
Flaring γ-Ray Emission from High Redshift Blazars

 ,
, 
Abstract
:1. Introduction
2. Results
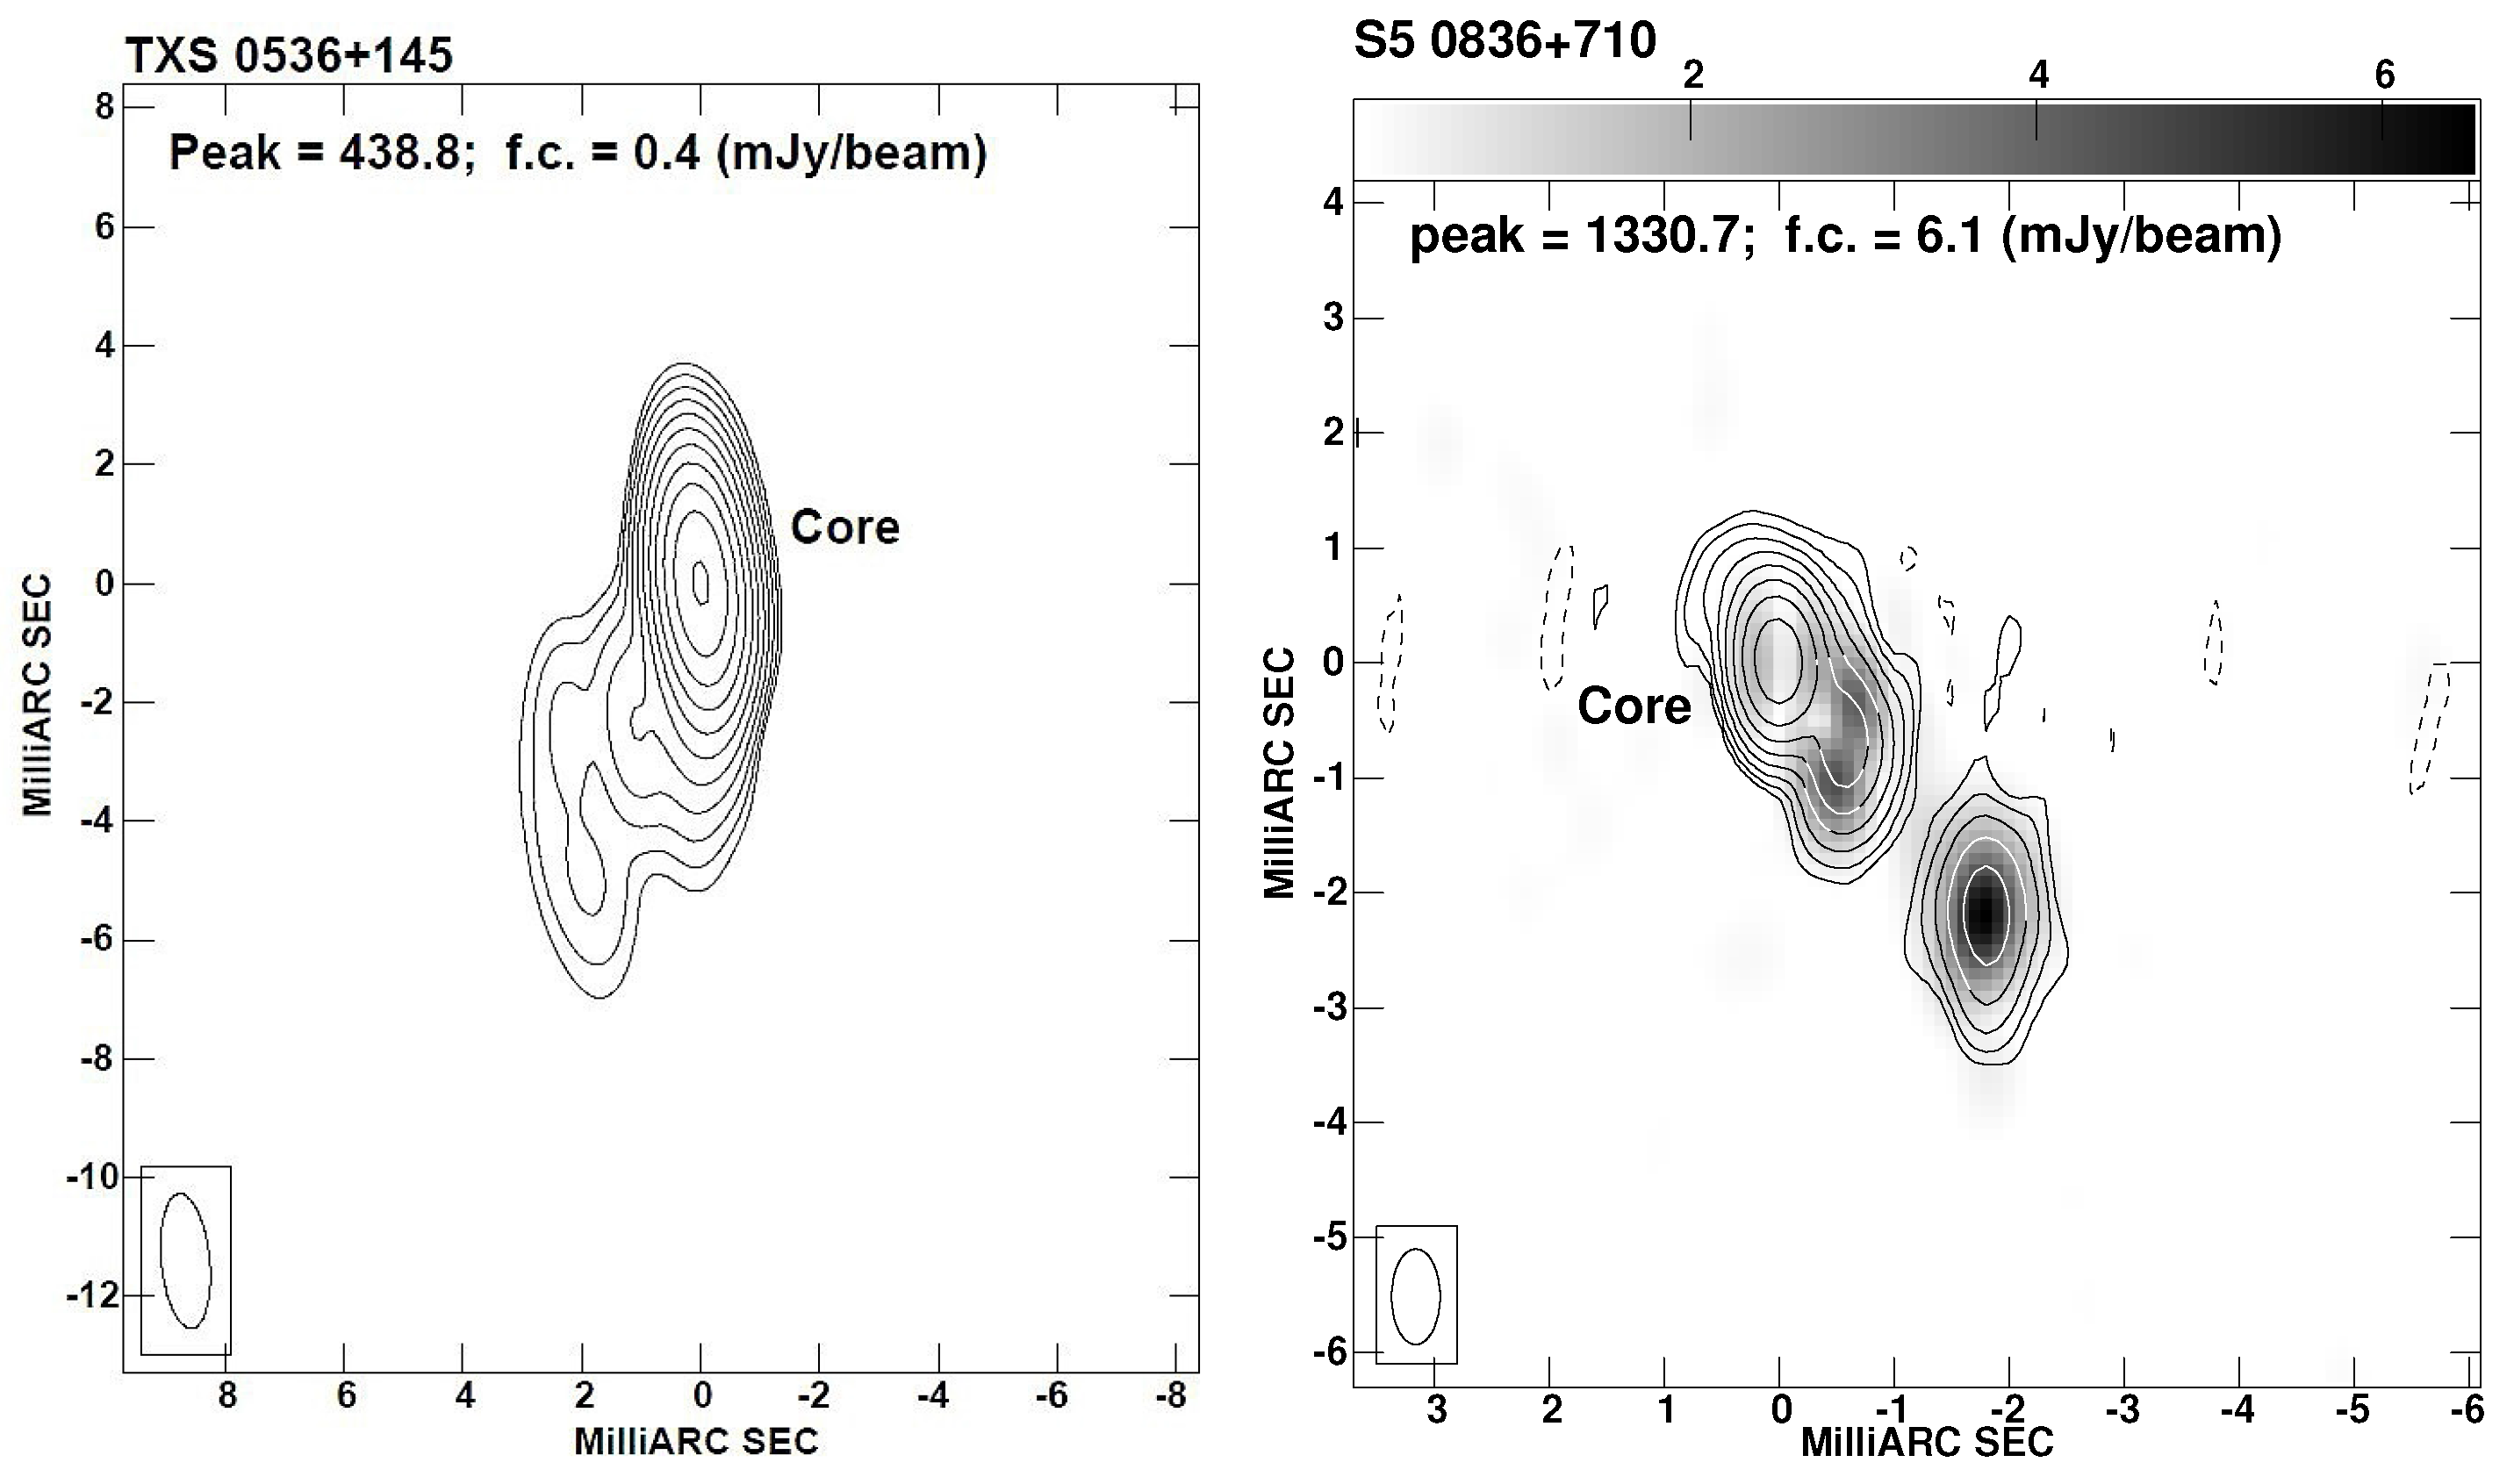
2.1. TXS 0536+145
2.2. PKS 2149−306
2.3. S5 0836+710
3. Discussion
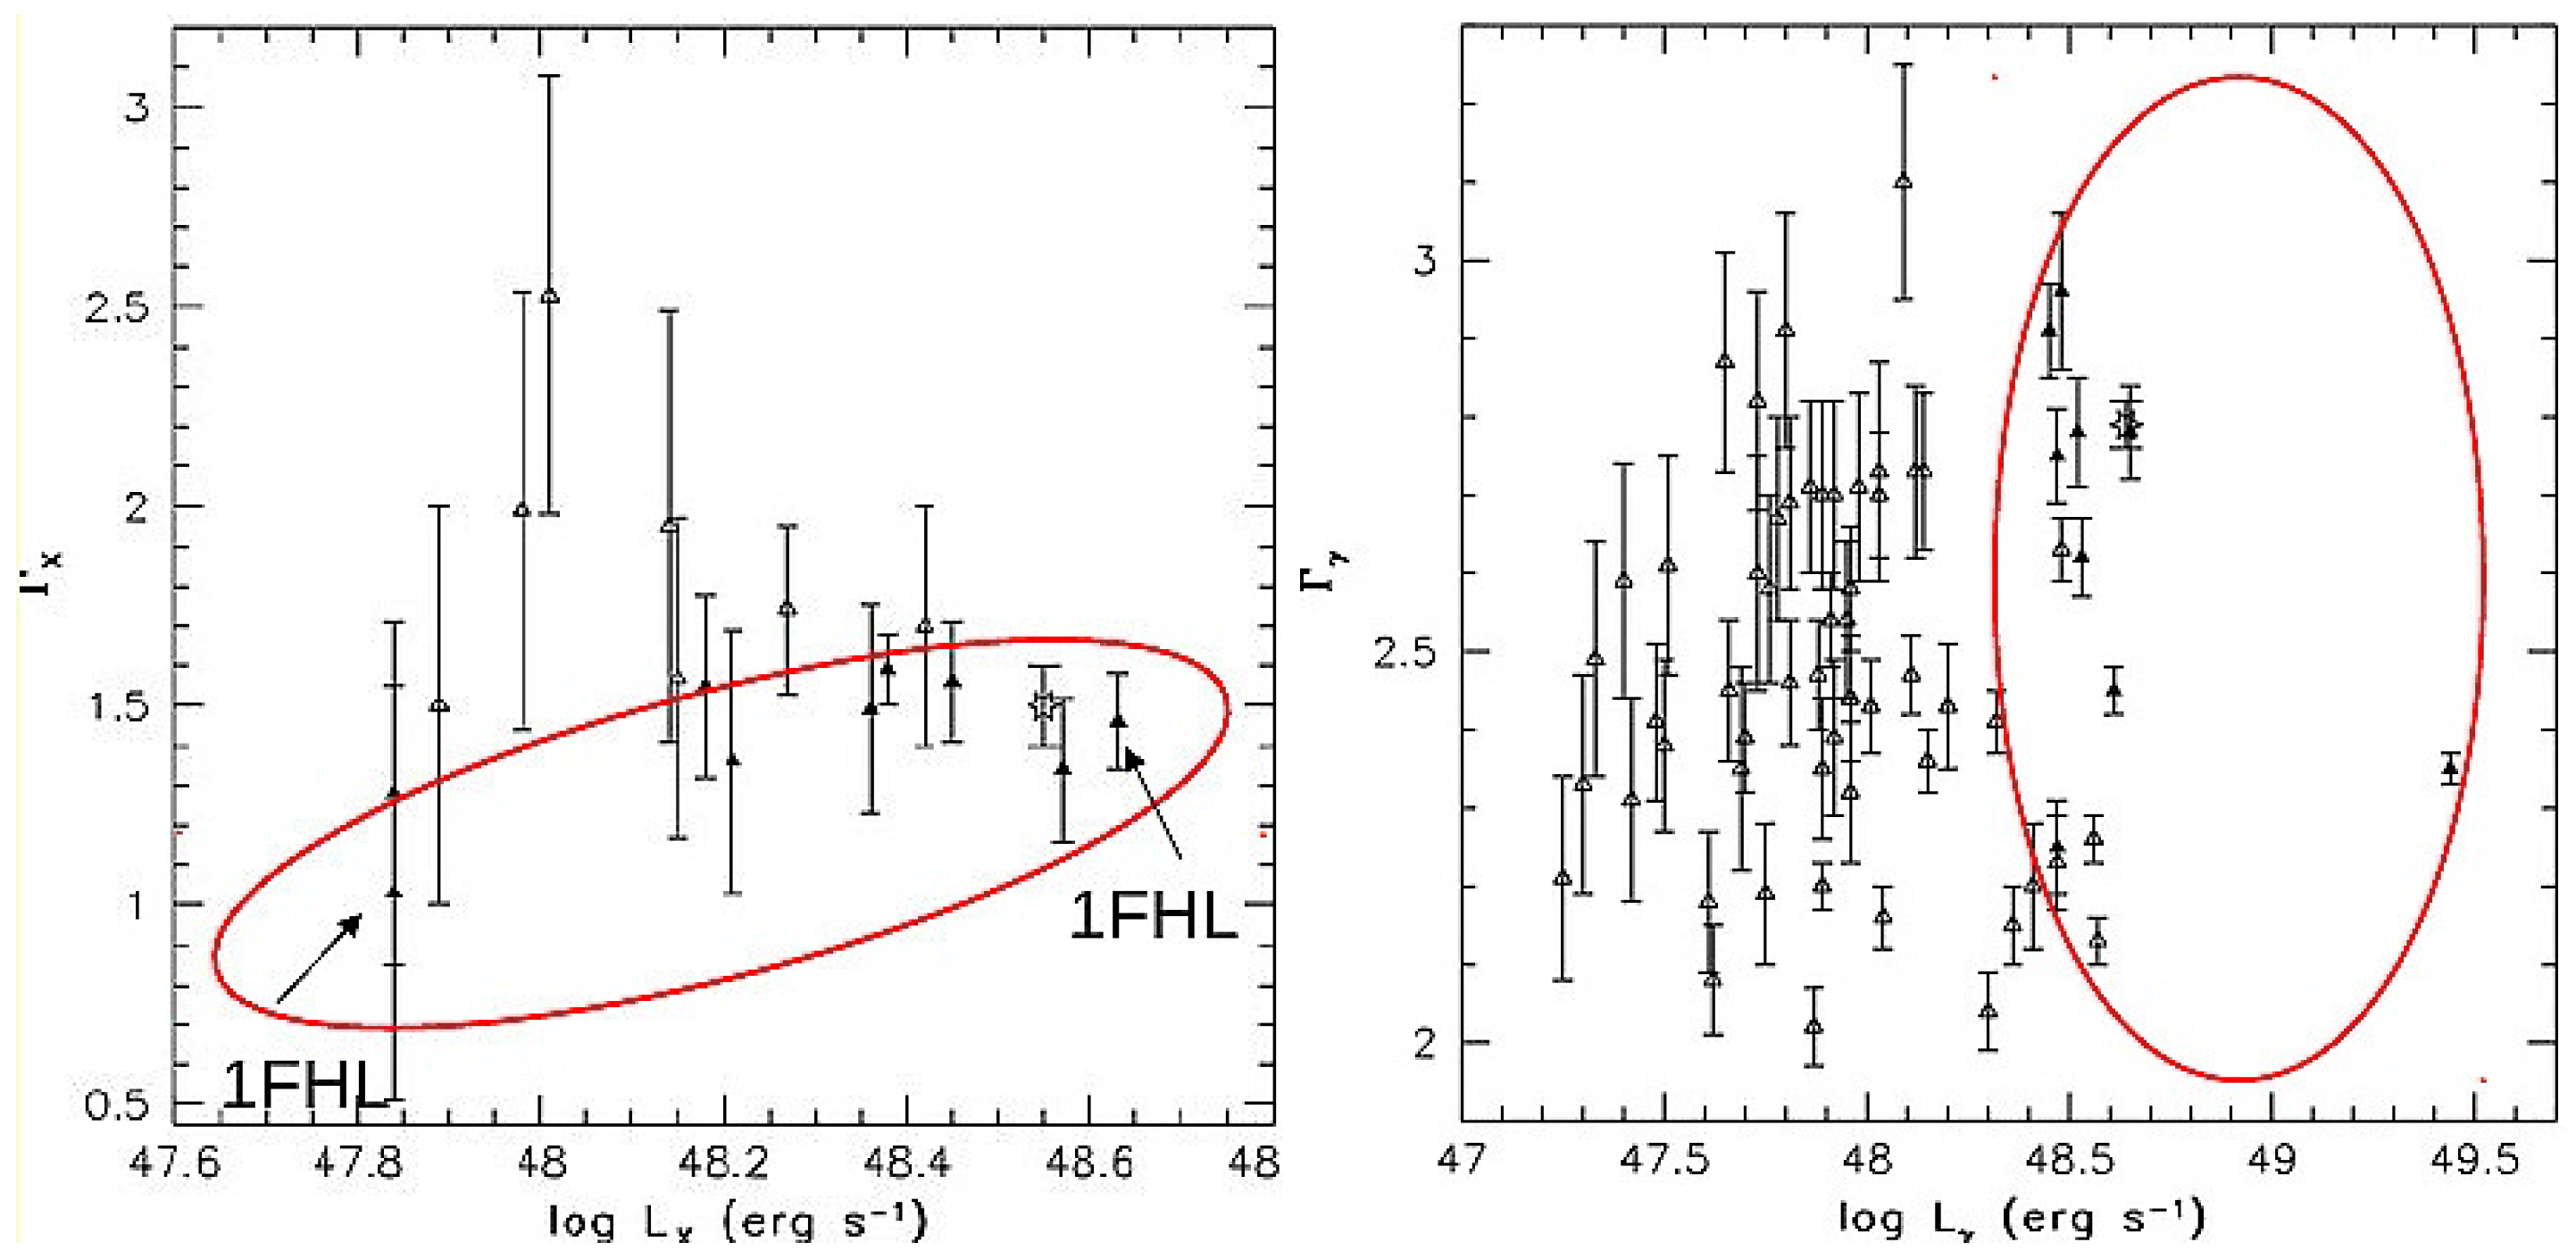
3.1. High-Energy Emission
3.2. Multi-Wavelength Variability
4. Conclusions
Acknowledgments
Author Contributions
Conflicts of Interest
References
- Acero, F.; Ackermann, M.; Ajello, M.; Albert, A.; Atwood, W.B.; Axelsson, M.; Baldini, L.; Ballet, J.; Barbiellini, G.; Bastieri, D.; et al. Fermi Large Area Telescope Third Source Catalog. Astrophys. J. 2015, 218, 23. [Google Scholar] [CrossRef]
- Baumgartner, W.H.; Tueller, J.; Markwardt, C.B.; Skinner, G.K.; Barthelmy, S.; Mushotzky, R.F.; Evans, P.A.; Gehrels, N. The 70 Month Swift-BAT All-sky Hard X-Ray Survey. Astrophys. J. 2013, 207, 19. [Google Scholar] [CrossRef]
- Bassani, L.; Landi, R.; Marshall, F.E.; Malizia, A.; Bazzano, A.; Bird, A.J.; Gehrels, N.; Ubertini, P.; Masetti, N. IGR J12319-0749: Evidence for another extreme blazar found with INTEGRAL. Astron. Astrophys. 2012, 543, A1. [Google Scholar] [CrossRef]
- Ghisellini, G.; Sbarrato, T.; Tagliaferri, G.; Foschini, L.; Tavecchio, F.; Ghirlanda, G.; Braito, V.; Gehrels, N. SDSS J114657.79+403708.6: The third most distant blazar at z = 5.0. Mon. Not. R. Astron. Soc. 2014, 440, L111–L115. [Google Scholar] [CrossRef]
- Sbarrato, T.; Tagliaferri, G.; Ghisellini, G.; Perri, M.; Puccetti, S.; Baloković, M.; Nardini, M.; Stern, D.; Boggs, S.E.; Brandt, W.N.; et al. NuSTAR Detection of the Blazar B2 1023+25 at Redshift 5.3. Astrophys. J. 2013, 777, 147. [Google Scholar] [CrossRef]
- Ghisellini, G.; Tagliaferri, G.; Foschini, L.; Ghirlanda, G.; Tavecchio, F.; Della Ceca, R.; Haardt, F.; Volonteri, M.; Gehrels, N. High-redshift Fermi blazars. Mon. Not. R. Astron. Soc. 2011, 411, 901–914. [Google Scholar] [CrossRef]
- D’Ammando, F.; Orienti, M. High-energy properties of the high-redshift flat spectrum radio quasar PKS 2149-306. Mon. Not. R. Astron. Soc. 2016, 455, 1881–1891. [Google Scholar] [CrossRef]
- Ackermann, M.; Ajello, M.; Allafort, A.; Atwood, W.B.; Baldini, L.; Ballet, J.; Barbiellini, G.; Bastieri, D.; Bechtol, K.; Belfiore, A.; et al. The First Fermi-LAT Catalog of Sources above 10 GeV. Astrophys. J. Suppl. Ser. 2013, 209, 34. [Google Scholar] [CrossRef]
- Orienti, M.; D’Ammando, F.; Giroletti, M.; Finke, J.; Ajello, M.; Dallacasa, D.; Venturi, T. Exploring the multiband emission of TXS 0536+145: The most distant γ-ray flaring blazar. Mon. Not. R. Astron. Soc. 2014, 444, 3040–3051. [Google Scholar] [CrossRef]
- Sowards-Emmerd, D.; Romani, R.W.; Michelson, P.F.; Healey, S.E.; Nolan, P.L. A Northern Survey of Gamma-Ray Blazar Candidates. Astrophys. J. 2005, 626, 95–103. [Google Scholar] [CrossRef]
- Abdo, A.A.; Ackermann, M.; Ajello, M.; Allafort, A.; Antolini, E.; Atwood, W.B.; Axelsson, M.; Baldini, L.; Ballet, J.; Barbiellini, G.; et al. Fermi Large Area Telescope First Source Catalog. Astrophys. J. Suppl. Ser. 2010, 188, 405–436. [Google Scholar] [CrossRef]
- Nolan, P.L.; Abdo, A.A.; Ackermann, M.; Ajello, M.; Allafort, A.; Antolini, E.; Atwood, W.B.; Axelsson, M.; Baldini, L.; Ballet, J.; et al. Fermi Large Area Telescope Second Source Catalog. Astrophys. J. Suppl. Ser. 2012, 199, 31. [Google Scholar] [CrossRef]
- Tagliaferri, G.; Ghisellini, G.; Perri, M.; Hayashida, M.; Balok’, M.; Covino, S.; Giommi, P.; Madejski, G.M.; Puccetti, S.; Sbarrato, T.; et al. NuSTAR and Multifrequency Study of the Two High-redshift Blazars S5 0836+710 and PKS 2149-306. Astrophys. J. 2015, 807, 167. [Google Scholar] [CrossRef]
- Thompson, D.J.; Bertsch, D.L.; Dingus, B.L.; Fichtel, C.E.; Hartman, R.C.; Hunter, S.D.; Kanbach, G.; Kniffen, D.A.; Lin, Y.C.; Mattox, J.R.; et al. EGRET observations of active galactic nuclei. Astrophys. J. 1993, 415, L13–L16. [Google Scholar] [CrossRef]
- Abdo, A.A.; Ackermann, M.; Ajello, M.; Atwood, W.B.; Axelsson, M.; Baldini, L.; Ballet, J.; Band, D.L.; Barbiellini, G.; Bastieri, D.; et al. Fermi/Large Area Telescope Bright Gamma-Ray Source List. Astrophys. J. Suppl. Ser. 2009, 183, 46–66. [Google Scholar] [CrossRef]
- Akyuz, A.; Thompson, D.J.; Donato, D.; Perkins, J.S.; Fuhrmann, L.; Angelakis, E.; Zensus, J.A.; Larsson, S.; Sokolovsky, K.; Kurtanidze, O. Long-term multiwavelength studies of high-redshift blazar 0836+710. Astron. Astrophys. 2013, 556, A71. [Google Scholar] [CrossRef]
- Abdo, A.A.; Ackermann, M.; Ajello, M.; Allafort, A.; Baldini, L.; Ballet, J.; Barbiellini, G.; Bastieri, D.; Bellazzini, R.; Berenji, B.; et al. Fermi Gamma-ray Space Telescope Observations of the Gamma-ray Outburst from 3C454.3 in November 2010. Astrophys. J. 2011, 733, L26. [Google Scholar] [CrossRef]
- Ackermann, M.; Ajello, M.; Atwood, W.B.; Baldini, L.; Ballet, J.; Barbiellini, G.; Bastieri, D.; Becerra Gonzalez, J.; Bellazzini, R.; Bissaldi, E.; et al. The Third Catalog of Active Galactic Nuclei Detected by the Fermi Large Area Telescope. Astrophys. J. 2015, 810, 14. [Google Scholar] [CrossRef]
- Abdo, A.A.; Ackermann, M.; Ajello, M.; Antolini, E.; Baldini, L.; Ballet, J.; Barbiellini, G.; Bastieri, D.; Baughman, B.M.; Bechtol, K.; et al. The Fermi-LAT High-Latitude Survey: Source Count Distributions and the Origin of the Extragalactic Diffuse Background. Astrophys. J. 2010, 720, 435–453. [Google Scholar] [CrossRef]
- Abdo, A.A.; Ackermann, M.; Ajello, M.; Allafort, A.; Amin, M.A.; Baldini, L.; Barbiellini, G.; Bastieri, D.; Bechtol, K.; Bellazzini, R.; et al. Gamma-Ray Flaring Activity from the Gravitationally Lensed Blazar PKS 1830-211 Observed by Fermi LAT. Astrophys. J. 2015, 799, 143. [Google Scholar] [CrossRef]
- Franceschini, A.; Rodighiero, G.; Vaccari, M. Extragalactic optical-infrared background radiation, its time evolution and the cosmic photon-photon opacity. Astron. Astrophys. 2008, 487, 837–852. [Google Scholar] [CrossRef]
- Finke, J.D.; Razzaque, S.; Dermer, C.D. Modeling the Extragalactic Background Light from Stars and Dust. Astrophys. J. 2010, 712, 238–249. [Google Scholar] [CrossRef]
- Giroletti, M.; Righini, S.; Bach, U.; D’Ammando, F.; Orienti, M.; Raiteri, C.M.; Villata, M. Multi-frequency radio observations of S5 0836+710 after gamma-ray outburst. Astron. Telegr. 2015, 7890. Available online: http://www.astronomerstelegram.org/?read=7890 (accessed on 7 August 2015). [Google Scholar]


© 2016 by the authors; licensee MDPI, Basel, Switzerland. This article is an open access article distributed under the terms and conditions of the Creative Commons Attribution (CC-BY) license (http://creativecommons.org/licenses/by/4.0/).
Share and Cite
Orienti, M.; D’Ammando, F.; Giroletti, M.; Finke, J.; Dallacasa, D. Flaring γ-Ray Emission from High Redshift Blazars. Galaxies 2016, 4, 26. https://doi.org/10.3390/galaxies4030026
Orienti M, D’Ammando F, Giroletti M, Finke J, Dallacasa D. Flaring γ-Ray Emission from High Redshift Blazars. Galaxies. 2016; 4(3):26. https://doi.org/10.3390/galaxies4030026
Chicago/Turabian StyleOrienti, Monica, Filippo D’Ammando, Marcello Giroletti, Justin Finke, and Daniele Dallacasa. 2016. "Flaring γ-Ray Emission from High Redshift Blazars" Galaxies 4, no. 3: 26. https://doi.org/10.3390/galaxies4030026