Article

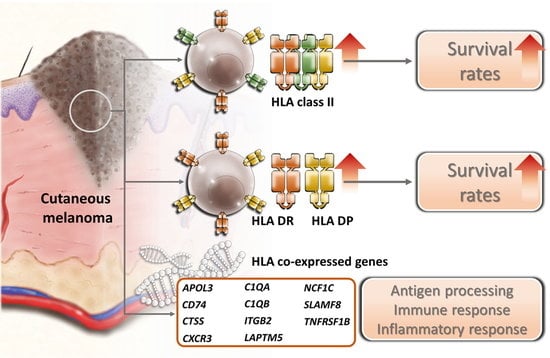
Expressions of HLA Class II Genes in Cutaneous Melanoma Were Associated with Clinical Outcome: Bioinformatics Approaches and Systematic Analysis of Public Microarray and RNA-Seq Datasets

1
Graduate Institute of Clinical Medicine, College of Medicine, Kaohsiung Medical University, Kaohsiung 807, Taiwan
2
Department of Dermatology, Kaohsiung Medical University Hospital, Kaohsiung 807, Taiwan
3
Division of Pulmonary and Critical Care Medicine, Kaohsiung Medical University Hospital, Kaohsiung 807, Taiwan
4
Department of Beauty Science, National Taichung University of Science and Technology, Taichung 403, Taiwan
5
Department of Physical Medicine and Rehabilitation, Kaohsiung Medical University Hospital, Kaohsiung 807, Taiwan
6
Institute of Medical Science and Technology, National Sun Yat-Sen University, Kaohsiung 804, Taiwan
*
Authors to whom correspondence should be addressed.
Diagnostics 2019, 9(2), 59; https://doi.org/10.3390/diagnostics9020059
Submission received: 21 May 2019 / Revised: 6 June 2019 / Accepted: 10 June 2019 / Published: 12 June 2019
(This article belongs to the Section Pathology and Molecular Diagnostics)

Abstract

:
Major histocompatibility complex (MHC) class II molecules, encoded by human leukocyte antigen (HLA) class II genes, play important roles in antigen presentation and initiation of immune responses. However, the correlation between HLA class II gene expression level and patient survival and disease progression in cutaneous melanoma is still under investigation. In the present study, we analyzed microarray and RNA-Seq data of cutaneous melanoma from The Cancer Genome Atlas (TCGA) using different bioinformatics tools. Survival analysis revealed higher expression level of HLA class II genes in cutaneous melanoma, especially HLA-DP and -DR, was significantly associated with better overall survival. Furthermore, the expressions of HLA class II genes were most closely associated with survival in cutaneous melanoma as compared with other cancer types. The expression of HLA class II co-expressed genes, which were found to associate with antigen processing, immune response, and inflammatory response, was also positively associated with overall survival in cutaneous melanoma. Therefore, the results indicated that increased HLA class II expression may contribute to enhanced anti-tumor immunity and related inflammatory response via presenting tumor antigens to the immune system. The expression pattern of HLA class II genes may serve as a prognostic biomarker and therapeutic targets in cutaneous melanoma.

Graphical Abstract

1. Introduction

Cutaneous melanoma, a malignant tumor that originates from melanocytes, is an aggressive neoplasm with high metastatic potential that accounts for most of skin cancer related deaths. The algorithm for staging and management of malignant melanoma had been well established. However, reliable biomarkers for prediction of clinical outcome in patients with malignant melanoma are still under investigation. Since changes in protein expression patterns in melanoma may be associated with tumor progression, angiogenesis and metastasis [1,2], investigating the tumor-associated microenvironment during the early stage of tumor development may be important for predicting clinical outcome in patients with cutaneous melanoma.
Human leukocyte antigen (HLA) class II antigen expression by tumor cells was reported to influence the tumor antigen-specific immune responses and prognosis in several cancer types [3], including melanoma [4]. In humans, there are three genes HLA-DP, -DQ, and -DR, which encode classical major histocompatibility complex class II (MHC-II) molecules, while HLA-DM and -DO encode non-classical MHC-II molecules. Classical MHC-II proteins form a heterodimeric antigen presenting complex traditionally present in professional antigen presenting cells (APCs). HLA-DM molecule functions as a peptide exchange factor required for efficient loading of endosomal peptides onto MHC-II, with HLA-DO as its modulator. Solid tumors originating from a variety of tissues were reported to express MHC-II molecules [5]. MHC-II molecules are critical for antigen presentation to CD4+ T-lymphocytes and its role in anti-tumor immunity is increasingly appreciated. Selected tumor-associated antigens (TAA) were effectively presented by MHC-II molecules to CD4+ T cells [6,7]. Accumulating evidence also demonstrated that tumor-specific MHC-II were associated with favorable outcomes in patients with cancer [8].
Constitutively increased expression of MHC molecules in cutaneous melanoma has been reported [9,10]. A previous study also revealed that 50–60% of freshly isolated primary and metastatic melanomas express HLA class II antigens [11]. However, current available studies investigating the prognostic significance of HLA class II antigen expression in cutaneous melanoma yield conflicting results. Expression of MHC-II by tumor cells had been found positively correlated with the presence of tumor-infiltrating lymphocytes, regression of the lesion, and time to progression and overall survival of patients with metastatic melanoma [12]. In addition, it was reported to associate with a favorable outcome in cutaneous melanoma patients [13], especially in patients treated with immunotherapies [14,15,16]. In contrast, expression of MHC-II by tumor cells was also reported to associate with higher metastatic dissemination, increased tumor stage and reduced survival in melanoma [4,17]. Therefore, the functional role of MHC-II, as well as their clinical implications, remains unclear.
In the present study, to elucidate the prognostic value and functional role of MHC-II molecules in cutaneous melanoma, we systematically analyzed the correlation between transcript levels of HLA class II genes and clinical outcomes in patients with skin cutaneous melanoma based on published microarray and RNA-Seq databases.

2. Materials and Methods

2.1. Gene Expression Analysis

The expression levels of HLA class II genes in normal skin tissue and tumor samples were evaluated using the Gene Expression Profiling Interactive Analysis (GEPIA) database (http://gepia.cancer-pku.cn/) [18] which was established using microarray and RNA-Seq data from The Cancer Genome Atlas (TCGA) [19] and Genotype-Tissue Expression (GTEx) [20]. A total of 471 cutaneous melanoma patients with 480 clinical samples were included in the TCGA PanCanAtlas dataset (https://gdc.cancer.gov/about-data/publications/pancanatlas). Moreover, the expression of HLA class II genes in different sample types of cutaneous melanoma was evaluated by the UALCAN database (http://ualcan.path.uab.edu) [21]. The mRNA expression of HLA class II molecules in clinical cancer tissues and cell lines of cutaneous melanoma was analyzed by the Metabolic gEne RApid Visualizer (MERAV) [22].

2.2. Co-Expression Gene Analysis

To explore the HLA class II co-expressed gene, we downloaded the public microarray data of cutaneous melanoma via the web-based microarray database Oncomine (www.oncomine.org) [23] and cBioPortal [24,25]. Three cutaneous melanoma datasets were selected, including TCGA melanoma, Harlin melanoma [26] and Bogunovic melanoma [27]. Co-expressed genes with respect to HLA-DPA1 and -DRA expression in cutaneous melanoma tissues were analyzed. The first dataset (TCGA provisional dataset, cutaneous melanoma) was composed of 109 primary melanoma samples and 371 metastatic melanoma samples. The second dataset (Harlin melanoma) was composed of 44 metastatic melanoma samples, 5 melanoma cell lines, and 3 normal melanocyte primary cell cultures. The third dataset (Bogunovic melanoma) was composed of 44 metastatic melanoma samples from 38 patients.

2.3. Survival Analysis

The Kaplan–Meier plot generation by the online databases Gene Expression Profiling Interactive Analysis (GEPIA) and UALCAN was performed to explore the association of 15 HLA class II genes and clinical outcome of cutaneous melanoma. Overall survival rate and hazard ratio estimation with respect to expression of HLA class II genes in cutaneous melanoma were also generated by GEPIA. In GEPIA database analysis, the patient samples were split into two groups (low vs. high expression). In UALCAN database analysis, the patient samples were split into three groups (low, medium and high expression). The Kaplan–Meier plot generation by UALCAN was also performed to explore the association between genes co-expressed with HLA class II genes and clinical outcome in patients affected by cutaneous melanoma.

2.4. OncoLnc Tool

OncoLnc (http://www.oncolnc.org) is a newly available resource for Cox coefficients and linking TCGA survival data to mRNA, miRNA or lncRNA expression [28]. Cox coefficients of HLA class II genes and their co-expressed genes were generated to explore the association of gene expressions and survival rate in cutaneous melanoma. Moreover, Cox coefficients of HLA class II genes were compared with other cancer types.

2.5. Gene Ontology Enrichment Analysis

Gene ontology enrichment analysis were conducted to examine HLA-DPA1 and/or HLA-DRA co-expressed genes by using the Database for Annotation, Visualization and Integrated Discovery (DAVID; http://david.abcc.ncifcrf.gov/) [29]. The categories of biological process, cellular component and molecular function were selected, and all options were set as defaults. The data listed in the table were those terms with p-value < 0.05.

2.6. Statistical Analysis

The hazard ratio and p-value in survival analysis were generated by GEPIA and UALCAN. The Cox coefficient and p-value in Cox regression analysis were generated by OncoLnc. The fold enrichment and p-value in gene otology enrichment analysis were generated by DAVID. The p-value < 0.05 was considered statistically significant difference in all analysis.

3. Results

3.1. The Expressions of HLA Class II Genes Were Up-Regulated in Cutaneous Melanoma

To clarify the expression pattern of HLA class II genes, the expressions of 15 HLA class II genes in skin cutaneous melanoma from TCGA samples (N = 461) were compared with normal skin tissue from TCGA (N = 1) and Genotype-Tissue Expression (GTEx) (N = 557) samples using the online Gene Expression Profiling Interactive Analysis (GEPIA) database. The expressions of most HLA class II genes were significantly up-regulated in cutaneous melanoma, except HLA-DQB2, which was significantly down-regulated in cutaneous melanoma compared to normal skin tissues (Figure 1). In addition, the expression levels of these HLA class II genes were observed to have wide range of distribution among cutaneous melanoma samples.
We next investigated the changes in HLA class II mRNA expression based on cutaneous melanoma stages (Stage I, II, III, and IV according to American Joint Committee on Cancer (AJCC) TNM staging) using the UALCAN web resource. The expression pattern of 15 HLA class II genes in each stage of cutaneous melanoma was displayed as heatmap in Figure 2A. A detailed analysis of expression levels between stages was also obtained from the UALCAN database. The results indicated the expression levels of HLA-DPB1, -DPB2, -DQA1, -DQB1, - DRA, -DMA and -DMB were significantly higher in Stage I than in Stage II (Stage I versus Stage II, HLA-DPB1: p = 2.68 × 10⁻², HLA-DPB2: p = 2.70 × 10⁻², HLA-DQA1: p = 1.32 × 10⁻², HLA-DQB1: p = 9.46 × 10⁻³, HLA-DRA: p = 5.22 × 10⁻³, HLA-DMA: p = 3.92 × 10⁻², HLA-DMB: p = 3.23 × 10⁻⁴), while the expression levels of other HLA class II genes were not significantly different between Stage 1 and Stage 2. However, there was no statistical significance between other stages (p > 0.05), although there was a tendency of gradual increase of HLA class II gene expressions from Stage 2 to Stage 4 (Figure 2B).

3.2. High HLA Class II mRNA Expression Levels Were Associated with a Good Prognosis in Cutaneous Melanoma Patients

The survival analysis of 15 HLA class II genes in cutaneous melanoma by online databases UALCAN revealed patients with cutaneous melanoma in high expression group of all HLA class II genes had longer survival as compared with patients in low/medium expression group (Figure 3). To verify this finding, the survival analysis and hazard ratio estimation of the expression levels of 15 HLA class II genes in cutaneous melanoma were performed using online bioinformatics database GEPIA. The overall survival between high and low expression levels of 15 HLA class II genes were displayed as survival plot in Figure 4, and the relative risk of patients with high compared to low HLA class II gene expression levels was indicated in hazard ratio (Table 1). The expression fold changes between high and low expression groups were quantitated from the RNA-seq data downloaded from the cBioPortal database. Hazard ratios of <1.0 indicated patients with high HLA class II gene expressions had better overall survival.

3.3. The Expressions of HLA Class II Genes in Cutaneous Melanoma Were Most Closely Correlated with Patient Survival among 21 Common Cancer Types in TCGA Database

To investigate the effect of HLA class II gene expressions on survival among various cancer types, including cutaneous melanoma, the mRNA levels of HLA class II genes were examined using the bioinformatics tool OncoLnc, and the Cox regression results and the p-value ranks for the 15 HLA class II genes in cutaneous melanoma were listed in Table 2. A negative Cox coefficient indicated higher gene expression reduced the risk of death. Similar to results obtained from UALCAN and GEPIA databases, the expressions of HLA class II genes in cutaneous melanoma was highly correlated to patients’ overall survival. Among the 15 HLA class II genes, HLA-DP and -DR genes were found to have higher expression levels and p-value rankings in association with survival. Furthermore, the expressions of HLA class II genes in cutaneous melanoma were found more closely associated with survival in cutaneous melanoma as compared to other cancer types. As shown in Table 3, HLA-DPA1 is the 80th gene most closely correlated with survival in cutaneous melanoma, although the expression level of HLA-DPA1 in cutaneous melanoma was not the highest among 21 common cancer types. As shown in Table 4, HLA-DRA is the 46th most closely correlated gene in cutaneous melanoma. For both HLA-DPA1 and HLA-DRA, the rank of correlations is highest in cutaneous melanoma, followed by lung adenocarcinoma, sarcoma and breast invasive carcinoma. Instead of focusing on p-values, it was suggested to focus more on the rank of the correlations, and also on the Cox coefficients in analysis by OncoLnc tool.

3.4. Top 11 Genes Co-Expressed with HLA-DPA1 and HLA-DRA in Clinical Cutaneous Melanoma Samples

The expression patterns of HLA class II genes in cutaneous melanoma from primary tumor samples and tumor cell lines were obtained from Oncomine database [23], and we found the expression patterns of HLA class II genes were different between cell lines and primary tumor samples. Specifically, as compared with in vitro cell lines of cutaneous melanoma, HLA class II gene expressions in resected tissues of melanoma tumors were generally higher, particularly HLA-DMA, -DMB, -DPA1, -DPB1, -DQA1, -DQB1, -DRA and -DRB1, as displayed in Figure 5. The phenomenon suggested that the tumor microenvironment may closely regulate the expression of these genes. Thus, we further analyzed the co-expressed genes of HLA class II genes to investigate the biological changes related to aberrant expression of HLA class II in cutaneous melanoma tissues. Using the Oncomine database and cBioPortal for public microarray data of cutaneous melanoma, we selected three datasets composed of melanoma tumor samples to analyze the genes co-expressed with HLA class II genes, specifically HLA-DPA1 and HLA-DRA. In the analysis of HLA-DPA1 co-expressed gene, 14 genes were consistently identified as top 100 genes by co-expression score in the three datasets of cutaneous melanoma; in the analysis of HLA-DRA co-expressed gene, 13 genes were consistently identified as top 100 genes by co-expression score in the three datasets of cutaneous melanoma (Figure 6). The genes consistently identified to be closely co-expressed to HLA class II genes were listed in Table 5, including 11 genes (APOL3, CD74, CTSS, CXCR3, C1QA, C1QB, ITGB2, LAPTM5, NCF1C, SLAMF8 and TNFRSF1B) other than HLA class II genes.

3.5. Gene Ontology Enrichment Analysis of HLA-DPA1 and -DRA Co-Expressed Genes Identified the Association of These Genes with Antigen Processing, Immune and Inflammatory Response in Skin Cutaneous Melanoma

To identify the mechanisms underlying the expression of HLA class II genes and its co-expressed genes, the gene ontology enrichment analysis was conducted using Database for Annotation, Visualization and Integrated Discovery (DAVID) bioinformatics tool. Overall, 10 biological processes, 18 cellular constituents, and 4 molecular function terms were significantly enriched (p < 0.05, Table 6). Based on the results of the analysis, biological functions related to antigen processing and presentation and immune response were most functionally enriched, with CTSS, CD74 and TNFRSF1B involved in these biological functions, in addition to HLA class II related genes. In addition, CD74 was the only related gene classified in the MHC class II protein complex binding, other than HLA class II related genes. Noticeably, four genes (APOL3, TNFRSF1B, ITGB2 and CXCR3) were linked to the biological process term “inflammatory response” (GO:0006954). These co-expressed genes were input into Search Tool for the Retrieval of Interacting Genes (STRING) database [30] and OmicsNet [31] for interaction network visualization. In the network produced by STRING database, CD74 and CTSS were clustered with HLA class II related genes (Figure 7A), while in the major subnetwork obtained from OmicsNet based on InnateDB database, CD74 was the molecule in close conjunction to HLA-DPA1 and -DRA (Figure 7B). Overall, the functional enrichment analysis results suggested that the cluster of genes co-expressed with HLA-DPA1 and -DRA may promote anti-tumor immune response through antigen processing and presentation via MHC class II.

3.6. Genes Co-Expressed with HLA-DPA1 or HLA-DRA Positively Associated with Clinical Outcome in Patients with Cutaneous Melanoma

To evaluate the significance of these 11 co-expressed genes in clinical outcome, the association of their expression levels with survival was assessed using the Kaplan–Meier plotter tool in the UALCAN web resource. The survival analysis showed higher expression level of all these 11 genes predicted a better survival in cutaneous melanoma (Figure 8). Correlation between expression level of HLA class II co-expressed genes and survival in cutaneous melanoma was also examined using the bioinformatics tool OncoLnc. Similar to the results from UALCAN database, Cox coefficients of these genes were all negative, which indicated that higher expression of these genes reduce the risk of death. APOL3, CD74, C1QA and C1QB were found to rank highest in association with survival among all co-expressed genes (Table 7).

4. Discussion

The present study demonstrated the novel findings that mRNA expressions of HLA class II genes, especially HLA-DP and -DR, were significantly increased in clinical cutaneous melanoma samples and positively associated with overall survival, while multivariate Cox regression analysis revealed that the HLA class II gene expressions were most closely associated with survival in cutaneous melanoma compared to other cancer types. Another novel finding in the present study is the identification of HLA class II co-expressed genes, including APOL3, CD74, CTSS, CXCR3, C1QA, C1QB, ITGB2, LAPTM5, NCF1C, SLAMF8 and TNFRSF1B. These co-expressed genes were associated with antigen processing and presentation, immune response and inflammatory response. The expression levels of these co-expressed genes were positively associated with overall survival in patients with cutaneous melanoma. To the best of our knowledge, this is the first study to comprehensively analyze the microarray and RNA-Seq data of HLA class II genes and their co-expressed genes in cutaneous melanoma datasets with largest sample size.
The significant association of HLA class II gene expressions with overall survival found in this study was consistent with the results obtained in large B-cell lymphoma [32], colorectal cancer [33,34,35], breast cancer [36,37], ovarian cancer [38], and laryngeal squamous cell carcinoma [39], as well as in metastatic melanoma [40]. In metastatic melanoma, positive staining for MHC-II expression in Stage III and IV cutaneous melanoma correlated with longer overall survival [40]. These studies suggested the functional role of HLA class II genes in tumor suppression. However, the available information for prognostic value of HLA class II antigens among different cancer types remained limited. In the present study, we found the rank of significance between HLA class II genes and patient overall survival was highest in cutaneous melanoma, suggesting that HLA class II genes possess greatest effect on overall survival of patients with cutaneous melanoma than other cancer types. This finding was compatible with the previous observation of special immunobiology in cutaneous melanoma [41,42]. Interestingly, cutaneous melanoma has been considered as a ‘model disease’ to investigate tumor immunobiology, to unveil the molecular basis underlying the interactions between neoplastic cells and host’s immune system, and ultimately to set up new bio-immunotherapeutic approaches [5]. However, the findings in this study were not consistent with previous study in metastatic melanoma patients, in which a low expression of HLA class II genes on neoplastic cells was associated with longer survival [43]. In that study, only 48 locoregional metastatic tumors from 39 patients were analyzed. The number of samples may be too small to draw conclusions and account for the discrepancy among these studies.
Previously, some studies focused on the change in HLA class II gene expressions during progression of cutaneous melanoma and underlying regulatory mechanisms. Here, we demonstrated that the expression levels of HLA-DP, -DQ, -DR, and -DM were significantly lower in Stage II than in Stage I cutaneous melanoma, while there was a tendency toward gradual increase in HLA class II gene expressions from Stage II to Stage IV (Figure 2). This finding was similar to the previous observation of dynamic expression of MHC during melanoma progression, and the potential mechanisms for the overexpression of MHC molecules in earlier stage were associated with the increased rates of DNA copy number gains in primary melanoma [10]. In metastatic melanoma, the master regulator of MHC genes, Class II Major Histocompatibility Complex Transactivator (CIITA), was significantly downregulated compared to vertical growth phase melanomas, which was considered to account for the discrepancy between expression level and DNA copy number [10,44,45].
In this study, survival analysis showed higher expression level of HLA class II co-expressed genes, especially APOL3, CD74, C1QA and C1QB, were associated with better prognosis in cutaneous melanoma. Surprisingly, APOL3, which encoded Apolipoprotein L3 [46] was found to be the 58th most closely correlated gene with patient survival in cutaneous melanoma, which was as high as HLA class II genes. The high expression of APOL3 was reported to predict worse clinical outcome in patients with acute myeloid leukemia [47]. However, no study related to the functional role of APOL3 in cutaneous melanoma has been reported. Recent studies have emphasized the association between metabolic syndrome and increased cancer risks, including skin cancer [48,49]. Non-alcoholic fatty liver disease (NAFLD), related to obesity and metabolic syndrome, has been proposed an added risk factor for extra-hepatic cancers [49,50,51], including melanoma (standardized incidence ratio of 2.4) [49]. The evidence suggests the importance of lipid metabolism in cancer development. However, whether APOL3 directly bridge the relation between cutaneous melanoma and metabolic syndrome cannot be clarified from the results of the present study.
CD74, along with CTSS and HLA class II genes, were found involved in antigen processing and presenting via MHC-II by gene ontology enrichment analysis, while interaction network analysis identified CD74 to be in close conjunction to HLA-DPA1 and -DRA. The Cox regression analysis also indicated CD74 as one of the higher-ranking genes positively correlated to overall survival in patients with melanoma. CD74 is associated with development of specific adaptive immune response, and higher CD74 expression correlated with improved recurrence-free and overall survival [52], regulated by interferon-gamma [53]. In brain metastasis, CD74 is also a potent positive prognostic marker for survival [54]. Blockade of CD74 related immunosuppressive signaling may restore anti-tumor immune response in metastatic melanoma, suggesting the crucial role of CD74 in immunotherapy [55].
C1QA and C1QB encode complement C1q subunit A and B, which are the initiator of the classical complement pathway and can induce dendritic cell maturation to generate Th1 type response [56,57]. C1q appears to have pro-tumorigenic and anti-tumorigenic role in cancer, depending on the context of the disease [58]. The anti-cancer role of C1q has been reported in prostate cancer [59], as well as in syngeneic murine model of melanoma [60]. LAPTM5 (lysosomal-associated protein transmembrane 5) is one of the top genes significantly associated with longer survival in metastatic melanoma [61], and ITGB2 (integrin beta 2) co-expression with HLA-DR participates in signal transduction, cell adhesion, and motility in neoplastic melanocytes [5,62]. However, the prognostic value of ITGB2 in cutaneous melanoma has not yet been reported. The other co-expression genes, including TNFRSF1B, CXCR3, SLAMF8 and NCF1, appeared to be involved in apoptosis and inflammatory response [63,64], lymphocyte activation and T cell trafficking [65]. Taken together, the HLA class II co-expressed genes may represent the anti-tumor immune response through antigen processing as well as inflammatory response in tumor microenvironment. However, the causality of expression of HLA class II genes and their co-expressed genes in cutaneous melanoma still need to be verified in further studies.
The limitation of the current study is that the results were derived based on public cancer data repository, therefore, we validated the gene expression patterns and the results of survival analysis in the different databases available. To further investigate the prognostic value of HLA class II genes in cutaneous melanoma, collection of clinical samples with longitudinal follow up is necessary.

5. Conclusions

The expression levels of HLA class II in cutaneous melanoma may reflect the tumor neo-antigen presentation by tumor specific MHC-II molecules and, therefore, correlate with clinical outcome. The results of the present study indicate that the expression pattern of HLA class II and their co-expressed gene may serve as prognostic biomarkers in prediction of overall survival. A schematic summary is shown in Figure 9. Therapeutic strategies aiming to increase HLA class II expression in cutaneous melanoma may prolong overall survival, especially in combination with other immunotherapy strategies. Future studies focusing on the mechanisms involved in the regulation of expression and activity of HLA class II genes may provide further insights into the treatment of cutaneous melanoma.

Public Databases

The GEPIA [18] is an interactive web server for analyzing the RNA sequencing expression data of tumors and normal samples from the TCGA and the GTEx projects to provide differential expression analysis, survival analysis, and correlation analysis. The UALCAN [21] is an interactive web resource for analyzing cancer genomics data and these resources allow researchers to gather valuable information and data about the genes of interest. The MERAV [22] is a web-based tool for whole genome analysis which query a database comprising of about 4300 microarrays, representing human gene expression in normal tissues, cancer cell lines and primary tumors, and offers advantages in comparing gene expression among different tissue types as well as between normal and cancer cells and generating heatmaps. The Oncomine Platform [23] is a web-based microarray database that provides peer-reviewed analysis methods and contains a powerful set of analysis functions that compute gene expression signatures and automatically extracts biological insights from the data. The cBioPortal [24,25] provides visualization, analysis and download of large-scale cancer genomics datasets. The OncoLnc [28] contains survival data from patients of 21 cancer types, and is a tool for interactively exploring survival correlations and downloading clinical data coupled with mRNA expression data.

Author Contributions

Conceptualization, Y.-Y.C. and P.-L.K.; methodology, Y.-Y.C., W.-A.C. and E.-S.L.; validation, Y.-J.C. and P.-L.K.; formal analysis, Y.-Y.C. and Y.-J.C.; investigation, Y.-Y.C., W.-A.C. and E.-S.L.; data curation, Y.-Y.C., W.-A.C., E.-S.L., Y.-J.C. and P.-L.K.; writing—original draft preparation, Y.-Y.C.; writing—review and editing, W.-A.C., E.-S.L., Y.-J.C. and P.-L.K.; visualization, Y.-Y.C., W.-A.C., E.-S.L., Y.-J.C. and P.-L.K.; supervision, P.-L.K.; funding acquisition, P.-L.K.

Funding

This study was supported by grants from the Ministry of Science and Technology (MOST 107-2320-B-037-011-MY3; MOST107-2622-E-025-002-CC3), and the Kaohsiung Medical University (KMU-DK 108003).

Acknowledgments

The authors thank the Center for Research Resources and Development of Kaohsiung Medical University. The authors also gratefully acknowledge the contribution of the previously established public databases and bioinformatics tools listed in the “Public Databases” section which help us conduct the present study.

Conflicts of Interest

The authors declare no conflict of interest.

References

  1. Fecher, L.A.; Cummings, S.D.; Keefe, M.J.; Alani, R.M. Toward a molecular classification of melanoma. J. Clin. Oncol. 2007, 25, 1606–1620. [Google Scholar] [CrossRef] [PubMed]
  2. Gray-Schopfer, V.; Wellbrock, C.; Marais, R. Melanoma biology and new targeted therapy. Nature 2007, 445, 851–857. [Google Scholar] [CrossRef] [PubMed]
  3. Seliger, B.; Kloor, M.; Ferrone, S. HLA class II antigen-processing pathway in tumors: Molecular defects and clinical relevance. Oncoimmunology 2017, 6, e1171447. [Google Scholar] [CrossRef] [PubMed]
  4. Pollack, M.S.; Livingston, P.O. HLA and DR antigen frequencies in melanoma patients: Possible relation to disease prognosis. Tissue Antigens 1985, 26, 262–265. [Google Scholar] [CrossRef] [PubMed]
  5. Altomonte, M.; Fonsatti, E.; Visintin, A.; Maio, M. Targeted therapy of solid malignancies via HLA class II antigens: A new biotherapeutic approach? Oncogene 2003, 22, 6564–6569. [Google Scholar] [CrossRef]
  6. Novellino, L.; Castelli, C.; Parmiani, G. A listing of human tumor antigens recognized by T cells: March 2004 update. Cancer Immunol. Immunother. CII 2005, 54, 187–207. [Google Scholar] [CrossRef] [PubMed]
  7. Tatsumi, T.; Kierstead, L.S.; Ranieri, E.; Gesualdo, L.; Schena, F.P.; Finke, J.H.; Bukowski, R.M.; Brusic, V.; Sidney, J.; Sette, A.; et al. MAGE-6 encodes HLA-DRbeta1*0401-presented epitopes recognized by CD4+ T cells from patients with melanoma or renal cell carcinoma. Clin. Cancer Res. 2003, 9, 947–954. [Google Scholar] [PubMed]
  8. Axelrod, M.L.; Cook, R.S.; Johnson, D.B.; Balko, J.M. Biological consequences of MHC-II expression by tumor cells in cancer. Clin. Cancer Res. 2018. [Google Scholar] [CrossRef] [PubMed]
  9. Garrido, C.; Paco, L.; Romero, I.; Berruguilla, E.; Stefansky, J.; Collado, A.; Algarra, I.; Garrido, F.; Garcia-Lora, A.M. MHC class I molecules act as tumor suppressor genes regulating the cell cycle gene expression, invasion and intrinsic tumorigenicity of melanoma cells. Carcinogenesis 2012, 33, 687–693. [Google Scholar] [CrossRef] [PubMed] [Green Version]
  10. Degenhardt, Y.; Huang, J.; Greshock, J.; Horiates, G.; Nathanson, K.; Yang, X.; Herlyn, M.; Weber, B. Distinct MHC gene expression patterns during progression of melanoma. Genes Chromosom. Cancer 2010, 49, 144–154. [Google Scholar] [PubMed]
  11. Taramelli, D.; Fossati, G.; Mazzocchi, A.; Delia, D.; Ferrone, S.; Parmiani, G. Classes I and II HLA and melanoma-associated antigen expression and modulation on melanoma cells isolated from primary and metastatic lesions. Cancer Res. 1986, 46, 433–439. [Google Scholar] [PubMed]
  12. Bernsen, M.R.; Hakansson, L.; Gustafsson, B.; Krysander, L.; Rettrup, B.; Ruiter, D.; Hakansson, A. On the biological relevance of MHC class II and B7 expression by tumour cells in melanoma metastases. Br. J. Cancer 2003, 88, 424–431. [Google Scholar] [CrossRef] [PubMed]
  13. Van Tuyn, J.; Jaber-Hijazi, F.; MacKenzie, D.; Cole, J.J.; Mann, E.; Pawlikowski, J.S.; Rai, T.S.; Nelson, D.M.; McBryan, T.; Ivanov, A.; et al. Oncogene-expressing senescent melanocytes up-regulate MHC class II, a candidate melanoma suppressor function. J. Invest. Derm. 2017, 137, 2197–2207. [Google Scholar] [CrossRef] [PubMed]
  14. Johnson, D.B.; Estrada, M.V.; Salgado, R.; Sanchez, V.; Doxie, D.B.; Opalenik, S.R.; Vilgelm, A.E.; Feld, E.; Johnson, A.S.; Greenplate, A.R.; et al. Melanoma-specific MHC-II expression represents a tumour-autonomous phenotype and predicts response to anti-PD-1/PD-L1 therapy. Nat. Commun. 2016, 7, 10582. [Google Scholar] [CrossRef] [PubMed]
  15. Johnson, D.B.; Bordeaux, J.; Kim, J.Y.; Vaupel, C.; Rimm, D.L.; Ho, T.H.; Joseph, R.W.; Daud, A.I.; Conry, R.M.; Gaughan, E.M.; et al. Quantitative spatial profiling of PD-1/PD-L1 interaction and HLA-DR/IDO-1 predicts improved outcomes of Anti-PD-1 therapies in metastatic melanoma. Clin. Cancer Res. 2018, 24, 5250–5260. [Google Scholar] [CrossRef] [PubMed]
  16. Rodig, S.J.; Gusenleitner, D.; Jackson, D.G.; Gjini, E.; Giobbie-Hurder, A.; Jin, C.; Chang, H.; Lovitch, S.B.; Horak, C.; Weber, J.S.; et al. MHC proteins confer differential sensitivity to CTLA-4 and PD-1 blockade in untreated metastatic melanoma. Sci. Transl. Med. 2018, 10, eaar3342. [Google Scholar] [CrossRef] [PubMed] [Green Version]
  17. Martins, I.; Sylla, K.; Deshayes, F.; Lauriol, J.; Ghislin, S.; Dieu-Nosjean, M.C.; Viguier, M.; Verola, O.; Charron, D.; Alcaide-Loridan, C.; et al. Coexpression of major histocompatibility complex class II with chemokines and nuclear NFkappaB p50 in melanoma: A rational for their association with poor prognosis. Melanoma Res. 2009, 19, 226–237. [Google Scholar] [CrossRef]
  18. Tang, Z.; Li, C.; Kang, B.; Gao, G.; Li, C.; Zhang, Z. GEPIA: A web server for cancer and normal gene expression profiling and interactive analyses. Nucleic Acids Res. 2017, 45, W98–W102. [Google Scholar] [CrossRef]
  19. Cancer Genome Atlas, N. Genomic classification of cutaneous melanoma. Cell 2015, 161, 1681–1696. [Google Scholar] [CrossRef]
  20. Human Genomics. The Genotype-Tissue Expression (GTEx) pilot analysis: Multitissue gene regulation in humans. Science 2015, 348, 648–660. [Google Scholar] [CrossRef] [Green Version]
  21. Chandrashekar, D.S.; Bashel, B.; Balasubramanya, S.A.H.; Creighton, C.J.; Ponce-Rodriguez, I.; Chakravarthi, B.; Varambally, S. UALCAN: A portal for facilitating tumor subgroup gene expression and survival analyses. Neoplasia 2017, 19, 649–658. [Google Scholar] [CrossRef] [PubMed]
  22. Shaul, Y.D.; Yuan, B.; Thiru, P.; Nutter-Upham, A.; McCallum, S.; Lanzkron, C.; Bell, G.W.; Sabatini, D.M. MERAV: A tool for comparing gene expression across human tissues and cell types. Nucleic Acids Res. 2016, 44, D560–D566. [Google Scholar] [CrossRef] [PubMed]
  23. Rhodes, D.R.; Yu, J.; Shanker, K.; Deshpande, N.; Varambally, R.; Ghosh, D.; Barrette, T.; Pandey, A.; Chinnaiyan, A.M. ONCOMINE: A cancer microarray database and integrated data-mining platform. Neoplasia 2004, 6, 1–6. [Google Scholar] [CrossRef]
  24. Cerami, E.; Gao, J.; Dogrusoz, U.; Gross, B.E.; Sumer, S.O.; Aksoy, B.A.; Jacobsen, A.; Byrne, C.J.; Heuer, M.L.; Larsson, E.; et al. The cBio cancer genomics portal: An open platform for exploring multidimensional cancer genomics data. Cancer Discov. 2012, 2, 401–404. [Google Scholar] [CrossRef] [PubMed]
  25. Gao, J.; Aksoy, B.A.; Dogrusoz, U.; Dresdner, G.; Gross, B.; Sumer, S.O.; Sun, Y.; Jacobsen, A.; Sinha, R.; Larsson, E.; et al. Integrative analysis of complex cancer genomics and clinical profiles using the cBioPortal. Sci. Signal 2013, 6, pl1. [Google Scholar] [CrossRef] [PubMed]
  26. Harlin, H.; Meng, Y.; Peterson, A.C.; Zha, Y.; Tretiakova, M.; Slingluff, C.; McKee, M.; Gajewski, T.F. Chemokine expression in melanoma metastases associated with CD8+ T-cell recruitment. Cancer Res. 2009, 69, 3077–3085. [Google Scholar] [CrossRef]
  27. Bogunovic, D.; O’Neill, D.W.; Belitskaya-Levy, I.; Vacic, V.; Yu, Y.L.; Adams, S.; Darvishian, F.; Berman, R.; Shapiro, R.; Pavlick, A.C.; et al. Immune profile and mitotic index of metastatic melanoma lesions enhance clinical staging in predicting patient survival. Proc. Natl. Acad. Sci. USA 2009, 106, 20429–20434. [Google Scholar] [CrossRef] [PubMed] [Green Version]
  28. Anaya, J. OncoLnc: Linking TCGA survival data to mRNAs, miRNAs, and lncRNAs. Peer J. Comp. Sci. 2016, 2, e67. [Google Scholar] [CrossRef]
  29. Huang da, W.; Sherman, B.T.; Lempicki, R.A. Systematic and integrative analysis of large gene lists using DAVID bioinformatics resources. Nat. Protoc. 2009, 4, 44–57. [Google Scholar] [CrossRef]
  30. Szklarczyk, D.; Morris, J.H.; Cook, H.; Kuhn, M.; Wyder, S.; Simonovic, M.; Santos, A.; Doncheva, N.T.; Roth, A.; Bork, P.; et al. The STRING database in 2017: Quality-controlled protein-protein association networks, made broadly accessible. Nucleic Acids Res. 2017, 45, D362–D368. [Google Scholar] [CrossRef]
  31. Zhou, G.; Xia, J. OmicsNet: A web-based tool for creation and visual analysis of biological networks in 3D space. Nucleic Acids Res. 2018, 46, W514–W522. [Google Scholar] [CrossRef] [PubMed]
  32. Rimsza, L.M.; Roberts, R.A.; Miller, T.P.; Unger, J.M.; LeBlanc, M.; Braziel, R.M.; Weisenberger, D.D.; Chan, W.C.; Muller-Hermelink, H.K.; Jaffe, E.S.; et al. Loss of MHC class II gene and protein expression in diffuse large B-cell lymphoma is related to decreased tumor immunosurveillance and poor patient survival regardless of other prognostic factors: A follow-up study from the Leukemia and Lymphoma Molecular Profiling Project. Blood 2004, 103, 4251–4258. [Google Scholar] [CrossRef] [PubMed]
  33. Matsushita, K.; Takenouchi, T.; Shimada, H.; Tomonaga, T.; Hayashi, H.; Shioya, A.; Komatsu, A.; Matsubara, H.; Ochiai, T. Strong HLA-DR antigen expression on cancer cells relates to better prognosis of colorectal cancer patients: Possible involvement of c-myc suppression by interferon-gamma in situ. Cancer Sci. 2006, 97, 57–63. [Google Scholar] [CrossRef] [PubMed]
  34. Kunihiro, M.; Tanaka, S.; Haruma, K.; Yoshihara, M.; Sumii, K.; Kajiyama, G.; Shimamoto, F. Combined expression of HLA-DR antigen and proliferating cell nuclear antigen correlate with colorectal cancer prognosis. Oncology 1998, 55, 326–333. [Google Scholar] [CrossRef] [PubMed]
  35. Lazaris, A.C.; Theodoropoulos, G.E.; Davaris, P.S.; Panoussopoulos, D.; Nakopoulou, L.; Kittas, C.; Golematis, B.C. Heat shock protein 70 and HLA-DR molecules tissue expression. Prognostic implications in colorectal cancer. Dis. Colon Rectum 1995, 38, 739–745. [Google Scholar] [CrossRef] [PubMed]
  36. Oldford, S.A.; Robb, J.D.; Codner, D.; Gadag, V.; Watson, P.H.; Drover, S. Tumor cell expression of HLA-DM associates with a Th1 profile and predicts improved survival in breast carcinoma patients. Int. Immunol. 2006, 18, 1591–1602. [Google Scholar] [CrossRef] [PubMed] [Green Version]
  37. Park, I.A.; Hwang, S.H.; Song, I.H.; Heo, S.H.; Kim, Y.A.; Bang, W.S.; Park, H.S.; Lee, M.; Gong, G.; Lee, H.J. Expression of the MHC class II in triple-negative breast cancer is associated with tumor-infiltrating lymphocytes and interferon signaling. PLoS ONE 2017, 12, e0182786. [Google Scholar] [CrossRef]
  38. Callahan, M.J.; Nagymanyoki, Z.; Bonome, T.; Johnson, M.E.; Litkouhi, B.; Sullivan, E.H.; Hirsch, M.S.; Matulonis, U.A.; Liu, J.; Birrer, M.J.; et al. Increased HLA-DMB expression in the tumor epithelium is associated with increased CTL infiltration and improved prognosis in advanced-stage serous ovarian cancer. Clin. Cancer Res. 2008, 14, 7667–7673. [Google Scholar] [CrossRef]
  39. Esteban, F.; Ruiz-Cabello, F.; Concha, A.; Perez-Ayala, M.; Sanchez-Rozas, J.A.; Garrido, F. HLA-DR expression is associated with excellent prognosis in squamous cell carcinoma of the larynx. Clin. Exp. Metastasis 1990, 8, 319–328. [Google Scholar] [CrossRef]
  40. Anichini, A.; Mortarini, R.; Nonaka, D.; Molla, A.; Vegetti, C.; Montaldi, E.; Wang, X.; Ferrone, S. Association of antigen-processing machinery and HLA antigen phenotype of melanoma cells with survival in American Joint Committee on Cancer stage III and IV melanoma patients. Cancer Res. 2006, 66, 6405–6411. [Google Scholar] [CrossRef]
  41. Oble, D.A.; Loewe, R.; Yu, P.; Mihm, M.C., Jr. Focus on TILs: Prognostic significance of tumor infiltrating lymphocytes in human melanoma. Cancer Immun. 2009, 9, 3. [Google Scholar] [PubMed]
  42. Zikich, D.; Schachter, J.; Besser, M.J. Predictors of tumor-infiltrating lymphocyte efficacy in melanoma. Immunotherapy 2016, 8, 35–43. [Google Scholar] [CrossRef] [PubMed]
  43. Van Duinen, S.G.; Ruiter, D.J.; Broecker, E.B.; van der Velde, E.A.; Sorg, C.; Welvaart, K.; Ferrone, S. Level of HLA antigens in locoregional metastases and clinical course of the disease in patients with melanoma. Cancer Res. 1988, 48, 1019–1025. [Google Scholar] [PubMed]
  44. Goodwin, B.L.; Xi, H.; Tejiram, R.; Eason, D.D.; Ghosh, N.; Wright, K.L.; Nagarajan, U.; Boss, J.M.; Blanck, G. Varying functions of specific major histocompatibility class II transactivator promoter III and IV elements in melanoma cell lines. Cell Growth Differ. 2001, 12, 327–335. [Google Scholar] [PubMed]
  45. Deffrennes, V.; Vedrenne, J.; Stolzenberg, M.C.; Piskurich, J.; Barbieri, G.; Ting, J.P.; Charron, D.; Alcaïde-Loridan, C. Constitutive expression of MHC class II genes in melanoma cell lines results from the transcription of class II transactivator abnormally initiated from its B cell-specific promoter. J. Immunol. 2001, 167, 98–106. [Google Scholar] [CrossRef]
  46. Page, N.M.; Butlin, D.J.; Lomthaisong, K.; Lowry, P.J. The human apolipoprotein L gene cluster: Identification, classification, and sites of distribution. Genomics 2001, 74, 71–78. [Google Scholar] [CrossRef]
  47. Lv, C.; Sun, L.; Guo, Z.; Li, H.; Kong, D.; Xu, B.; Lin, L.; Liu, T.; Guo, D.; Zhou, J.; et al. Circular RNA regulatory network reveals cell-cell crosstalk in acute myeloid leukemia extramedullary infiltration. J. Transl. Med. 2018, 16, 361. [Google Scholar] [CrossRef]
  48. Nagel, G.; Bjorge, T.; Stocks, T.; Manjer, J.; Hallmans, G.; Edlinger, M.; Haggstrom, C.; Engeland, A.; Johansen, D.; Kleiner, A.; et al. Metabolic risk factors and skin cancer in the Metabolic Syndrome and Cancer Project (Me-Can). Br. J. Derm. 2012, 167, 59–67. [Google Scholar] [CrossRef]
  49. Sanna, C.; Rosso, C.; Marietti, M.; Bugianesi, E. Non-alcoholic fatty liver disease and extra-hepatic cancers. Int. J. Mol. Sci. 2016, 17, 717. [Google Scholar] [CrossRef]
  50. Scalera, A.; Tarantino, G. Could metabolic syndrome lead to hepatocarcinoma via non-alcoholic fatty liver disease? World J. Gastroenterol. 2014, 20, 9217–9228. [Google Scholar] [CrossRef]
  51. Koch, K.S.; Leffert, H.L. Ectopic expression of CD74 in Ikkbeta-deleted mouse hepatocytes. Acta Histochem. 2011, 113, 428–435. [Google Scholar] [CrossRef] [PubMed]
  52. Ekmekcioglu, S.; Davies, M.A.; Tanese, K.; Roszik, J.; Shin-Sim, M.; Bassett, R.L., Jr.; Milton, D.R.; Woodman, S.E.; Prieto, V.G.; Gershenwald, J.E.; et al. Inflammatory marker testing identifies CD74 expression in melanoma tumor cells, and its expression associates with favorable survival for stage III melanoma. Clin. Cancer Res. 2016, 22, 3016–3024. [Google Scholar] [CrossRef] [PubMed]
  53. Tanese, K.; Hashimoto, Y.; Berkova, Z.; Wang, Y.; Samaniego, F.; Lee, J.E.; Ekmekcioglu, S.; Grimm, E.A. Cell surface CD74-MIF interactions drive melanoma survival in response to interferon-γ. J. Invest. Derm. 2015, 135, 2775–2784. [Google Scholar] [CrossRef] [PubMed]
  54. Zeiner, P.S.; Zinke, J.; Kowalewski, D.J.; Bernatz, S.; Tichy, J.; Ronellenfitsch, M.W.; Thorsen, F.; Berger, A.; Forster, M.T.; Muller, A.; et al. CD74 regulates complexity of tumor cell HLA class II peptidome in brain metastasis and is a positive prognostic marker for patient survival. Acta Neuropathol. Commun. 2018, 6, 18. [Google Scholar] [CrossRef] [PubMed]
  55. Figueiredo, C.R.; Azevedo, R.A.; Mousdell, S.; Resende-Lara, P.T.; Ireland, L.; Santos, A.; Girola, N.; Cunha, R.; Schmid, M.C.; Polonelli, L.; et al. Blockade of MIF-CD74 signalling on macrophages and dendritic cells restores the antitumour immune response against metastatic melanoma. Front. Immunol. 2018, 9, 1132. [Google Scholar] [CrossRef] [PubMed]
  56. Noris, M.; Remuzzi, G. Overview of complement activation and regulation. Semin. Nephrol. 2013, 33, 479–492. [Google Scholar] [CrossRef] [PubMed]
  57. Csomor, E.; Bajtay, Z.; Sandor, N.; Kristof, K.; Arlaud, G.J.; Thiel, S.; Erdei, A. Complement protein C1q induces maturation of human dendritic cells. Mol. Immunol. 2007, 44, 3389–3397. [Google Scholar] [CrossRef] [PubMed]
  58. Mangogna, A.; Agostinis, C.; Bonazza, D.; Belmonte, B.; Zacchi, P.; Zito, G.; Romano, A.; Zanconati, F.; Ricci, G.; Kishore, U.; et al. Is the complement protein C1q a pro- or anti-tumorigenic factor? Bioinformatics analysis involving human carcinomas. Front. Immunol. 2019, 10, 865. [Google Scholar] [CrossRef]
  59. Hong, Q.; Sze, C.I.; Lin, S.R.; Lee, M.H.; He, R.Y.; Schultz, L.; Chang, J.Y.; Chen, S.J.; Boackle, R.J.; Hsu, L.J.; et al. Complement C1q activates tumor suppressor WWOX to induce apoptosis in prostate cancer cells. PLoS ONE 2009, 4, e5755. [Google Scholar] [CrossRef]
  60. Bulla, R.; Tripodo, C.; Rami, D.; Ling, G.S.; Agostinis, C.; Guarnotta, C.; Zorzet, S.; Durigutto, P.; Botto, M.; Tedesco, F. C1q acts in the tumour microenvironment as a cancer-promoting factor independently of complement activation. Nat. Commun. 2016, 7, 10346. [Google Scholar] [CrossRef] [Green Version]
  61. Mandruzzato, S.; Callegaro, A.; Turcatel, G.; Francescato, S.; Montesco, M.C.; Chiarion-Sileni, V.; Mocellin, S.; Rossi, C.R.; Bicciato, S.; Wang, E.; et al. A gene expression signature associated with survival in metastatic melanoma. J. Transl. Med. 2006, 4, 50. [Google Scholar] [CrossRef] [PubMed]
  62. Moretti, S.; Pinzi, C.; Berti, E.; Spallanzani, A.; Chiarugi, A.; Boddi, V.; Reali, U.M.; Giannotti, B. In situ expression of transforming growth factor beta is associated with melanoma progression and correlates with Ki67, HLA-DR and beta 3 integrin expression. Melanoma Res. 1997, 7, 313–321. [Google Scholar] [CrossRef] [PubMed]
  63. Hehlgans, T.; Pfeffer, K. The intriguing biology of the tumour necrosis factor/tumour necrosis factor receptor superfamily: Players, rules and the games. Immunology 2005, 115, 1–20. [Google Scholar] [CrossRef] [PubMed]
  64. Locksley, R.M.; Killeen, N.; Lenardo, M.J. The TNF and TNF receptor superfamilies: Integrating mammalian biology. Cell 2001, 104, 487–501. [Google Scholar] [CrossRef]
  65. Orentas, R.J.; Yang, J.J.; Wen, X.; Wei, J.S.; Mackall, C.L.; Khan, J. Identification of cell surface proteins as potential immunotherapy targets in 12 pediatric cancers. Front. Oncol. 2012, 2, 194. [Google Scholar] [CrossRef] [PubMed]
Figure 1. Expressions of human leukocyte antigen (HLA) class II genes in skin cutaneous melanoma from The Cancer Genome Atlas (TCGA) samples were compared with normal skin tissue from TCGA (N = 1) and genotype-tissue expression (GTEx) (N = 557) samples. Above results were obtained from the Gene Expression Profiling Interactive Analysis (GEPIA) database. The expression levels were expressed in log2 (TPM + 1) scale. * Indicates p < 0.0001 between tumor and normal tissues.
Diagnostics 09 00059 g001
Figure 2. (A) The expression pattern of 15 HLA class II genes in each stage of cutaneous melanoma was displayed as heatmap in log2 (TPM + 1) scale. (B) The box plot represented expression of HLA-DPB1 and HLA-DRA in different stages of cutaneous melanoma from TCGA samples. Significant difference (p < 0.05) in expressions was detected between Stage 1 and Stage 2, but not between other cancer stages.
Diagnostics 09 00059 g002
Figure 3. Effect of HLA class II expression level on overall survival. Survival analysis between high and low/medium expression of HLA class II genes in clinical skin cutaneous melanoma patients was performed using bioinformatics database UALCAN. Patients with high expression group had better overall survival. ** Indicates p value < 0.01, *** indicates p value < 0.001.
Diagnostics 09 00059 g003
Figure 4. Effect of HLA class II expression level on overall survival. Survival analysis between high and low expression of HLA class II genes in clinical skin cutaneous melanoma patients was performed using bioinformatics database GEPIA. Patients with high expression group showed better overall survival. * Indicates p value < 0.05, ** indicates p value < 0.01, *** indicates p value < 0.001.
Diagnostics 09 00059 g004
Figure 5. HLA class II expression pattern in cutaneous melanoma. The expression pattern of 15 HLA class II genes in primary cutaneous melanoma tumor and tumor cell lines was displayed as heatmap in log ratio of mean centered expression level. The expression pattern was observed to be more diverse in skin cutaneous melanoma cell lines than in primary tumor samples (especially expression of HLA-DMA, -DMB, -DPA1, -DPB1, -DQA1, -DQB1, -DRA and -DRB1). The dataset was composed of 43 primary tumors of cutaneous melanoma and 164 cell lines of cutaneous melanoma.
Diagnostics 09 00059 g005
Figure 6. The Venn diagram analysis on the left panel showed 14 HLA-DPA1 co-expressed genes in cutaneous melanoma from three datasets of clinical cutaneous melanoma specimens. The Venn diagram analysis on the right panel showed 13 HLA-DRA co-expressed genes in cutaneous melanoma from three datasets of cutaneous melanoma specimens.
Diagnostics 09 00059 g006
Figure 7. (A) The interaction network of co-expressed genes was generated in Search Tool for the Retrieval of Interacting Genes (STRING) database, where CD74 and CTSS were clustered with HLA class II related genes. (B) The major interaction network of co-expressed genes generated by OmicsNet indicated CD74 as the molecule in closest conjunction to HLA-DPA1 and -DRA.
Diagnostics 09 00059 g007
Figure 8. Effect of HLA class II co-expressed genes on overall survival. Survival analysis of HLA-DPA1 and/or HLA-DRA co-expressed genes in cutaneous melanoma was performed by the UALCAN database. Patients with high expression group showed better overall survival. ** Indicates p value < 0.01, *** indicates p value < 0.001.
Diagnostics 09 00059 g008
Figure 9. Schematic summary of the effect of HLA class II genes and their co-expressed genes in prediction of overall survival in cutaneous melanoma. The arrows indicated increased expressions and increased survival rates.
Diagnostics 09 00059 g009
Table 1. Survival analysis and hazard ratio estimation of the expression of 15 HLA class II genes in cutaneous melanoma via GEPIA.
GeneHazard Ratiop-ValueLog Rank p-ValueFold Change
HLA-DPA10.507.1 × 10−74.3 × 10−78.01
HLA-DPB10.547.4 × 10−65.4 × 10−67.38
HLA-DPB20.670.00390.003720.28
HLA-DQA10.601.7 × 10−41.4 × 10−411.37
HLA-DQA20.740.0270.02713.26
HLA-DQB10.591.3 × 10−41.1 × 10−49.81
HLA-DQB20.562.0 × 10−51.5 × 10−513.51
HLA-DRA0.521.9 × 10−61.2 × 10−68.28
HLA-DRB10.624.7 × 10−44.1 × 10−48.35
HLA-DRB50.700.0090.008710.63
HLA-DRB60.650.00140.001311.05
HLA-DMA0.623.9 × 10−43.5 × 10−46.06
HLA-DMB0.534.3 × 10−63.0 × 10−66.73
HLA-DOA0.549.2 × 10−66.8 × 10−611.39
HLA-DOB0.522.2 × 10−61.4 × 10−617.20
Table 2. Association of 15 HLA class II gene expressions in cutaneous melanoma with survival generated from Cox regression analysis via OncoLnc tool.
GeneCox Coefficientp-ValueFDR CorrectedRankMedian ExpressionMean Expression
HLA-DPA1−0.3375.40 × 10−71.08 × 10−4804585.319121.78
HLA-DPB1−0.3582.30 × 10−78.21 × 10−5453117.185914.74
HLA-DPB2−0.3935.20 × 10−83.34 × 10−5254.1413.99
HLA-DQA1−0.3024.70 × 10−63.51 × 10−42141170.12855.2
HLA-DQA2−0.291.60 × 10−57.65 × 10−4335283.68690.69
HLA-DQB1−0.281.10 × 10−56.16 × 10−42851368.123053.13
HLA-DQB2−0.2962.20 × 10−59.45 × 10−437084.35196.98
HLA-DRA−0.3442.50 × 10−78.73 × 10−5469839.4618,668.64
HLA-DRB1−0.3736.60 × 10−83.52 × 10−5303544.567634.49
HLA-DRB5−0.2966.90 × 10−64.53 × 10−42441079.72645.34
HLA-DRB6−0.3048.50 × 10−65.19 × 10−4262263.9636.43
HLA-DMA−0.3351.90 × 10−62.01 × 10−41521236.62101.88
HLA-DMB−0.3414.60 × 10−71.04 × 10−470771.471417.4
HLA-DOA−0.3483.20 × 10−79.52 × 10−553440.21098.24
HLA-DOB−0.3222.60 × 10−62.43 × 10−417231.68107.89
The Cox coefficient and p-value are from the gene term in precomputed multivariate Cox regressions. The false discovery rate (FDR) correction is performed per cancer analysis per data type. The rank is also performed per cancer per data type.
Table 3. Association of HLA-DPA1 expression in cutaneous melanoma with survival were compared across cancer types.
GeneCancerCox Coefficientp-ValueFDR CorrectedRankMedian ExpressionMean Expression
HLA-DPA1SKCM−0.3375.40 × 10−71.08 × 10−4804585.319121.78
LUAD−0.2351.50 × 10−30.0317979849.3412,162.44
SARC−0.2898.70 × 10−30.09614664027.867692.16
BRCA−0.1830.0380.34218345003.016437.27
LGG0.4292.30 × 10−51.53 × 10−425131388.132947.54
LUSC0.1060.1200.63630734131.195702.61
CESC−0.2310.0720.38130793826.456061.82
LAML0.1410.2000.59550174888.656455.32
KIRC−0.1930.0110.034539413,119.5215,657.27
LIHC−0.1380.1400.37957212345.753679.56
HNSC−0.0830.2400.58667093054.795091.7
STAD−0.0940.2600.64167565108.67427.25
OV−0.0680.3800.85174625886.048121.03
UCEC−0.0690.5100.99584052478.443839.0
BLCA−0.0720.3200.58588732159.674356.95
GBM0.0550.5600.93110,0335543.046987.86
KIRP−0.1350.3700.55810,8554783.416319.32
READ0.0150.9400.99315,5311829.922538.31
COAD0.01.001.0016,3862198.833337.41
ESCA−0.0040.9800.99516,4711974.743355.17
PAAD−0.0030.9800.98817,0355814.376925.07
Abbreviation: BLCA: Bladder urothelial carcinoma, BRCA: Breast invasive carcinoma, CESC: Cervical squamous cell carcinoma and endocervical adenocarcinoma, COAD: Colon adenocarcinoma, ESCA: Esophageal carcinoma, GBM: Glioblastoma multiforme, HNSC: Head and neck squamous cell carcinoma, KIRC: Kidney renal clear cell carcinoma, KIRP: Kidney renal papillary cell carcinoma, LAML: Acute myeloid leukemia, LGG: Brain lower grade glioma, LIHC: Liver hepatocellular carcinoma, LUAD: Lung adenocarcinoma, LUSC: Lung squamous cell carcinoma, OV: Ovarian serous cystadenocarcinoma, PAAD: Pancreatic adenocarcinoma, READ: Rectum adenocarcinoma, SARC: Sarcoma, SKCM: Skin cutaneous melanoma, STAD: Stomach adenocarcinoma, UCEC: Uterine corpus endometrial carcinoma.
Table 4. Association of HLA-DRA expression in cutaneous melanoma with survival were compared across cancer types.
GeneCancerCox Coefficientp-ValueFDR CorrectedRankMedian ExpressionMean Expression
HLA-DRASKCM−0.3442.50 × 10−78.73 × 10−5469839.4618,668.64
LUAD−0.241.20 × 10−70.02870627,710.3734,117.21
SARC−0.3055.80 × 10−30.07812008466.0616,968.25
BRCA−0.1910.02920.313152511,992.6115,710.87
UCEC−0.1680.1200.95819888596.8411,817.06
LGG0.4498.00 × 10−66.45 × 10−520842897.566102.37
CESC−0.2420.0640.362287812,787.4718,592.32
KIRC−0.2183.80 × 10−30.015430429,068.6532,924.27
LIHC−0.1560.1000.31649415590.889443.03
HNSC−0.0950.1800.52056619416.7314,015.01
STAD−0.1070.2100.590592612,673.0118,011.42
LAML0.1160.2700.659615212,957.7218,731.49
LUSC0.0760.2900.770629111,713.1518,081.96
ESCA−0.1240.3800.97764025720.119112.51
BLCA−0.0970.1800.43067355928.9811,505.42
OV−0.0580.4400.873844215,570.2320,289.93
COAD−0.0820.4100.76786856279.59455.2
KIRP−0.1570.3000.48710,06410,478.6814,076.0
GBM0.0360.6900.95812,02914,344.3919,440.02
READ−0.0210.9200.99215,1895247.537508.25
PAAD0.0260.8000.89515,33116,654.6318,258.57
Abbreviation: BLCA: Bladder urothelial carcinoma, BRCA: Breast invasive carcinoma, CESC: Cervical squamous cell carcinoma and endocervical adenocarcinoma, COAD: Colon adenocarcinoma, ESCA: Esophageal carcinoma, GBM: Glioblastoma multiforme, HNSC: Head and neck squamous cell carcinoma, KIRC: Kidney renal clear cell carcinoma, KIRP: Kidney renal papillary cell carcinoma, LAML: Acute myeloid leukemia, LGG: Brain lower grade glioma, LIHC: Liver hepatocellular carcinoma, LUAD: Lung adenocarcinoma, LUSC: Lung squamous cell carcinoma, OV: Ovarian serous cystadenocarcinoma, PAAD: Pancreatic adenocarcinoma, READ: Rectum adenocarcinoma, SARC: Sarcoma, SKCM: Skin cutaneous melanoma, STAD: Stomach adenocarcinoma, UCEC: Uterine corpus endometrial carcinoma.
Table 5. Co-expressed genes of HLA-DPA1 and/or HLA-DRA with the cut-off for selection defined as an appearance in three cutaneous melanoma datasets.
GeneGene Name
Co-expressed with both HLA-DPA1 and HLA-DRAAPOL3apolipoprotein L3
CD74CD74 molecule
CXCR3C-X-C motif chemokine receptor 3
HLA-DMAmajor histocompatibility complex, class II, DM alpha
HLA-DPB1major histocompatibility complex, class II, DP beta 1
HLA-DQA1major histocompatibility complex, class II, DQ alpha 1
HLA-DQB1major histocompatibility complex, class II, DQ beta 1
ITGB2integrin subunit beta 2
LAPTM5lysosomal protein transmembrane 5
TNFRSF1BTNF receptor superfamily member 1B
Co-expressed with HLA-DPA1C1QAcomplement C1q A chain
C1QBcomplement C1q B chain
HLA-DRAmajor histocompatibility complex, class II, DR alpha
NCF1Cneutrophil cytosolic factor 1C pseudogene
Co-expressed with HLA-DRACTSScathepsin S
HLA-DPA1major histocompatibility complex, class II, DP alpha 1
SLAMF8SLAM family member 8
Table 6. Gene ontology (GO) enrichment analysis of HLA-DPA1 and -DRA co-expressed genes by the Database for Annotation, Visualization and Integrated Discovery (DAVID).
GO Term and FunctionCountGenep-ValueFold EnrichmentFDR
GOTERM_BP
GO:0019886, antigen processing and presentation of exogenous peptide antigen via MHC class II8HLA-DQB1, HLA-DPA1, CTSS, HLA-DPB1, HLA-DMA, CD74, HLA-DQA1, HLA-DRA7.29 × 10−1391.268.58 × 10−10
GO:0002504, antigen processing and presentation of peptide or polysaccharide antigen via MHC class II6HLA-DQB1, HLA-DPA1, HLA-DPB1, HLA-DMA, HLA-DQA1, HLA-DRA1.66 × 10−12370.411.96 × 10−9
GO:0019882, antigen processing and presentation7HLA-DQB1, HLA-DPA1, CTSS, HLA-DPB1, CD74, HLA-DQA1, HLA-DRA4.56 × 10−12133.57275.37 × 10−9
GO:0006955, immune response9HLA-DQB1, TNFRSF1B, HLA-DPA1, CTSS, HLA-DPB1, HLA-DMA, CD74, HLA-DQA1, HLA-DRA8.06 × 10−1022.449.49 × 10−7
GO:0060333, interferon-gamma-mediated signaling pathway5HLA-DQB1, HLA-DPA1, HLA-DPB1, HLA-DQA1, HLA-DRA3.87 × 10−773.914.55 × 10−4
GO:0031295, T cell costimulation5HLA-DQB1, HLA-DPA1, HLA-DPB1, HLA-DQA1, HLA-DRA5.66 × 10−767.286.66 × 10−4
GO:0050852, T cell receptor signaling pathway5HLA-DQB1, HLA-DPA1, HLA-DPB1, HLA-DQA1, HLA-DRA7.33 × 10−635.460.009
GO:0006954, inflammatory response4APOL3, TNFRSF1B, ITGB2, CXCR30.00411.084.88
GO:0002503, peptide antigen assembly with MHC class II protein complex2HLA-DMA, HLA-DRA0.004419.805.12
GO:0050870, positive regulation of T cell activation2HLA-DPA1, HLA-DPB10.016116.6117.26
GOTERM_CC
GO:0042613, MHC class II protein complex7HLA-DQB1, HLA-DPA1, HLA-DPB1, HLA-DMA, CD74, HLA-DQA1, HLA-DRA1.17 × 10−14341.091.10 × 10−11
GO:0071556, integral component of lumenal side of endoplasmic reticulum membrane6HLA-DQB1, HLA-DPA1, HLA-DPB1, CD74, HLA-DQA1, HLA-DRA3.06 × 10−11221.792.88 × 10−8
GO:0030658, transport vesicle membrane6HLA-DQB1, HLA-DPA1, HLA-DPB1, CD74, HLA-DQA1, HLA-DRA1.29 × 10−10169.261.21 × 10−7
GO:0030669, clathrin-coated endocytic vesicle membrane6HLA-DQB1, HLA-DPA1, HLA-DPB1, CD74, HLA-DQA1, HLA-DRA1.92 × 10−10156.881.81 × 10−7
GO:0012507, ER to Golgi transport vesicle membrane6HLA-DQB1, HLA-DPA1, HLA-DPB1, CD74, HLA-DQA1, HLA-DRA6.62 × 10−10123.696.23 × 10−7
GO:0005765, lysosomal membrane8HLA-DQB1, LAPTM5, HLA-DPA1, HLA-DPB1, HLA-DMA, CD74, HLA-DQA1, HLA-DRA1.64 × 10−931.2991.54 × 10−6
GO:0030666, endocytic vesicle membrane6HLA-DQB1, HLA-DPA1, HLA-DPB1, CD74, HLA-DQA1, HLA-DRA2.26 × 10−997.452.13 × 10−6
GO:0032588, trans-Golgi network membrane6HLA-DQB1, HLA-DPA1, HLA-DPB1, CD74, HLA-DQA1, HLA-DRA7.28 × 10−977.496.85 × 10−6
GO:0009986, cell surface6HLA-DPA1, ITGB2, HLA-DPB1, HLA-DMA, CD74, HLA-DRA7.60 × 10−511.867160.071
GO:0000139, Golgi membrane6HLA-DQB1, HLA-DPA1, HLA-DPB1, CD74, HLA-DQA1, HLA-DRA1.14 × 10−410.880.108
GO:0010008, endosome membrane4HLA-DQB1, HLA-DPA1, HLA-DPB1, HLA-DQA15.23 × 10−423.1780.491
GO:0005602, complement component C1 complex2C1QA, C1QB0.00210721.64
GO:0005887, integral component of plasma membrane6TNFRSF1B, LAPTM5, HLA-DPA1, CXCR3, HLA-DQA1, HLA-DRA0.0064.555.44
GO:0016020, membrane7HLA-DQB1, APOL3, ITGB2, HLA-DPB1, HLA-DMA, CD74, HLA-DQA10.0083.417.62
GO:0005886, plasma membrane9HLA-DQB1, TNFRSF1B, HLA-DPA1, ITGB2, CXCR3, HLA-DPB1, CD74, HLA-DQA1, HLA-DRA0.01492.3413.19
GO:0005764, lysosome3LAPTM5, CTSS, HLA-DRA0.016414.2314.39
GO:0016021, integral component of membrane10HLA-DQB1, TNFRSF1B, HLA-DPA1, SLAMF8, CXCR3, HLA-DPB1, HLA-DMA, CD74, HLA-DQA1, HLA-DRA0.01762.0815.35
GO:0005576, extracellular region5C1QA, APOL3, C1QB, TNFRSF1B, CTSS0.0473.3336.23
GOTERM_MF
GO:0032395, MHC class II receptor activity6HLA-DQB1, HLA-DPA1, HLA-DPB1, HLA-DMA, HLA-DQA1, HLA-DRA7.86 × 10−13422.037.31 × 10−10
GO:0042605, peptide antigen binding5HLA-DQB1, HLA-DPA1, HLA-DPB1, HLA-DQA1, HLA-DRA8.16 × 10−9188.407.59 × 10−6
GO:0023026, MHC class II protein complex binding3HLA-DMA, CD74, HLA-DRA8.78 × 10−5197.820.082
GO:0004252, serine-type endopeptidase activity3C1QA, C1QB, CTSS0.02112.4117.90
Table 7. Association of 11 HLA class II co-expressed genes in cutaneous melanoma with survival generated from Cox regression analysis via OncoLnc.
GeneCox Coefficientp-ValueFDR CorrectedRankMedian ExpressionMean Expression
APOL3−0.3463.60 × 10−79.97 × 10−558380.28755.47
C1QA−0.3465.30 × 10−71.08 × 10−4792654.85159.04
CD74−0.3398.70 × 10−71.36 × 10−410331,899.3463,138.81
C1QB−0.3371.10 × 10−61.45 × 10−41142932.115671.22
ITGB2−0.2833.50 × 10−51.34 × 10−34181577.142848.66
NCF1C−0.284.80 × 10−51.65 × 10−346840.0397.48
CXCR3−0.2625.00 × 10−51.69 × 10−347469.42194.29
LAPTM5−0.2715.10 × 10−51.71 × 10−34782998.914868.46
CTSS−0.2677.20 × 10−52.14 × 10−35371627.912518.04
TNFRSF1B−0.2631.50 × 10−43.64 × 10−3661805.721283.71
SLAMF8−0.2422.60 × 10−45.42 × 10−3769377.6711.27

