Hypertension Assessment via ECG and PPG Signals: An Evaluation Using MIMIC Database


Abstract
:1. Introduction
2. Methods
2.1. Database
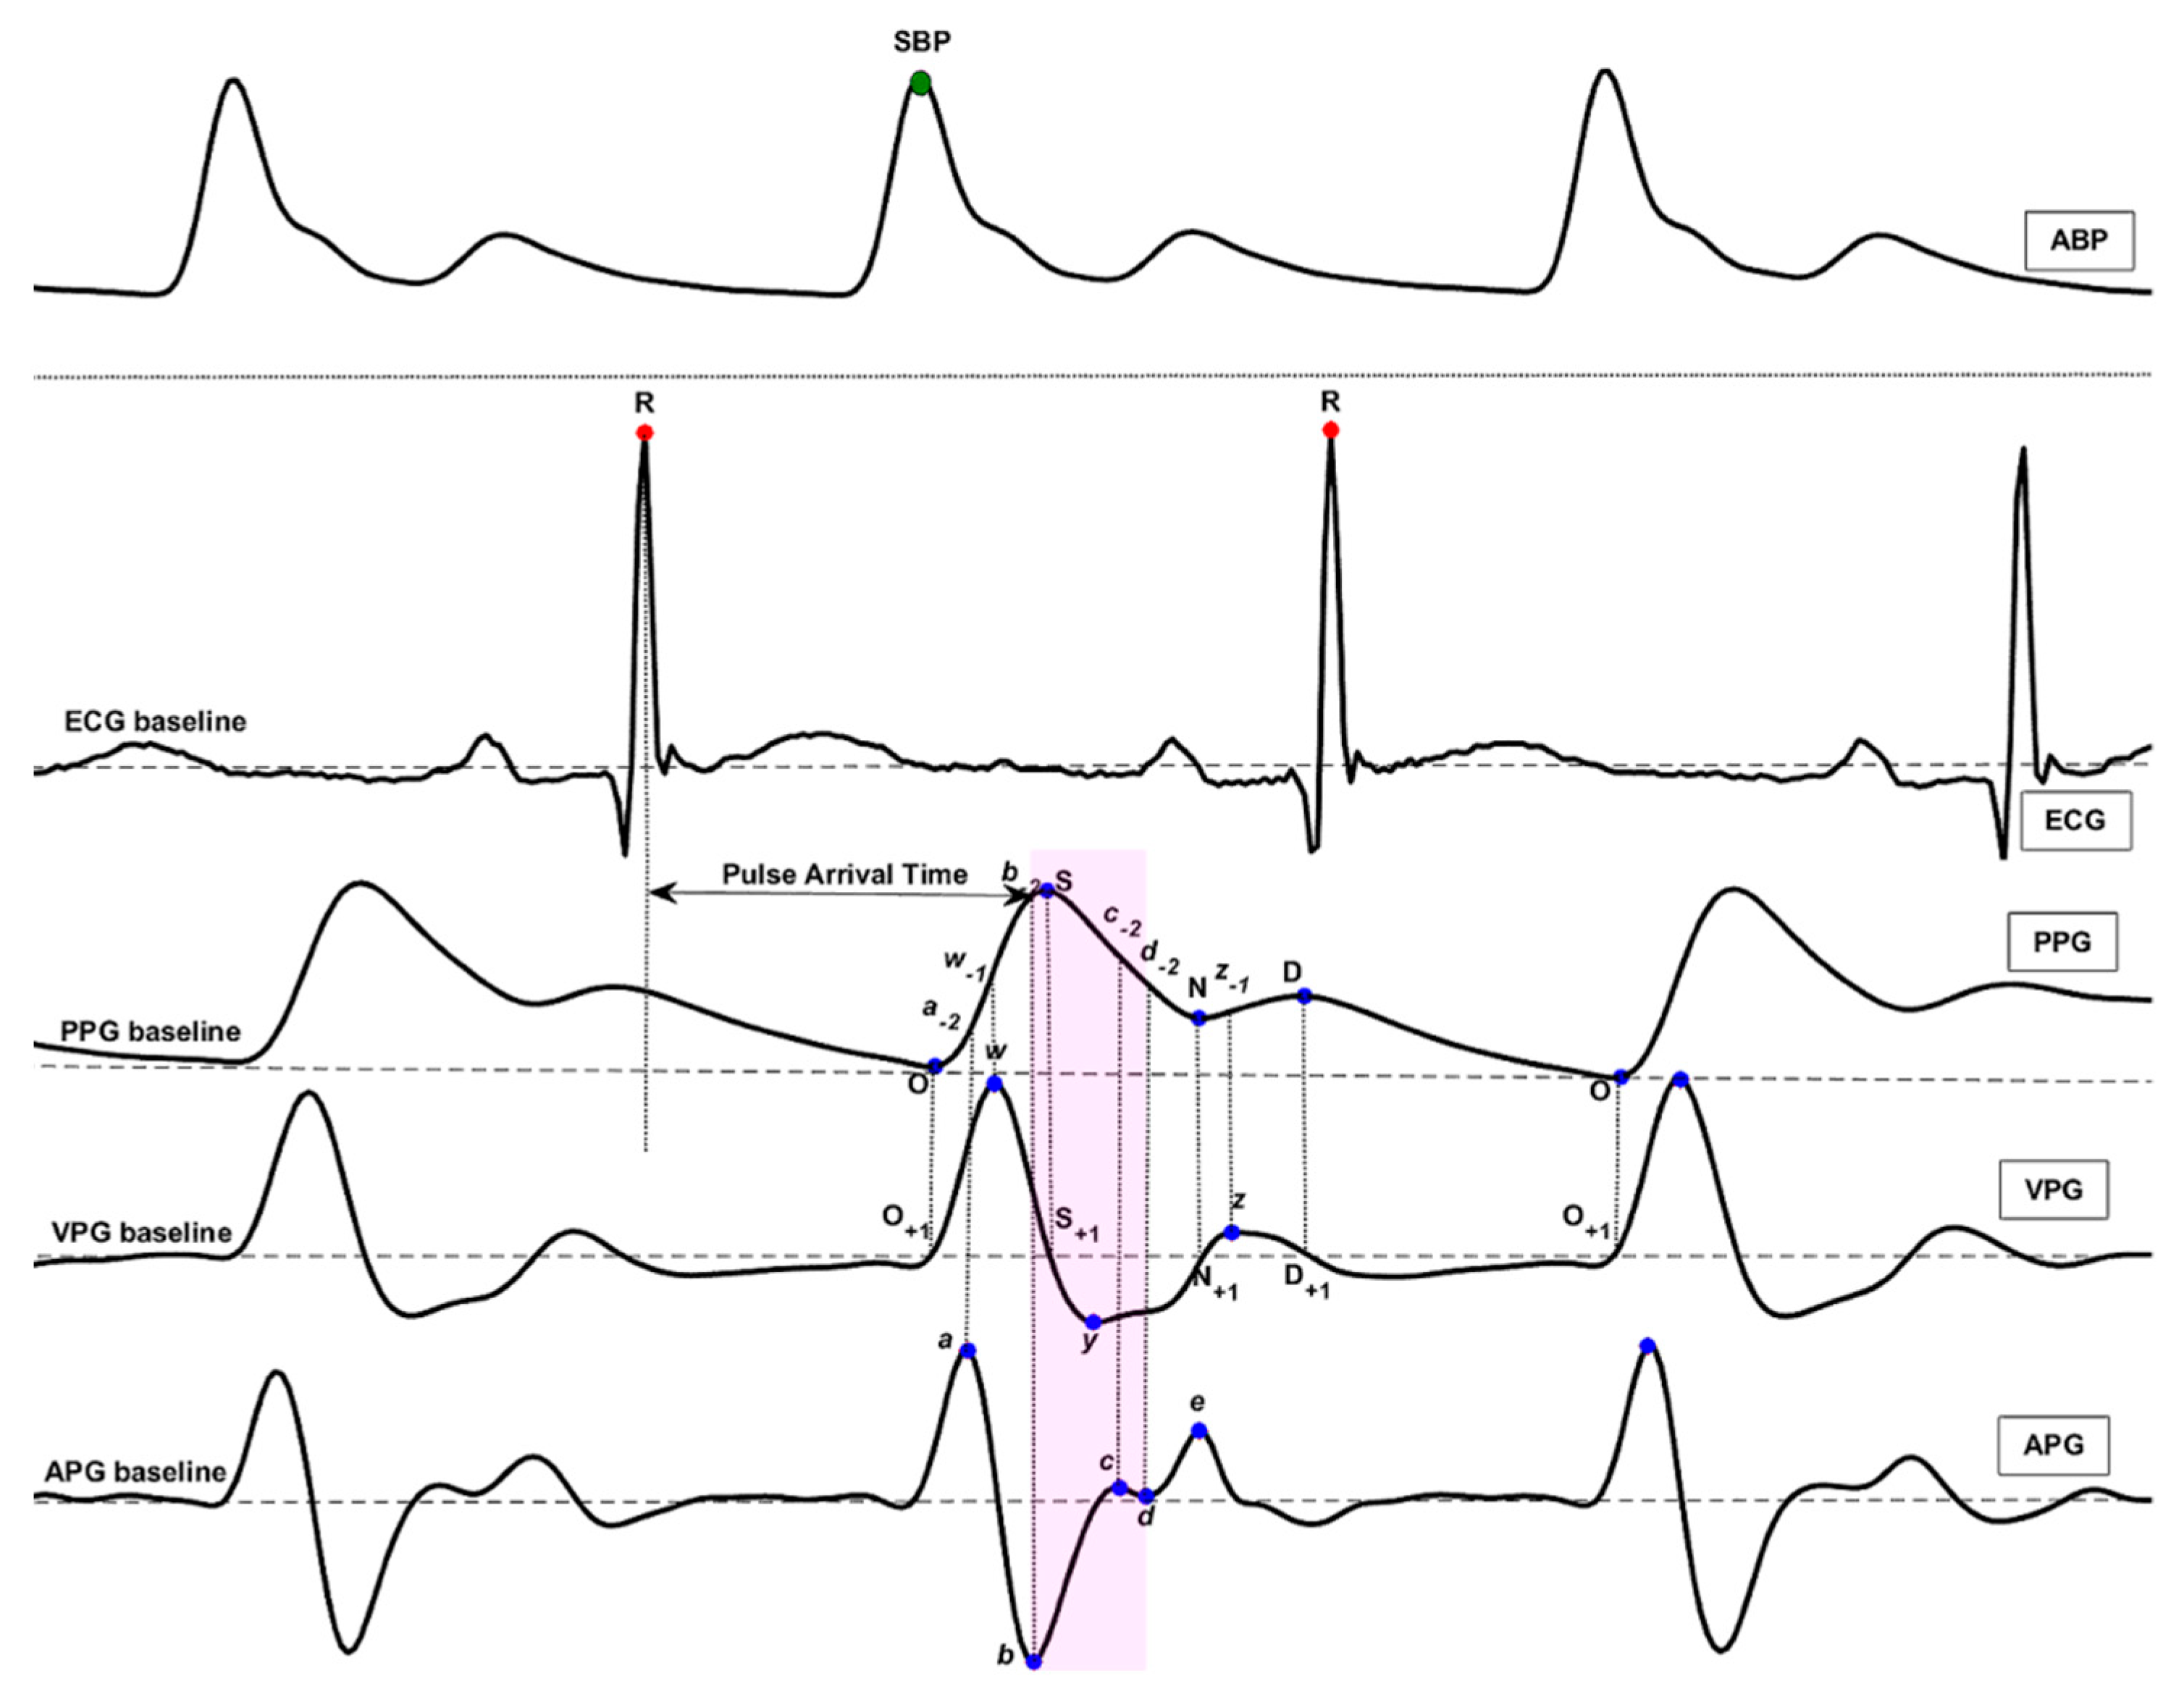
2.2. PAT Feature
2.3. PPG Features
- Time Span (23): The time span features are expressed as their letters with a dash on top (e.g., ).
- Features of PPG Amplitude (14): The S, N, D, w-1, a-2, b-2, c-2, etc. features were defined in PPG waveform. They represent the amplitude of the corresponding waveform from the PPG baseline.
- Features of VPG and APG (20): The a, b, c, d, and e features were defined in the APG waveform, and the w, x, y, and z features were defined in the VPG waveform. They represent the amplitude of the corresponding waveform from the APG baseline and VPG baseline. Other features based on these features were also defined, such as b/a, c/a, d/a, e/a, (b-c-d-e)/a, (b-c-d)/a, and so on.
- Waveform Area (4): The waveform AC component area features are expressed as their letters with a polyline on top (e.g., ).
- Power Area (15): The power area features are expressed as their letters with a brace on top (e.g., ). For example, the feature represents the quadratic sum of the curve point from the onset point O to the systolic peak S.
- Ratio (43): The ratio features are expressed directly as their ratio formulae (e.g., , ).
- Slope (16): The slope features are expressed as their letters with a tilde on top (e.g., ).
2.4. Classification Models
3. Results
4. Discussion
5. Conclusions
Author Contributions
Funding
Conflicts of Interest
References
- Mendis, S.; Puska, P.; Norrving, B. Global Atlas on Cardiovascular Disease Prevention and Control; World Health Organization: Geneva, Switzerland, 2011. [Google Scholar]
- Moore, R.D. The High Blood Pressure Solution: A Scientifically Proven Program for Preventing Strokes and Heart Diseases; Simon and Schuster: New York, NY, USA, 2001. [Google Scholar]
- Chobanian, A.V.; Bakris, G.L.; Black, H.R.; Cushman, W.C.; Green, L.A.; Izzo, J.L., Jr.; Jones, D.W.; Materson, B.J.; Oparil, S.; Wright, J.T., Jr.; et al. The seventh report of the joint national committee on prevention, detection, evaluation, and treatment of high blood pressure. Hypertension 2003, 42, 1206–1252. [Google Scholar] [CrossRef] [PubMed]
- Pielmuş, A.-G.; Osterland, D.; Klum, M.; Tigges, T.; Feldheiser, A.; Hunsicker, O.; Orglmeister, R. Correlation of arterial blood pressure to synchronous piezo, impedance and photoplethysmographic signal features. Curr. Dir. Biomed. Eng. 2017, 3, 749–753. [Google Scholar] [CrossRef] [Green Version]
- Bruno, R.M.; Duranti, E.; Ippolito, C.; Segnani, C.; Bernardini, N.; Di Candio, G.; Chiarugi, M.; Taddei, S.; Virdis, A. Different impact of essential hypertension on structural and functional age-related vascular changes. Hypertension 2017, 69, 71–78. [Google Scholar] [CrossRef] [PubMed]
- Mukkamala, R.; Hahn, J.O.; Inan, O.T.; Mestha, L.K.; Kim, C.S.; Toreyin, H.; Kyal, S. Toward ubiquitous blood pressure monitoring via pulse transit time: Theory and practice. IEEE Trans. Biomed. Eng. 2015, 62, 1879–1901. [Google Scholar] [CrossRef] [PubMed]
- Johnson, A.E.; Pollard, T.J.; Shen, L.; Lehman, L.W.; Feng, M.; Ghassemi, M.; Moody, B.; Szolovits, P.; Celi, L.A.; Mark, R.G. MIMIC-II, a freely accessible critical care database. Sci. Data 2016, 3, 160035. [Google Scholar] [CrossRef] [PubMed]
- Goldberger, A.L.; Amaral, A.L.; Glass, L.; Hausdorff, J.M.; Ivanov, P.C.; Mark, R.G.; Mietus, J.E.; Moody, G.B.; Peng, C.K.; Stanley, H.E. Physiobank, physiotoolkit, and physionet: Components of a new research resource for complex physiologic signals. Circulation 2000, 101, e215–e220. [Google Scholar] [CrossRef] [PubMed]
- Forouzanfar, M.; Ahmad, S.; Batkin, I.; Dajani, H.R.; Groza, V.Z.; Bolic, M. Coefficient-free blood pressure estimation based on pulse transit time–cuff pressure dependence. IEEE Trans. Biomed. Eng. 2013, 60, 1814–1824. [Google Scholar] [CrossRef] [PubMed]
- Wang, R.; Jia, W.; Mao, Z.-H.; Sclabassi, R.J.; Sun, M. Cuff-free blood pressure estimation using pulse transit time and heart rate. In Proceedings of the 12th International Conference on Signal Processing, Hangzhou, China, 19–23 October 2014. [Google Scholar]
- Zhang, Q.; Chen, X.; Fang, Z.; Xue, Y.; Zhan, Q.; Yang, T.; Xia, S. Cuff-less blood pressure measurement using pulse arrival time and a kalman filter. J. Micromech. Microeng. 2017, 27, 024002. [Google Scholar] [CrossRef]
- Pflugradt, M.; Geissdoerfer, K.; Goernig, M.; Orglmeister, R. A fast multimodal ectopic beat detection method applied for blood pressure estimation based on pulse wave velocity measurements in wearable sensors. Sensors 2017, 17, 158. [Google Scholar] [CrossRef] [PubMed] [Green Version]
- Feng, J.; Huang, Z.; Zhou, C.; Ye, X. Study of continuous blood pressure estimation based on pulse transit time, heart rate and photoplethysmography-derived hemodynamic covariates. Aust. Phys. Eng. Sci. Med. 2018, 41, 403–413. [Google Scholar] [CrossRef] [PubMed]
- Clifford, G.D.; Scott, D.J.; Villarroel, M. User Guide and Documentation for the Mimic ii Database. MIMIC-II Database Version 2009, Version 2.6. Available online: https://physionet.org/mimic2/UserGuide/UserGuide.pdf (accessed on 7 September 2011).
- Elgendi, M.; Fletcher, R.; Liang, Y.; Howard, N.; Abbott, D.; Lim, K.; Ward, R. Blood pressure estimation using the pulse oximeter and other physiological signals. NPJ Digit. Med. 2018. accepted. [Google Scholar]
- Choi, Y.; Zhang, Q.; Ko, S. Noninvasive cuffless blood pressure estimation using pulse transit time and hilbert-huang transform. Comput. Electr. Eng. 2013, 39, 103–111. [Google Scholar] [CrossRef]
- Li, B.N.; Dong, M.C.; Vai, M.I. On an automatic delineator for arterial blood pressure waveforms. Biomed. Signal Process. Control 2010, 5, 76–81. [Google Scholar] [CrossRef]
- Liang, Y.; Elgendi, M.; Chen, Z.; Ward, R. An optimal filter for short photoplethysmogram signals. Sci. Data 2018, 5, 180076. [Google Scholar] [CrossRef] [PubMed] [Green Version]
- Shin, W.; Cha, Y.D.; Yoon, G. ECG/PPG integer signal processing for a ubiquitous health monitoring system. J. Med. Syst. 2010, 34, 891–898. [Google Scholar] [CrossRef] [PubMed]
- Elgendi, M. TERMA framework for biomedical signal analysis: An economic-inspired approach. Biosensors 2016, 6, 55. [Google Scholar] [CrossRef] [PubMed]
- Elgendi, M. Eventogram: A visual representation of main events in biomedical signals. Bioengineering 2016, 3, 22. [Google Scholar] [CrossRef] [PubMed]
- Elgendi, M.; Liang, Y.; Ward, R. Toward generating more diagnostic features from photoplethysmogram waveforms. Diseases 2018, 6, 20. [Google Scholar] [CrossRef] [PubMed]
- Elgendi, M. Fast QRS detection with an optimized knowledge-based method evaluation on 11 standard ECG databases. PLoS ONE 2013, 8, e73557. [Google Scholar] [CrossRef] [PubMed]
- Elgendi, M.; Al-Ali, A.; Mohamed, A.; Ward, R. Improving remote health monitoring: A low-complexity ECG compression approach. Diagnostics 2018, 8, 10. [Google Scholar] [CrossRef] [PubMed]
- Elgendi, M.; Mohamed, A.; Ward, R. Efficient ECG compression and QRS detection for e-health applications. Sci. Rep. 2017, 7, 459. [Google Scholar] [CrossRef] [PubMed]
- Liang, Y.; Chen, Z.; Liu, G.; Elgendi, M. A new, short-recorded photoplethysmogram dataset for blood pressure monitoring in china. Sci. Data 2018, 5, 180020. [Google Scholar] [CrossRef] [PubMed]
- Messas, E.; Pernot, M.; Couade, M. Arterial wall elasticity: State of the art and future prospects. Diagn. Interv. Imaging 2013, 94, 561–569. [Google Scholar] [CrossRef] [PubMed]
- Allen, J. Photoplethysmography and its application in clinical physiological measurement. Physiol. Meas. 2007, 28, R1–R39. [Google Scholar] [CrossRef] [PubMed]
- Elgendi, M. On the analysis of fingertip photoplethysmogram signals. Curr. Cardiol. Rev. 2012, 8, 14–25. [Google Scholar] [CrossRef] [PubMed]
- Shin, H.; Min, S.D. Feasibility study for the non-invasive blood pressure estimation based on ppg morphology: Normotensive subject study. Biomed. Eng. Online 2017, 16, 10. [Google Scholar] [CrossRef] [PubMed]
- Kachuee, M.; Kiani, M.M.; Mohammadzade, H.; Shabany, M. Cuffless blood pressure estimation algorithms for continuous health-care monitoring. IEEE Trans. Biomed. Eng. 2017, 64, 859–869. [Google Scholar] [CrossRef] [PubMed]
- Ding, X.; Yan, B.P.; Zhang, Y.T.; Liu, J.; Zhao, N.; Tsang, H.K. Pulse transit time based continuous cuffless blood pressure estimation: A new extension and a comprehensive evaluation. Sci. Rep. 2017, 7, 11554. [Google Scholar] [CrossRef] [PubMed]
- Xing, X.; Sun, M. Optical blood pressure estimation with photoplethysmography and fft-based neural networks. Biomed. Opt. Express 2016, 7, 3007–3020. [Google Scholar] [CrossRef] [PubMed]
- Elgendi, M. Optimal signal quality index for photoplethysmogram signals. Bioengineering 2016, 3, 21. [Google Scholar] [CrossRef] [PubMed]
- Elgendi, M.; Norton, I.; Brearley, M.; Abbott, D.; Schuurmans, D. Systolic peak detection in acceleration photoplethysmograms measured from emergency responders in tropical conditions. PLoS ONE 2013, 8, e76585. [Google Scholar] [CrossRef] [PubMed] [Green Version]
- Elgendi, M. Detection of c, d, and e waves in the acceleration photoplethysmogram. Comput. Methods Programs Biomed. 2014, 117, 125–136. [Google Scholar] [CrossRef] [PubMed]
- Elgendi, M.; Norton, I.; Brearley, M.; Abbott, D.; Schuurmans, D. Detection of a and b waves in the acceleration photoplethysmogram. Biomed. Eng. Online 2014, 13, 139. [Google Scholar] [CrossRef] [PubMed]
- Elgendi, M. Merging digital medicine and economics: Two moving averages unlock biosignals for better health. Diseases 2018, 6, 6. [Google Scholar] [CrossRef] [PubMed]
- Elgendi, M. Less is more in biosignal analysis: Compressed data could open the door to faster and better diagnosis. Diseases 2018, 6, 18. [Google Scholar] [CrossRef] [PubMed]
- Mills, K.T.; Bundy, J.D.; Kelly, T.N.; Reed, J.E.; Kearney, P.M.; Reynolds, K.; Chen, J.; He, J. Global disparities of hypertension prevalence and controlclinical perspective: A systematic analysis of population-based studies from 90 countries. Circulation 2016, 134, 441–450. [Google Scholar] [CrossRef] [PubMed]
- Elgendi, M.; Howard, N.; Lovell, N.; Cichocki, A.; Brearley, M.; Abbott, D.; Adatia, I. A six-step framework on biomedical signal analysis for tackling noncommunicable diseases: Current and future perspectives. JMIR Biomed. Eng. 2016, 1, e1. [Google Scholar] [CrossRef]

| Feature # | PPG Features | Normotension | Prehypertension | Hypertension | ANOVA p-Value |
|---|---|---|---|---|---|
| 1 | 0.52 ± 0.45 | 0.52 ± 0.42 | 0.38 ± 0.45 | <0.01 | |
| 2 | −2.94 ± 7.66 | −3.35 ± 7.11 | −0.93 ± 8.65 | <0.01 | |
| 3 | 0.06 ± 0.05 | 0.06 ± 0.04 | 0.04 ± 0.05 | <0.01 | |
| 4 | c-2 | 0.79 ± 0.17 | 0.78 ± 0.16 | 0.83 ± 0.19 | <0.01 |
| 5 | 0.09 ± 0.06 | 0.09 ± 0.04 | 0.09 ± 0.06 | <0.01 | |
| 6 | (b-c-d)/a | −0.53 ± 0.64 | −0.61 ± 0.59 | −0.48 ± 0.61 | <0.01 |
| 7 | d | −0.52 ± 0.61 | −0.41 ± 0.57 | −0.69 ± 0.63 | <0.01 |
| 8 | c-1/w | −0.25 ± 0.27 | −0.26 ± 0.26 | −0.14 ± 0.28 | <0.01 |
| 9 | d/a | −0.21 ± 0.26 | −0.17 ± 0.25 | −0.27 ± 0.25 | <0.01 |
| 10 | −6.79 ± 6.03 | −7.34 ± 5.71 | −5.31 ± 7.01 | <0.01 |
| Trial | Feature Set | AdaBoost Tree | Logistic Regression | K-Nearest Neighbors | Bagged Tree | ||||||||
|---|---|---|---|---|---|---|---|---|---|---|---|---|---|
| SE (%) | SP (%) | F1 (%) | SE (%) | SP (%) | F1 (%) | SE (%) | SP (%) | F1 (%) | SE (%) | SP (%) | F1 (%) | ||
| Normal (46) vs. Prehyp. (41) | PAT feature | 67.42 | 65.46 | 66.88 | 56.91 | 56.27 | 56.85 | 46.69 | 73.29 | 53.93 | 67.63 | 65.24 | 66.95 |
| 10 PPG features | 90.13 | 41.81 | 72.76 | 71.65 | 46.01 | 63.66 | 79.48 | 77.07 | 78.62 | 79.20 | 77.14 | 78.48 | |
| (PAT + 10 PPG) features | 75.67 | 72.72 | 74.67 | 67.35 | 56.20 | 63.92 | 83.92 | 84.76 | 84.34 | 83.50 | 84.26 | 83.88 | |
| Normal (46) vs. Hyp. (34) | PAT feature | 63.48 | 80.56 | 68.10 | 63.04 | 80.71 | 67.85 | 40.09 | 93.08 | 54.08 | 63.48 | 80.56 | 68.10 |
| 10 PPG features | 75.65 | 88.81 | 80.11 | 62.09 | 82.47 | 67.94 | 84.78 | 91.31 | 86.94 | 81.65 | 91.09 | 84.98 | |
| (PAT + 10 PPG) features | 87.57 | 94.33 | 90.15 | 78.87 | 82.62 | 79.11 | 94.26 | 96.17 | 94.84 | 92.70 | 96.39 | 94.13 | |
| (Norm + Prehyp.) (87) vs. Hyp. (34) | PAT feature | 40.44 | 95.37 | 53.19 | 45.51 | 88.76 | 52.38 | 40.27 | 95.37 | 53.01 | 40.44 | 95.37 | 53.19 |
| 10 PPG features | 53.16 | 94.63 | 63.79 | 35.02 | 94.55 | 47.10 | 74.40 | 93.92 | 78.44 | 68.09 | 94.94 | 75.32 | |
| (PAT + 10 PPG) features | 74.22 | 95.23 | 79.71 | 55.20 | 91.20 | 62.26 | 87.47 | 95.93 | 88.49 | 85.87 | 96.50 | 88.22 | |
© 2018 by the authors. Licensee MDPI, Basel, Switzerland. This article is an open access article distributed under the terms and conditions of the Creative Commons Attribution (CC BY) license (http://creativecommons.org/licenses/by/4.0/).
Share and Cite
Liang, Y.; Chen, Z.; Ward, R.; Elgendi, M. Hypertension Assessment via ECG and PPG Signals: An Evaluation Using MIMIC Database. Diagnostics 2018, 8, 65. https://doi.org/10.3390/diagnostics8030065
Liang Y, Chen Z, Ward R, Elgendi M. Hypertension Assessment via ECG and PPG Signals: An Evaluation Using MIMIC Database. Diagnostics. 2018; 8(3):65. https://doi.org/10.3390/diagnostics8030065
Chicago/Turabian StyleLiang, Yongbo, Zhencheng Chen, Rabab Ward, and Mohamed Elgendi. 2018. "Hypertension Assessment via ECG and PPG Signals: An Evaluation Using MIMIC Database" Diagnostics 8, no. 3: 65. https://doi.org/10.3390/diagnostics8030065