
Reliability of Various Measurement Stations for Determining Plantar Fascia Thickness and Echogenicity

Abstract
:1. Introduction
2. Materials and Methods
2.1. Participant Selection
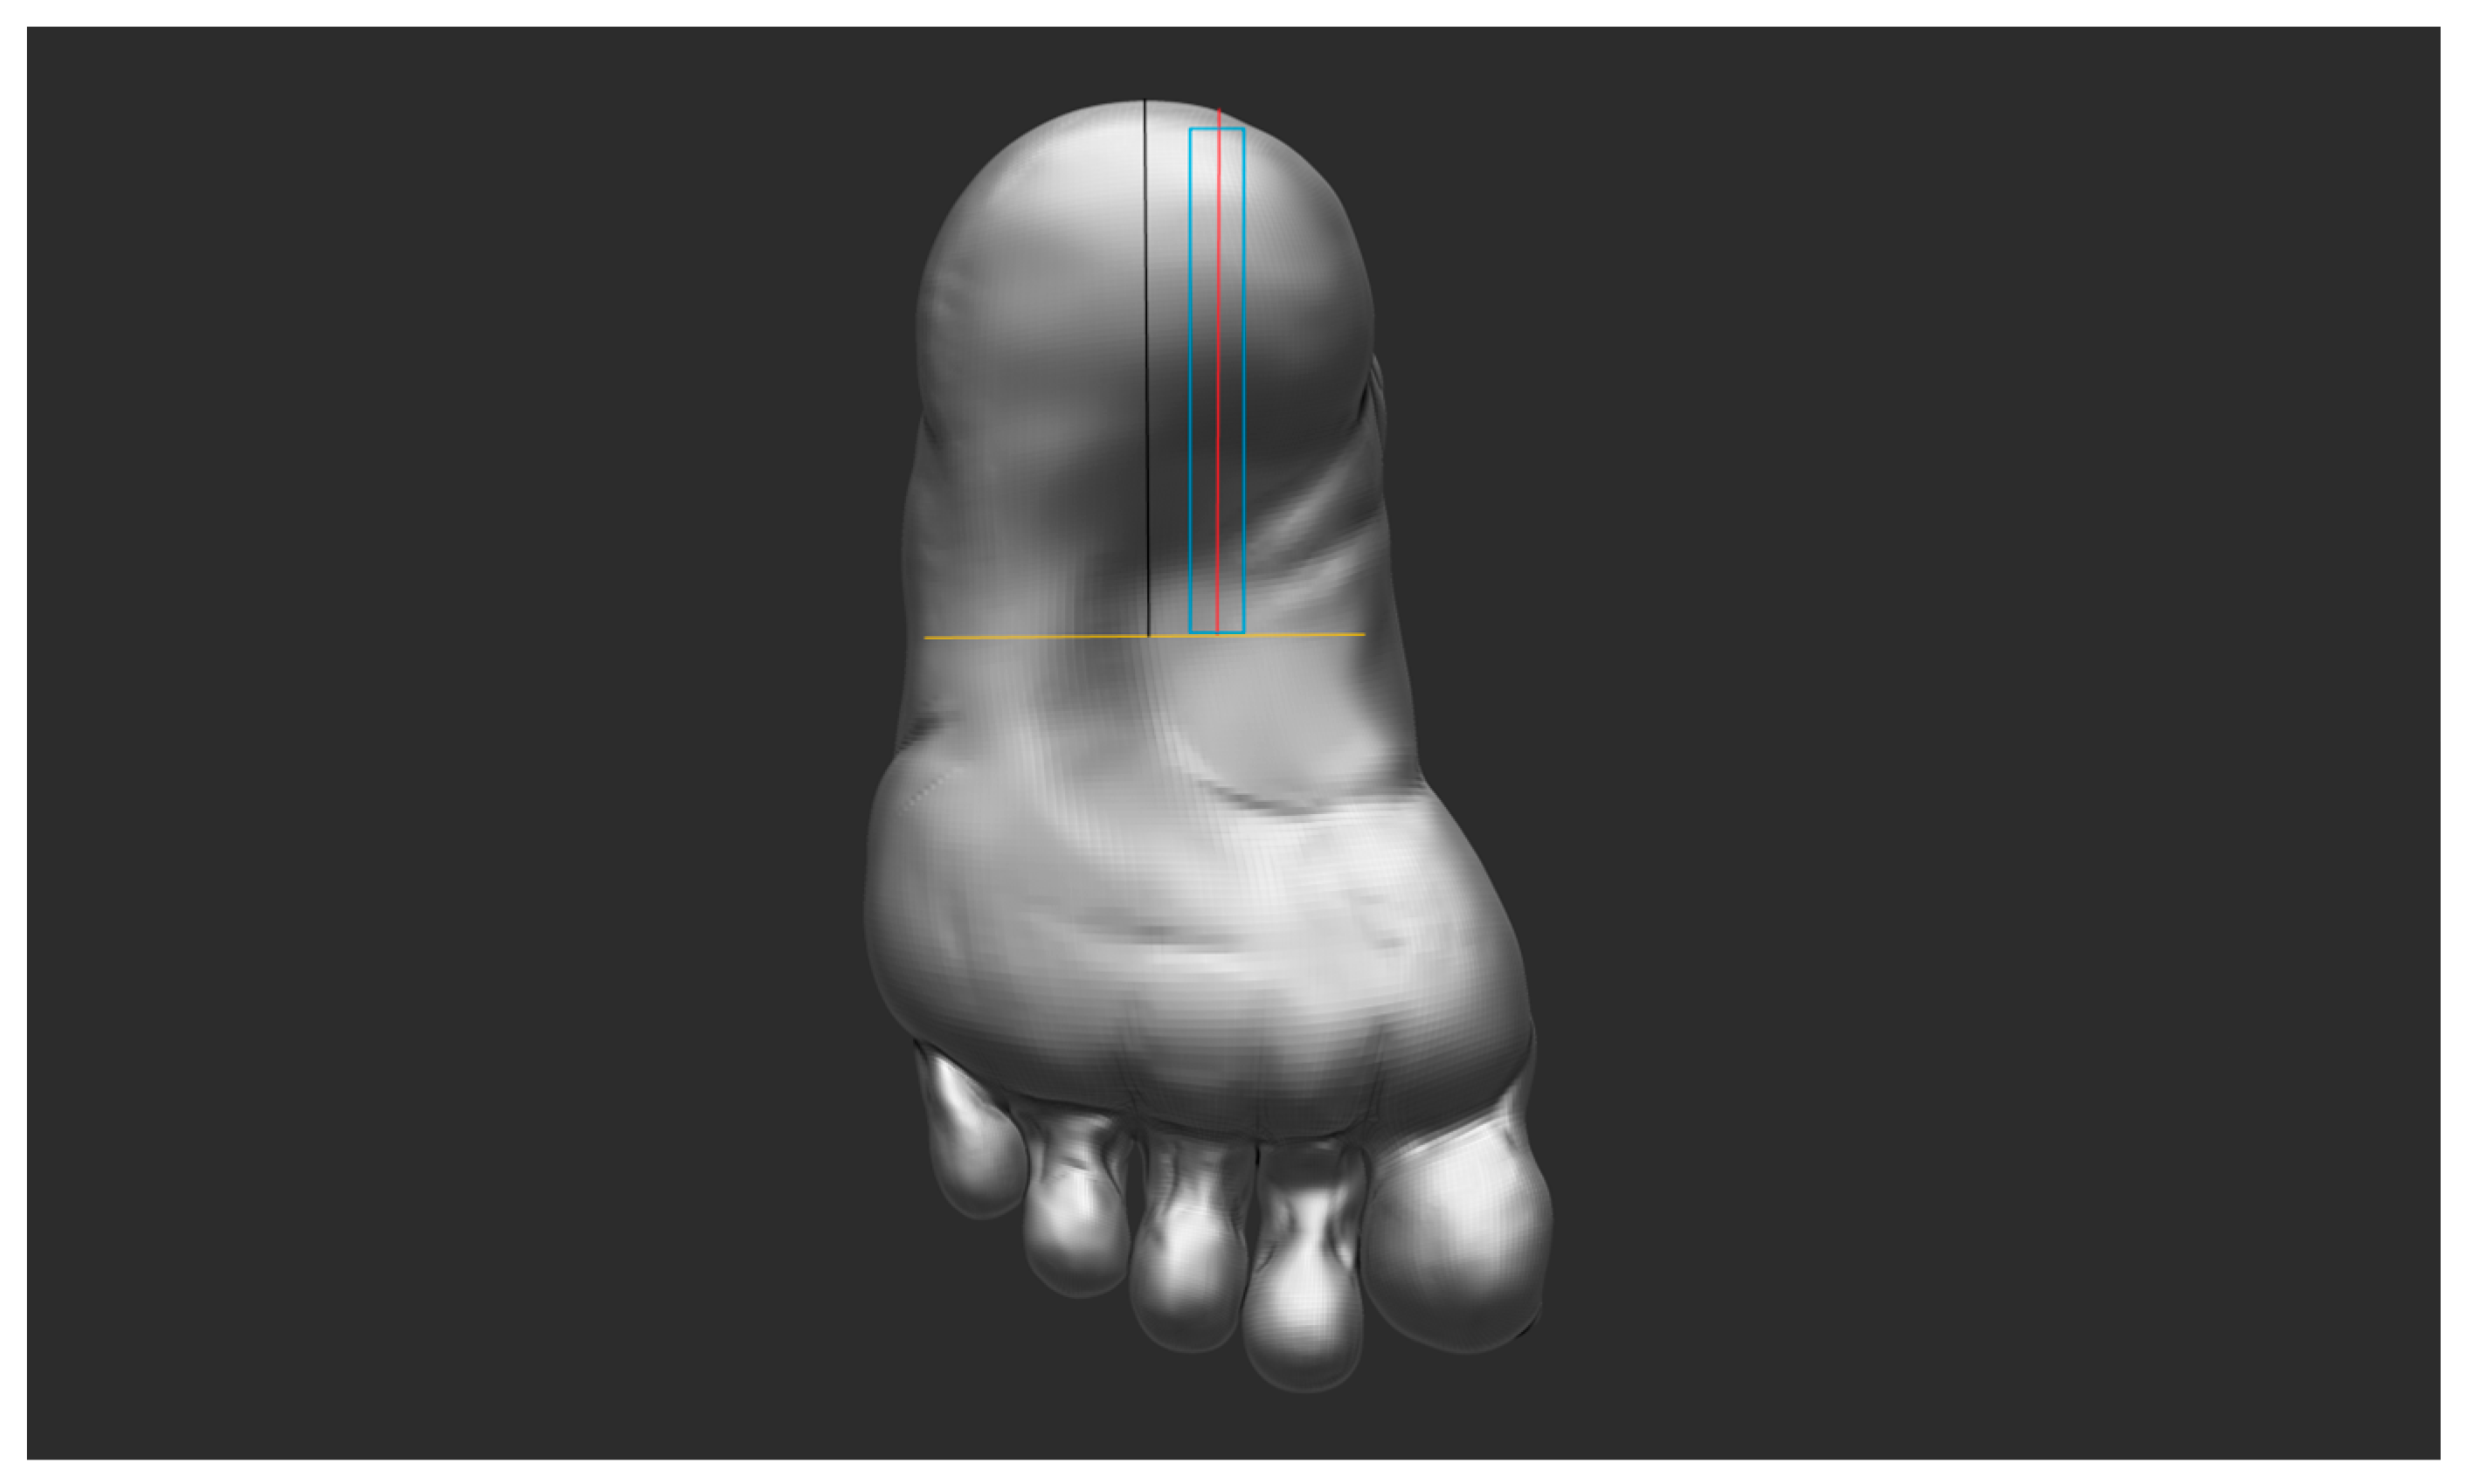
2.2. Test Procedure
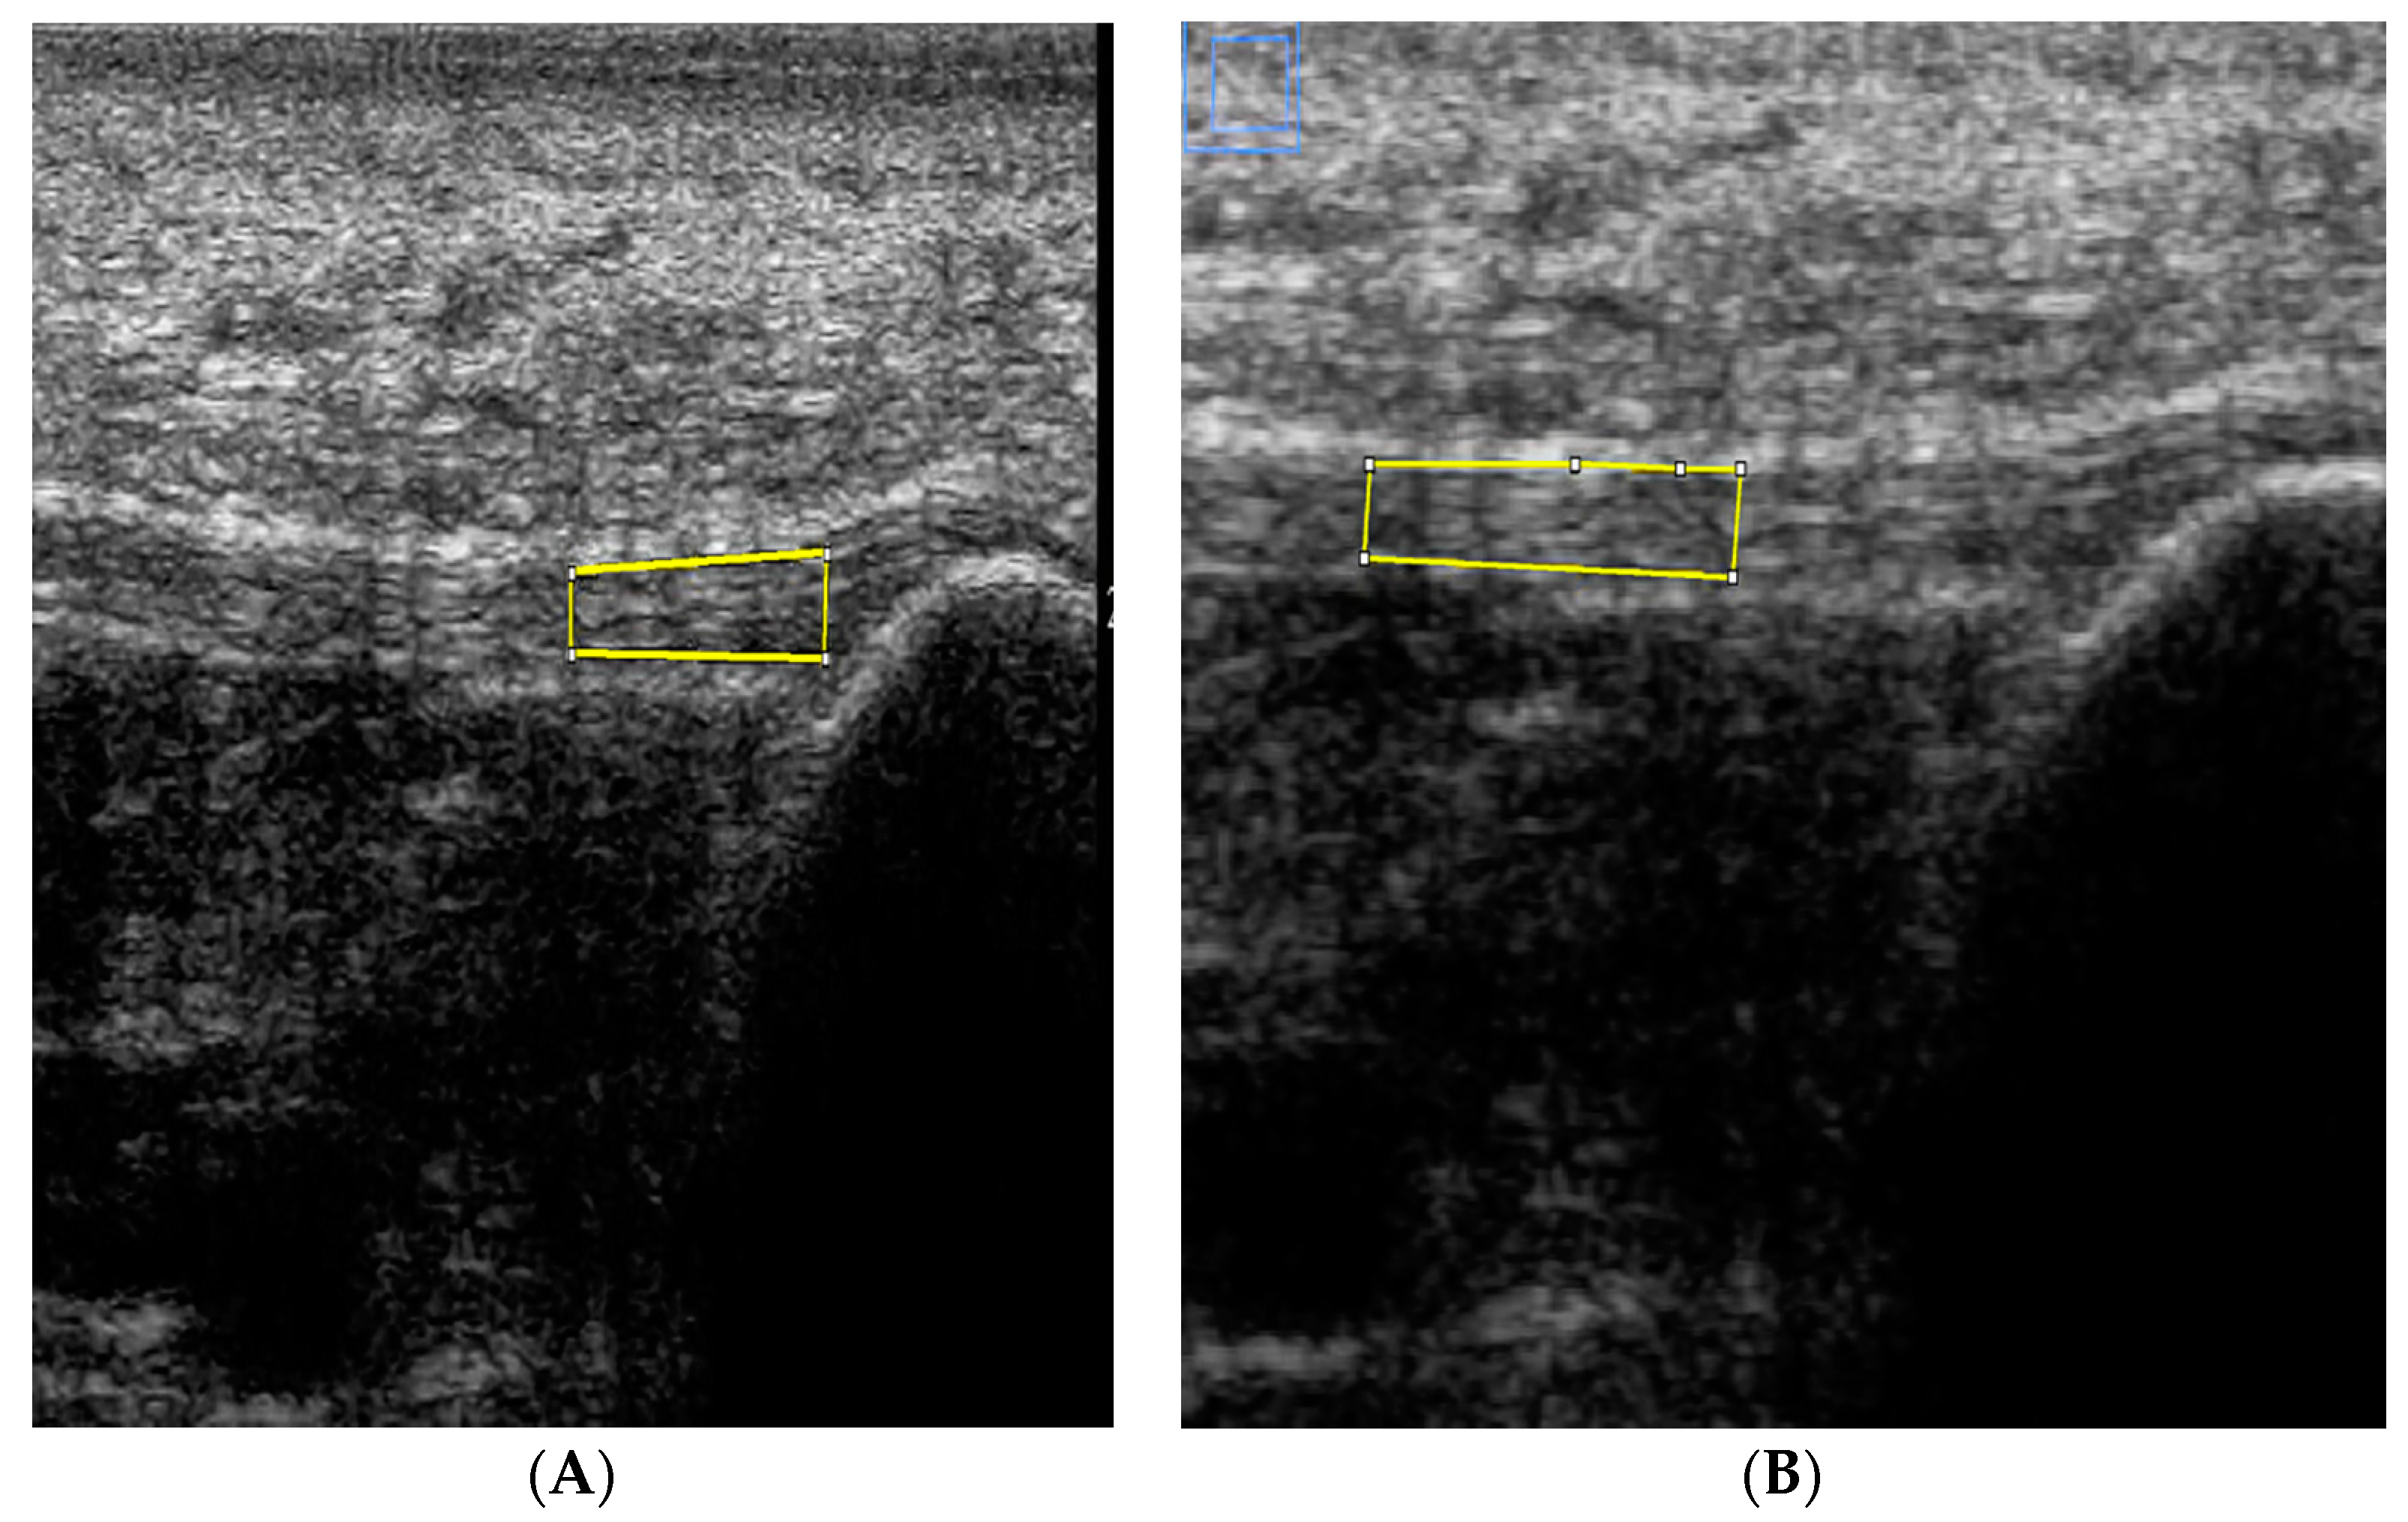
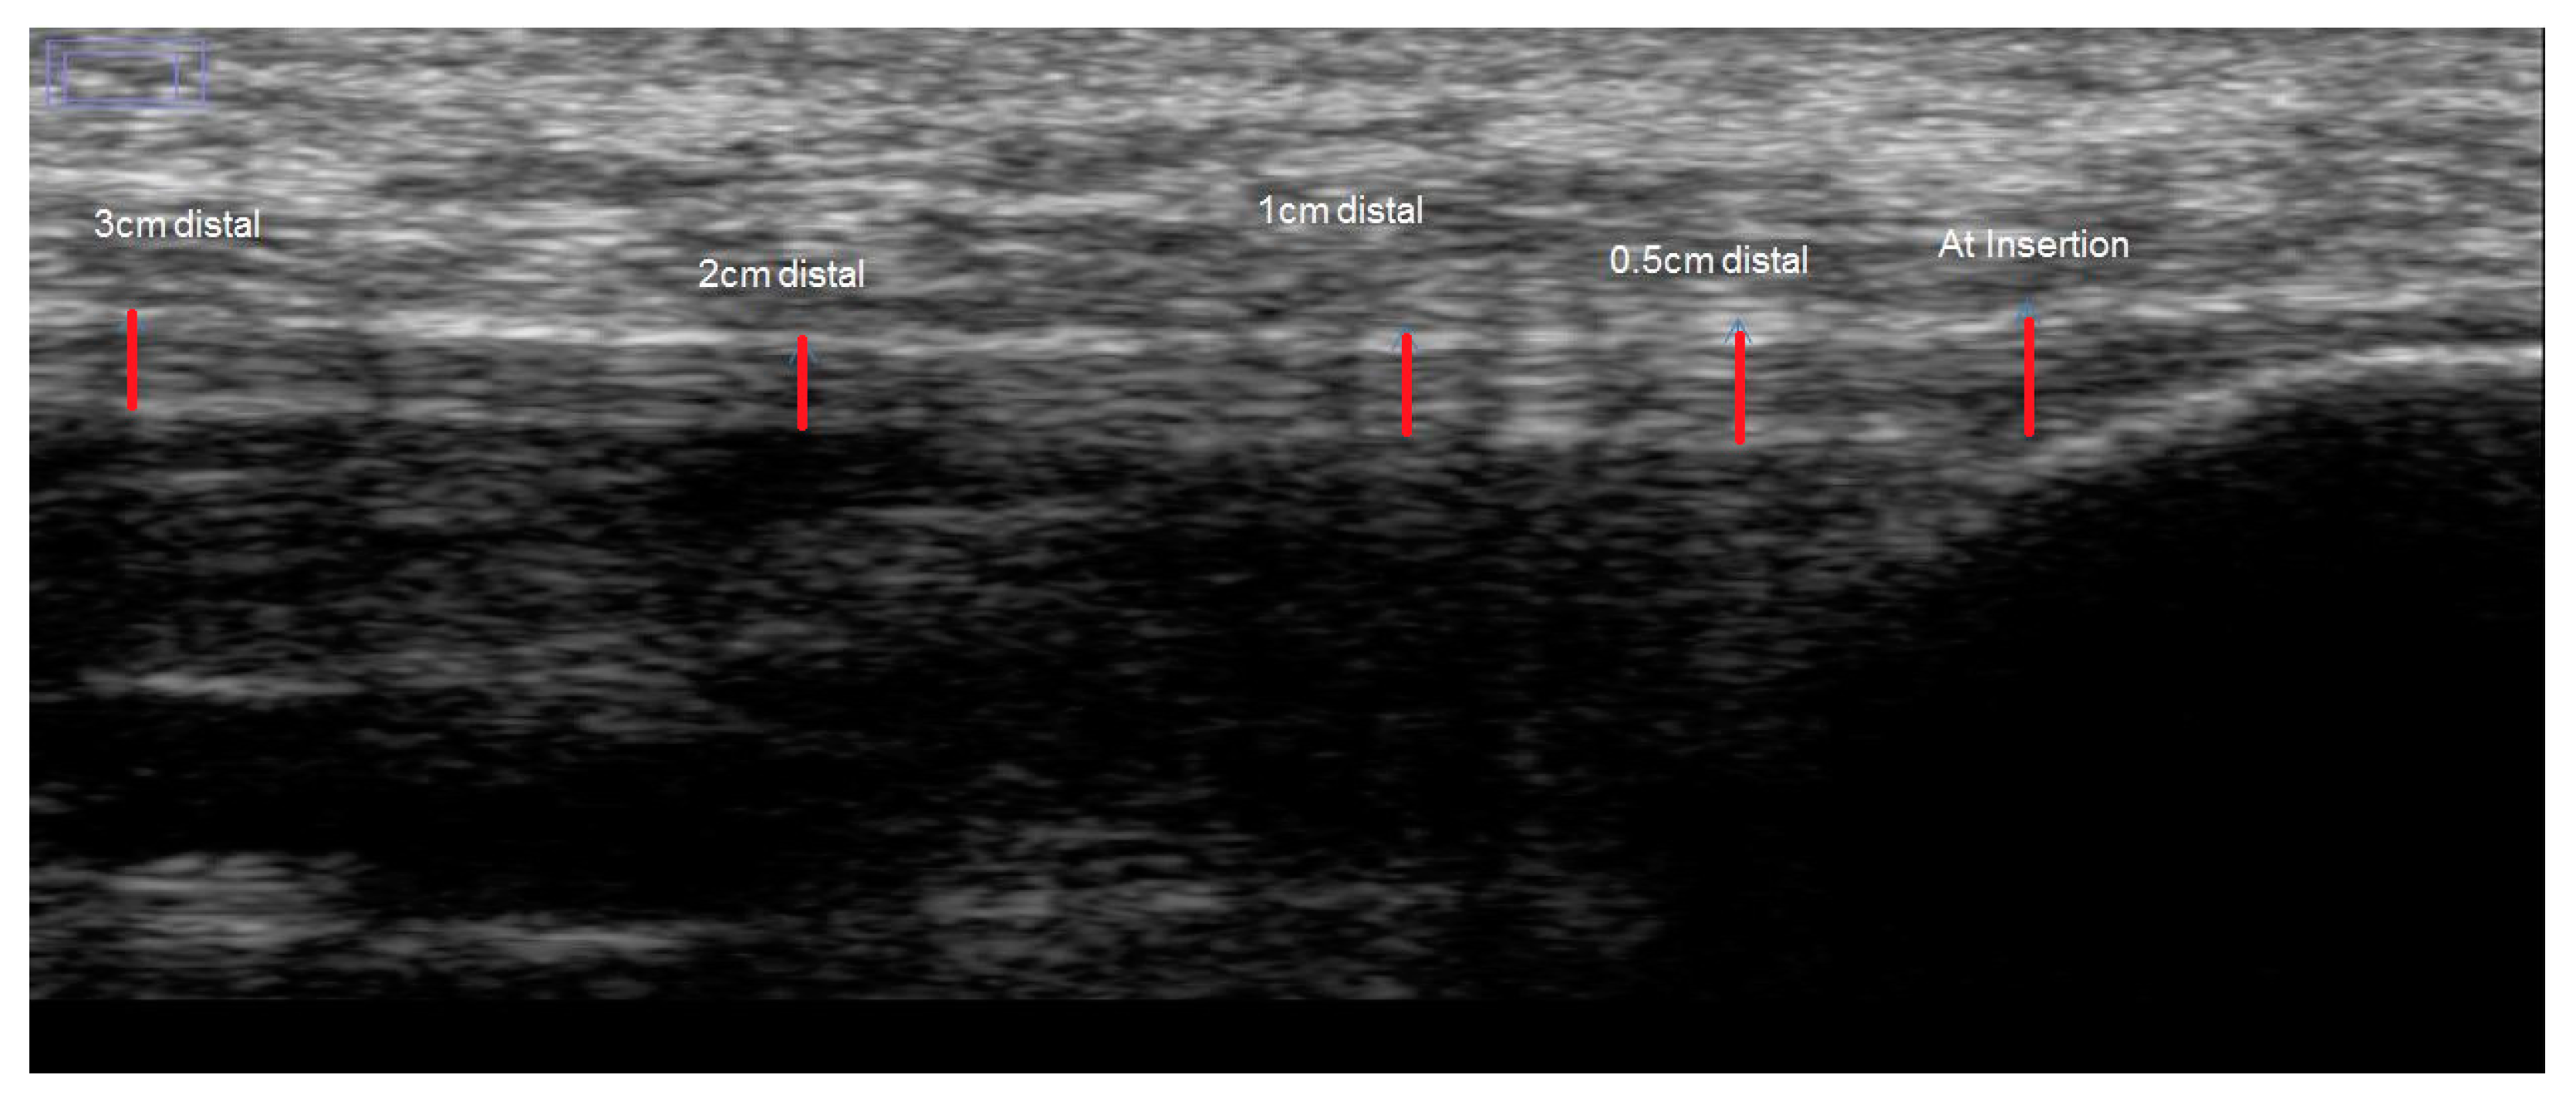
2.3. Image Analysis
2.4. Statistical Analysis
3. Results
3.1. Relative Reliability
3.2. Absolute Reliability
3.2.1. PF Thickness
3.2.2. PF Echogenicity
4. Discussion
4.1. PF Thickness
4.2. Echogenicity of PF
4.3. Strengths and Limitations
5. Conclusions
Acknowledgments
Author Contributions
Conflicts of Interest
References
- Fornage, B.D.; Rifkin, M.D. Ultrasound examination of the hand and foot. Radiol. Clin. N. Am. 1988, 26, 109–129. [Google Scholar] [PubMed]
- Cardinal, E.; Chhem, R.K.; Beauregard, C.G.; Aubin, B.; Pelletier, M. Plantar fasciitis: Sonographic evaluation. Radiology 1996, 201, 257. [Google Scholar] [CrossRef] [PubMed]
- Kannus, P.; Jozsa, L. Histopathological changes preceding spontaneous rupture of a tendon. A controlled study of 891 patients. J. Bone Jt. Surg. Am. 1991, 73, 1507–1525. [Google Scholar]
- Martinoli, C.; Bianchi, S.; Derchi, L.E. Tendon and nerve sonography. Radiol. Clin. N. Am. 1999, 37, 691–711. [Google Scholar] [CrossRef]
- Fornage, B.D.; Rifkin, M.D. Ultrasound examination of tendons. Radiol. Clin. N. Am. 1988, 26, 87–107. [Google Scholar] [PubMed]
- Nuran Sabir, M.D.; Semra Demirlenk, M.D.; Baki Yagci, M.D.; Nevzat Karabulut, M.D.; Sibel Cubukcu, M.D. Clinical Utility of Sonography in Diagnosing Plantar Fasciitis. J. Ultrasound Med. 2005, 24, 1041–1048. [Google Scholar]
- McPoil, T.G.; Martin, R.L.; Cornwall, M.W. Heel pain–plantar fasciitis: Clinical practice guidelines linked to the international classification offunction, disability, and health from the orthopaedic section of the American Physical Therapy Association. J. Orthop. Sports Phys. Ther. 2008, 38, A1–A18. [Google Scholar] [CrossRef] [PubMed]
- Liang, H.W.; Wang, T.G.; Chen, W.S.; Hou, S.M. Thinner plantar fascia predicts decreased pain after extracorporeal shock wave therapy. Clin. Orthop. Relat. Res. 2007, 460, 219–225. [Google Scholar] [PubMed]
- Hammer, D.S.; Adam, F.; Kreutz, A. Ultrasonographic evaluation at 6-month follow-up of plantar fasciitis after extracorporeal shock wave therapy. Arch. Orthop. Trauma Surg. 2005, 125, 6–9. [Google Scholar] [CrossRef] [PubMed]
- McNally, E.; Shetty, S. Plantar Fascia: Imaging Diagnosis and Guided Treatment. Semin. Musculoskelet. Radiol. 2010, 14, 334–343. [Google Scholar] [CrossRef] [PubMed]
- Cheng, J.; Tsai, W.; Yu, T.; Huang, K. Reproducibility of Sonographic Measurement of Thickness and Echogenicity of the Plantar Fascia. J. Clin. Ultrasound 2012, 40, 14–19. [Google Scholar] [CrossRef] [PubMed]
- Mohseni-Bandpei, M.A.; Nakhaee, M.; Mousavi, M.E.; Shakourirad, A.; Safari, M.R.; Vahab Kashani, R. Application of ultrasound in the assessment of plantar fascia in patients with plantar fasciitis: A systematic review. Ultrasound Med. Biol. 2014, 40, 1737–1754. [Google Scholar] [CrossRef] [PubMed]
- Crofts, G.; Angin, S.; Mickle, K.; Hill, S.; Nester, C. Reliability of ultrasound for measurement of selected foot structures. Gait Posture 2014, 39, 35–39. [Google Scholar] [CrossRef] [PubMed]
- Mayans, D.; Cartwright, MS.; Walker, F.O. Neuromuscular ultrasonography: Quantifying muscle and nerve measurements. Phys. Med. Rehabil. Clin. N. Am. 2011, 23, 133–148. [Google Scholar] [CrossRef] [PubMed]
- Cameron, A.F.; Rome, K.; Hing, W.A. Ultrasound evaluation of the abductor hallucis muscle: Reliability study. J. Foot Ankle Res. 2008, 1, 45–50. [Google Scholar] [CrossRef] [PubMed] [Green Version]
- Rathleff, M.; Moelgaard, C.; Olesen, J. Intra- and Interobserver Reliability of Quantitative Ultrasound Measurement of the Plantar Fascia. J. Clin. Ultrasound 2011, 39, 128–134. [Google Scholar] [CrossRef] [PubMed]
- Atkinson, G.; Nevill, A.M. Statistical methods for assessing measurement error (reliability) in variables relevant to sports medicine. Sports Med. 1998, 26, 217–238. [Google Scholar] [CrossRef] [PubMed]
- Lohr, K.N.; Aaronson, N.K.; Alonso, J.; Burnam, M.A.; Patrick, D.L.; Perrin, E.B.; Roberts, J.S. Evaluating quality-of-life and health status instruments: Development of scientific review criteria. Clin. Ther. 1996, 18, 979–792. [Google Scholar] [CrossRef]
- Schwenk, M.; Gogulla, S.; Englert, S.; Czempik, A.; Hauer, K. Test–retest reliability and minimal detectable change of repeated sit-to-stand analysis using one body fixed sensor in geriatric patients. Physiol. Meas. 2012, 33, 1931–1946. [Google Scholar] [CrossRef] [PubMed]
- Welk, A.; Haun, D.; Clark, T.; Kettner, N. Use of high-resolution ultrasound to measure changes in plantar fascia thickness resulting from tissue creep in runners and walkers. J. Manip. Physiol. Ther. 2015, 38, 81–85. [Google Scholar] [CrossRef] [PubMed]
- Gefen, A. The in vivo elastic properties of the plantar fascia during the contact phase of walking. Foot Ankle Int. 2003, 24, 23–30. [Google Scholar]
- Chen, D.-W.; Li, B.; Aubeeluck, A.; Yang, Y.-F.; Huang, Y.-G.; Zhou, J.-Q.; Yu, G.-R. Anatomy and biomechanical properties of the plantar aponeurosis: A cadaveric study. PLoS ONE 2014, 9, e84347. [Google Scholar] [CrossRef] [PubMed]
- Erdemir, A.; Hamel, A.J.; Fauth, A.R.; Piazza, S.J.; Sharkey, N.A. Dynamic loading of the plantar aponeurosis in walking. J. Bone Jt. Surg. Am. 2004, 86, 546–552. [Google Scholar]
- Gu, Y.; Li, Z. Mechanical Information of Plantar Fascia during Normal Gait. Phys. Procedia 2012, 3363–3366. [Google Scholar] [CrossRef]
- Miller, B.F.; Olesen, J.L.; Hansen, M.; Døssing, S.; Crameri, R.M.; Welling, R.J.; Langberg, H.; Flyvbjerg, A.; Kjaer, M.; Babraj, J.A.; et al. Coordinated collagen and muscle protein synthesis in human patella tendon and quadriceps muscle after exercise. J. Physiol. 2005, 567, 1021–1033. [Google Scholar] [CrossRef] [PubMed]
- Langberg, H.; Rosendal, L.; Kjær, M. Training-induced changes in peritendinous type I collagen turnover determined by microdialysis in humans. J. Physiol. 2001, 534, 297–302. [Google Scholar] [CrossRef] [PubMed]
- Kjær, M.; Langberg, H.; Heinemeier, K.; Bayer, M.; Hansen, M.; Holm, L.; Doessing, S.; Kongsgaard, K.; Krogsgaard, M.; Magnusson, P. From mechanical loading to collagen synthesis, structural changes and function in human tendon. Scand. J. Med. Sci. Sports 2009, 19, 500–510. [Google Scholar] [CrossRef] [PubMed]
- Couppe´, C.; Kongsgaard, M.; Aagaard, P.; Hansen, P.; Bojsen-Moller, J.; Kjaer, M.; Magnusson, S.P. Habitual loading results in tendon hypertrophy and increased stiffness of the human patellar tendon. J. Appl. Physiol. 2008, 105, 805–810. [Google Scholar] [CrossRef] [PubMed]
- Kovanen, V. Effects of ageing and physical training on rat skeletal muscle. An experimental study on the properties of collagen, laminin, and fibre types in muscles serving different functions. Acta Physiol. Scand. Suppl. 1989, 577, 1–56. [Google Scholar] [PubMed]
- Magnusson, S.P.; Langberg, H.; Kjaer, M. The pathogenesis of tendinopathy: Balancing the response to loading. Nat. Rev. Rheumatol. 2010, 6, 262–268. [Google Scholar] [CrossRef] [PubMed]
- Fessel, G.; Jacob, H.A.C.; Wyss, C.H.; Mittlmeier, T.; Müller-Gerbl, M.; Büttner, A. Changes in length of the plantar aponeurosis during the stance phase of gait — An in vivo dynamic fluoroscopic study. Ann. Anat. 2014, 196, 471–478. [Google Scholar] [CrossRef] [PubMed]
- Bisi-Balogun, A.; Torlak, F. Outcomes following Hip and Quadriceps Strengthening Exercises for Patellofemoral pain syndrome: A Systematic Review and Meta-Analysis. Sports 2015, 3, 281–301. [Google Scholar] [CrossRef]


| Measurement Stations | Test (n = 24) | Retest (n = 24) | Difference (n = 24) |
|---|---|---|---|
| Mean ± SD | Mean ± SD | Mean ± SD | |
| Thickness (mm) | |||
| At insertion | 3.06 ± 0.6 | 3.07 ± 0.7 | 0.17 ± 0.1 |
| 0.5 cm distal | 3.06 ± 0.5 | 3.06 ± 0.5 | 0.25 ± 0.2 |
| 1 cm distal | 2.83 ± 0.7 | 2.77 ± 0.7 | 0.13 ± 0.1 |
| 2 cm distal | 2.47 ± 0.6 | 2.42 ± 0.6 | 0.17 ± 0.1 |
| 3 cm distal | 2.26 ± 0.4 | 2.20 ± 0.4 | 0.13 ± 0.1 |
| Echogenicity | |||
| ROI at insertion to 1 cm distal | 89.4 ± 29 | 91.5 ± 30 | 9.5 ± 10 |
| ROI at 1 to 2 cm distal | 81.4 ± 26 | 83.7 ± 28 | 7.0 ± 9 |
| ROI at 2 to 3 cm distal | 79.2 ± 26 | 78.7 ± 27 | 8.3 ± 7 |
| Measurement Stations | ICC | LOA | LOA | SEM | SEM | MDC95 | MDC95 | SRD | |
|---|---|---|---|---|---|---|---|---|---|
| (95% CI) | Bias ± 1.96 SD | % | % | % | |||||
| Thickness (mm) | One sonograph | ||||||||
| At insertion | 0.97 (0.92–0.99) | 0.18 ± 0.25 | 5.6 | 0.11 | 3.4 | 0.30 | 9.6 | 0.9 | |
| 0.5 cm distal | 0.86 (0.63–0.94) | 0.30 ± 0.34 | 9.8 | 0.17 | 5.6 | 0.48 | 15.6 | 1.2 | |
| 1 cm distal | 0.92 (0.78–0.96) | 0.22 ± 0.66 | 7.7 | 0.19 | 6.9 | 0.54 | 19.1 | 1.2 | |
| 2 cm distal | 0.97 (0.92–0.99) | 0.16 ± 0.28 | 6.7 | 0.10 | 4.2 | 0.30 | 11.6 | 0.9 | |
| 3 cm distal | 0.91 (0.76–0.97) | 0.17 ± 0.34 | 7.8 | 0.12 | 5.4 | 0.33 | 15.1 | 1.0 | |
| Mean of three sonographs | |||||||||
| At insertion | 0.97 (0.92–0.98) | 0.17 ± 0.25 | 5.6 | 0.10 | 3.5 | 0.29 | 9.6 | 0.9 | |
| 0.5 cm distal | 0.88 (0.70–0.95) | 0.25 ± 0.36 | 8.3 | 0.15 | 5.2 | 0.44 | 14.3 | 1.1 | |
| 1 cm distal | 0.98 (0.96–0.99) | 0.13 ± 0.21 | 4.3 | 0.09 | 3.4 | 0.27 | 9.3 | 0.9 | |
| 2 cm distal | 0.96 (0.90–0.98) | 0.16 ± 0.31 | 6.3 | 0.10 | 4.6 | 0.30 | 12.8 | 0.9 | |
| 3 cm distal | 0.95(0.92–0.96) | 0.13 ± 0.20 | 5.8 | 0.08 | 3.7 | 0.23 | 10.4 | 0.8 | |
| Echogenicity | One sonograph | ||||||||
| ROI from insertion to 1 cm distal | 0.93 (0.83–0.97) | 10.9 ± 21.1 | 11.6 | 7.5 | 8.0 | 20.9 | 22.2 | 7.6 | |
| RO1 from 1 cm to 2 cm distal | 0.96 (0.91–0.99) | 7.1 ± 15.1 | 8.3 | 5.2 | 6.0 | 14.3 | 16.7 | 6.3 | |
| ROI from 2 cm to 3 cm distal | 0.94 (0.86–0.98) | 11.3 ± 15.8 | 13.0 | 6.5 | 8.2 | 17.9 | 22.7 | 7.0 | |
| Mean of three sonographs | |||||||||
| ROI from insertion to 1 cm distal | 0.95 (0.85–0.99) | 9.5 ± 18.5 | 10.5 | 6.3 | 7.0 | 17.5 | 19.4 | 7.0 | |
| ROI from 1 cm to 2 cm distal | 0.96 (0.86–0.97) | 7.0 ± 16.6 | 8.2 | 5.2 | 6.3 | 14.3 | 17.6 | 6.3 | |
| ROI from 2 cm to 3 cm distal | 0.96 (0.89–0.98) | 8.3 ± 13.1 | 10.5 | 5.2 | 6.6 | 14.4 | 18.2 | 6.3 | |
© 2016 by the authors; licensee MDPI, Basel, Switzerland. This article is an open access article distributed under the terms and conditions of the Creative Commons by Attribution (CC-BY) license (http://creativecommons.org/licenses/by/4.0/).
Share and Cite
Bisi-Balogun, A.; Cassel, M.; Mayer, F. Reliability of Various Measurement Stations for Determining Plantar Fascia Thickness and Echogenicity. Diagnostics 2016, 6, 15. https://doi.org/10.3390/diagnostics6020015
Bisi-Balogun A, Cassel M, Mayer F. Reliability of Various Measurement Stations for Determining Plantar Fascia Thickness and Echogenicity. Diagnostics. 2016; 6(2):15. https://doi.org/10.3390/diagnostics6020015
Chicago/Turabian StyleBisi-Balogun, Adebisi, Michael Cassel, and Frank Mayer. 2016. "Reliability of Various Measurement Stations for Determining Plantar Fascia Thickness and Echogenicity" Diagnostics 6, no. 2: 15. https://doi.org/10.3390/diagnostics6020015