
Stratifying Disease Severity in Pediatric COVID-19: A Correlative Study of Serum Biomarkers and Lung Ultrasound—A Retrospective Observational Dual-Center Study

 ,
,  , , , , , and
Abstract
:1. Introduction
2. Materials and Methods
2.1. Study Design
2.2. Participant Selection
- Hospitalized neonates and infants diagnosed with SARS-CoV-2 infection for a period shorter than three days;
- Neonates and infants with pre-existing chronic lung conditions like bronchopulmonary dysplasia, cystic fibrosis, immunodeficiency, and comparable disorders;
- Neonates and infants lacking parental or legal guardian consent.
2.3. Clinical and Laboratory Evaluations
2.4. Lung Ultrasound Examination
2.5. Lung Ultrasound Score and Protocol
- LUS score = 0 was assigned for a normal or physiological pattern displaying A-lines, along with one or two B-lines per intercostal space;
- LUS score = 1 indicated the observation of more than two B-lines (referred to as sparse B-lines) per intercostal space, accompanied by pleural abnormalities, such as irregularities or thickening;
- LUS score = 2 was allocated for the presence of coalescent or merging B-lines, a ‘white-lung’ appearance, or small peripheral consolidations smaller than 1 cm;
- LUS score = 3 was given for substantial peripheral consolidations wider than 1 cm, regardless of the presence of air bronchograms.
2.6. Data Collection and Analysis
2.7. Ethical Considerations
3. Results
3.1. Baseline Characteristics
3.2. Signs and Symptoms
3.3. Lung Ultrasound Score and Ultrasound Abnormalities
3.4. Lung Ultrasound Score and Correlation with Inflammatory Markers
4. Discussion
4.1. Limitations
4.2. Further Directions
5. Conclusions
Author Contributions
Funding
Institutional Review Board Statement
Informed Consent Statement
Data Availability Statement
Acknowledgments
Conflicts of Interest
References
- Lu, X.; Zhang, L.; Du, H.; Zhang, J.; Li, Y.Y.; Qu, J.; Zhang, W.; Wang, Y.; Bao, S.; Li, Y.; et al. SARS-CoV-2 Infection in Children. N. Engl. J. Med. 2020, 382, 1663–1665. [Google Scholar] [CrossRef]
- Cui, X.; Zhao, Z.; Zhang, T.; Guo, W.; Guo, W.; Zheng, J.; Zhang, J.; Dong, C.; Na, R.; Zheng, L.; et al. A Systematic Review and Meta-Analysis of Children with Coronavirus Disease 2019 (COVID-19). J. Med. Virol. 2021, 93, 1057–1069. [Google Scholar] [CrossRef]
- Morrell, E.D.; Mikacenic, C. Differences between Children and Adults with COVID-19: It’s Right under Our Nose. Am. J. Respir. Cell Mol. Biol. 2022, 66, 122–123. [Google Scholar] [CrossRef]
- Stoicescu, E.R.; Iacob, R.; Iacob, E.R.; Ghenciu, L.A.; Oancea, C.; Manolescu, D.L. Tiny Lungs, Big Differences: Navigating the Varied COVID-19 Landscape in Neonates vs. Infants via Biomarkers and Lung Ultrasound. Biomedicines 2024, 12, 425. [Google Scholar] [CrossRef]
- Lee, P.-I.; Hu, Y.-L.; Chen, P.-Y.; Huang, Y.-C.; Hsueh, P.-R. Are Children Less Susceptible to COVID-19? J. Microbiol. Immunol. Infect. 2020, 53, 371–372. [Google Scholar] [CrossRef]
- Viner, R.M.; Mytton, O.T.; Bonell, C.; Melendez-Torres, G.J.; Ward, J.; Hudson, L.; Waddington, C.; Thomas, J.; Russell, S.; Van Der Klis, F.; et al. Susceptibility to SARS-CoV-2 Infection Among Children and Adolescents Compared With Adults: A Systematic Review and Meta-Analysis. JAMA Pediatr. 2021, 175, 143. [Google Scholar] [CrossRef] [PubMed]
- Dioguardi, M.; Cazzolla, A.P.; Arena, C.; Sovereto, D.; Caloro, G.A.; Dioguardi, A.; Crincoli, V.; Laino, L.; Troiano, G.; Lo Muzio, L. Innate Immunity in Children and the Role of ACE2 Expression in SARS-CoV-2 Infection. Pediatr. Rep. 2021, 13, 363–382. [Google Scholar] [CrossRef]
- Scialo, F.; Daniele, A.; Amato, F.; Pastore, L.; Matera, M.G.; Cazzola, M.; Castaldo, G.; Bianco, A. ACE2: The Major Cell Entry Receptor for SARS-CoV-2. Lung 2020, 198, 867–877. [Google Scholar] [CrossRef] [PubMed]
- Hassan, M.; Khalil, A.; Magboul, S.; Alomari, O.; Abdalla, T.; Alsliman, H.; Alhothi, A.; Al Maslamani, E.; AlAmri, M.; Soliman, A. Neonates and Young Infants With COVID-19 Presented With Sepsis-Like Syndrome: A Retrospective Case Controlled Study. Front. Pediatr. 2021, 9, 634844. [Google Scholar] [CrossRef]
- Ryan, L.; Plötz, F.B.; van den Hoogen, A.; Latour, J.M.; Degtyareva, M.; Keuning, M.; Klingenberg, C.; Reiss, I.K.M.; Giannoni, E.; Roehr, C.; et al. Neonates and COVID-19: State of the Art: Neonatal Sepsis Series. Pediatr. Res. 2022, 91, 432–439. [Google Scholar] [CrossRef] [PubMed]
- Stoicescu, E.R.; Ciuca, I.M.; Iacob, R.; Iacob, E.R.; Marc, M.S.; Birsasteanu, F.; Manolescu, D.L.; Iacob, D. Is Lung Ultrasound Helpful in COVID-19 Neonates?—A Systematic Review. Diagnostics 2021, 11, 2296. [Google Scholar] [CrossRef]
- Azadbakht, J.; Saffari, M.; Talarie, H.; Esfahani, M.M.; Barzegar, M. Diagnostic Accuracy and Prognostic Value of Lung Ultrasound in Coronavirus Disease (COVID-19). Pol. J. Radiol. 2022, 87, e397–e408. [Google Scholar] [CrossRef]
- Buonsenso, D.; Vetrugno, L. Lung Ultrasound in Adults and Children with COVID-19: From First Discoveries to Recent Advances. J. Clin. Med. 2022, 11, 4340. [Google Scholar] [CrossRef]
- Ciuca, I.M.; Pop, L.L.; Dediu, M.; Stoicescu, E.R.; Marc, M.S.; Manea, A.M.; Manolescu, D.L. Lung Ultrasound in Children with Cystic Fibrosis in Comparison with Chest Computed Tomography: A Feasibility Study. Diagnostics 2022, 12, 376. [Google Scholar] [CrossRef] [PubMed]
- Ciuca, I.M.; Dediu, M.; Marc, M.S.; Lukic, M.; Horhat, D.I.; Pop, L.L. Lung Ultrasound Is More Sensitive for Hospitalized Consolidated Pneumonia Diagnosis Compared to CXR in Children. Children 2021, 8, 659. [Google Scholar] [CrossRef] [PubMed]
- Caroselli, C.; Blaivas, M.; Falzetti, S. Diagnostic Imaging in Newborns, Children and Adolescents Infected with Severe Acute Respiratory Syndrome Coronavirus 2 (SARS-CoV-2): Is There a Realistic Alternative to Lung High-Resolution Computed Tomography (HRCT) and Chest X-Rays? A Systematic Review of the Literature. Ultrasound Med. Biol. 2021, 47, 3034–3040. [Google Scholar] [CrossRef] [PubMed]
- Demi, L. Lung Ultrasound: The Future Ahead and the Lessons Learned from COVID-19. J. Acoust. Soc. Am. 2020, 148, 2146. [Google Scholar] [CrossRef] [PubMed]
- Saraogi, A. Lung Ultrasound: Present and Future. Lung India 2015, 32, 250–257. [Google Scholar] [CrossRef] [PubMed]
- Demi, L.; Wolfram, F.; Klersy, C.; De Silvestri, A.; Ferretti, V.V.; Muller, M.; Miller, D.; Feletti, F.; Wełnicki, M.; Buda, N.; et al. New International Guidelines and Consensus on the Use of Lung Ultrasound. J. Ultrasound Med. 2023, 42, 309–344. [Google Scholar] [CrossRef]
- Iacob, R.; Stoicescu, E.R.; Cerbu, S.; Iacob, D.; Amaricai, E.; Catan, L.; Belei, O.; Iacob, E.R. Could Ultrasound Be Used as a Triage Tool in Diagnosing Fractures in Children? A Literature Review. Healthcare 2022, 10, 823. [Google Scholar] [CrossRef]
- Jiang, Z.; Salcudean, S.E.; Navab, N. Robotic Ultrasound Imaging: State-of-the-Art and Future Perspectives. Med. Image Anal. 2023, 89, 102878. [Google Scholar] [CrossRef]
- Broască, L.; Trușculescu, A.A.; Ancușa, V.M.; Ciocârlie, H.; Oancea, C.-I.; Stoicescu, E.-R.; Manolescu, D.L. A Novel Method for Lung Image Processing Using Complex Networks. Tomography 2022, 8, 1928–1946. [Google Scholar] [CrossRef] [PubMed]
- Roy, K.; Lee, J.E.-Y.; Lee, C. Thin-Film PMUTs: A Review of over 40 Years of Research. Microsyst. Nanoeng. 2023, 9, 95. [Google Scholar] [CrossRef]
- Shaiba, L.A.; More, K.; Hadid, A.; Almaghrabi, R.; Al Marri, M.; Alnamnakani, M.; Shah, P. Multisystemic Inflammatory Syndrome in Neonates: A Systematic Review. Neonatology 2022, 119, 405–417. [Google Scholar] [CrossRef]
- Ito, A.; Ishida, T. Diagnostic Markers for Community-Acquired Pneumonia. Ann. Transl. Med. 2020, 8, 609. [Google Scholar] [CrossRef]
- Battaglini, D.; Lopes-Pacheco, M.; Castro-Faria-Neto, H.C.; Pelosi, P.; Rocco, P.R.M. Laboratory Biomarkers for Diagnosis and Prognosis in COVID-19. Front. Immunol. 2022, 13, 857573. [Google Scholar] [CrossRef]
- Stoicescu, E.R.; Manolescu, D.L.; Iacob, R.; Cerbu, S.; Dima, M.; Iacob, E.R.; Ciuca, I.M.; Oancea, C.; Iacob, D. The Assessment of COVID-19 Pneumonia in Neonates: Observed by Lung Ultrasound Technique and Correlated with Biomarkers and Symptoms. J. Clin. Med. 2022, 11, 3555. [Google Scholar] [CrossRef] [PubMed]
- Ciuca, I.M.; Dediu, M.; Pop, L.L. Pediatric Pneumonia (PedPne) Lung Ultrasound Score and Inflammatory Markers: A Pilot Study. Pediatr. Pulmonol. 2022, 57, 576–582. [Google Scholar] [CrossRef] [PubMed]
- Stoicescu, E.R.; Lovrenski, J.; Iacob, R.; Cerbu, S.; Iacob, D.; Iacob, E.R.; Susa, S.R.; Ciuca, I.M.; Bolintineanu (Ghenciu), L.A.; Ciornei-Hoffman, A.; et al. COVID-19 in Infants and Children under 2 Years—Could Lung Ultrasound Score Be Correlated with Biomarkers and Symptoms? Biomedicines 2023, 11, 2620. [Google Scholar] [CrossRef]
- Mongodi, S.; Bouhemad, B.; Orlando, A.; Stella, A.; Tavazzi, G.; Via, G.; Iotti, G.A.; Braschi, A.; Mojoli, F. Modified Lung Ultrasound Score for Assessing and Monitoring Pulmonary Aeration. Ultraschall Med. 2017, 38, 530–537. [Google Scholar] [CrossRef]
- Spoulou, V.; Noni, M.; Koukou, D.; Kossyvakis, A.; Michos, A. Clinical Characteristics of COVID-19 in Neonates and Young Infants. Eur. J. Pediatr. 2021, 180, 3041–3045. [Google Scholar] [CrossRef]
- Bitar, R.R.; Alattas, B.; Azaz, A.; Rawat, D.; Miqdady, M. Gastrointestinal Manifestations in Children with COVID-19 Infection: Retrospective Tertiary Center Experience. Front. Pediatr. 2022, 10, 925520. [Google Scholar] [CrossRef]
- Sobolewska-Pilarczyk, M.; Pokorska-Śpiewak, M.; Stachowiak, A.; Marczyńska, M.; Talarek, E.; Ołdakowska, A.; Kucharek, I.; Sybilski, A.; Mania, A.; Figlerowicz, M.; et al. COVID-19 Infections in Infants. Sci. Rep. 2022, 12, 7765. [Google Scholar] [CrossRef]
- Khoury, L.; Pillar, G.; Shehadeh, S. COVID-19 in Neonates and Infants Younger than 6 Months—A Mild Viral Illness. Eur. J. Pediatr. 2023, 182, 3287–3291. [Google Scholar] [CrossRef]
- Gregorio-Hernández, R.; Escobar-Izquierdo, A.B.; Cobas-Pazos, J.; Martínez-Gimeno, A. Point-of-Care Lung Ultrasound in Three Neonates with COVID-19. Eur. J. Pediatr. 2020, 179, 1279–1285. [Google Scholar] [CrossRef]
- Ibarra-Ríos, D.; Enríquez-Estrada, A.C.; Serpa-Maldonado, E.V.; Miranda-Vega, A.L.; Villanueva-García, D.; Vázquez-Solano, E.P.; Márquez-González, H. Lung Ultrasound Characteristics in Neonates With Positive Real Time Polymerase Chain Reaction for SARS-CoV-2 on a Tertiary Level Referral Hospital in Mexico City. Front. Pediatr. 2022, 10, 859092. [Google Scholar] [CrossRef] [PubMed]
- Caiulo, V.A.; Gargani, L.; Caiulo, S.; Fisicaro, A.; Moramarco, F.; Latini, G.; Picano, E.; Mele, G. Lung Ultrasound Characteristics of Community-Acquired Pneumonia in Hospitalized Children. Pediatr. Pulmonol. 2013, 48, 280–287. [Google Scholar] [CrossRef] [PubMed]
- Denina, M.; Scolfaro, C.; Silvestro, E.; Pruccoli, G.; Mignone, F.; Zoppo, M.; Ramenghi, U.; Garazzino, S. Lung Ultrasound in Children With COVID-19. Pediatrics 2020, 146, e20201157. [Google Scholar] [CrossRef] [PubMed]
- Roy, S.; Jha, V.N.; Ranjan, B. A Case Series of Coagulopathy in Preterm or Growth-Restricted Term Neonates Born to Mothers with Antenatal SARS-CoV-2 Infection: Neonatal Post-COVID-19 Coagulopathy? J. Fam. Med. Prim. Care 2022, 11, 7483–7490. [Google Scholar] [CrossRef] [PubMed]
- Vetrugno, L.; Sala, A.; Orso, D.; Meroi, F.; Fabbro, S.; Boero, E.; Valent, F.; Cammarota, G.; Restaino, S.; Vizzielli, G.; et al. Lung Ultrasound Signs and Their Correlation With Clinical Symptoms in COVID-19 Pregnant Women: The “PINK-CO” Observational Study. Front. Med. 2021, 8, 768261. [Google Scholar] [CrossRef] [PubMed]
- Casella, F.; Barchiesi, M.; Leidi, F.; Russo, G.; Casazza, G.; Valerio, G.; Torzillo, D.; Ceriani, E.; Del Medico, M.; Brambilla, A.M.; et al. Lung Ultrasonography: A Prognostic Tool in Non-ICU Hospitalized Patients with COVID-19 Pneumonia. Eur. J. Intern. Med. 2021, 85, 34–40. [Google Scholar] [CrossRef] [PubMed]
- Smargiassi, A.; Soldati, G.; Borghetti, A.; Scoppettuolo, G.; Tamburrini, E.; Testa, A.C.; Moro, F.; Natale, L.; Larici, A.R.; Buonsenso, D.; et al. Lung Ultrasonography for Early Management of Patients with Respiratory Symptoms during COVID-19 Pandemic. J. Ultrasound 2020, 23, 449–456. [Google Scholar] [CrossRef] [PubMed]
- Espersen, C.; Platz, E.; Skaarup, K.G.; Lassen, M.C.H.; Lind, J.N.; Johansen, N.D.; Sengeløv, M.; Alhakak, A.S.; Nielsen, A.B.; Bundgaard, H.; et al. Lung Ultrasound Findings Associated With COVID-19 ARDS, ICU Admission, and All-Cause Mortality. Respir. Care 2022, 67, 66–75. [Google Scholar] [CrossRef] [PubMed]
- Vetrugno, L.; Meroi, F.; Orso, D.; D’Andrea, N.; Marin, M.; Cammarota, G.; Mattuzzi, L.; Delrio, S.; Furlan, D.; Foschiani, J.; et al. Can Lung Ultrasound Be the Ideal Monitoring Tool to Predict the Clinical Outcome of Mechanically Ventilated COVID-19 Patients? An Observational Study. Healthcare 2022, 10, 568. [Google Scholar] [CrossRef] [PubMed]
- Pesacreta, L.D.; Cilli, K.E.; Lawrence, A.K.; Bulas, D.I. The Key Role of the Pediatric Radiologist in Developing a Multidisciplinary Fetal Center. Pediatr. Radiol. 2020, 50, 1801–1809. [Google Scholar] [CrossRef] [PubMed]
- Raimondi, F.; Yousef, N.; Migliaro, F.; Capasso, L.; De Luca, D. Point-of-Care Lung Ultrasound in Neonatology: Classification into Descriptive and Functional Applications. Pediatr. Res. 2021, 90, 524–531. [Google Scholar] [CrossRef]
- Vetrugno, L.; Bove, T.; Orso, D.; Bassi, F.; Boero, E.; Ferrari, G. Lung Ultrasound and the COVID-19 “Pattern”: Not All That Glitters Today Is Gold Tomorrow. J. Ultrasound Med. 2020, 39, 2281–2282. [Google Scholar] [CrossRef]
- Huang, H.; Wu, R.S.; Lin, M.; Xu, S. Emerging Wearable Ultrasound Technology. IEEE Trans. Ultrason. Ferroelectr. Freq. Control 2024. online ahead of print. [Google Scholar] [CrossRef]


| LUS Score | 0 Points | 1 Point | 2 Points | 3 Points |
|---|---|---|---|---|
| Image | 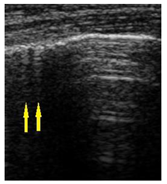 |  |  | 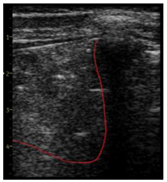 |
| Description of image | Normal or physiological pattern displaying A-lines (right part), along with two sparse B-lines (yellow arrows) per intercostal space | Three sparse B-lines (yellow arrows) per intercostal space, accompanied by pleural abnormalities, such as irregularities or thickening (orange circle) | Small peripheral consolidations smaller than 1 cm (red dotted area), a small area with ‘white-lung’ appearance, adjacent coalescent or merging B-lines | Substantial peripheral consolidations (marked with red) wider than 1 cm with the presence of air bronchograms (hyperechoic areas inside); the image is from an infant with bacterial pneumonia not included in this study |
| Signs and Symptoms in Neonates and Infants | n = 42 (Percentage %) |
|---|---|
| Moderately influenced general condition | 27 (64.28) |
| Slightly influenced general condition | 15 (35.71) |
| Psychomotor agitation | 16 (38.09) |
| Asthenic syndrome | 14 (33.33) |
| Fever (≥37.5 °C) | 26 (61.90) |
| Cough | 17 (40.47) |
| Rhinorrhea | 18 (42.85) |
| Mild acute dehydration syndrome (<5% of weight) | 24 (57.14) |
| Moderate acute dehydration syndrome (5–10% of weight) | 2 (4.76) |
| Episodes of diarrhea | 9 (21.42) |
| Vomiting | 6 (14.28) |
| Loss of appetite | 23 (54.76) |
| Lateral cervical lymph nodes | 6 (14.28) |
| Dyspnea | 4 (9.52) |
| Oral candidiasis | 12 (28.57) |
| LUS Findings | n = 42 (Percentage %) |
|---|---|
| Sparse B-lines | 42 (100) |
| Confluent B-lines | 18 (42.85) |
| Pleural abnormalities | 23 (54.76) |
| Subpleural consolidation < 1 cm | 10 (23.80) |
| Large consolidation < 1 cm | 0 |
| Pleural effusion | 2 (4.76) |
| Areas of interest in lung ultrasound | Total LUS score (percentage % from total LUS score) |
| All areas | 337 |
| L1—left anterior superior | 19 (5.63) |
| L2—left anterior inferior | 22 (6.52) |
| L3—left lateral superior | 25 (7.41) |
| L4—left lateral inferior | 25 (7.41) |
| L5—left posterior superior | 31 (9.19) |
| L6—left posterior inferior | 38 (11.27) |
| R1—right anterior superior | 27 (8.01) |
| R2—right anterior inferior | 26 (7.71) |
| R3—right lateral superior | 20 (5.93) |
| R4—right lateral inferior | 24 (7.12) |
| R5—right posterior superior | 38 (11.27) |
| R6—right posterior superior | 42 (12.46) |
| Correlation between LUS Score and the below Variables | Spearman’s Coefficient of Rank Correlation (rho) | Rho 95% Confidence Interval | Significance Level p Value |
|---|---|---|---|
| Days of hospitalization | 0.49 | 0.21 to 0.69 | 0.0010 |
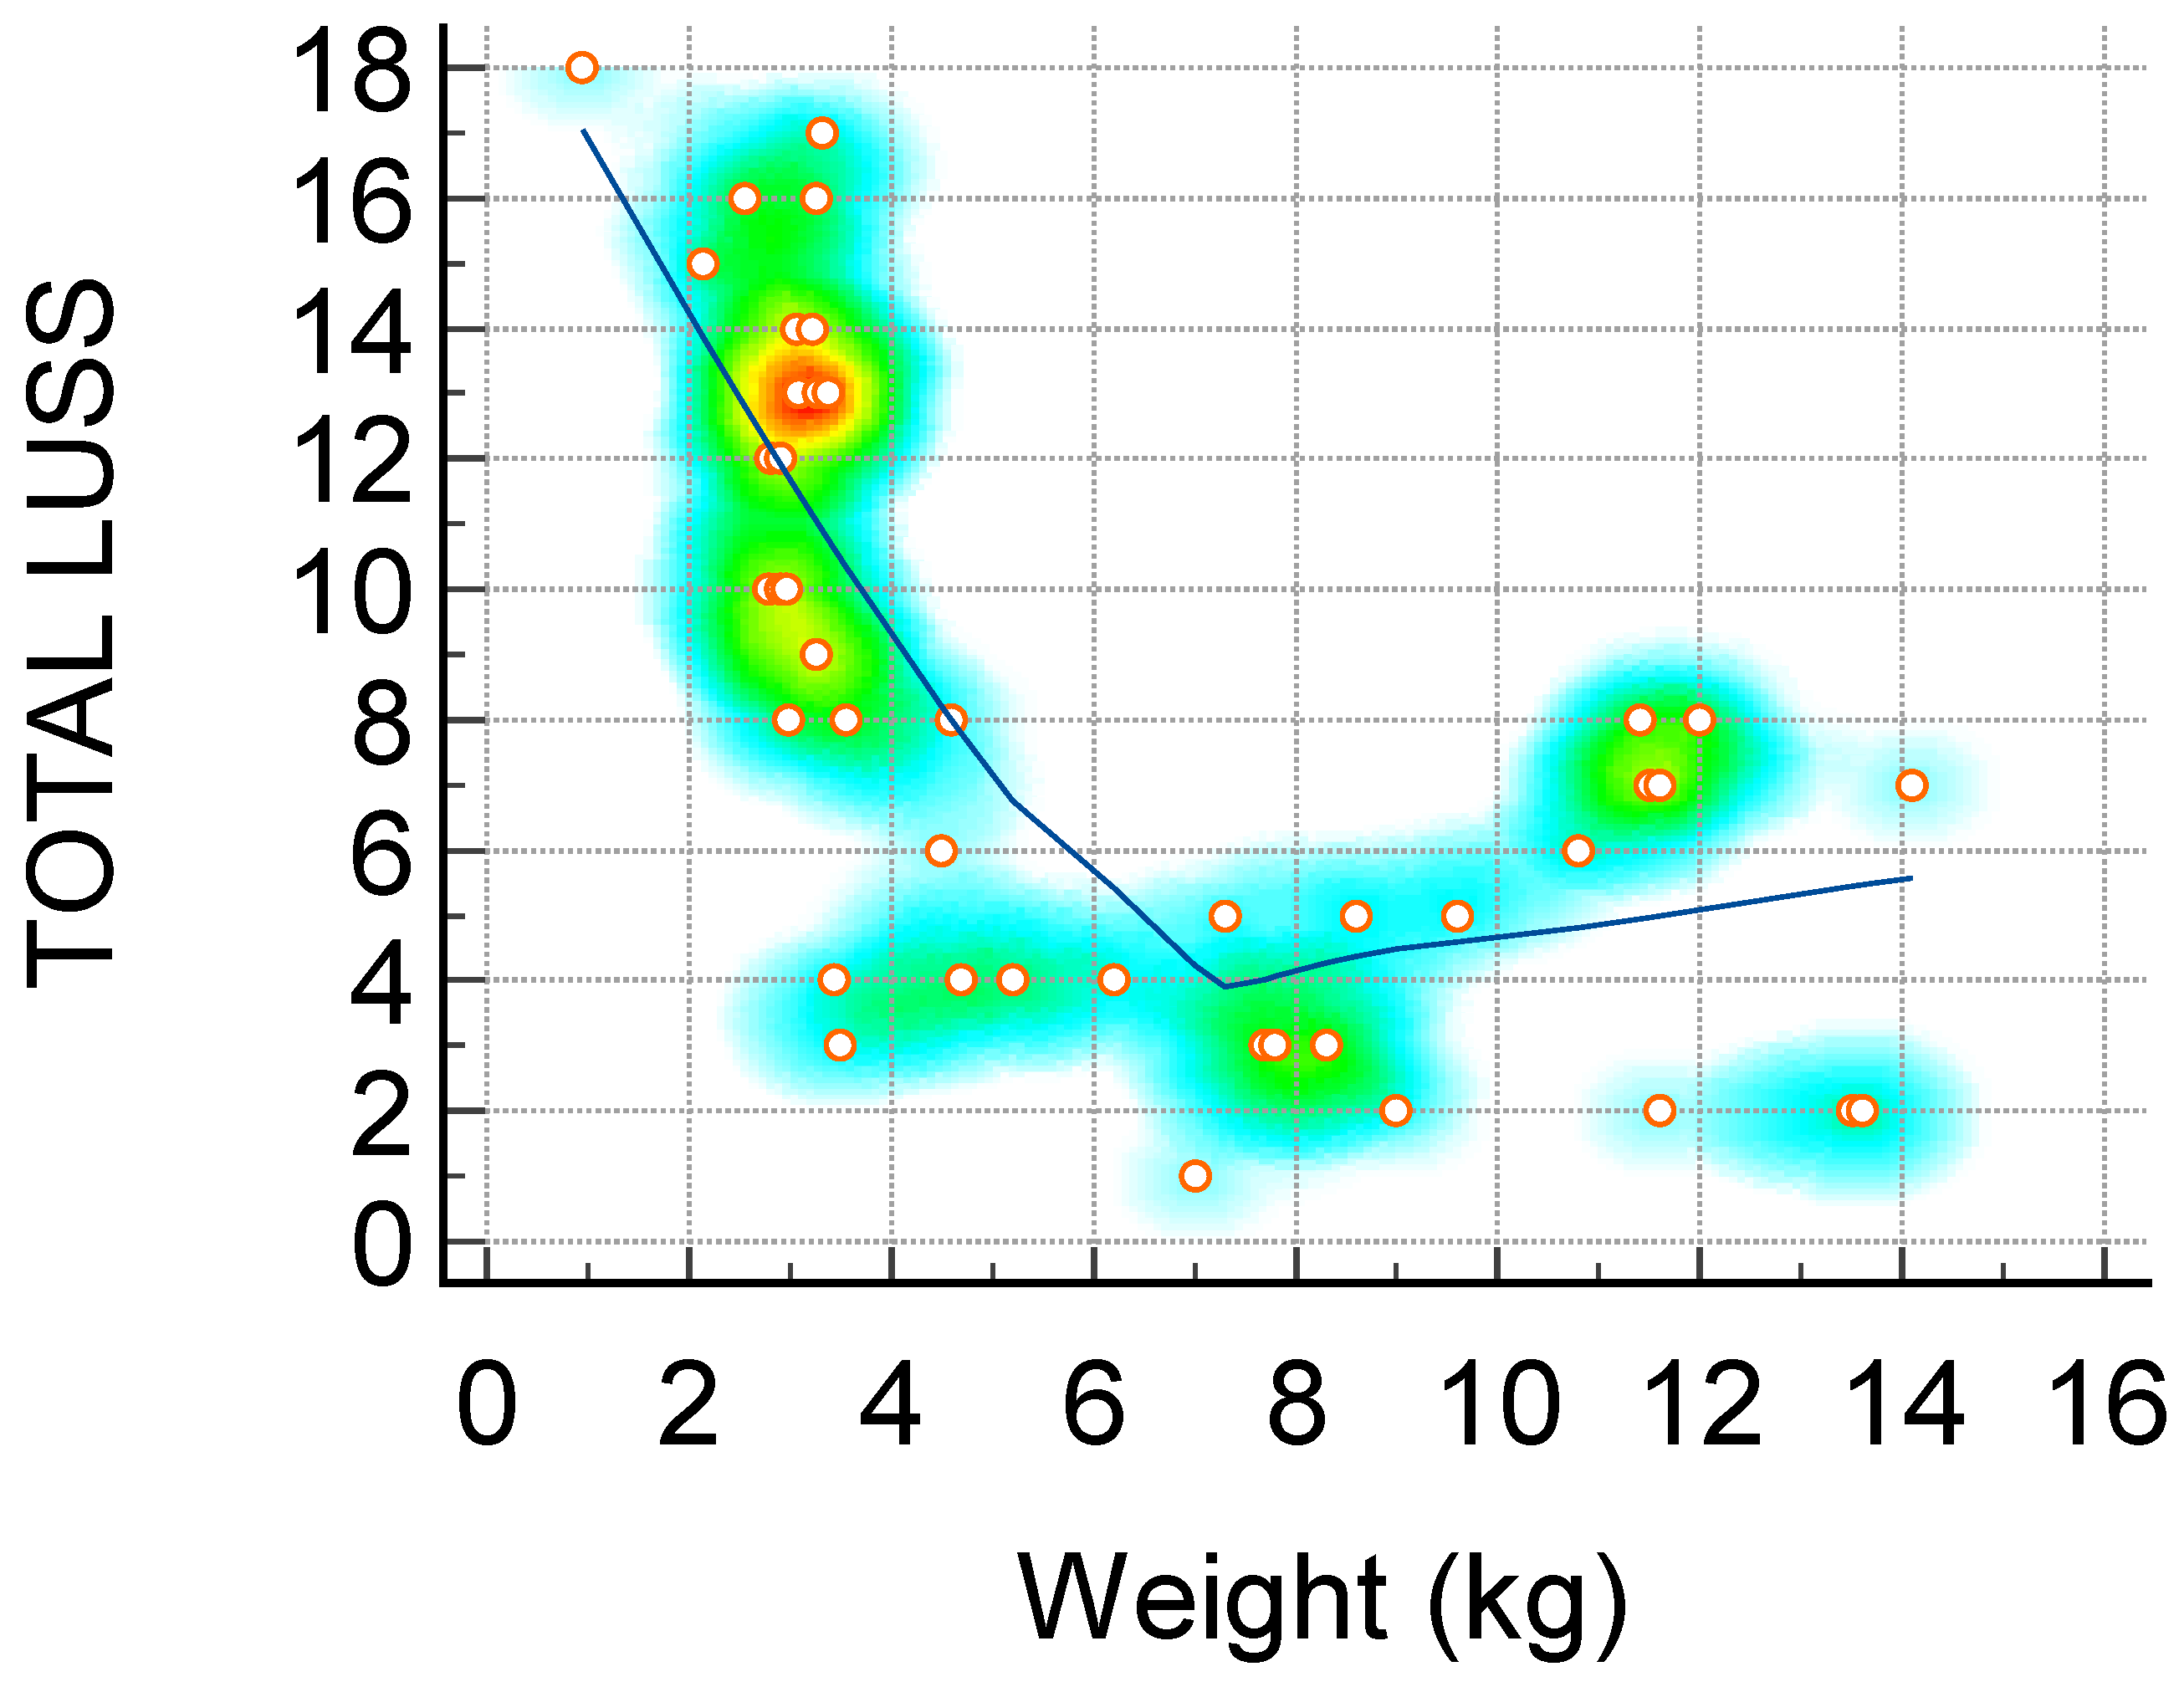
| Weight (kg)—Figure 1 | −0.72 | −0.84 to −0.53 | <0.0001 |
| Hemoglobin (g/dL) | 0.30 | −0.00 to 0.55 | 0.0520 |
| Leukocytes (×109/L) | 0.48 | 0.21 to 0.69 | 0.0010 |
| Lymphocytes (×109/L) | 0.32 | 0.02 to 0.57 | 0.0348 |
| Neutrophiles (×109/L) | 0.38 | 0.08 to 0.61 | 0.0127 |
| Thrombocytes (×109/L) | −0.22 | −0.49 to 0.08 | 0.1568 |
| ALT(U/L) | 0.11 | −0.19 to 0.40 | 0.4578 |
| AST (U/L) | 0.30 | 0.00 to 0.56 | 0.0462 |
| Total bilirubin (mg/dL) | 0.49 | 0.18 to 0.71 | 0.0036 |
| Procalcitonin (ng/mL) | 0.35 | 0.00 to 0.62 | 0.0487 |
| CRP (mg/L) | 0.34 | 0.04 to 0.58 | 0.0267 |
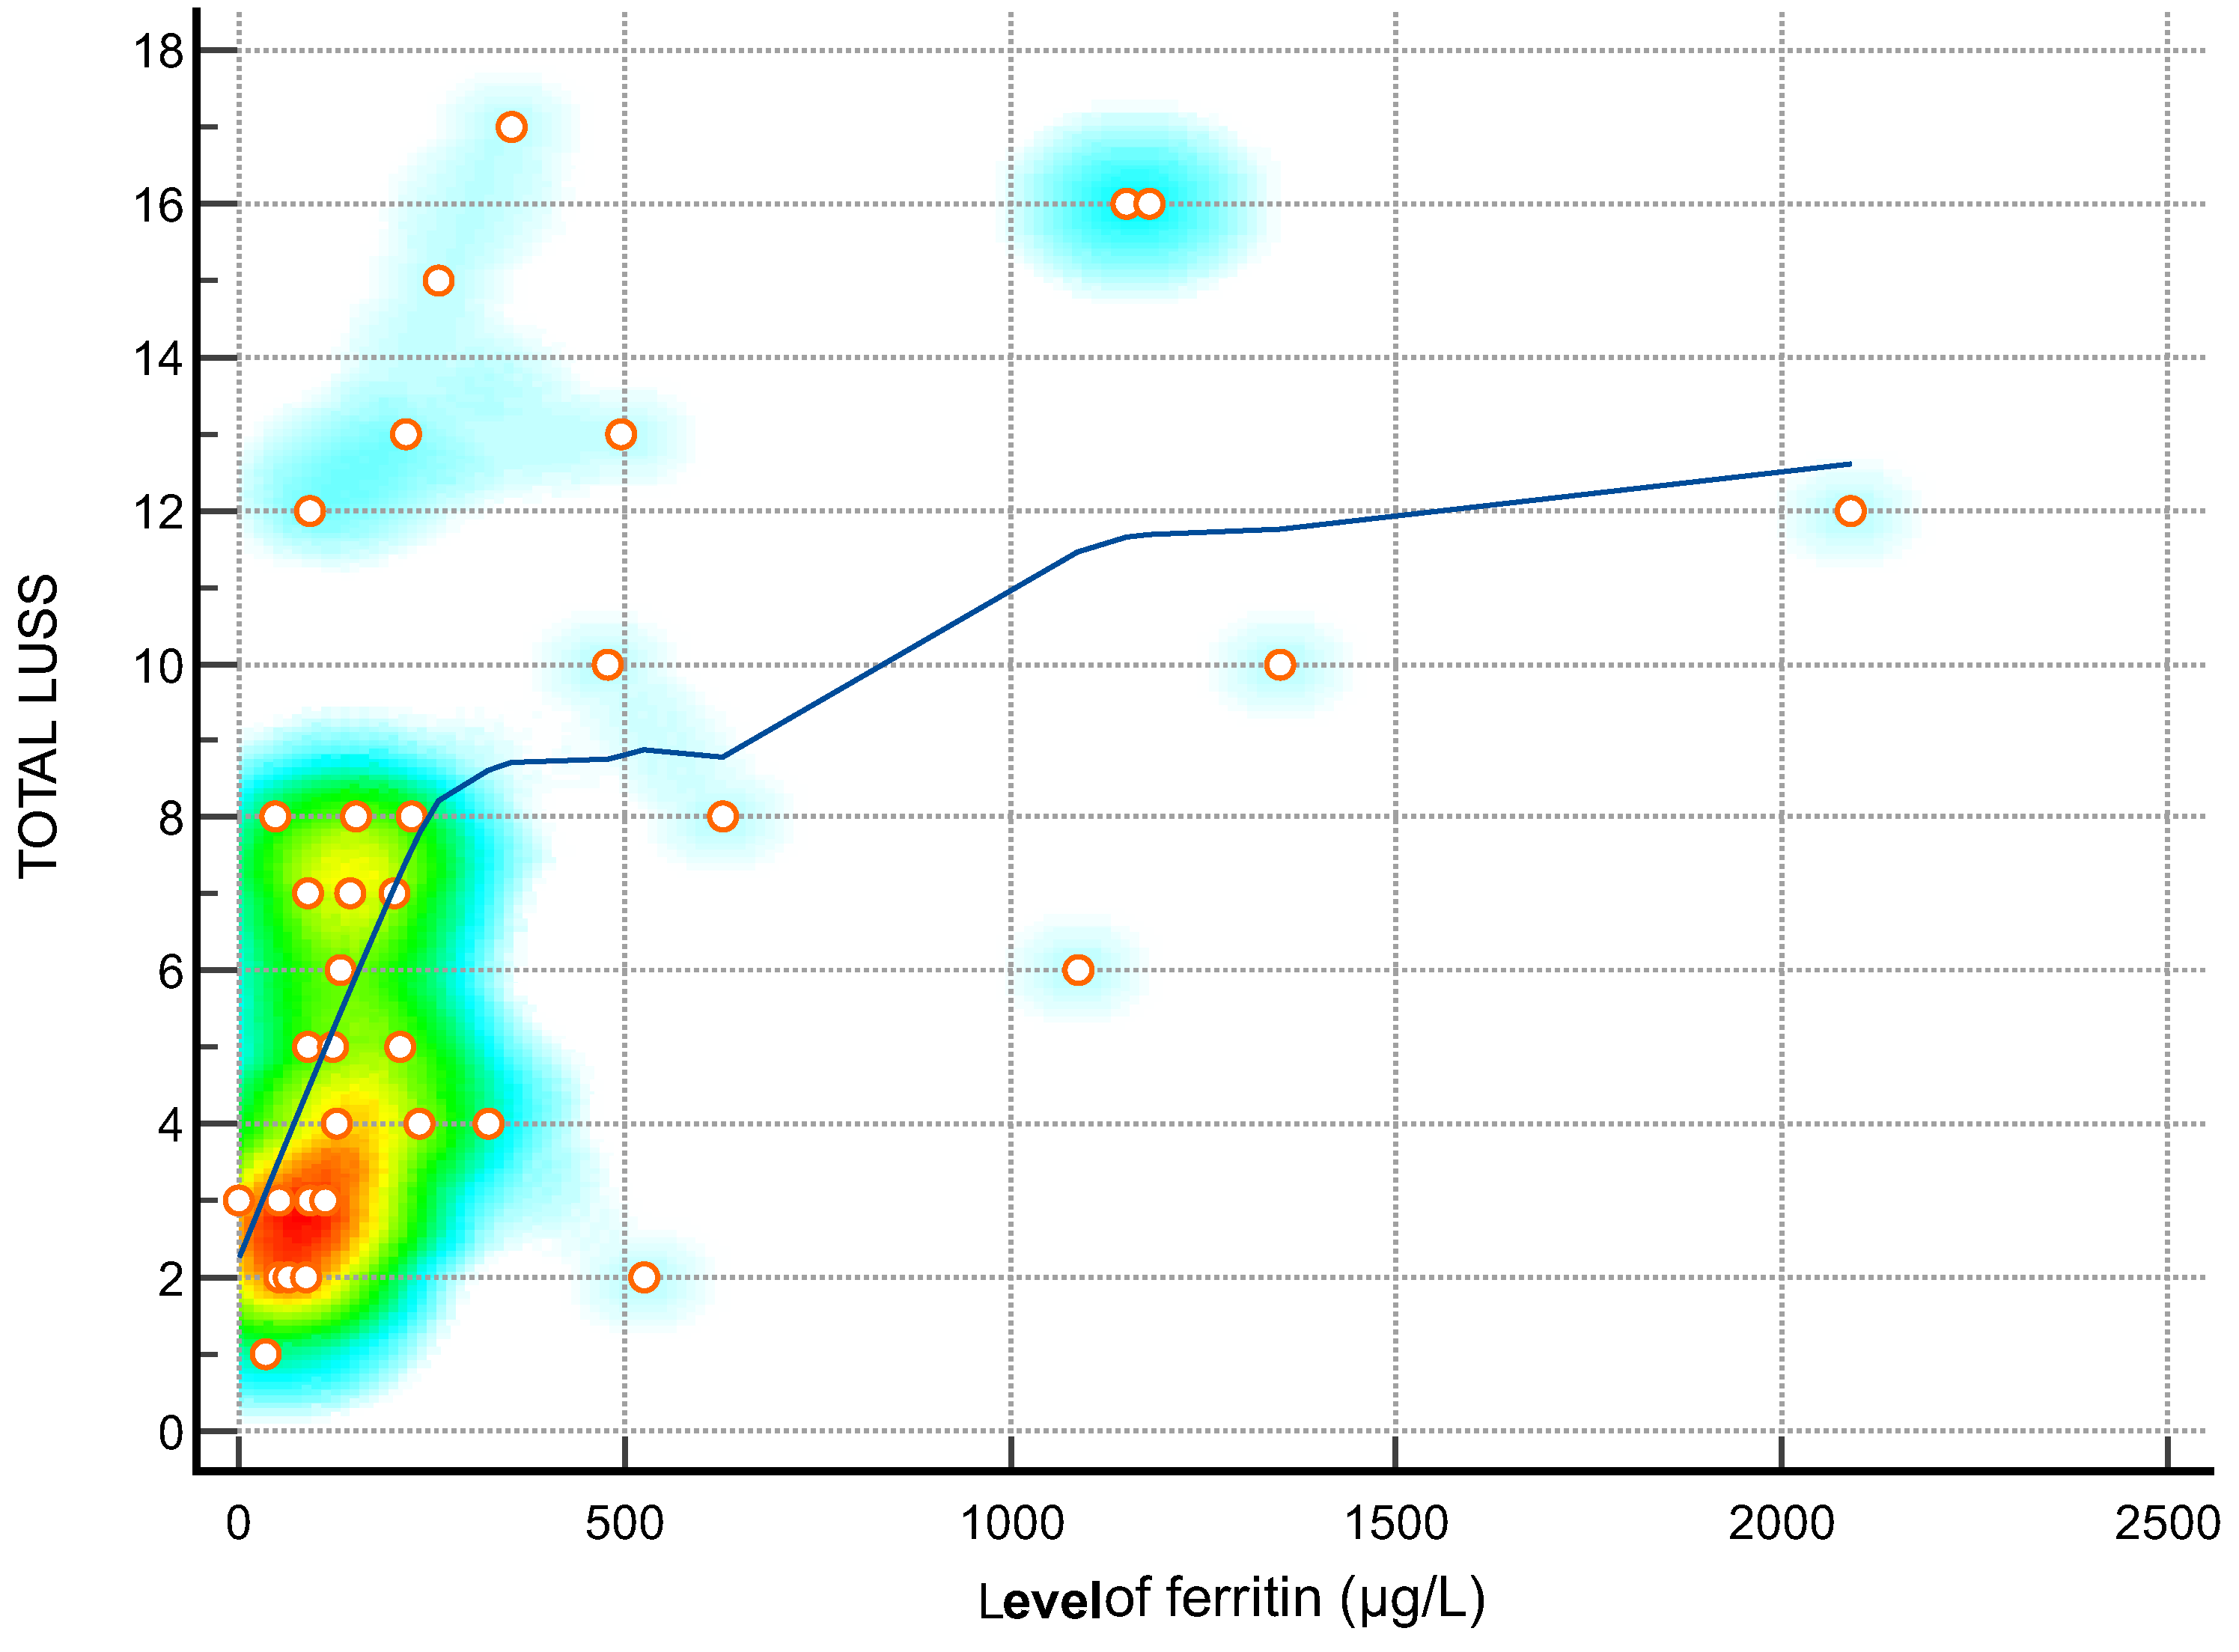
| Ferritin (µg/L)—Figure 2 | 0.62 | 0.36 to 0.79 | 0.0001 |
| LDH (U/L)—Figure 3 | 0.73 | 0.56 to 0.85 | <0.0001 |
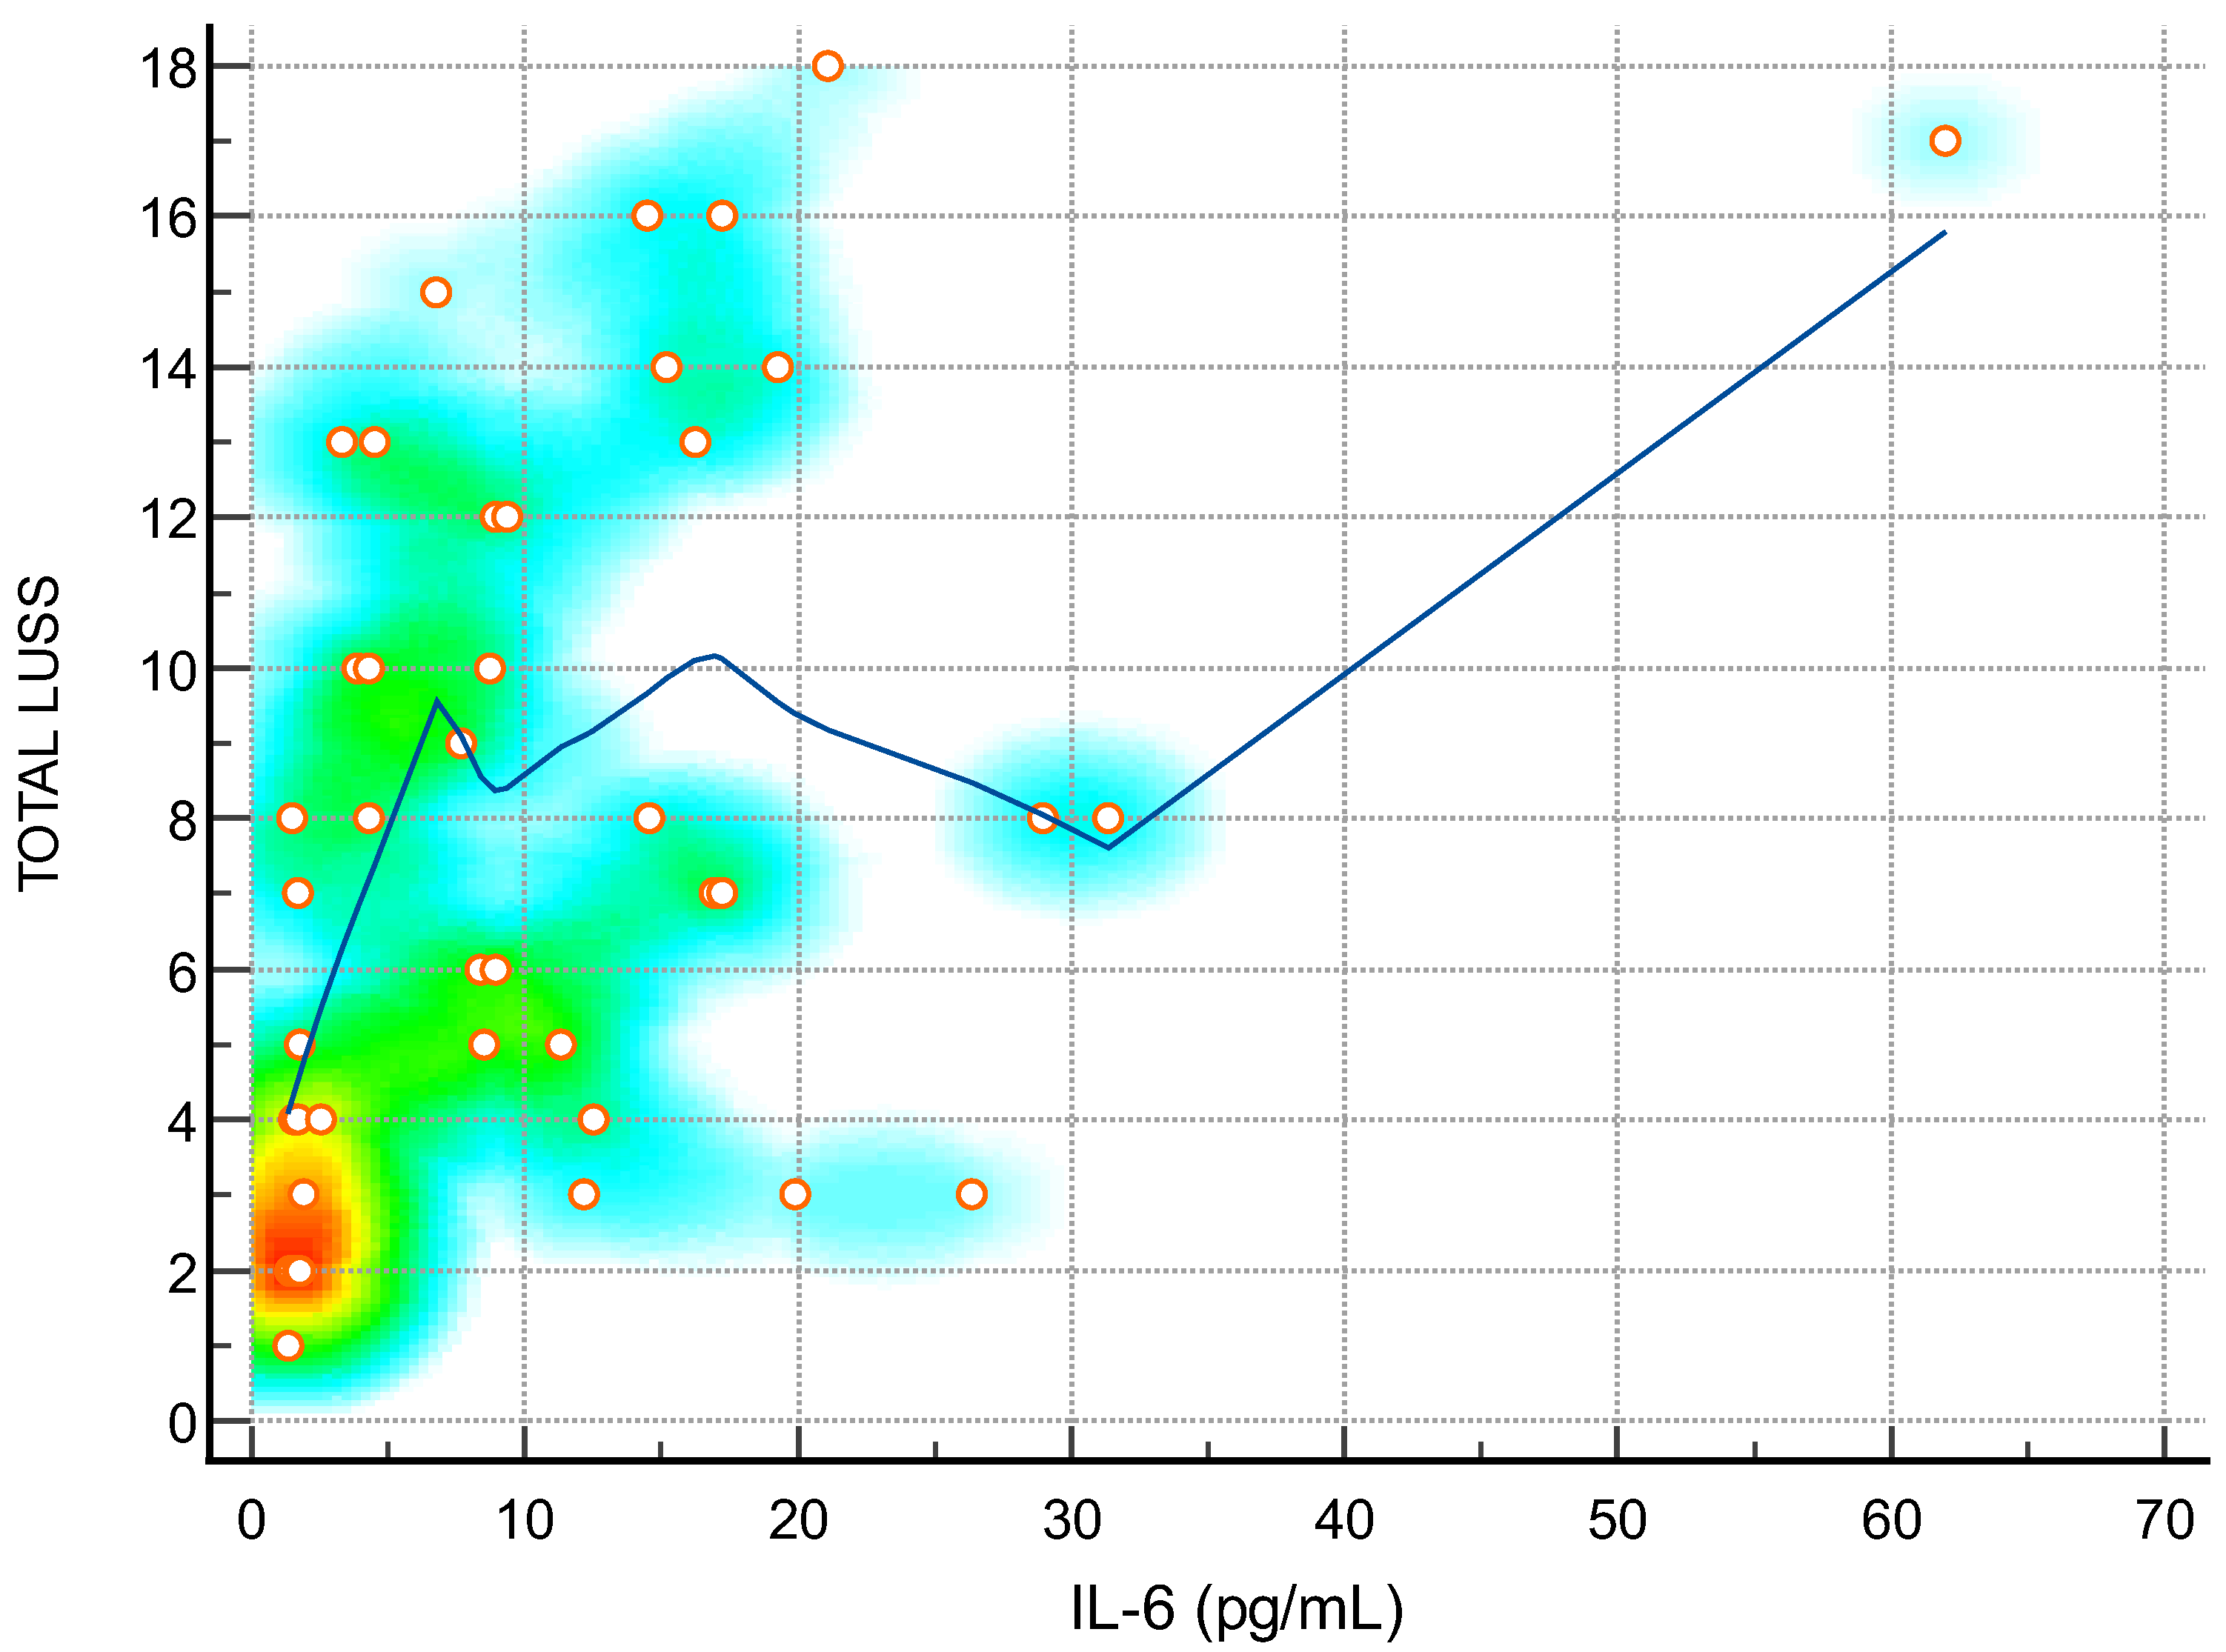
| IL-6 (pg/mL)—Figure 4 | 0.46 | 0.19 to 0.67 | 0.0017 |
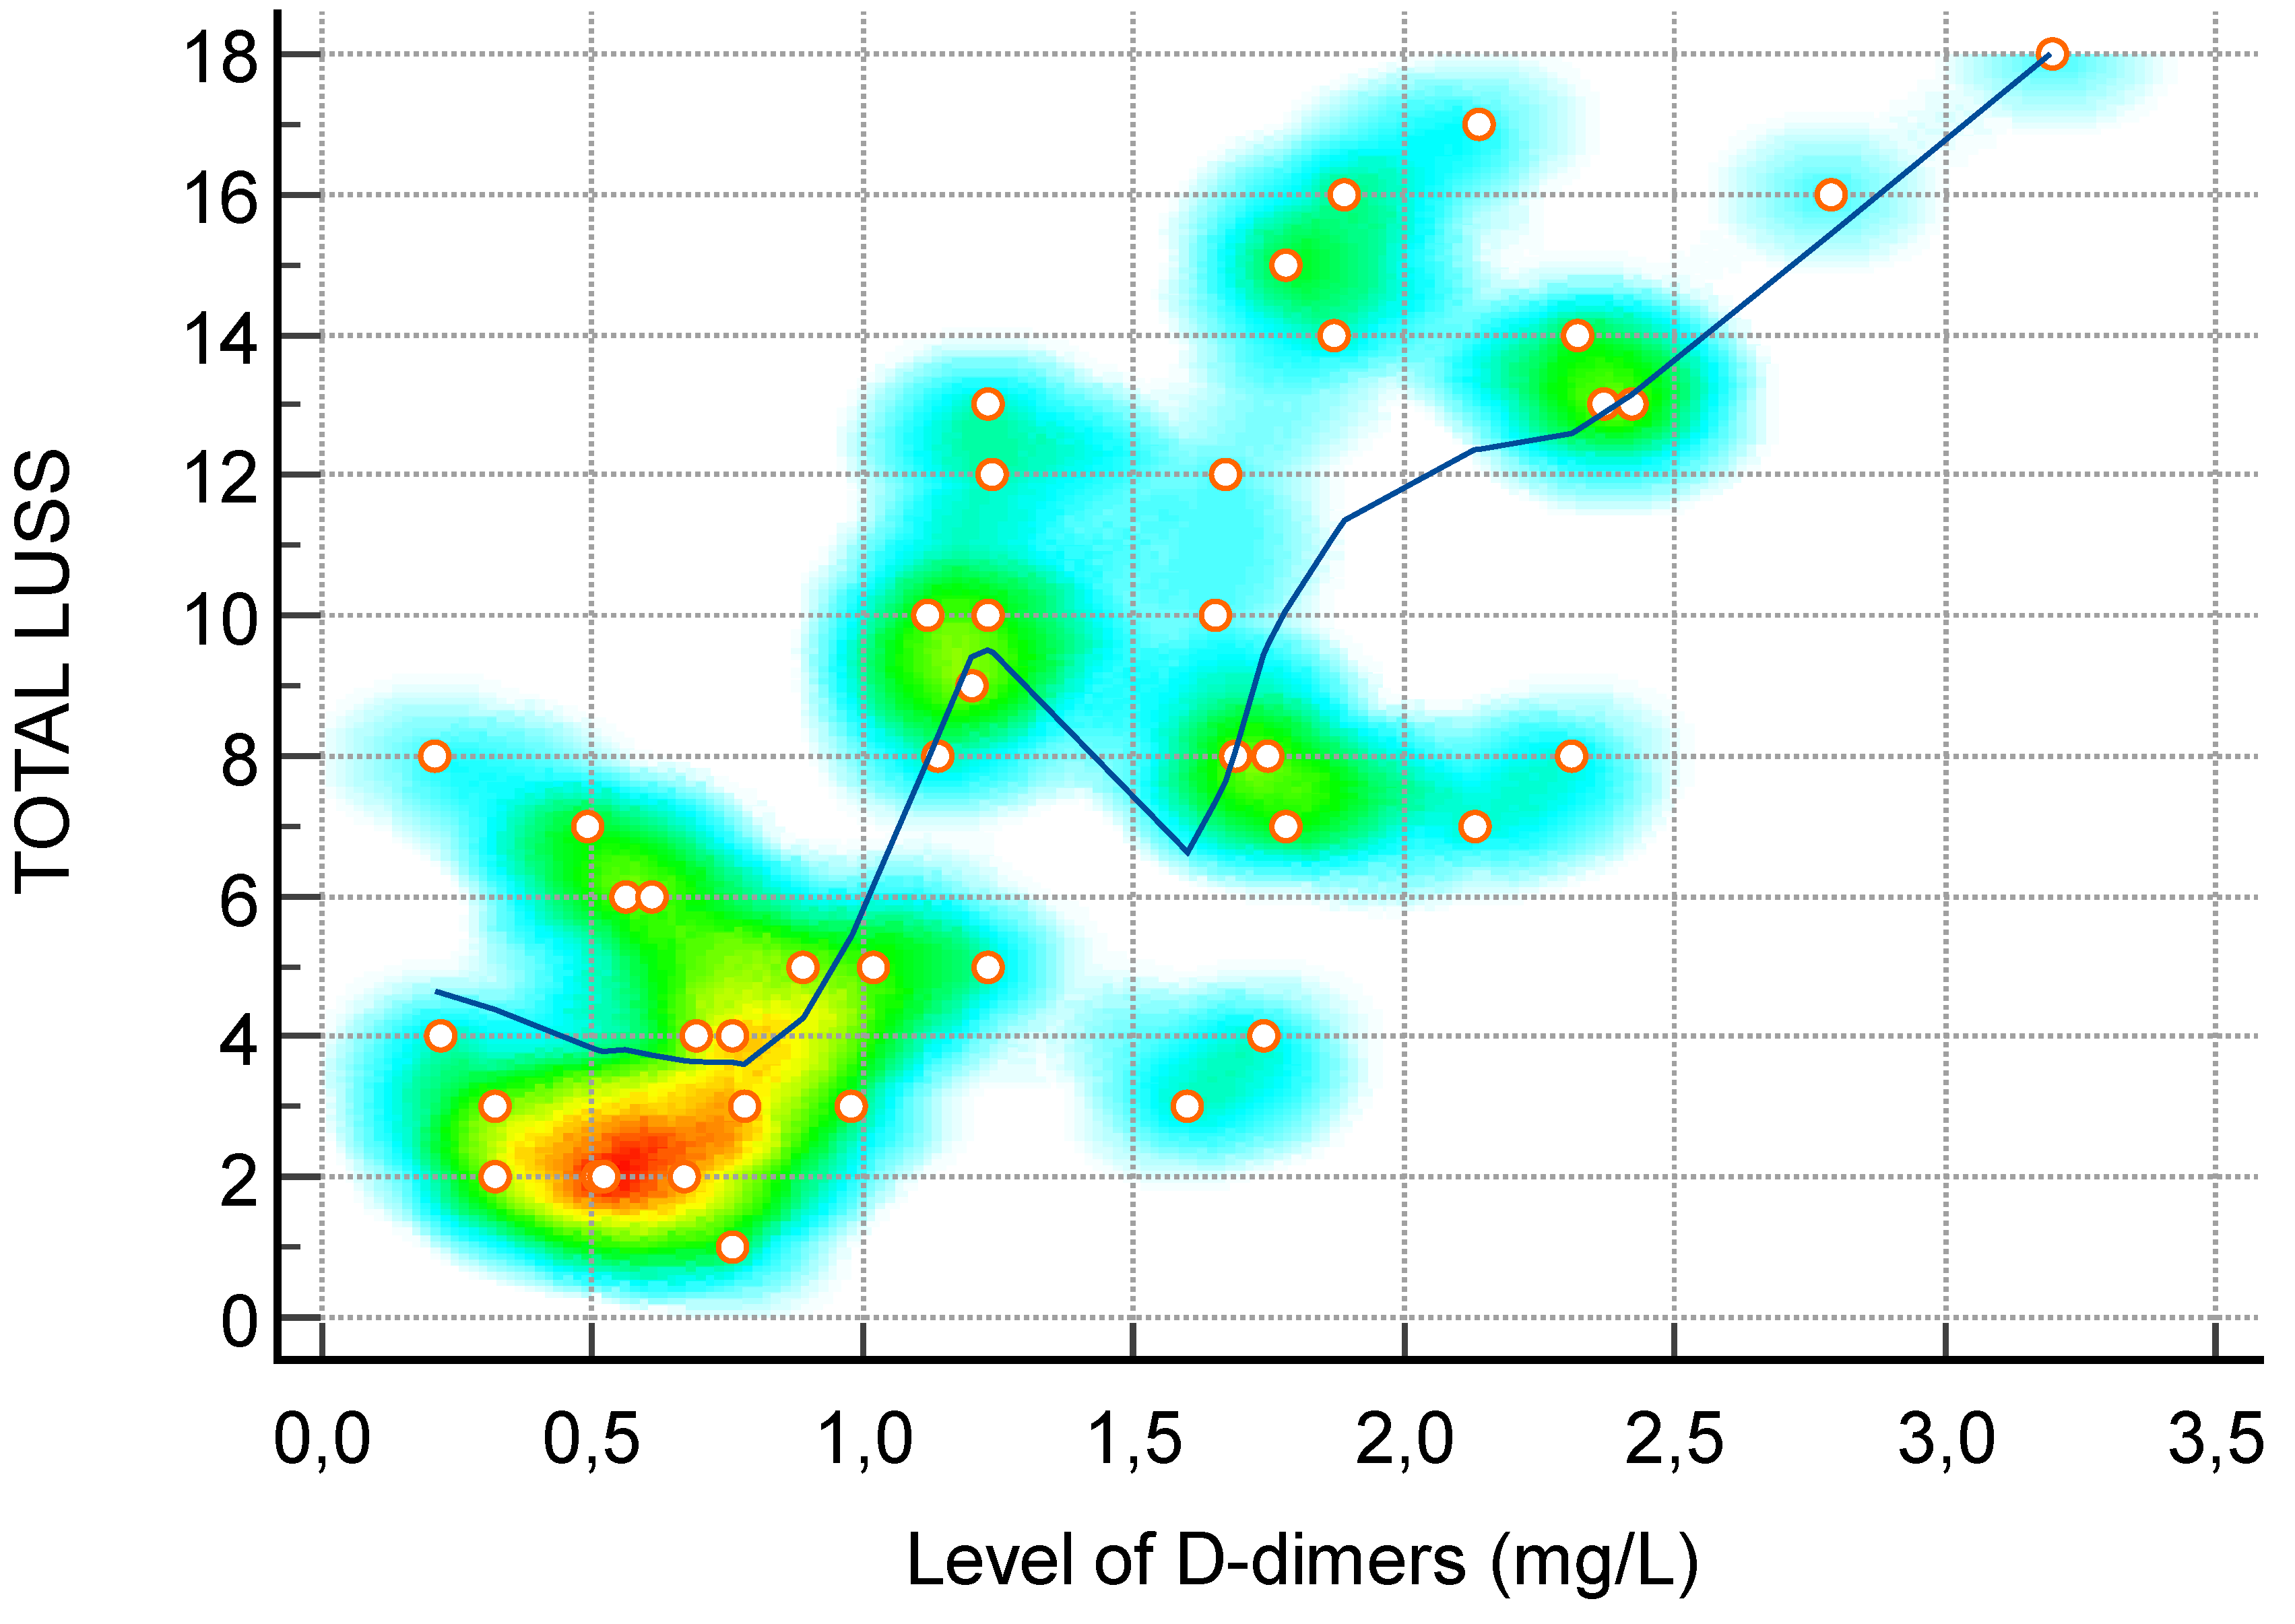
| D-dimer (mg/L)—Figure 5 | 0.73 | 0.55 to 0.85 | <0.0001 |
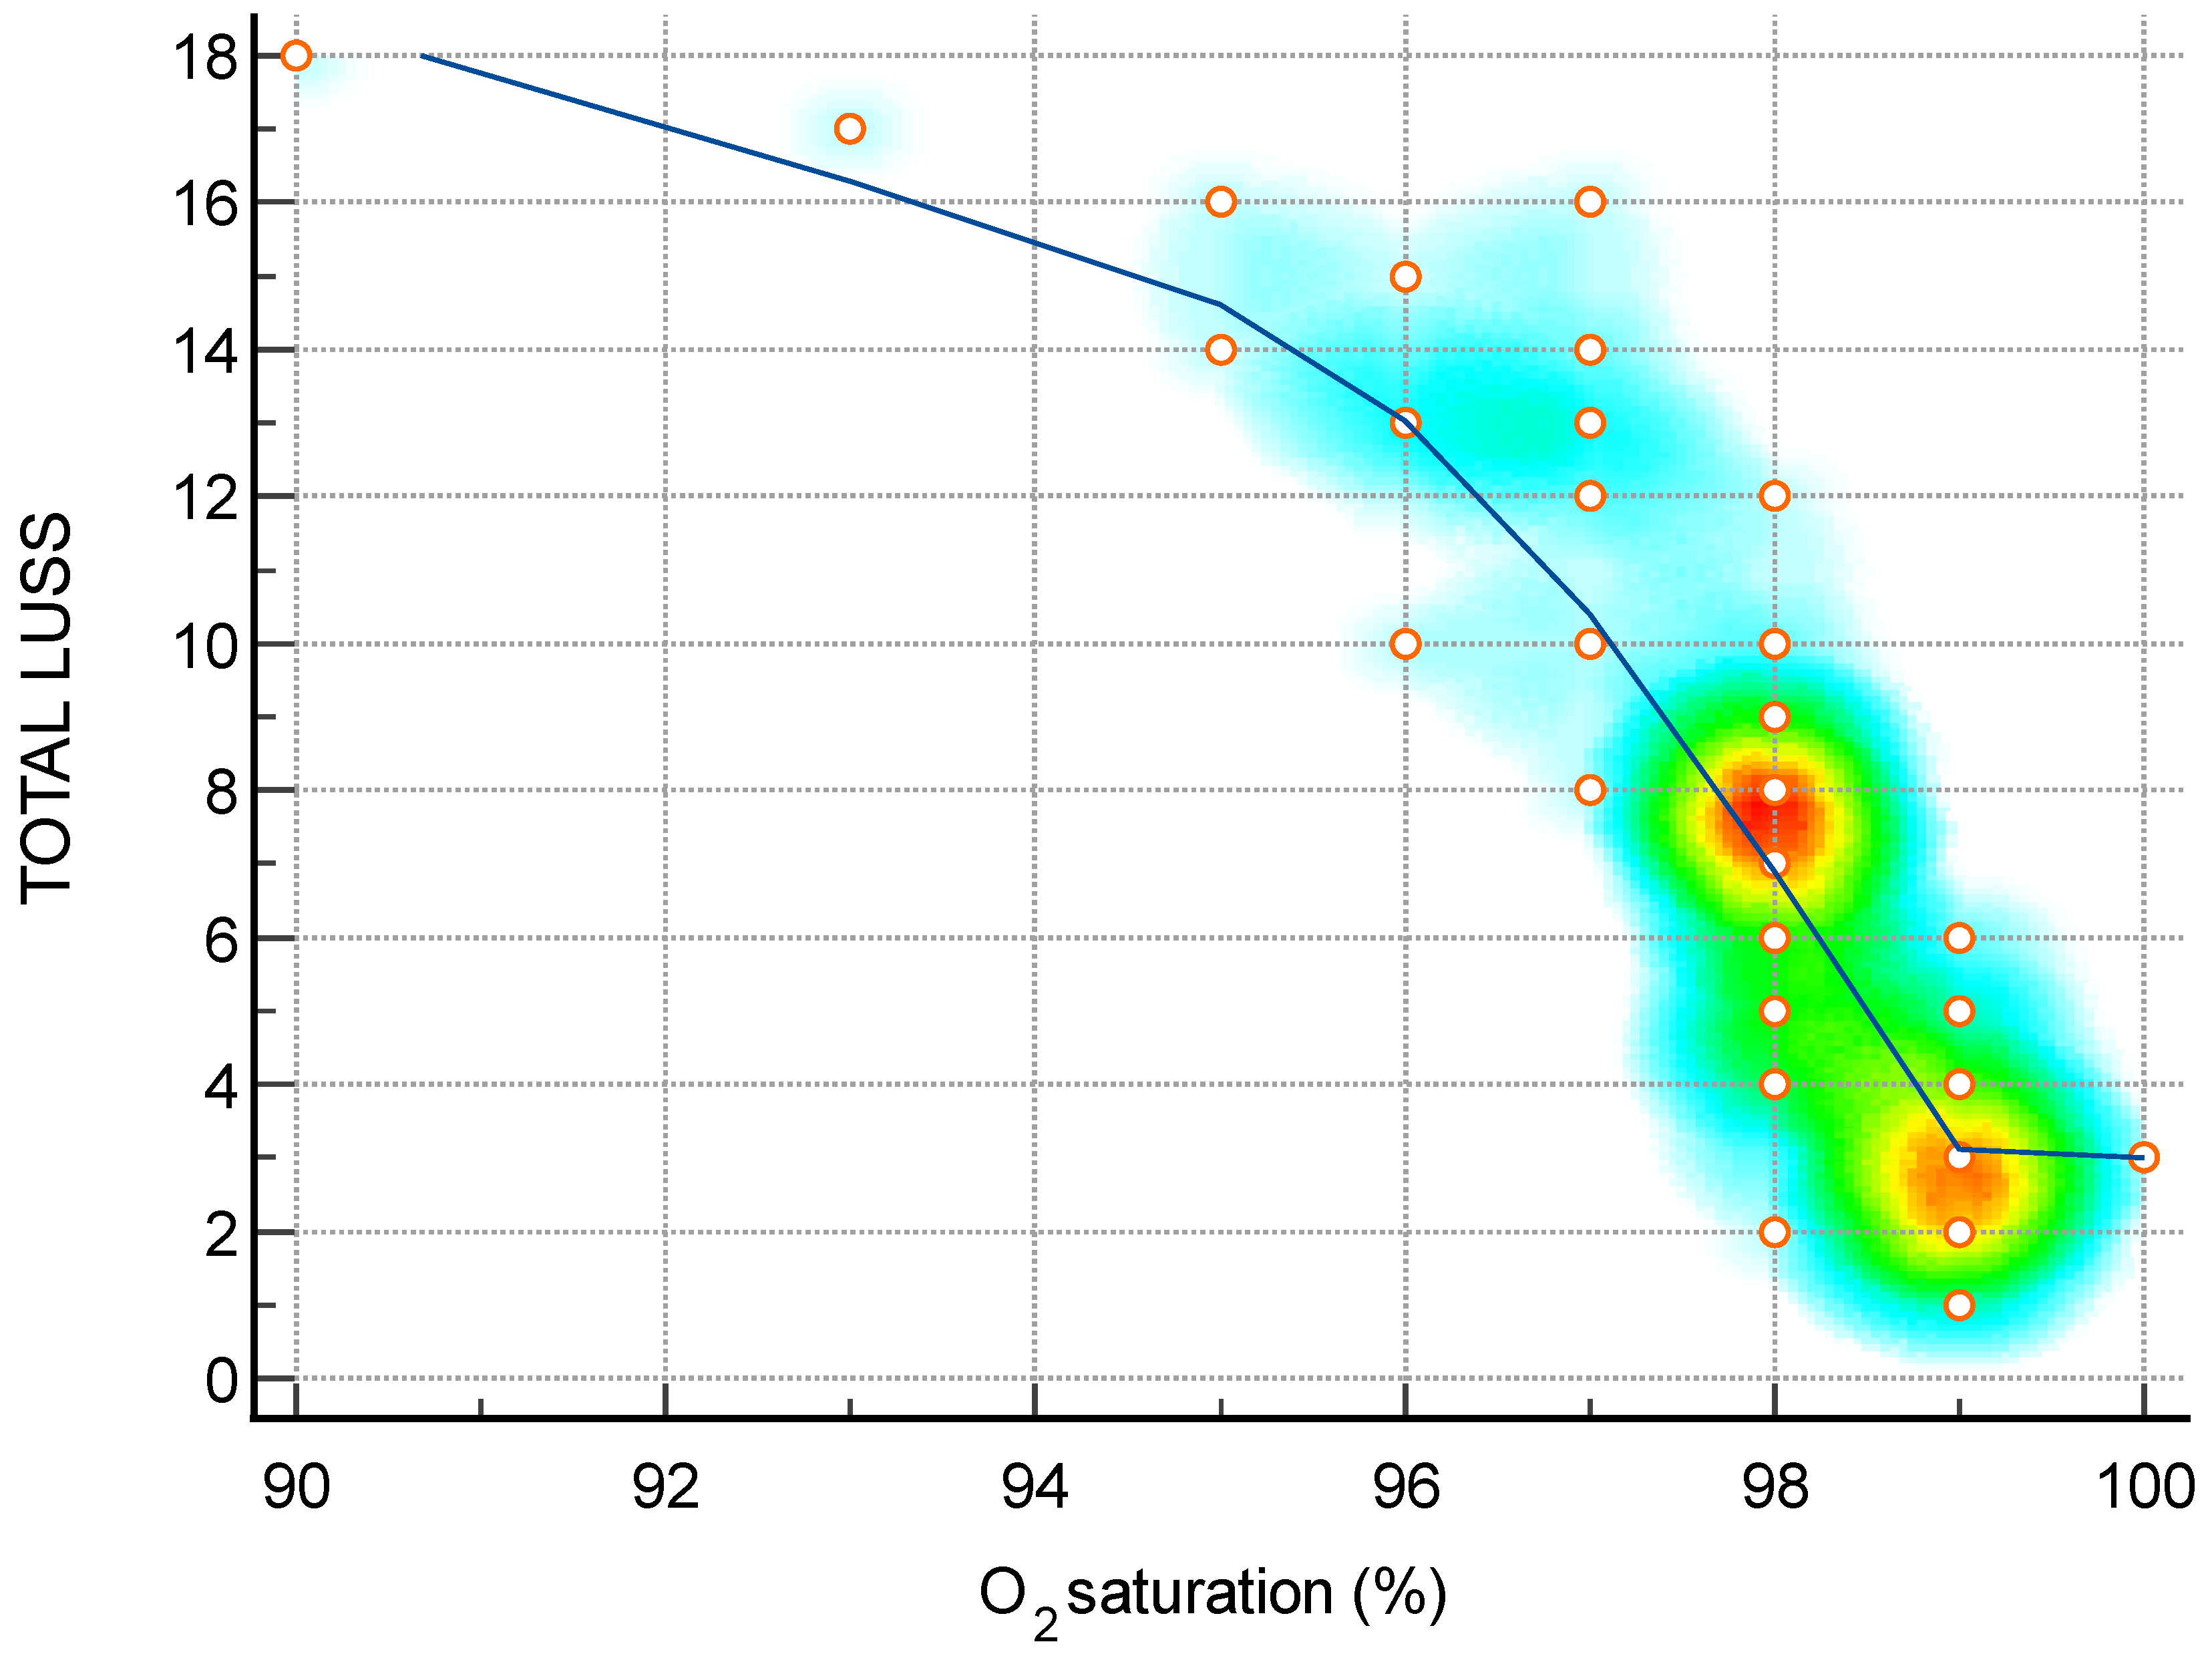
| O2 saturation (%)—Figure 6 | −0.88 | −0.93 to −0.79 | <0.0001 |
Disclaimer/Publisher’s Note: The statements, opinions and data contained in all publications are solely those of the individual author(s) and contributor(s) and not of MDPI and/or the editor(s). MDPI and/or the editor(s) disclaim responsibility for any injury to people or property resulting from any ideas, methods, instructions or products referred to in the content. |
© 2024 by the authors. Licensee MDPI, Basel, Switzerland. This article is an open access article distributed under the terms and conditions of the Creative Commons Attribution (CC BY) license (https://creativecommons.org/licenses/by/4.0/).
Share and Cite
Stoicescu, E.R.; Iacob, R.; Ilie, A.C.; Iacob, E.R.; Susa, S.R.; Ghenciu, L.A.; Constantinescu, A.; Cocolea, D.M.; Ciornei-Hoffman, A.; Oancea, C.; et al. Stratifying Disease Severity in Pediatric COVID-19: A Correlative Study of Serum Biomarkers and Lung Ultrasound—A Retrospective Observational Dual-Center Study. Diagnostics 2024, 14, 440. https://doi.org/10.3390/diagnostics14040440
Stoicescu ER, Iacob R, Ilie AC, Iacob ER, Susa SR, Ghenciu LA, Constantinescu A, Cocolea DM, Ciornei-Hoffman A, Oancea C, et al. Stratifying Disease Severity in Pediatric COVID-19: A Correlative Study of Serum Biomarkers and Lung Ultrasound—A Retrospective Observational Dual-Center Study. Diagnostics. 2024; 14(4):440. https://doi.org/10.3390/diagnostics14040440
Chicago/Turabian StyleStoicescu, Emil Robert, Roxana Iacob, Adrian Cosmin Ilie, Emil Radu Iacob, Septimiu Radu Susa, Laura Andreea Ghenciu, Amalia Constantinescu, Daiana Marina Cocolea, Andreea Ciornei-Hoffman, Cristian Oancea, and et al. 2024. "Stratifying Disease Severity in Pediatric COVID-19: A Correlative Study of Serum Biomarkers and Lung Ultrasound—A Retrospective Observational Dual-Center Study" Diagnostics 14, no. 4: 440. https://doi.org/10.3390/diagnostics14040440