
Clinical Significance of Maximum Intensity Projection Method for Diagnostic Imaging of Thoracic Outlet Syndrome
 , ,
, ,
Abstract
:1. Introduction
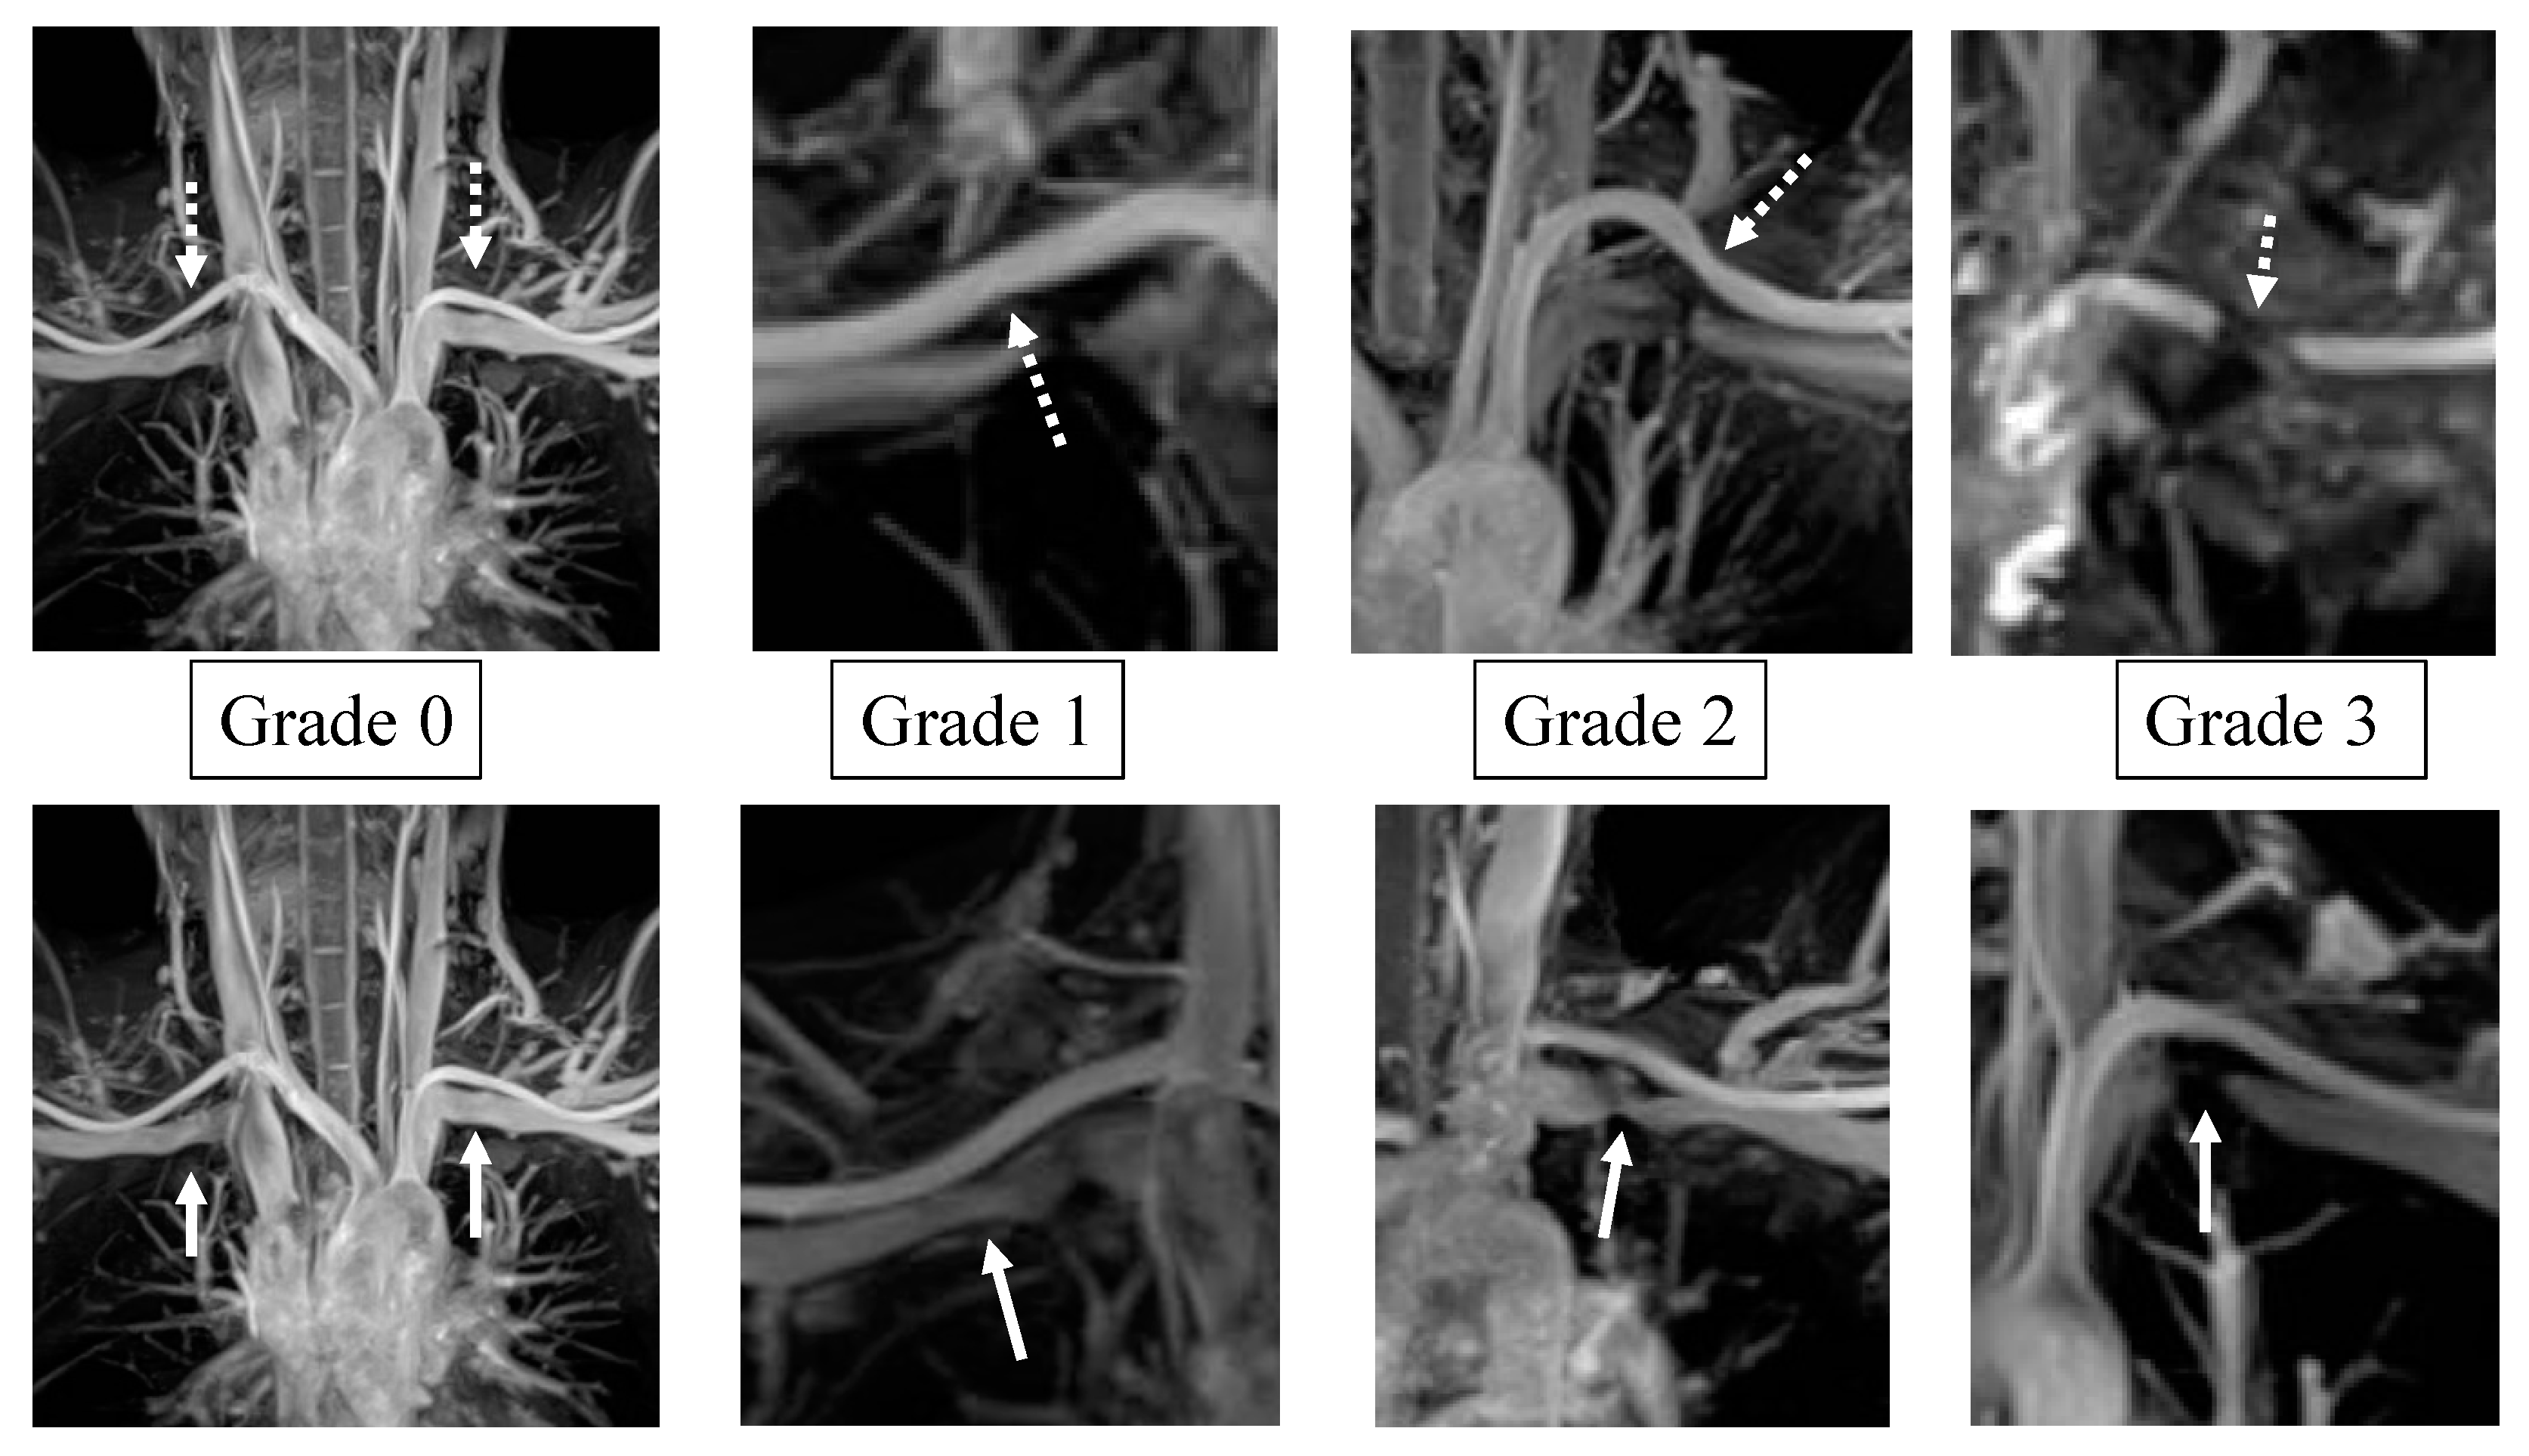
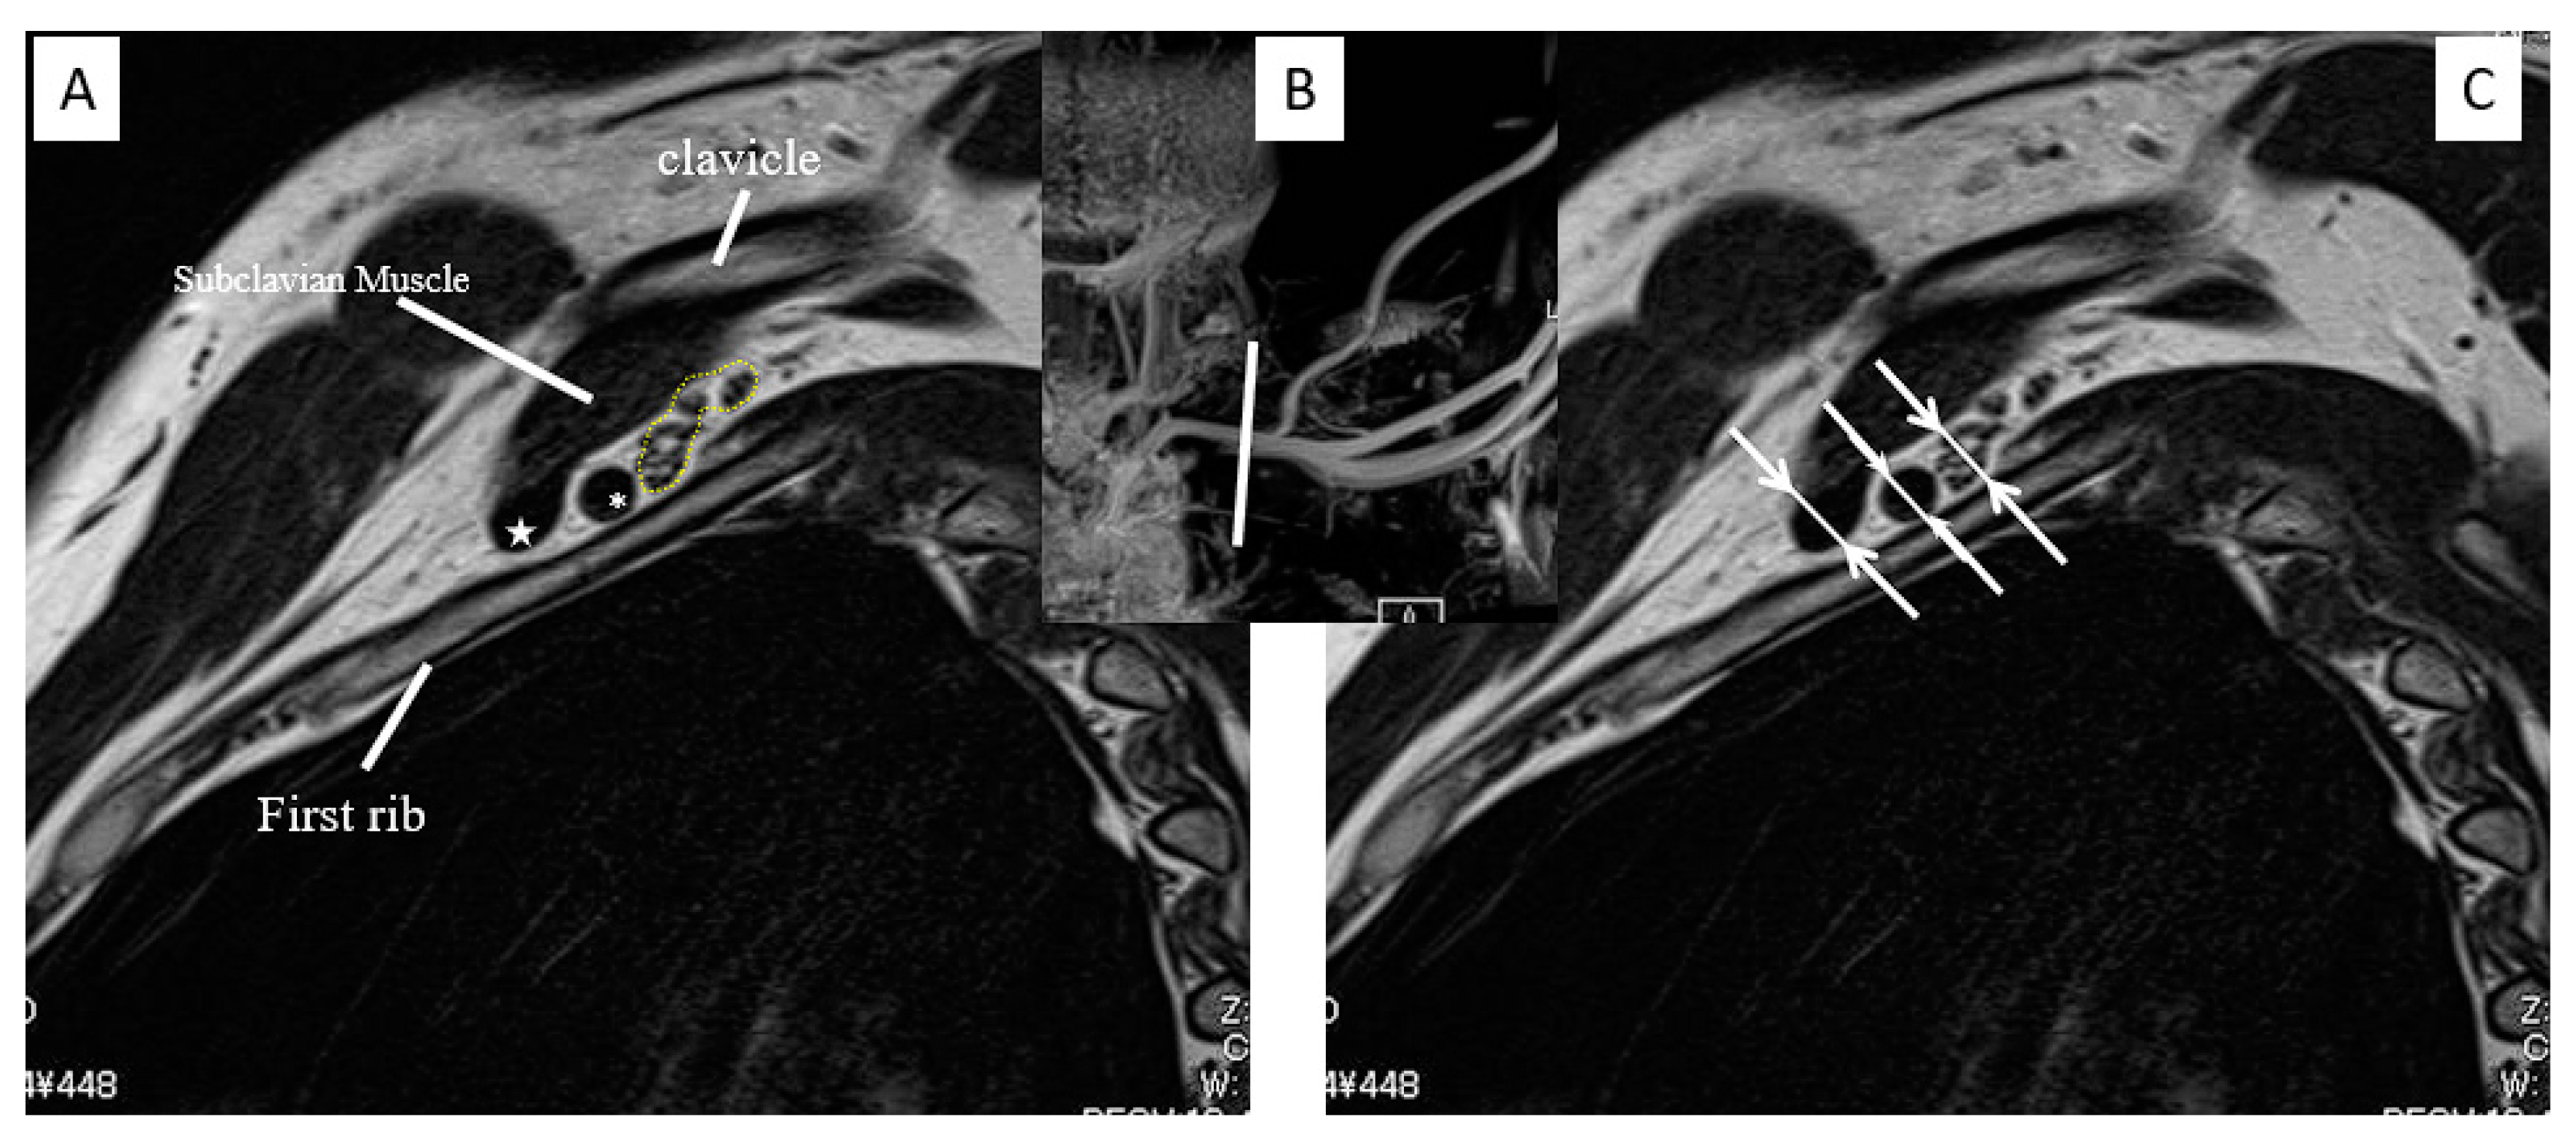
2. Materials and Methods
3. Results
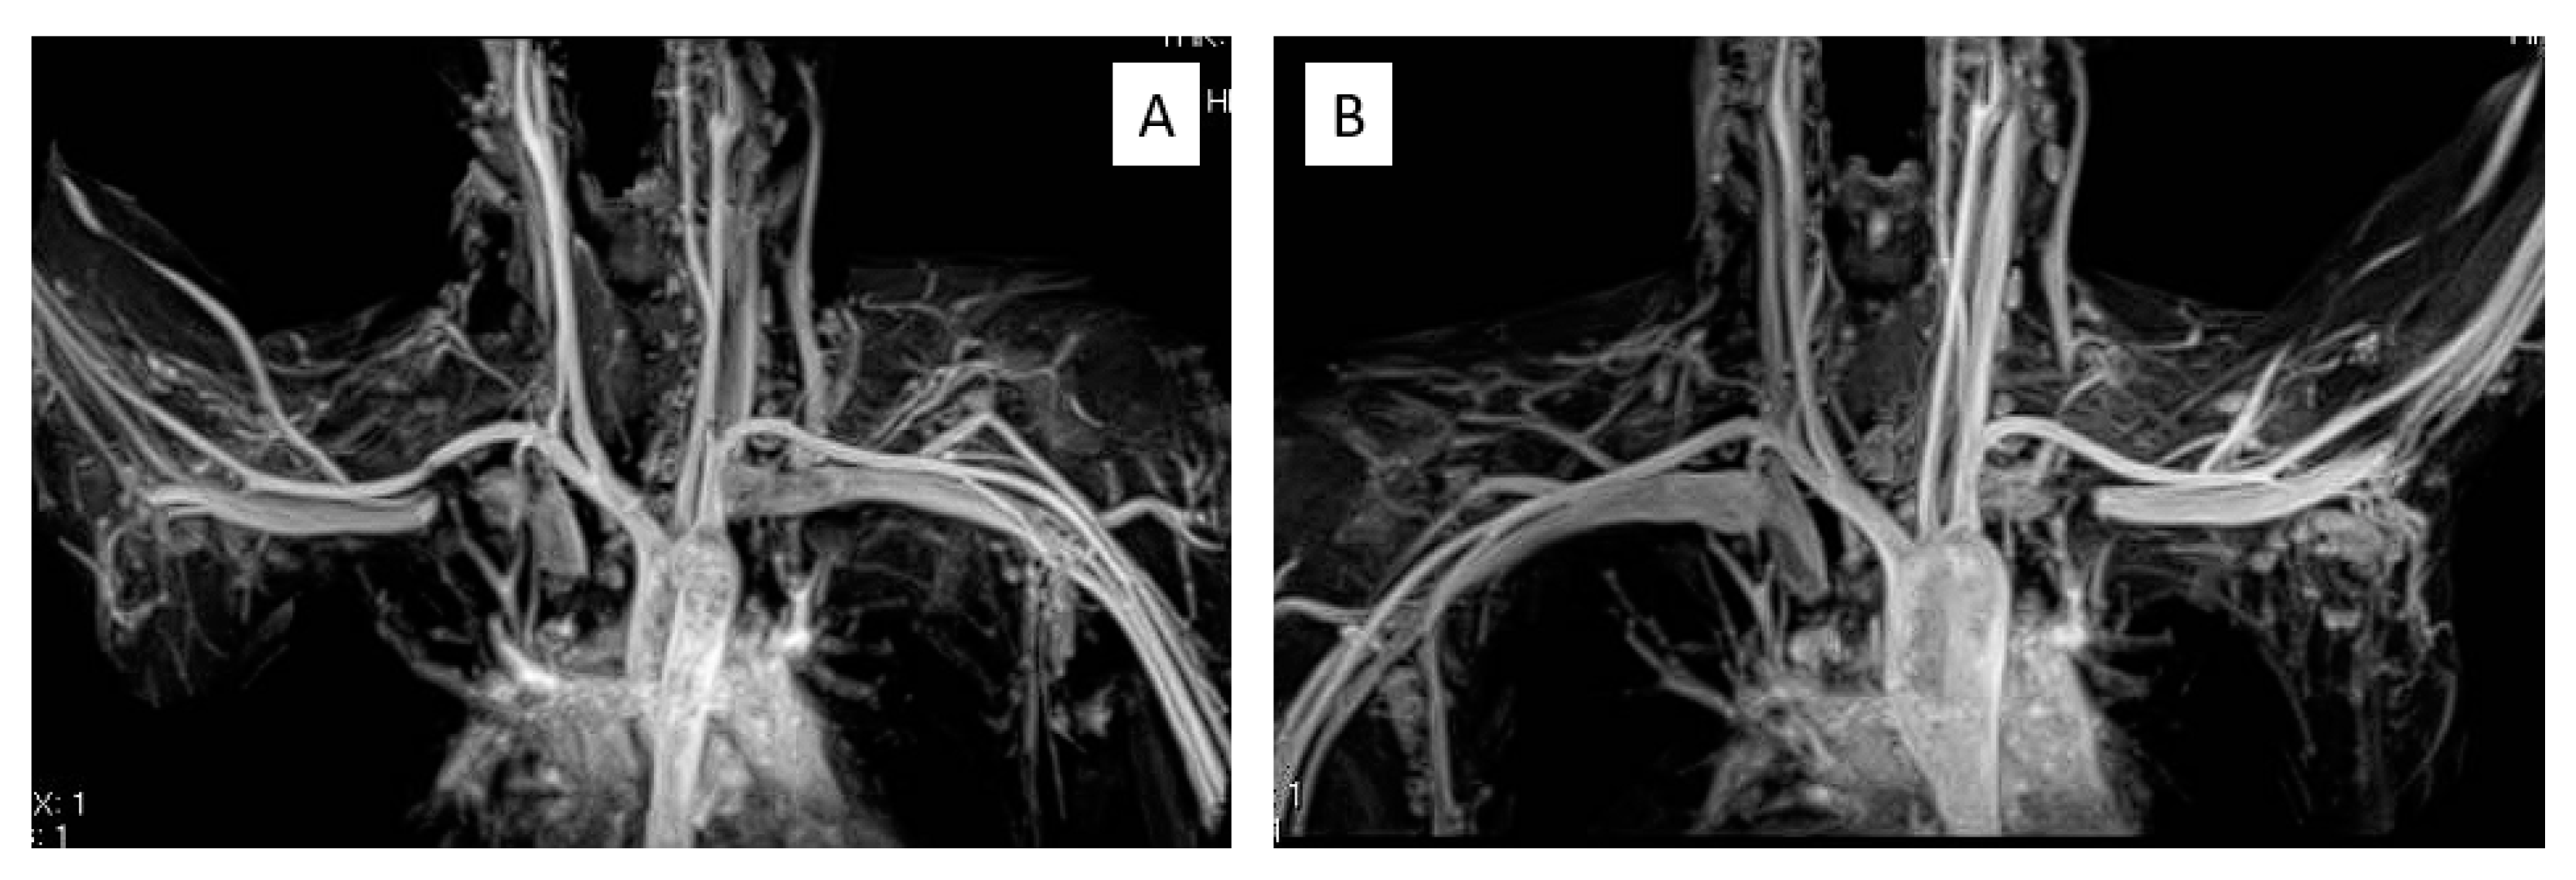
Representative Case
4. Discussion
5. Conclusions
Author Contributions
Funding
Institutional Review Board Statement
Informed Consent Statement
Data Availability Statement
Acknowledgments
Conflicts of Interest
References
- Ruopsa, N.; Ristolainen, L.; Vastamäki, M.; Vastamäki, H. Neurogenic Thoracic Outlet Syndrome with Supraclavicular Release: Long-Term Outcome without Rib Resection. Diagnostics 2021, 11, 450. [Google Scholar] [CrossRef] [PubMed]
- Povlsen, S.; Povlsen, B. Diagnosing Thoracic Outlet Syndrome: Current Approaches and Future Directions. Diagnostics 2018, 8, 21. [Google Scholar] [CrossRef] [PubMed] [Green Version]
- Kuhn, J.E.; Lebus, G.F.; Bible, J.E. Thoracic Outlet Syndrome. J. Am. Acad. Orthop. Surg. 2015, 23, 222–232. [Google Scholar] [CrossRef] [PubMed]
- Peek, J.; Vos, C.G.; Ünlü, Ç.; van de Pavoordt, H.D.W.M.; van den Akker, P.J.; de Vries, J.-P.P. Outcome of Surgical Treatment for Thoracic Outlet Syndrome: Systematic Review and Meta-Analysis. Ann. Vasc. Surg. 2017, 40, 303–326. [Google Scholar] [CrossRef]
- Beteck, B.; Shutze, W.; Richardson, B.; Shutze, R.; Tran, K.; Dao, A.; Ogola, G.O.; Pearl, G. Comparison of Athletes and Nonathletes Undergoing Thoracic Outlet Decompression for Neurogenic Thoracic Outlet Syndrome. Ann. Vasc. Surg. 2018, 54, 269–275. [Google Scholar] [CrossRef]
- Burks, S.S.; Wolfe, E.M.; Yoon, J.W.; Levi, A.D. Supraclavicular Resection of a Cervical Rib Causing Thoracic Outlet Syndrome: 2-Dimensional Operative Video. Oper. Neurosurg. 2020, 19, E520. [Google Scholar] [CrossRef]
- Furushima, K.; Funakoshi, T.; Kusano, H.; Miyamoto, A.; Takahashi, T.; Horiuchi, Y.; Itoh, Y. Endoscopic-Assisted Transaxillary Approach for First Rib Resection in Thoracic Outlet Syndrome. Arthrosc. Sport. Med. Rehabil. 2021, 3, e155–e162. [Google Scholar] [CrossRef]
- Ransom, E.F.; Minton, H.L.; Young, B.L.; He, J.K.; Ponce, B.A.; McGwin, G.; Meyer, R.D.; Brabston, I.E.W. Intermediate and Long-Term Outcomes Following Surgical Decompression of Neurogenic Thoracic Outlet Syndrome in an Adolescent Patient Population. Hand 2020, 17, 43–49. [Google Scholar] [CrossRef]
- Perchoc, A.; Andro, C.; Letissier, H.; Schiele, P.; Le Nen, D. Long-term functional outcomes after surgical treatment of nonspecific thoracic outlet syndrome: Retrospective study of 70 cases at a mean of 8 years’ follow-up. Hand Surg. Rehabil. 2019, 38, 195–201. [Google Scholar] [CrossRef] [PubMed]
- Wilbourn, A.J. Thoracic outlet syndrome is over diagnosed. Muscle Nerve 1999, 22, 130–136. [Google Scholar] [CrossRef]
- Ferrante, M.A.; Ferrante, N.D. The thoracic outlet syndromes: Part 2. The arterial, venous, neurovascular, and disputed thoracic outlet syndromes. Muscle Nerve 2017, 56, 663–673. [Google Scholar] [CrossRef] [PubMed]
- Masocatto, N.O.; Da-Matta, T.; Prozzo, T.G.; Couto, W.J.; Porfirio, G. Thoracic outlet syndrome: A narrative review. Rev. Col. Bras. Cir. 2019, 46, e20192243. [Google Scholar] [CrossRef]
- Seror, P. Medial antebrachial cutaneous nerve conduction study, a new tool to demonstrate mild lower brachial plexus lesions. A report of 16 cases. Clin. Neurophysiol. 2004, 115, 2316–2322. [Google Scholar] [CrossRef] [PubMed]
- Sonoo, M. Thoracic outlet syndrome. Brain Nerve 2014, 66, 1429–1439. (In Japanese) [Google Scholar] [CrossRef]
- Remy-Jardin, M.; Remy, J.; Masson, P.; Bonnel, F.; Debatselier, P.; Vinckier, L.; Duhamel, A. Helical CT Angiography of Thoracic Outlet Syndrome. Am. J. Roentgenol. 2000, 174, 1667–1674. [Google Scholar] [CrossRef] [PubMed]
- Demondion, X.; Herbinet, P.; Van Sint Jan, S.; Boutry, N.; Chantelot, C.; Cotten, A. Imaging Assessment of Thoracic Outlet Syndrome. Radiographics 2006, 26, 1735–1750. [Google Scholar] [CrossRef] [Green Version]
- Likes, K.; Rochlin, D.H.; Call, D.; Freischlag, J.A. Coexistence of Arterial Compression in Patients With Neurogenic Thoracic Outlet Syndrome. JAMA Surg. 2014, 149, 1240–1243. [Google Scholar] [CrossRef] [Green Version]
- Sanders, R.J.; Annest, S.J. Thoracic outlet and pectoralis minor syndromes. Semin. Vasc. Surg. 2014, 27, 86–117. [Google Scholar] [CrossRef]
- Raptis, C.A.; Sridhar, S.; Thompson, R.W.; Fowler, K.; Bhalla, S. Imaging of the Patient with Thoracic Outlet Syndrome. Radiographics 2016, 36, 984–1000. [Google Scholar] [CrossRef] [Green Version]
- Ersoy, H.; Steigner, M.L.; Coyner, K.B.; Gerhard-Herman, M.D.; Rybicki, F.J.; Bueno, R.; Nguyen, L.L. Vascular Thoracic Outlet Syndrome: Protocol Design and Diagnostic Value of Contrast-Enhanced 3D MR Angiography and Equilibrium Phase Imaging on 1.5- and 3-T MRI Scanners. Am. J. Roentgenol. 2012, 198, 1180–1187. [Google Scholar] [CrossRef]
- Esposito, M.D.; Arrington, J.A.; Blackshear, M.N.; Murtagh, F.R.; Silbiger, M.L. Thoracic outlet syndrome in a throwing athlete diagnosed with MRI and MRA. J. Magn. Reson. Imaging 1997, 7, 598–599. [Google Scholar] [CrossRef] [PubMed]
- Zhang, T.; Xu, Z.; Chen, J.; Liu, Z.; Wang, T.; Hu, Y.; Shen, L.; Xue, F. A Novel Approach for Imaging of Thoracic Outlet Syndrome Using Contrast-Enhanced Magnetic Resonance Angiography (CE-MRA), Short Inversion Time Inversion Recovery Sampling Perfection with Application-Optimized Contrasts Using Different Flip Angle Evolutions (T2-STIR-SPACE), and Volumetric Interpolated Breath-Hold Examination (VIBE). Med. Sci. Monit. 2019, 25, 7617–7623. [Google Scholar] [CrossRef] [PubMed]
- Hardy, A.; Pougès, C.; Wavreille, G.; Behal, H.; Demondion, X.; Lefebvre, G. Thoracic Outlet Syndrome: Diagnostic Accuracy of MRI. Orthop. Traumatol. Surg. Res. 2019, 105, 1563–1569. [Google Scholar] [CrossRef] [PubMed]
- Brownie, E.R.; Abuirqeba, A.A.; Ohman, J.W.; Rubin, B.G.; Thompson, R.W. False-negative upper extremity ultrasound in the initial evaluation of patients with suspected subclavian vein thrombosis due to thoracic outlet syndrome (Paget-Schroetter syndrome). J. Vasc. Surg. Venous Lymphat. Disord. 2020, 8, 118–126. [Google Scholar] [CrossRef] [PubMed]


| Age at Surgery | Affected Side | Cause or Occupation | Symptom | Duration of Illness (Years) | Classification of TOS | Co-Morbid Disease or Symptom | Satisfaction after Surgery | |
|---|---|---|---|---|---|---|---|---|
| 1 | 37 | L | Baseball | Numbness after throwing | 2 | Disputed neurogenic | Good | |
| 2 | 15 | R | Baseball | Numbness after throwing | 2 | Disputed neurogenic | Good | |
| 3 | 41 | R | Baseball | Numbness after throwing | 4 | Disputed neurogenic | Good | |
| 4 | 17 | R | Baseball | Numbness after throwing | 2 | Disputed neurogenic | UCL injury of same side elbow | Excellent |
| 5 | 20 | R | Baseball | Numbness after throwing | 2 | Disputed neurogenic | Good | |
| 6 | 19 | R | Baseball | Numbness after throwing | 3 | Disputed neurogenic | Good | |
| 7 | 14 | R | Tennis | Numbness and pain | 2 | Disputed neurogenic | Excellent | |
| 8 | 40 | R | Reseaercher | Cold sensation and numbness | 5 | Arterial | Skin lesion of fingers, upper limb weakness | Excellent |
| 9 | 43 | L | Office worker | Cold sensation and numbness | 3 | Arterial | Numbness after jogging | Excellent |
| 10 | 15 | R | Malformation of first rib | Cold sensation and numbness | 2 | Arterial | Malformation of first rib | Excellent |
| 11 | 56 | L | Service industry | Cold sensation and numbness | 6 | Disputed neurogenic | Post operation of cervical stenosis | Good |
| 12 | 32 | L | Traffic accident | Numbness and pain | 2 | Disputed neurogenic | Fair | |
| 13 | 48 | R | Service industry | Numbness and pain | 6 | Disputed neurogenic | Excellent | |
| 14 | 47 | R | Nurse | Numbness and pain | 5 | Disputed neurogenic | Good | |
| 15 | 22 | L | Office worker | Numbness and pain | 3 | Disputed neurogenic | Good | |
| 16 | 51 | L | Care worker | Numbness and pain | 15 | Disputed neurogenic | Post operation of same side cubital tunnel syndrome | Good |
| 17 | 26 | L | Service industry | Numbness and pain | 4 | Disputed neurogenic | Good | |
| 18 | 24 | R | Service industry | Numbness and pain | 4 | Disputed neurogenic | Excellent | |
| 19 | 55 | L | Construction industry | Numbness and pain | 4 | Disputed neurogenic | Fair | |
| 20 | 53 | L | Forestry industry | Numbness and pain | 5 | Disputed neurogenic | Good | |
| 21 | 44 | L/R | Unemployed | Numbness and pain | 10 | Disputed neurogenic | Post operation of cervical stenosis | Good |
| Grade 0 | Grade 1 | Grade 2 | Grade 3 | p-Value | ||
|---|---|---|---|---|---|---|
| SCV | Surgery (n = 22) Conservative (n = 91) | 0 5 | 3 35 | 4 20 | 15 31 | 0.0113 |
| SCA | Surgery (n = 22) Conservative (n = 91) | 11 59 | 7 22 | 2 8 | 2 2 | 0.33 |
| Surgery (%) n = 22 | Conservative (%) n = 91 | p-Value | |
|---|---|---|---|
| SCV | 76.7 | 67.7 | 0.036 |
| SCA | 34.6 | 28 | 0.21 |
| Nerve bundle | 34.5 | 34.5 | 0.53 |
| Surgery (n = 7) Conservative (n = 24) | Affected Side | Normal Side | p-Value | |
|---|---|---|---|---|
| SCV | Surgery Conservative | 66.7 67.1 | 74.4 66.9 | 0.20 0.47 |
| SCA | Surgery Conservative | 47.4 29.3 | 28.5 32.5 | 0.064 0.28 |
| Nerve bundle | Surgery Conservative | 46.0 74.8 | 40.3 71.2 | 0.24 0.36 |
Disclaimer/Publisher’s Note: The statements, opinions and data contained in all publications are solely those of the individual author(s) and contributor(s) and not of MDPI and/or the editor(s). MDPI and/or the editor(s) disclaim responsibility for any injury to people or property resulting from any ideas, methods, instructions or products referred to in the content. |
© 2023 by the authors. Licensee MDPI, Basel, Switzerland. This article is an open access article distributed under the terms and conditions of the Creative Commons Attribution (CC BY) license (https://creativecommons.org/licenses/by/4.0/).
Share and Cite
Ogawa, T.; Onishi, S.; Mamizuka, N.; Yoshii, Y.; Ikeda, K.; Mammoto, T.; Yamazaki, M. Clinical Significance of Maximum Intensity Projection Method for Diagnostic Imaging of Thoracic Outlet Syndrome. Diagnostics 2023, 13, 319. https://doi.org/10.3390/diagnostics13020319
Ogawa T, Onishi S, Mamizuka N, Yoshii Y, Ikeda K, Mammoto T, Yamazaki M. Clinical Significance of Maximum Intensity Projection Method for Diagnostic Imaging of Thoracic Outlet Syndrome. Diagnostics. 2023; 13(2):319. https://doi.org/10.3390/diagnostics13020319
Chicago/Turabian StyleOgawa, Takeshi, Shinzo Onishi, Naotaka Mamizuka, Yuichi Yoshii, Kazuhiro Ikeda, Takeo Mammoto, and Masashi Yamazaki. 2023. "Clinical Significance of Maximum Intensity Projection Method for Diagnostic Imaging of Thoracic Outlet Syndrome" Diagnostics 13, no. 2: 319. https://doi.org/10.3390/diagnostics13020319