Analysis of Vibration Plate Cracking Based on Working Stress

College of Mechanical Engineering, School of Chengdu Technological University, Chengdu 610071, China
*
Author to whom correspondence should be addressed.
Machines 2018, 6(4), 51; https://doi.org/10.3390/machines6040051
Submission received: 7 September 2018
/
Revised: 9 October 2018
/
Accepted: 10 October 2018
/
Published: 26 October 2018
(This article belongs to the Special Issue Smart Manufacturing)
Abstract
:At present, vibroseis has become the major technique to achieve environmental protection and high efficiency in fossil fuel exploration. During such exploration, a vibrator transmits seismic waves to the surface. The waves are excited by continuously changing the load stress from the burden of weight of the vehicle and the vibrator’s variable frequency load. This paper will apply a numerical simulation method to develop research on the analysis of vibration plate cracking based on working stress. Based on the structure and mechanism of vibroseis vibrator plate, a vibrator simulation model is built under system dynamics to develop research on the vibroseis plate load stress feature and gain distribution, and change pattern of the plate load stress. The results show that stress response around the upright welding of is high, and there is evident distortion in plate area, which matches the actual fracture position on the plate, and can be confirmed as a key area of plate fatigue.
1. Introduction
At present, China’s shallow oil and gas resources are gradually being exhausted, so oil and gas exploration is gradually moving to areas with complex topographies and harsh environments, such as the Gobi desert, mountainous areas, and the ocean [1]. In these areas of petroleum exploration and development, oil and gas exploration technology has been unable to meet the current reliability, safety, environmental protection, and efficient exploration acquisition requirements. Now, more efficient, environmentally friendly, and safe exploration technology is needed; therefore, the seismic method is also proposed. At present, seismic exploration signal sources cause significant damage to the environment [2]; however, vibroseis serves as a non-explosive source, which is not destructive to the environment or living creatures, as are the output of seismic signals generated by explosion sources. More importantly, though larger than the source of power in a short period of time to produce high-energy, vibroseis uses low power, and requires a long time for scanning excitation. During scanning, the continuous variation of the sinusoidal vibration waveform is known; vibroseis is therefore more accurate and controllable than explosion sources [3].
Vibroseis has the following advantages:
- The seismic signal excited by vibroseis is controllable. Vibroseis can be used to independently choose the appropriate excitation frequency width according to the working environment, thus improving the signal excitation quality. The direction of the output force is also controllable; vibroseis can reduce the energy loss in other directions and increase the signal-to-noise ratio (SNR) of the vibroseis excitation signal.
- Vibroseis uses continuous excitation signals. According to the requirements, vibroseis can be used to control the vibrator to continuously make contact with the earth within a few seconds, and generate the required signal waveform. The repeated superposition of the signal can eliminate a large amount of random external interference, so as to obtain high-SNR data.
- Vibroseis is not destructive to the environment or organisms. Vibroseis is a low-power method which can efficiently complete the exploration of deep-stratum oil and gas reservoirs in cities, dykes, industrial areas, and other areas where it is inconvenient to use explosives.
- Vibroseis uses Combined Excitation Technology to effectively suppress the linear interference energy during operation.
- Vibroseis can be operated without drilling, which improves the mobility and reduces a lot of costs [4].
At present, vibroseis has become the first choice for oil and gas exploration in areas with harsh environments, complex topographies, and high environmental protection requirements. Wei established the finite element model of the vibrator plate and geo-coupling, and studied the influence of the plate and the geo-coupling on vibroseis performance [4,5]. Ding compared and analyzed the characteristics and performance of different vibrator plates, and put forward suggestions for their structural design [6]. Zhuang Juan derived a dynamical equation of high-frequency vibroseis, and analyzed the effect of plate area, plate mass, and soil medium density on the amplitude and frequency characteristics of the vibroseis output signal [7]. The literature above mainly studied the relationship between the macro characteristics of the plate and the output signal, but lacked microscopic and quantitative analysis.
At present, research on vibration plate performance mainly focuses on single frequencies. However, the excitation signal of vibroseis is a sinusoidal scanning signal, whose frequency increases linearly with time. In practice, the response performance of the plate at different scanning frequencies is different. The difference in plate response affects the stability of vibrator response performance at full frequency, and restricts the development of vibroseis in terms of broadband and precision. Therefore, it is necessary to carry out multi-frequency response analysis of the plate in order to master the response change rule at different scanning frequencies, so as to provide guidance for the structural design of the plate.
2. Structure and Working Principle of the KZ-28 Vibroseis Vehicle
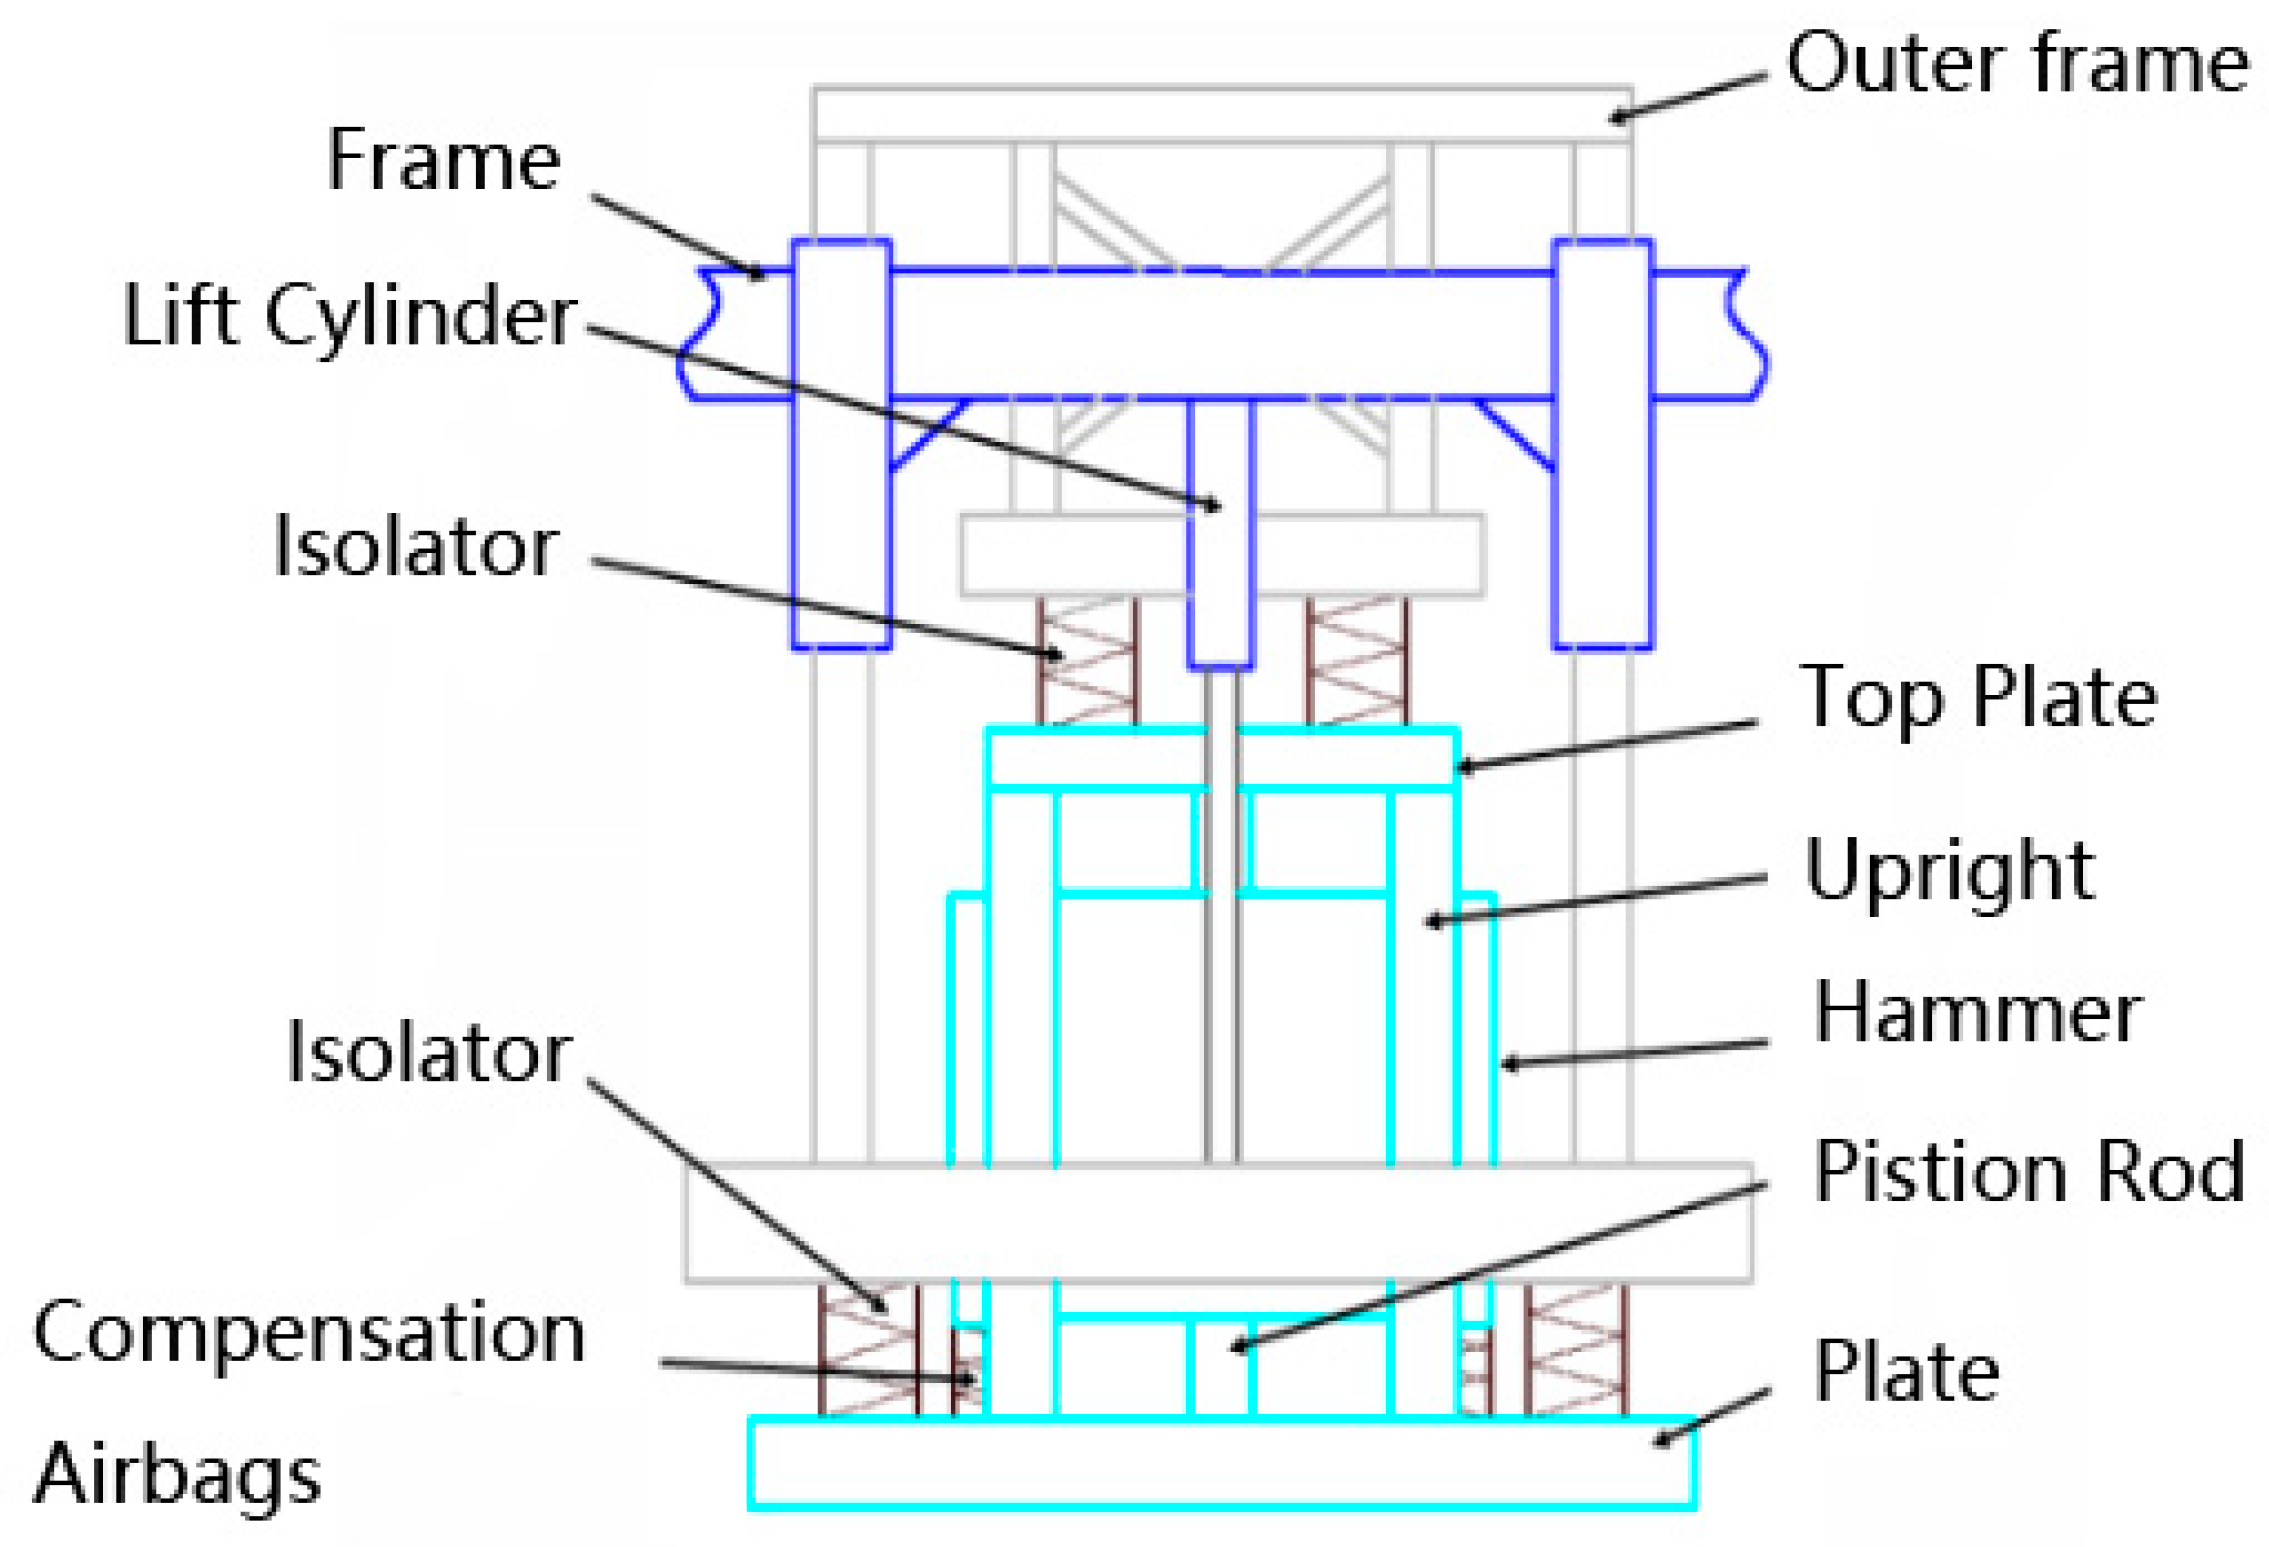
Vibroseis mainly consists of a vibrator body and a vibrator. The vibrator is installed in the central position of the vibrator car, as shown in Figure 1.
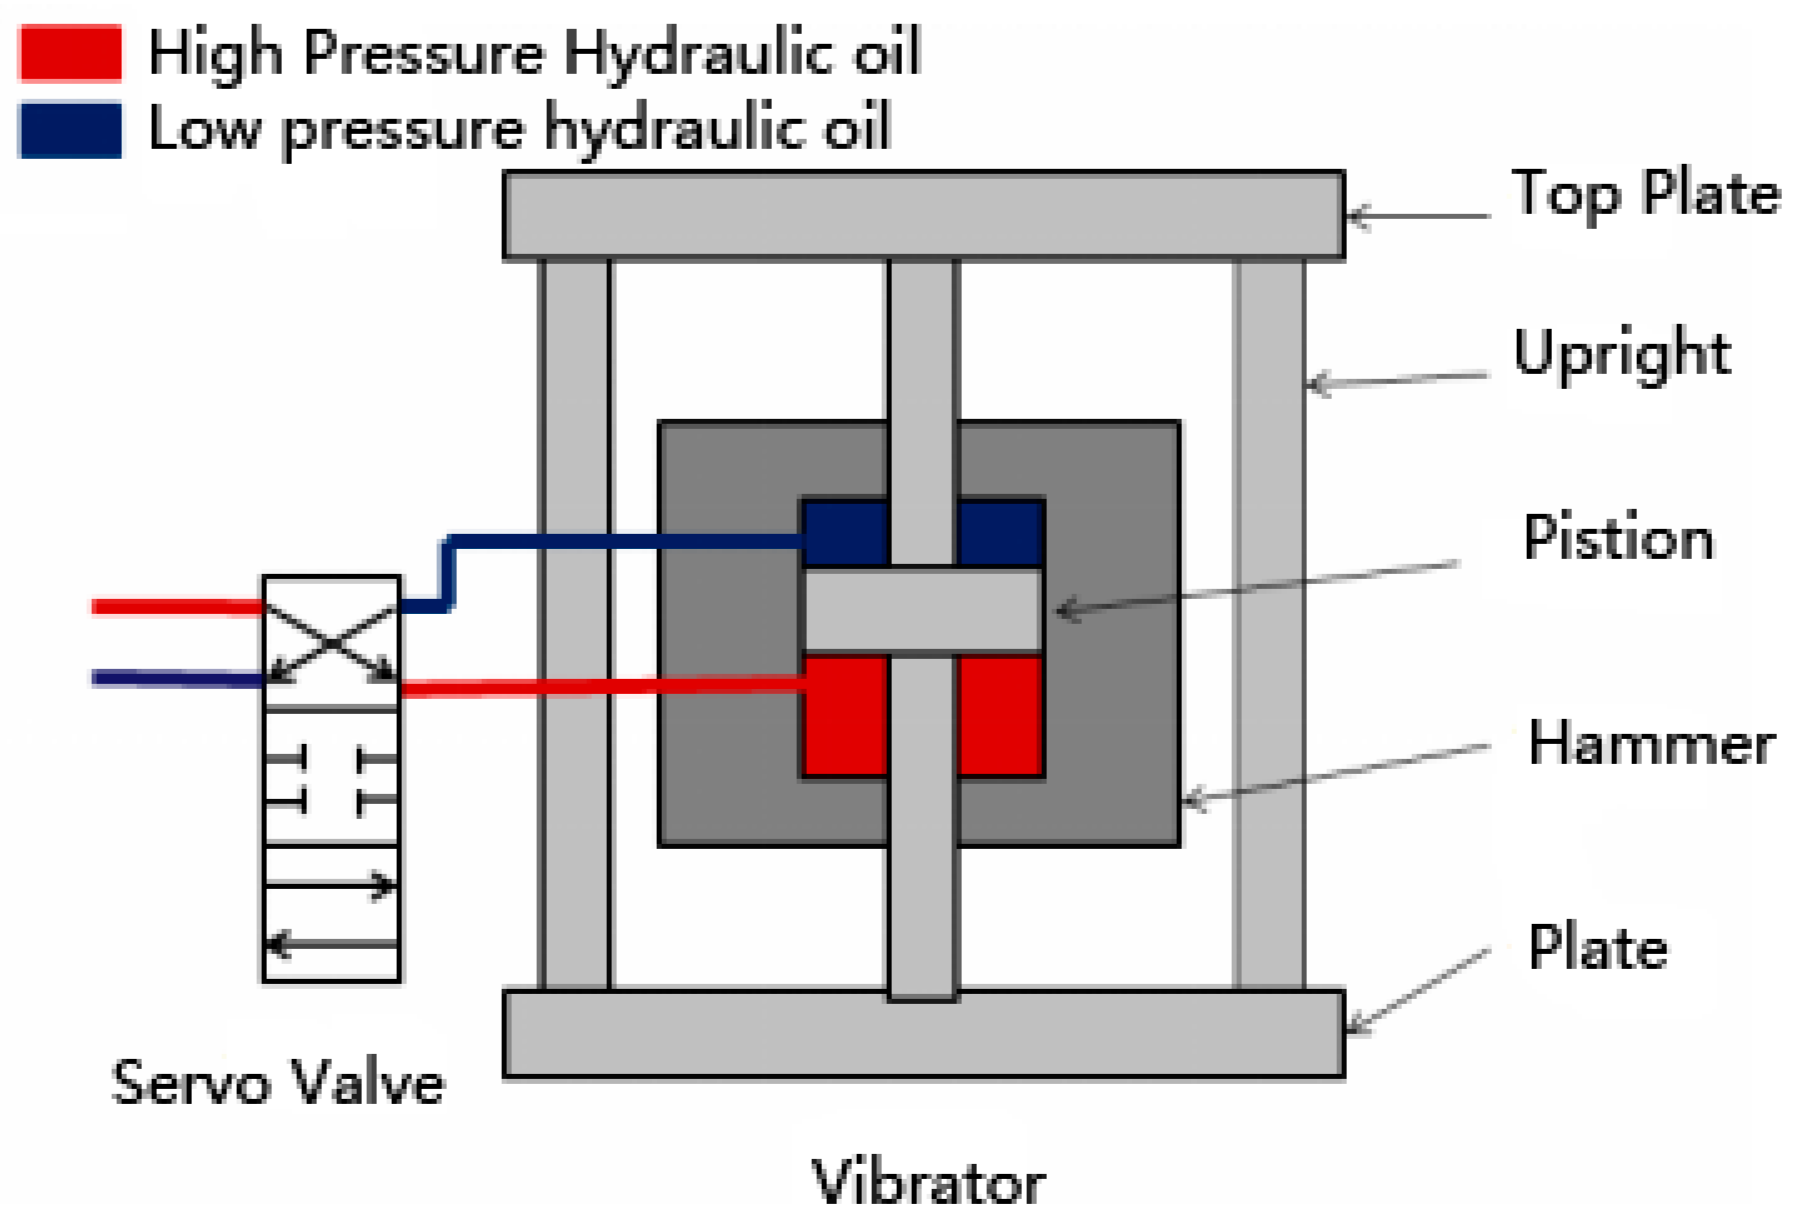
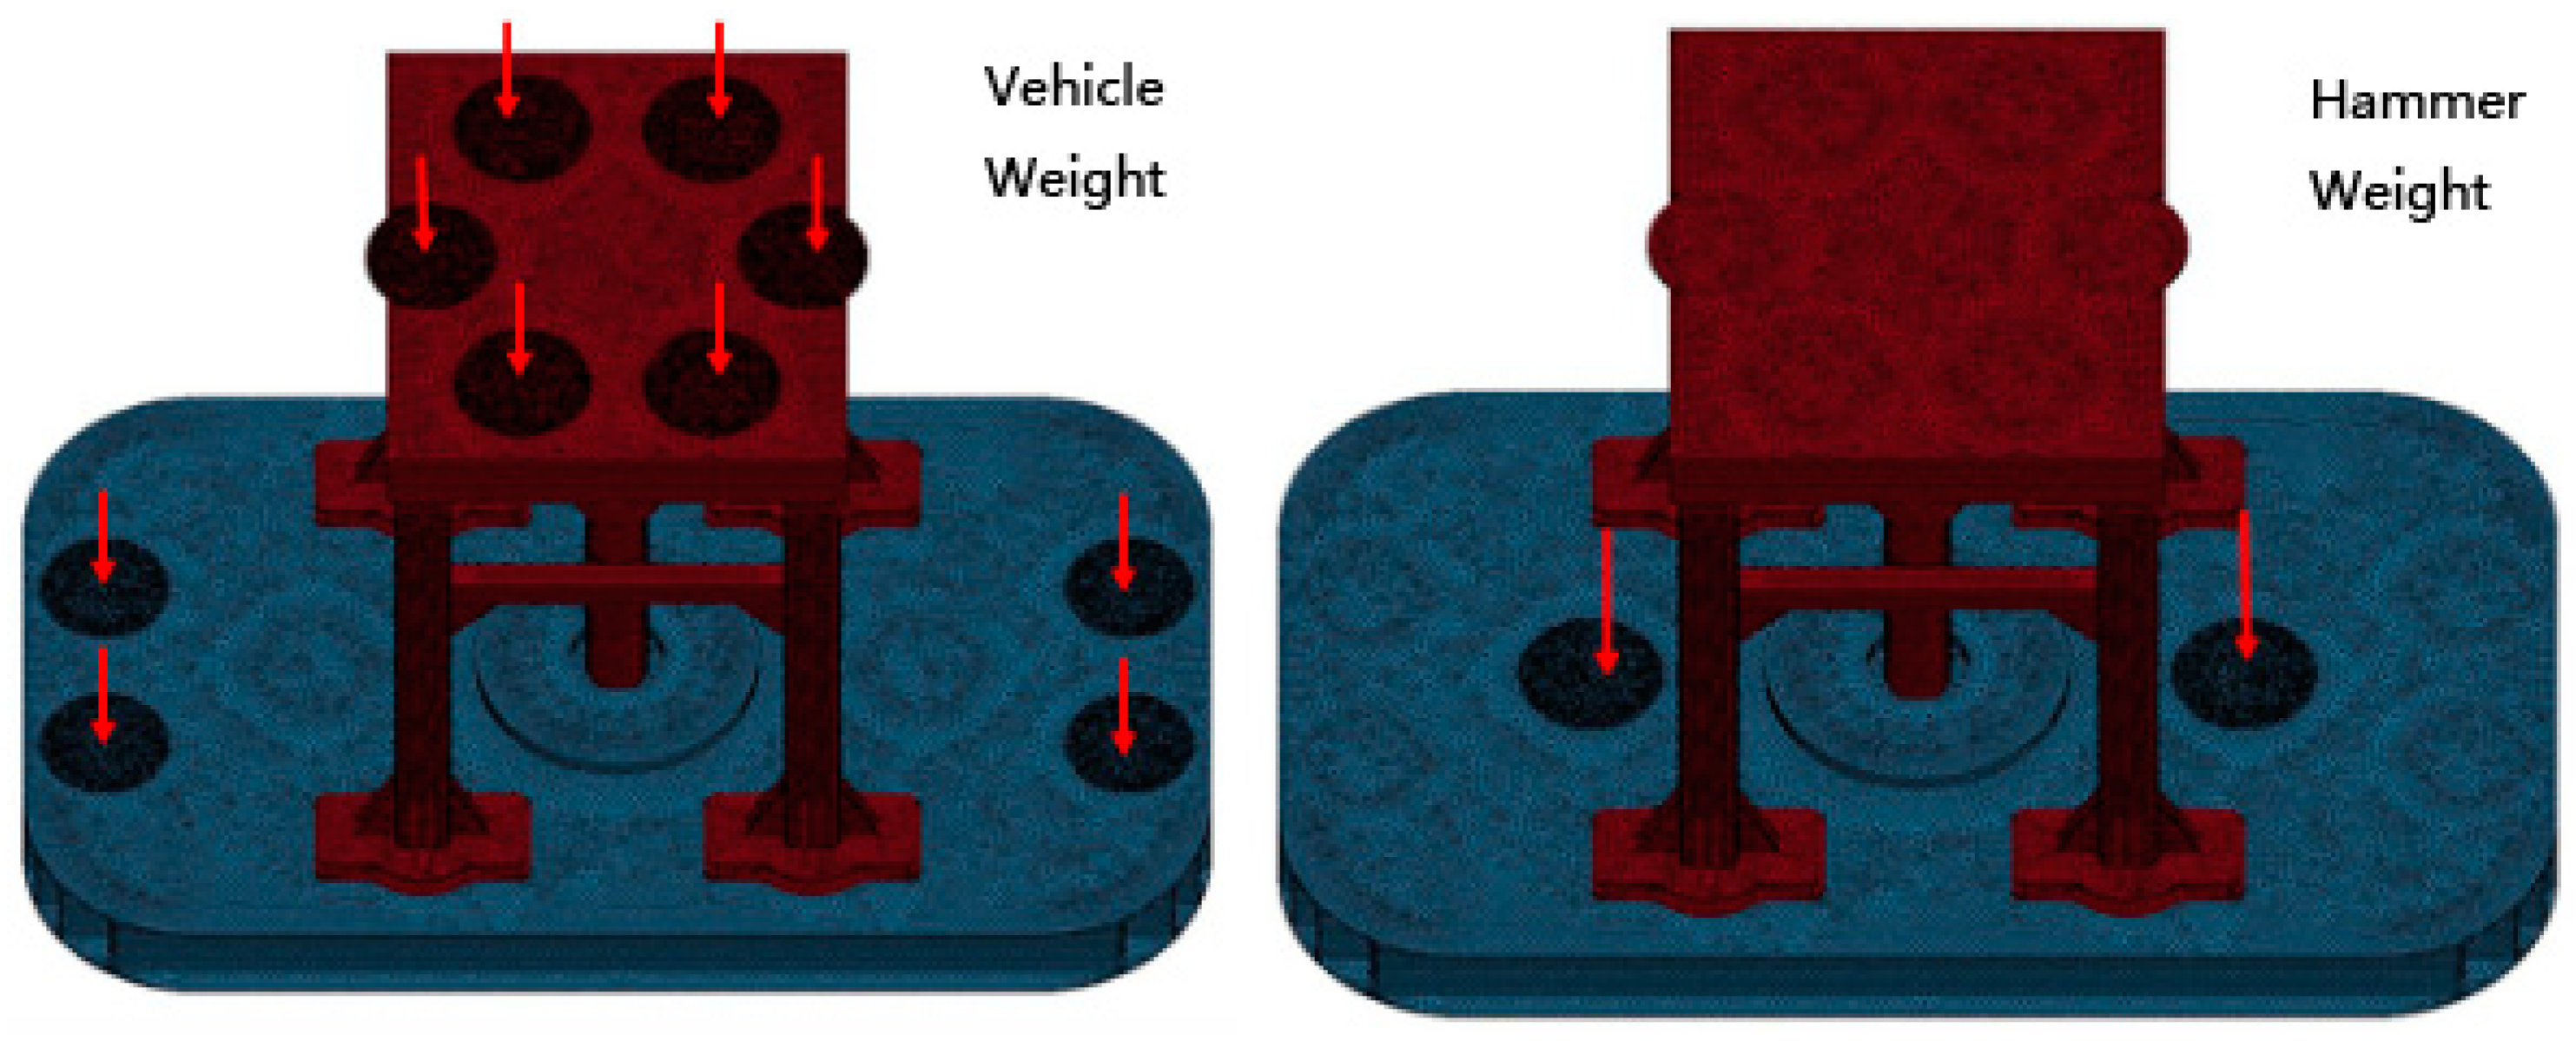
When a vibroseis vehicle moves, the lifting hydraulic cylinder lifts the vibrator and separates it from the ground [8]. As shown in Figure 2, at the beginning of the process, the lifting hydraulic cylinder transfers the vibrator and jacks up the car body, and the whole weight of the vibroseis vehicle acts upon the roof and plate of the vibrator through a vibration isolation air bag. When the vibroseis is working, the servo valve opens. The high-pressure hydraulic oil produced by the hydraulic system alternately enters the upper and lower cavity between the hammer and the piston rod, causing the hammer to move up and down. The reaction of hydraulic oil produced by the piston rod is passed to the tablet, and the signals produced by the vibrators are also passed to the earth, thereby exciting seismic waves [9,10].
3. The Vibrator Cracking Problem
The vibrator is the key excitation device for the vibroseis seismic signal. The plate is an important component which connects the vibroseis and the ground; the column supports the car body and transfers the load. The column is fixed to the plate by welding.
In 2016, a group of vibroseis vehicles which had been sent to Saudi Arabia by Bureau of Geophysical Prospecting INC, experienced cracks in the plate weld during operation. As shown in Figure 3, the weld toe of the welding position between the vertical column and the plate was cracked (the position of the red line). At the time of the accident, the vehicle was exploring in the desert [10].
It can be concluded by analyzing the causes of plate weld cracking that the weld structure is closed, and the deformation near the welding is not uniform, resulting in large tensile stress, which is one of the main reasons for the initiation of weld cracks.
When the vibrator is operating, under the effect of seismic wave excitation, the plate is affected by its own weight and by vibrating force at the same time; working stress is therefore generated. Additionally, the weld joint (especially in the weld toe) is prone to high tensile stress under the effect of vibrator working load, and fatigue cracks easily arise in this position [11,12].
4. Establishment of Finite Element Model for Working Stress Analysis of Vibrator Plate
By analyzing the structure and working characteristics of the KZ-28 vibroseis vibrator, we decided to use a simulation analysis to solve the problem of cracking. At present, there is a new method of analysis: Nguyen-Thanh et al. presented a new concurrent simulation approach to couple isogeometric analysis (IGA) with the mesh-free method for studying crack problems. The convergence rate of the present method is higher than that of the traditional method. However, the Gaussian integration of weak form is computationally expensive in the mesh-free sub-domain [13]. Therefore, we still choose the traditional method; the model has been established in ANSYS LS-DYNA, and the vibrator is simplified [14,15]:
- Simplify the hammer and its accessories without considering the weight of the hammer and the impact action when the hydraulic oil drives the hammer. Remove the hammer and its accessory parts in the analysis; the hammer force and dynamic hydraulic load are directly loaded into the vibrator model as the known load.
- Simplify the piston base of I-steel plate. According to the plate structure, the piston rod base is installed in the middle of the plate, which is used to connect the piston rod and I-steel plate. For the convenience of the analysis, this was simplified into solid cylindrical structure.
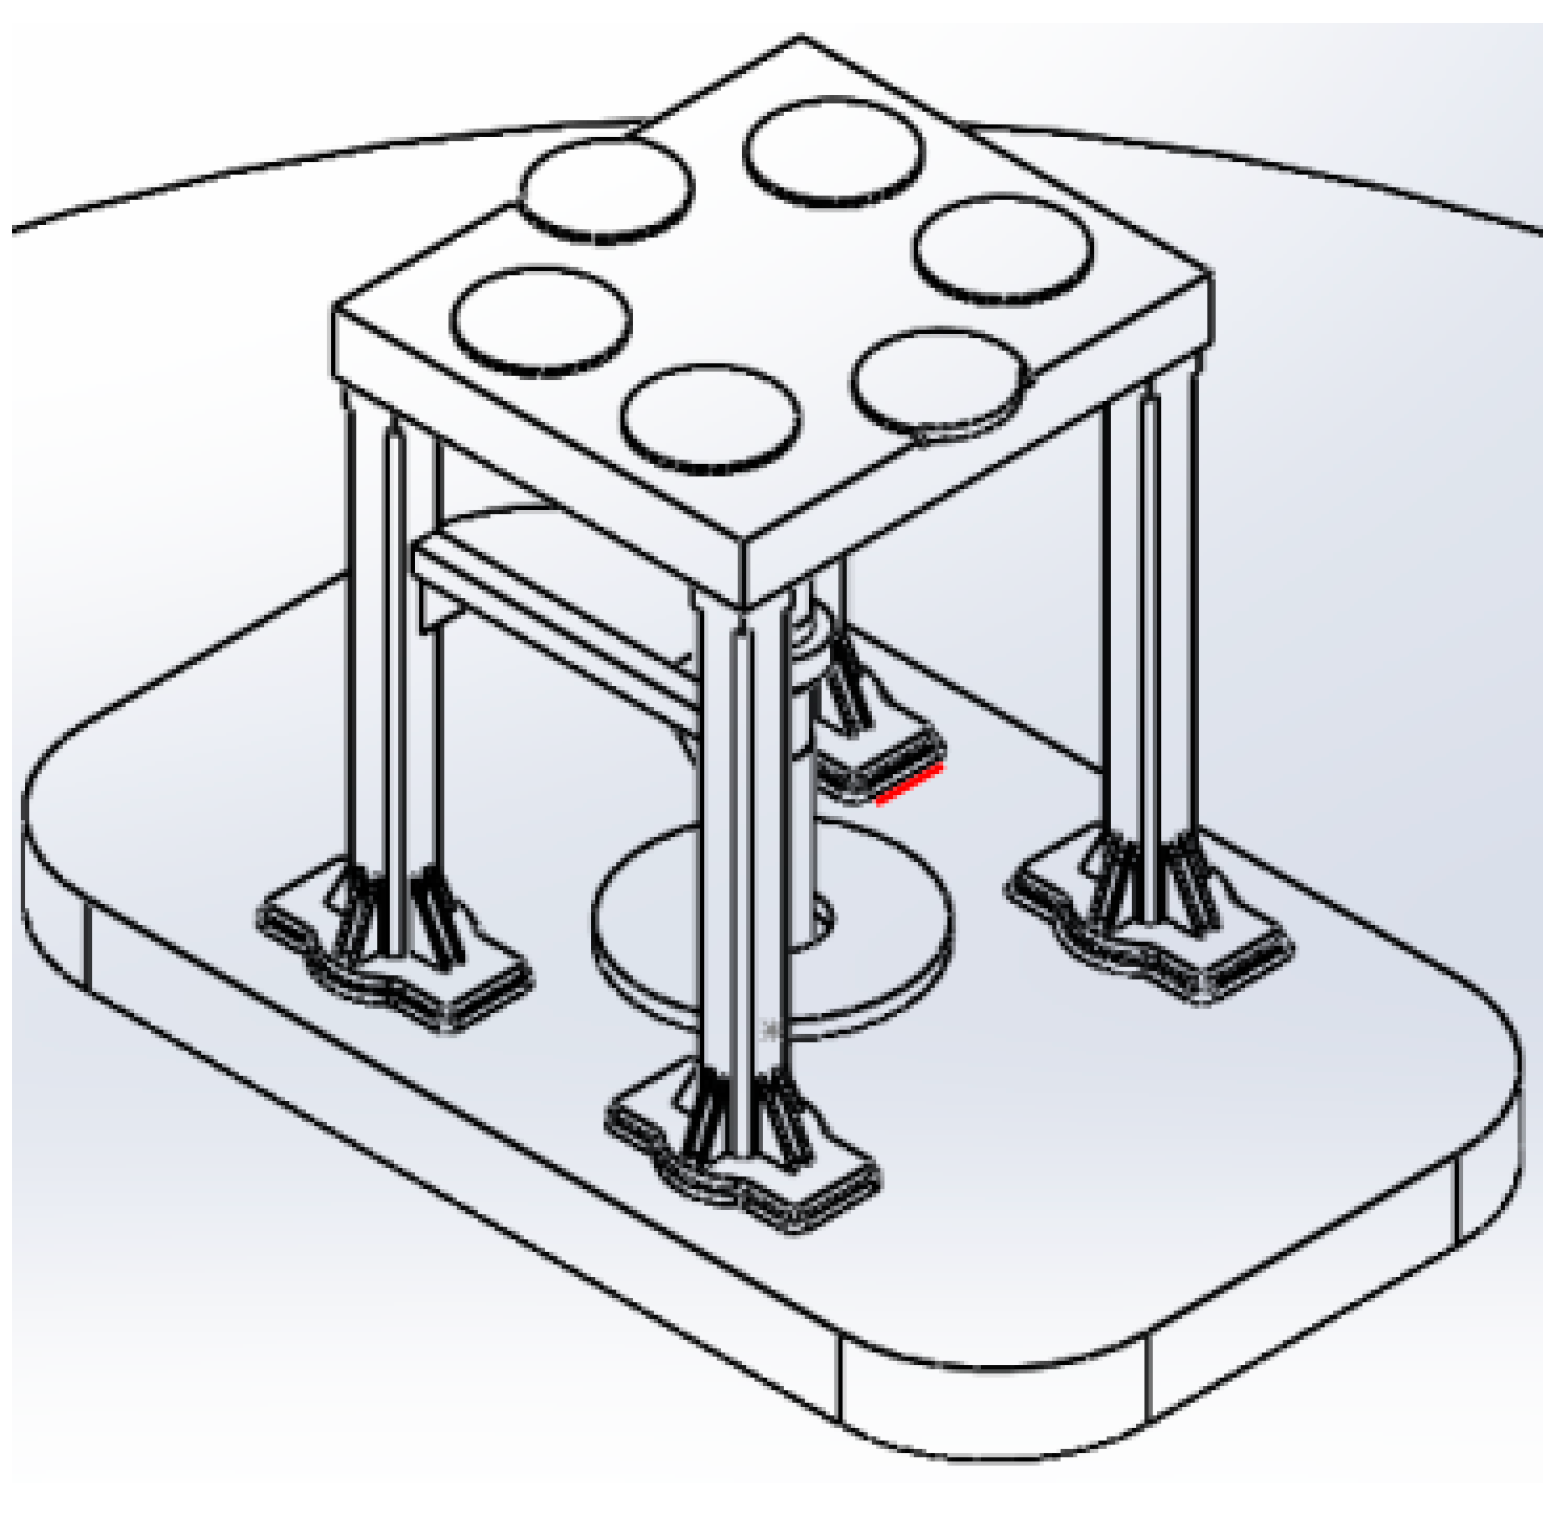
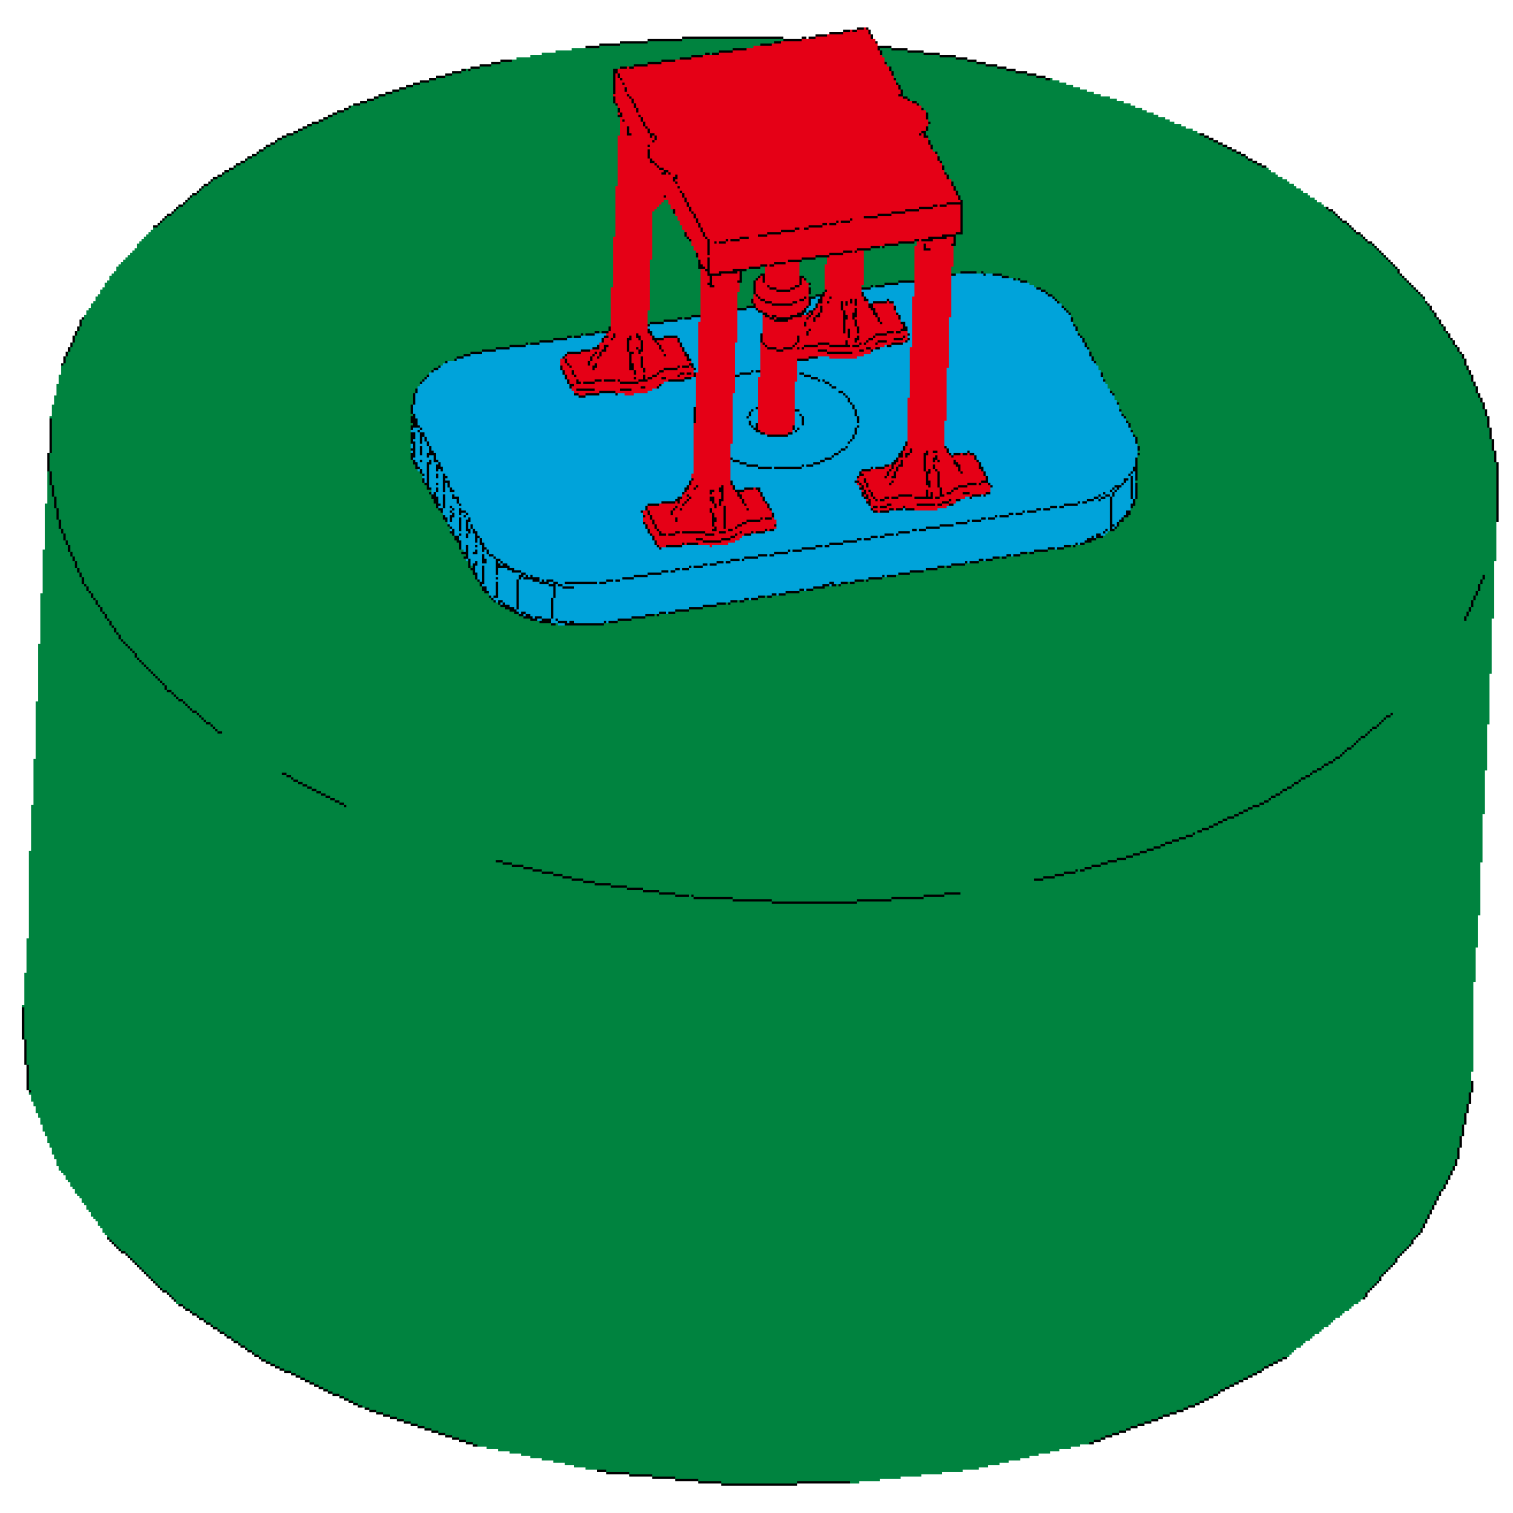
- The vibrator needs to be in contact with the ground during operation. Therefore, it is necessary to establish a ground model. However, the size cannot be unlimited; therefore, at the time of the earth model size selection, the size should be considered so as not to affect the deformation of the vibrator plate. Through repeated with different sizes of earth model, and considering the calculation time and accuracy, it was eventually determined that the optimal values were: diameter of the earth model, 5 m, and height, 2.5 m. The completed geometric model of the vibrator is shown in Figure 4.
In the analysis process, the size of the cell will cause grid-dependent numerical instability. In order to guarantee accuracy, the size of the flat cell was set to 6 mm, and the total number of grids was 119,988. The rest of the vibrator is not analyzed in detail, so the tetrahedral element with low calculation accuracy and fast calculation speed is selected for mesh division. The tetrahedral elements are 8–20 mm in size. The total number of grids after grid partitioning was 432,876. Since the vibrator plate is in contact with the ground, in order to improve the calculation accuracy, in the ground model a hexahedral mesh of equal size was adopted for the part that is in contact with the vibrator, while a larger tetrahedral mesh was adopted for the part that is not in contact with the vibrator. The total number of meshes after ground grid partitioning was 252,159. The material messages of the vibrator and earth are shown in Table 1.
Considering the actual situation, the simulated geodetic model is an elastic half-space, and the non-reflecting boundary conditions of the LS-DYNA software can simulate the effect of infinite earth. Therefore, the contact between the plate and the ground is defined as slide contact [17].
There are two kinds of loads on the vibrator, as described below:
- (1)
- Static load (Figure 6 shows the loading diagram of static load).
The static load is mainly caused by the car body; its purpose is to ensure that the flat plate can stay close to the ground under the huge working load without deformation. The weight of the car body is 28 t, of which 90% uniformly acts on the shock absorber air pad of the roof, and the roof is transferred to the flat plate through the vertical column. The remaining 10% comes from the hammer [18,19].
- (2)
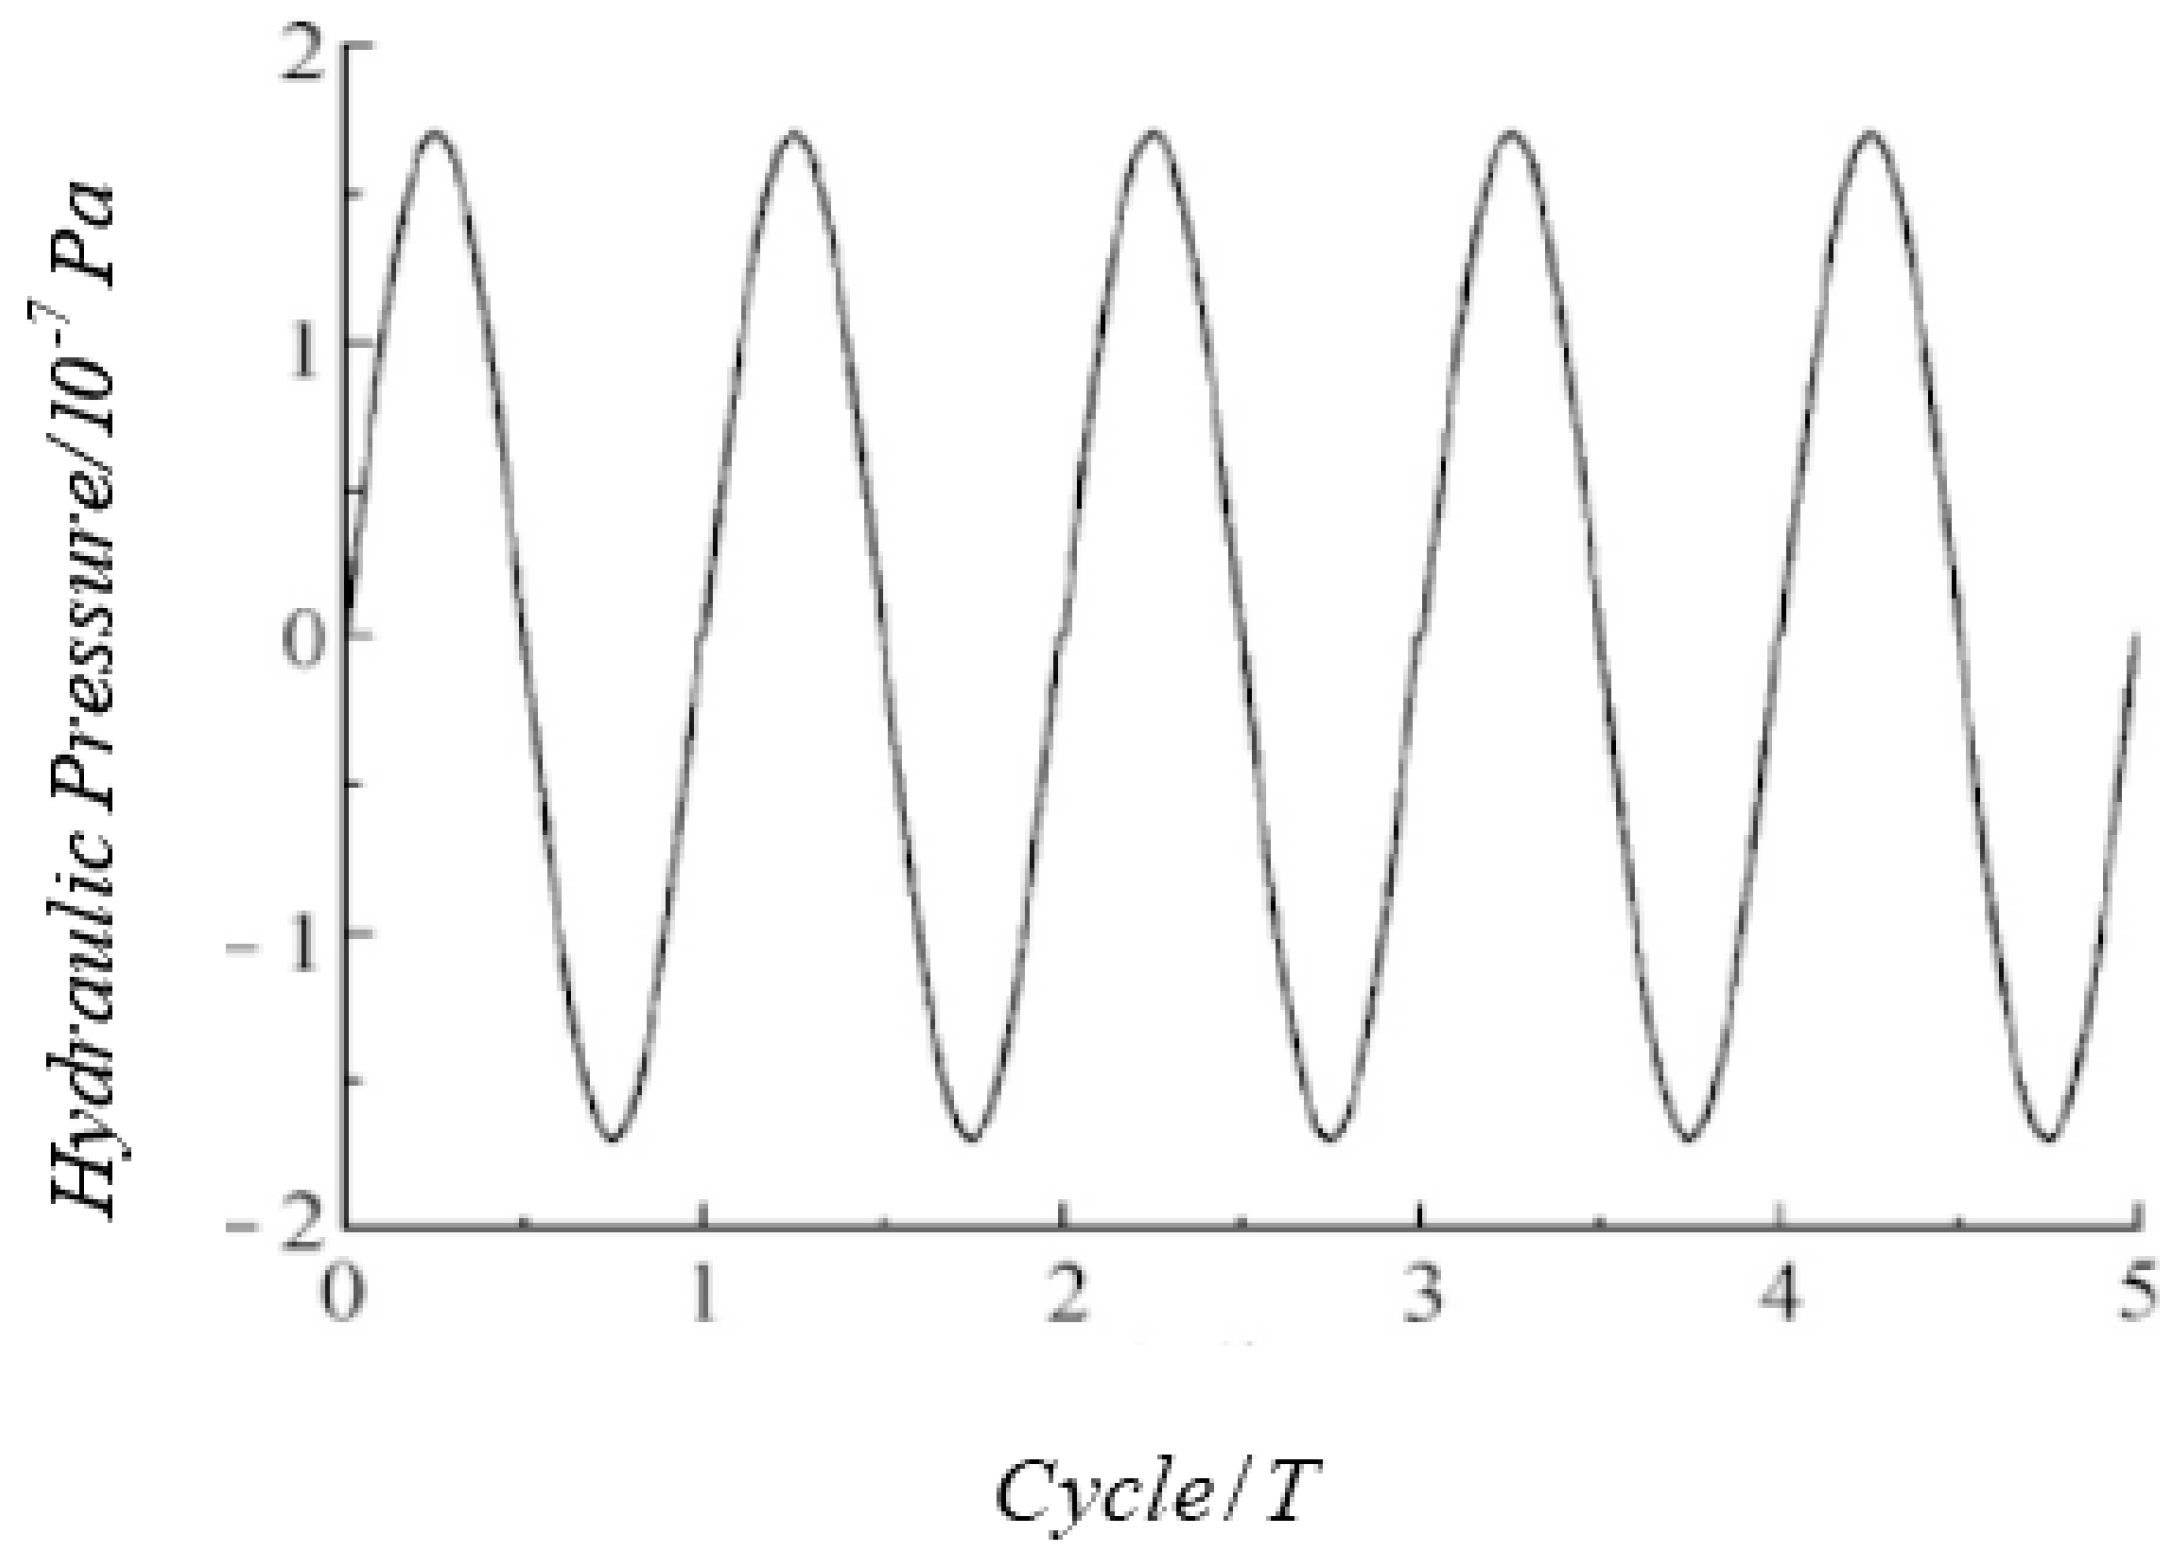
- Dynamic load
The size and variation of dynamic loads are shown in Figure 7. The initial analyzed frequency in this study is 80 Hz, and the loading time is five cycles. The dynamic liquid pressure on the upper and lower end surfaces of the piston rod of the vibrator is consistent with the changing law of linear scanning signal. The rated peak pressure of hydraulic oil is 20 MPa. In the construction process, in order to ensure that the output signal does not generate large distortion, the hydraulic pressure is generally selected as 70–85% of the rated peak value. Therefore, 85% of the rated peak value was selected in this paper, that is, the peak value of liquid pressure was 17 MPa. Additionally, due to the instability of the system at the initial stage of loading, the data under the stable system (after three periods) were analyzed [20].
5. Analysis of Working Stress of Vibrator Plate under Maximum Liquid Pressure
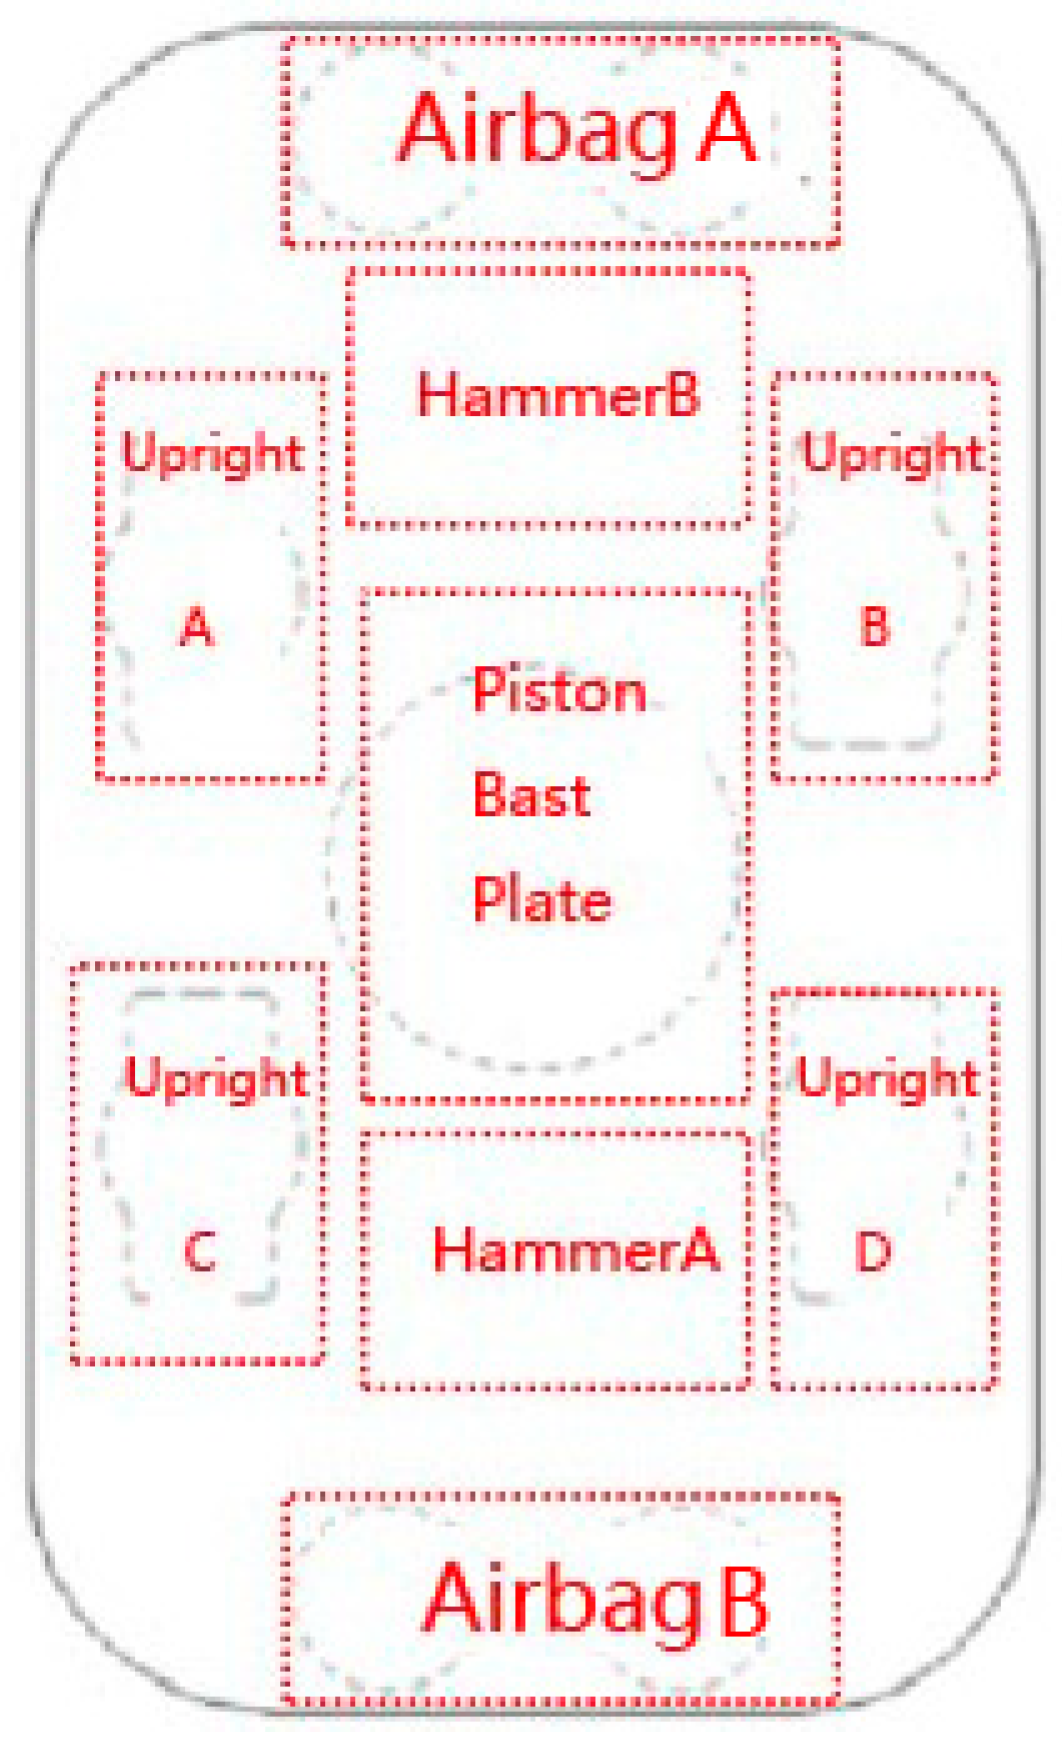
In Figure 8, in order to facilitate the study of the working stress of the vibrator plate, the plate area is divided into several parts for clarity of illustration.
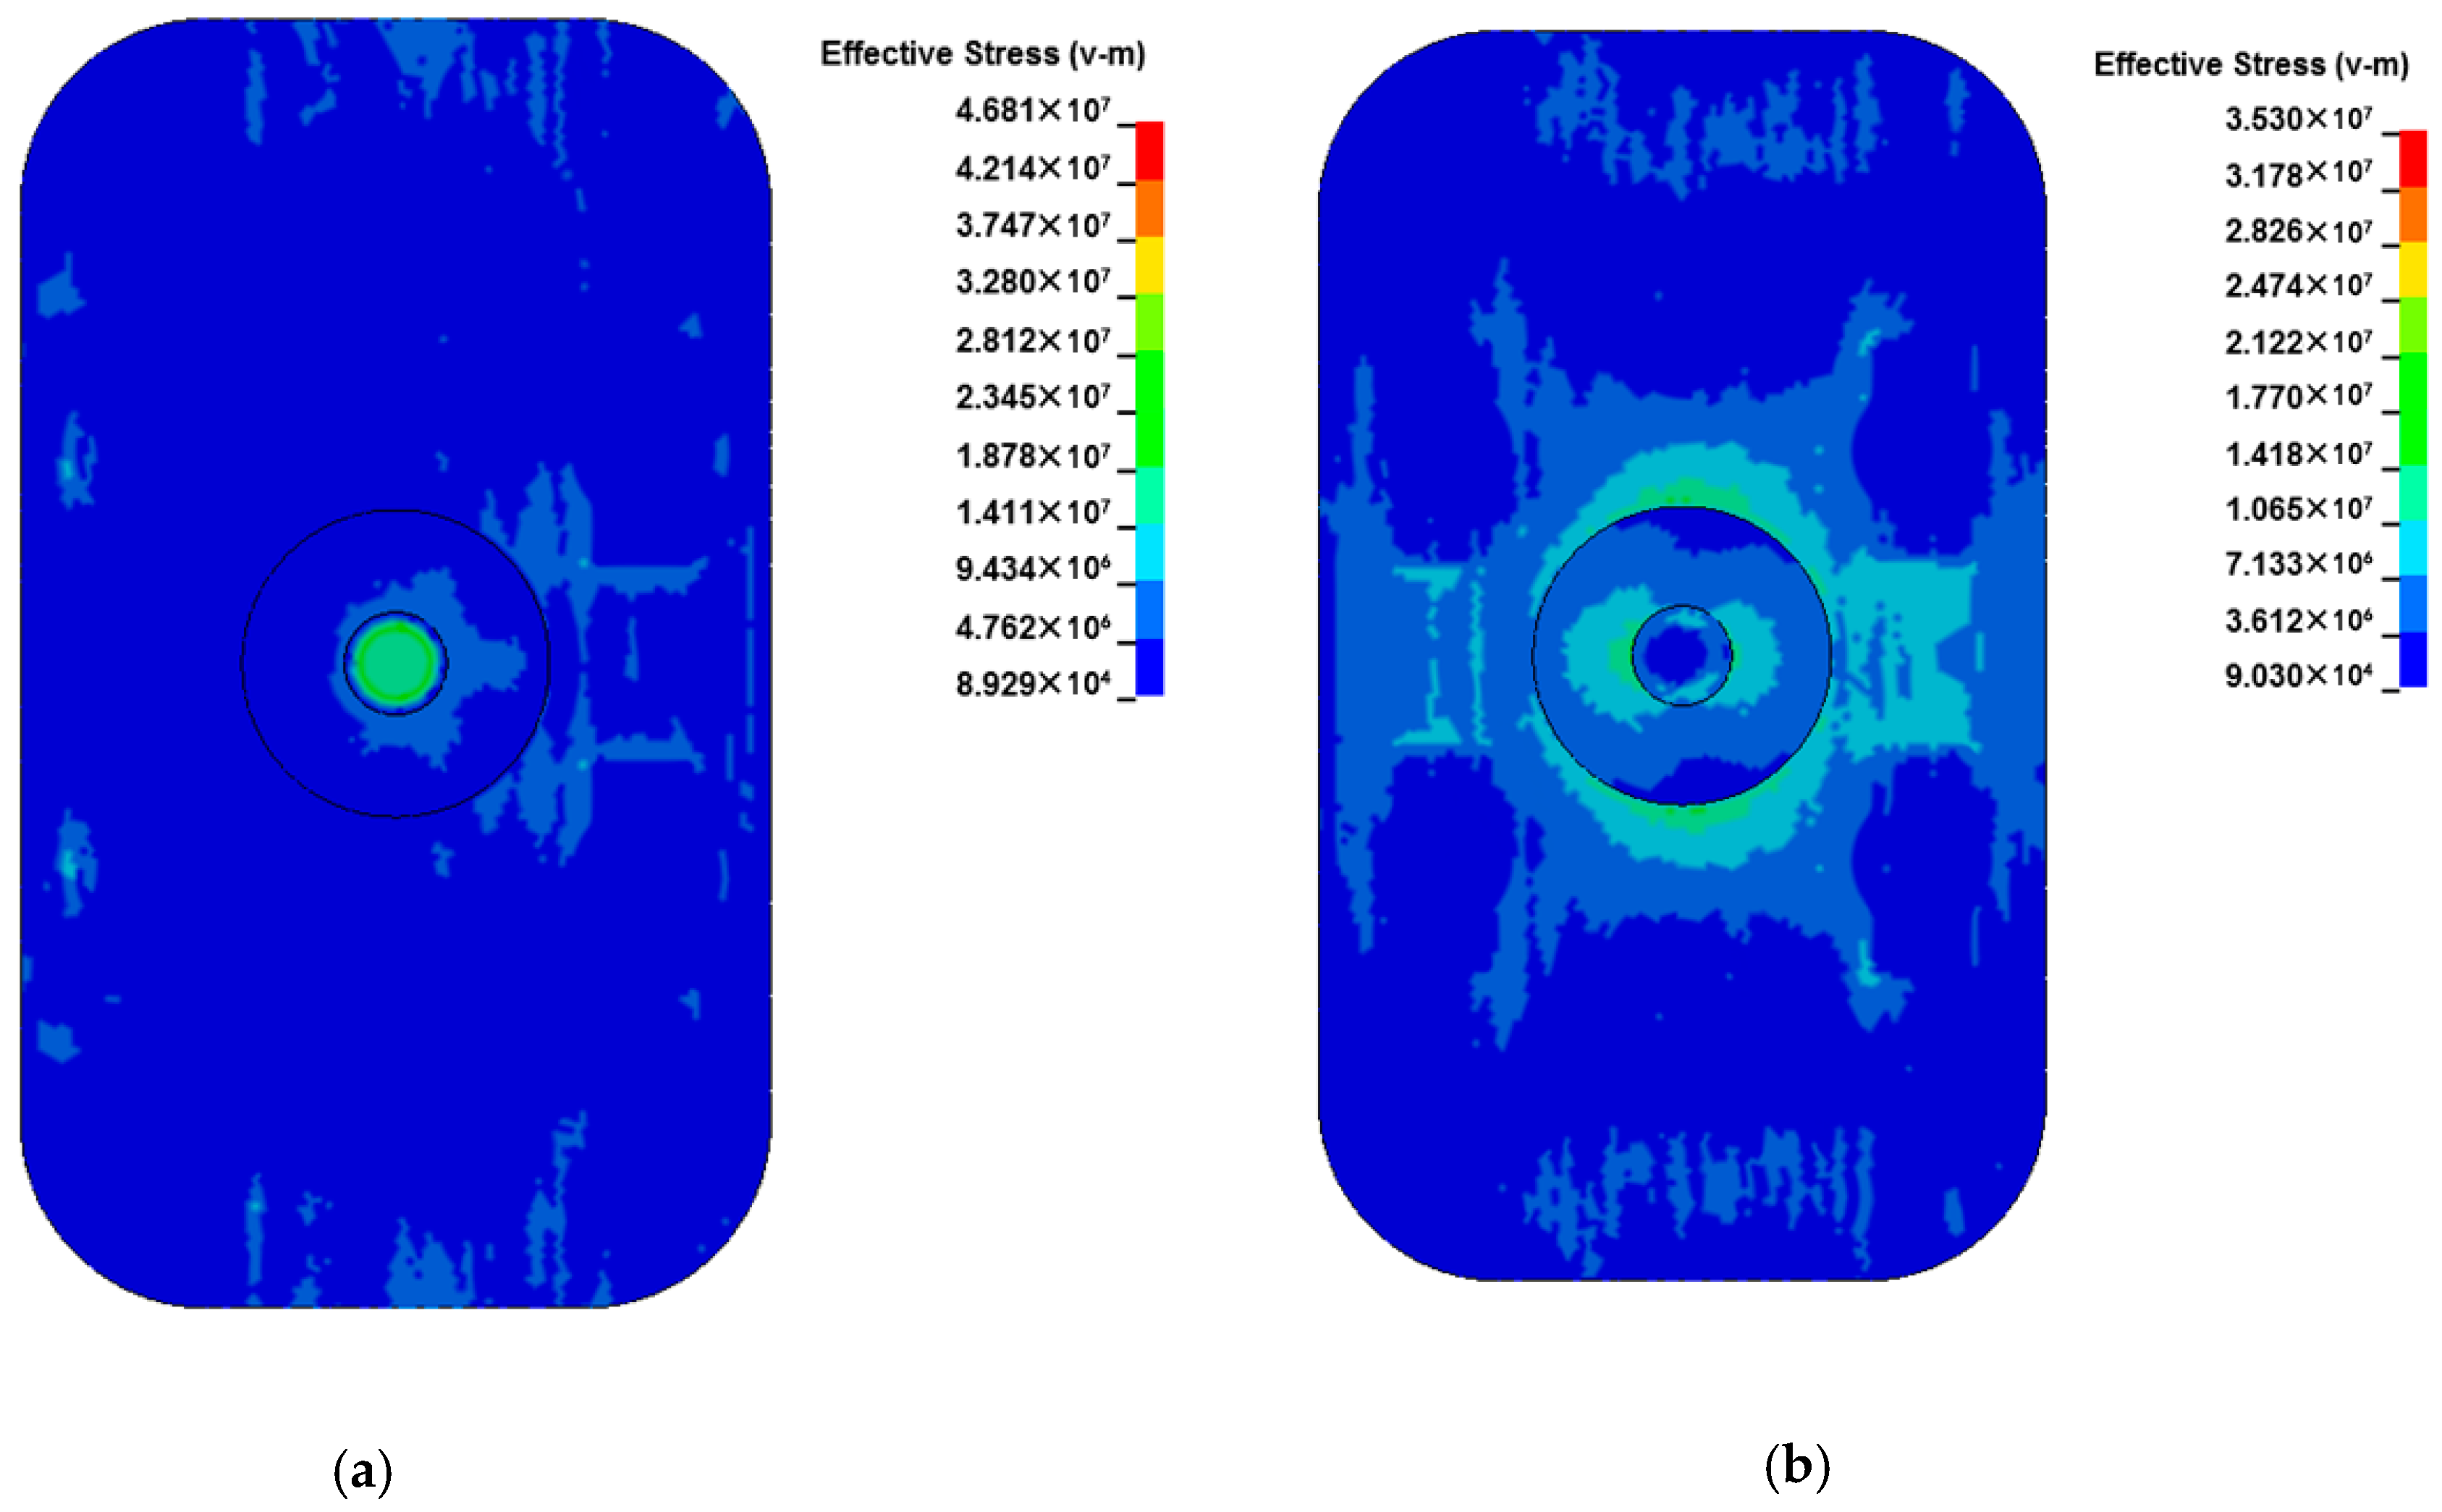
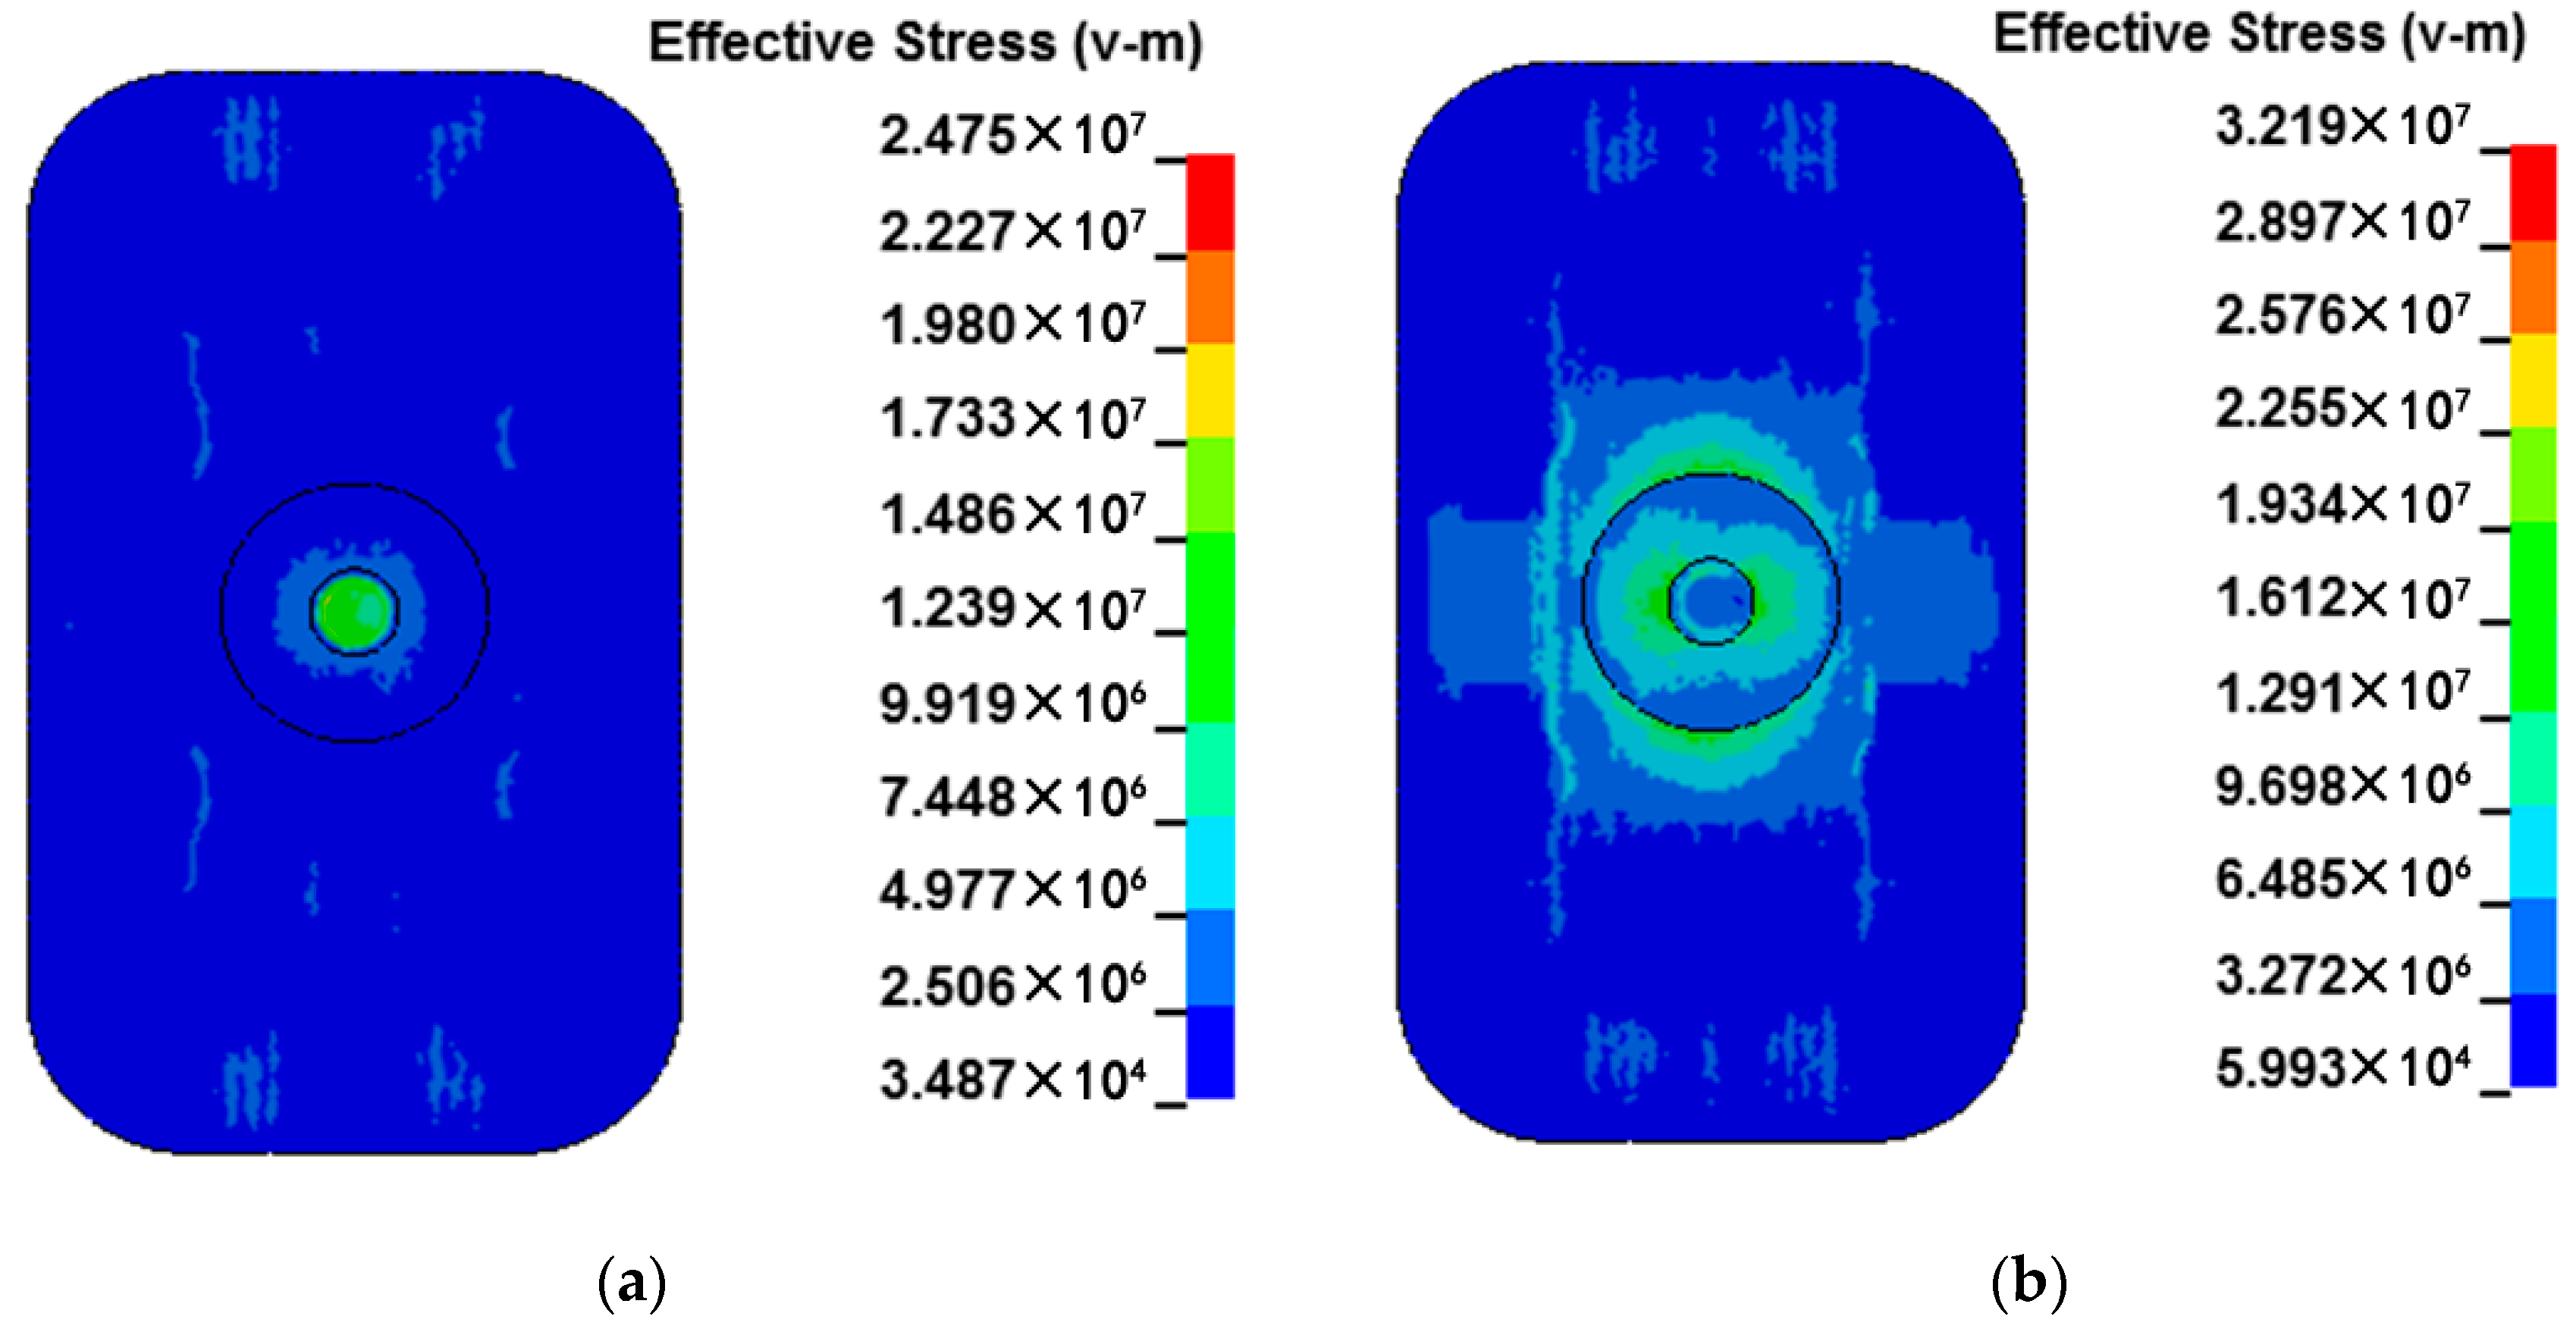
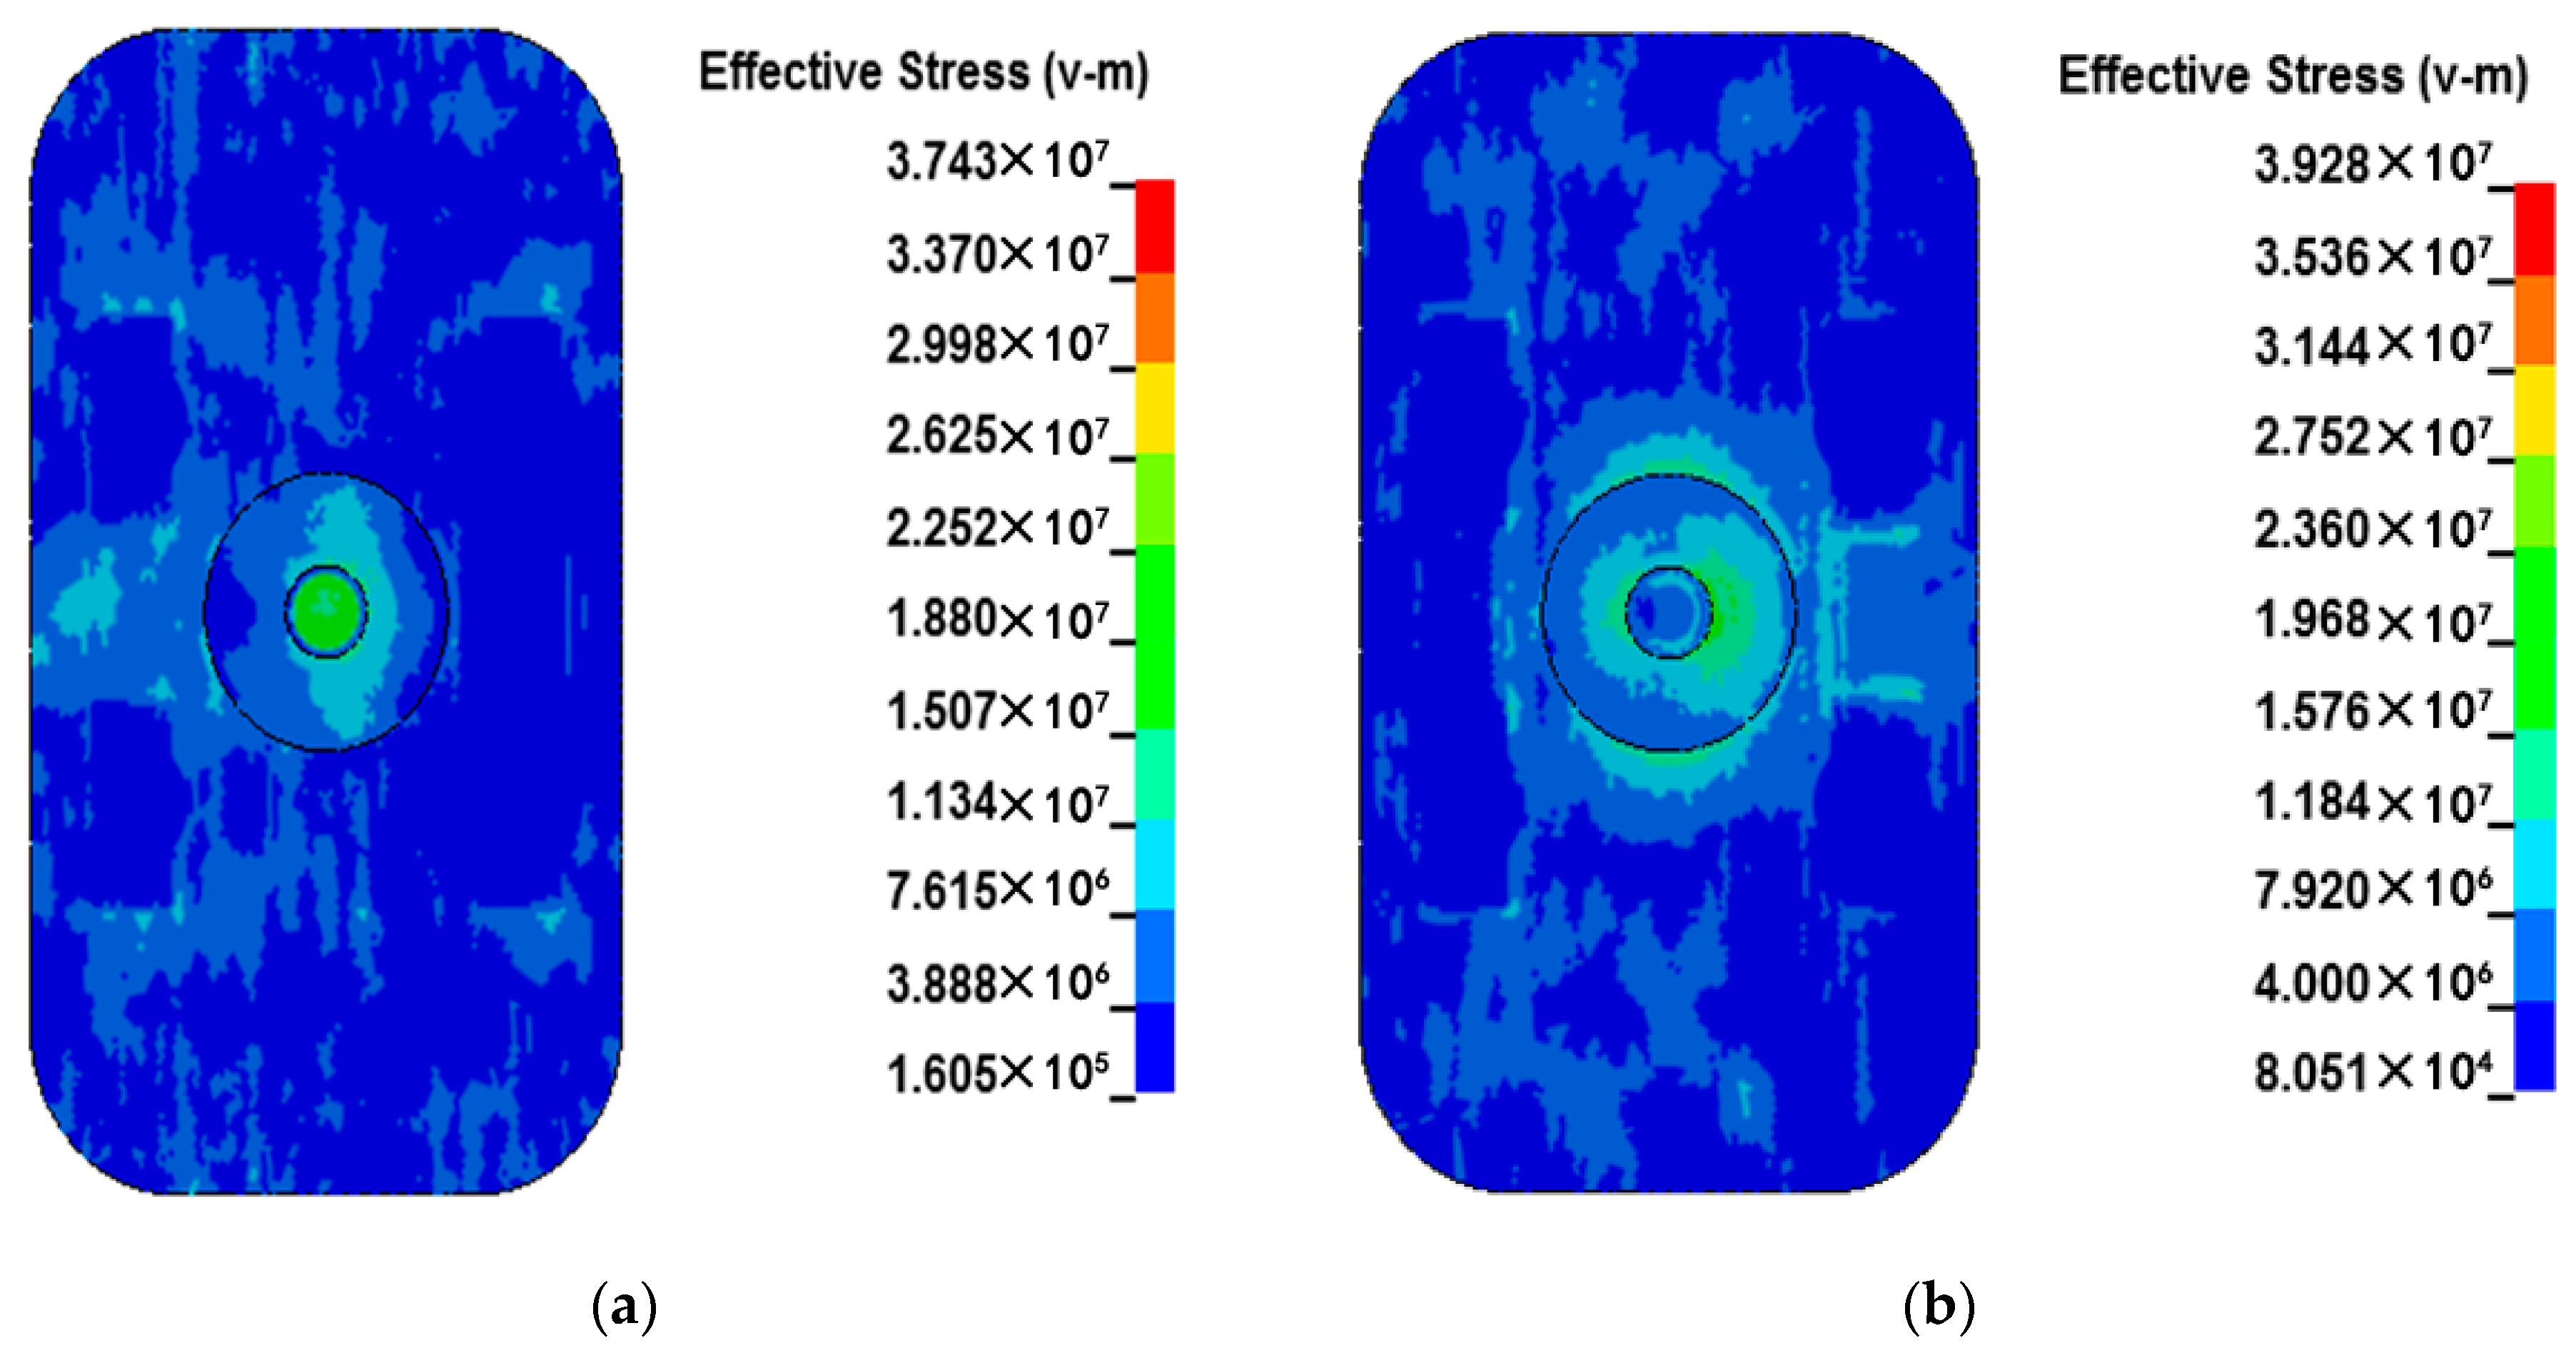
The stress distribution of the plate was extracted during a period when the liquid pressure reached its peak at the upper and lower ends of the piston rod. The results are shown in Figure 9.
- In the upper half of cycle when the liquid pressure reaches the maximum, the von Mises stress on the upper surface of the plate reaches the maximum value in the area of the piston rod; the maximum value is 25.3 MPa, the larger value around the long side of columns A and C is 16.4 and 12.2 MPa, respectively, and the larger value around the short edge of columns B and D is 10.1 and 18.6 MPa, respectively.
- In the second half cycle when the liquid pressure reaches the maximum, the von Mises stress on the upper surface of the plate reaches the maximum in the area of the piston rod; the maximum value is 28.2 MPa, which presents large values on the short edges of columns A, B, C, and D of 13.6, 9.5, 8.6, and 14.6 MPa, respectively.
- Based on the analysis of Figure 9, it can be found that the stress concentration and stress peak exist when the short edge weld of the column reaches its maximum value within one cycle of liquid pressure. The location of the peak area of stress concentration exists near the area of the piston rod and the pillar. When the liquid pressure of the vertical columns B and D reached the maximum in the upper and lower half periods, they all presented large values; the post short edge weld is the part of the welding crack in practical engineering.
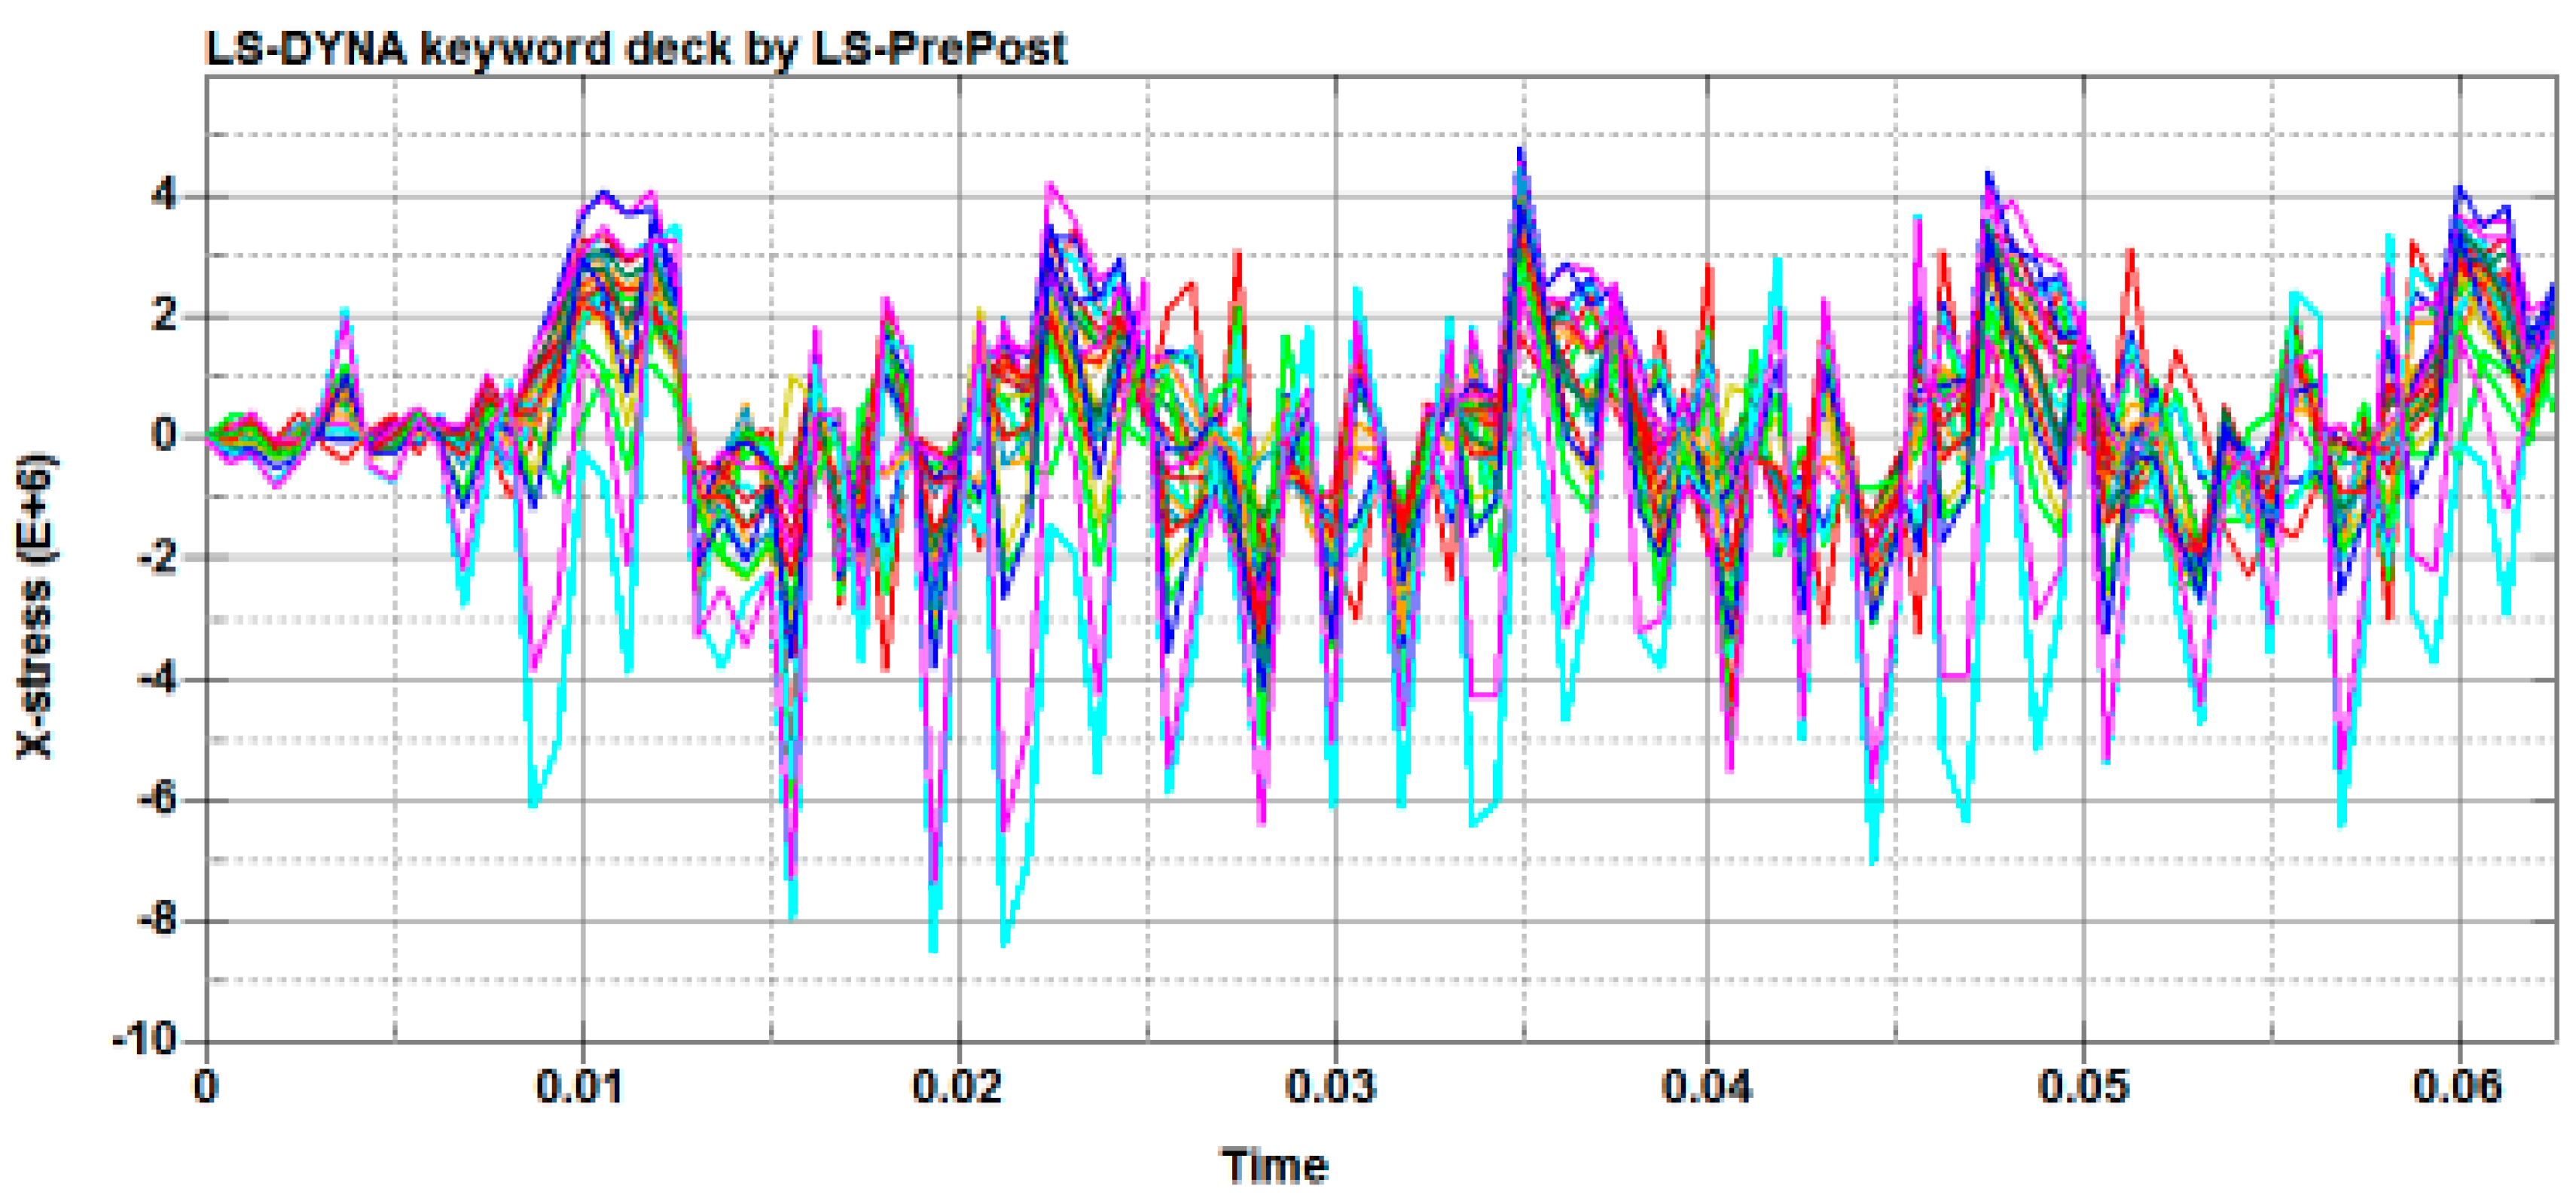
For further analysis, the data for the joint stress in the direction of the welding seam along the short edge of the vertical column were extracted, and the stress–time curve was plotted, as shown in Figure 10 and Figure 11.
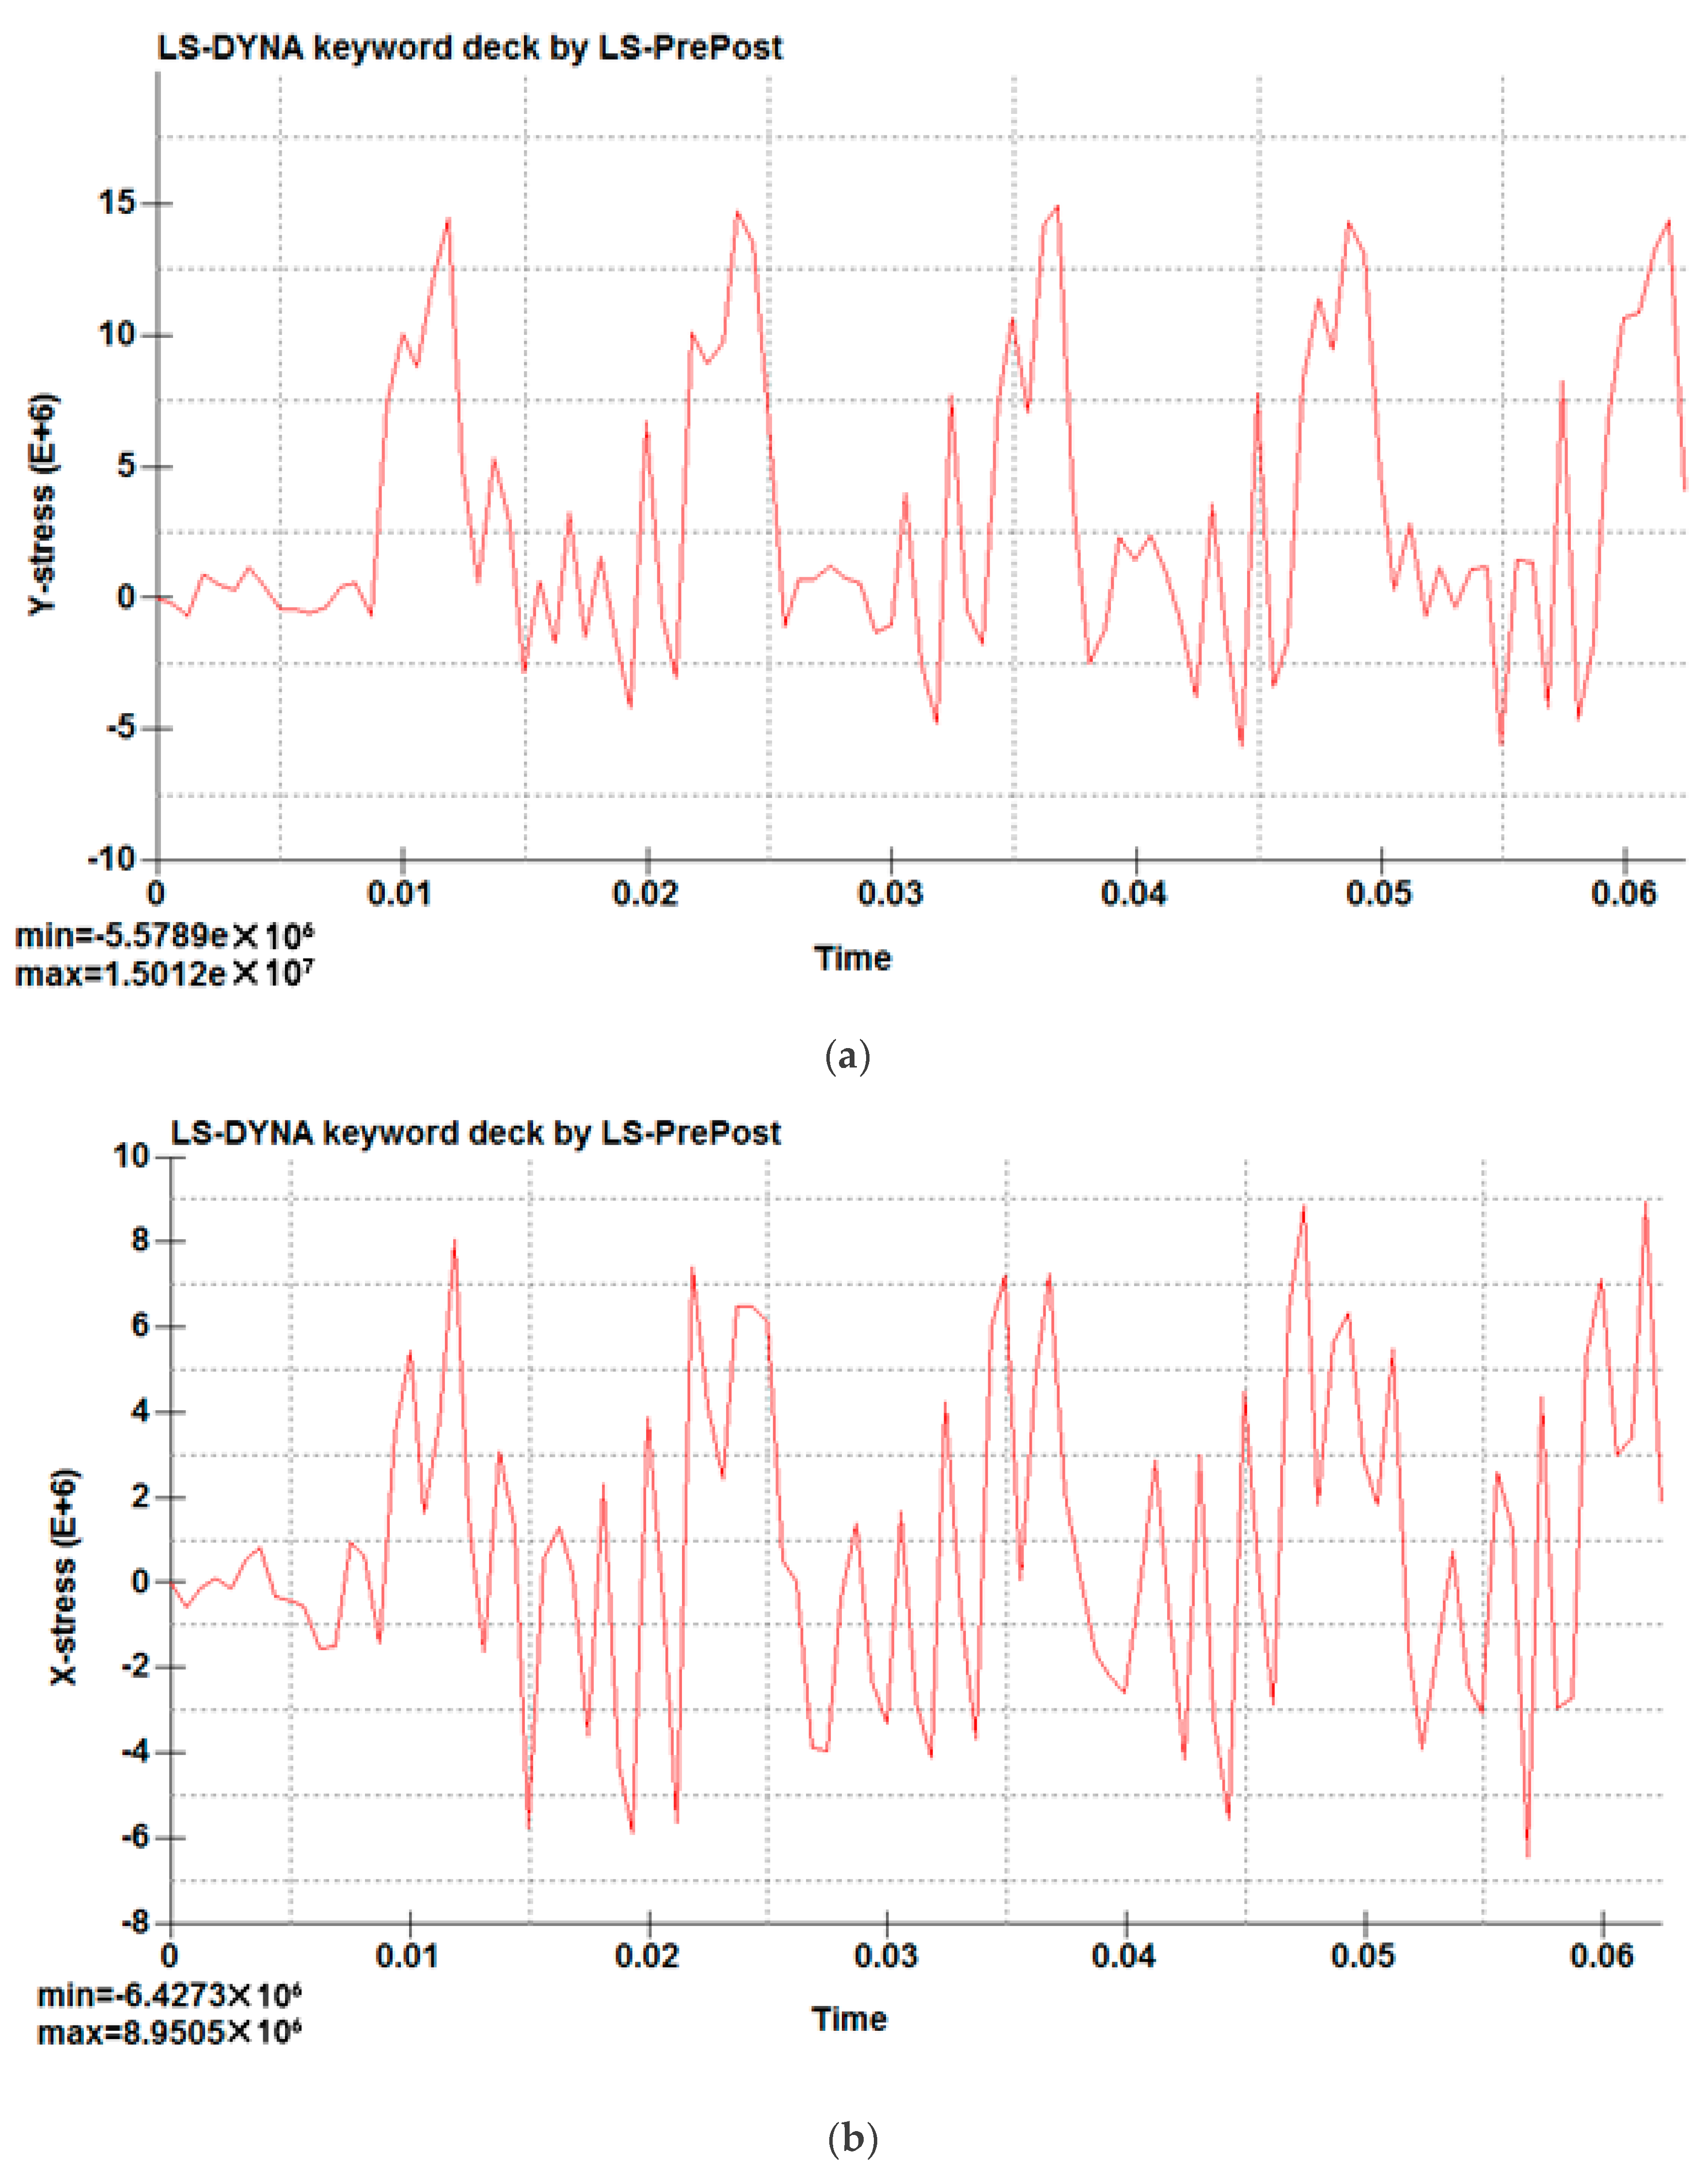
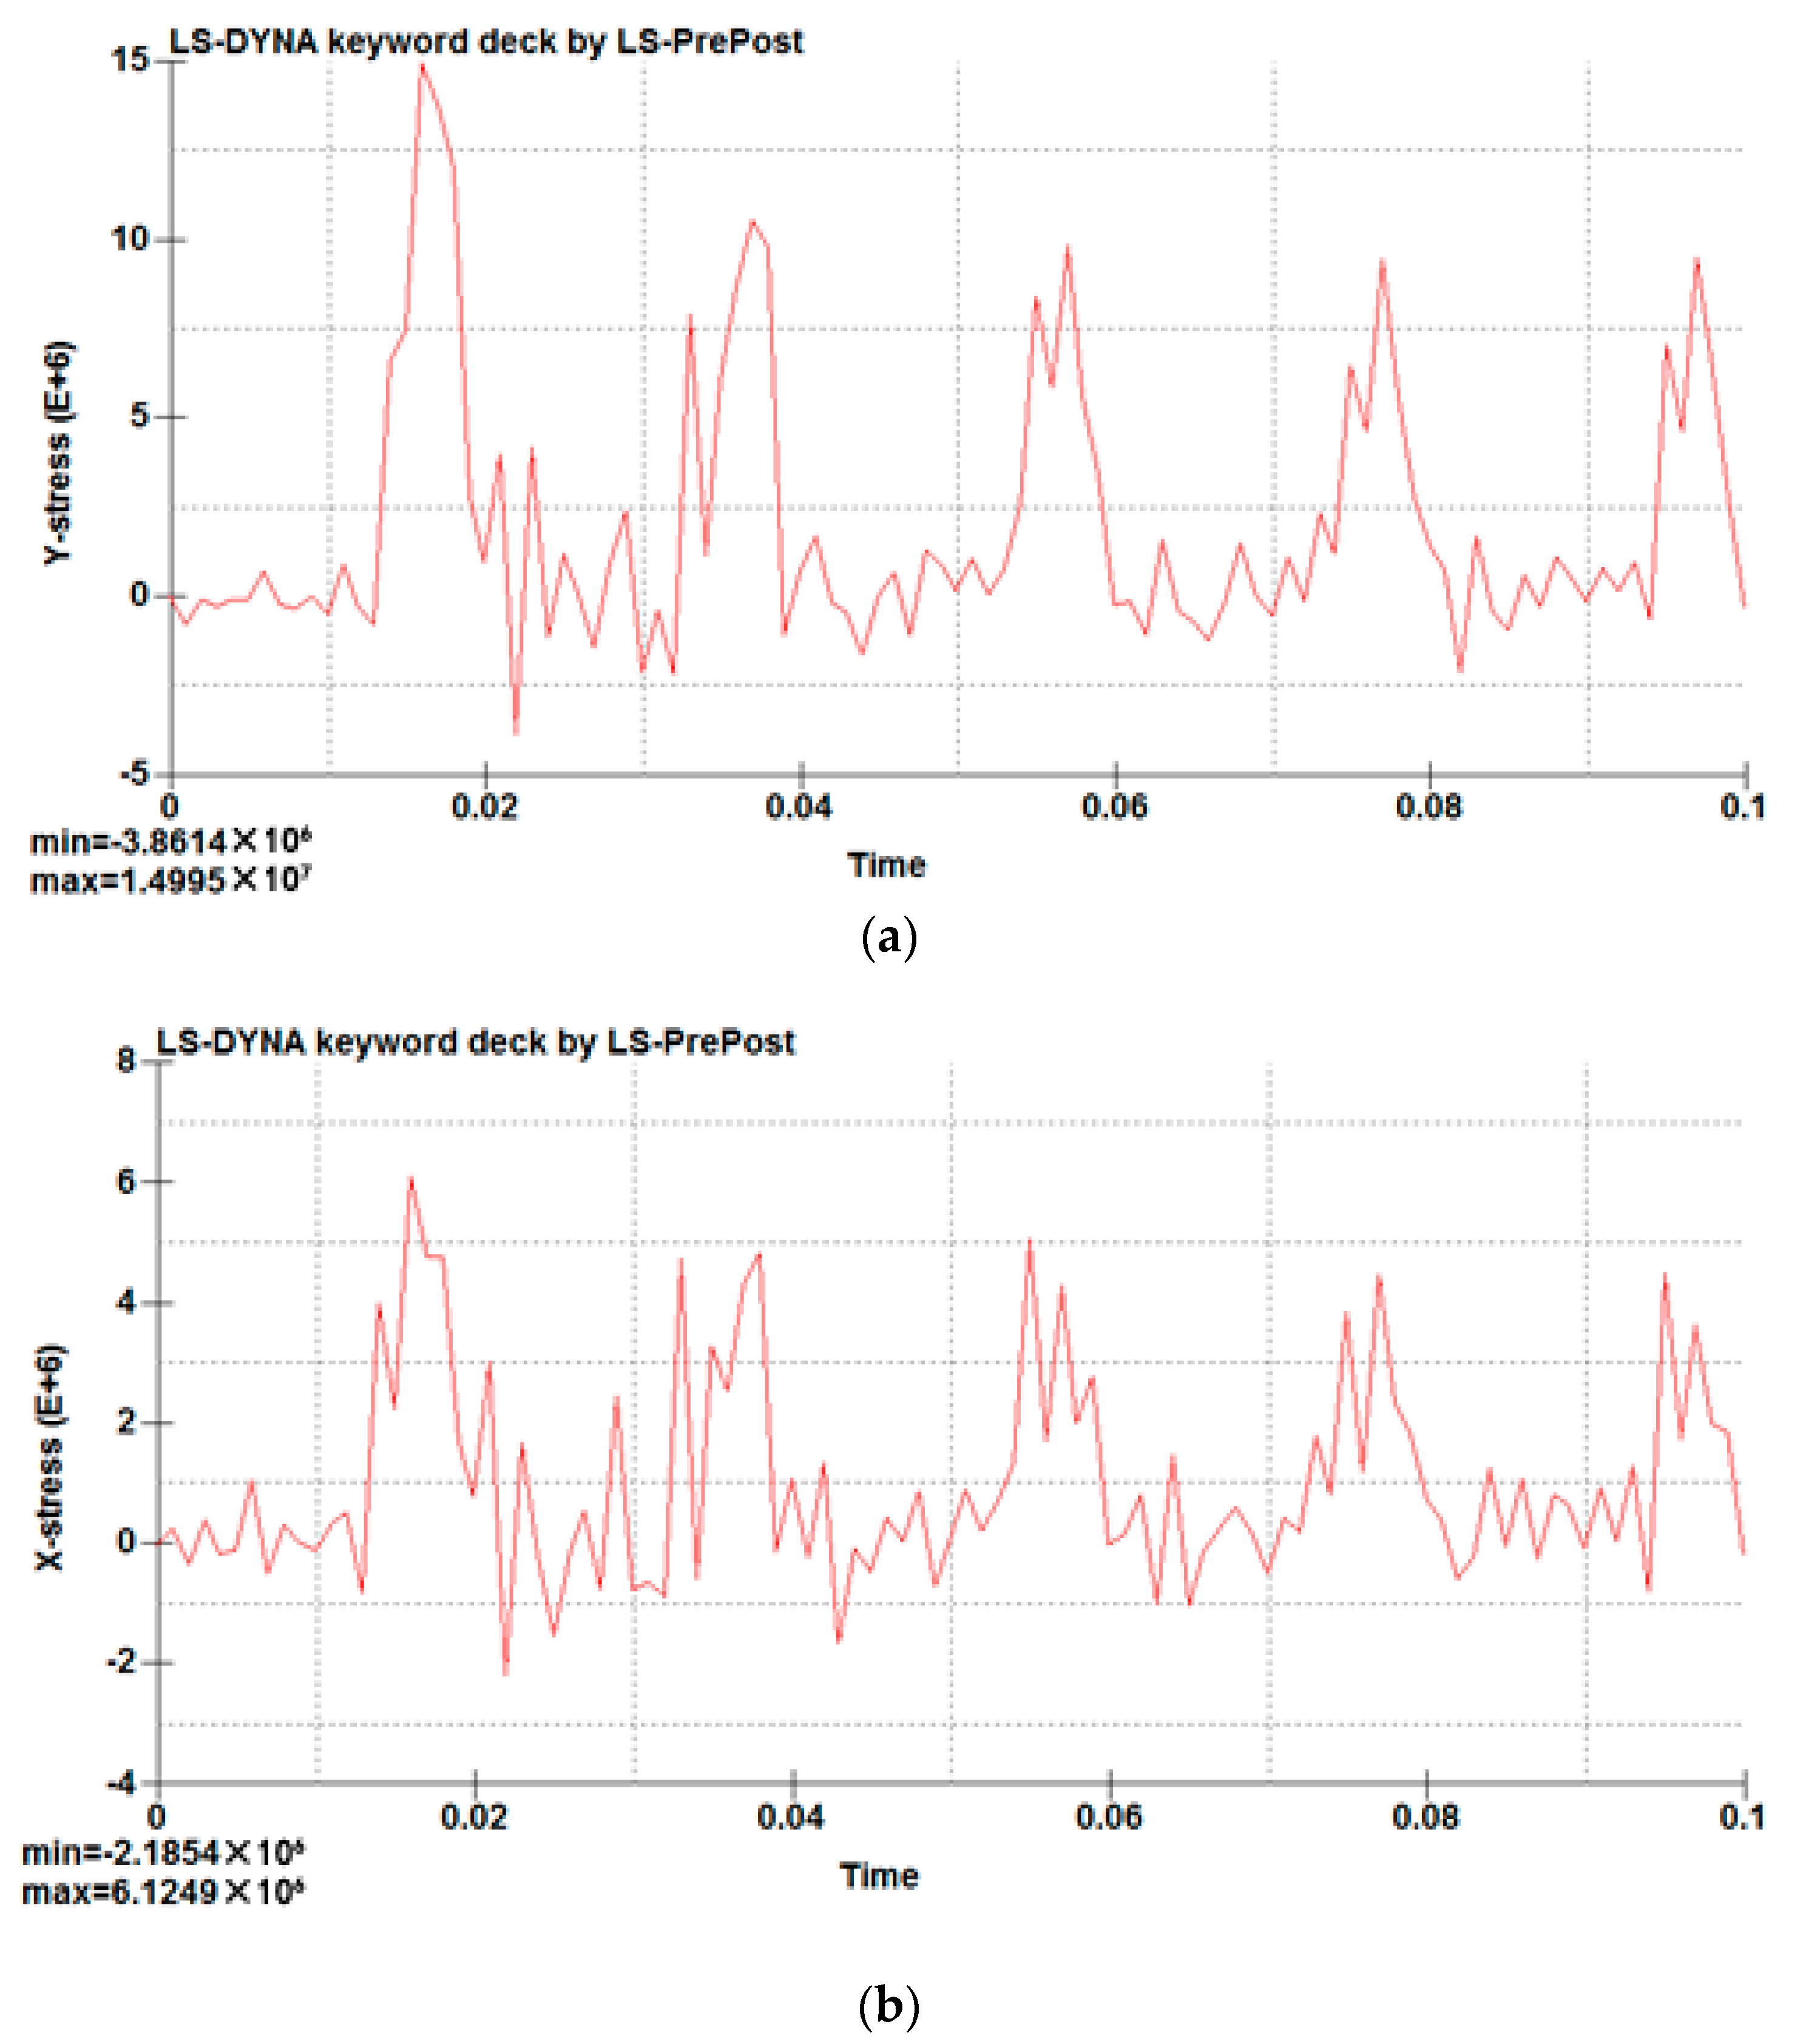
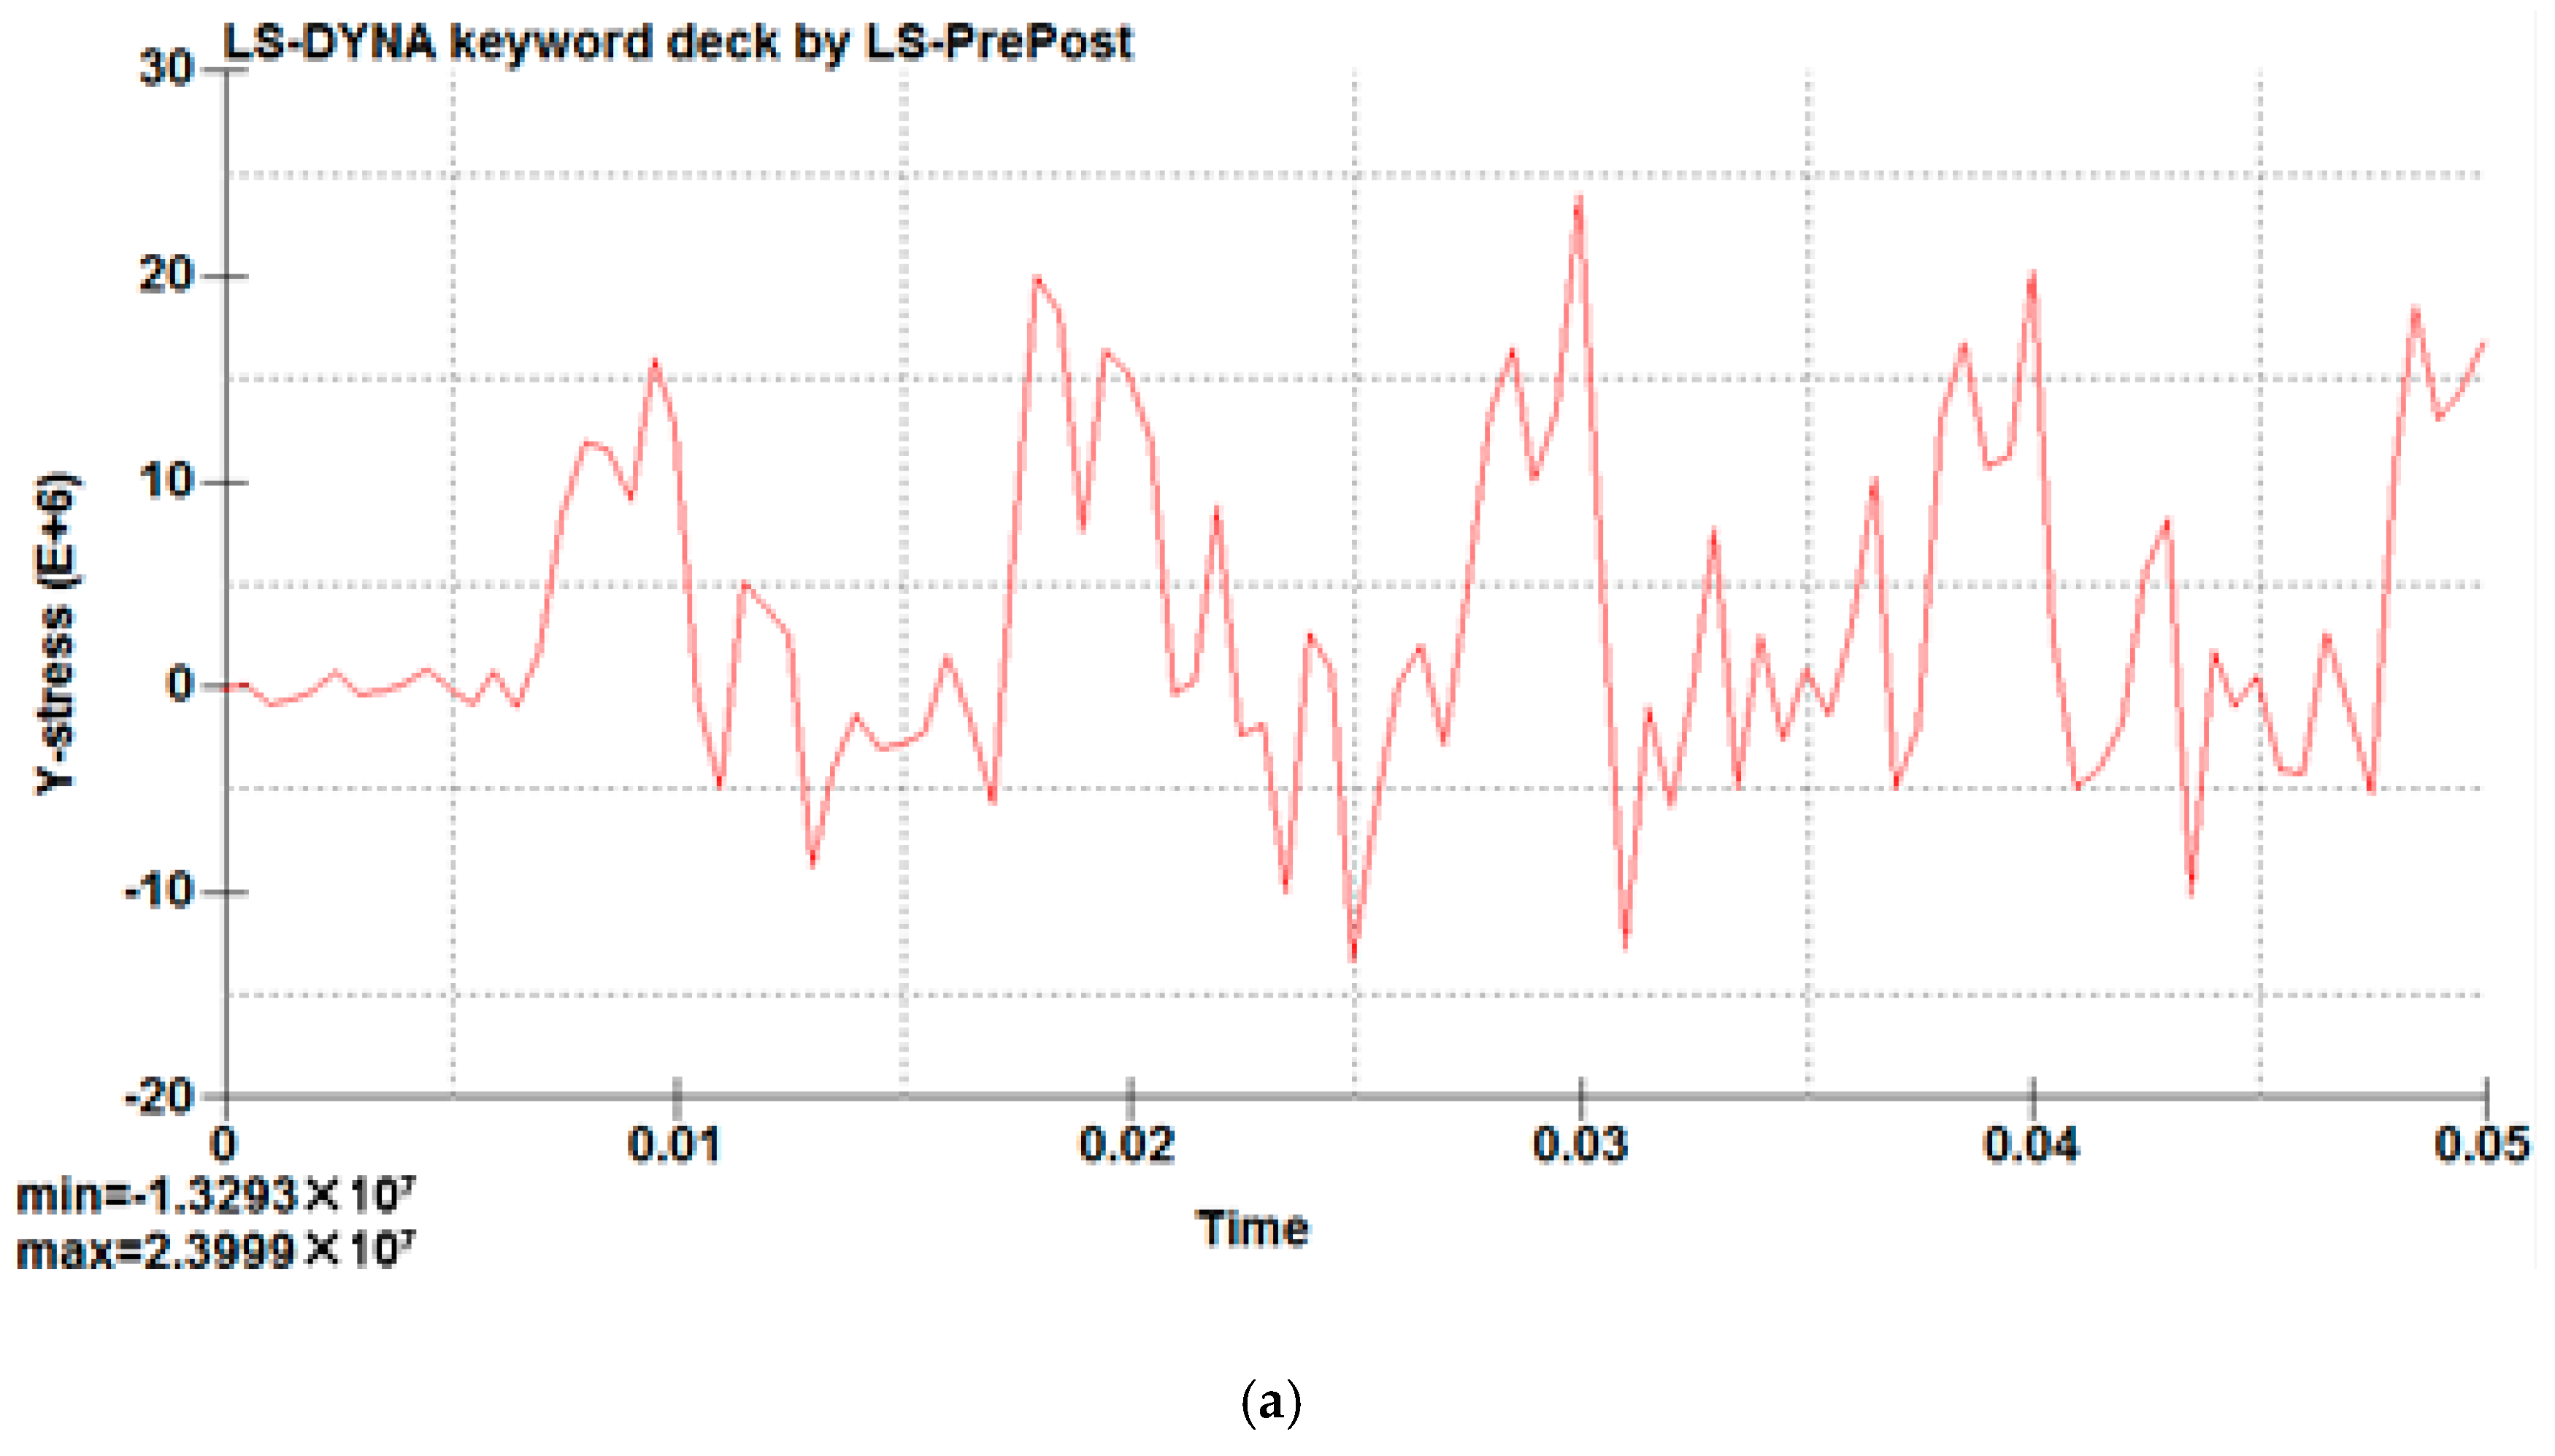
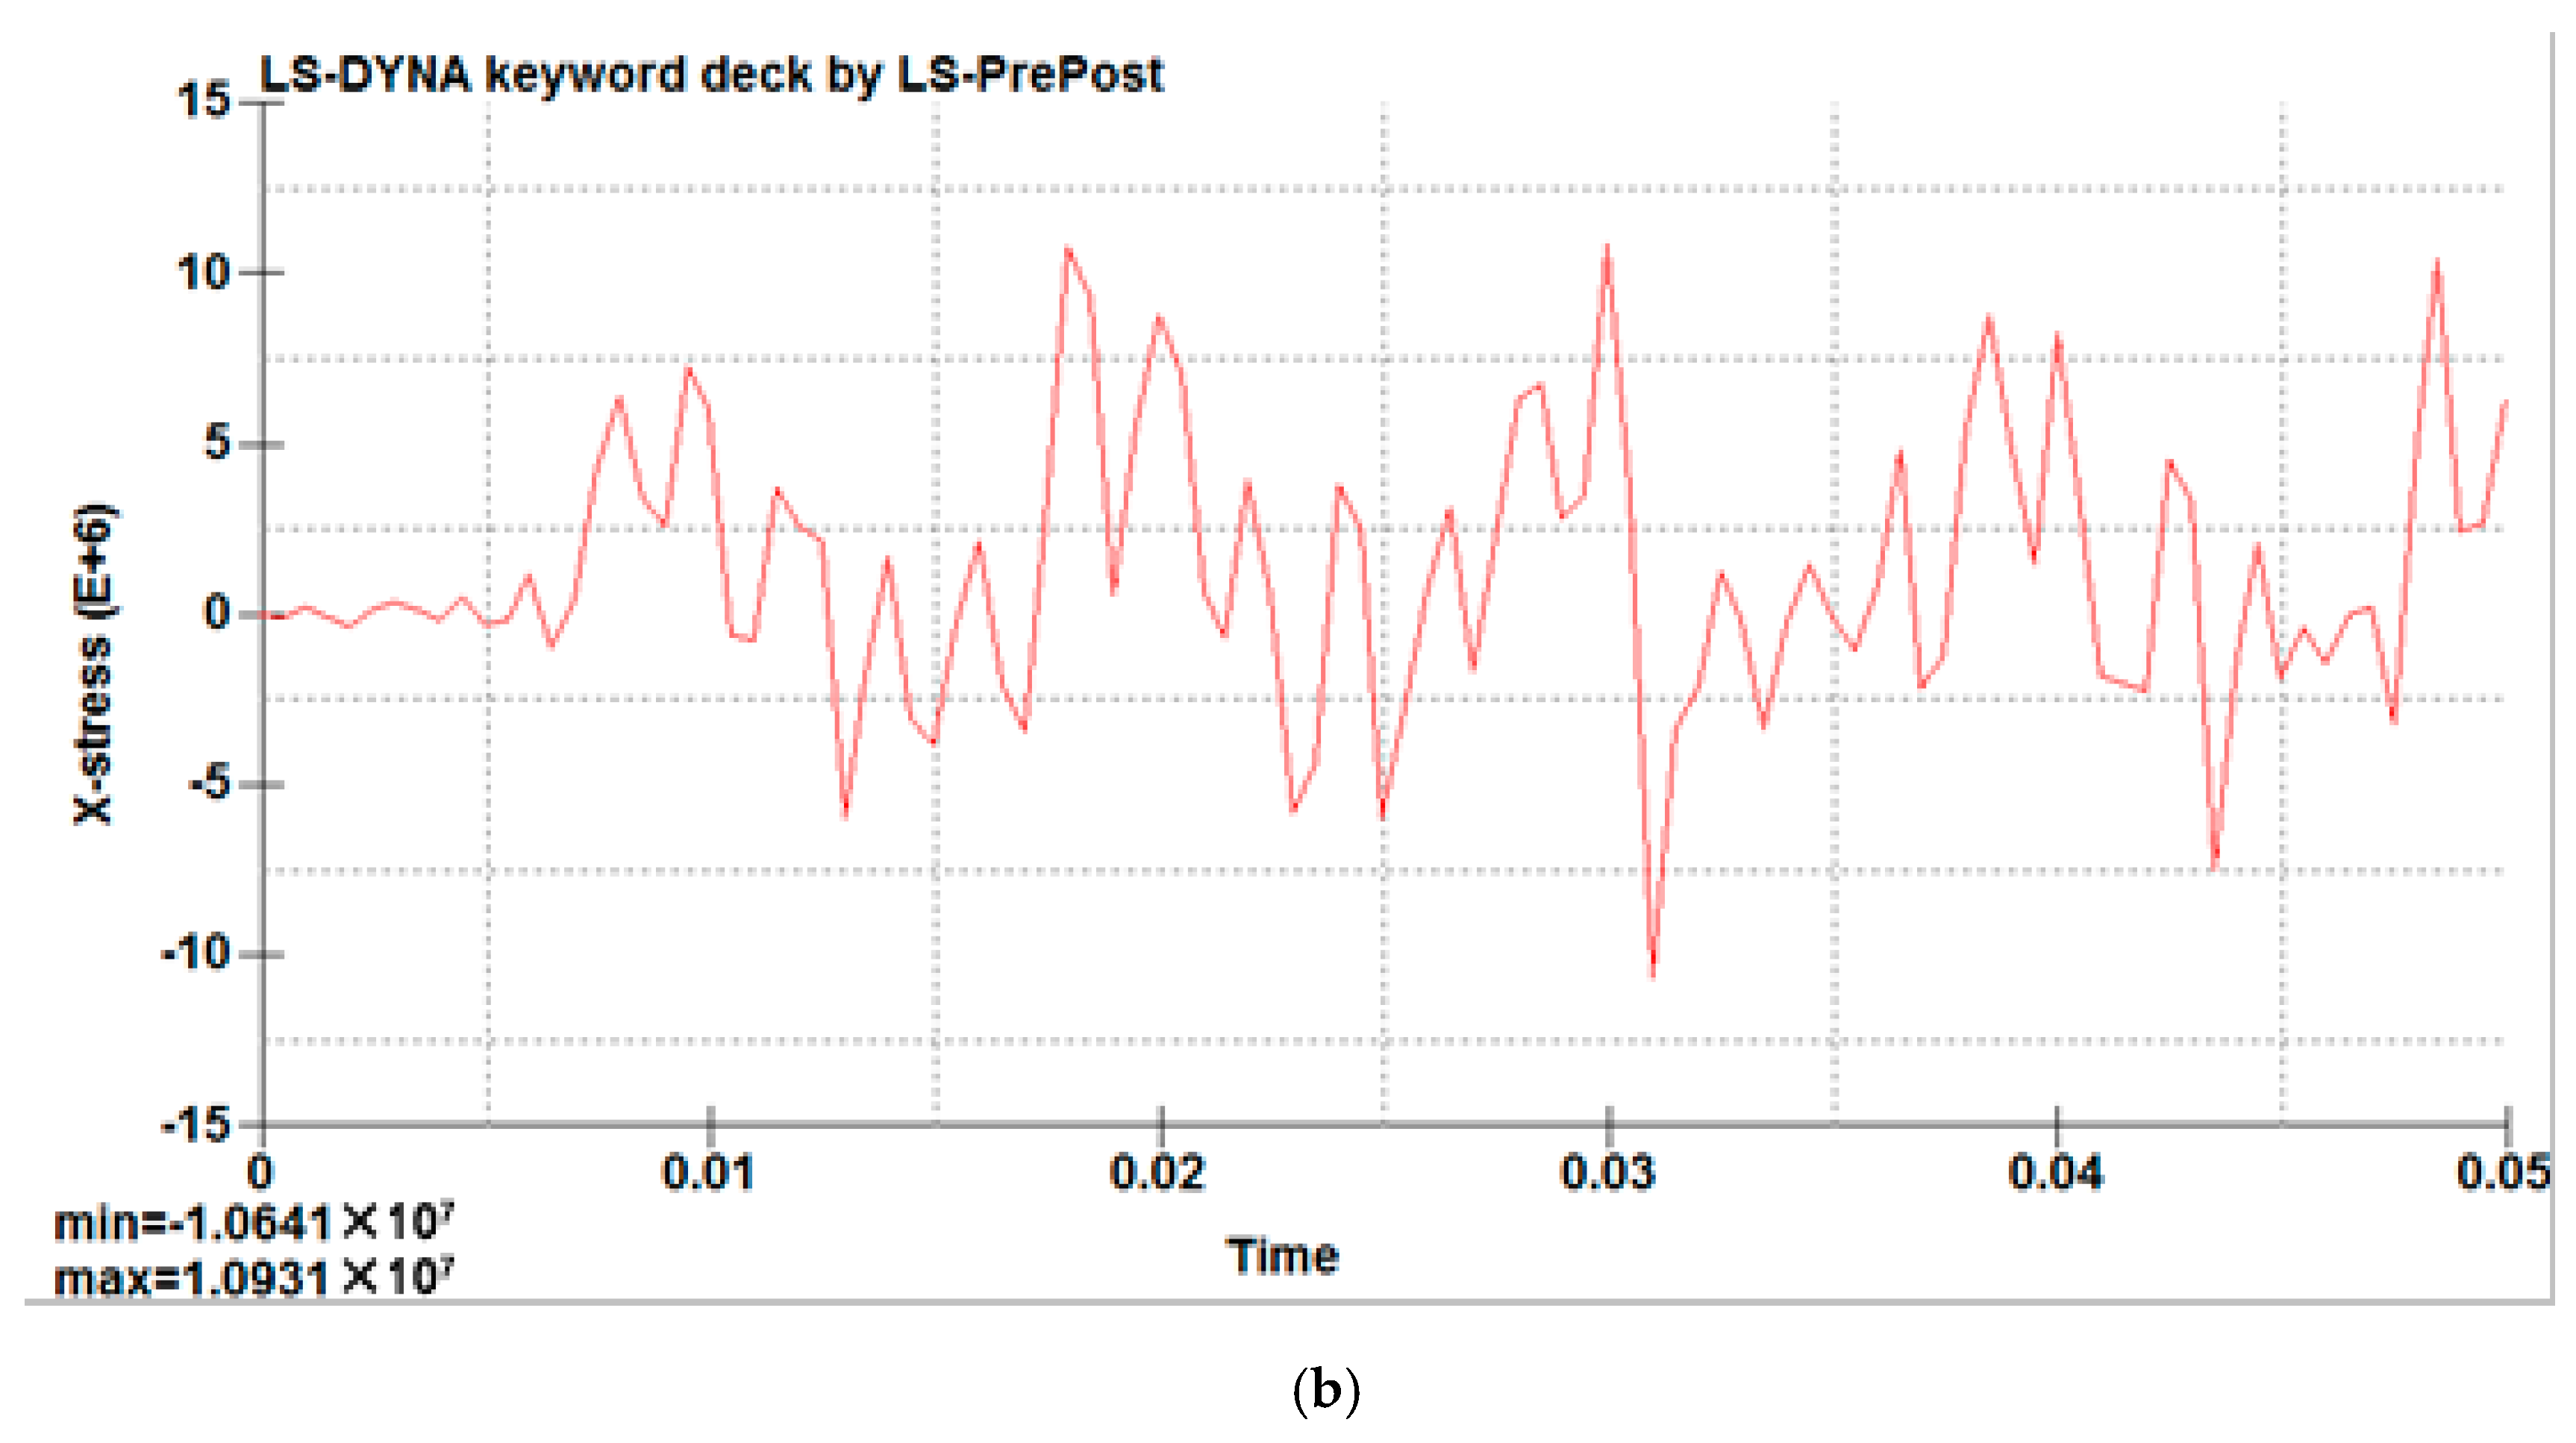
The longitudinal and transverse stress of columns on the short edge weld in a cycle (T = 0.125 s) present the periodical change of tensile stress and compressive stress; the weld on each node of the change trend of stress is very close. As shown in Figure 10 and Figure 11, the curve which is formed by the multiple nodes shows the same trend, so we can judge that the trends of these node stresses are almost the same. Therefore, the mid-point of the short edge of the welding seam was taken as being representative to analyze the variations of stress on the whole welding seam under one cycle, and the variation data for stress over time were extracted and are shown in Figure 12.
As shown in Figure 12, after the system is stable (the fifth cycle), the longitudinal stress on the weld mid-point in the first half cycle is converted from the tensile stress to compressive stress; the maximum value is 5.5 MPa. In the second half cycle, the stress is converted from compressive stress to tensile stress; the maximum value is 15.0 MPa. The transverse stress in the first half cycle is converted from tensile stress to compressive stress; the maximum value is 6.4 MPa. In the second half cycle, the stress is converted from compressive stress to tensile stress; the maximum value is 8.9 MPa. The overall trend shows that stress is present at the periodical change of tensile stress and compressive stress. Based on these observations, there is a peak stress in the weld.
6. Analysis of Plate Deformation under Maximum Liquid Pressure
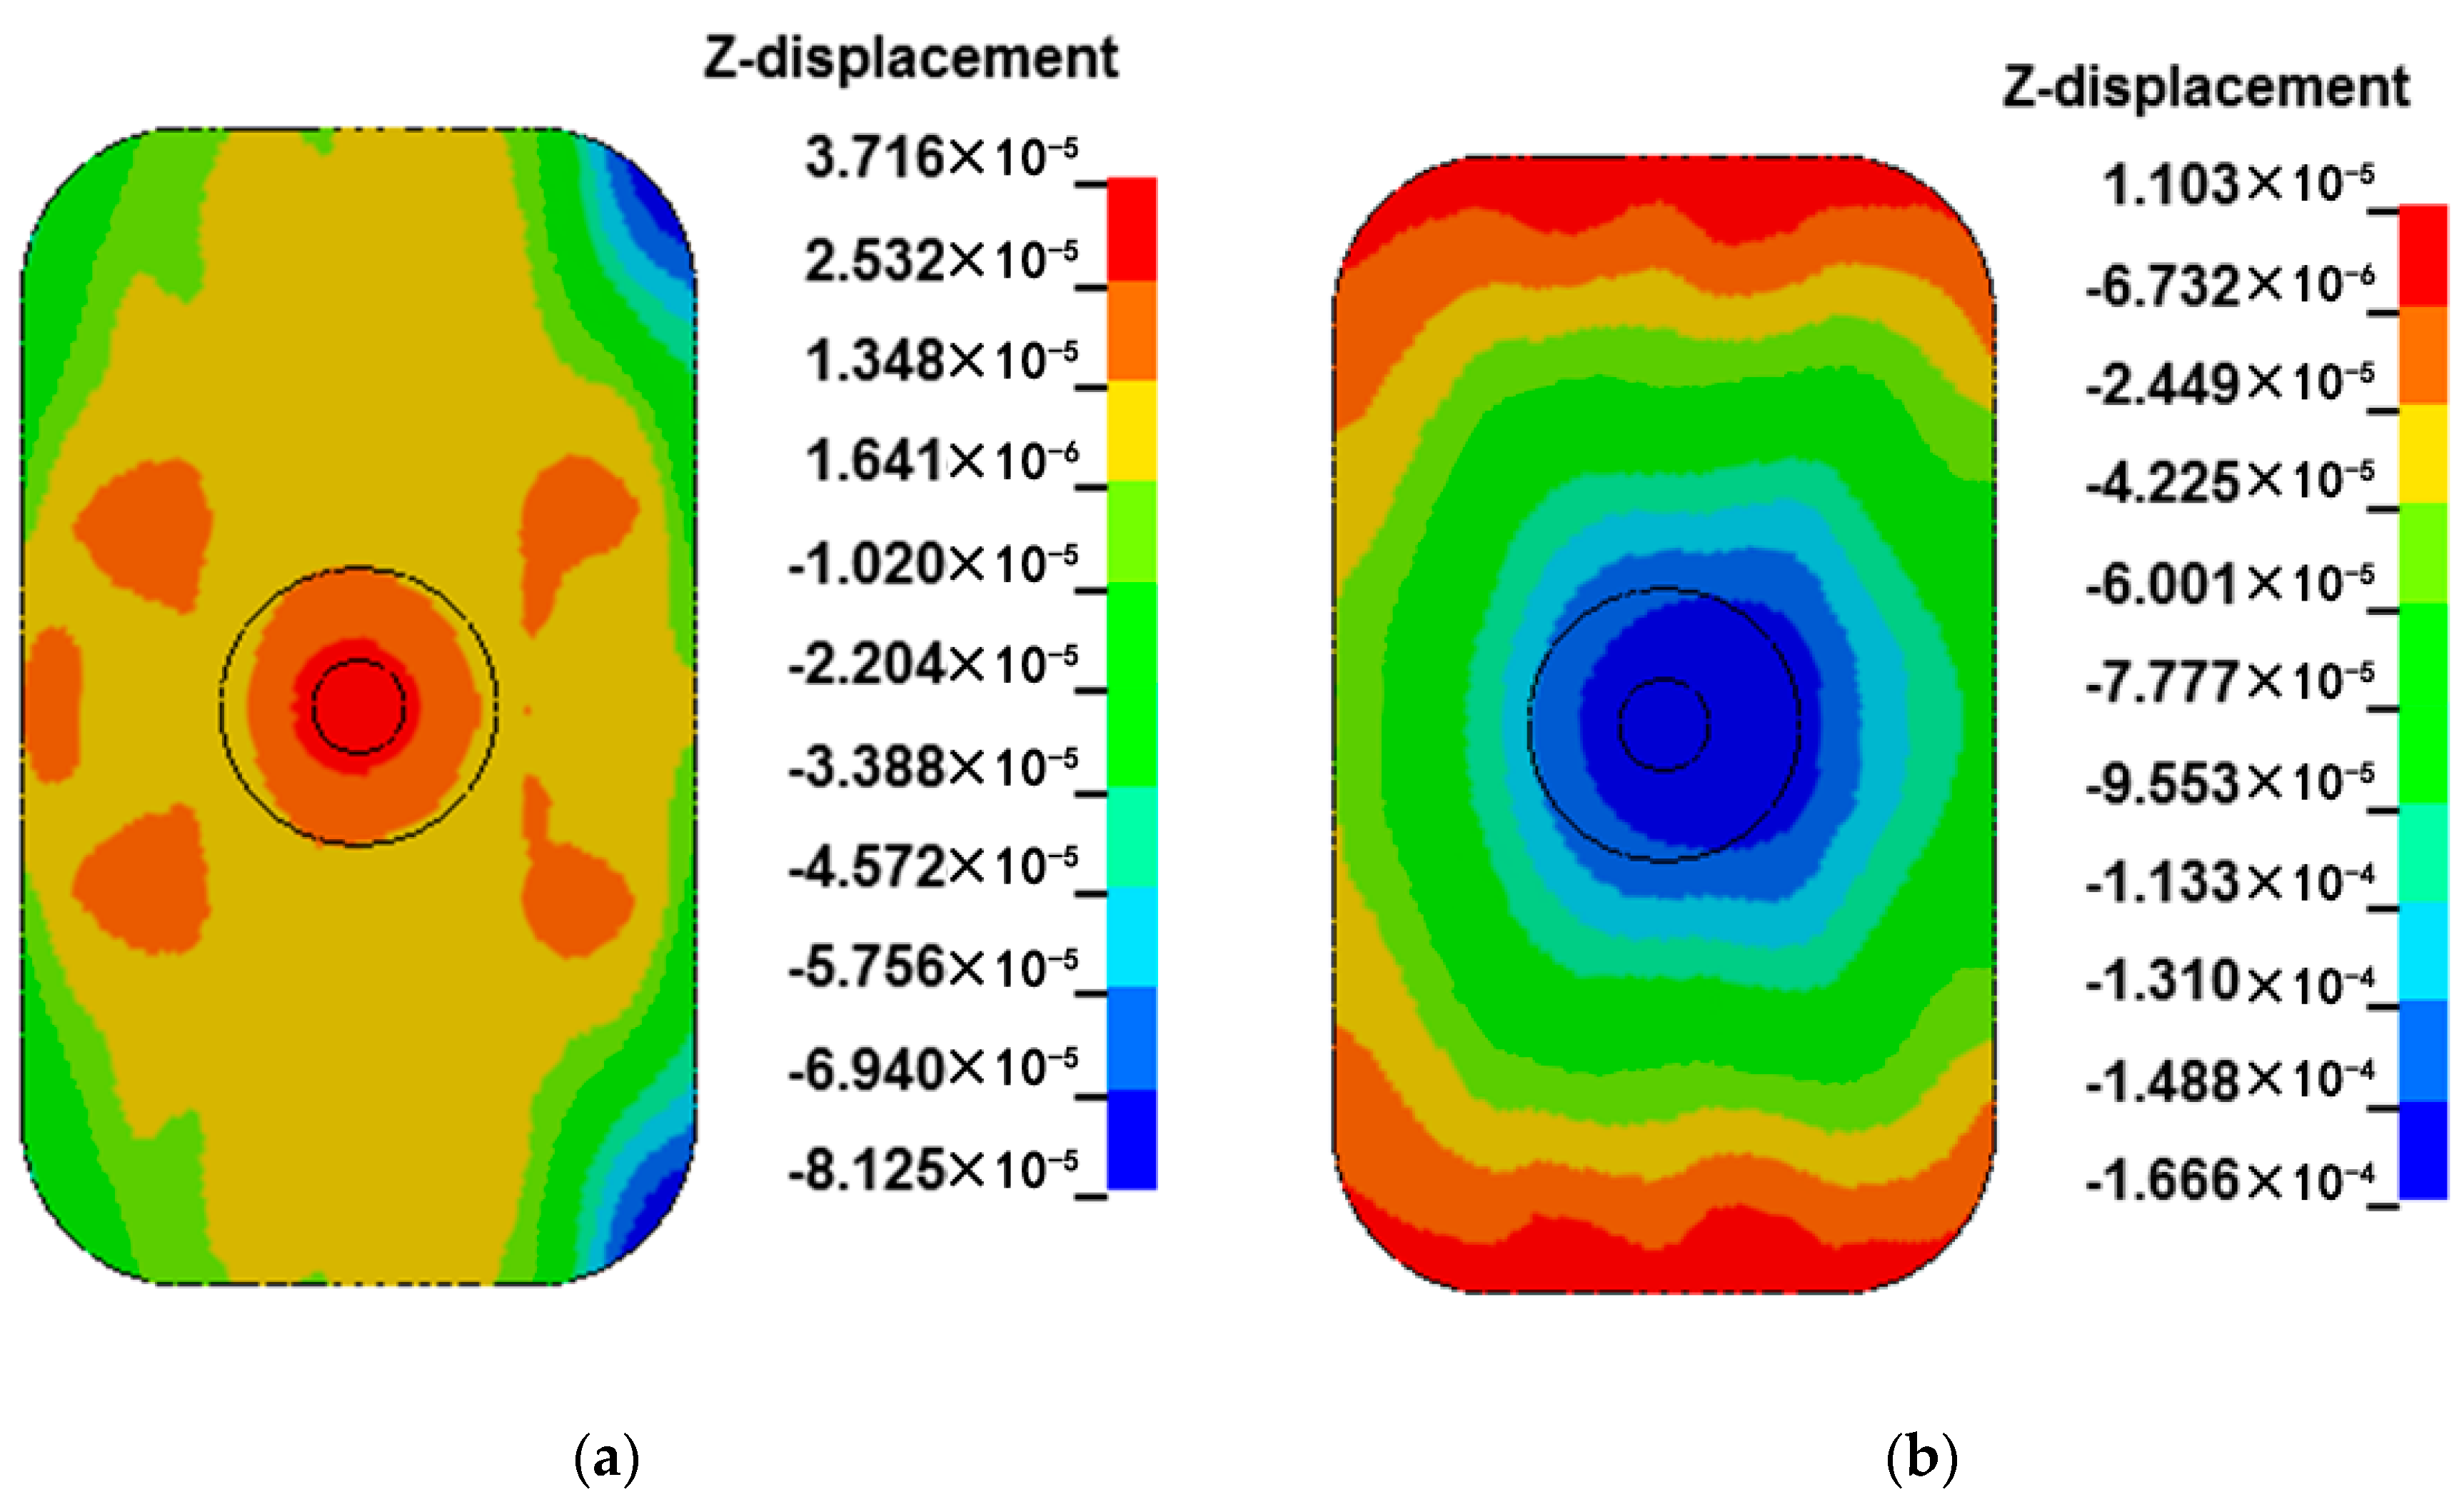
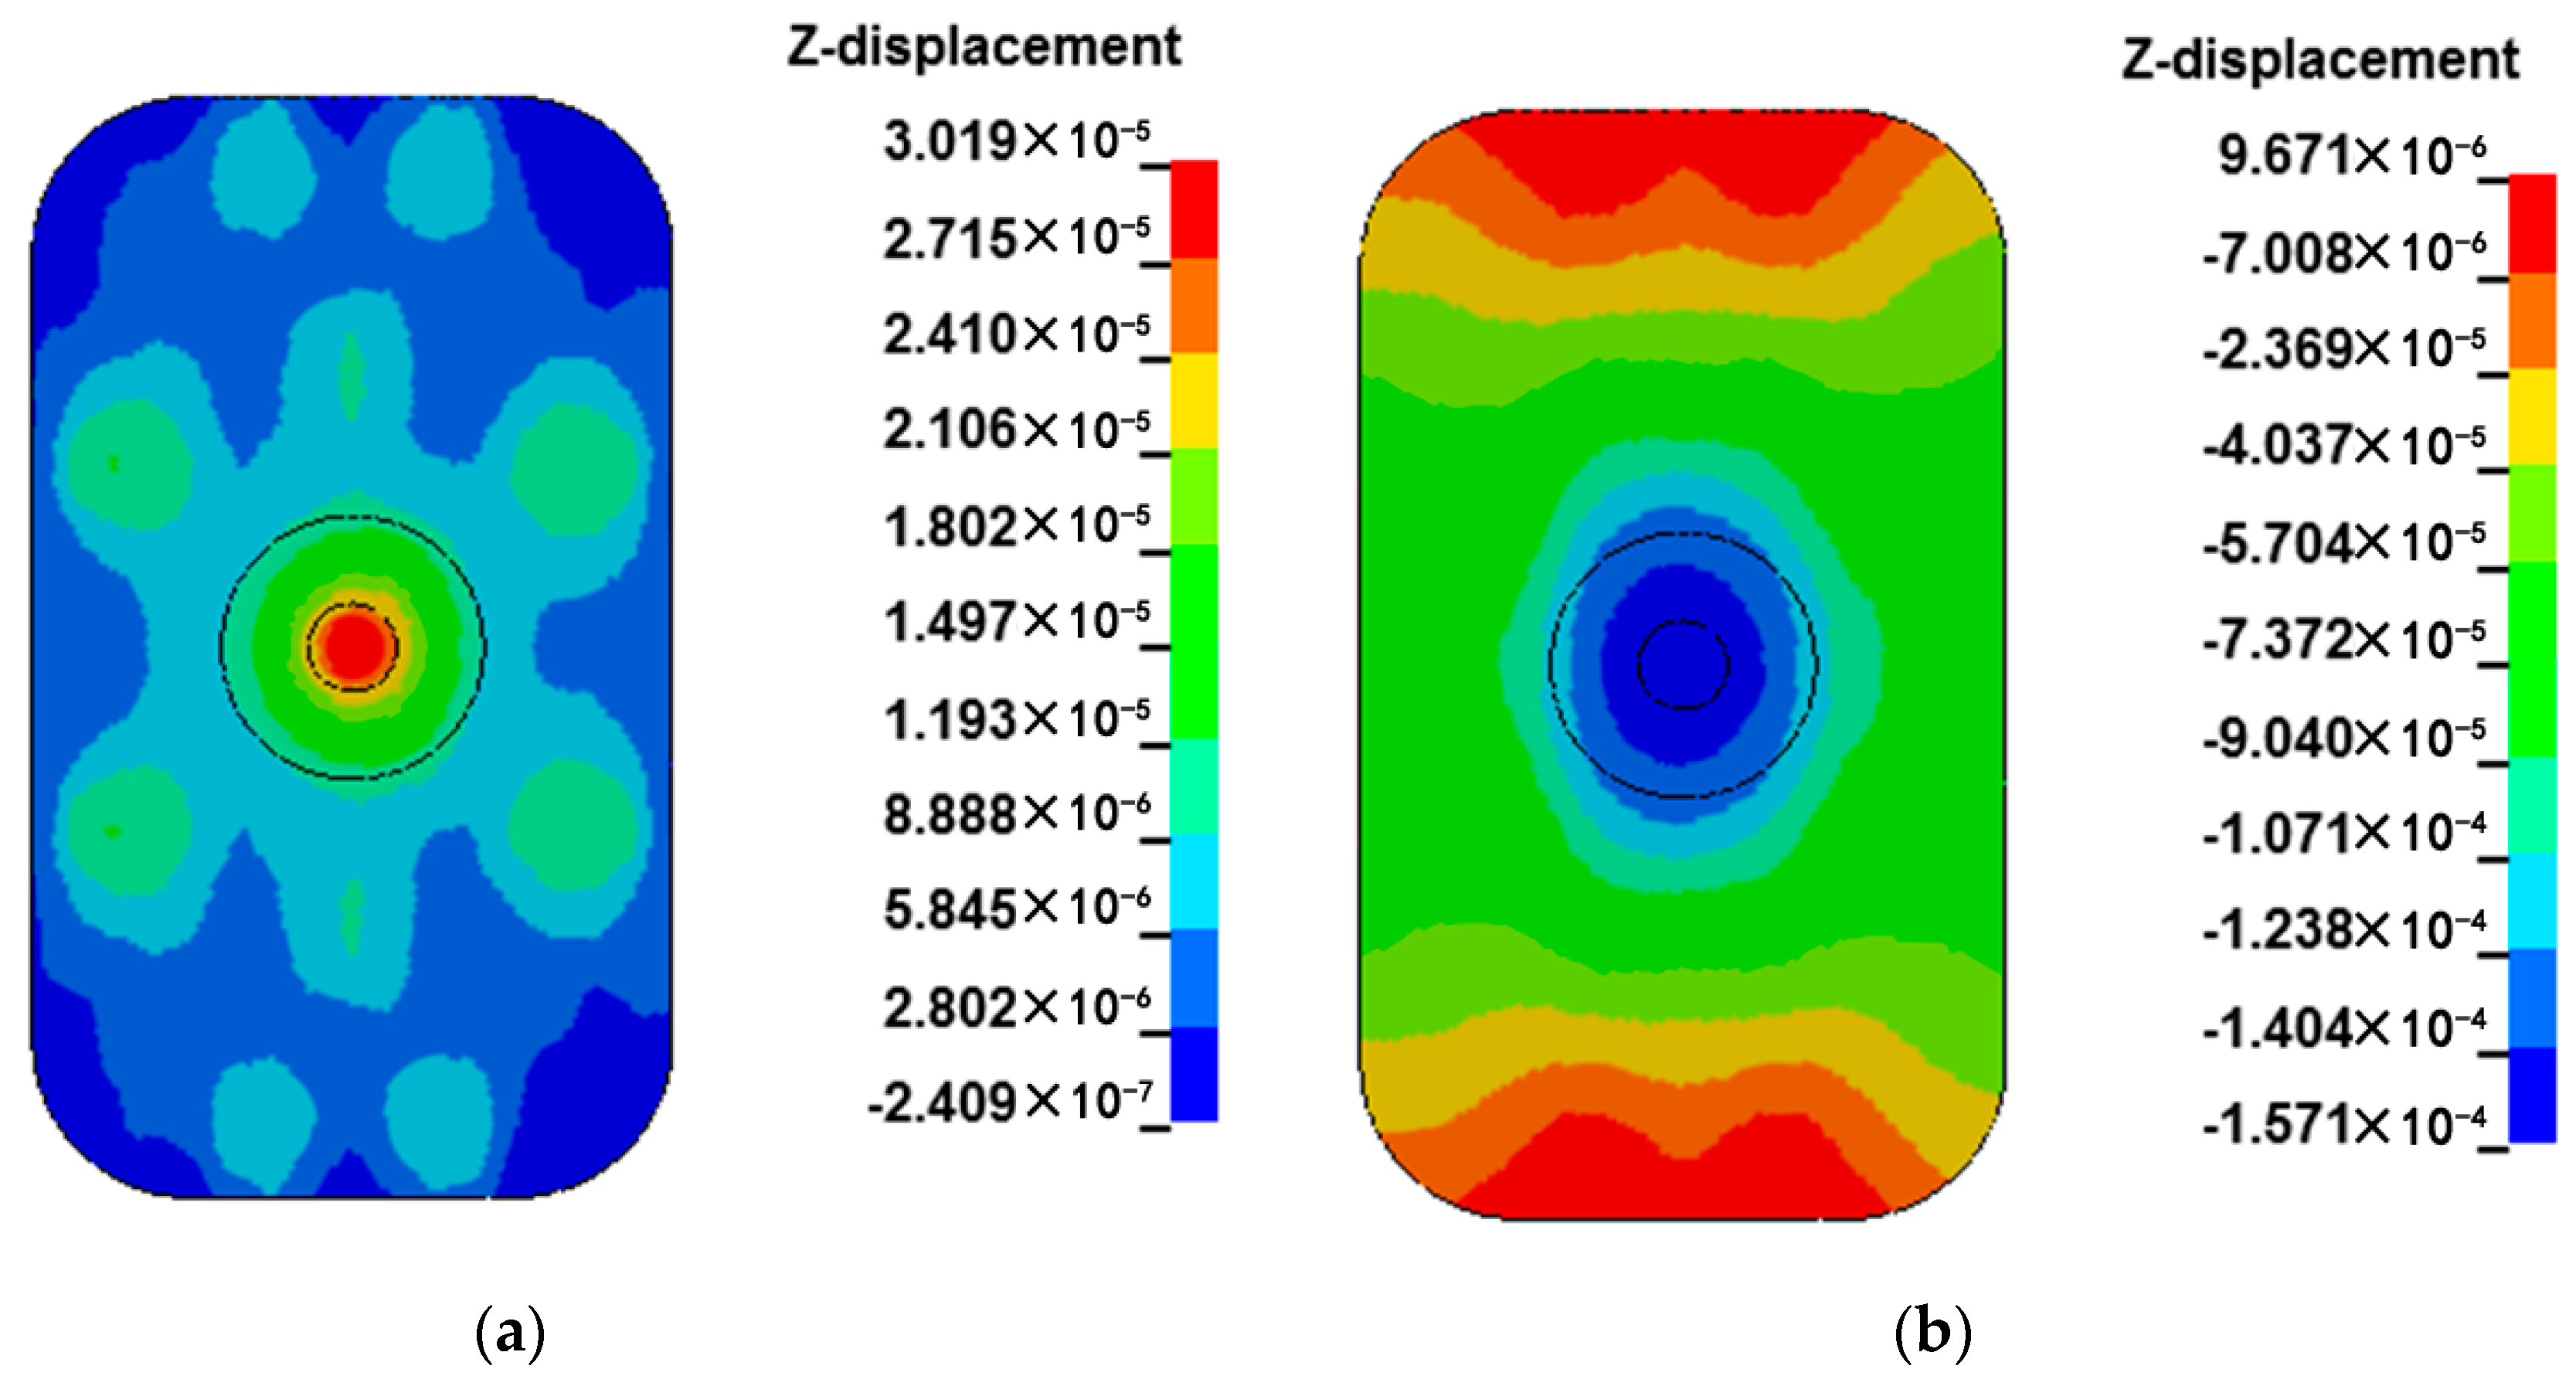
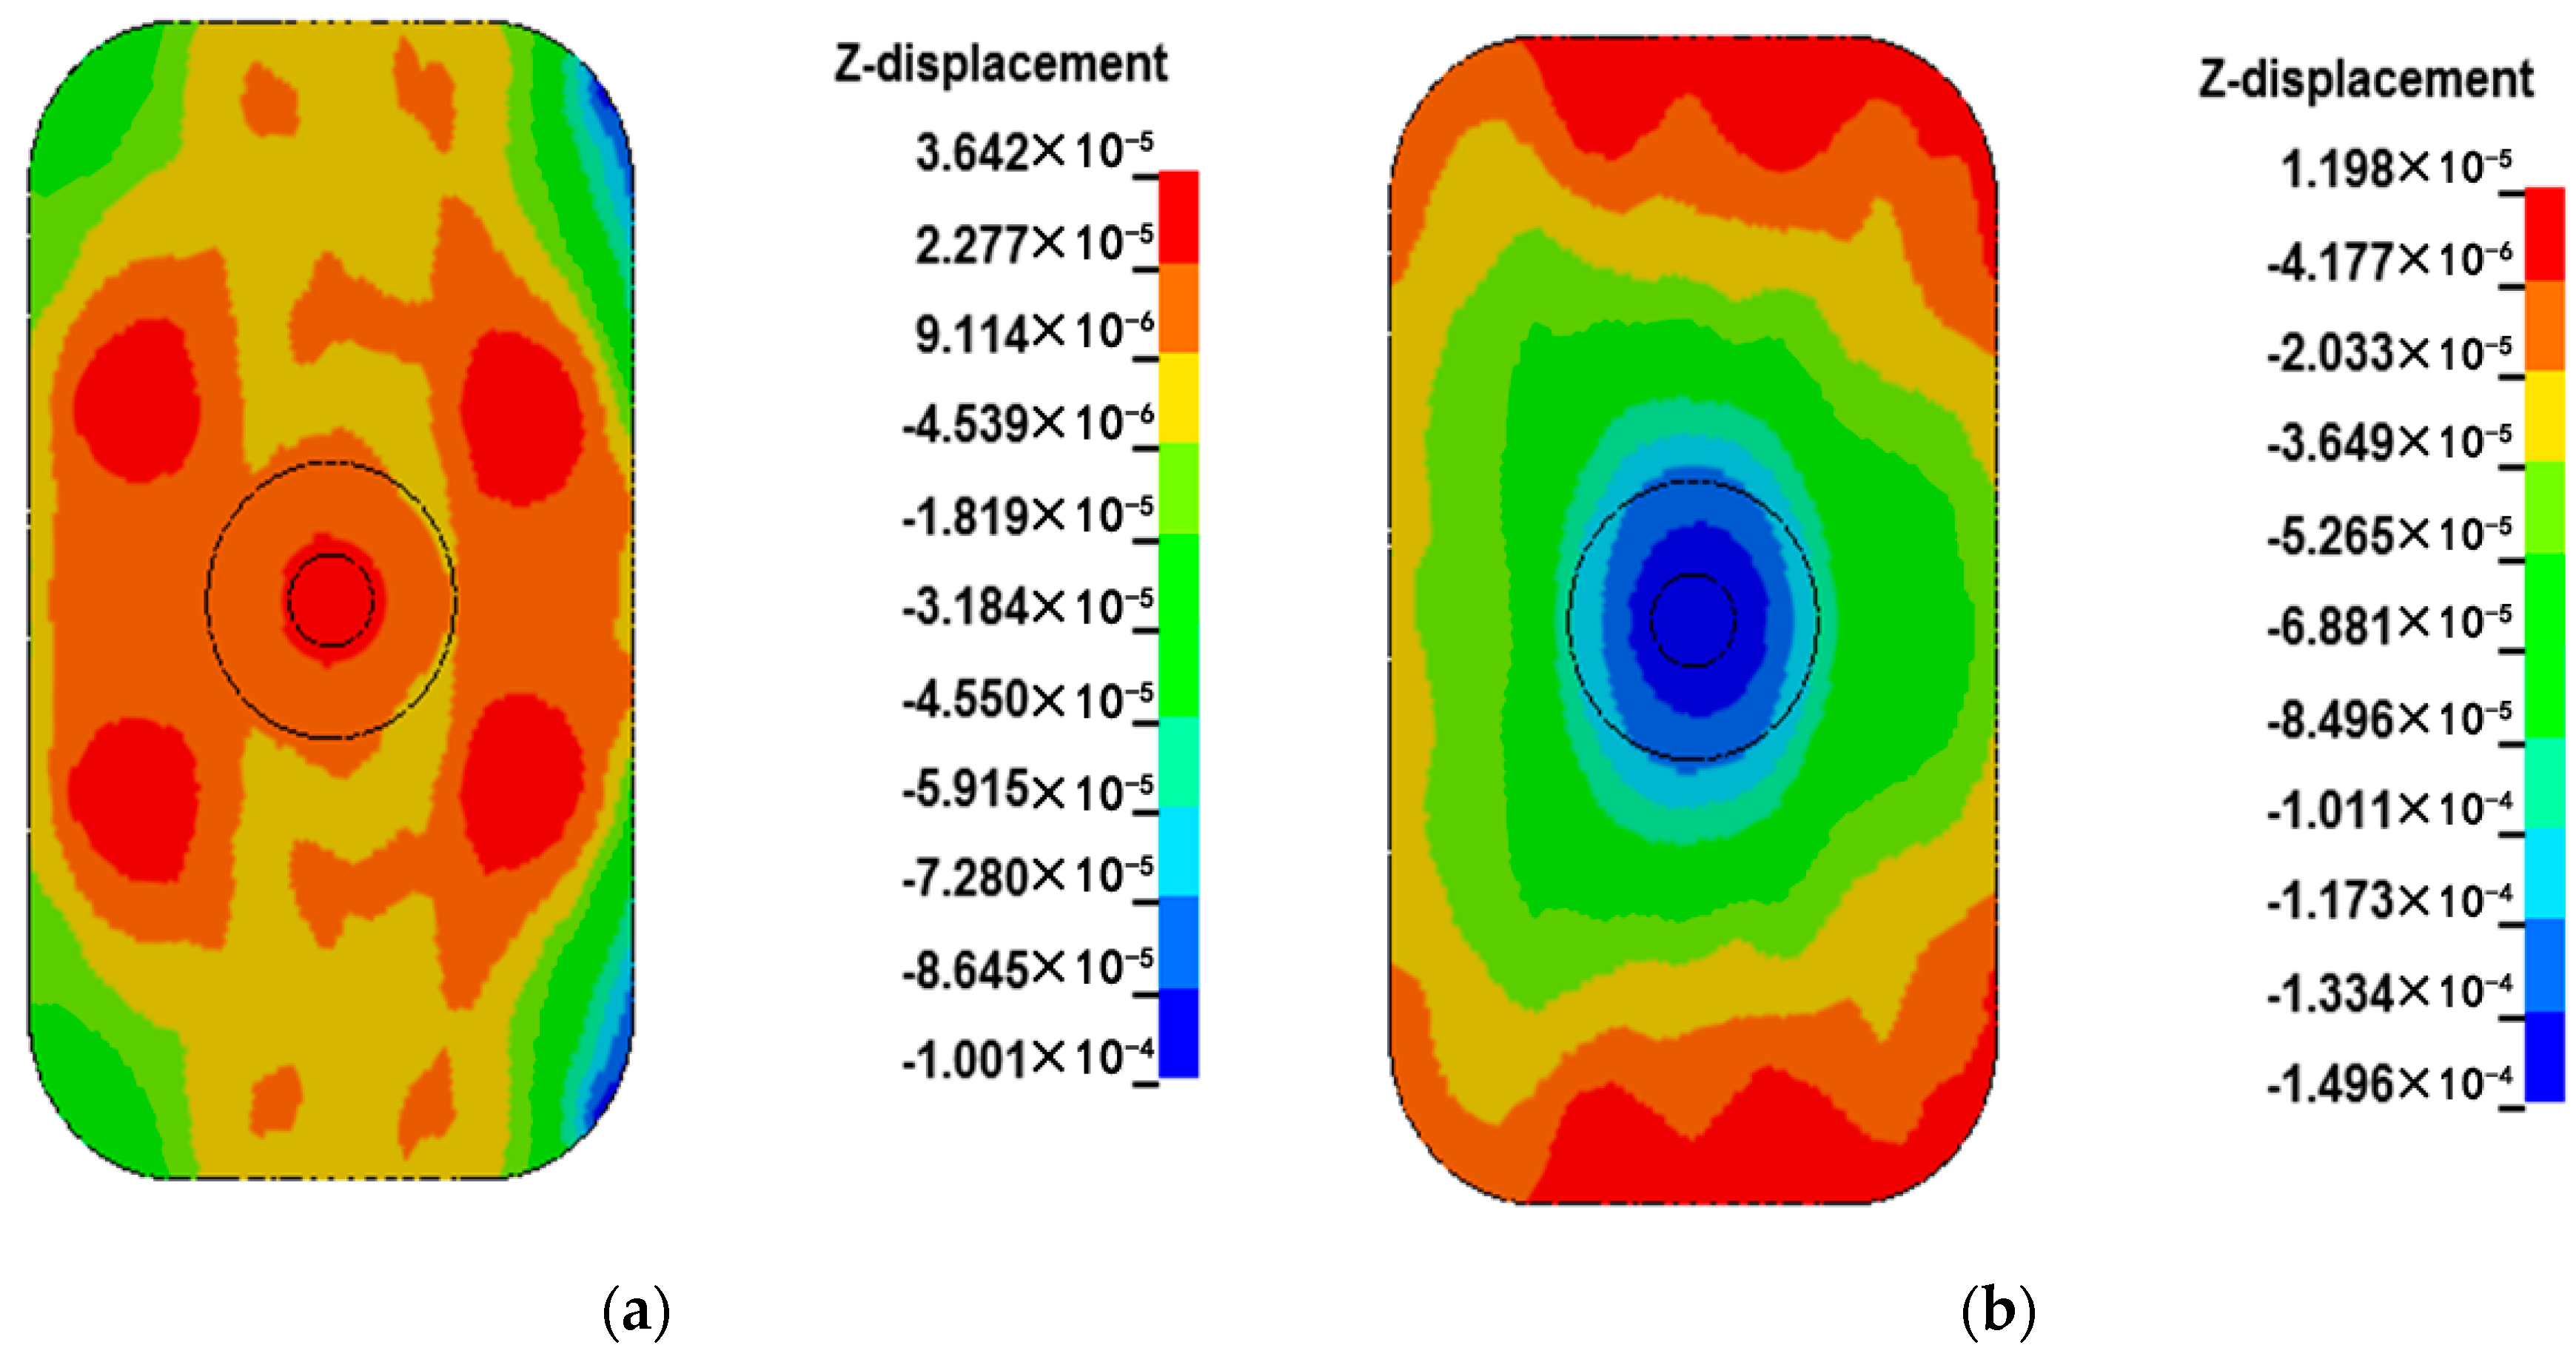
The deformation distribution of the plate was extracted respectively when the liquid pressure reaches its peak at the upper and lower ends of the piston rod within one cycle. The results are shown in Figure 13.
- In the upper half of the cycle, when the liquid pressure reaches the maximum value, the whole plate deforms downward on the upper surface of the plate. The maximum value of deformation is 3.2 × 10⁻⁴ m near the piston rod; it deformed downward near the vertical column, showing a larger value. The edge of the plate has an upward deformation.
- In the second half of the cycle, when the liquid pressure reaches the maximum value, the whole plate deforms upward on the upper surface of the plate. The maximum value of deformation is 2.2 × 10⁻⁴ m near the piston rod, and the upward deformation near the vertical column presents a large value. The edge of the plate has downward deformation.
According to the deformation analysis, the whole of the plate is subjected to periodic deformation in the working process. The position of the short edge weld of the vertical column plate is shown in Figure 3. As a relatively fragile structure on the plate, the welding seam is prone to cracking under such conditions, which is consistent with the crack position observed in the welding seam.
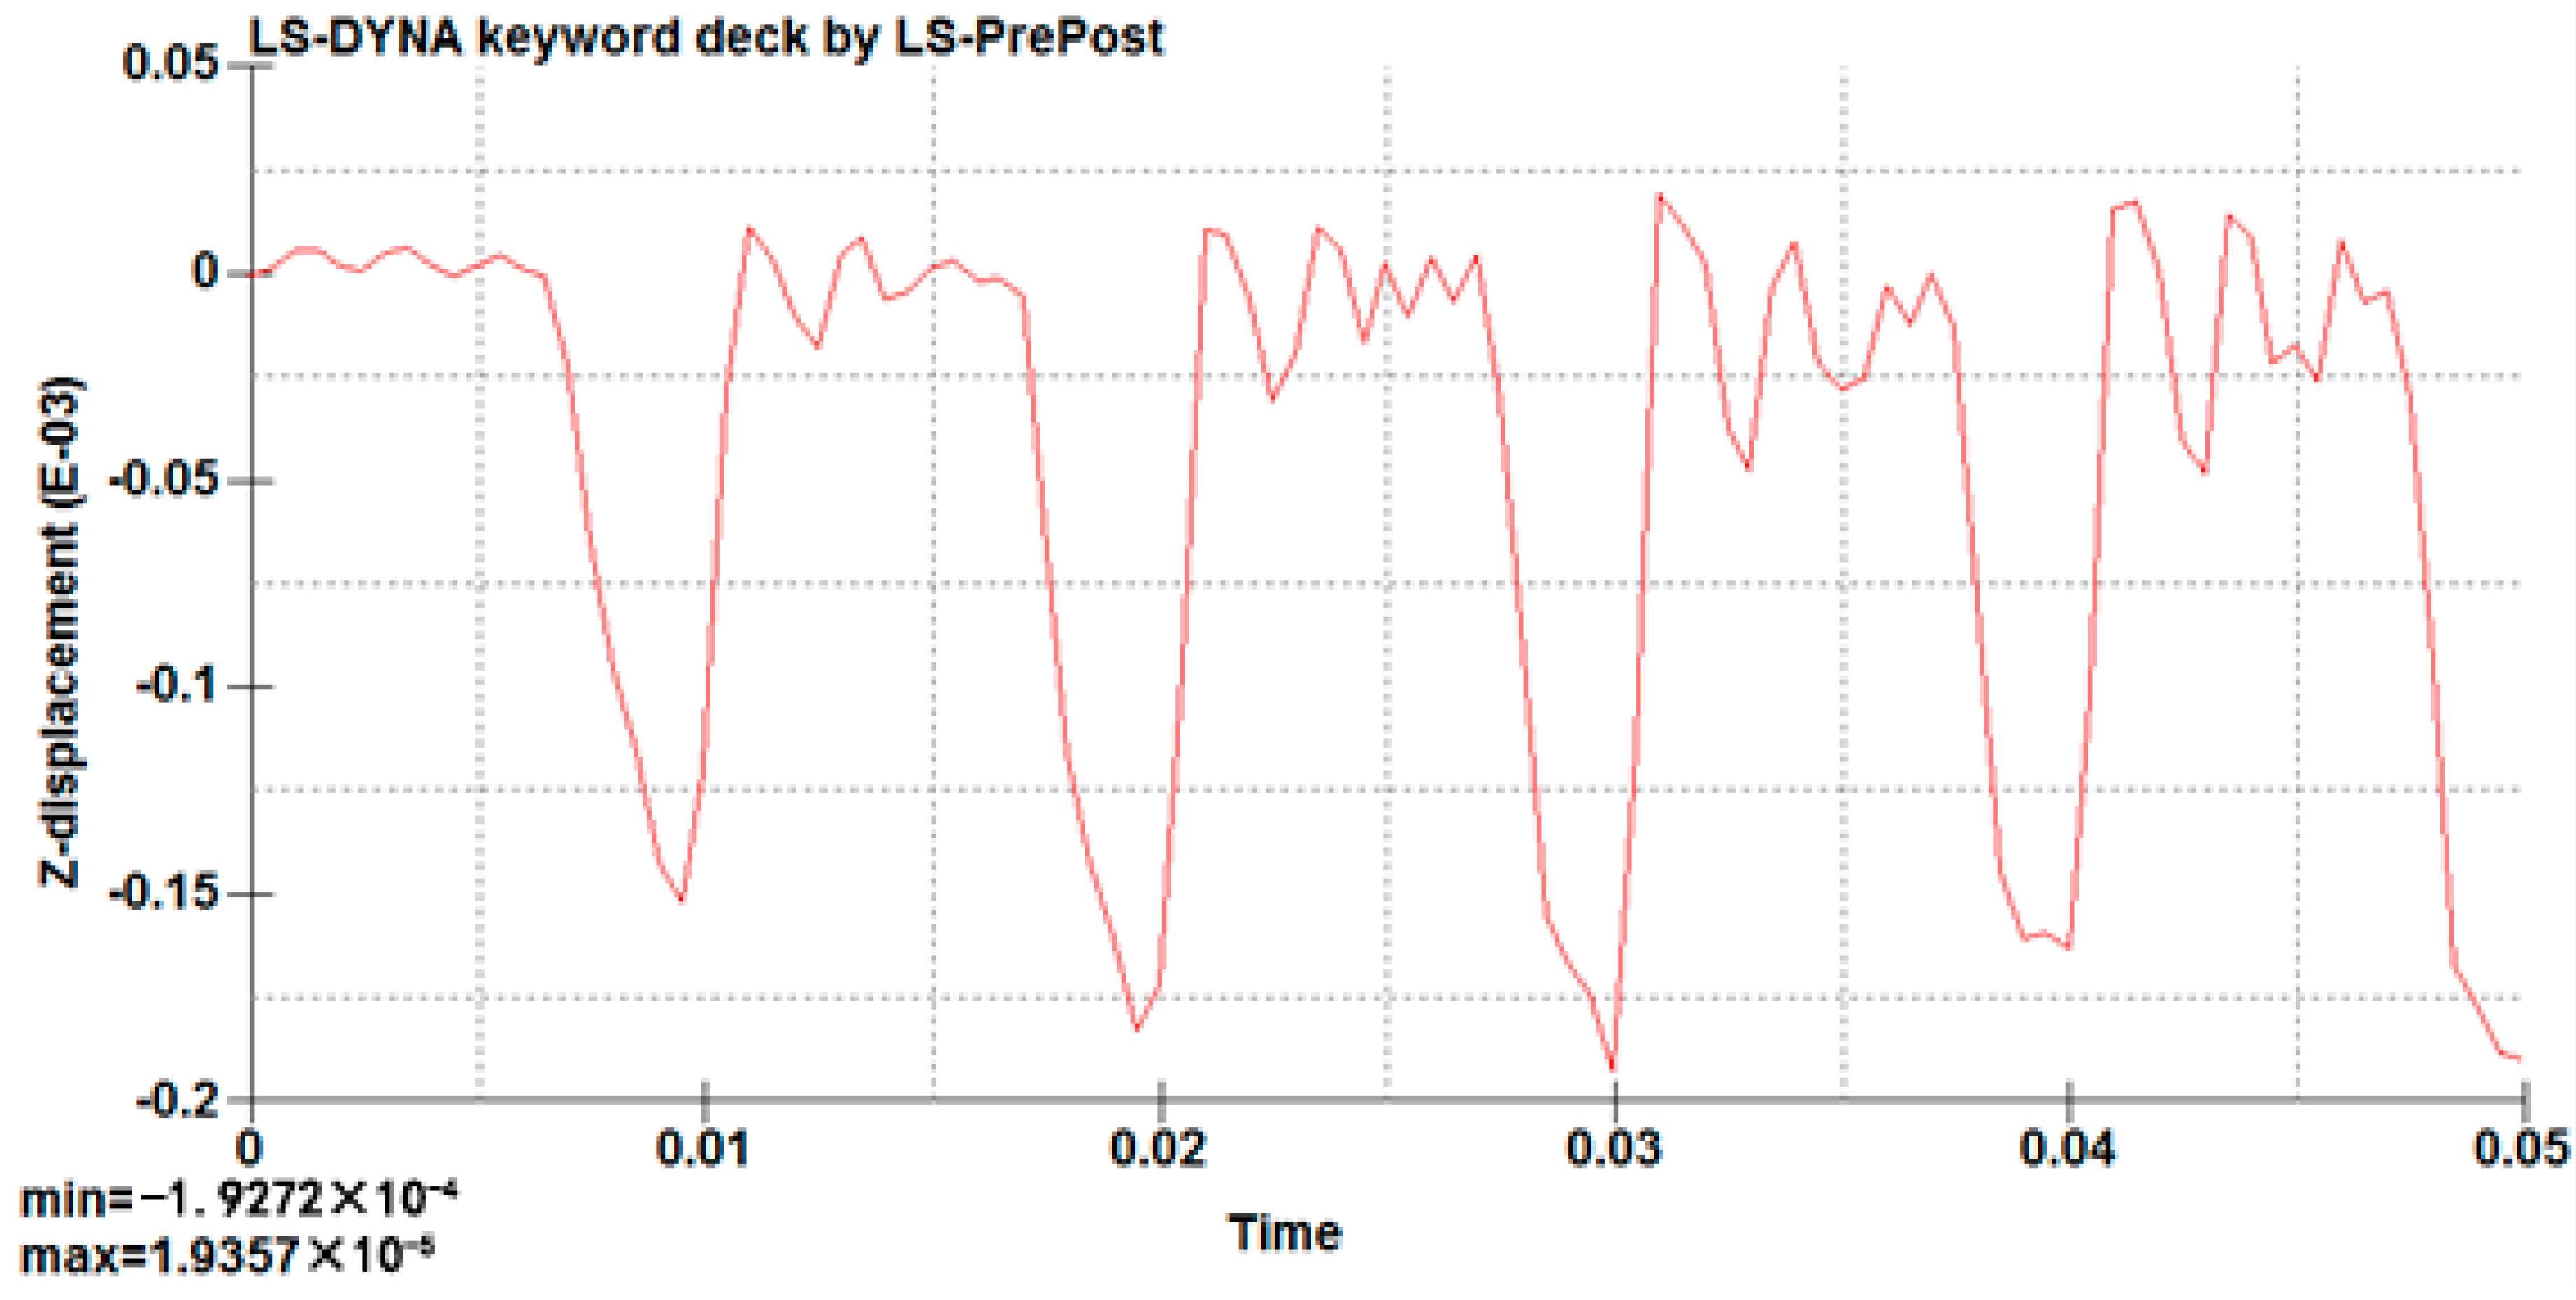
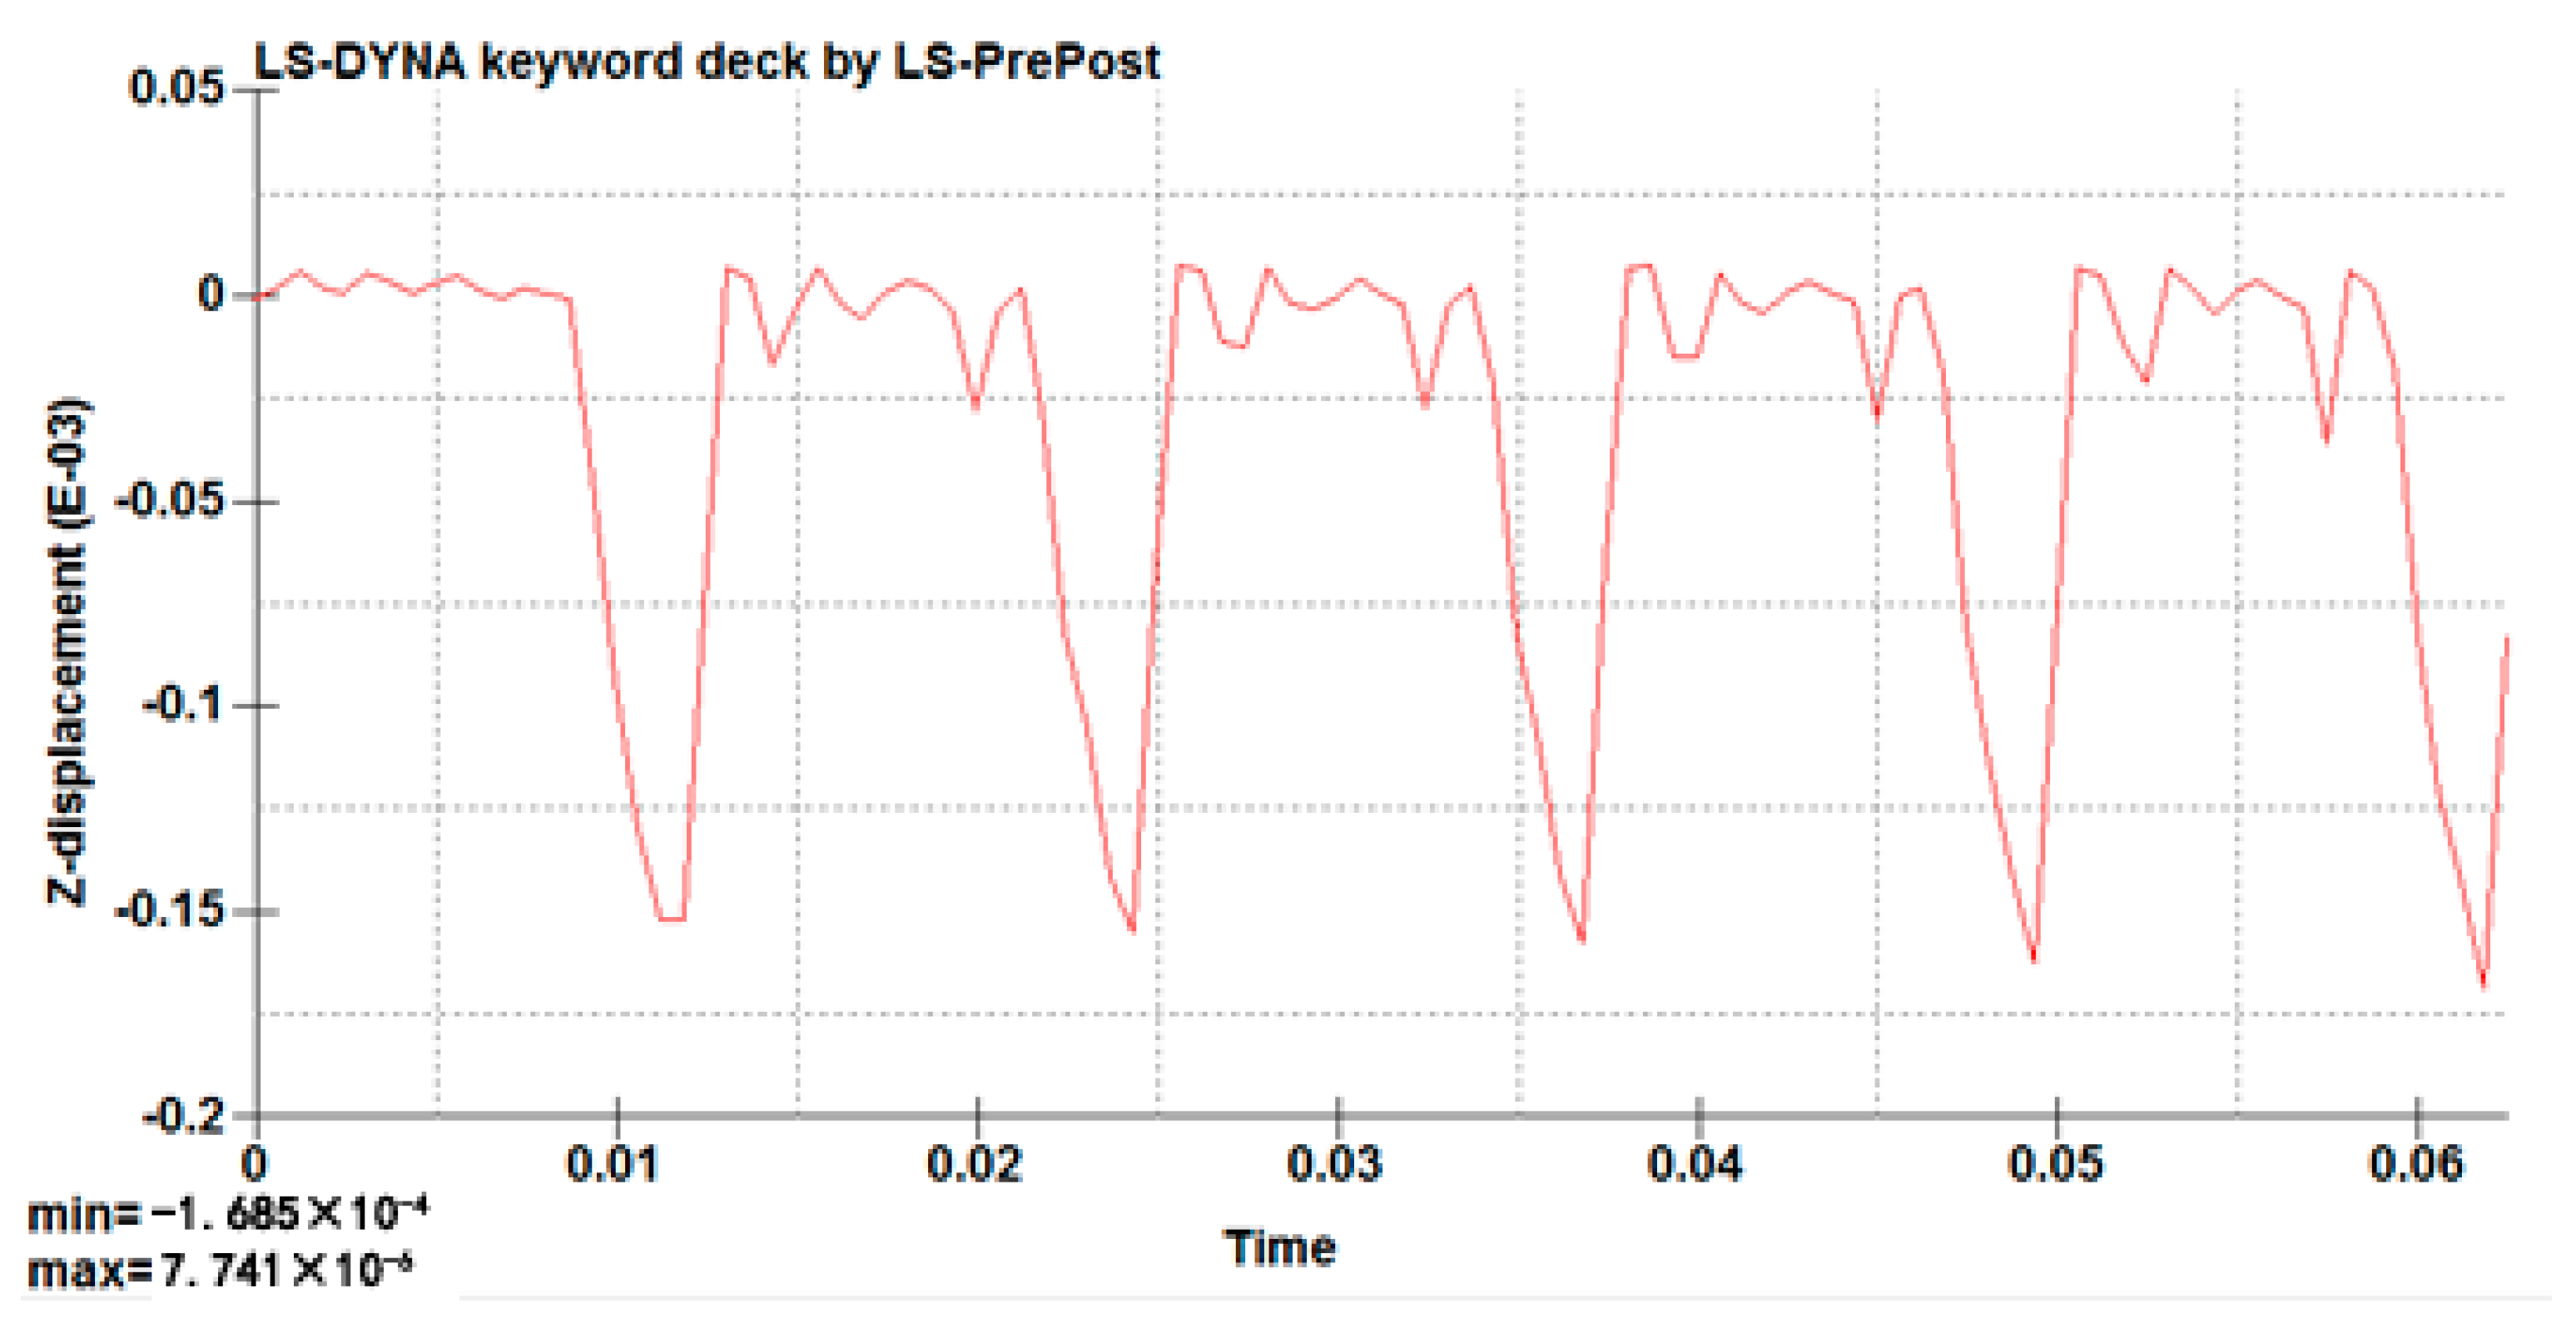
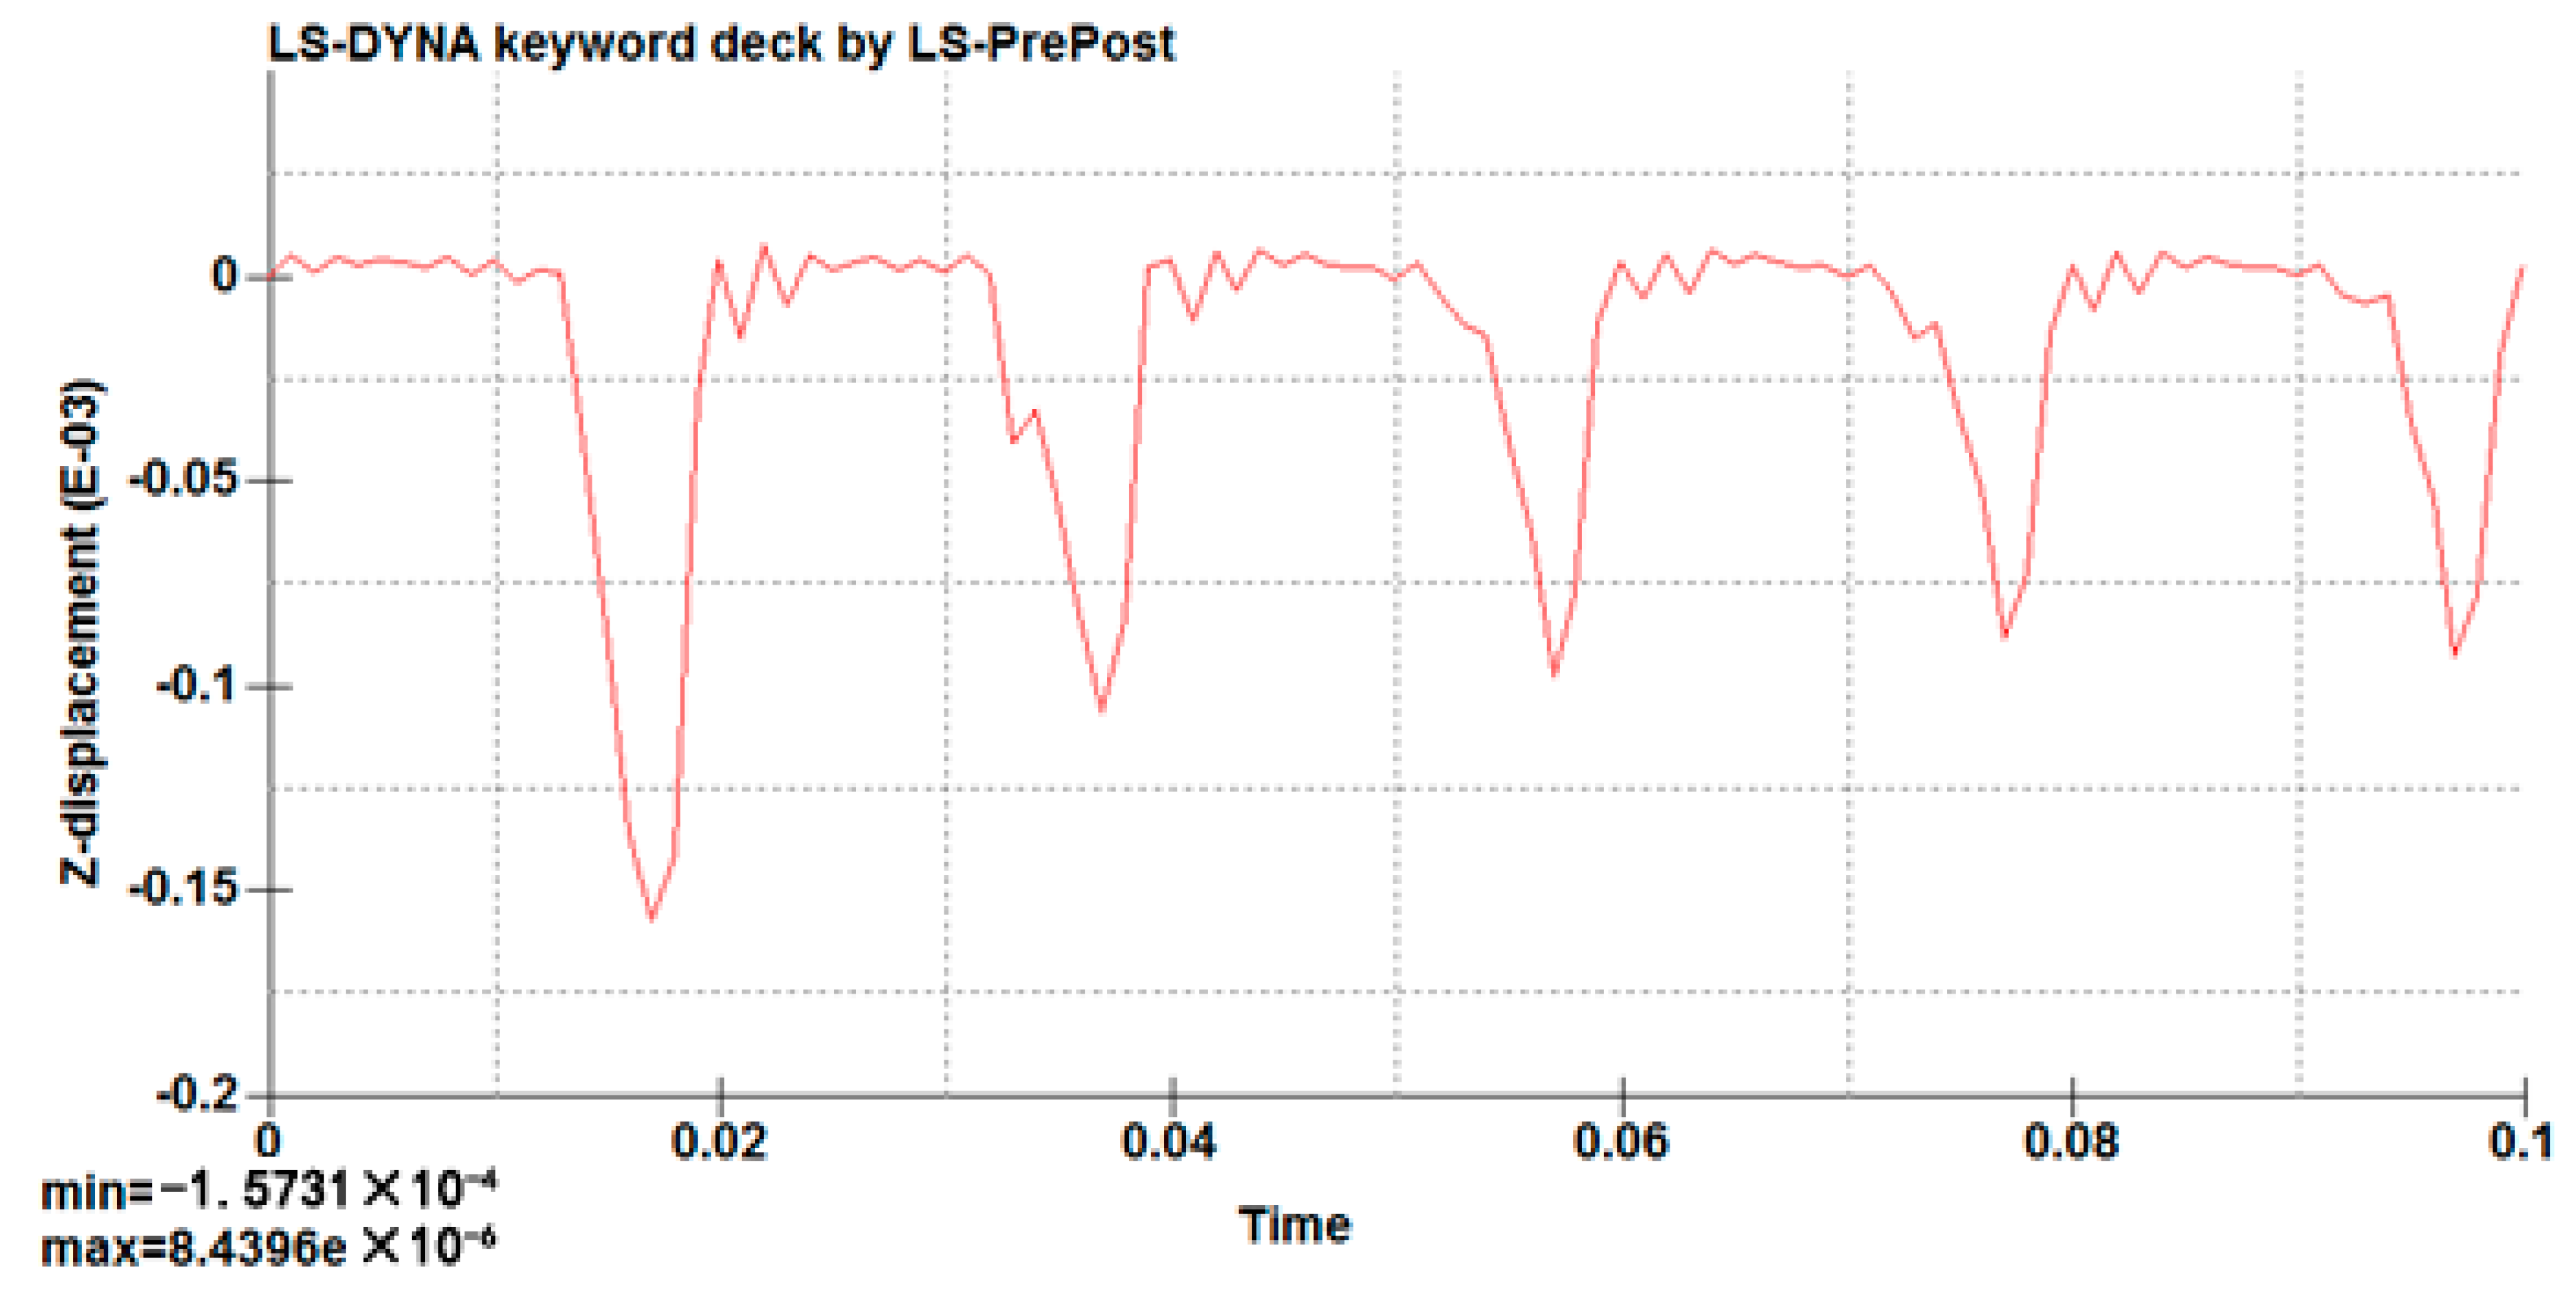
For further analysis, the data for the mid-point of the short edge seam of the vertical column were extracted, and the displacement–time curve was drawn, as shown in Figure 14.
After the system is stable (the fifth cycle), the displacement at the mid-point of the weld shows alternating changes with time in the positive and negative directions; the maximum value of the downward deformation is 7.74 × 10⁻⁶ m, and the that of the upward deformation in the lower half period is 1.69 × 10⁻⁴ m.
7. Analysis of Working Stress and Deformation of Plate at Different Frequencies under the Action of Liquid Pressure
The working load will lead to the deformation of the plate, and change its stress distribution, resulting in stress concentration, which is a hidden problem for the cracks in the plate’s welding seam. Among them, the rated output and self-weight of vibroseis are restricted by the conditions. This does not usually change, and the vibrator as a source of multiple frequency output, frequency fluid pressure can be changed and controlled. With a working frequency for 5~125 Hz, we selected 50 Hz, 100 Hz, and 80 Hz, analyzed the stress and displacement of plate by using the method of simulation under three kinds of liquid pressure frequencies, and studied the influence of liquid pressure frequency on working stress and plate deformation.
The stress distribution of the plate is obtained when the liquid pressure of 50 Hz reaches its peak at the upper and lower ends of the piston rod within a period. The results are shown in Figure 15.
- In the upper half of the cycle, when the liquid pressure reaches the maximum value, the von Mises stress on the surface of the plate reaches the maximum value in the piston rod area, 23.2 MPa. Larger values are presented near the long side of columns A, B, C, and D, respectively 12.9, 8.6, 7.5, and 7.8 MPa. Large values are presented at air springs A and B, respectively 4.6 and 3.8 MPa.
- In the second half of the cycle, when the liquid pressure reaches the maximum value, the von Mises stress on the upper surface of the plate reaches the maximum value in the piston rod area, 17.1 MPa, and larger values are displayed on the short edge of the vertical columns A, B, C, and D, respectively 9.4, 8.4, 10.1, and 11.9 MPa.
- Compare the stress distribution of the plate under 80 Hz liquid pressure to others. When the upper semi-periodic stress value under 50 Hz reaches the maximum, there is no stress concentration on the short edge of the column.
Similarly, the mid-point of the short weld edge was taken as being representative, and the data for the change of stress over time were extracted, as shown in Figure 16.
As shown in Figure 16, after the system is stable (the fifth cycle), the longitudinal stress on the weld mid-point in the first half cycle is converted from tensile stress to compressive stress; the maximum value is 2.4 MPa. In the second half cycle, the stress is converted from compressive stress to tensile stress; the maximum value is 9.8 MPa. The transverse stress in the first half cycle is converted from tensile stress to compressive stress; the maximum value is 0.9 MPa. In the second half cycle, the stress is converted from compressive stress to tensile stress; the maximum value is 4.8 MPa. As an overall trend, stress is present during the periodical change of tensile stress and compressive stress. Based on this data, there is a peak stress in the weld.
The deformation distribution of 50 Hz liquid pressure on the plate in one cycle was extracted, as was the mid-point displacement–time curve of the welding seam. The results are shown in Figure 17 and Figure 18.
- In the upper half of the cycle, when the liquid pressure reaches the maximum value, the whole plate deforms downward on the upper surface. The maximum value of the deformation is 2.8 ×10⁻⁵ m near the piston rod, while the downward deformation near the column presents a larger value, 8.8 × 10⁻⁶ m. The edge of the plate has upward deformation.
- In the second half of the cycle, when the liquid pressure reaches the maximum value, on the upper surface of the plate the deformation has a maximum value near the piston rod, 1.5 × 10⁻⁴ m, the upward deformation near the four vertical columns. The short edge of the plate deforms downward.
- By analyzing the deformation of the whole, under the effect of liquid pressure of 50 Hz, the deformation law of the whole plate in the working process is quite similar to that under 80 Hz, and the position of the short edge weld of the column plate shows up and down deformation alternately over the whole cycle.
The data for the mid-point of the short edge seam of the vertical column were extracted, and the displacement–time curve was drawn, as shown in Figure 18.
After the system is stable (the fifth cycle), the displacement at the mid-point of the weld shows alternating changes with time in the positive and negative direction; the maximum value of downward deformation of the plate in the upper half of the cycle is 5.3 × 10⁻⁶ m. The maximum value of the upward deformation in the second half of the cycle is 9.1 × 10⁻⁵ m.
The stress distribution of the plate when the liquid pressure reaches its peak at the upper and lower ends of the piston rod within a period of 100 Hz was extracted, and the results are shown in Figure 19.
- In the upper half of the cycle when the liquid pressure reaches the maximum value, the von Mises stress on the upper surface of the plate reaches the maximum value in the piston rod area, 32.3 MPa, and the larger value is displayed near the vertical columns A, B, C, and D, respectively 10.1, 9.1, 13.4, and 9.6 MPa.
- In the second half of the cycle when the liquid pressure reaches the maximum value, the von Mises stress on the upper surface of the plate reaches the maximum value in the piston rod area, 33.6 MPa, and the larger value is shown at the long side of the vertical columns A and C, respectively 15.7 and 14.8 MPa, and the larger value is shown at the short edge of B and D, respectively 14.6 and 16.6 MPa.
- As for the stress distribution of the plate under 80 Hz liquid pressure, in the upper half of the cycle, the stress value under 100 Hz reaches the maximum. There is also a stress concentration near the column, while the stress distribution in the second half of the cycle is similar to that under 80 Hz.
Similarly, the mid-point of the short weld edge was taken as being representative, and the data for the change of stress over time was extracted, as shown in Figure 20.
As shown in Figure 20, after the system is stable (the fifth cycle), the longitudinal stress on the weld mid-point in the first half cycle is converted from tensile to compressive stress; the maximum value is 10 MPa. In the second half cycle, the stress is converted from compressive stress to tensile stress; the maximum value is 18.6 MPa. The transverse stress in the first half cycle is converted from tensile stress to compressive stress; the maximum value is 7.43 MPa. In the second half cycle, the stress is converted from compressive stress to tensile stress; the maximum value is 10.04 MPa. In the overall trend, stress is present at the periodical change of tensile stress and compressive stress. Based on this data, there is a peak stress in the weld.
The deformation distribution of 100 Hz liquid pressure on the plate over one cycle was extracted, as was the time–displacement curve of the mid-point of the weld seam. The results are shown in Figure 21 and Figure 22.
- In the upper half of the cycle, when the liquid pressure reaches the maximum value, the piston rod and the column are deformed downward and the rest of the parts are deformed upward on the upper surface of the plate. The maximum deformation is 3.4 × 10⁻⁵ m near the piston rod, and it is deformed downward near the vertical column, showing a larger value.
- In the second half of the cycle, when the liquid pressure reaches the maximum value, on the upper surface of the plate, the deformation takes on a maximum value near the piston rod, 1.4 × 10⁻⁴ m, showing a larger value near the four vertical columns. The short edge of the plate deforms downward.
- According to the global deformation analysis, under 100 Hz liquid pressure, the deformation law of the whole plate in the working process is similar to that under 80 Hz, and the position of short edge weld of the column plate shows up and down deformation alternately over the whole cycle.
The data for the mid-point of the short edge seam of the vertical column were extracted, and the displacement–time curve was drawn, as shown in Figure 22.
After the system is stable (the fifth cycle), the displacement at the mid-point of the weld shows alternating changes with time in the positive and negative direction. The maximum value of downward deformation in the upper half cycle is 1.94 × 10⁻⁵ m, and that of upward deformation in the lower half period is 1.83 × 10⁻⁴ m.
The data were collated under the three frequencies, as shown in Table 2.
- The stress on the welding seam of the vertical column is mostly tensile stress, but is compressive stress in a small period.
- The maximum transverse stress and maximum longitudinal stress of the vertical welding seam of the vertical column increased with the rise in frequency, among which the tensile stress was clearly higher than the compressive stress.
- The peak value and variation amplitude of the deformation of the welding seam increased with the rise in liquid pressure frequency, and the deformation became more obvious with the rise in frequency.
8. Summary
(1) The stress and displacement of the plate are greatly influenced by the liquid pressure frequency in the working frequency of the vibrator.
(2) Under the working frequency of the vibration device, the maximum stress in the weld area of the short edge of the vertical column increases with the increase in liquid pressure frequency.
(3) The welding zone of the short edge of the vertical column has a stress concentration under three working frequencies; there is a peak value, and most of the time, stress is tensile stress.
(4) The deformation of the welds on the short edge of the primary welding line alternates in positive and negative directions throughout the cycle, and the peak value and variation amplitude rise with the increase in liquid pressure frequency, and the deformation is more obvious.
(5) A stress peak exists in the short edge weld area, and the displacement deformation is produced continuously as the vibrator operates; this area can therefore be determined as being the most susceptible to plate cracking.
Author Contributions
Conceptualization, Z.K.; Methodology, Z.K.; Software, F.W.; Validation, G.L.; Formal Analysis, Z.K. and F.W.; Investigation, Z.K. and R.S.; Resources, H.Z. and G.L.; Data Curation, Z.K.; Writing-Original Draft Preparation, Z.K.; Writing-Review & Editing, R.S.; Visualization, H.Z.; Supervision, R.S.; Project Administration, G.L.; Funding Acquisition, G.L.
Funding
This research was funded by Basic research project of sichuan science and technology department grant number 18YYJC0217. The APC was funded by Gangjun Li.
Acknowledgments
I would like to thank my parents for their support and my mentor Zhiqiang Huang for their care and guidance.
Conflicts of Interest
The authors declare no conflict of interest.
References
- Ma, Y.C. Research and application based on reflection wave seismic exploration. Agric. Sci. Technol. Inf. 2017, 11, 43–46. [Google Scholar]
- Tong, X.Q.; Lin, J.; Jiang, T. Summary of development. Prog. Geophys. 2012, 5, 1912–1921. [Google Scholar]
- Wei, Z.H.; Phillips, T.; Hall, F.; Michael, A. Fundamental discussions on seismic vibrators Basic overview on seismic vibrators. Geophysics 2010, 75, 13–25. [Google Scholar] [CrossRef]
- Wei, Z.H. Modelling and modal analysis of seismic vibrator baseplate. Geophys. Prospect. 2010, 58, 19–32. [Google Scholar] [CrossRef] [Green Version]
- Wei, Z.H. How good is the weighted-sum estimate of the vibrator ground force? Lead. Edge 2009, 28, 960–965. [Google Scholar] [CrossRef]
- Ding, Z.G. Discussion on seismic vibration vibrator. Equip. Geophys. Prospect. 1998, 4, 36–38. [Google Scholar]
- Zhuang, J.; Lin, J.; Wu, D.J. Analyzing coupling process of the earth-high frequency vibrator. J. Changchun Univ. Sci. Technol. 1999, 29, 184–187. [Google Scholar]
- Tao, Z.F. Current situation and problems of vibroseis. Equip. Geophys. Prospect. 1995, 5, 11–26. [Google Scholar]
- Zhuang, J.; Lin, J.; Wu, D.J.; Zhang, B.J.; Zhang, Z.S. Amplitude-frequency analysis of the coupling process of high frequency vibroseis and ground vibration. J. Changchun Univ. Sci. Technol. 1999, 2, 184–187. [Google Scholar]
- Huang, Z.Q.; Ding, Y.P.; Tao, Z.F.; Hao, L.; Li, G. Research status and development direction of vibroseis vibrator baseplate at home and abroad. Oil Field Equip. 2015, 6, 1–5. [Google Scholar]
- Tao, Z.F.; Su, Z.H.; Zhao, Y.L.; Ma, L. The latest development of low frequecy vibrator for seismic. Equip. Geophys. Prospect. 2010, 20, 1–5. [Google Scholar]
- Claudio, B. Low-frequency vibroseis date with maximum displacement sweeps. Lead. Edge 2008, 27, 582–591. [Google Scholar]
- Nguyen-Thanh, N.; Huang, J.; Zhou, K. An isogeometric-meshfree coupling approach for analysis of cracks. Int. J. Numer. Methods Eng. 2017, 113, 1630–1651. [Google Scholar] [CrossRef]
- Mougenot, D. Land seismic: Needs and answers. First Break 2004, 22, 59–63. [Google Scholar]
- Chapman, W.L.; Brown, G.L.; Fair, D.W. The Vibroseis System: A High Frequency Tool. Geophysics 1981, 46, 1657–1666. [Google Scholar] [CrossRef]
- Walker, D. Harmonic resonance structure and chaotic dynamics in the earth-vibrator system. Geophys. Prospect. 1995, 43, 487–507. [Google Scholar] [CrossRef]
- Gurbuz, B.M. Upsweep Signals with High Frequency Attenuation and Their Use in the Construction of VIBROSEIS Synthetic Seismograms. Geophys. Prospect. 1982, 30, 432–443. [Google Scholar] [CrossRef]
- Sallas, J.J. Seismic vibrator control and down going P-wave. Geophys. Prospect. 1984, 49, 732–740. [Google Scholar]
- Haines, S.S. Design and Application of an Electromagnetic Vibrator Seismic Source. J. Environ. Eng. 2006, 11, 9–15. [Google Scholar] [CrossRef]
- Kalinski, M.E. Effect of Vibroseis Arrays on Ground Vibrations: A Numerical Study. J. Environ. Eng. 2007, 12, 281–287. [Google Scholar] [CrossRef]
- Nguyen-Thanh, N.; Zhou, K. An adaptive extended isogeometric analysis based on PHT-splines for crack propagation. Int. J. Numer. Methods Eng. 2017, 00, 1–30. [Google Scholar]
- Nguyen-Thanh, N.; Li, W.; Zhou, K. Static and free-vibration analyses of cracks in thin-shell structures based on an isogeometric-meshfree coupling approach. Comput. Mech. 2018, 61, 1–23. [Google Scholar] [CrossRef]
Figure 1.
Schematic diagram of vibrator structure.
Figure 2.
The working principle of a vibrator.
Figure 3.
Schematic diagram of the weld cracking position.
Figure 4.
Vibrator geometric model.
Figure 5.
Vibrator geogrid.
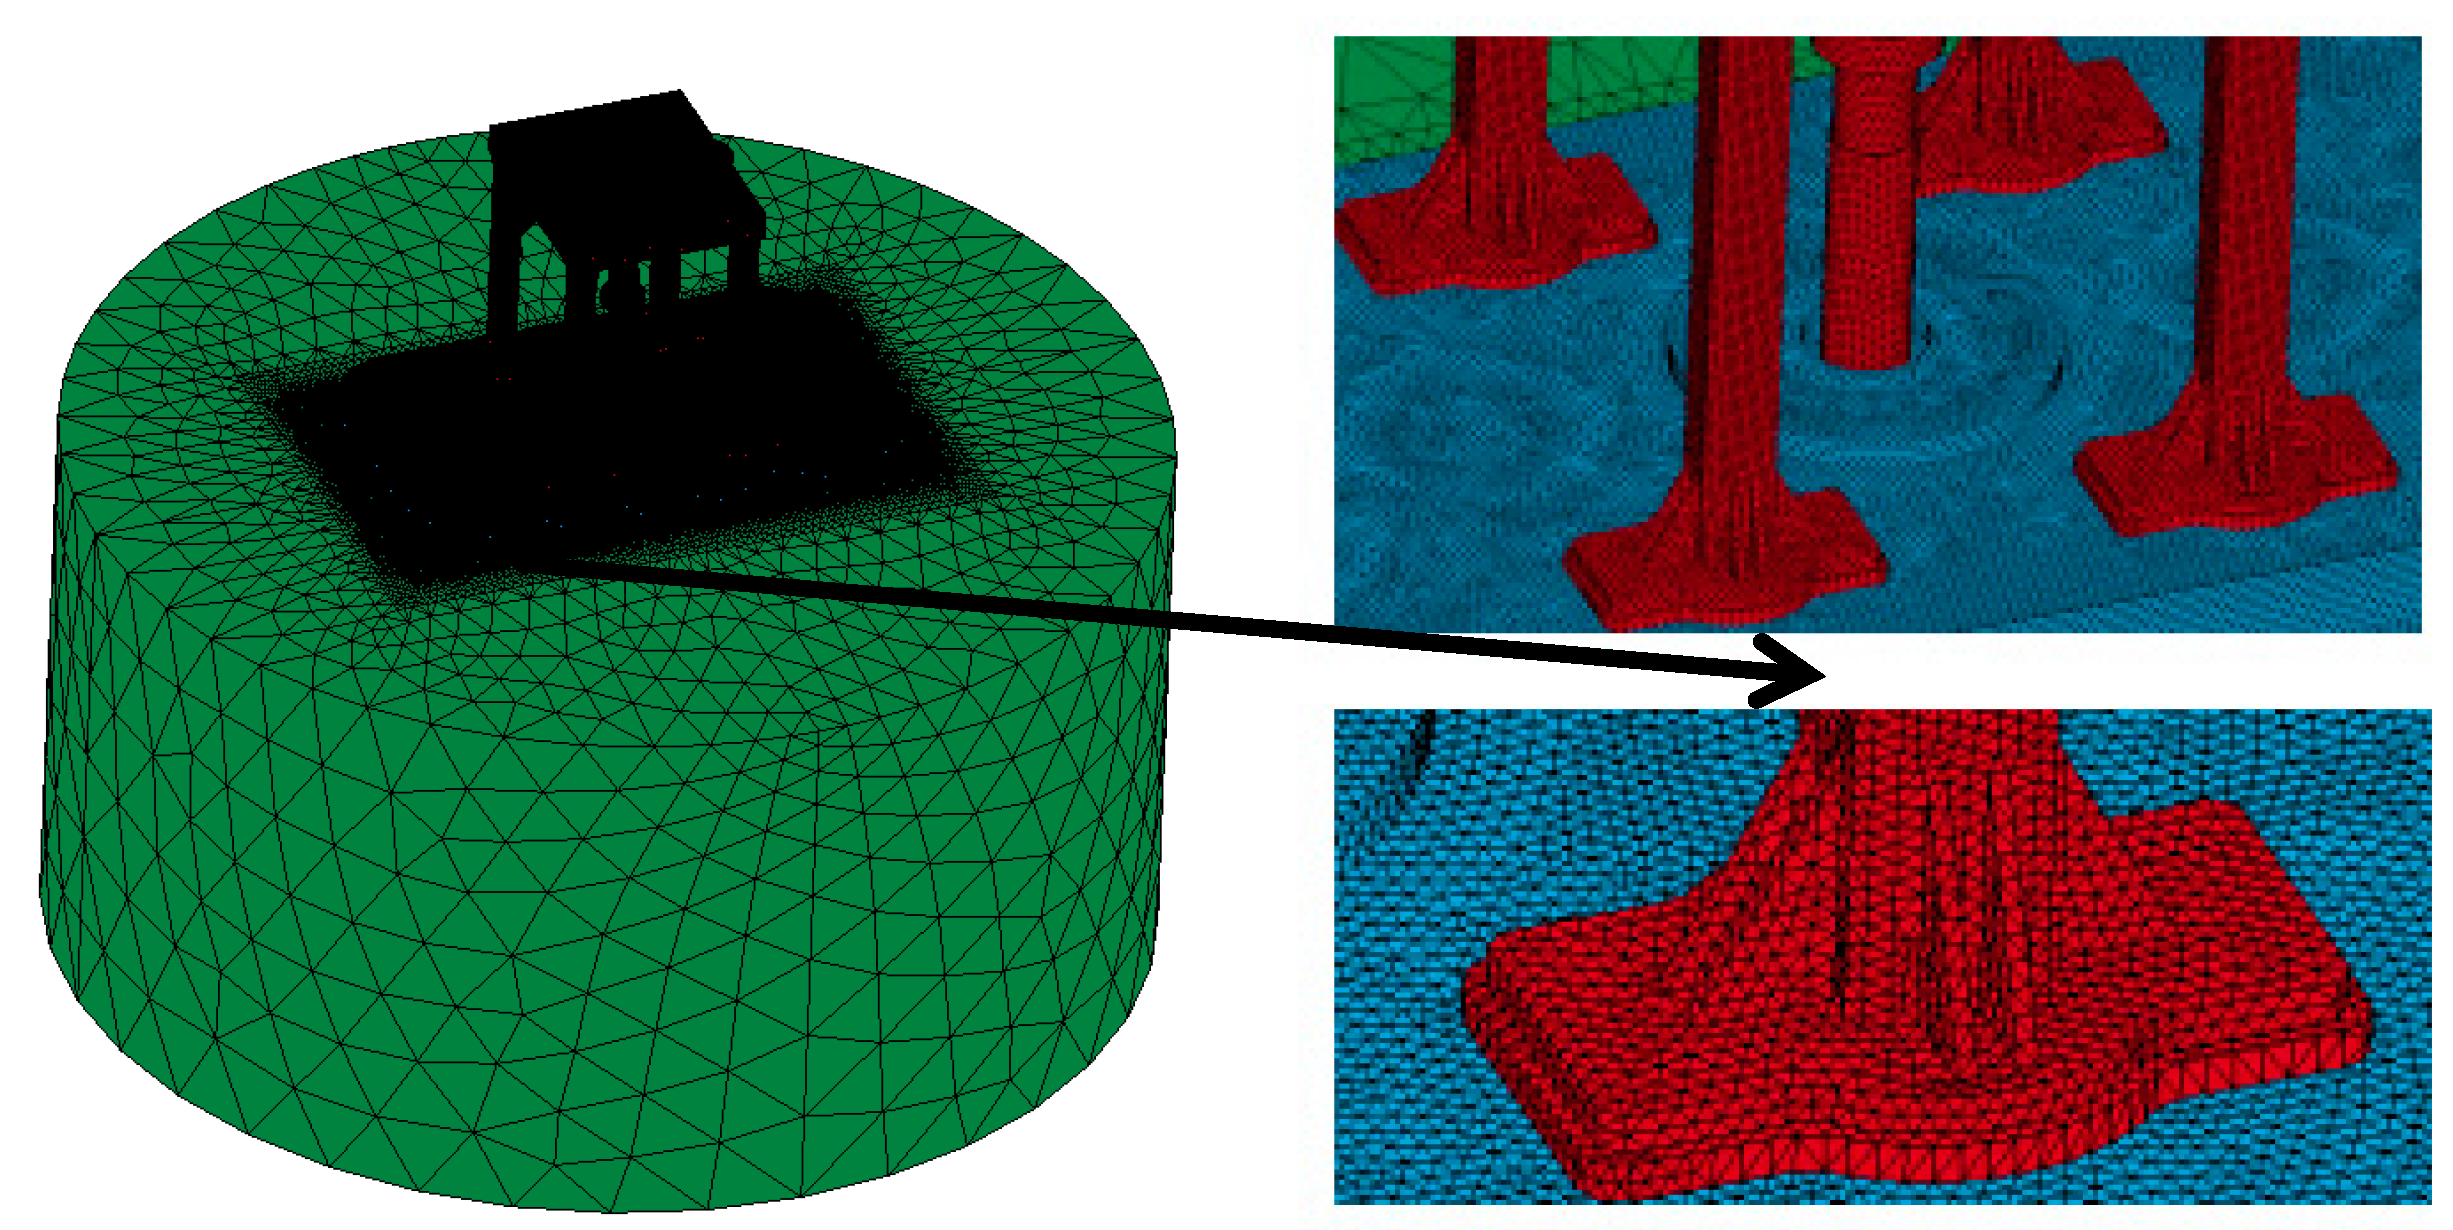
Figure 6.
Vibrator loading diagram.
Figure 7.
Dynamic load curve of vibrator.

Figure 8.
Regional location and labeling of the vibrator plate.
Figure 9.
Stress distribution of plates. (a) plate stress distribution at the maximum of upper half cycle; (b) plate stress distribution at the maximum of lower half cycle.
Figure 9.
Stress distribution of plates. (a) plate stress distribution at the maximum of upper half cycle; (b) plate stress distribution at the maximum of lower half cycle.
Figure 10.
Longitudinal stress of weld joint.
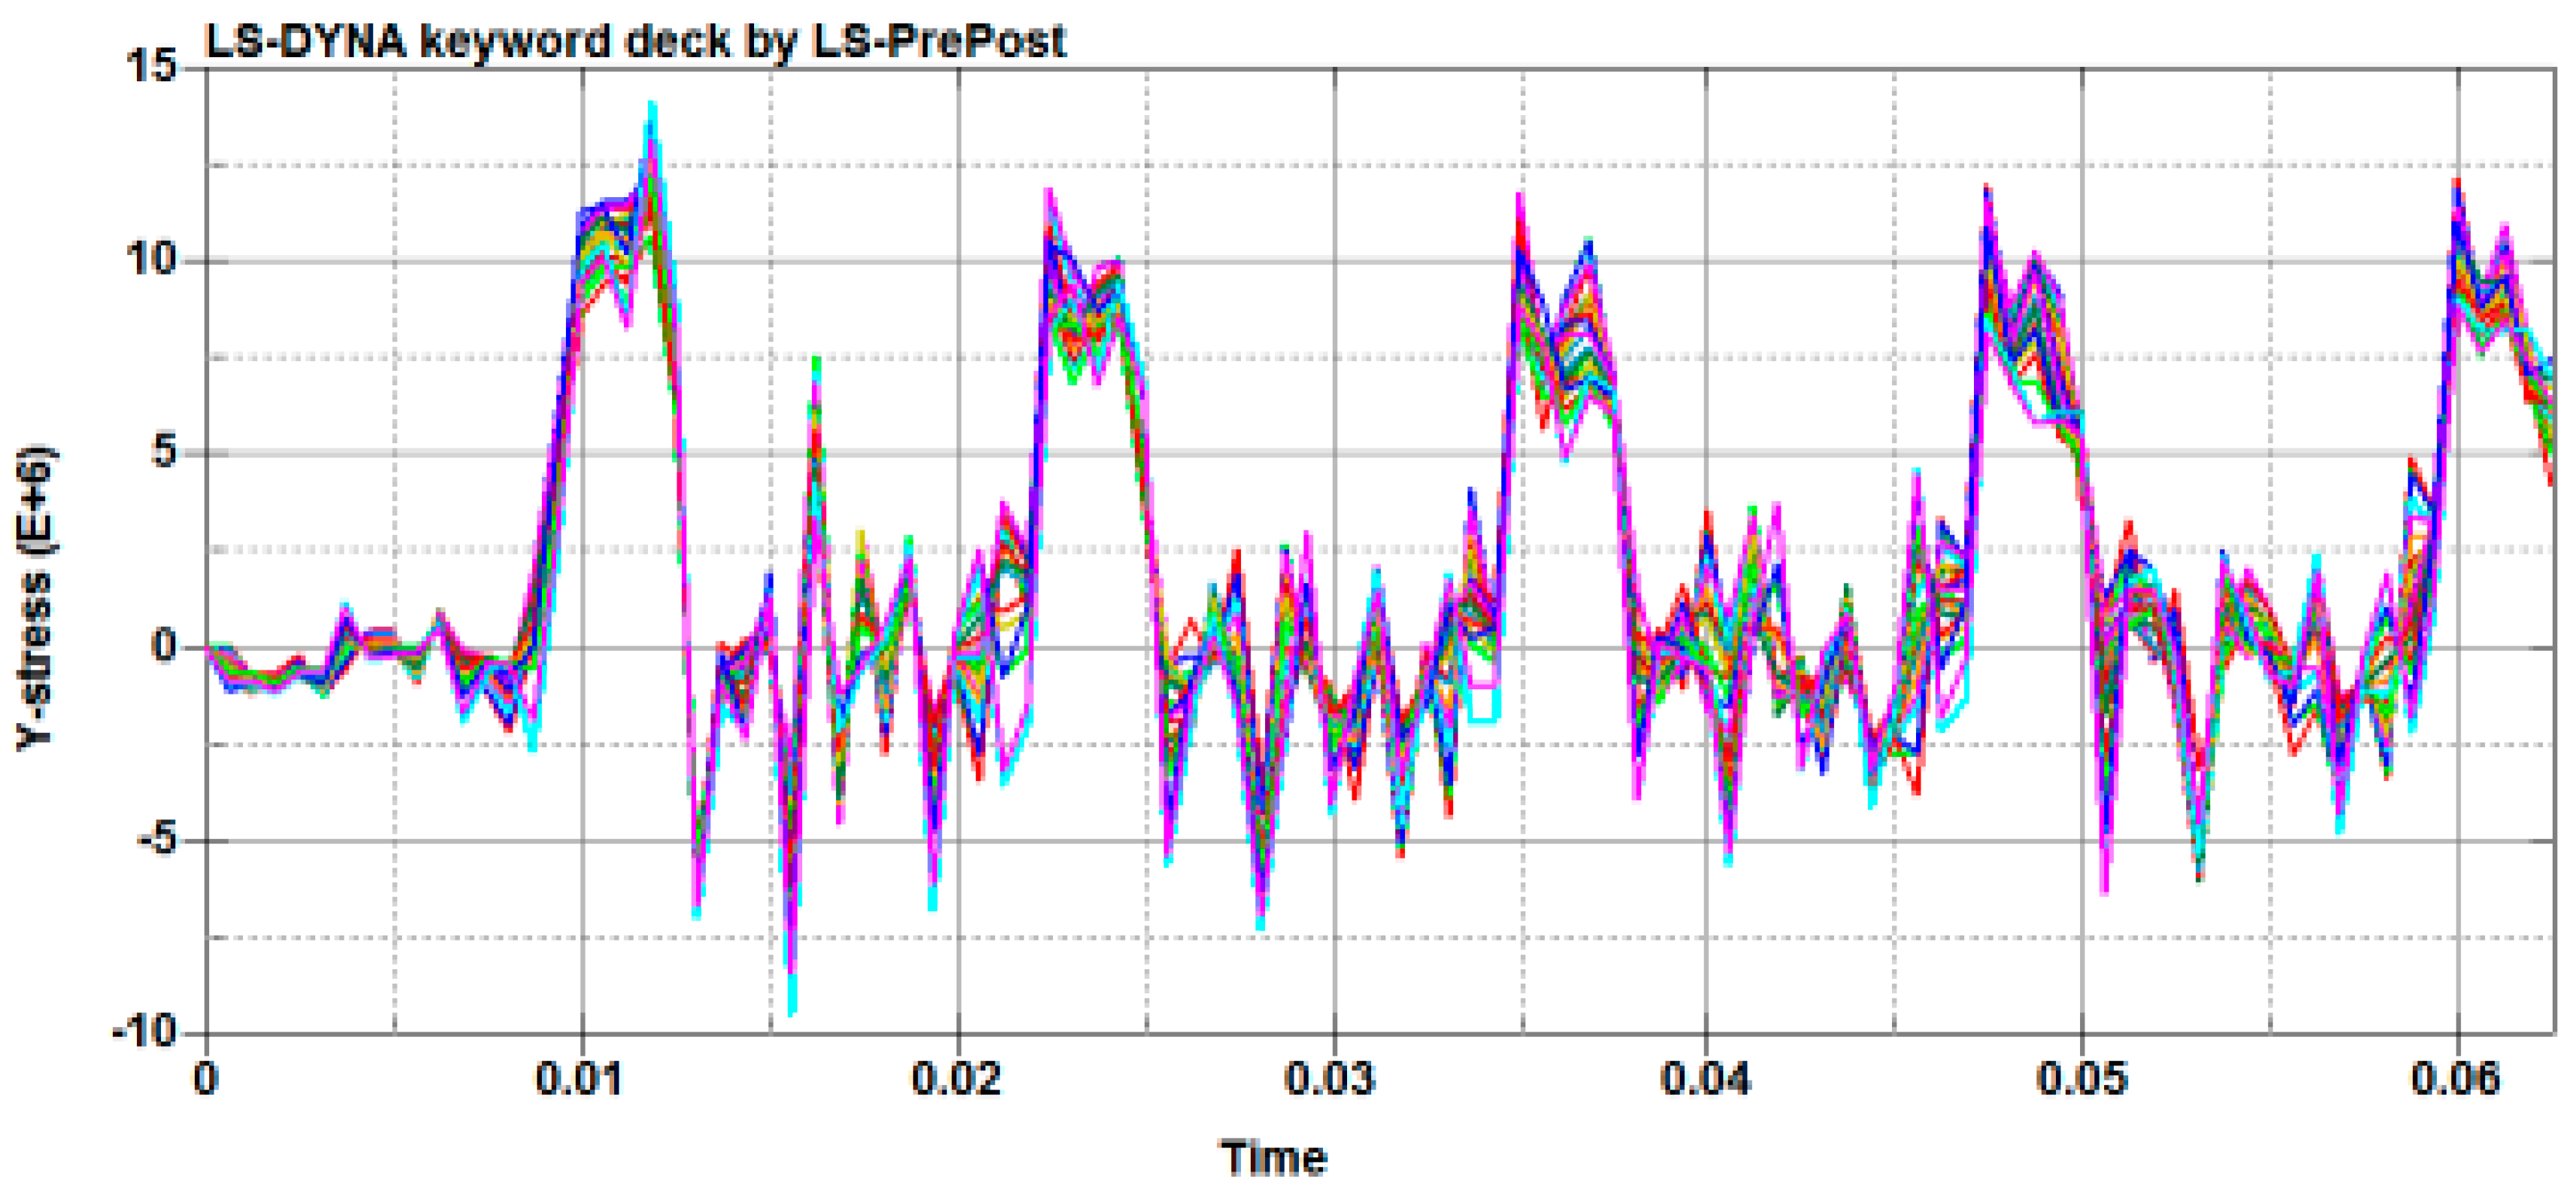
Figure 11.
Transverse stress of weld joint.
Figure 12.
Schematic diagram of stress change at the mid-point of weld. (a) longitudinal stress. (b) transverse stress.
Figure 12.
Schematic diagram of stress change at the mid-point of weld. (a) longitudinal stress. (b) transverse stress.
Figure 13.
Schematic diagram of plate deformation. (a) plate deformation distribution at the upper half cycle maximum. (b) plate deformation distribution at the lower half cycle maximum.
Figure 13.
Schematic diagram of plate deformation. (a) plate deformation distribution at the upper half cycle maximum. (b) plate deformation distribution at the lower half cycle maximum.
Figure 14.
Displacement at the mid-point of weld.
Figure 15.
Distribution of plate stress under 50 Hz. (a) plate stress distribution at the maximum of upper half cycle. (b) plate stress distribution at the maximum of lower half cycle.
Figure 15.
Distribution of plate stress under 50 Hz. (a) plate stress distribution at the maximum of upper half cycle. (b) plate stress distribution at the maximum of lower half cycle.
Figure 16.
Variation of mid-point stress under 50 Hz. (a) longitudinal stress. (b) transverse stress.
Figure 16.
Variation of mid-point stress under 50 Hz. (a) longitudinal stress. (b) transverse stress.
Figure 17.
Deformation diagram under 50 Hz. (a) plate deformation distribution at the upper half cycle maximum. (b) plate deformation distribution at the lower half cycle maximum.
Figure 17.
Deformation diagram under 50 Hz. (a) plate deformation distribution at the upper half cycle maximum. (b) plate deformation distribution at the lower half cycle maximum.

Figure 18.
Displacement on mid-point of weld under 50 Hz.
Figure 19.
Distribution of plate stress under 100 Hz. (a) plate stress distribution at the maximum of upper half cycle. (b) plate stress distribution at the maximum of lower half cycle.
Figure 19.
Distribution of plate stress under 100 Hz. (a) plate stress distribution at the maximum of upper half cycle. (b) plate stress distribution at the maximum of lower half cycle.

Figure 20.
Variation of mid-point stress of welding seam under 100 Hz. (a) longitudinal stress. (b) transverse stress.
Figure 20.
Variation of mid-point stress of welding seam under 100 Hz. (a) longitudinal stress. (b) transverse stress.
Figure 21.
Deformation under 100 Hz. (a) plate deformation distribution at the upper half cycle maximum. (b) plate deformation distribution at the lower half cycle maximum.
Figure 21.
Deformation under 100 Hz. (a) plate deformation distribution at the upper half cycle maximum. (b) plate deformation distribution at the lower half cycle maximum.
Figure 22.
Displacement on mid-point of weld under 100 Hz.

Table 1.
Material parameters of the vibrator model.
| Parts | Materials | Density (kg/m3) | Elastic Modulus (Pa) | Poisson’s Ratio | Yield Strength (MPa) |
|---|---|---|---|---|---|
| Above-slab structure | 45 steel | 7890 | 2.09 × 10¹¹ | 0.269 | 355 |
| Tablet | 16 Mn | 7850 | 2.12 × 10¹¹ | 0.310 | 345 |
| Ground | rock | 2600 | 5.5 × 10¹⁰ | 0.270 | -- |
Table 2.
Stress and displacement of the mid-point of the weld at different frequencies.
| 50 Hz | 80 Hz | 100 Hz | |
|---|---|---|---|
| Maximum transverse tensile stress (MPa) | 4.8 | 8.9 | 10 |
| Maximum transverse compressive stress (MPa) | 0.9 | 6.4 | 7.43 |
| Maximum longitudinal tensile stress (MPa) | 9.8 | 15.5 | 18.6 |
| Maximum longitudinal compressive stress (MPa) | 2.4 | 5.5 | 10 |
| Maximum positive displacement (×10−5 m) | 9.1 | 16.9 | 18.3 |
| Maximum negative displacement (×10−5 m) | 0.53 | 0.77 | 1.9 |
© 2018 by the authors. Licensee MDPI, Basel, Switzerland. This article is an open access article distributed under the terms and conditions of the Creative Commons Attribution (CC BY) license (http://creativecommons.org/licenses/by/4.0/).
Share and Cite
MDPI and ACS Style
Kang, Z.; Li, G.; Wang, F.; Zhang, H.; Su, R. Analysis of Vibration Plate Cracking Based on Working Stress. Machines 2018, 6, 51. https://doi.org/10.3390/machines6040051
AMA Style
Kang Z, Li G, Wang F, Zhang H, Su R. Analysis of Vibration Plate Cracking Based on Working Stress. Machines. 2018; 6(4):51. https://doi.org/10.3390/machines6040051
Chicago/Turabian StyleKang, Zeyu, Gangjun Li, Fujun Wang, Huan Zhang, and Rui Su. 2018. "Analysis of Vibration Plate Cracking Based on Working Stress" Machines 6, no. 4: 51. https://doi.org/10.3390/machines6040051
Note that from the first issue of 2016, this journal uses article numbers instead of page numbers. See further details here.