Low-Rate Characterization of a Mechanical Inerter


School of Mechanical and Aerospace Engineering, Oklahoma State University, Stillwater, OK, 74078, USA
*
Author to whom correspondence should be addressed.
Machines 2018, 6(3), 32; https://doi.org/10.3390/machines6030032
Submission received: 25 May 2018
/
Revised: 10 July 2018
/
Accepted: 14 July 2018
/
Published: 18 July 2018
Abstract
:In this study, improved analytical models, numerical parametric explorations, and experimental characterization are presented for a mechanical inerter to bring out dependencies for dynamic mass amplification under low rates (<5 Hz) of excitation. Two common realizations of the inerter—the ball-screw and the rack-and-pinion versions—are considered. Theoretical models incorporating component inertias and sizing were developed for both versions. The dependence of the specific inertance on key design parameters is explored through simulations. Based on these simulations, a prototype rack-and-pinion inerter delivering a specific inertance above 90 was designed, fabricated, and tested under low-rate displacement and acceleration-controlled excitations. The measured specific inertance was found to display an exponential decline with an increase in excitation frequency for both cases. Deviations from predictions are attributable to the frequency dependence of internal stiffness and damping in the fabricated prototype. Using a phase-matching procedure for a representative lumped model, the internal stiffness and damping in the prototype were estimated. Examination of the phase spectra reveals an influence of the excitation frequency on the internal stiffness, damping, and consequently specific inertance. Further, based on the results of this study, design perspectives for such mechanical inerters, which are seeing increasing use in several low-frequency applications, are also presented. It is envisioned that this approach can be utilized to subsume the specific nonlinear characteristics of individual inerters into a simple yet unsimplistic model that can be used to more efficiently and accurately predict the behavior of multi-element, inerter-based systems that employ them.
1. Introduction
In establishing the traditional analogies between mechanical and electrical networks, the lack of the preservation of topology while transitioning from a mechanical to its equivalent electrical network was rectified by Firestone [1] by the introduction of the so-called mobility or force–current analogy. However, one drawback of this approach was that the mechanical equivalent of the ungrounded electrical capacitor was not identified. The mass, which is the mechanical equivalent of the grounded electrical capacitor, cannot represent a two-terminal device, since by definition one of its terminals is ‘fixed’ when its motion is described with respect to an inertial frame of reference. This issue was remedied by the introduction of a two-terminal device termed the ‘inerter’ by Smith [2]. The inerter is a mechanical element in which the force applied at the terminals is proportional to the difference in acceleration across them. The proportionality constant has the dimension of mass and is defined as the ‘inertance’ of the device. Practically, the inerter can be realized by storing energy using a flywheel within the device. The introduction of the inerter completed the force–current analogy and thereby provided an ungrounded mass element for use in mechanical networks. This has led to considerable interest in exploring their design, characteristics, and applications in recent years.
Inerters can provide a high dynamic mass presence while having a low static mass. Inerters with an inertance that is a few orders of magnitude greater than their static mass have been demonstrated [2]. Conventional designs for inerters are primarily based on mechanical elements such as the rack-and-pinion [3] or ball-screw [4,5,6]. Torque transmission to the flywheel from the rack occurs through a series of gears in rack-and-pinion inerters, whereas the linear motion of the screw is directly converted to the rotary motion of the flywheel in ball-screw inerters. Tests on rack-and-pinion and ball-screw versions of the inerter have shown that friction has a dominant influence on performance in both [7]. Alternative power transmission methods based on fluid or hydraulic techniques [8,9] have also been introduced in inerters, which has led to new applications in hydraulic systems. Inerters have also been investigated for vehicular applications. There has been considerable interest and success in transitioning inerter-based technologies for applications related to vibration isolation in vehicles. Significant performance improvement related to passenger comfort, safety, and system dynamics has been demonstrated using a rack-and-pinion in various suspension layouts [3]. The potential for improved safety and comfort in railway vehicle suspension systems [4] by utilizing inerters has also been studied. Inerters have also been shown to enhance stability for steering systems in high-performance motorcycles [10]. Several studies [11,12,13,14,15,16,17,18,19,20,21] have assessed the performance of inerters in semi-active and passive suspension systems. Enhancements to road handling and passenger comfort parameters using inerter-based vehicle suspension layouts vis-à-vis traditional layouts were achieved. Improved performance has been reported for aircraft landing gear systems [22,23] employing inerters due to better resistance to shimmy vibrations through nonlinear effects. Applications for inerters in tuned mass absorber/damper systems [24,25,26] through optimal design and control strategies have also been reported. Inerters were also studied for use in devices that can suppress structural vibrations in multi-DOF systems [27]. They have also been shown to be effective in safeguarding civil infrastructures from detrimental seismic effects [28,29,30].
Recently, there have been studies on dampers and inerters that deliver adaptive performance. A magneto-mechanically coupled damper under the moniker of ‘Z-Damper’ was explored to deliver better vibration absorption through frequency-dependent damping [31]. Introducing a controllable adaptive inerter was shown to influence the natural frequencies of a vibrational system in suspensions [32]. Incorporating a continuously variable transmission system enables the realization of variable inertance and helps offers optimal damping efficiency within a wide range of forcing frequencies [33]. A fluid inerter with variable inertance was investigated by varying pipe radius [34]. Theoretical investigation on variable inertance in a single DOF system was done to understand its effect on parameters such as the natural frequency of the system, logarithmic decrement, damping ratio, and tunability of response [35]. Brzeski and Perlikowski [36] developed a simplified yet authentic model for an inerter-based tuned mass damper including nonlinear effects such as viscous damping and dry friction as well as the play in gears, which are to be expected in practical systems. It was found that the presence of damping leads to restrictions on the tunability of the inerter’s performance range. Dry friction is found to have a more pronounced effect, even leading to diminished resonance peaks for high values. The presence of play in gears could result in discontinuities in the response, although its influence depends on the scale of the system’s implementation relative to the magnitude of the play gaps. Simplified models were shown to be able to capture the device’s predicted response satisfactorily when the nonlinearities are relatively small. Sun et al. [37] studied the influence of component nonlinearities for a ball-screw inerter design in order to gauge their influence on a vehicle suspension system. The elasticity and friction in the ball-screw assembly are taken into account. The parameters for the nonlinear mechanics model were estimated from test data. Simulations were used to predict the performance variations of the systems due to the nonlinearities. In a similar vein, a real-time dynamic sub-structuring approach was employed by Gonzalez-Buelga et al. [38] to study the nonlinear effects from an off-the-shelf inerter within a tuned inerter damper device for low-frequency civil engineering applications. This approach provides a means to incorporate specific characteristics of the inerter as well as the host structure evaluated through experimental testing in the hybrid model. More recently, a device displaying a hysteretic response described by a relationship between momentum and velocity is postulated as the memory-based counterpart of the inerter by Zhang et al. [39]. This so called ‘mem-inerter’ is found to deliver better performance than the conventional inerter under conditions of equivalence. In the context of these studies, tailoring the nonlinearity or adaptivity in inerters may prove beneficial for applications scenarios demanding frequency agile response. The ability to adapt the dynamic mass participation offered by inerters based on loading conditions could provide opportunities for novel application related to energy harvesting and vibrational transduction. Realizing designs that can deliver nonlinear inertance at the microscale could be of interest to enrich the functionalities of MEMS devices.
In this study, the focus is on the low-rate characterization of inerters in order to understand the mechanisms involved and develop a test-based model that can be used to generate design and implementation guidelines. In several scenarios, it is of interest to extract lumped parameters that are representative of component inertias and nonlinear effects arising from the assembly of components, which are to be expected in practical inerter devices so as to provide a description of the device that is easy to implement within complex multi-element dynamical systems that may employ inerters. In order to achieve this, firstly, improved analytical models incorporating component inertias and sizing are developed. Based on numerical parametric studies, a prototype inerter is designed, fabricated, and tested. The rate-dependence of the measured specific inertance is modeled using a representative lumped model based on experimental phase matching. The influence of internal stiffness and damping is investigated by examining the spectra of phase histories. Finally, conclusions and potential applications are discussed. It is envisioned that this approach can be utilized to subsume the specific nonlinear characteristics of individual inerters into a simple yet unsimplistic model that can be used to more efficiently and accurately predict the behavior of multi-element, inerter-based systems that employ them.
2. Modeling
Analytical models for specific inertance that include component inertias and sizing but retaining rigid body assumptions are developed for both the ball-screw and rack-and-pinion embodiments of the inerter. Firstly, detailed designs that account for functional components for both versions were created. Equations of motion were derived for these designs, and parametric studies were undertaken to extract the dependencies for specific inertance.
2.1. Analytical Expressions for Specific Inertance
Inerters are two-terminal mechanical devices that provide a force response that is proportional to the relative acceleration across their terminals. This response can be described as
where is the force, and are the accelerations at terminals 1 and 2, respectively, and is the proportionality constant termed ‘inertance’ that has the dimension of mass. The inerter can be realized in practice in several ways; prominent among these are the ball-screw and the rack-and-pinion inerters [3,6]. Figure 1a shows the CAD model of a ball-screw inerter design, which is based on commercial off-the-shelf components. Its principal components are two ball bearings, a fly wheel, the ball-screw unit and its nut, and an external casing to house the rotary components. From a mechanical standpoint, the ball-screw version is the simpler of the two versions considered here. One end of the screw acts as the first terminal of the inerter, while the casing acts as the other. Force transmission occurs from the screw through the nut, flywheel, and bearings to the casing. Both axial and rotary dynamic balancing are easier to accomplish using the ball-screw design. A line diagram with forces and geometric parameters for the ball-screw design is shown in Figure 1b. For the purposes of this analysis, a force is assumed to be applied to terminal 1 (i.e., the screw) and terminal 2 (casing) is assumed to be encastred as shown in Figure 1b. The screw is assumed to have rotation about its axis and translation in the axial direction alone. The effect of friction and other sources of damping as well as gravity are neglected.
Considering the configuration shown in Figure 1b, the equation of motion for the screw in axial direction is:
where is the external force applied on the screw, is the reaction force due to the nut on the screw, is the mass of the screw, and is the axial acceleration of the screw. Now, since the nut is assumed to be rigidly connected to the flywheel, the rotational equation of motion for the nut and flywheel due to the axial motion of the screw can be expressed as:
where is the reaction force due to the screw on the nut, L is the lead of the screw, is the mass moment of inertia of the nut, is the mass moment of inertia of the flywheel, and is the common angular acceleration of the nut and the flywheel. Expressing the linear acceleration of the screw in terms of the angular acceleration of the nut, one can directly note that under no-slip condition. Here, is the angular acceleration of the nut, and is the linear acceleration of the screw. Using Equations (2) and (3), and substituting the relations for the mass moment of inertia, the equation of motion for the screw can be expressed as:
where is the mass of the nut, is the mass of the flywheel, and is the radius of gyration of the flywheel. Comparing Equation (4) with Equation (1), one can rewrite Equation (4) in terms of the inertance, and the static mass of the inerter, to obtain the expression for the specific inertance for this device as:
Similarly, the detailed design for a prototype rack-and-pinion inerter is analyzed to obtain its specific inertance. While its mechanical configuration is slightly more complicated compared to the ball-screw version, it is nonetheless realizable using a limited number of commercial off-the-shelf and custom components. The CAD model for the design is shown in Figure 2a. The top and front panels are not shown in the model to reveal the internal mechanism. Components for the rack-and-pinion version include the rack and its pinion, the gear and its pinion, the flywheel, two sets of shafts and bearings, and external casing components. The load path runs from the rack, which acts as the first terminal, through the pinion to the gear, and then to the flywheel and casing. A line diagram showing the forces and geometric parameters involved is shown in Figure 2b. The effects of friction and damping from structural causes are not considered in this formulation.
Under the same assumptions and constraints as before, the equation of motion for the rack in the axial (x-) direction is:
Again, is the external force acting on the rack, is the reaction force due to the rack’s pinion on the rack, is the mass of the rack and is the acceleration of the rack. Similarly, the translational force balance in the axial and vertical directions and rotational equation of motion for pinion and gear are:
where is the reaction force on the pinion in the x-direction due to the casing, is the reaction force due to the rack on the rack’s pinion, is the reaction force on the gear in the y-direction due to the casing, is the radius of the rack’s pinion, is the radius of the gear, is the mass moment of inertia of the rack’s pinion, is the mass moment of inertia of the gear, and is the angular acceleration of the rack’s pinion. It is noted that the gear and the rack’s pinion are on a single shaft that is housed within the bearing on the casing walls, and therefore, the horizontal and vertical reactions provided by the casing are assumed to be distributed equally between the support locations at either end. These reaction are lumped together and described as and in the above equations. Carrying forward this process for the gear’s pinion and the flywheel, the following equations are obtained:
where is the reaction on the gear’s pinion in the y-direction due to the casing, is the reaction force due to the gear on the gear’s pinion, is the radius of the gear’s pinion, is the mass moment of inertia of the gear’s pinion, is the mass moment of inertia of the flywheel, and is the angular acceleration of the gear’s pinion. The accelerations can be related through the expressions, (the tangential acceleration of the rack’s pinion),, (the tangential accelerations of gear’s pinion and the gear are equal), and therefore, . Here, is the radius of the rack’s pinion, is the tangential acceleration of the gear, is the radius of the gear, is the acceleration of the gear’s pinion, and is the radius of the gear’s pinion. Now, incorporating the acceleration relationship into Equations (6), (9), and (11) and substituting for the mass moment of inertias, the equation of motion for the rack is obtained as:
where is the mass of the gear’s pinion, is the mass of the flywheel, k is the radius of gyration of the flywheel, is the mass of the rack’s pinion, is the mass of the gear, and is the mass of the rack. Comparing Equation (12) with Equation (1), one can rewrite Equation (12) in terms of the inertance and the static mass of the inerter to obtain the expression for the specific inertance for the rack-and-pinion inerter as:
2.2. Parametric Study
The parametric dependencies for the specific inertance of both ball-screw and rack-and-pinion inerters are explored using numerical simulations. The generation of parametric curves establishes the feasible design space and aids component selection and sizing so as to optimize specific inertance. Inspecting the expressions for specific inertance, it can easily be seen that component inertias and radii have varying degrees of influence. However, several of these are ‘derived’ parameters that can be further reduced to arrive at a set of independent fundamental parameters for both designs. In order to accomplish this, firstly, the component inertias are expressed in terms of its material density and volumetric dimensions. For the ball-screw inerter, the device’s static mass can be expressed as a sum of component mass as . Here, subscripts s, n, f, b, and c denote the screw, nut, flywheel, bearing, and the casing, respectively. The mass of the fasteners and other miscellaneous components are lumped with the casing. Substituting for the densities, expressions for volumes and radii of gyration, the specific inertance for the ball-screw inerter can be shown to be:
Note that in Equation (14), and represent the axial thickness for the nut and the flywheel respectively, while represents the axial length for the screw. It is seen that the densities for the selected components affect both the static mass as well as the mass moment of inertia terms in the inertance. Assuming that the choice of materials for components is fixed, it remains to explore the influence of the key sizing parameters, namely the radii of the flywheel and nut within the bounds of available sizing. The lead of the screw is set as the reference parameter. Other geometric parameters are assumed to be invariant in the design. Table 1 lists the base parametric setting used for the ball-screw inerter design.
A ball-screw is a device that ideally converts rotational motion to linear motion in which frictional forces are dominant and contribute to significant losses. Therefore, ball-screws can generally be inefficient under certain sizing conditions due to the phenomenon of self-locking. The self-locking condition is given by , where is the coefficient of friction, is the mean diameter of the screw, and L is the lead. When the lead is sufficiently small for a specified coefficient of friction and screw diameter, the device tends to lock up when an applied linear motion is intended to be converted to rotational motion, as in the case of an inerter. Therefore, restriction has to be placed on the choice of the lead to avoid self-locking. Assuming the coefficient of friction between mating surfaces as 0.3, and the diameter of screw as fixed at 4 mm, a lead of 5 mm ( is used to prevent self-locking.
Figure 3 depicts the variation of specific inertance (for the ball-screw inerter with key sizing parameters nondimensionalized by the lead of the screw. For each parametric variation, the other parameters are retained as fixed. It is obvious that the outer radius of the flywheel has the greatest influence on specific inertance. This is explainable, since the outer radius of the flywheel influences the mass and sizing of the flywheel. A steep decline in the specific inertance is therefore observed when the outer radius of the flywheel is decreased, since the effective size of the flywheel reduces. Further, an increase in the size of the nut somewhat decreases the specific inertance. The specific inertance has an increasing dependence on the inner radius of the flywheel. The trend is nearly linear in the range explored, although the influence of the inner radius of the flywheel is lower than that of the outer radius of the flywheel. The flywheel radii influence both the mass and rotational inertia parameters, and hence have a bearing on both the specific inertance and the static mass of the device. Overall, among the key parameters, it is desirable to minimize the radius of the nut, and maximize the inner and outer radii of the flywheel for the given choice of the other fixed parameters. Under the design constraints of the components chosen, specific inertance up to about 450 is seen to be achievable through an optimal choice of key parameters.
Employing a similar procedure for the rack-and-pinion inerter, one can examine its parametric dependencies. The static mass of the rack-and-pinion inerter can be expressed in terms of its component masses as . Here, the subscripts r, p, g, f and c stand for the rack, pinion, gear, flywheel and casing. As the rack’s and gear’s pinions are identical, a separate symbol is not introduced, but twice the mass of the rack’s pinion is used. The mass of the static shafts, bearings, fasteners, and other miscellaneous components are lumped with the casing. Introducing component densities, and expressions for volumes, radius of gyration, and mass moment of inertia, the specific inertance in terms of independent fundamental parameters can be expressed as:
In Equation (15), the symbol pertains to the out-of-plane thickness for the subscripted components, while and are the length and width of the rack. Also, since the rack and gear pinions are identical, they are sized without distinction through the use of the same radius and thickness parameters. The base parametric setting for the rack-and-pinion inerter design is listed in Table 2.
Figure 4 depicts the variation of specific inertance ( for the rack-and-pinion inerter with key sizing parameters nondimensionalized by the pitch of the rack. The design points for each parameter is depicted using the black ‘X’ mark, and the designed value of is indicated on the vertical axis. Several points of interest from a design perspective are observed. A high sensitivity is observed for the radii of the (rack and gear) pinions. As the radius of the pinions is increased, the specific inertance drops drastically, which is primarily due to the decrease in the flywheel’s angular velocity, but to a much lower extent due to the increase in static mass. Interestingly, the specific inertance is more or less insensitive to variation in the inner radius of the flywheel. Increasing the flywheel’s inner radius causes its radius of gyration to go up, but at the same time reduces the mass of the flywheel. Specific inertance displays a nonlinear increasing dependence on the outer radius of the flywheel and the radius of the gear. These radii have a dominant influence on the rotary inertia and the gearing ratio. Overall, it is desirable to have smaller pinion radii, and a larger flywheel and gear radii within the constraints of the design. For the design space enabled by the choice of components, specific inertance in excess of 90 is achievable for the rack-and-pinion design. These parametric studies based on the analytical models and constraints provide design guidelines to help maximize the specific inertance.
3. Experimental Methods
A prototype rack-and-pinion inerter was designed and built based on the design guidelines provided by the parametric studies. A combination of commercial off-the-shelf components and custom fabricated components were used to construct the prototype. Details of the prototype fabrication and experimental setup and procedures are discussed in the ensuing sections.
3.1. Test Article Fabrication
The prototype rack-and-pinion inerter that was built is shown in Figure 5a. It has a designed inertance of 180 kg and a static mass of about 2 kg, giving a specific inertance of about 90. The principal components are the rack, gear, two pinions (one each for the rack and the gear), two shafts, four bearings, a flywheel, and the casing. Except for the casing and a hub to connect the flywheel to the shaft, all of the other components are commercial off the shelf (COTS) components. The hub and parts of the casing are printed using a desktop 3D printer. The flywheel is a thick aluminum shell mounted on the hub. An acrylic sheet is used to fabricate the transparent front panel for the casing. Standard fasteners were used to assemble the casing and bolt it to the vibration isolation table during testing. Table 3 summarizes the key components and their details for the prototype inerter.
3.2. Experimental Setup and Procedures
The experimental setup is shown in Figure 5b. The setup is built on a vibration isolation table. An electrodynamic shaker is connected to one end of the rack through a three-dimensional (3D) printed custom fixture that can house a load cell. The test article and the electrodynamic shaker are firmly mounted to the table using spacers and fasteners. Input excitations are provided to the rack (terminal-1) of the inerter using the shaker. A waveform generator and an amplifier were used for signal generation and amplification. An inline load cell with a maximum load capacity of 1000 lb and a sensitivity of 1 lb was installed between the shaker and rack. The load cell is mounted via the 3D printed fixture. Accelerations at the shaker head and on the rack are measured by a unidirectional accelerometer having a resolution of 0.01 m/s2.
Two different cases based on excitation type—(i) displacement-controlled and (ii) acceleration-controlled sinusoidal excitations—are considered for testing. For the displacement-controlled case, the input excitation’s displacement amplitude is controlled to be about the same for all of the excitation frequencies, whereas for the acceleration-controlled case, the input excitation’s acceleration amplitude is controlled to be about the same for all of the excitation frequencies. The displacement amplitude was controlled to be between 7–8 mm for case (i), and the acceleration amplitude was controlled to be as close as possible to 3.5 m/s2. A custom LabVIEW interface was developed to acquire and record time-synchronized data from the load cell and accelerometers. Data acquisition begins from the rest condition, and continues until a condition of steady state is assumed to exist. Discrete single frequency excitations below 5 Hz are used for both cases. Three independent sets of data are acquired for each frequency case to check for consistency and repeatability. The results are discussed in the following section.
4. Results and Discussions
Firstly, the results from the two test cases—Displacement-Controlled Sinusoidal Excitation (DCSE) and Acceleration-Controlled Sinusoidal Excitation (ACSE) are presented and discussed. For each case, the experimental load and acceleration data are extracted, and the specific inertance () is calculated. Salient trends and mechanisms are discussed.
4.1. Displacement-Controlled Sinusoidal Excitation
Load and acceleration time histories recorded for various excitation frequencies under 5 Hz from the DCSE tests are shown in Figure 6, Figure 7, Figure 8, Figure 9, Figure 10 and Figure 11. Histories for excitation frequencies of 0.5 Hz, 1 Hz, 2 Hz, 3 Hz, 4 Hz, and 5 Hz are shown. In each case, load and acceleration measurements are time synchronous, and the history for the first 8 s from start-up is shown. For each frequency, the post start-up transient data is used to extract the average peak load and average peak acceleration in order to compute the specific inertance, , as per Equation (16) below:
For each excitation frequency, three separate trials were performed. The overall maximum percentage error for the measured specific inertance between trials was under 12%. It is noted that for lower frequencies, attainment of a post-transient acceleration response takes longer time and still evinces modulations at frequencies lower than the driving frequency. Further, due to the existence of preload in the test article under a nominally zero displacement condition, an offset exists between positive and negative peaks in the load history. However, the average of the peak loads, which are more or less consistent post-transience, are used to compute the specific inertance. The specific inertance versus frequency results for DCSE are summarized in Figure 12 for each frequency; the data point represents the average value with the error bars indicating the maximum and minimum value for specific inertance from three trials. The measured specific inertance displays an exponentially decaying trend with an increase in frequency. This negative exponential fit for specific inertance under DSCE is given by:
where f is the frequency of excitation. In the high frequency limit, the specific inertance as per this model tends to zero, which is physically reasonable since as the harmonic excitation frequency is increased, large accelerations would be sensed, but the displacements would tend to diminish, whereas the load that can be applied by the external source would tend to have a finite limit. Toward the low frequency limit, extrapolating the fit yields a limiting value of 212.3 for the quasi-static case. This obviously is much higher than the frequency-invariant value of 90 that was predicted theoretically. Noting that the experimental fit includes structural effects (owing to friction and misalignment in assembly for instance), other than those arising from just the inertant mechanism considered in the theoretical model, an exaggerated quasi-static specific inertance is obtained from the experimentally calibrated model. While the trend line provides an estimation of the overall behavior in the low-frequency regime, deviations from it such as for the 1-Hz case could be attributed to internal dynamics arising from the assemblage of components. Therefore, including effects of the test article’s internal structural stiffness and damping in the theoretical model is expected to improve the predictions.
4.2. Acceleration-Controlled Sinusoidal Excitation
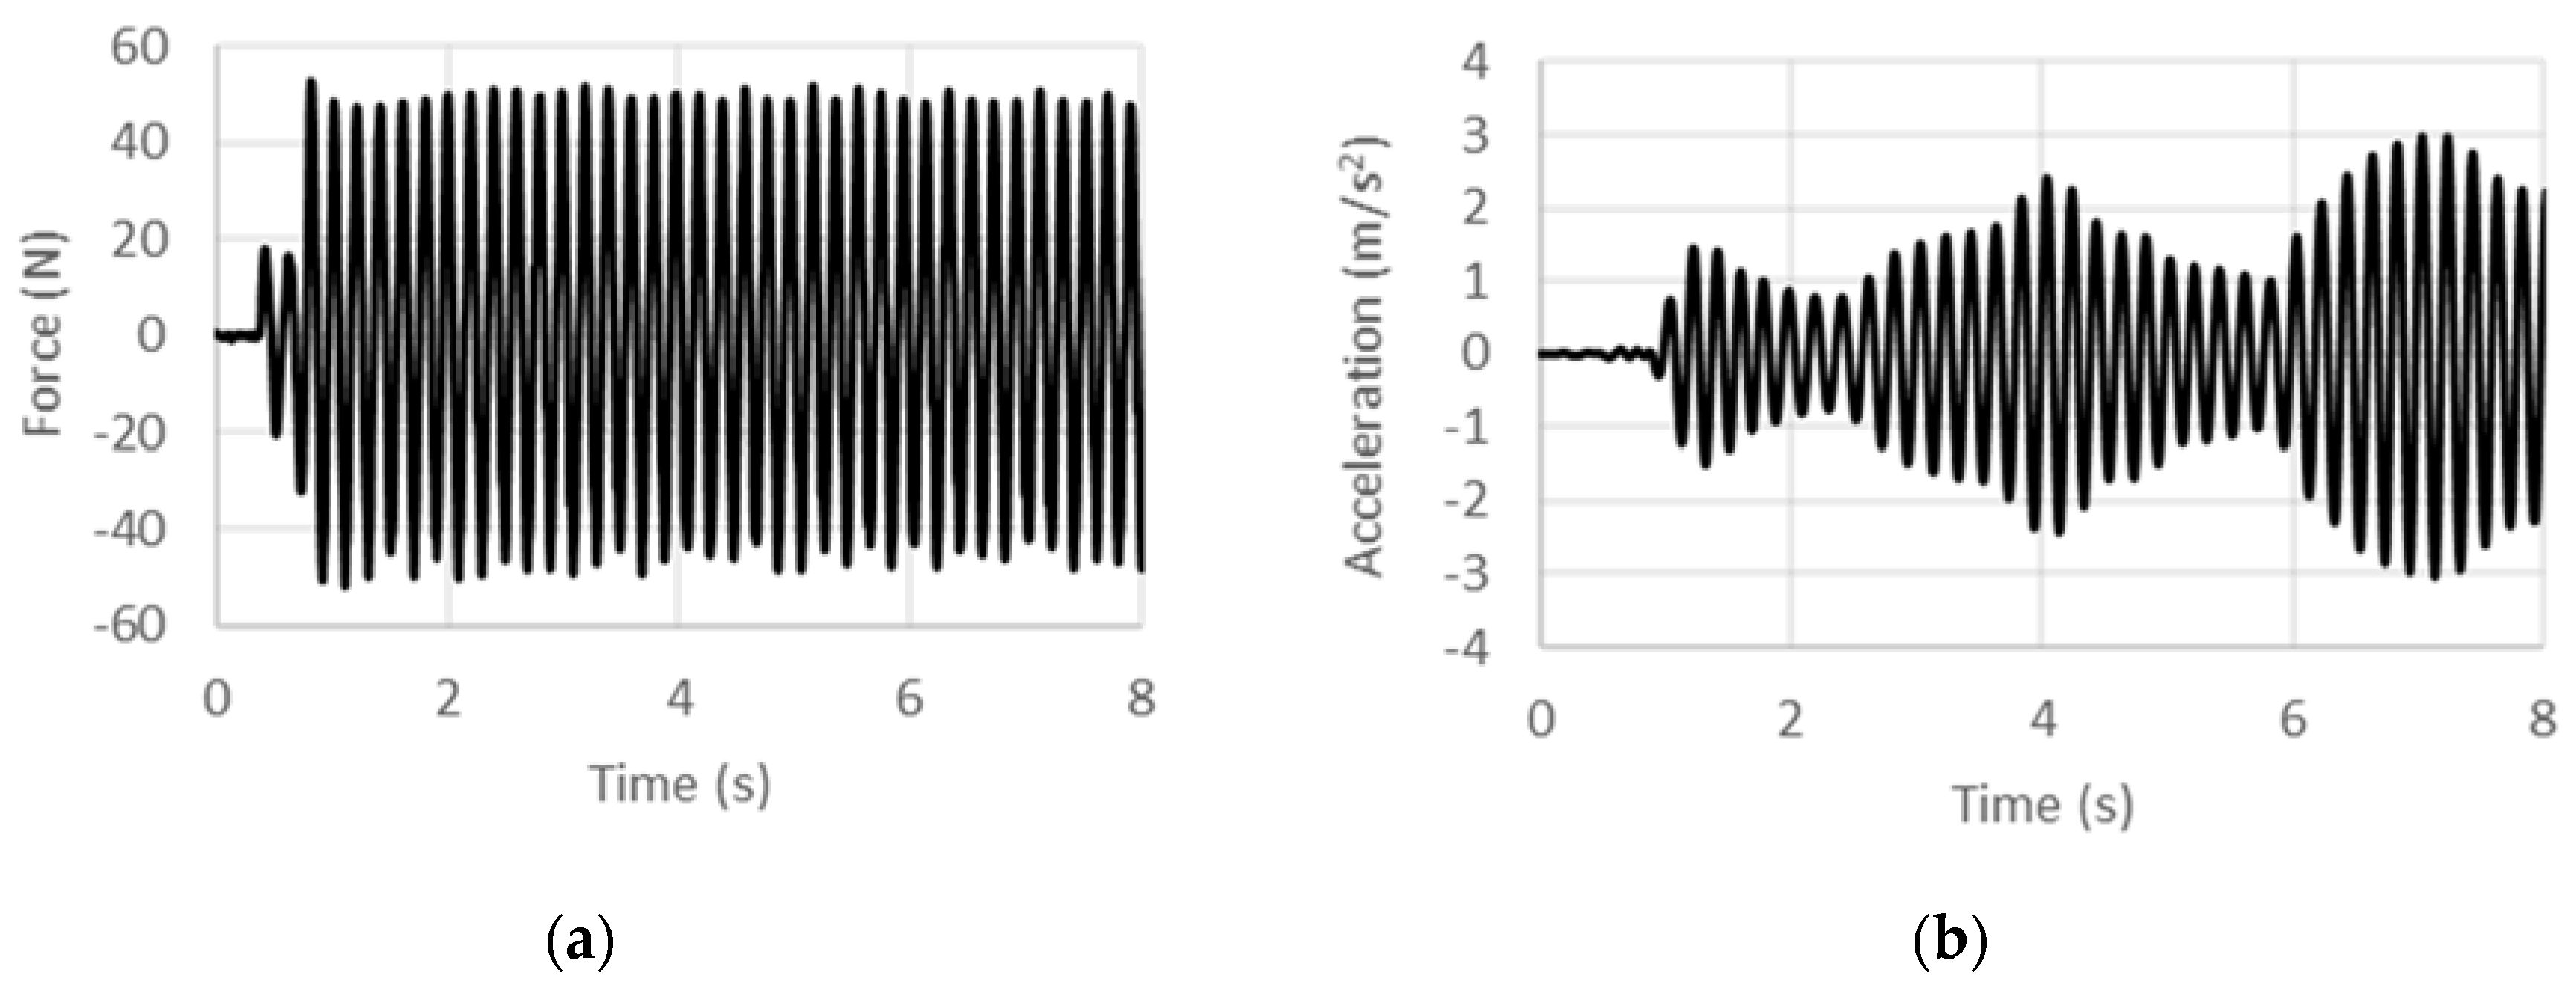
Load and acceleration time histories recorded for various excitation frequencies under 5 Hz from ACSE tests are shown in Figure 13, Figure 14 and Figure 15. Histories for excitation frequencies of 3 Hz, 4 Hz, and 5 Hz are shown. The data acquisition and analysis procedure for the ASCE case is the same as that for the DCSE case. Since the shaker is operated without feedback control, the acceleration control is coarse, and deviates from the targeted 3.5 m/s2 more so for lower frequencies. The load offset behavior also displays similar features as those for the DSCE case. Post-transient acceleration response is achieved earlier when excitation frequency is higher. Averaged peak values are used as before to compute the specific inertance.
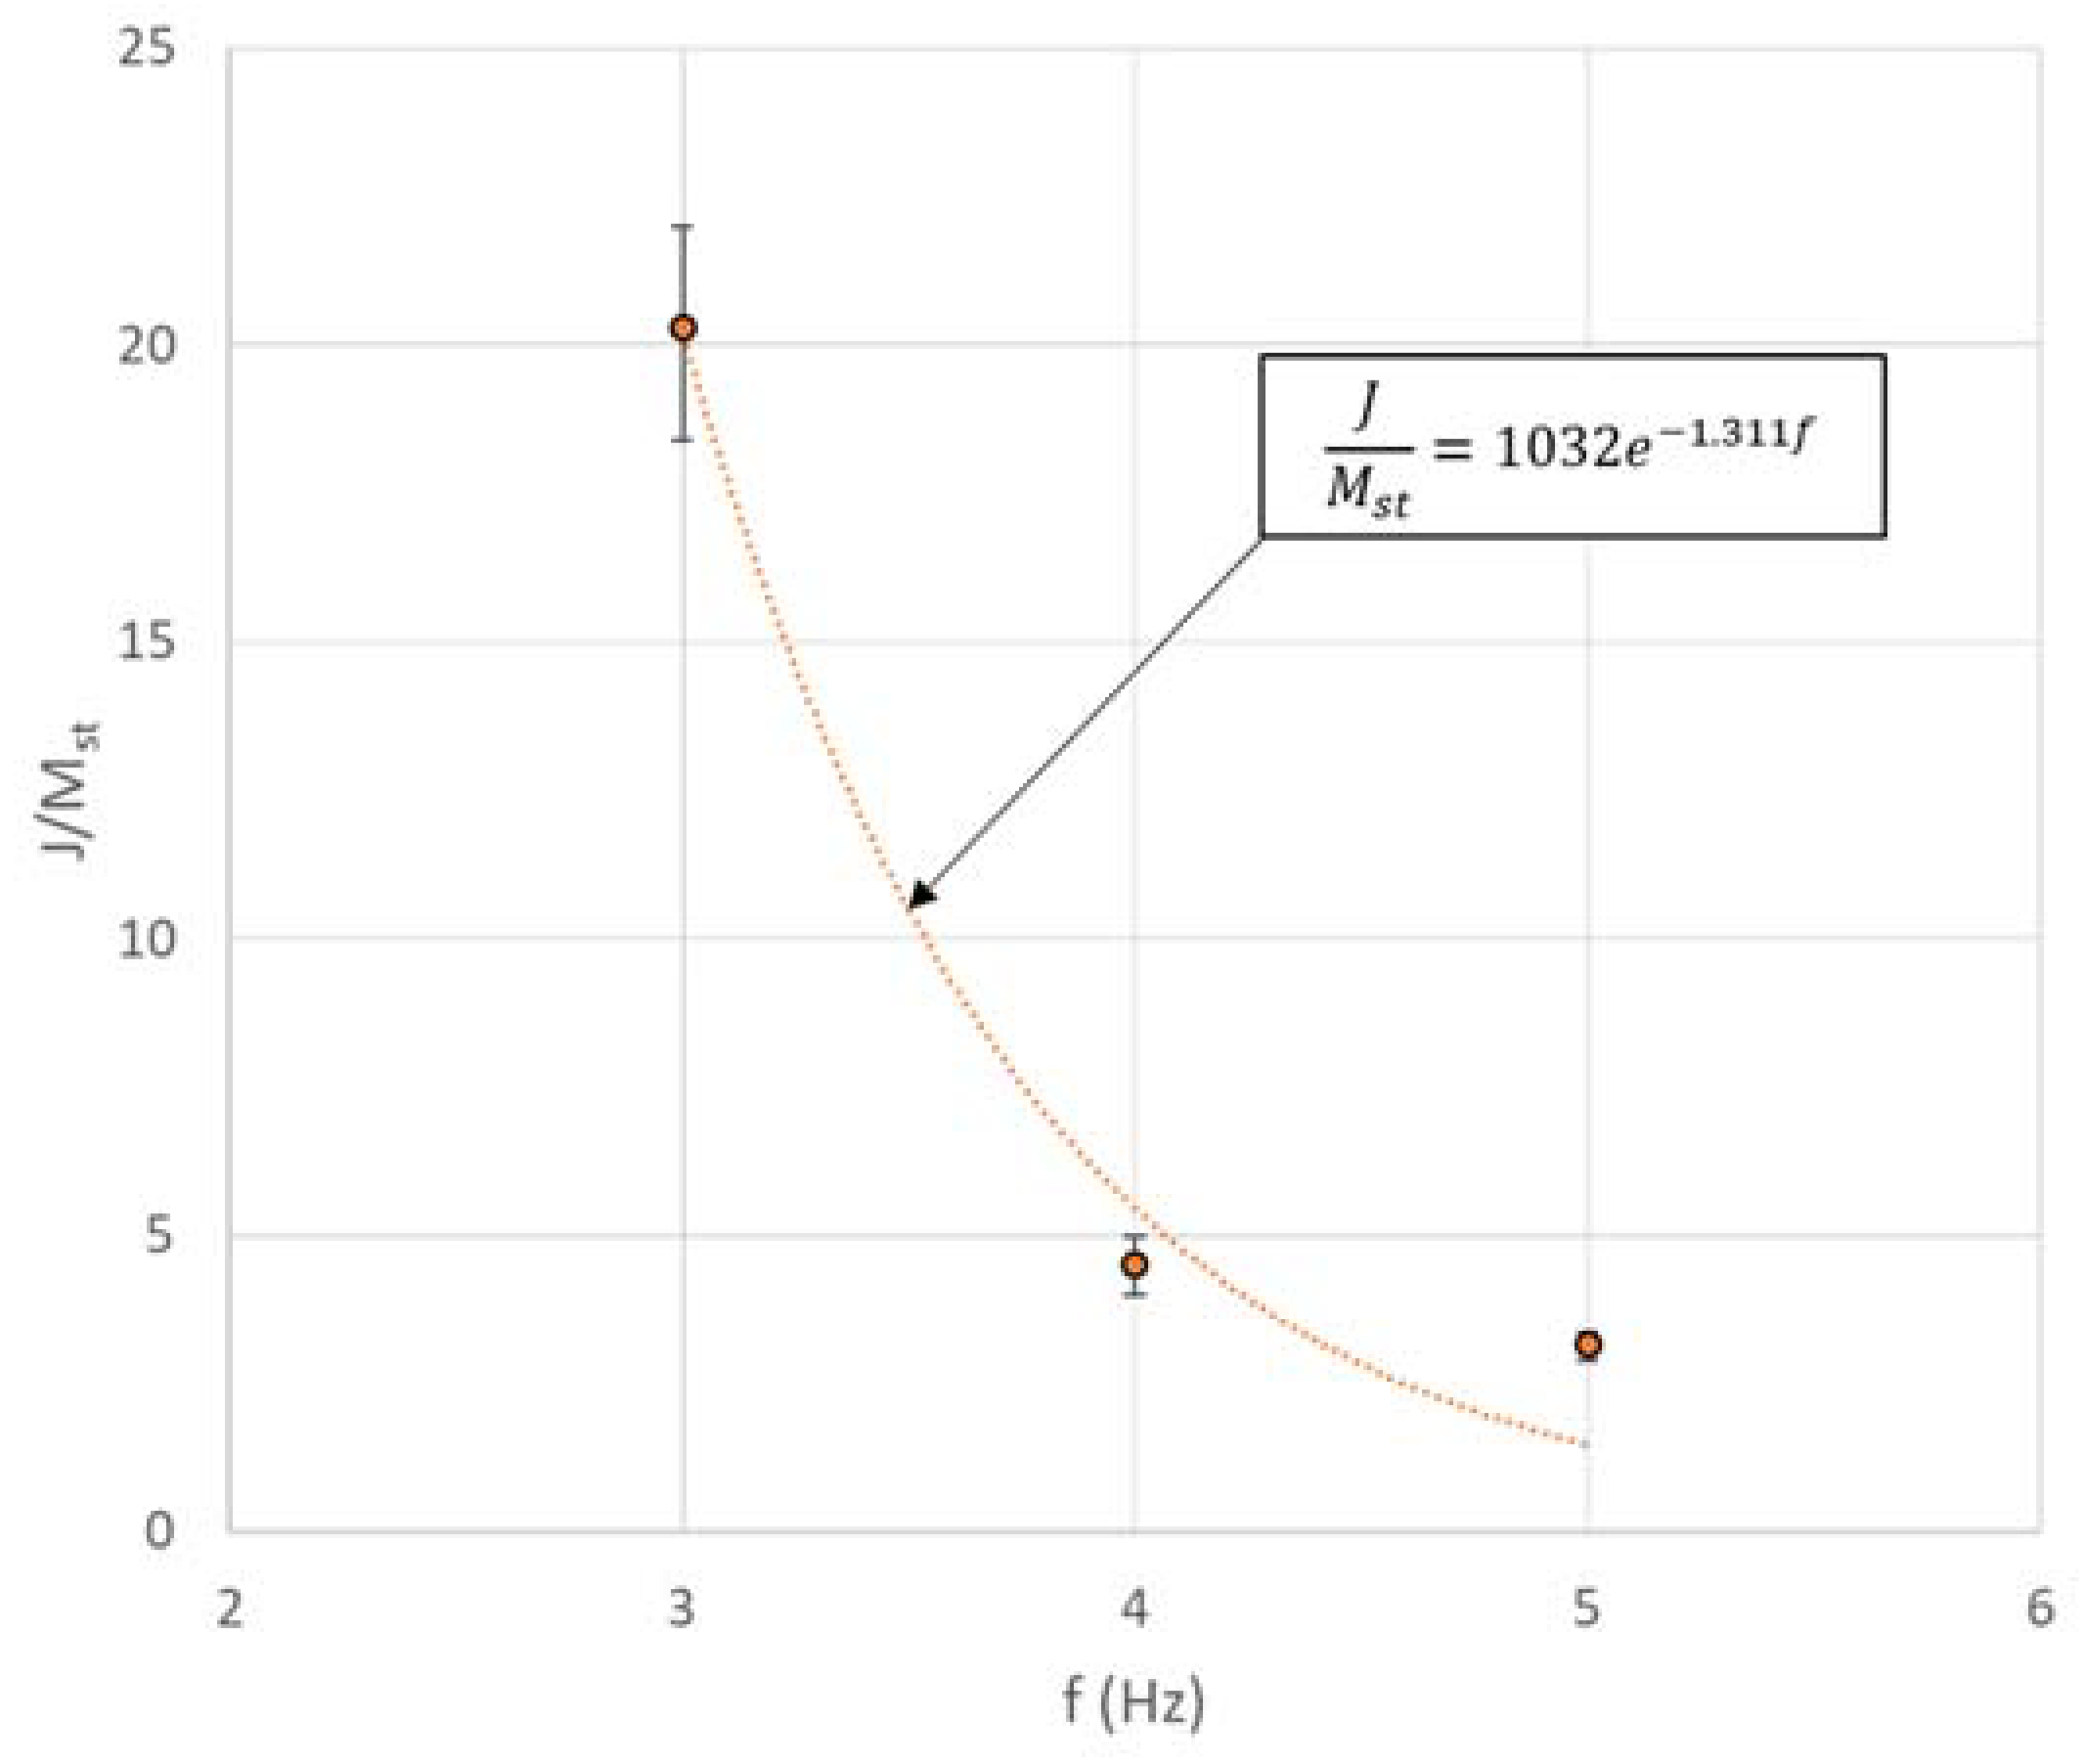
Specific inertance versus frequency results for ACSE are summarized in Figure 16. While the number of data points are quite limited, the measured specific inertance could be modeled using an exponentially decaying trend with an increase in frequency as before. This negative exponential fit for specific inertance under ACSE is given by:
For the ACSE case, the specific inertance at corresponding frequencies are lower than those obtained for the DCSE case. Further, the displacements reduced from the measured acceleration are significantly smaller (2–3 mm) than those for DCSE. This could be correlated with the much higher quasi-static specific inertance (1032) obtained from the experimental model, as at very small displacements, the system is expected to operate in a different regime as far as the mechanisms for internal resistance are concerned.
4.3. Estimation of Internal Stiffness and Damping
Since the internal stiffness and damping inherent in the fabricated test article has a significant effect on the performance, a method based on experimental phase matching was used to estimate these for a representative lumped element model. The line diagram of the representative model is shown in Figure 17. In addition to the inerter’s components, a spring with a dashpot in parallel to it connects the rack to the casing, which acts as the fixed terminal 2.
Using the same procedure as for the original rack-and-pinion model, the equation of motion for this model can be derived as:
where and are the displacement, velocity, and acceleration of the rack, respectively. Since a harmonic forcing, , is assumed, the displacement response of the rack can be expressed as:
where is the displacement amplitude of the rack, and is the phase angle of the rack’s displacement response relative to the applied harmonic force. Substituting the harmonic input and the response into Equation (19), one can directly obtain:
Simplifying and comparing the coefficients of and , the following two equations can be extracted.
Using Equations (22) and (23), one can solve for the internal stiffness, , and the internal damping coefficient, , in terms of the phase angle, , and the inertance, , to obtain:
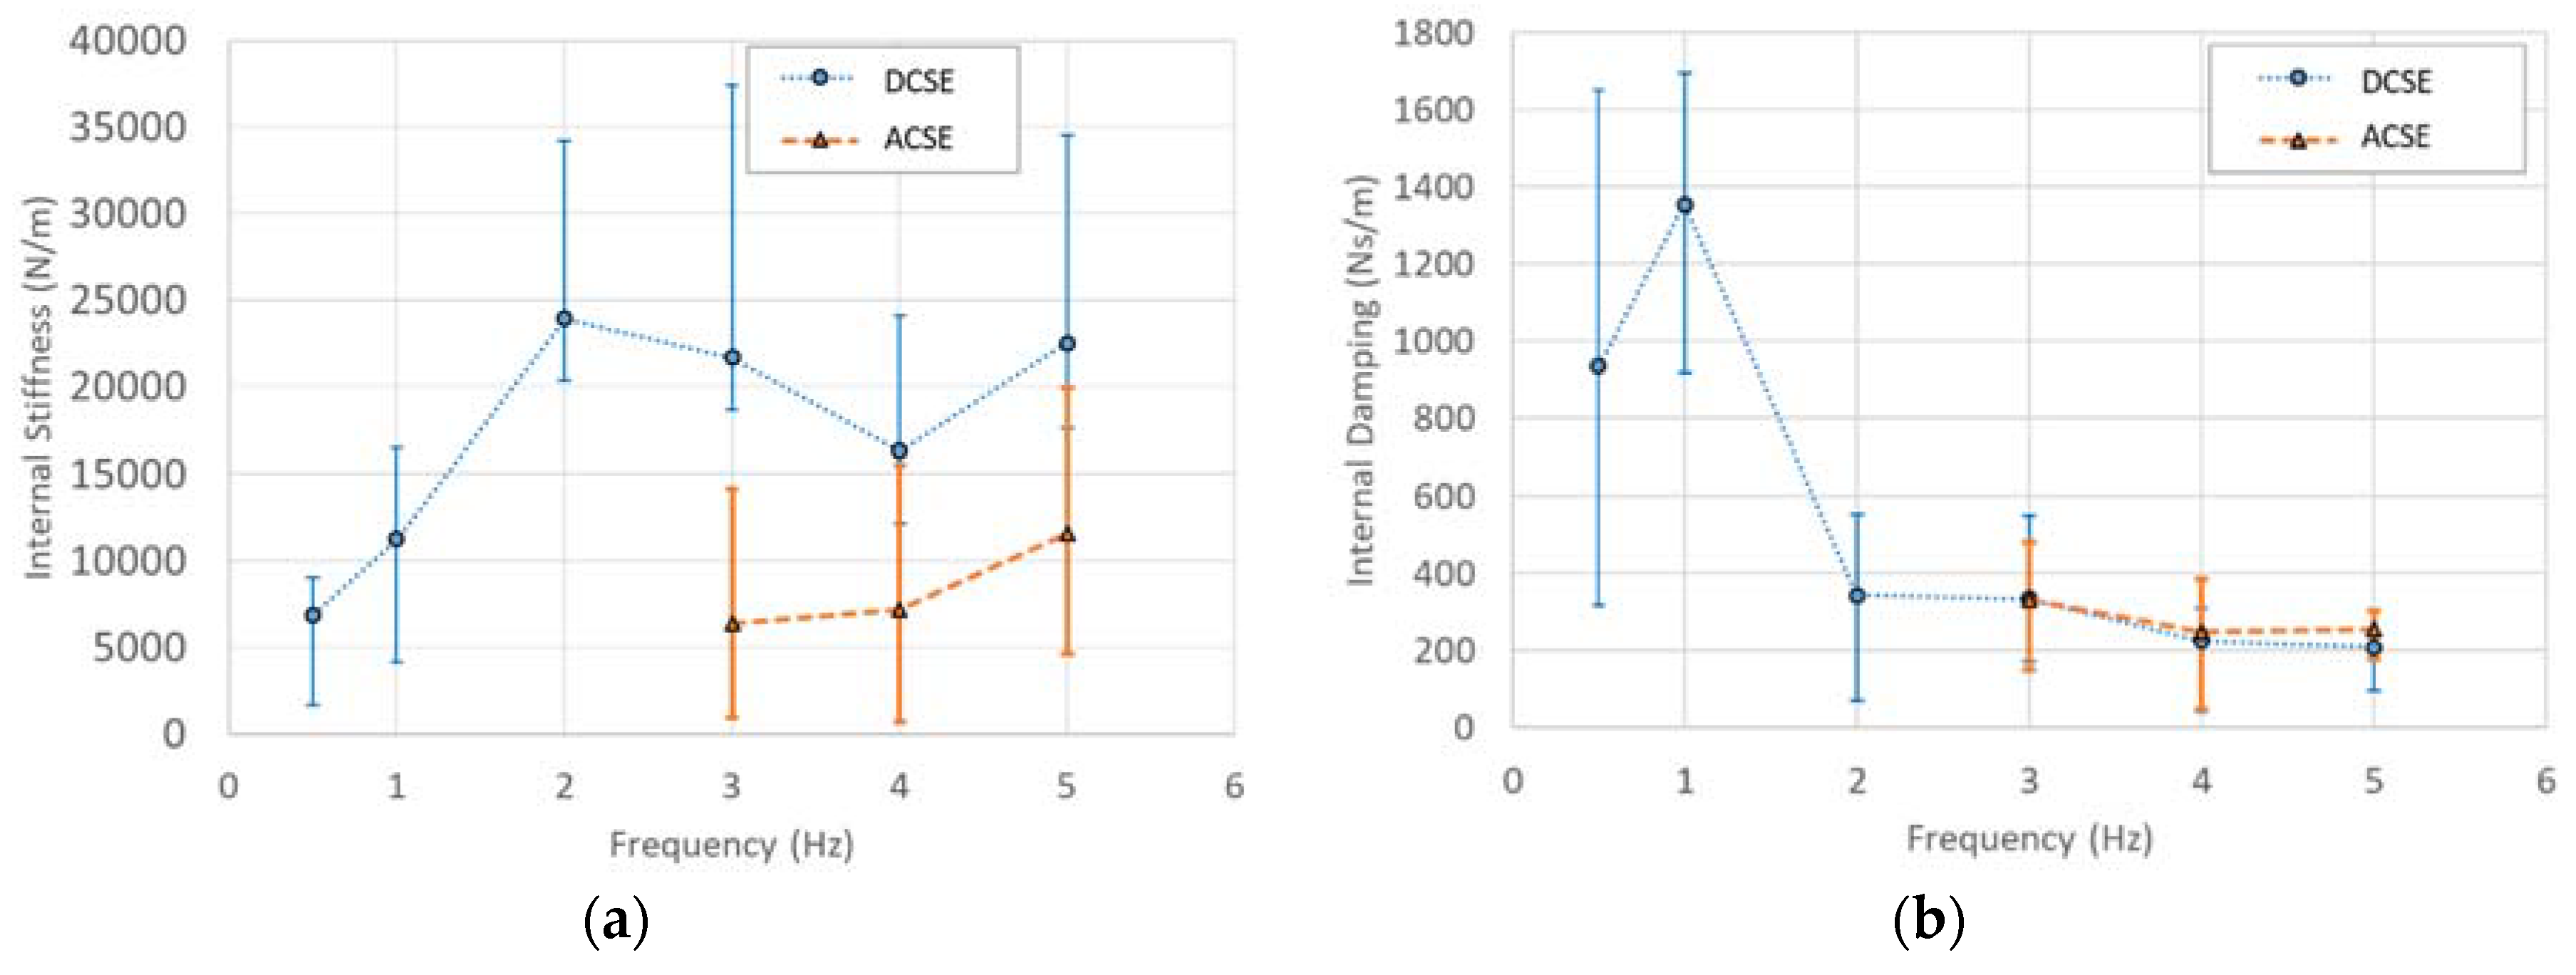
In Equations (24) and (25),, ,, , and are experimental input or measured parameters. The phase angle is obtained from an averaging procedure based on the time synchronous load and acceleration histories recorded from experiments. The time lag is extracted at multiple points within each cycle for each pair of histories. This lag data is converted to its corresponding phase angle data for the respective frequencies and interpolated to obtain evenly spaced phase angle data. The maximum, minimum, and average phase angle value for each case is then computed from this data. This procedure is repeated for all of the frequencies in order to obtain the phase information. Substituting for these parameters from experiments, the frequency-dependent internal stiffness and damping for the test article are estimated for both DCSE and ACSE cases. The results are shown in Figure 18. For each case, the internal stiffness and damping coefficient computed using the average as well as the maximum and minimum phase angle values are reported. It is noted that the stiffness depends on the inertance,, in addition to phase angle, , and displacement, , but the damping coefficient does not. This dependence on an additional derived experimental parameter results in higher magnitudes for the error in the estimates for internal stiffness. The values for ACSE are relatively smaller than those for DCSE; nonetheless, they are still comparable. For the DCSE cases, the displacement magnitudes are relatively higher than those for the ACSE cases for the same excitation frequencies, which could indicate a transition in the rate-dependence of the internal stiffness mechanism, as evidenced by the stabilization of the stiffness values in the vicinity of 20,000 N/m at higher frequencies for the DCSE. Further, for the DCSE case, both the stiffness and damping values are observed to tend toward limiting values with an increase in excitation frequency. This behavior could be correlated with a transition in the rate-dependence of the internal stiffness mechanism when the excitation frequency increases.
A discrete element simulation model was set up using ABAQUS finite element software to examine the specific inertance predicted by the theoretical model based on phase estimation. The average internal stiffness and damping values are used in the simulation. Under prescribed harmonic displacement input, the simulated force and acceleration magnitudes are obtained to compute the specific inertance for each case. The comparison of the simulated and experimental specific inertance for the DCSE and ACSE cases are shown in Figure 19. This modeling based on averaged phase estimation is found to provide very close agreement with experiments for higher frequencies. For the lowest frequencies, the deviation is larger, since the average estimate for internal damping from the phase information depicts a much larger scatter. Nonetheless, the phase matching-based estimation process for internal stiffness and damping is found to provide a simple means to calibrate the theoretical model to include the characteristic internal structural effects present in different fabricated prototypes, which could have a significant influence on its inertant performance.
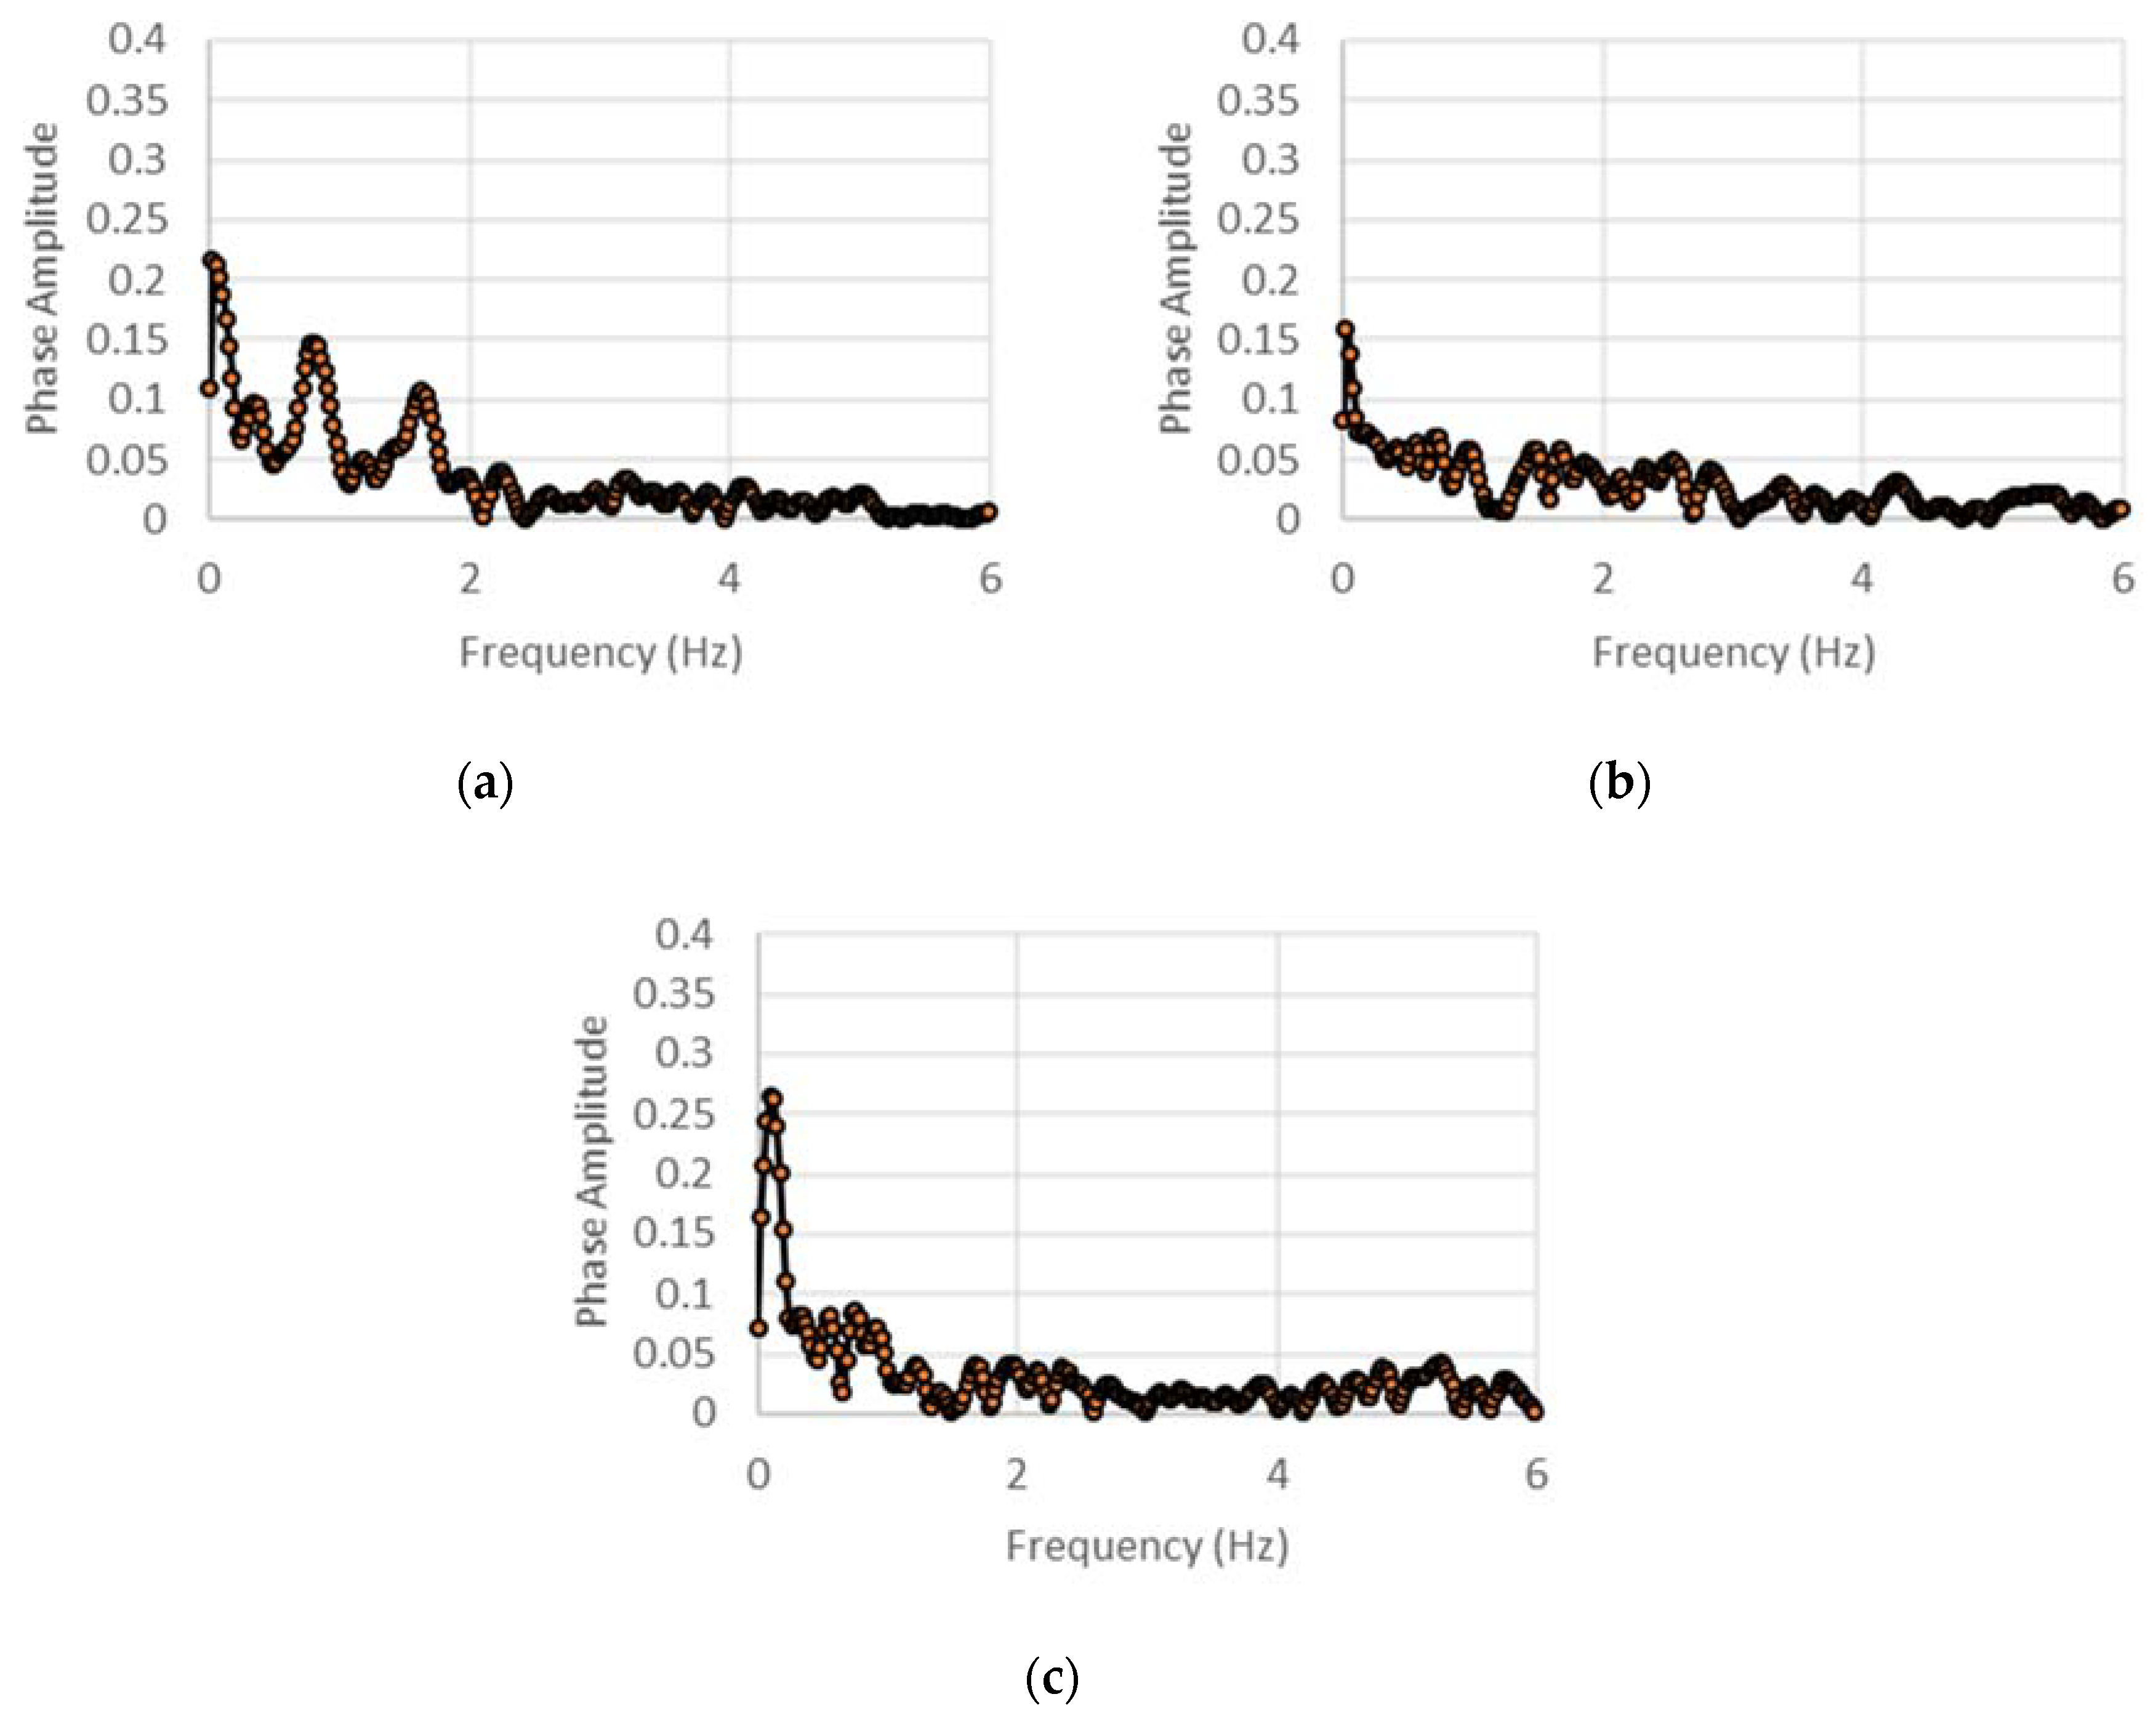
The extraction of the phase angle for the internal stiffness and damping estimation reveals some interesting trends that indicate the nature of the nonlinear response of the test article under low-rate excitations. Through a discrete sampling of the phase difference between the time-synchronous input loading and output acceleration data, the phase history is generated for each case, and its spectrum is examined. The spectra of these phase histories for various cases are shown in Figure 20 and Figure 21. Due to the nonlinearities in the test article’s response, the phase difference between the force and acceleration varies with time, even when a post-transient state seems to have been achieved. However, the spectra of the phase histories show that the ultra-low frequency components (<1 Hz) do in general dominate across excitation frequencies, indicating contributions from meandering effects within the structural assembly. The phase variation is also seen to be affected directly by the excitation frequency, especially for the DCSE case, in which the displacement amplitudes are significantly higher than the ACSE case. For this case, a discernable peak is observed in the spectrum corresponding to the excitation frequency, affirming its direct contribution to the variation of phase with time. In contrast, for the ACSE, for which the displacements are much lower, the influence of the excitation frequency on the spectrum of the phase history is not seen. The ultra-low frequencies are observed to dominate. Analysis of the spectra of phase histories could provide a means to understanding the origins of the nonlinear structural effects and their characteristics in such inertant devices.
5. Conclusions
Low-rate characterization of a mechanical inerter is conducted using analytical and experimental studies. Firstly, improved analytical models that account for the effects of component inertias and sizing were developed for both ball-screw and rack-and-pinion versions of the inerter. Numerical parametric studies were undertaken in order to understand the dependence of the specific inertance on key design parameters. Design guidelines for key sizing parameters were also developed. Based on these studies, a feasible design for a prototype rack-and-pinion inerter that utilizes commercial off-the-shelf and additively manufactured components was identified, and the test article was fabricated and tested. The test article had a designed inertance of 180 kg and a static mass of 2 kg. Both displacement as well as acceleration controlled sinusoidal excitation cases at low frequencies (<5 Hz) were considered. The measured specific inertance displays an exponentially decaying trend with an increase in frequency for both cases. Examining the low and high frequency limits of the experimental specific inertance reveals that the internal stiffness and damping inherent in the test article has a significant influence on it. In order to account for this in the theoretical model, a method based on experimental phase matching was used to estimate the internal stiffness and damping using a representative lumped element model. The estimated internal stiffness and damping display increasing and decreasing trends, respectively, with an increase in excitation frequency, and appear to asymptote to finite limits. The phase-matching method to estimate internal stiffness and damping provides a means to calibrate the theoretical model to include the characteristic structural effects that are unique to each prototype, thereby improving the accuracy of its predictions. Further, examination of the experimental phase lag between the input load and output acceleration reveals interesting trends that could indicate the nature of the nonlinearities in the test article under low-rate excitations. The spectra of phase histories show that ultra-low frequency components (<1 Hz) dominate, indicating meandering effects in the structural assembly, while component corresponding to the excitation frequency is also evident when the output displacements are significant. Analysis of the spectra of phase histories could be utilized to understand the origins of nonlinear structural effects in such inertant devices. It is envisioned that this approach can be utilized to subsume the specific nonlinear characteristics of individual inerters into a simple yet unsimplistic model that can be used to more efficiently and accurately predict the behavior of multi-element, inerter-based systems that employ them. Further, by engineering intentional nonlinear response in inerters, it could be possible to create devices that provide passive adaptive tuned mass participation. This could be of interest in potential applications related to energy harvesting, vibration isolation, and transduction or in realizing micro-scale inertance in MEMS devices where mechanical elements displaying a high yet tunable dynamic mass presence but having a low static mass are desirable.
Author Contributions
K.M. contributed to the modeling, detailed design, simulations, fabrication and testing. J.M.M. contributed to the research methodology, conceptual design, testing protocols, and data interpretation. Both authors contributed equally to the preparation of the manuscript.
Funding
Support for this work through Defense Advanced Research Projects Agency (DARPA) Grant No. D16AP00032 is gratefully acknowledged.
Conflicts of Interest
The authors declare no conflict of interest.
References
- Firestone, F.A. A new analogy between mechanical and electrical systems. J. Acoust. Soc. Am. 1933, 4, 249–267. [Google Scholar] [CrossRef]
- Smith, M.C. Synthesis of mechanical networks: The inerter. IEEE Trans. Automat. Control 2002, 47, 1648–1662. [Google Scholar] [CrossRef]
- Smith, M.C.; Wang, F.C. Performance benefits in passive vehicle suspensions employing inerters. Veh. Syst. Dyn. 2004, 42, 235–257. [Google Scholar] [CrossRef]
- Wang, F.C.; Yu, C.H.; Chang, M.L.; Hsu, M. The performance improvements of train suspension systems with inerters. In Proceedings of the 45th IEEE Conference on Decision and Control, San Diego, CA, USA, 13–15 December 2006; pp. 1472–1477. [Google Scholar]
- Wang, F.C.; Su, W.J. Impact of inerter nonlinearities on vehicle suspension control. Veh. Syst. Dyn. 2008, 46, 575–595. [Google Scholar] [CrossRef] [Green Version]
- Shen, Y.; Chen, L.; Yang, X.; Shi, D.; Yang, J. Improved design of dynamic vibration absorber by using the inerter and its application in vehicle suspension. J. Sound Vib. 2016, 361, 148–158. [Google Scholar] [CrossRef]
- Papageorgiou, C.; Smith, M.C. Laboratory experimental testing of inerters. In Proceedings of the 44th IEEE Conference on Decision and Control, 2005 and 2005 European Control Conference, Seville, Spain, 12–15 December 2005; pp. 3351–3356. [Google Scholar]
- Wang, F.C.; Hong, M.F.; Lin, T.C. Designing and testing a hydraulic inerter. J. Mech. Eng. Sci. 2010. [Google Scholar] [CrossRef]
- Swift, S.J.; Smith, M.C.; Glover, A.R.; Papageorgiou, C.; Gartner, B.; Houghton, N.E. Design and modelling of a fluid inerter. Int. J. Control 2013, 86, 2035–2051. [Google Scholar] [CrossRef]
- Evangelou, S.S.; Limebeer, D.J.N.; Sharp, R.S.; Smith, M.C. Steering compensation for high-performance motorcycles. In Proceedings of the 43rd IEEE Conference on Decision and Control, Paradise Island, Bahamas, 14–17 December 2004; pp. 749–754. [Google Scholar]
- Chen, M.Z.Q.; Papageorgiou, C.; Scheibe, F.; Wang, F.C.; Smith, M.C. The missing mechanical circuit element. IEEE Trans. Circuits Syst. 2009, 9, 10–26. [Google Scholar] [CrossRef]
- Hu, Y.; Li, C.; Chen, M.Z.Q. Optimal control for semi-active suspension with inerter. In Proceedings of the 31st Chinese Control Conference, Hefei, China, 25–27 July 2012. [Google Scholar]
- Chen, M.Z.Q.; Hu, Y.; Li, C.; Chen, G. Performance Benefits of Using Inerter in Semi Active Suspensions. IEEE. Trans. Control Syst. Technol. 2015. [Google Scholar] [CrossRef]
- Chen, M.Z.Q.; Hu, Y.; Li, C.; Chen, G. Semi-active suspension with semi-active inerter and semi-active damper. In Proceedings of the 19th World Congress the International Federation of Automatic Control, Cape Town, South Africa, 24–29 August 2014. [Google Scholar]
- Zhang, X.J.; Ahmadian, M.; Guo, K.H. On the benefits of semi-active suspensions with inerters. Shock Vib. 2012, 19, 257–272. [Google Scholar] [CrossRef]
- Chen, M.Z.Q.; Hu, Y.; Du, B. Suspension Performance with One Damper and One Inerter. In Proceedings of the 24th Chinese Control and Decision Conference (CCDC), Taiyuan, China, 23–25 May 2012. [Google Scholar]
- Kuznetsov, A.; Mammadov, M.; Sultan, I.; Hajilarov, E. Optimization of improved suspension system with inerter device of the quarter-car model in vibration analysis. Arch. Appl. Mech. 2011, 81, 1427–1437. [Google Scholar] [CrossRef]
- Tran, T.T.; Hasegawa, H. Advanced Passive Suspension with Inerter Devices and optimization design for vehicle oscillation. Int. J. Mech. Eng. Robot. Res. 2015. [Google Scholar] [CrossRef]
- Zhang, Z.; Chen, M.Z.Q.; Huang, L. Frequency Response of a Suspension System with Inerter and Play. In Proceedings of the 21st International Congress on Sound and Vibration, Beijing, China, 13–17 July 2014. [Google Scholar]
- Hu, Y.; Wang, K.; Chen, M.Z.Q. Performance Optimization for Passive Suspensions with One Damper One Inerter and Three Springs. In Proceedings of the IEEE International Conference on Information and Automation, Lijiang, China, 8–10 August 2015. [Google Scholar]
- Shen, Y.; Chen, L.; Liu, Y.; Zhang, X. Analysis of vibration transfer characteristics of vehicle suspension system employing inerter. J. Theor. Appl. Mech. 2017, 55, 1245–1256. [Google Scholar] [CrossRef]
- Liu, Y.; Chen, M.Z.Q.; Tian, Y. Nonlinearities in Landing Gear Model Incorporating Inerter. In Proceedings of the IEEE International Conference on Information and Automation, Lijiang, China, 8–10 August 2015. [Google Scholar]
- Xin, D.; Yuance, L.; Chen, M.Z.Q. Application of Inerter to Aircraft Landing Gear Suspension. In Proceedings of the 34th Chinese Control Conference, Hangzhou, China, 28–30 July 2015. [Google Scholar]
- Hu, Y.; Chen, M.Z.Q. Performance evaluation for inerter-based dynamic vibration absorbers. Int. J. Mech. Sci. 2015, 99, 297–307. [Google Scholar] [CrossRef] [Green Version]
- Marian, L.; Giaralis, A. Optimal design of a novel tuned mass-damper-inerter (TMDI) passive vibration control configuration for stochastically support-excited structural systems. Probabil. Eng. Mech. 2014, 38, 156–164. [Google Scholar] [CrossRef]
- Brzeski, P.; Pavlovskaia, E.; Kapitaniak, T.; Perlikowski, P. The application of inerter in tuned mass absorber. Int. J. Nonlinear Mech. 2015, 70, 20–29. [Google Scholar] [CrossRef]
- Wang, F.-C.; Chen, C.-W.; Liao, M.-K.; Hong, M.-F. Performance analyses of building suspension control with inerters. In Proceedings of the 46th IEEE Conference on Decision and Control, New Orleans, LA, USA, 12–14 December 2007; pp. 3786–3791. [Google Scholar]
- Wang, F.-C.; Hong, M.-F.; Chen, C.-W. Building suspensions with inerters. J. Mech. Eng. Sci. 2010, 224, 1605–1616. [Google Scholar] [CrossRef]
- Lazar, I.F.; Neild, S.A.; Wagg, D.J. Using an inerter-based device for structural vibration suppression. Earthq. Eng. Struct. Dyn. 2014, 43, 1129–1147. [Google Scholar] [CrossRef] [Green Version]
- Siami, A.; Cigada, A.; Karimi, H.R.; Zappa, E. Vibration Protection of a Famous Statue against Ambient and Earthquake Excitation Using a Tuned Inerter–Damper. Machines 2017, 5, 33. [Google Scholar] [CrossRef]
- Pérez-Díaz, J.L.; Valiente-Blanco, I.; Cristache, C. Z-Damper: A New Paradigm for Attenuation of Vibrations. Machines 2016, 4, 12. [Google Scholar] [CrossRef]
- Li, P.; Lam, J.; Cheung, K.C. Investigation on Semi-Active Control of Vehicle Suspension using Adaptive Inerter. In Proceedings of the 21st International Congress on Sound and Vibration, Beijing, China, 13–17 July 2014. [Google Scholar]
- Brzeski, P.; Lazarek, M.; Perlikowski, P. Experimental study of the novel tuned mass damper with inerter which enables changes of inertance. J. Sound Vib. 2017, 404, 47–57. [Google Scholar] [CrossRef]
- Smith, N.D.J.; Wagg, D.J. A fluid inerter with variable inertance properties. In Proceedings of the 6th European Conference on Structural Control, Sheffield, England, 11–13 July 2016. [Google Scholar]
- Suciu, B.; Tsuji, Y. Theoretical Investigation on the Dynamic Characteristics of One Degree of Freedom Vibration System Equipped with Inerter of Variable Inertance. Int. J. Mech. Mechatron. Eng. 2017. [Google Scholar] [CrossRef]
- Brzeski, P.; Perlikowski, P. Effects of play and inerter nonlinearities on the performance of tuned mass damper. Nonlinear Dyn. 2017, 88, 1–15. [Google Scholar] [CrossRef]
- Sun, X.Q.; Chen, L.; Wang, S.H.; Zhang, X.L.; Yang, X.F. Performance Investigation of Vehicle Suspension System with Nonlinear Ball-Screw Inerter. Int. J. Automot. Technol. 2008, 17, 399–408. [Google Scholar] [CrossRef]
- Gonzalez-Buelga, A.; Lazar, I.F.; Jiang, J.Z.; Neild, S.A.; Inman, D.J. Assessing the Effect of Nonlinearities on the Performance of a Tuned Inerter Damper. Struct. Control Health Monit. 2017, 24. [Google Scholar] [CrossRef]
- Zhang, X.-L.; Gao, Q.; Nie, J. The Mem-Inerter: A New Mechanical Element with Memory. Adv. Mech. Eng. 2018, 10, 1–13. [Google Scholar] [CrossRef]
Figure 1.
(a) CAD model of the ball-screw inerter, and (b) line diagram of the ball-screw inerter showing forces and geometric parameters. All of the dimensions shown are in mm.
Figure 1.
(a) CAD model of the ball-screw inerter, and (b) line diagram of the ball-screw inerter showing forces and geometric parameters. All of the dimensions shown are in mm.
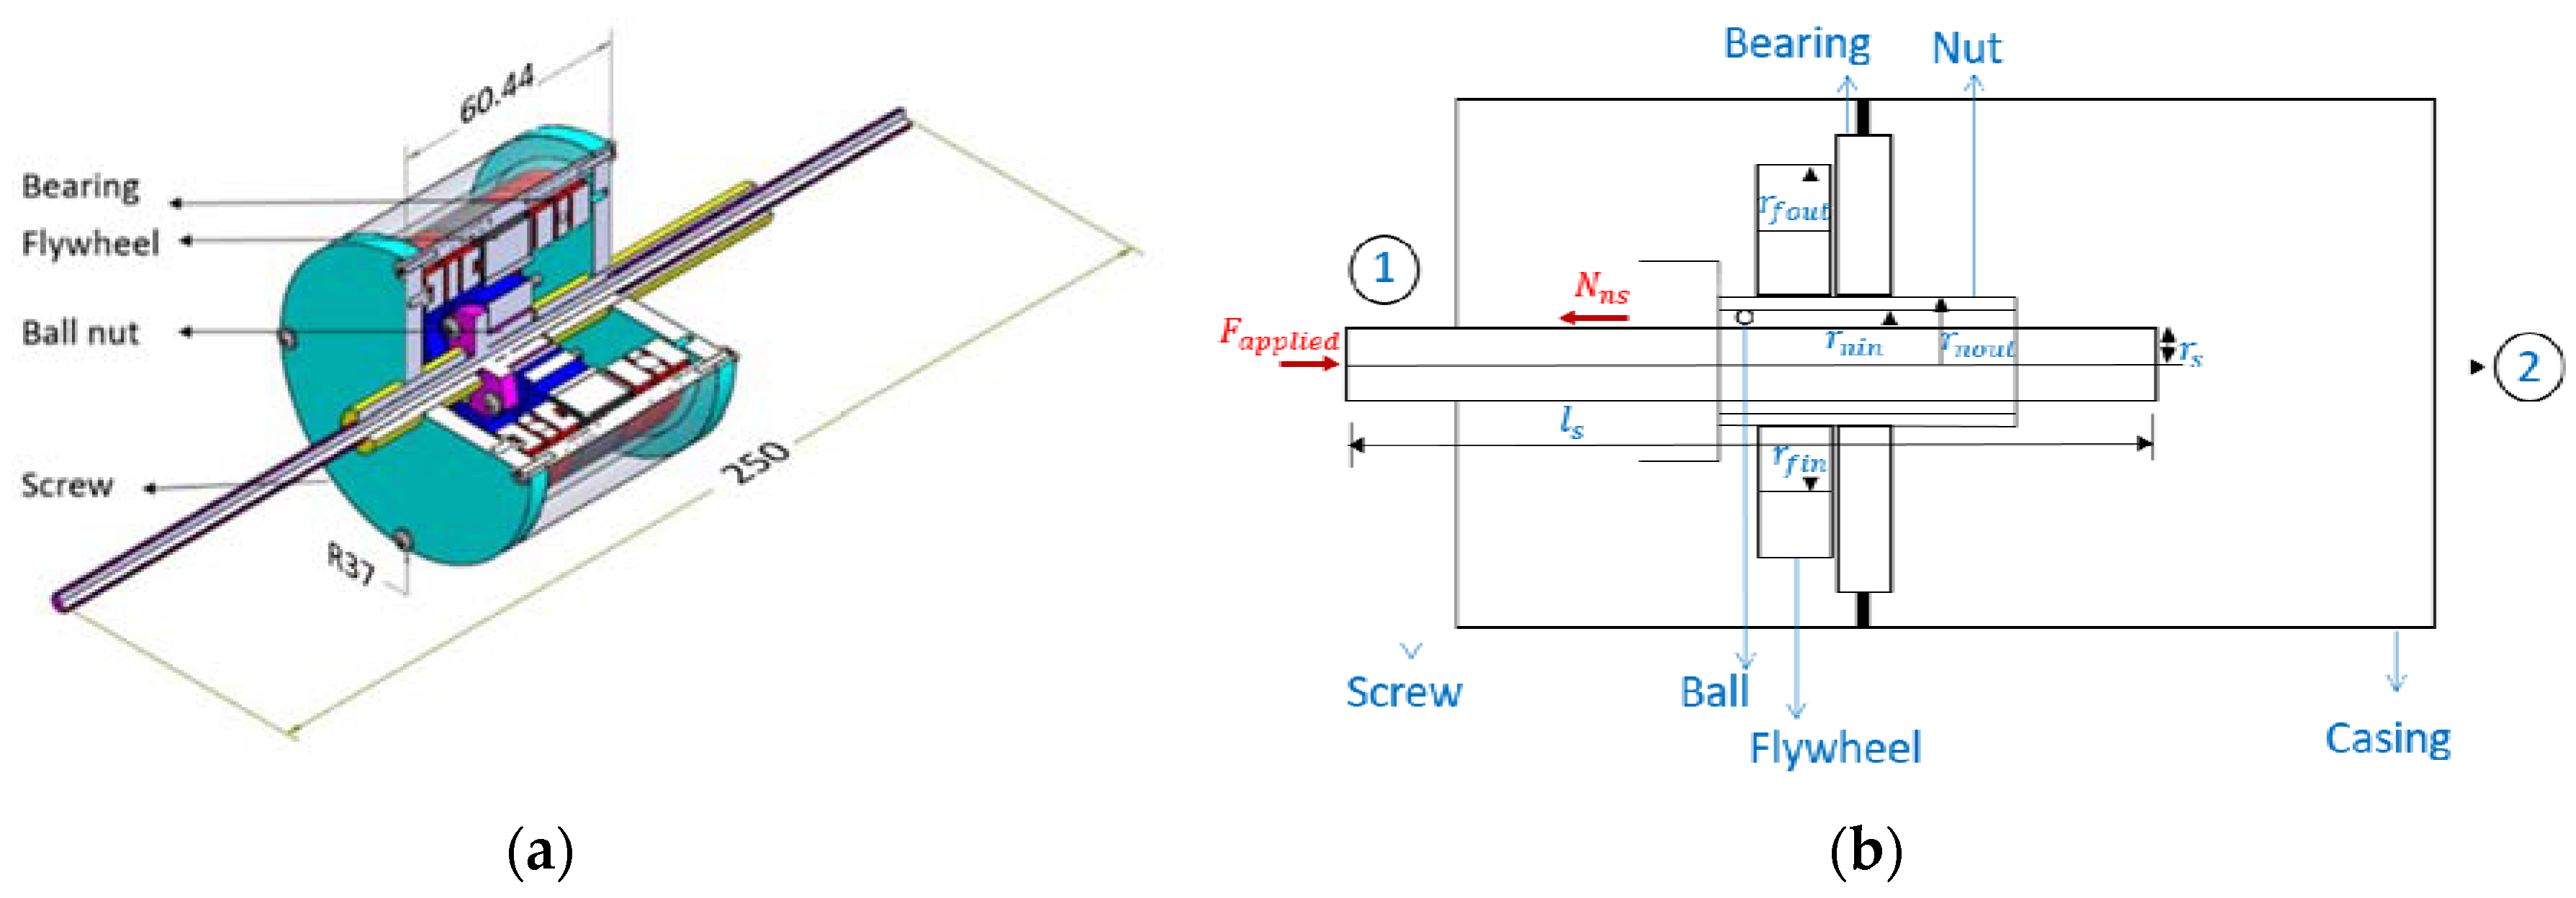
Figure 2.
(a) CAD model of the rack-and-pinion inerter and (b) line diagram of the rack-and-pinion inerter showing forces and geometric parameters. All of the dimensions shown are in mm.
Figure 2.
(a) CAD model of the rack-and-pinion inerter and (b) line diagram of the rack-and-pinion inerter showing forces and geometric parameters. All of the dimensions shown are in mm.
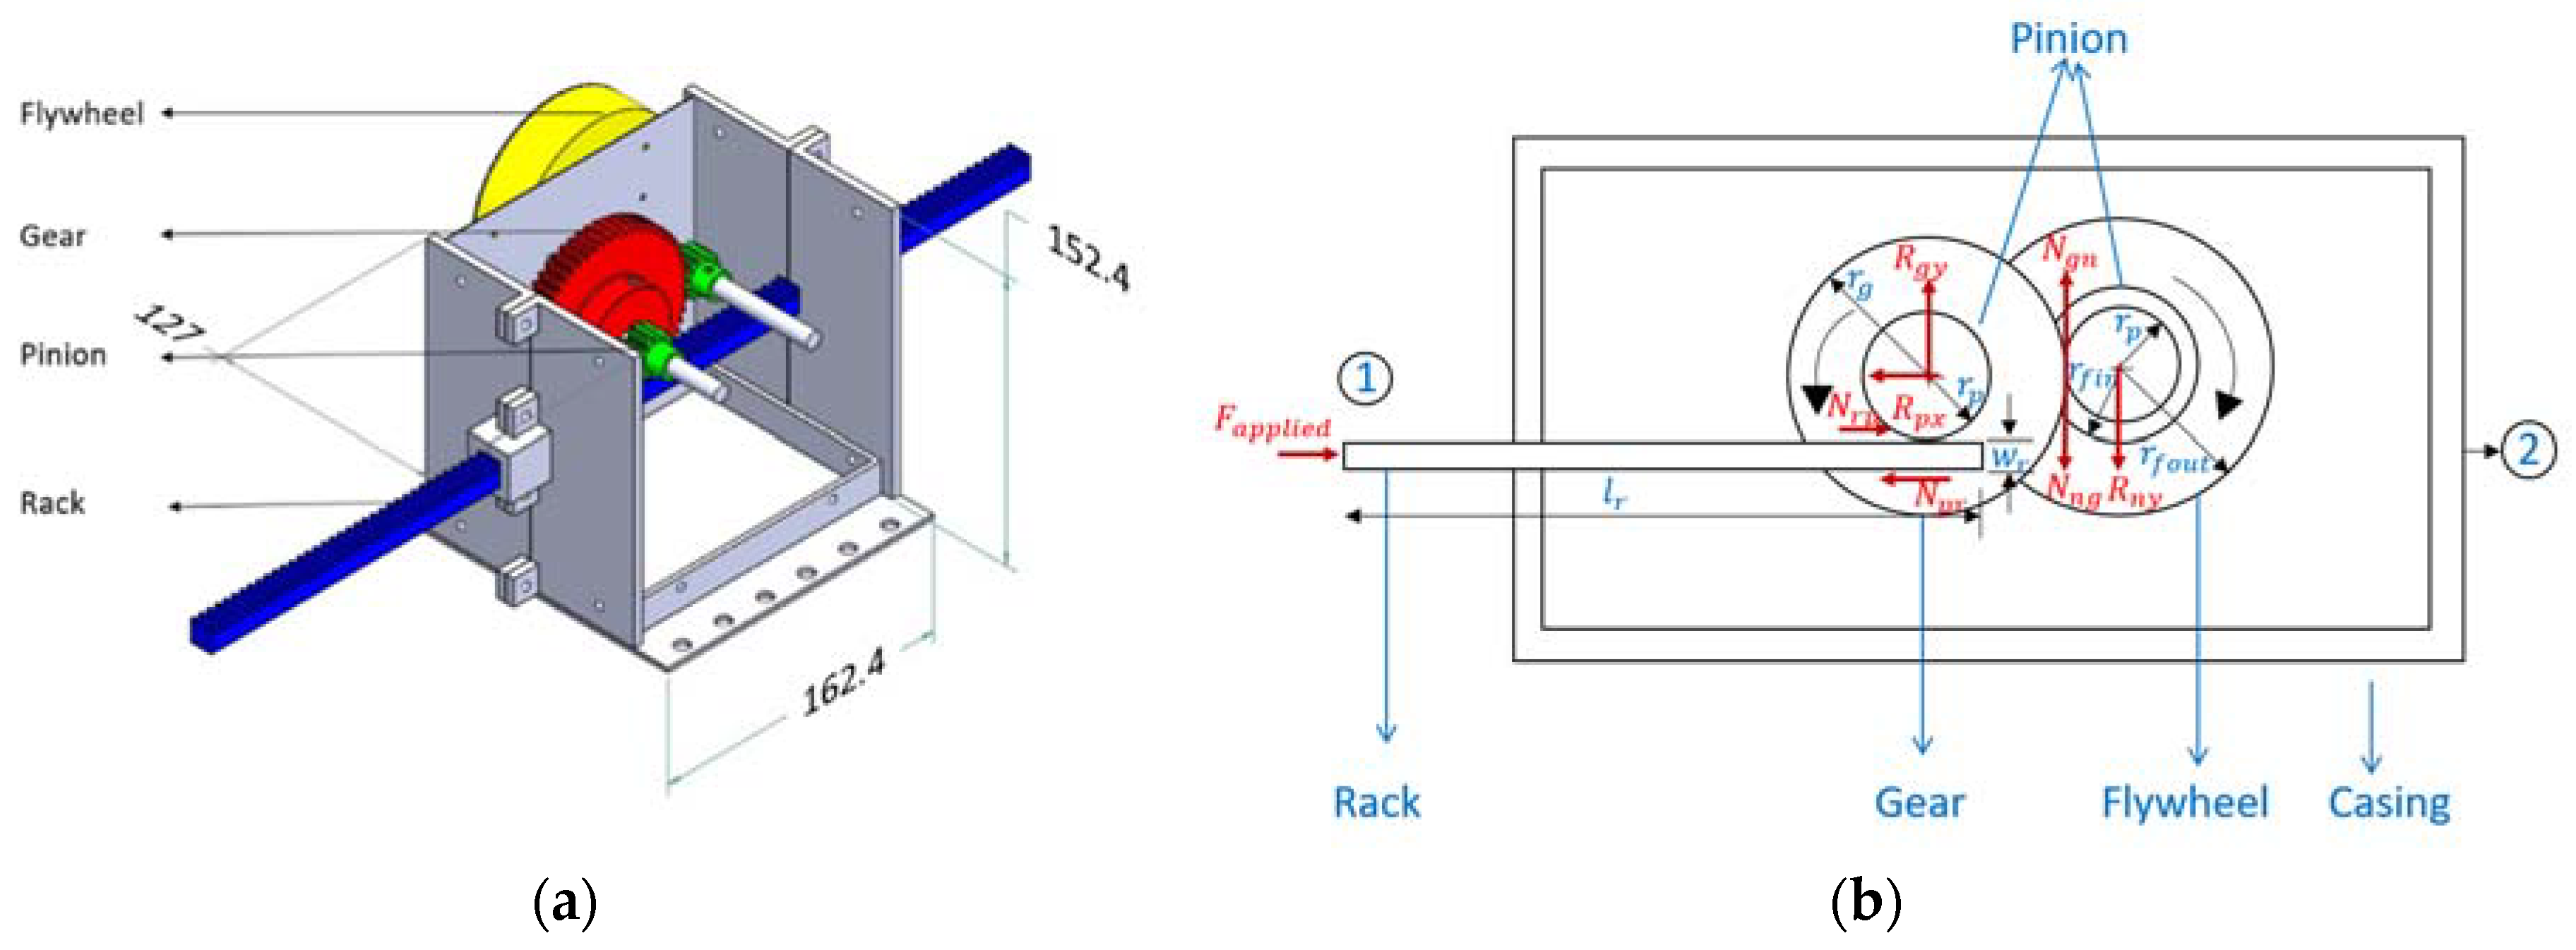
Figure 3.
Parametric curves for the ball-screw inerter. L is the lead of its screw.
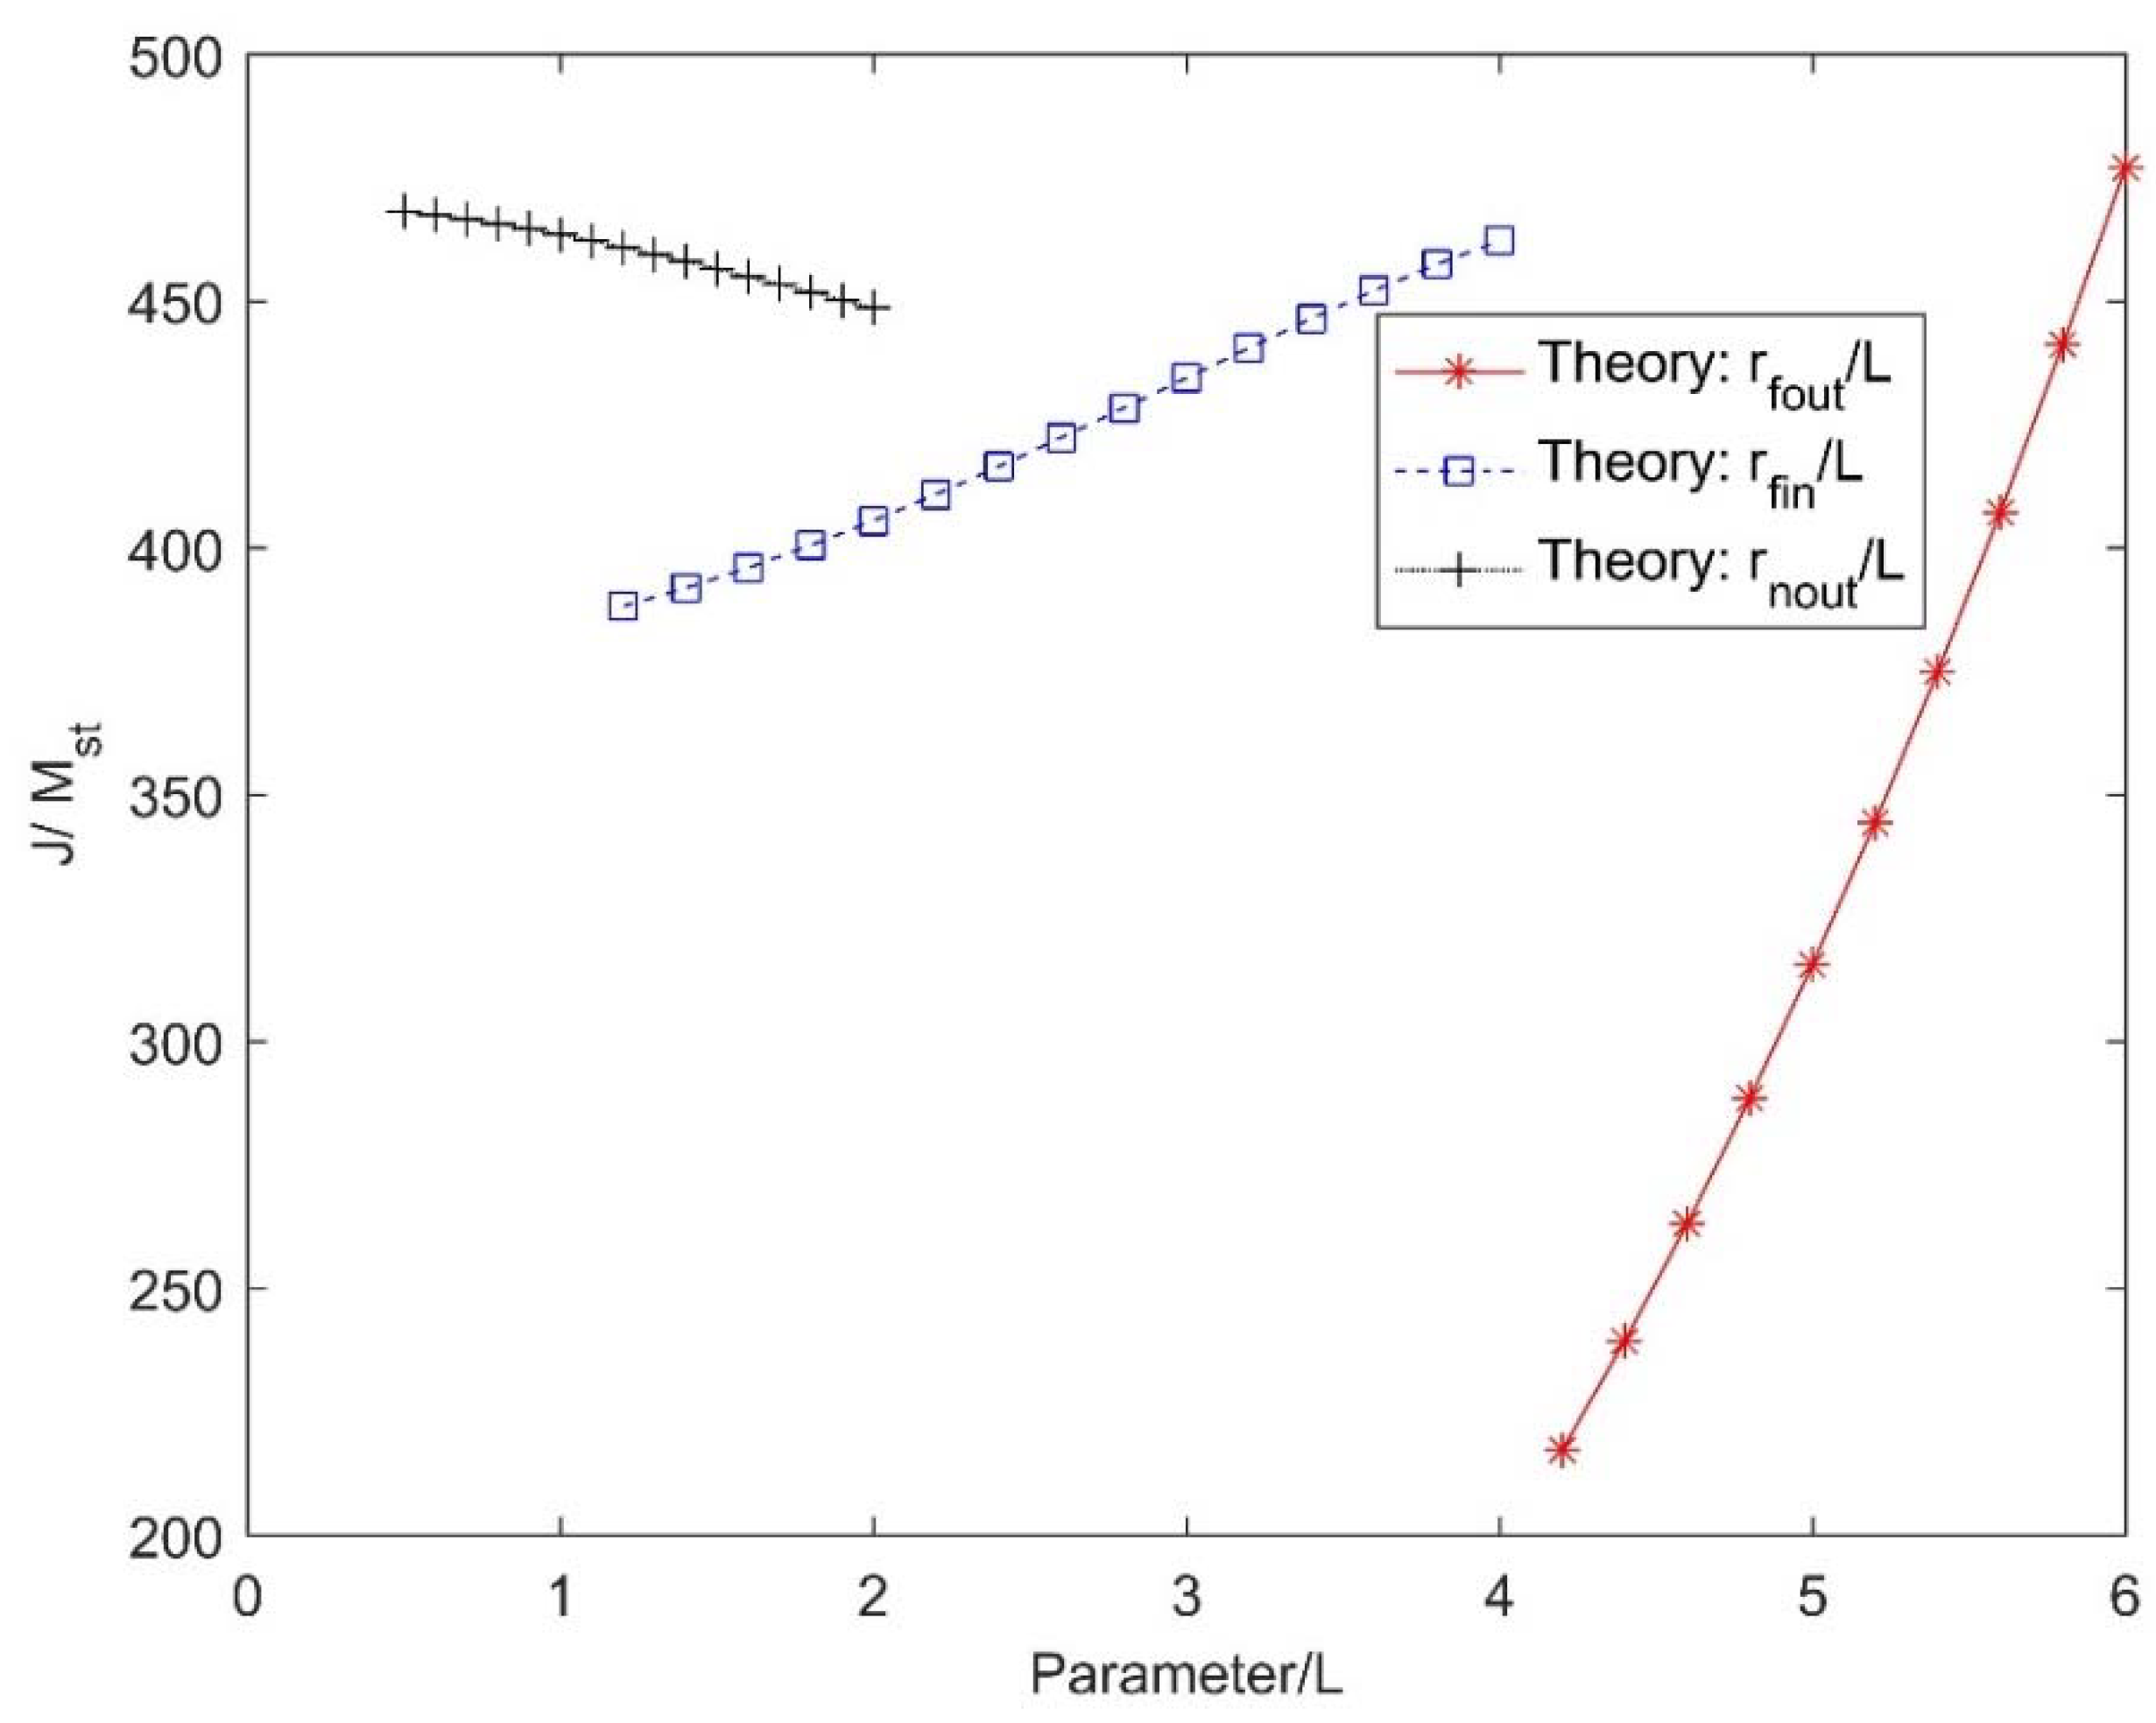
Figure 4.
Parametric curves of the rack and pinion inerter. P is the pitch of the rack.
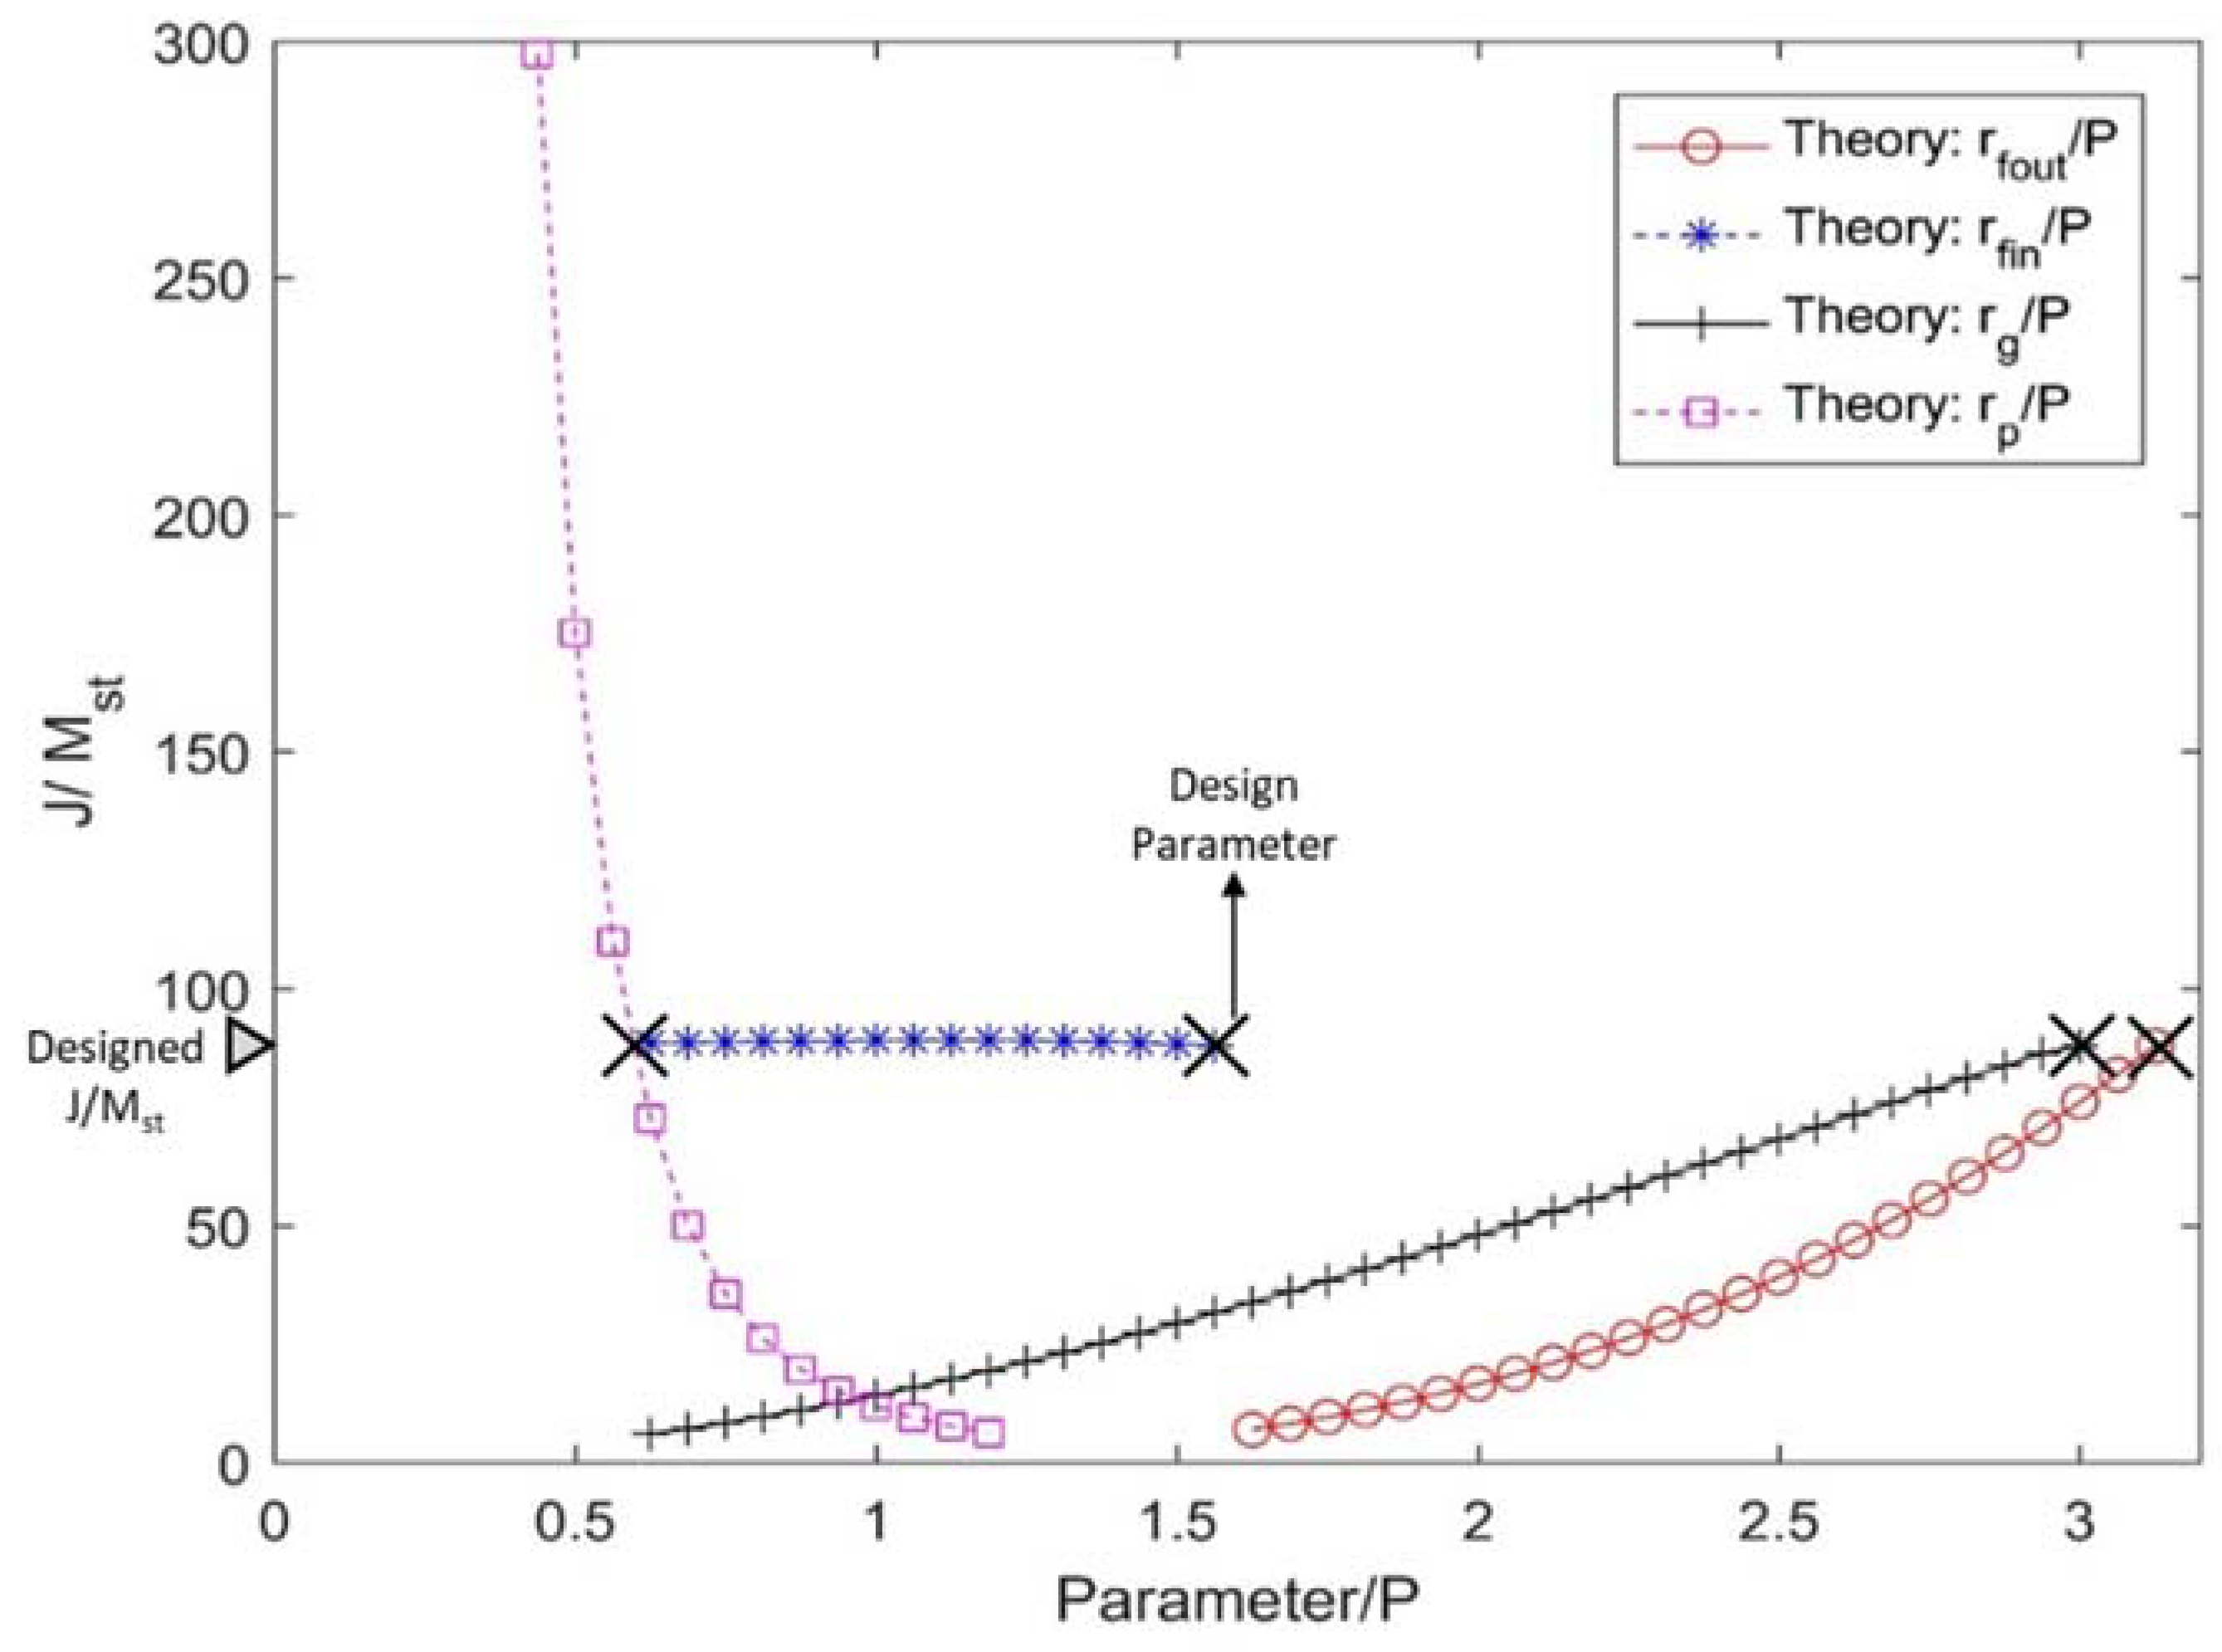
Figure 5.
(a) The rack-and-pinion inerter and (b) its experimental setup.
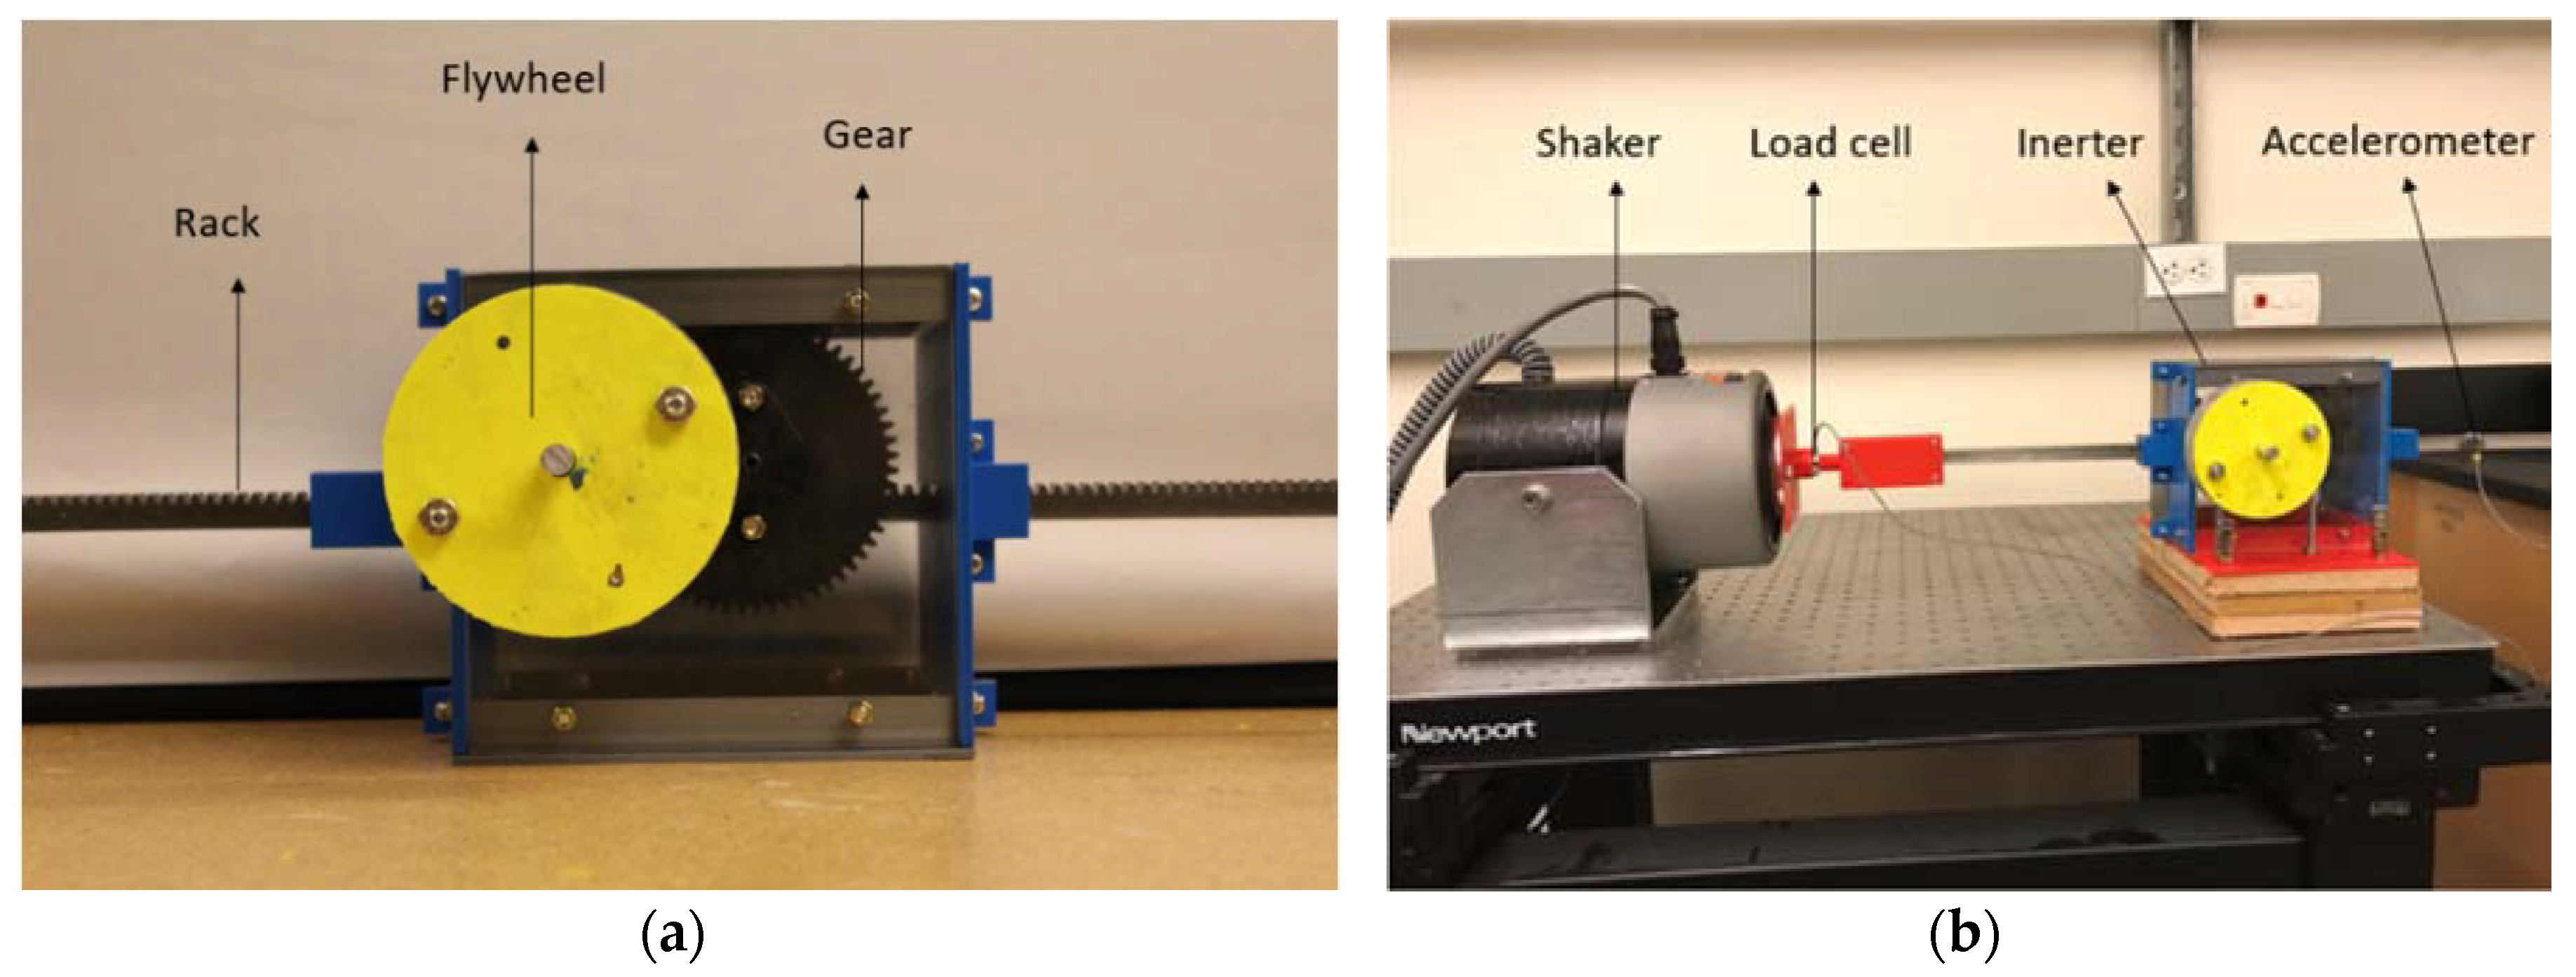
Figure 6.
Experimental (a) force and (b) acceleration histories at 0.5 Hz under displacement control.
Figure 6.
Experimental (a) force and (b) acceleration histories at 0.5 Hz under displacement control.
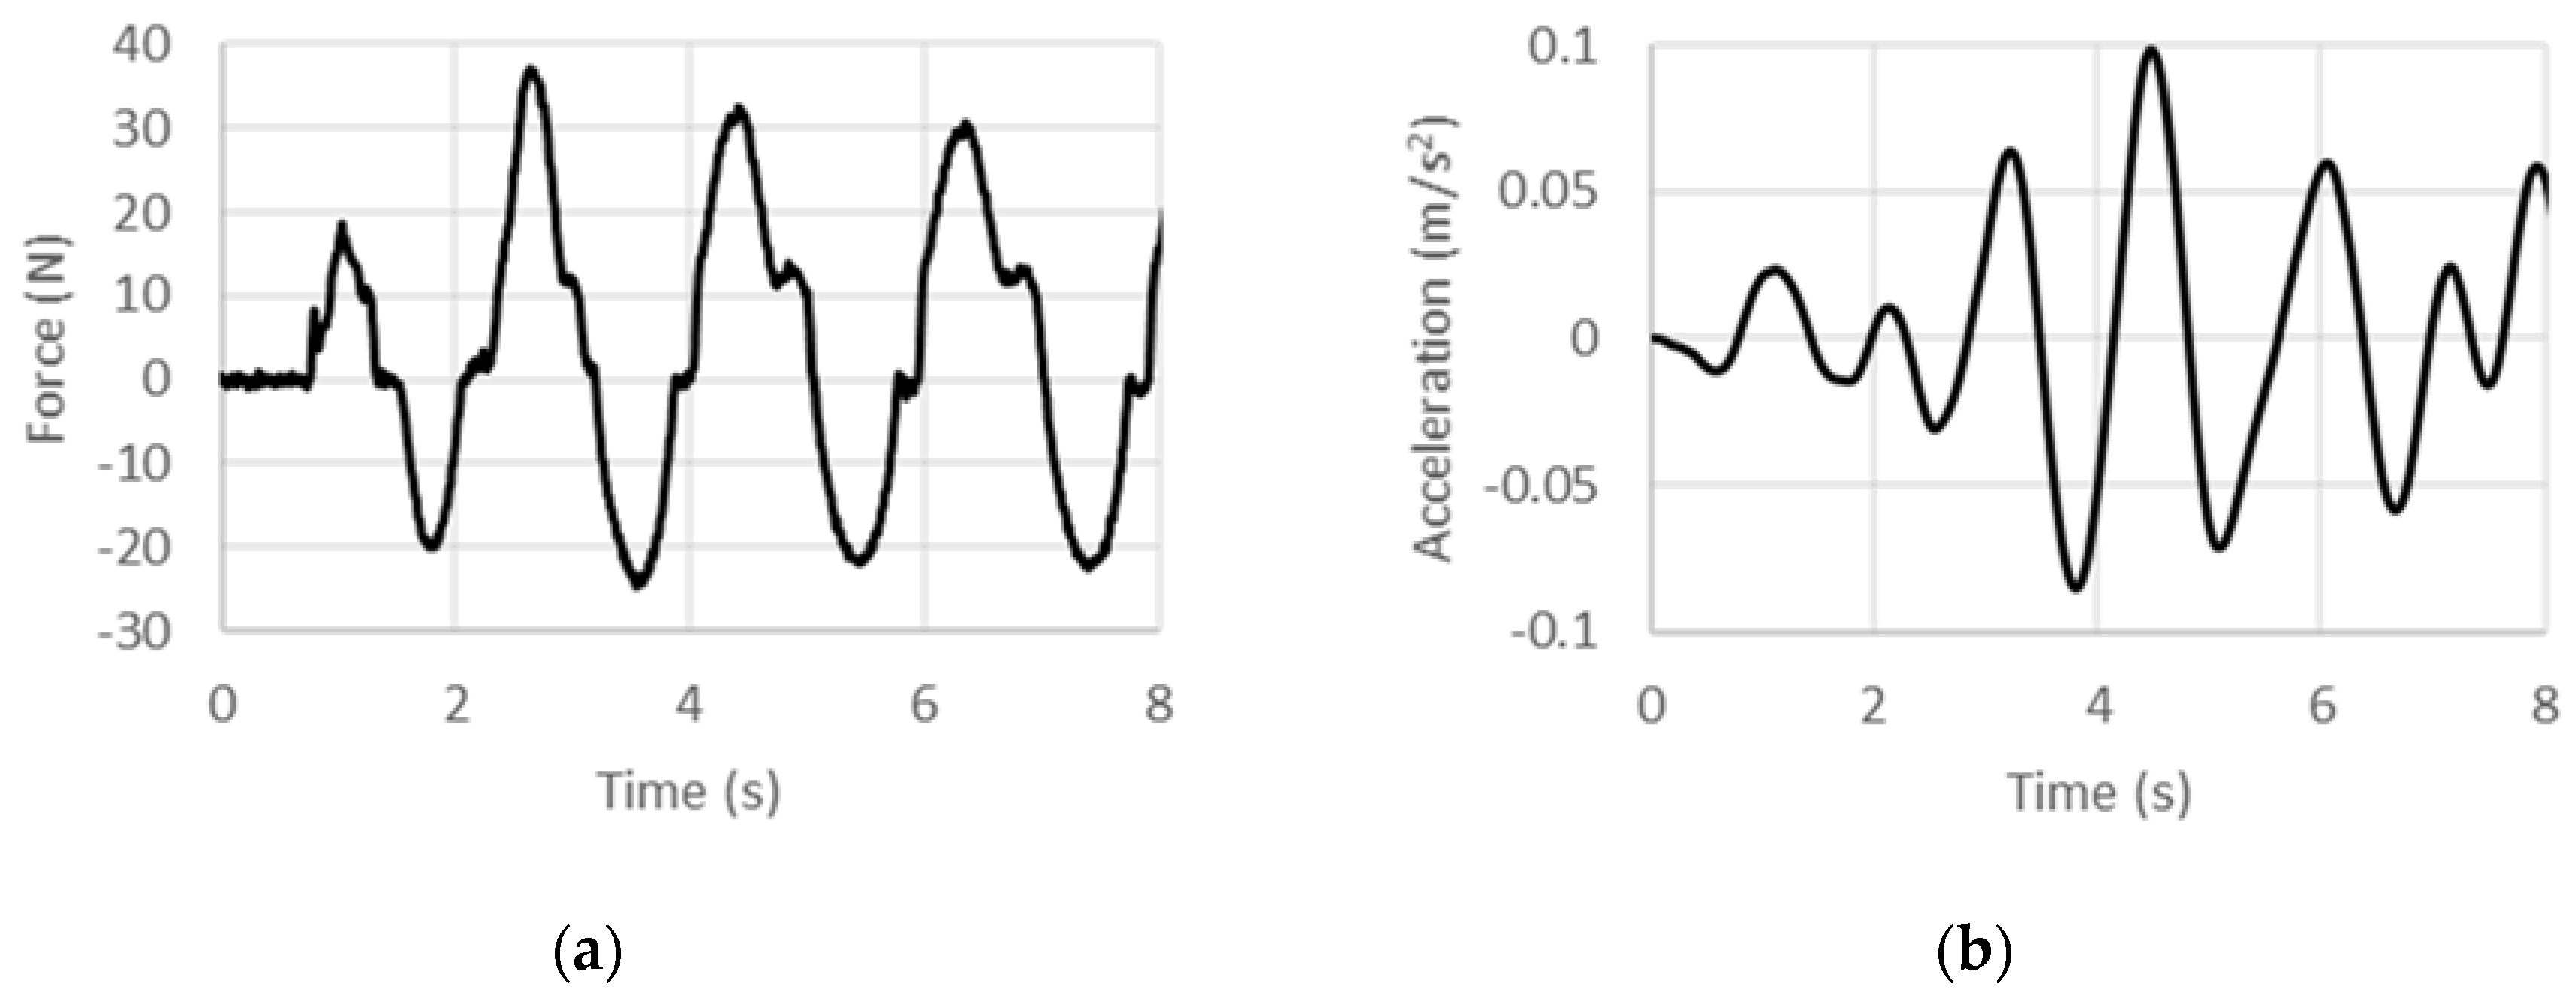
Figure 7.
Experimental (a) force and (b) acceleration histories at 1 Hz under displacement control.
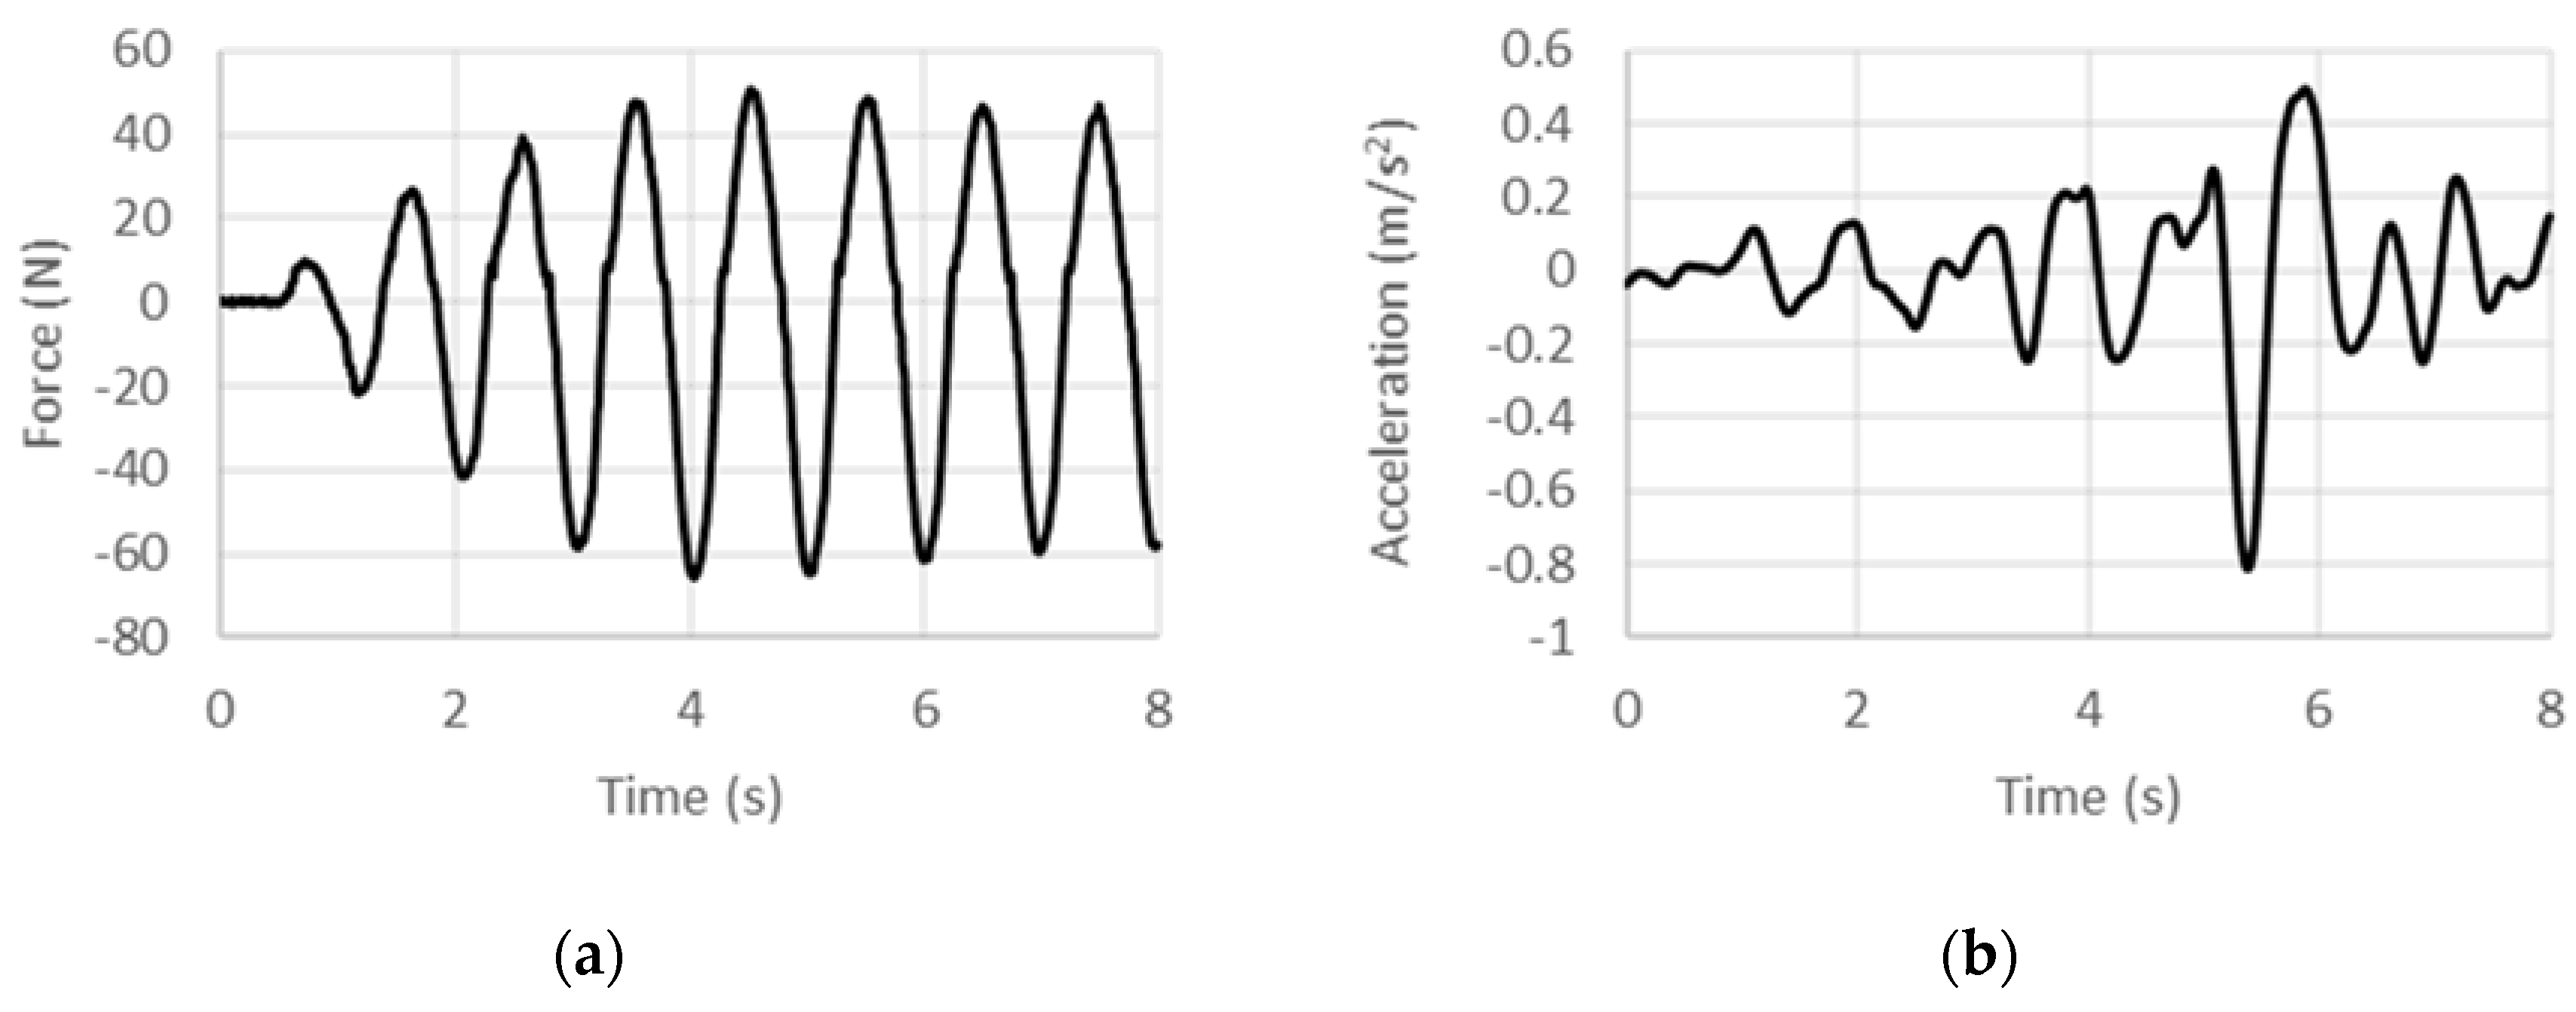
Figure 8.
Experimental (a) force and (b) acceleration histories at 2 Hz under displacement control.
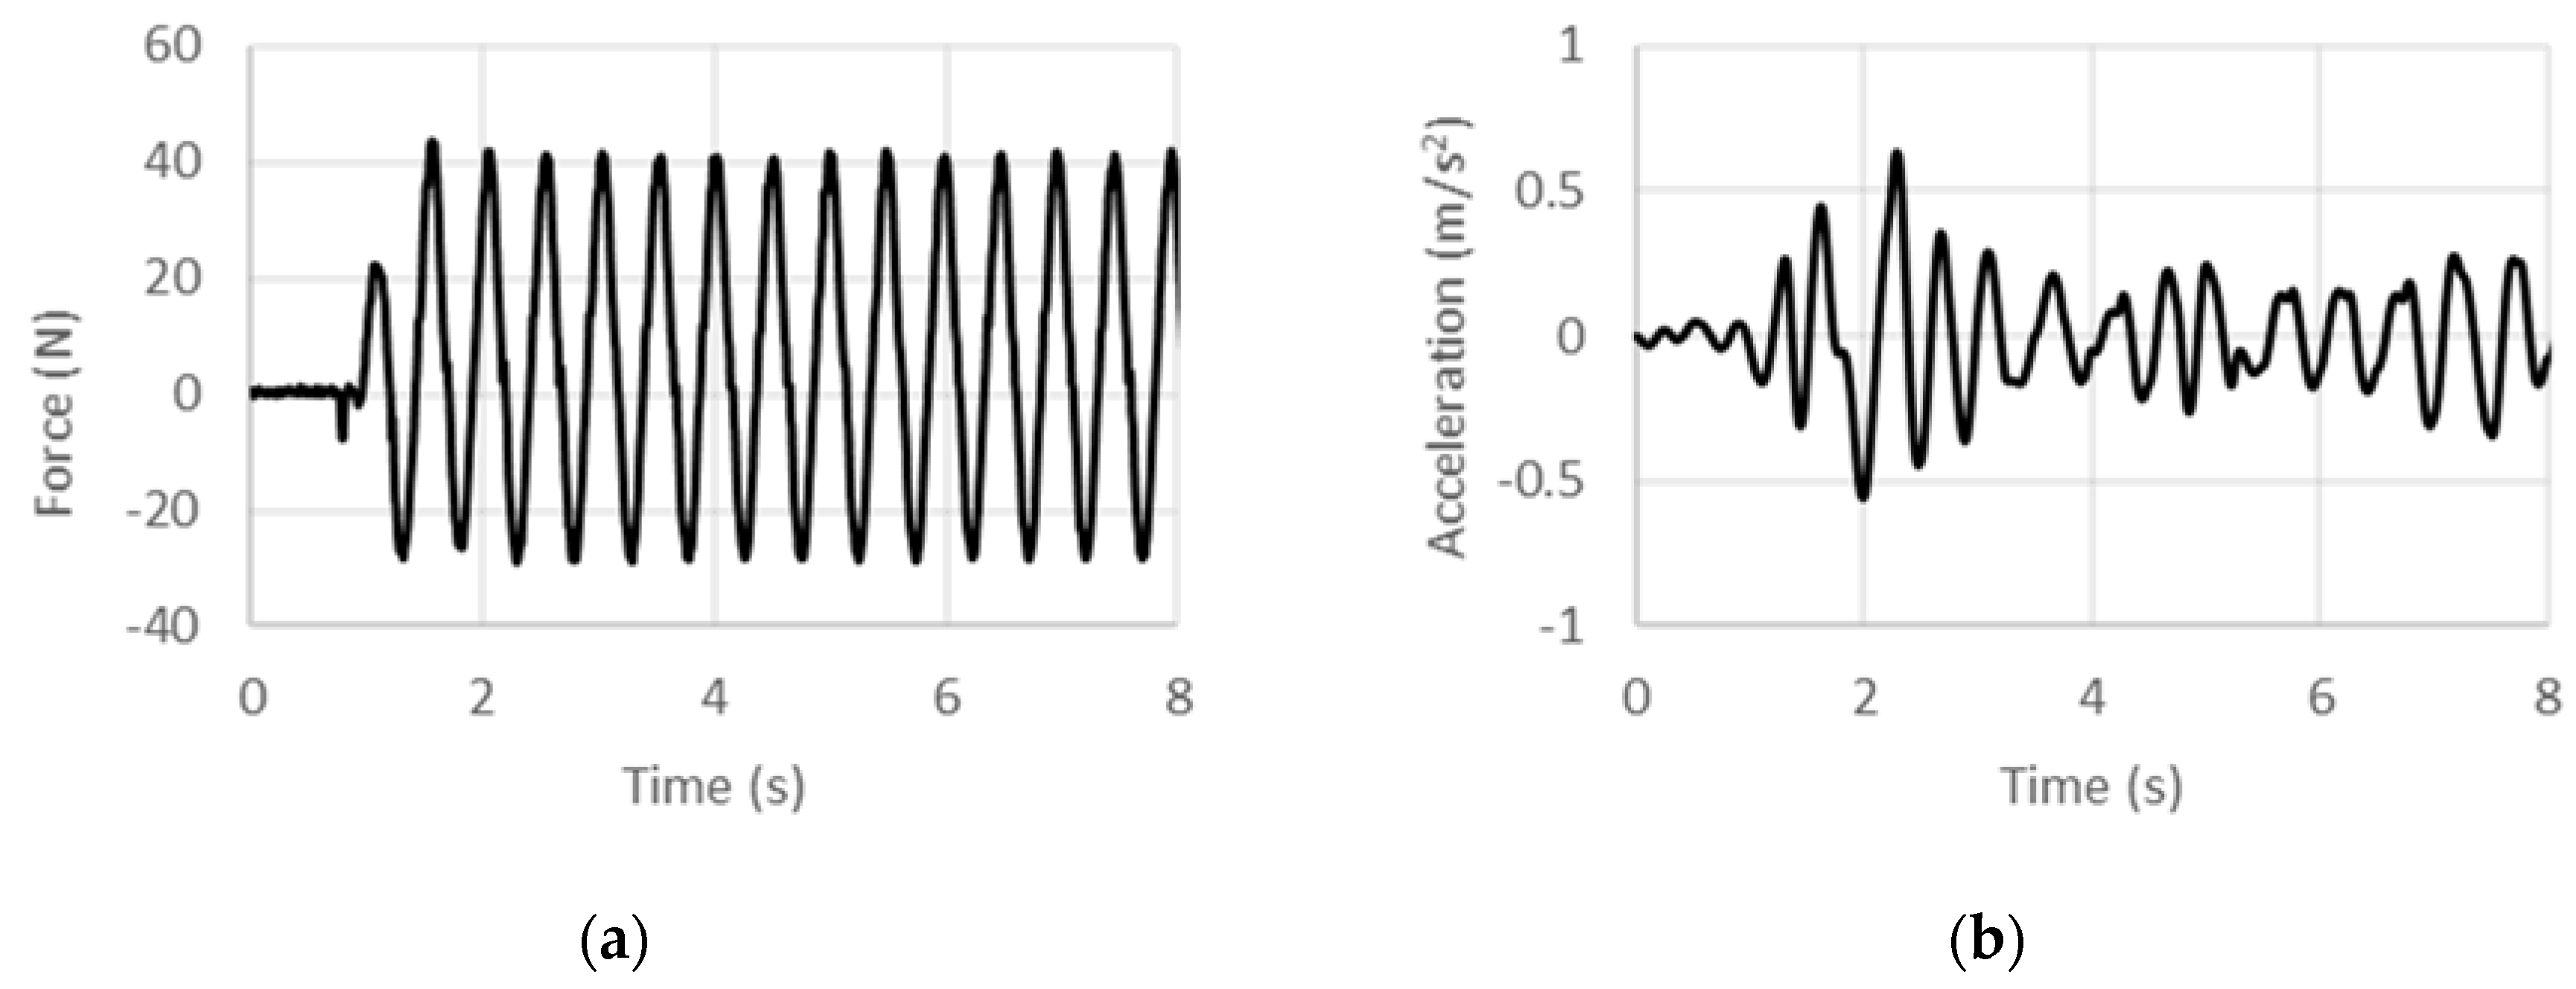
Figure 9.
Experimental (a) force and (b) acceleration histories at 3 Hz under displacement control.
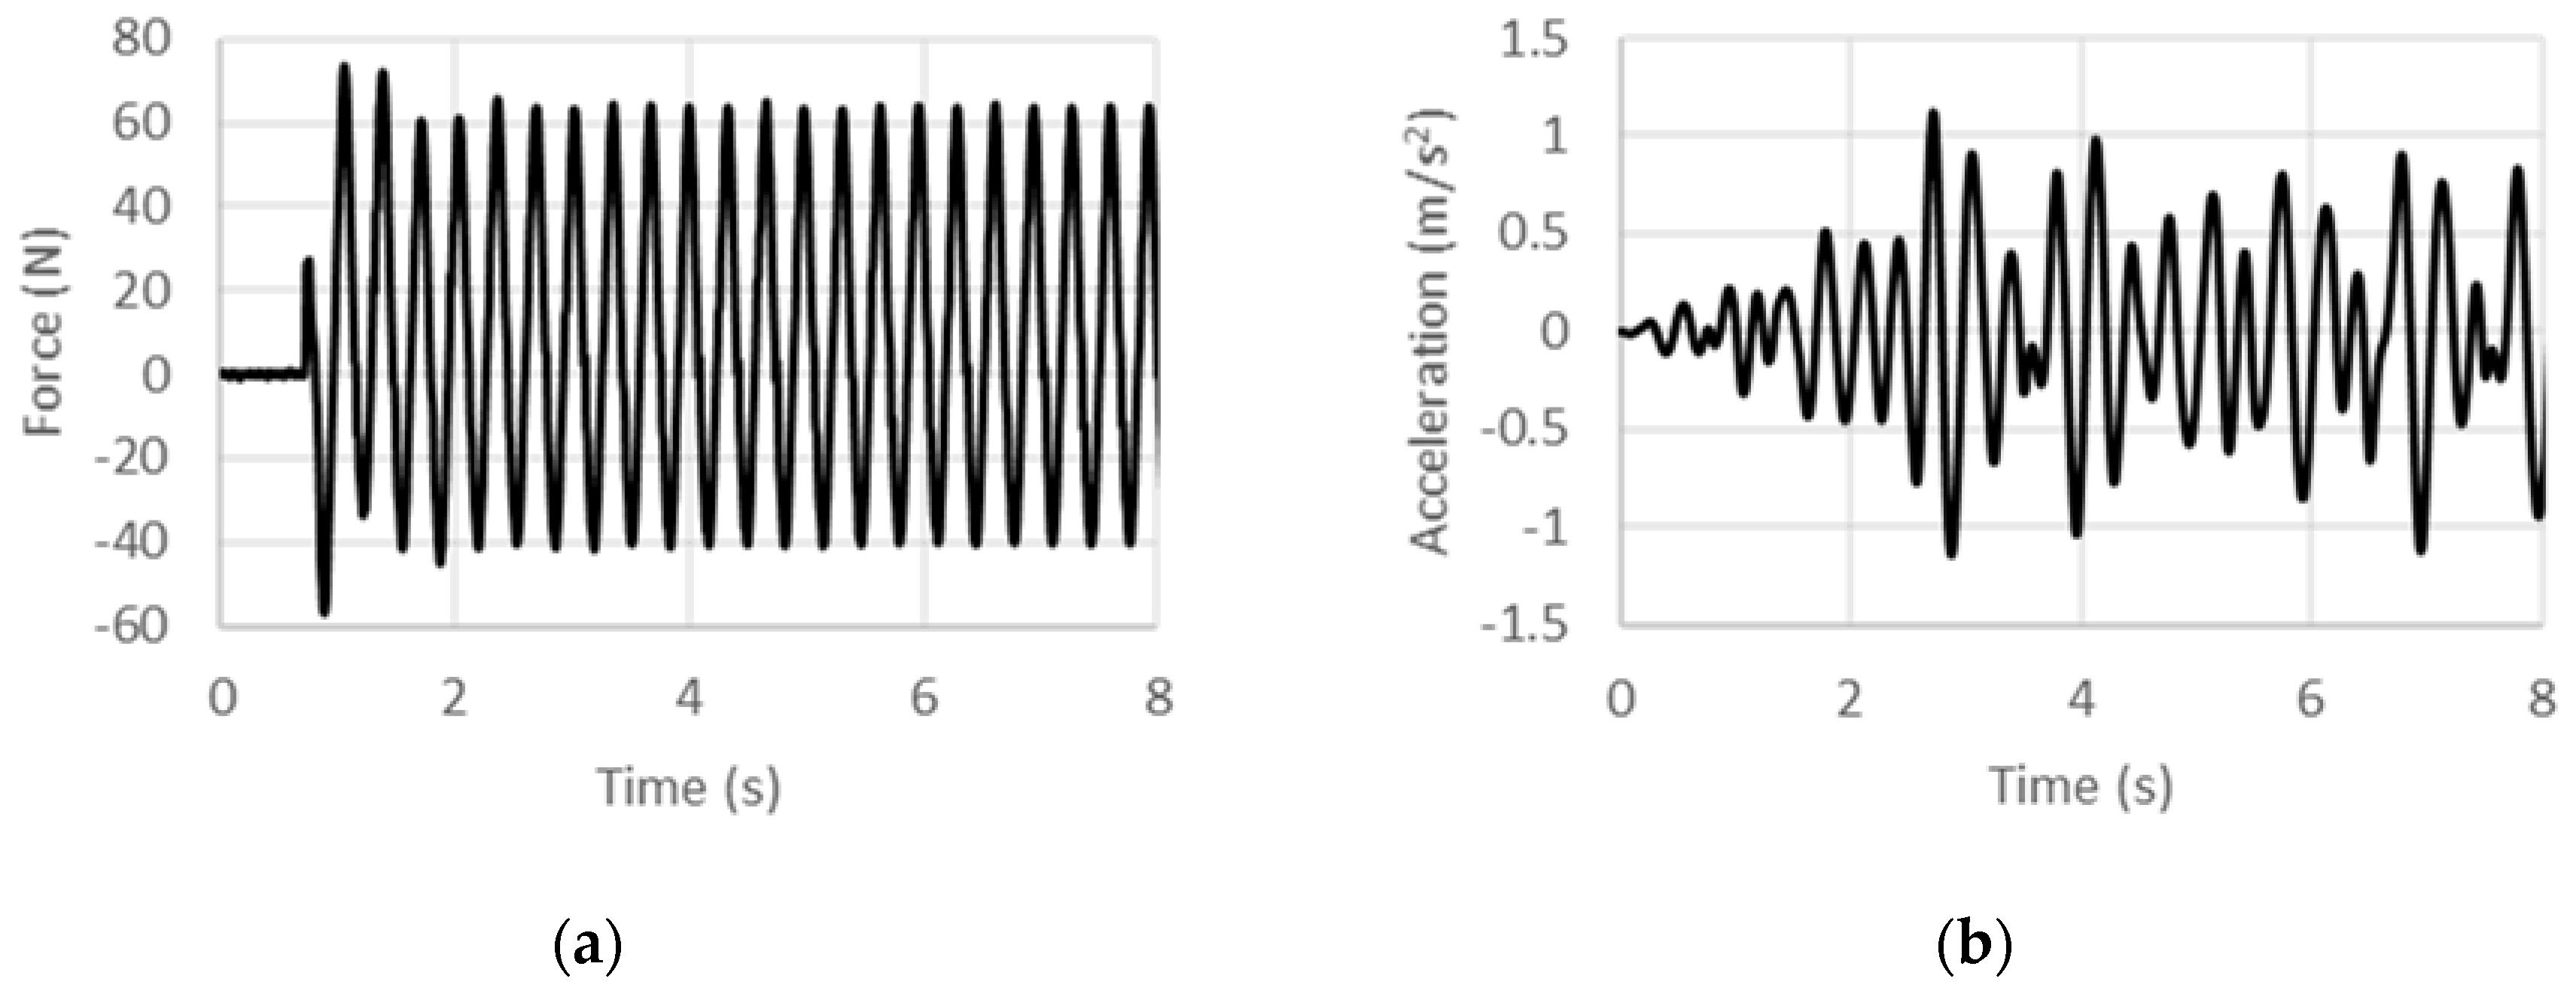
Figure 10.
Experimental (a) force and (b) acceleration histories at 4 Hz under displacement control.
Figure 10.
Experimental (a) force and (b) acceleration histories at 4 Hz under displacement control.
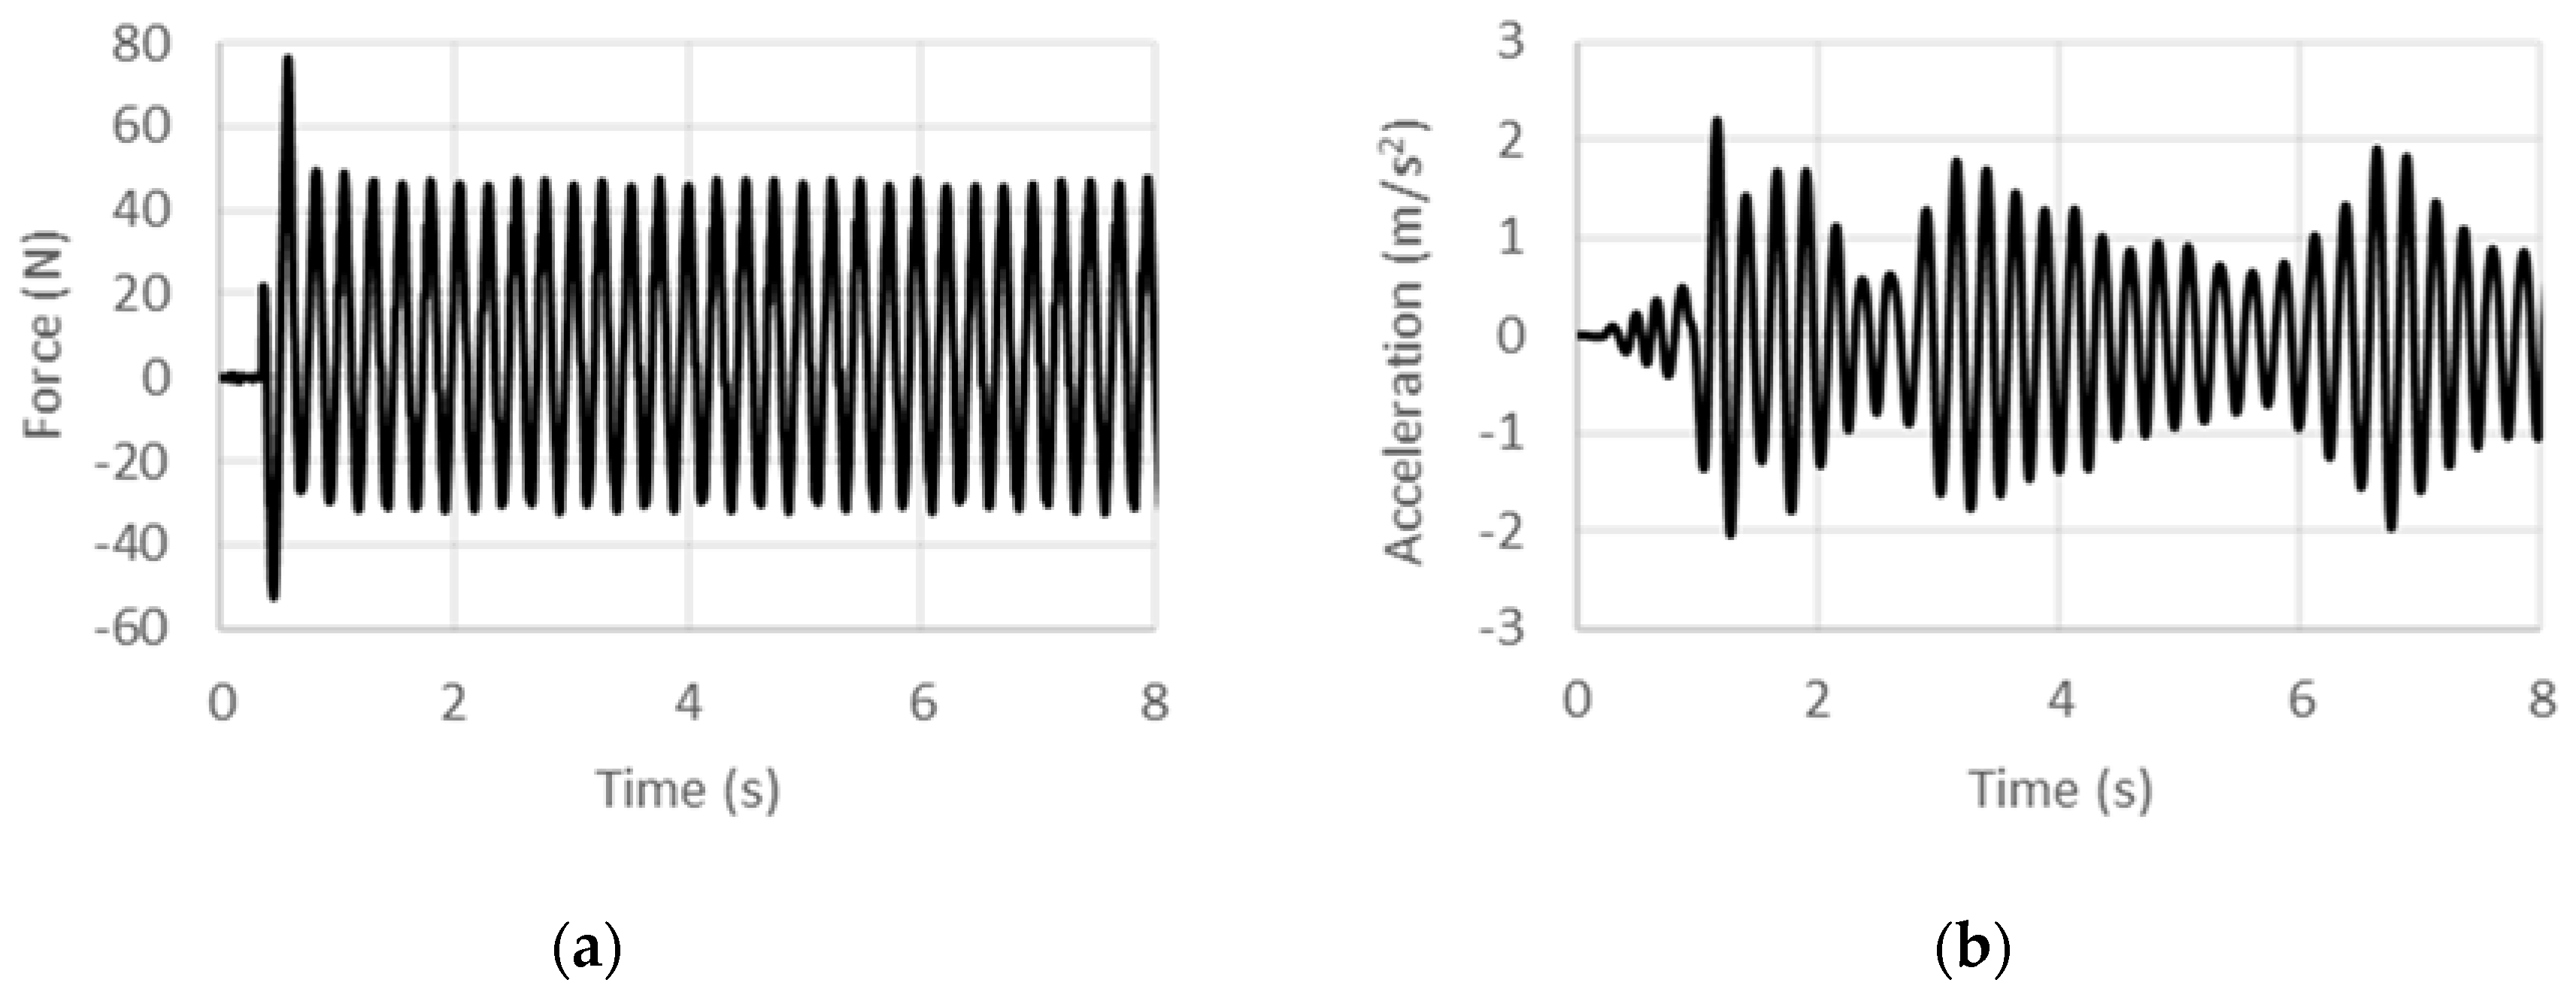
Figure 11.
Experimental (a) force and (b) acceleration histories at 5 Hz under displacement control.
Figure 11.
Experimental (a) force and (b) acceleration histories at 5 Hz under displacement control.
Figure 12.
Variation of with excitation frequency from displacement controlled tests.
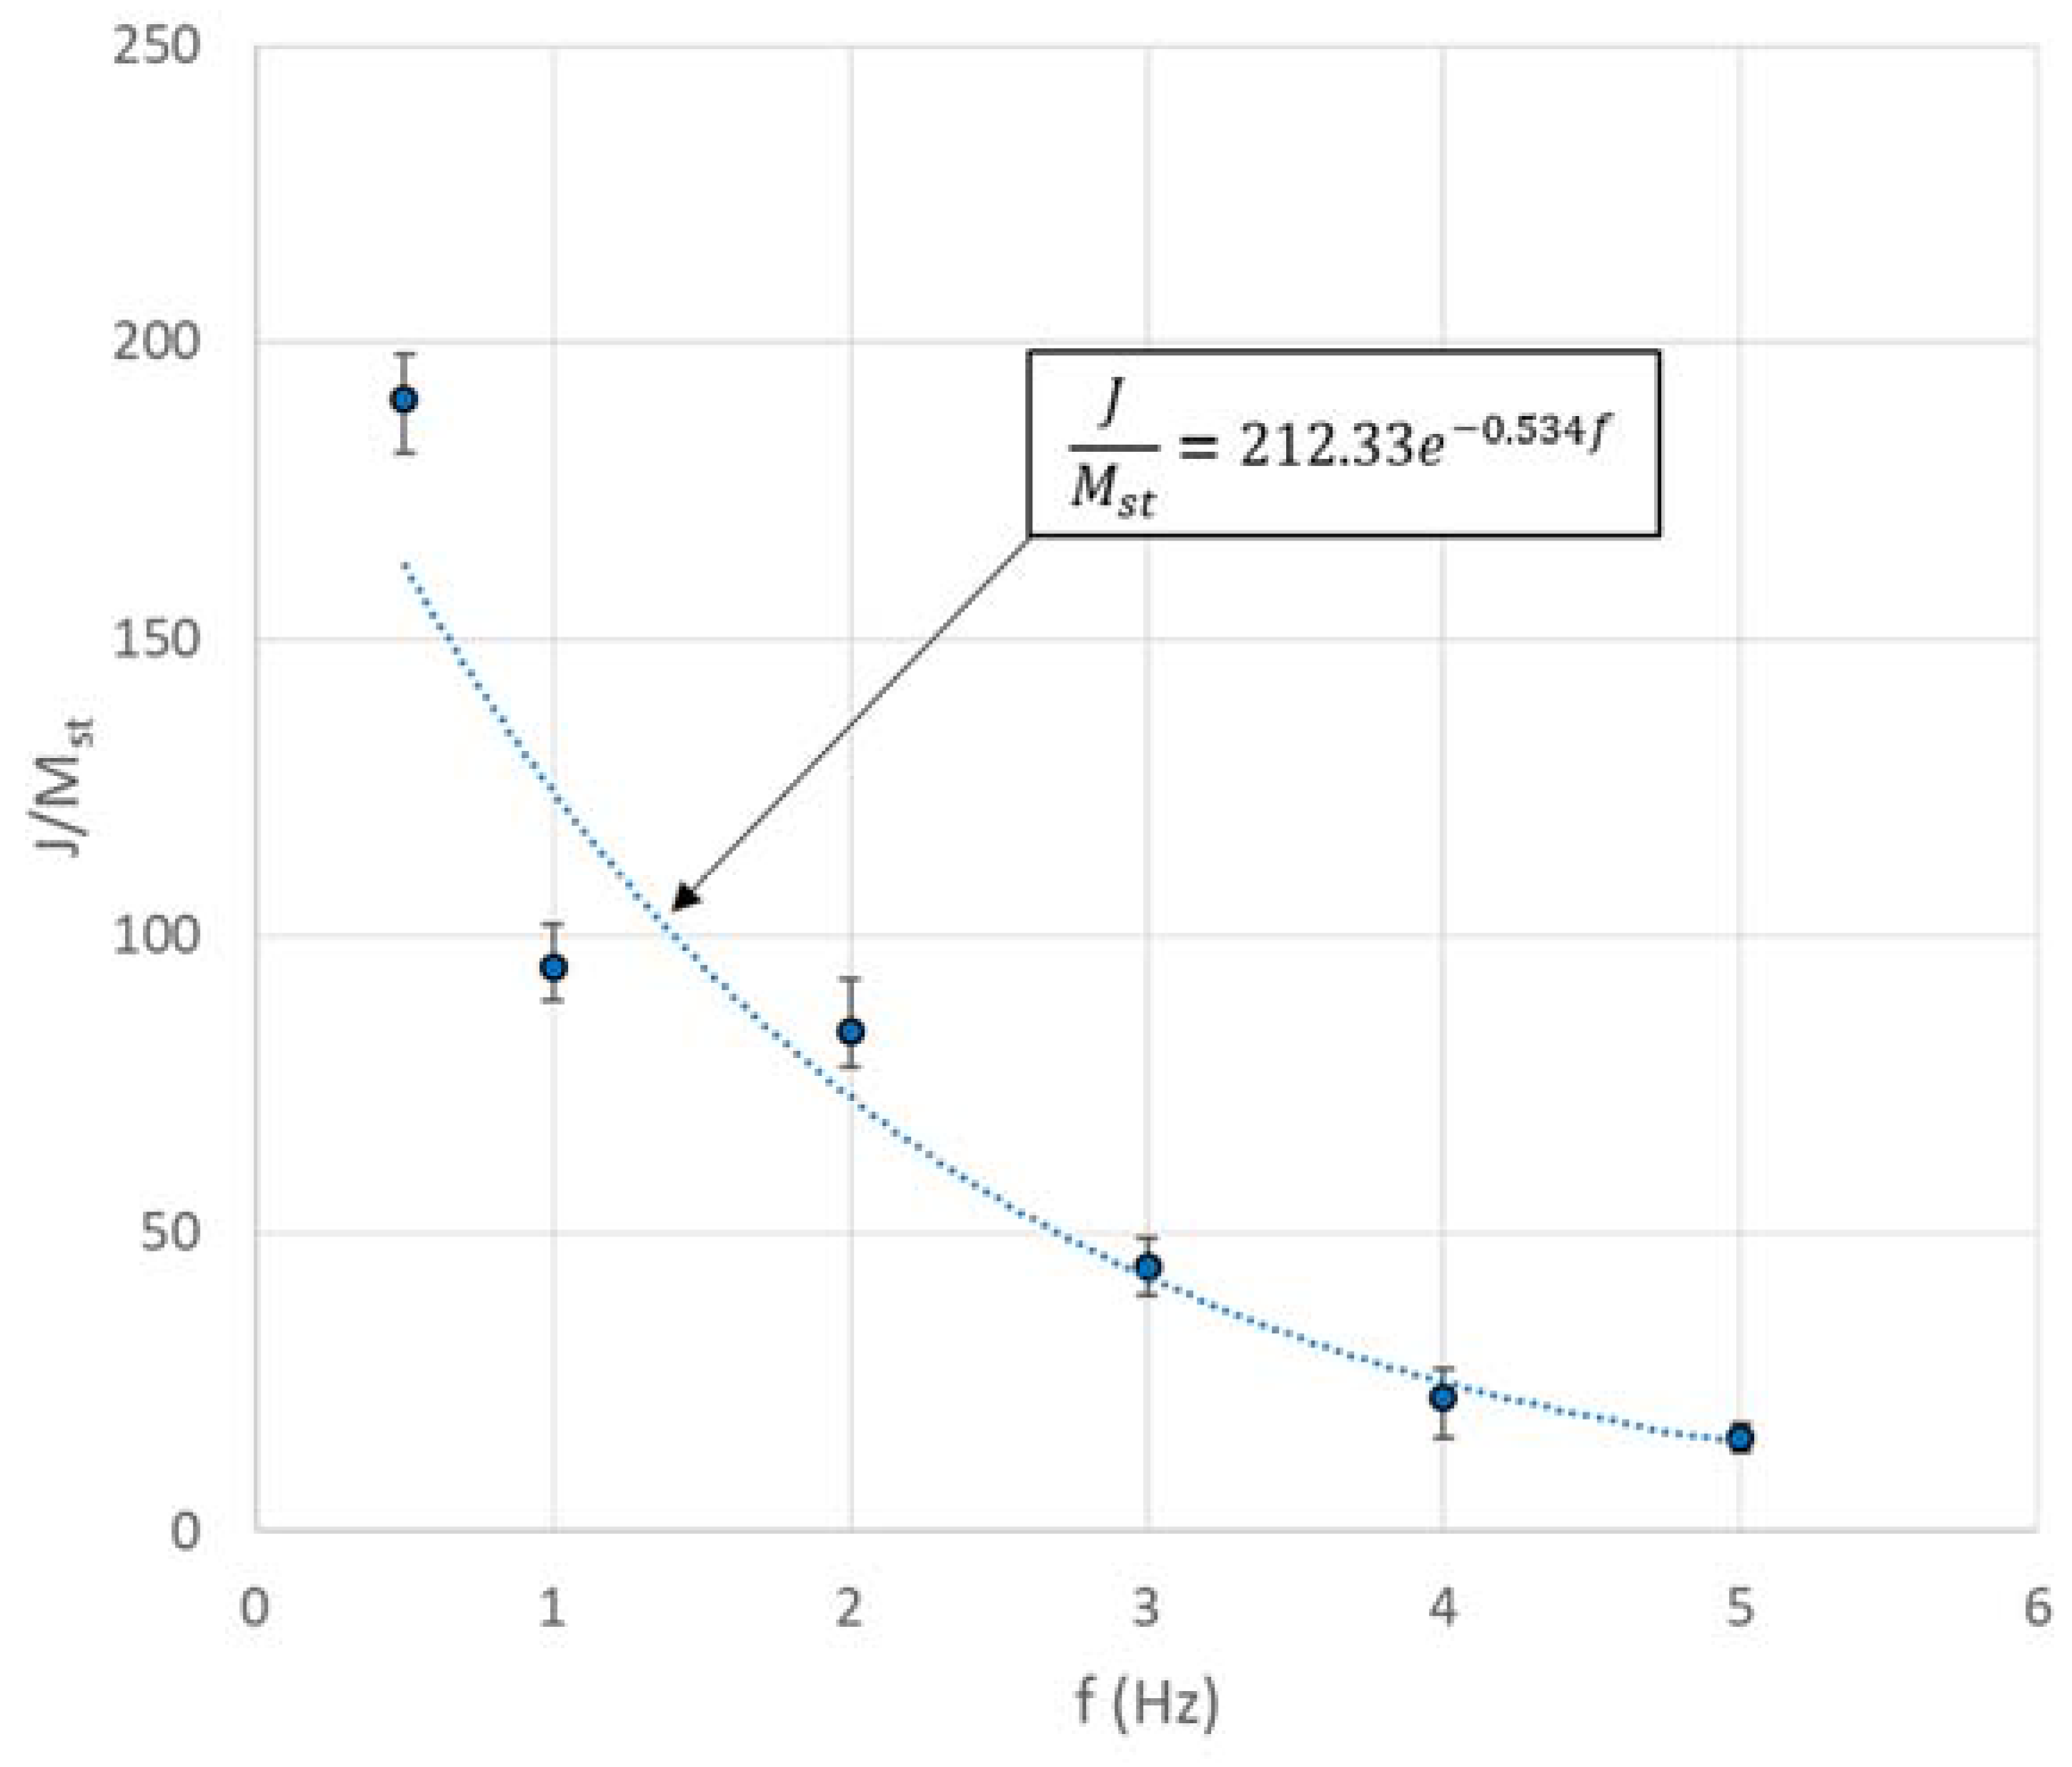
Figure 13.
Experimental (a) force and (b) acceleration histories at 3 Hz under acceleration control.
Figure 13.
Experimental (a) force and (b) acceleration histories at 3 Hz under acceleration control.
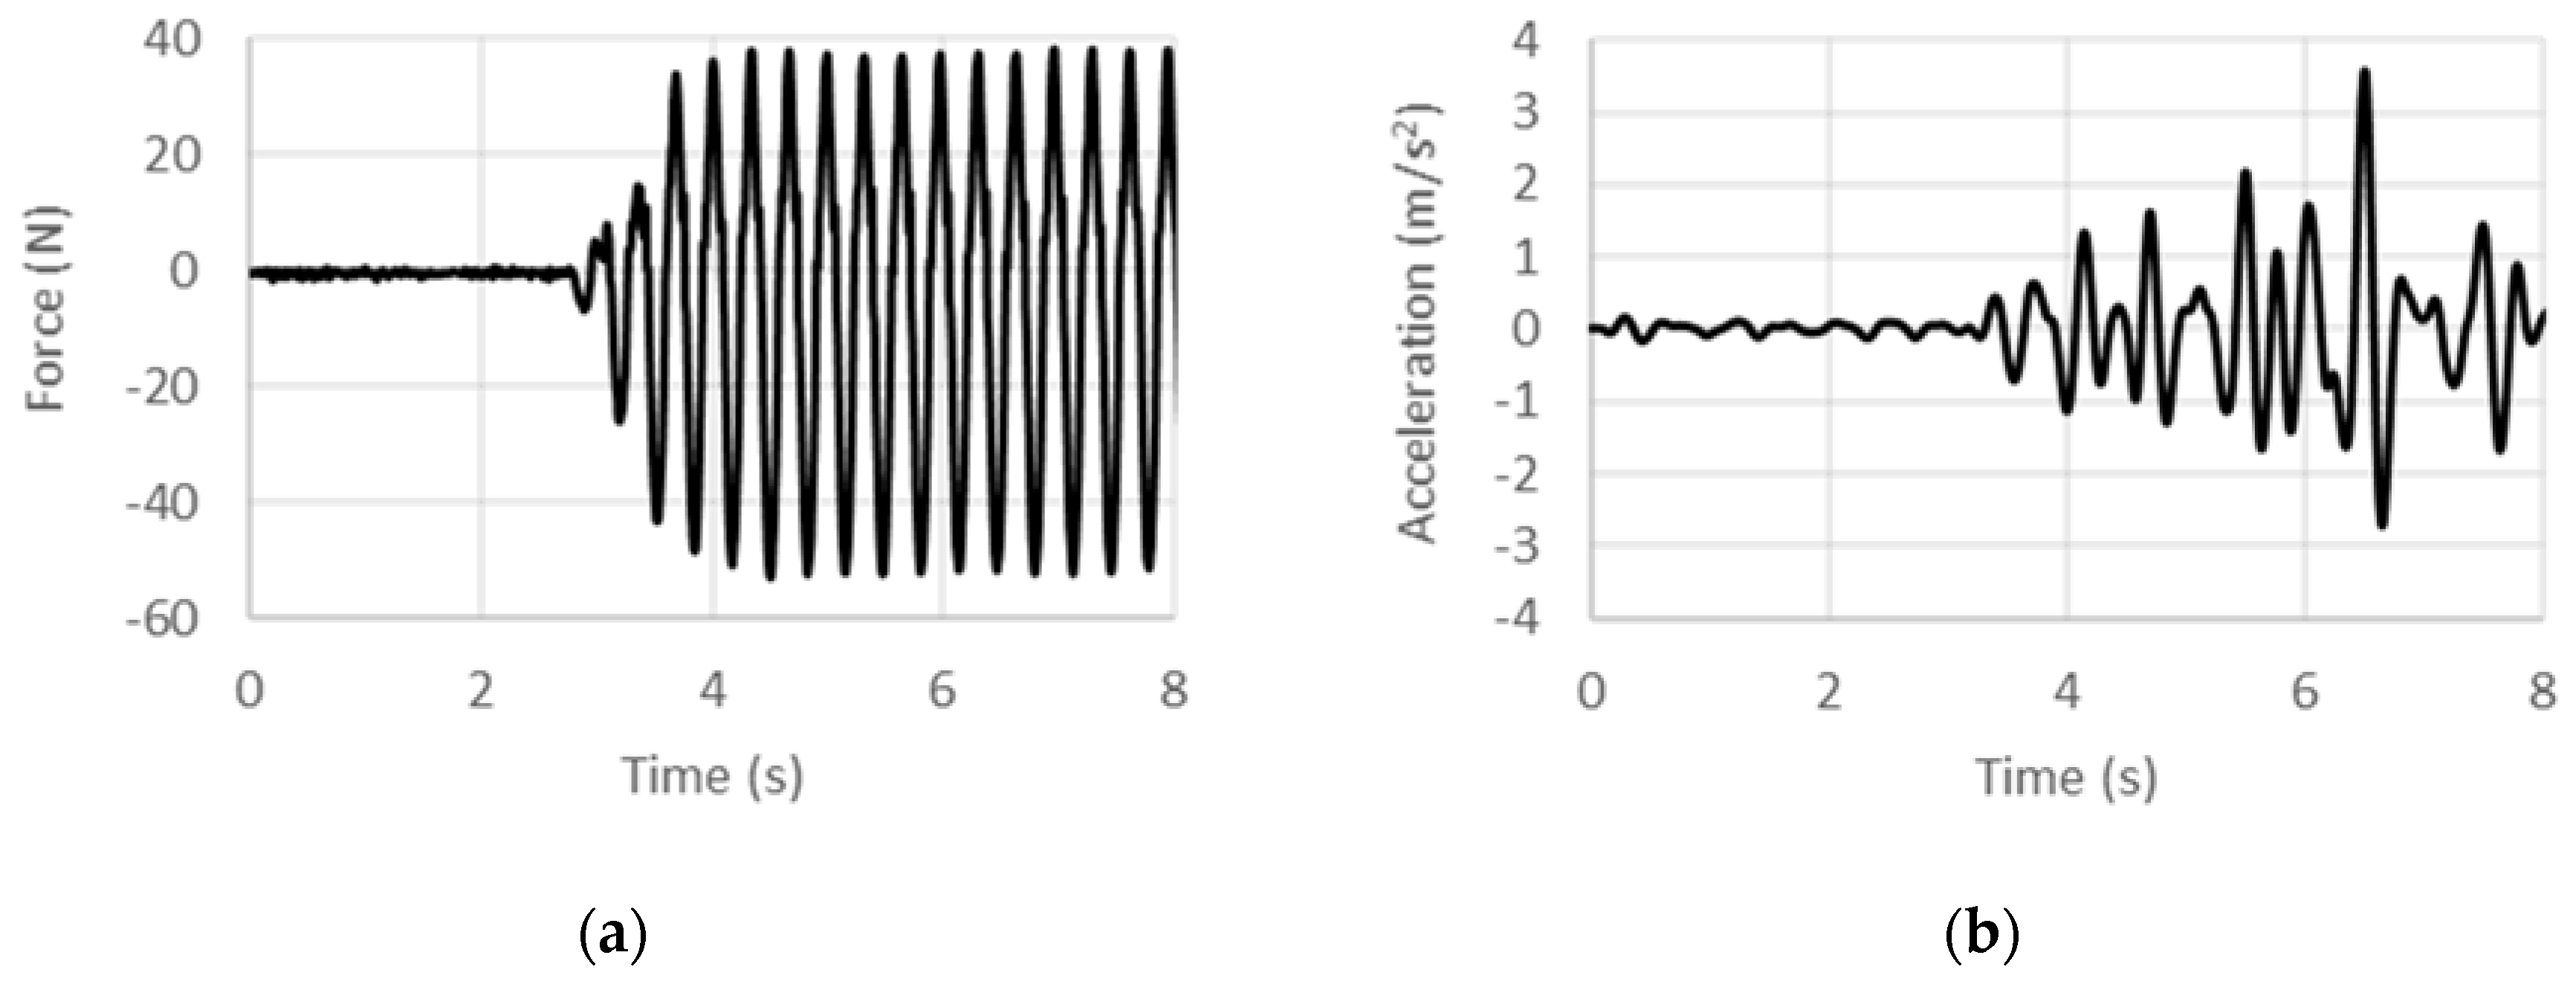
Figure 14.
Experimental (a) force and (b) acceleration histories at 4 Hz under acceleration control.
Figure 14.
Experimental (a) force and (b) acceleration histories at 4 Hz under acceleration control.

Figure 15.
Experimental (a) force and (b) acceleration histories at 5 Hz under acceleration control.
Figure 15.
Experimental (a) force and (b) acceleration histories at 5 Hz under acceleration control.
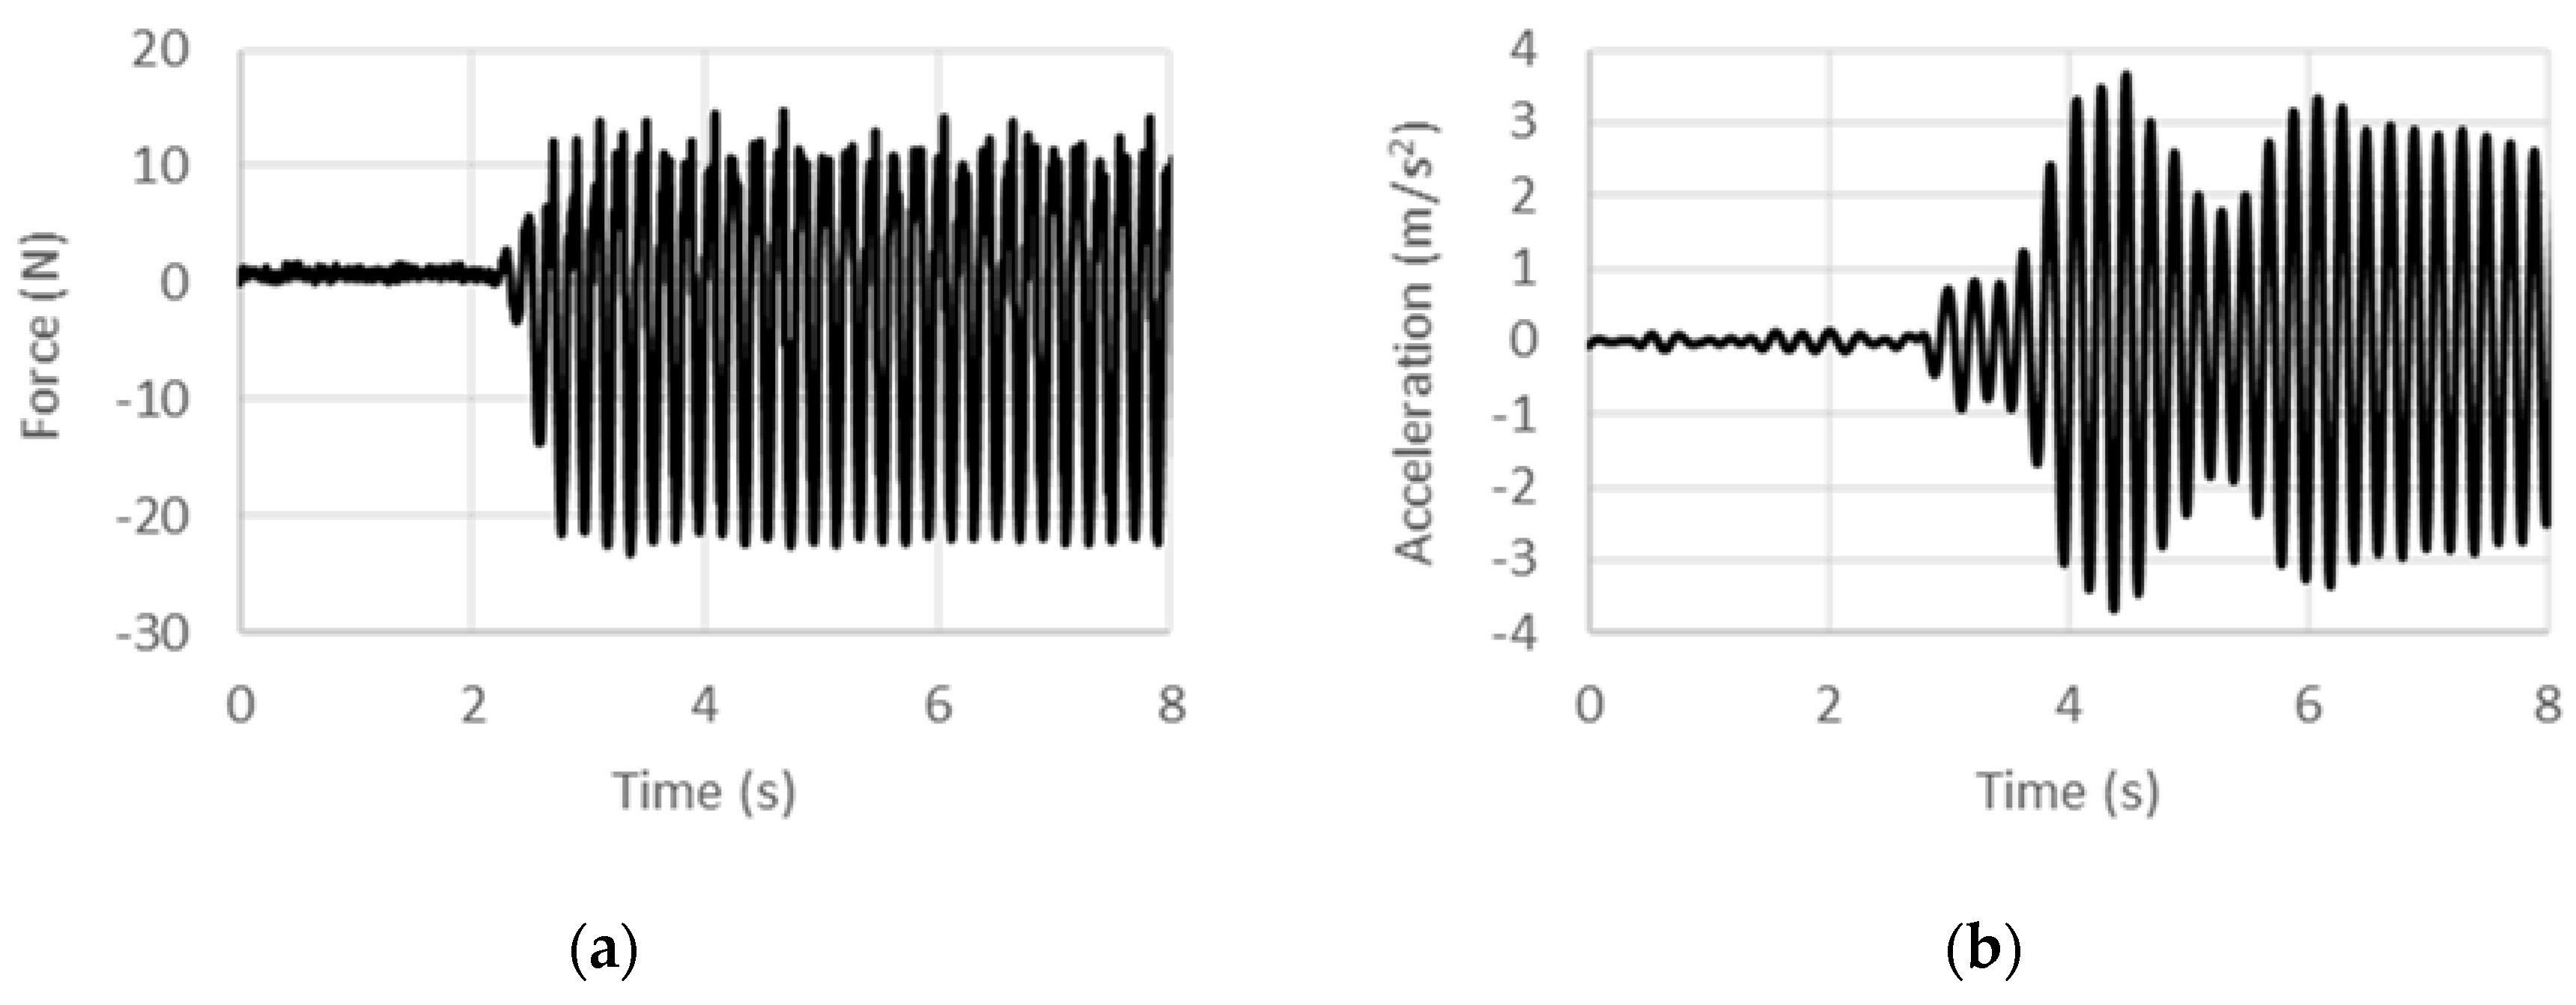
Figure 16.
Variation of J/Mst with excitation frequency from acceleration controlled tests.

Figure 17.
Line diagram of rack and pinion inerter with lumped elements representing the internal stiffness and damping.
Figure 17.
Line diagram of rack and pinion inerter with lumped elements representing the internal stiffness and damping.
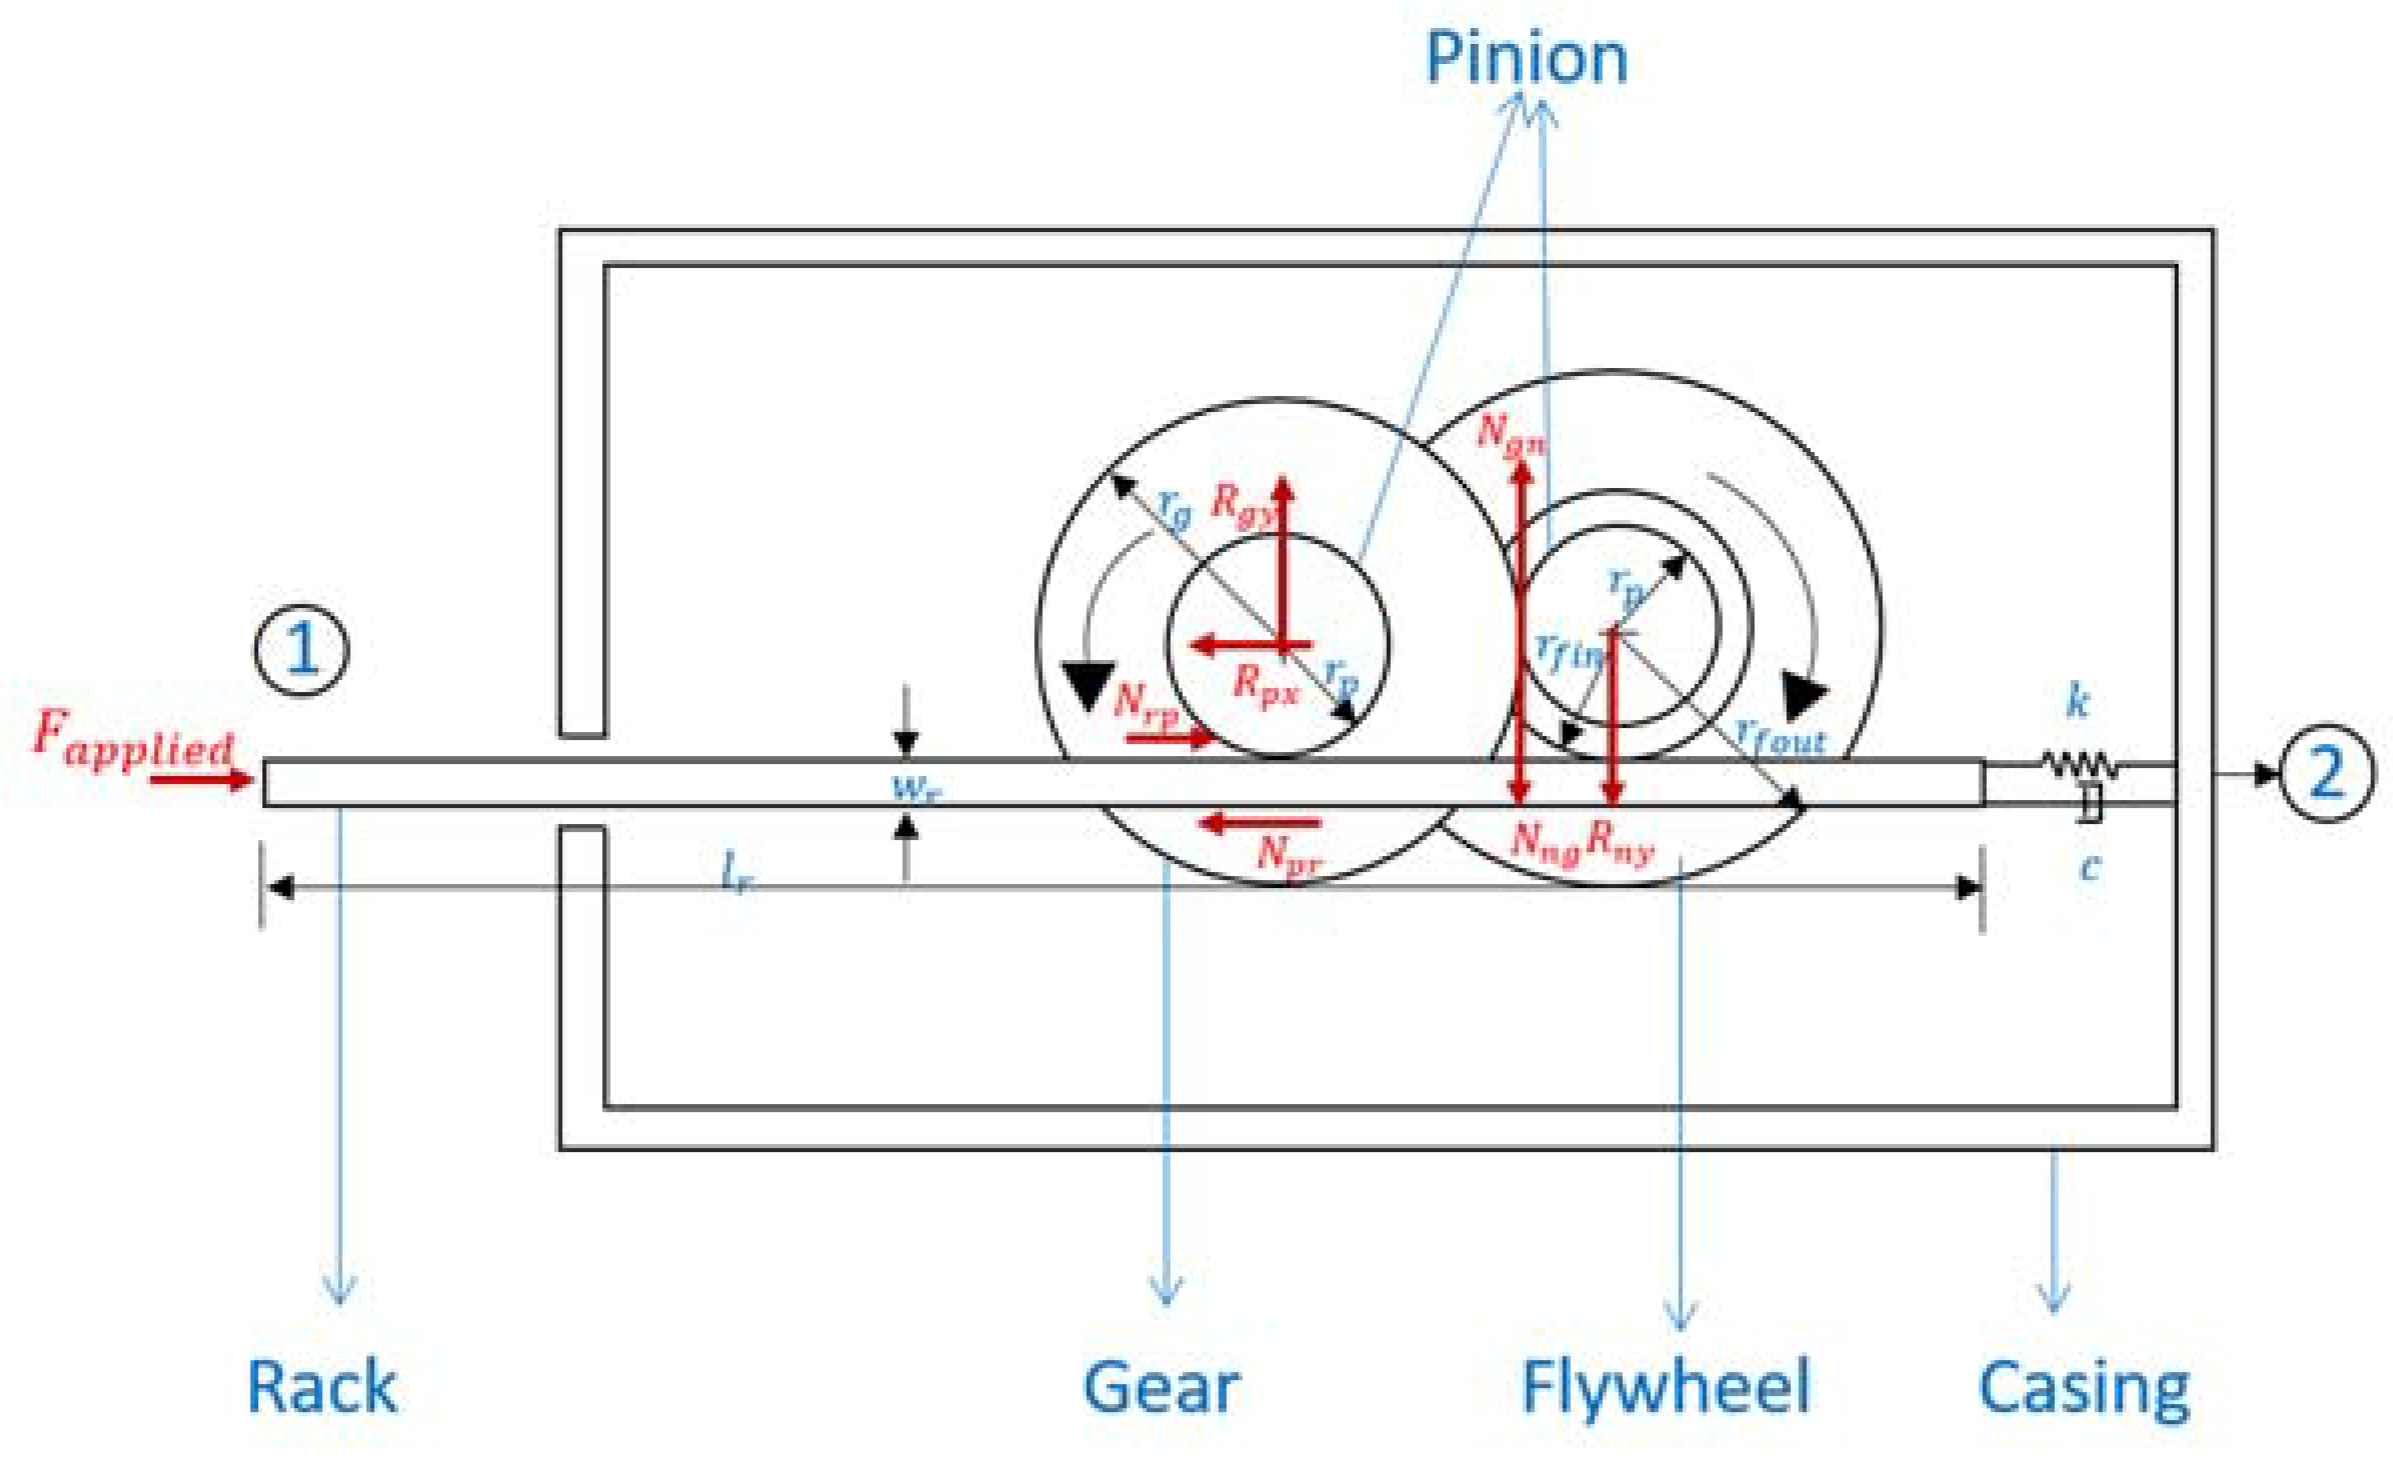
Figure 18.
Estimated internal (a) stiffness and (b) damping versus excitation frequency.

Figure 19.
Comparison of experimental and simulated specific inertance for (a) Displacement-Controlled Sinusoidal Excitation (DCSE) and (b) Acceleration-Controlled Sinusoidal Excitation (ACSE).
Figure 19.
Comparison of experimental and simulated specific inertance for (a) Displacement-Controlled Sinusoidal Excitation (DCSE) and (b) Acceleration-Controlled Sinusoidal Excitation (ACSE).
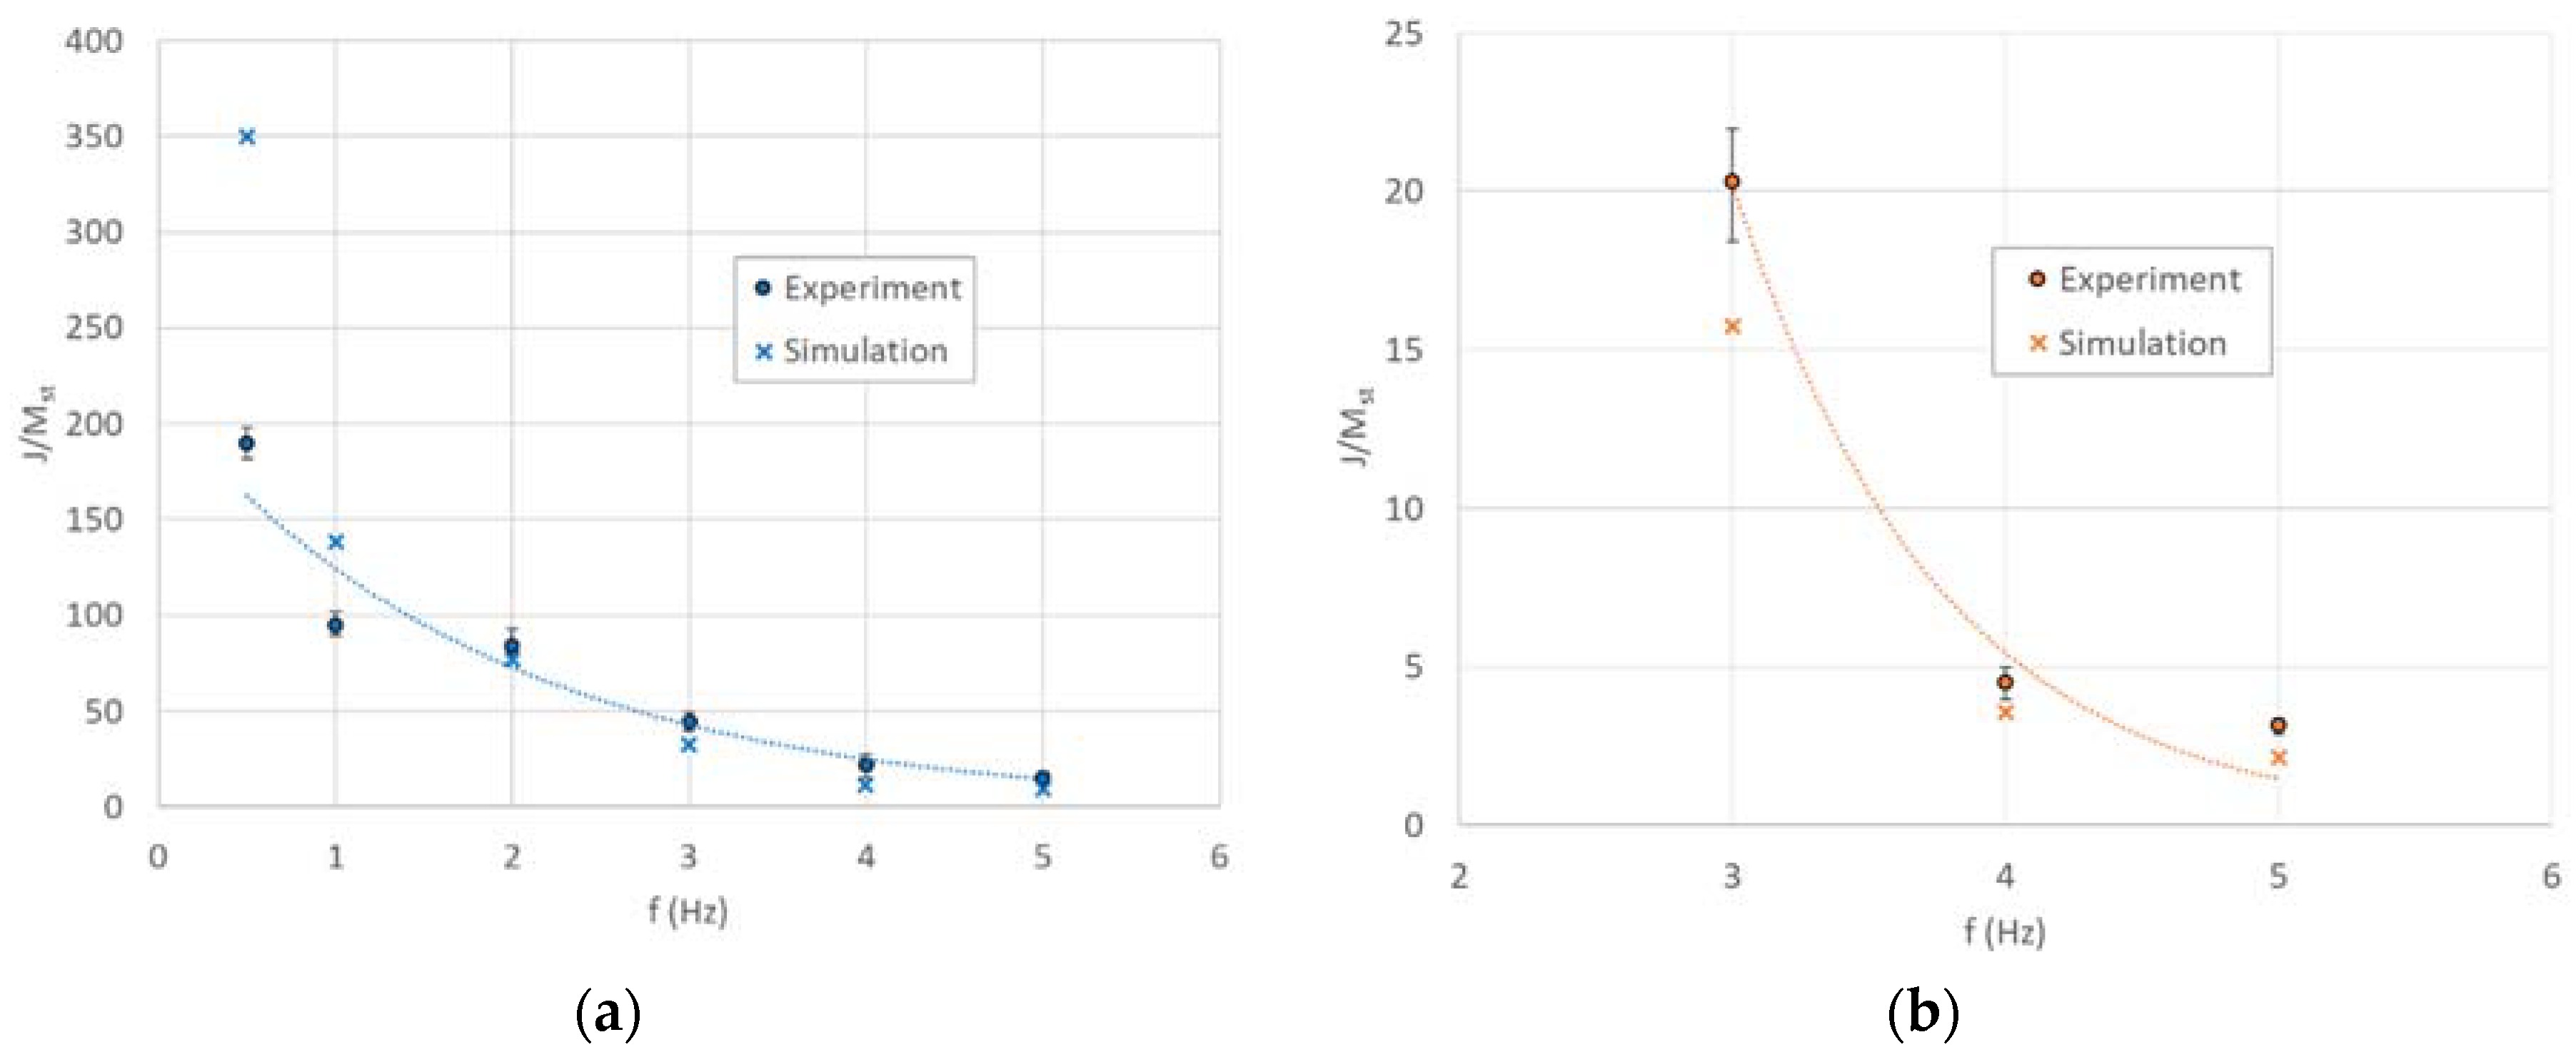
Figure 20.
Phase angle spectra for (a) 0.5 Hz, (b) 1 Hz, (c) 2 Hz, (d) 3 Hz, (e) 4 Hz, and (f) 5 Hz for displacement control.
Figure 20.
Phase angle spectra for (a) 0.5 Hz, (b) 1 Hz, (c) 2 Hz, (d) 3 Hz, (e) 4 Hz, and (f) 5 Hz for displacement control.
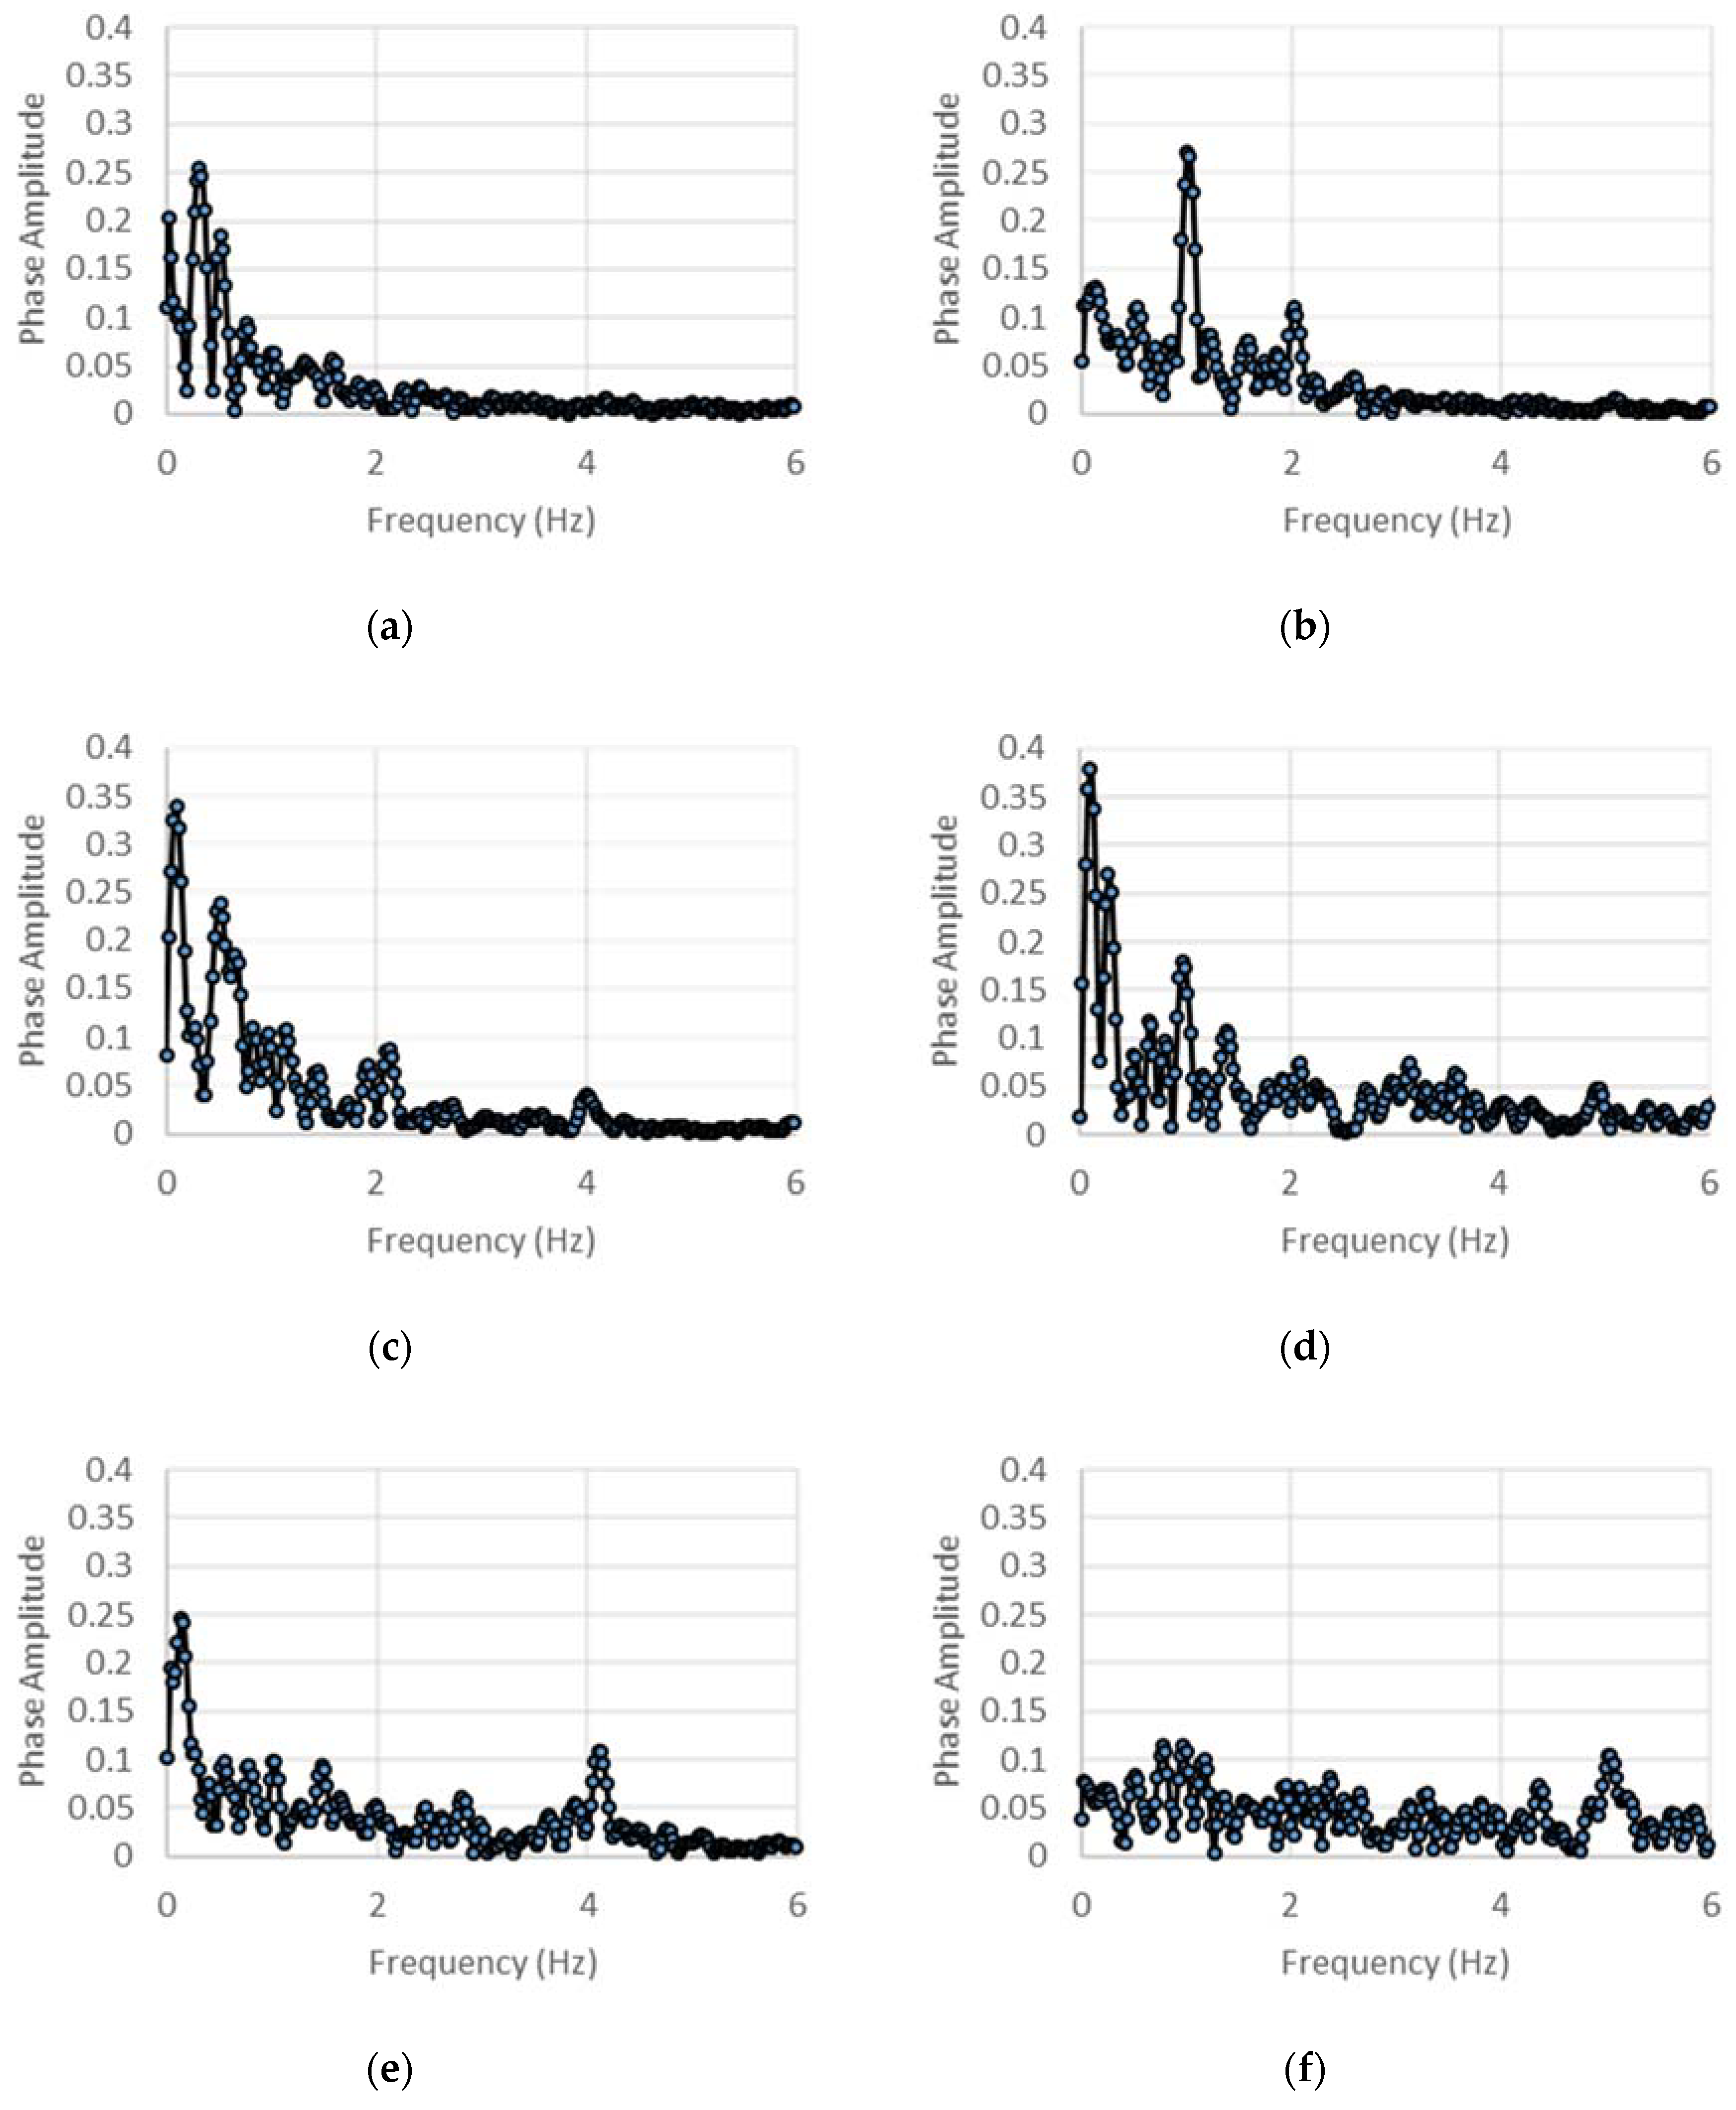
Figure 21.
Phase angle spectra for (a) 3 Hz, (b) 4 Hz, and (c) 5 Hz for acceleration control.

Table 1.
Key components of the ball-screw inerter and their parametric values.
| Component | Parameter | Value |
|---|---|---|
| Nut | Density | 7890 kg/m3 |
| Thickness | 17 mm | |
| Outer radius | 5.5 mm | |
| Inner radius | 2 mm | |
| Flywheel | Density | 7890 kg/m3 |
| Thickness | 13 mm | |
| Outer radius | 30 mm | |
| Inner radius | 20 mm | |
| Ball-Screw | Density | 7890 kg/m3 |
| Length | 250 mm | |
| Radius | 2 mm | |
| Lead | 5 mm | |
| Casing | Mass | 0.2 kg |
| Bearing | Mass | 0.174 kg |
Table 2.
Key components of the rack-and-pinion inerter and values.
| Component | Parameter | Value |
|---|---|---|
| Gear | Density | 7890 kg/m3 |
| Thickness | 13 mm | |
| Outer radius | 47.6 mm | |
| Inner radius | 6.4 mm | |
| Pitch | 16 mm | |
| Flywheel | Density | 7890 kg/m3 |
| Thickness | 25.4 mm | |
| Outer radius | 50.8 mm | |
| Inner radius | 25.4 mm | |
| Pinion | Density | 7890 kg/m3 |
| Thickness | 13 mm | |
| Outer radius | 9.5 mm | |
| Inner radius | 6.4 mm | |
| Pitch | 16 mm | |
| Rack | Density | 7890 kg/m3 |
| Length | 500 mm | |
| Width | 12.7 mm | |
| Pitch | 16 mm | |
| Casing | Mass | 0.3 kg |
Table 3.
Key components of the rack-and-pinion inerter. COTS: commercial off the shelf.
| S. No | Component | Material | Density (kg/m3) | Key Parameter | Source |
|---|---|---|---|---|---|
| 1 | Rack | Steel | 7890 | lr (length) | COTS |
| 2 | Pinion(s) | Steel | 7890 | rp (radius) | COTS |
| 3 | Gear | Steel | 7890 | rg (radius) | COTS |
| 4 | Flywheel | Aluminum | 2800 | rf (radius) | COTS |
| 5 | Casing | PLA/Acrylic | 1250 | mc (mass) | 3D printed |
| 6 | Hub | PLA | 1250 | - | 3D printed |
© 2018 by the authors. Licensee MDPI, Basel, Switzerland. This article is an open access article distributed under the terms and conditions of the Creative Commons Attribution (CC BY) license (http://creativecommons.org/licenses/by/4.0/).
Share and Cite
MDPI and ACS Style
Madhamshetty, K.; Manimala, J.M. Low-Rate Characterization of a Mechanical Inerter. Machines 2018, 6, 32. https://doi.org/10.3390/machines6030032
AMA Style
Madhamshetty K, Manimala JM. Low-Rate Characterization of a Mechanical Inerter. Machines. 2018; 6(3):32. https://doi.org/10.3390/machines6030032
Chicago/Turabian StyleMadhamshetty, Karthik, and James M. Manimala. 2018. "Low-Rate Characterization of a Mechanical Inerter" Machines 6, no. 3: 32. https://doi.org/10.3390/machines6030032
Note that from the first issue of 2016, this journal uses article numbers instead of page numbers. See further details here.