
Framework for Holistic Online Optimization of Milling Machine Conditions to Enhance Machine Efficiency and Sustainability

 , ,
, ,
Abstract
:1. Introduction
2. State of the Art
2.1. Prediction of Surface Roughness during Milling
2.2. Prediction of Tool Wear during Milling
2.3. Prediction of Energy Consumption
2.4. Use of Fuzzy Logic for Optimization Problems
2.5. Milling Machine Used
3. Framework for Holistic Online Optimization
3.1. BaSyX Management Shell
3.2. ML Model
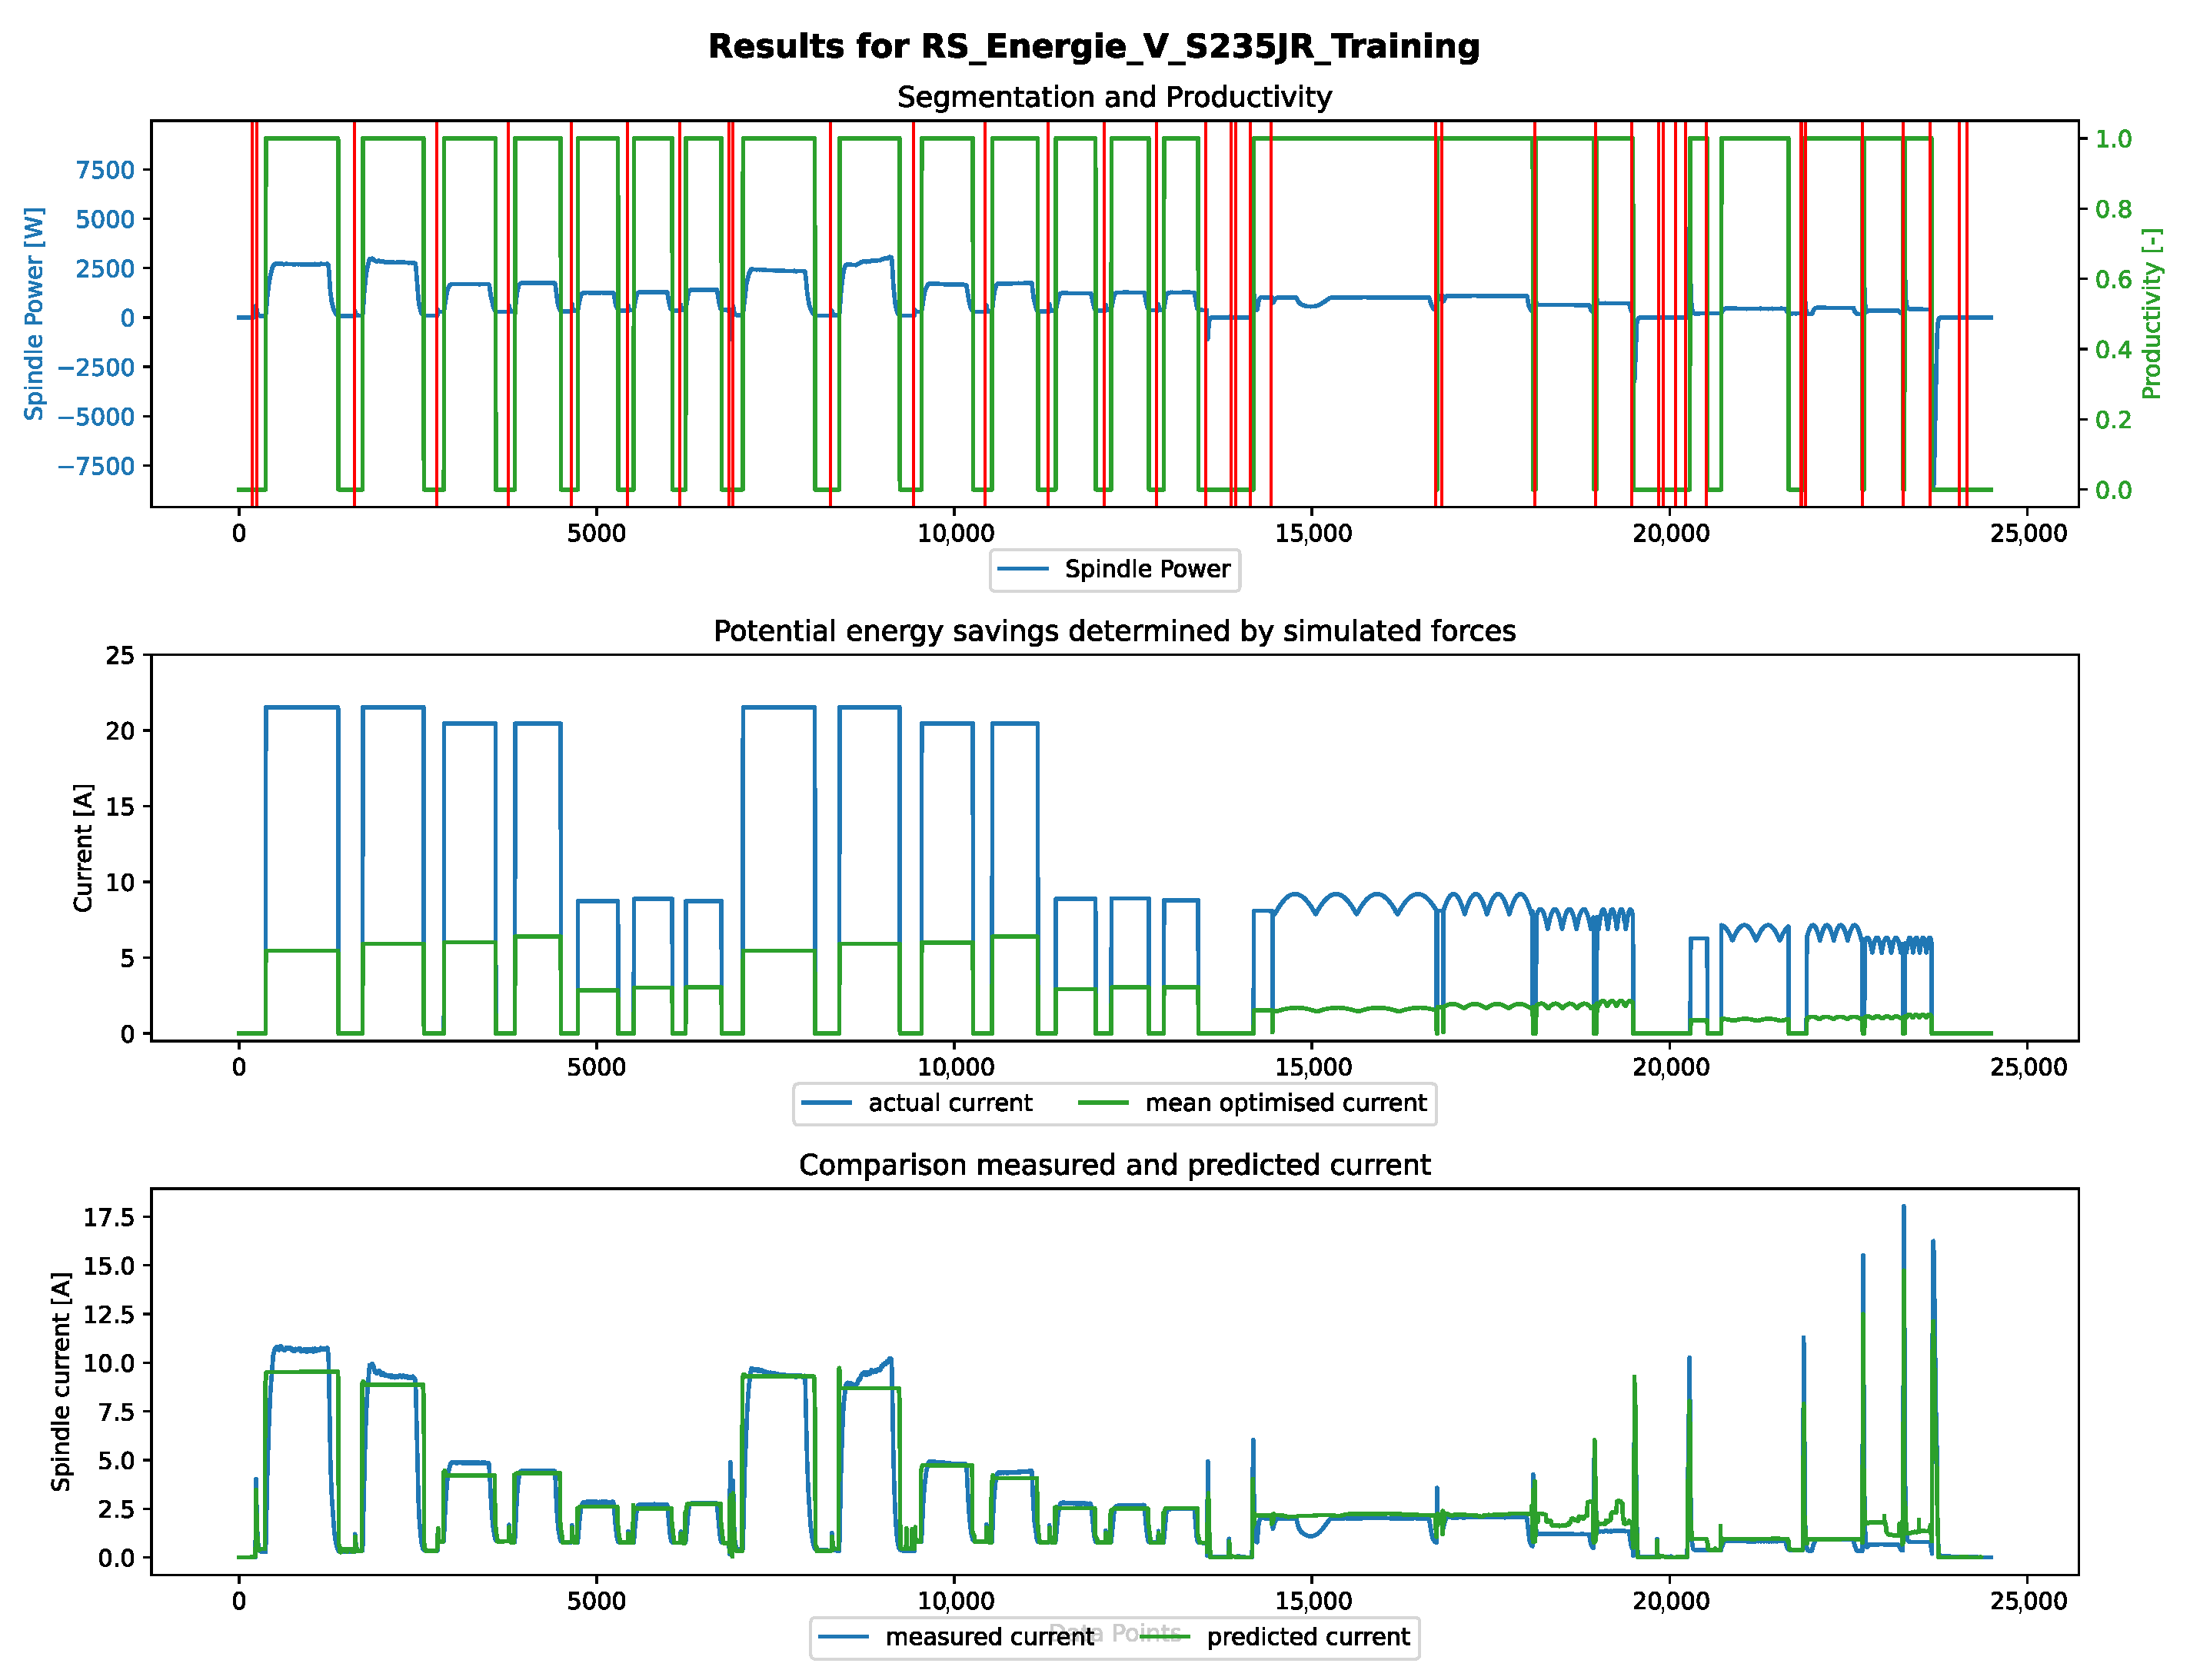
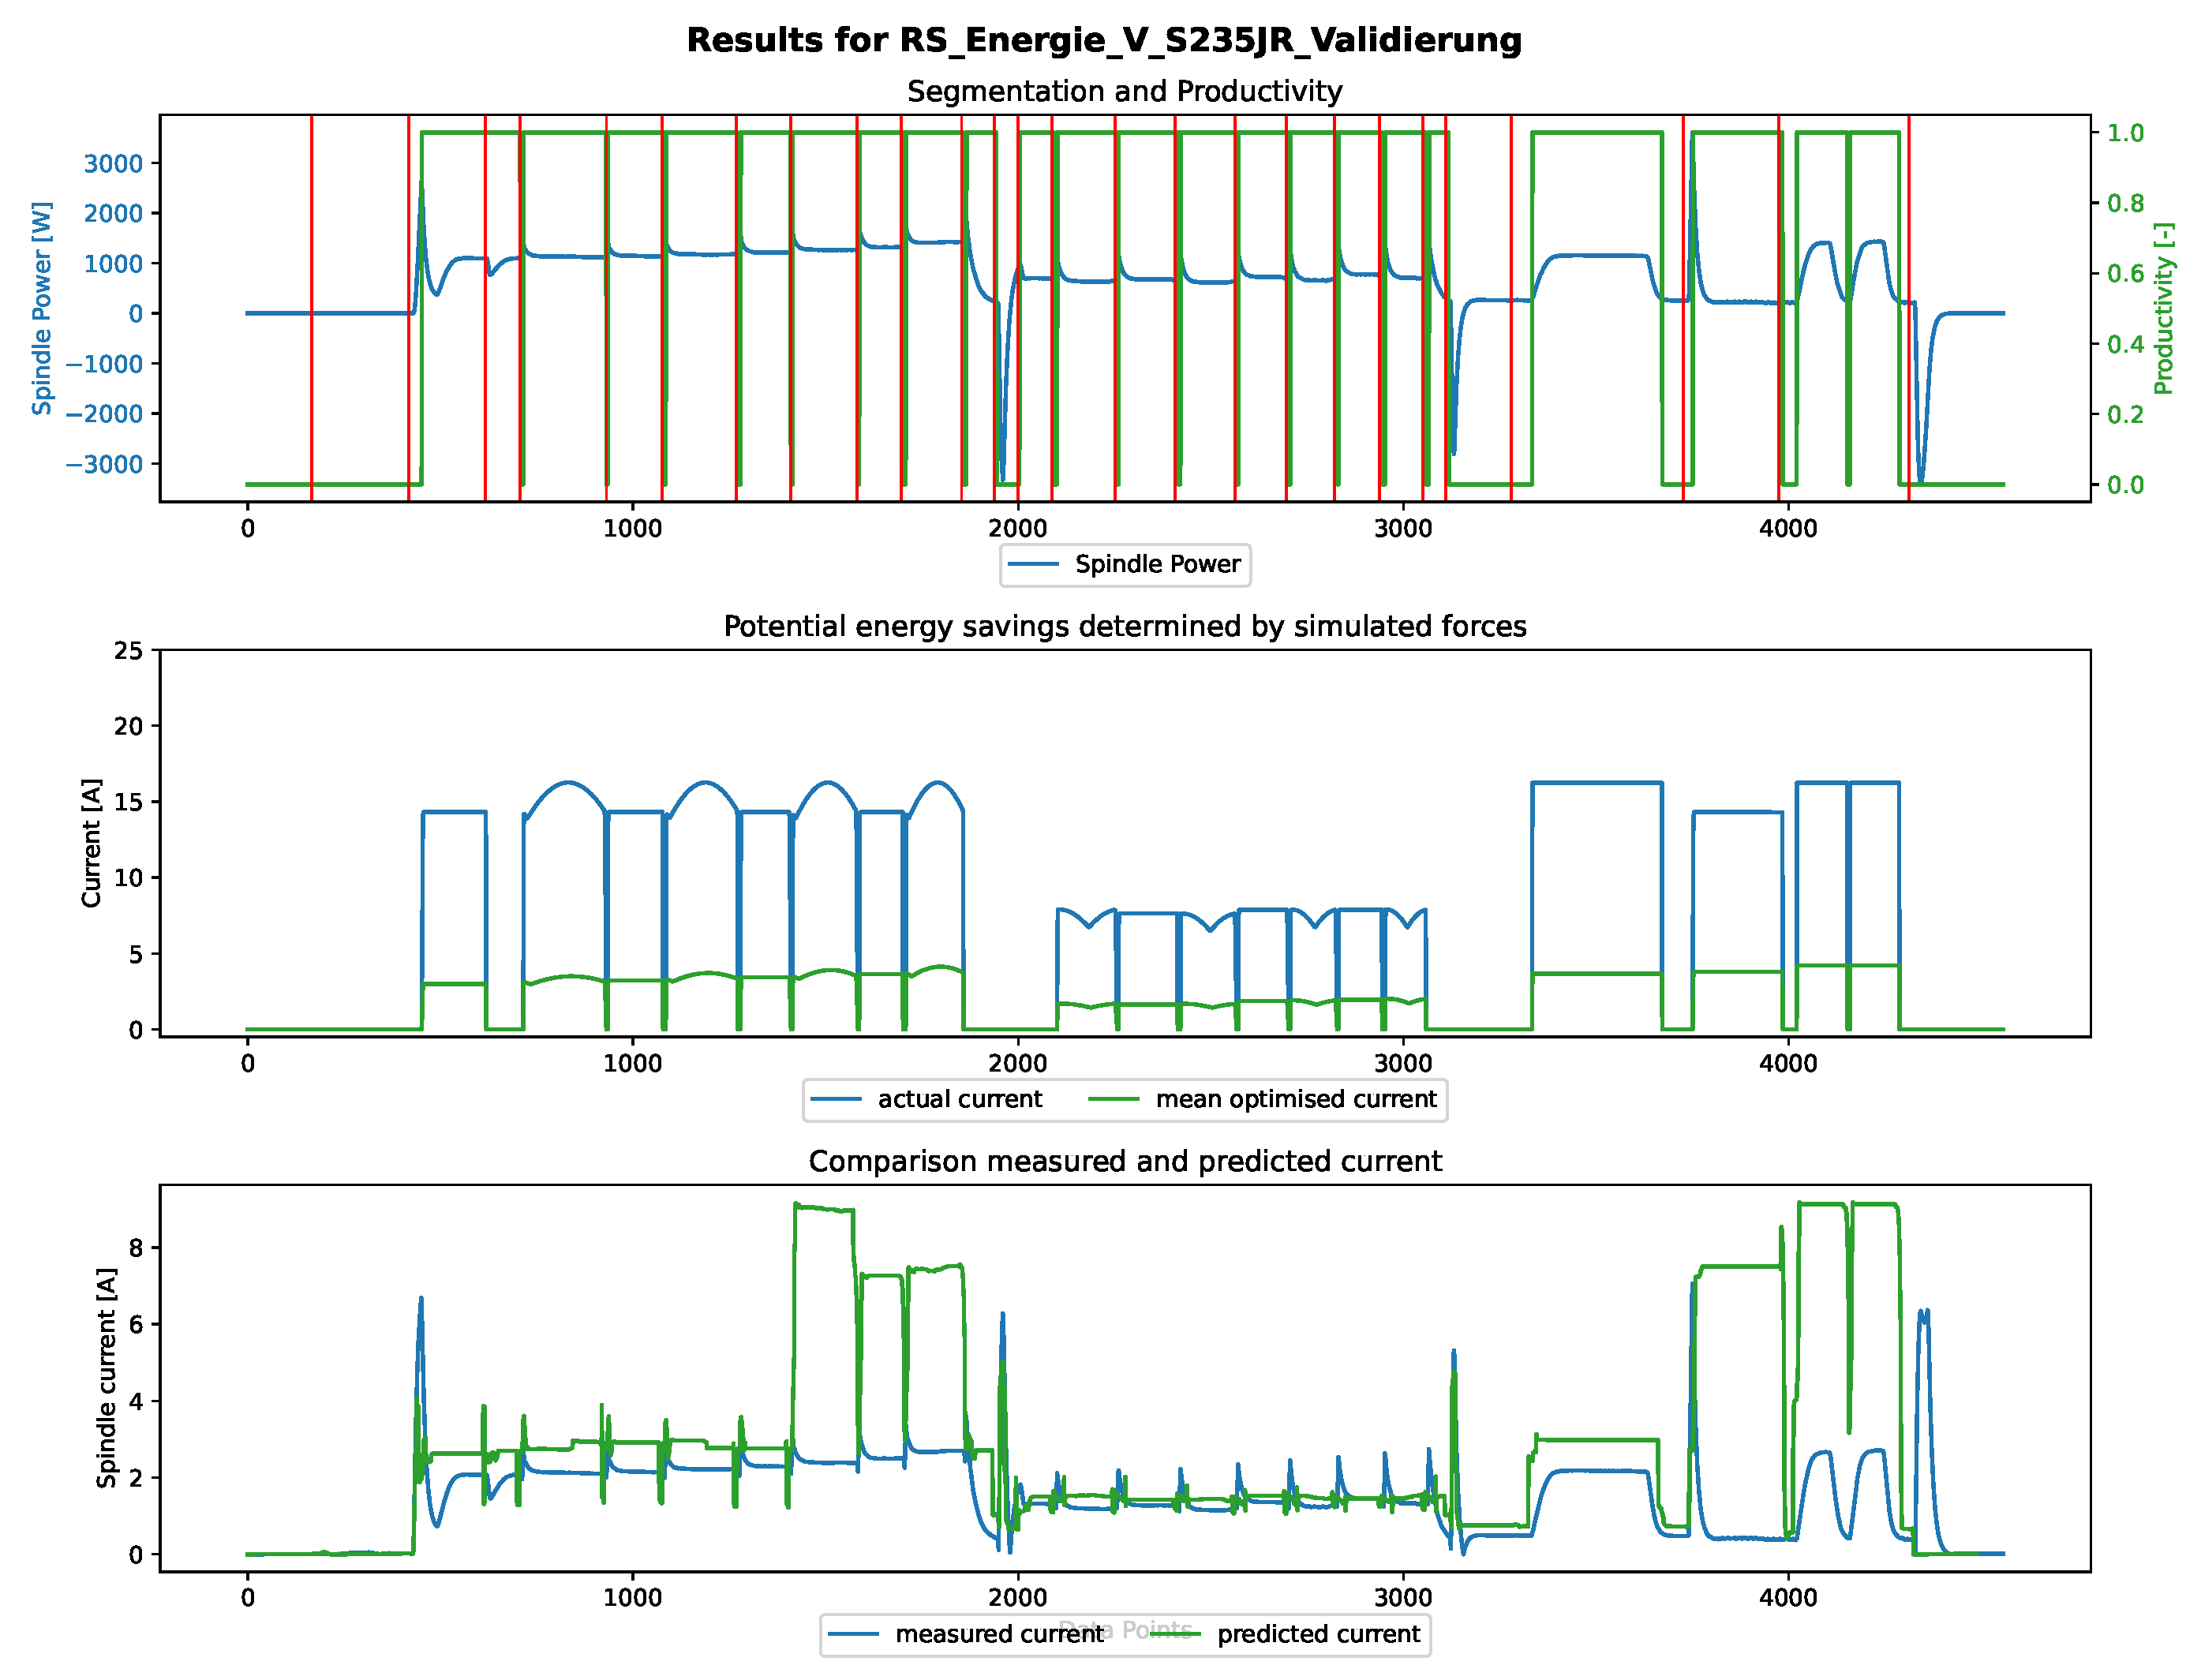
3.3. Segmentation
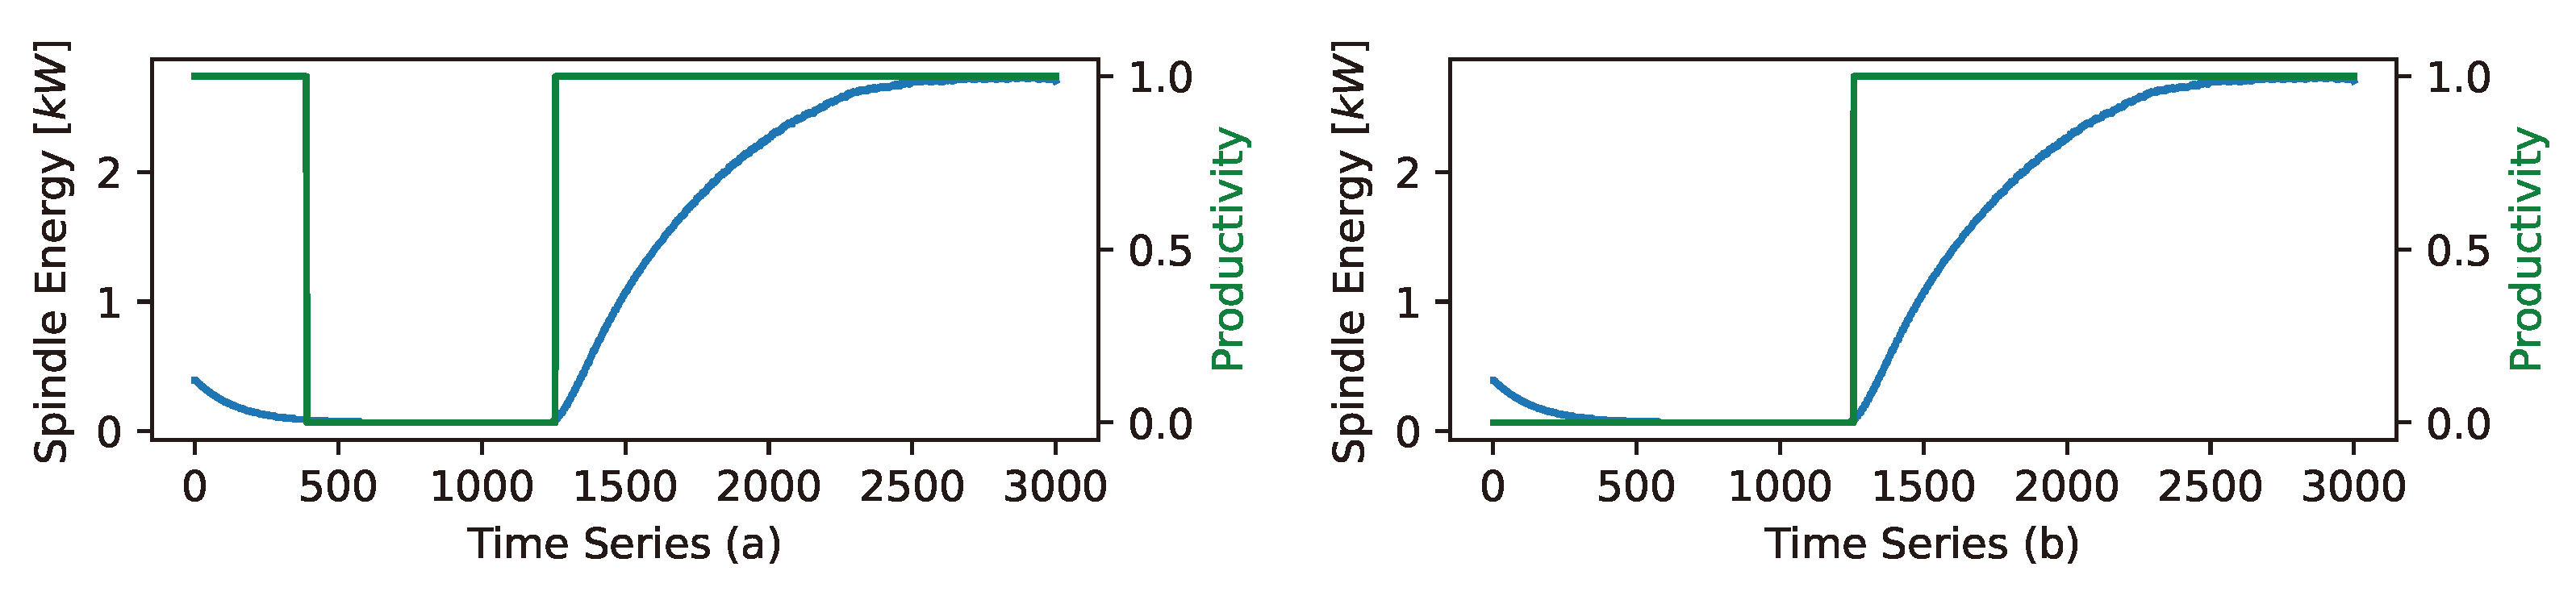
3.4. Productivity Determination
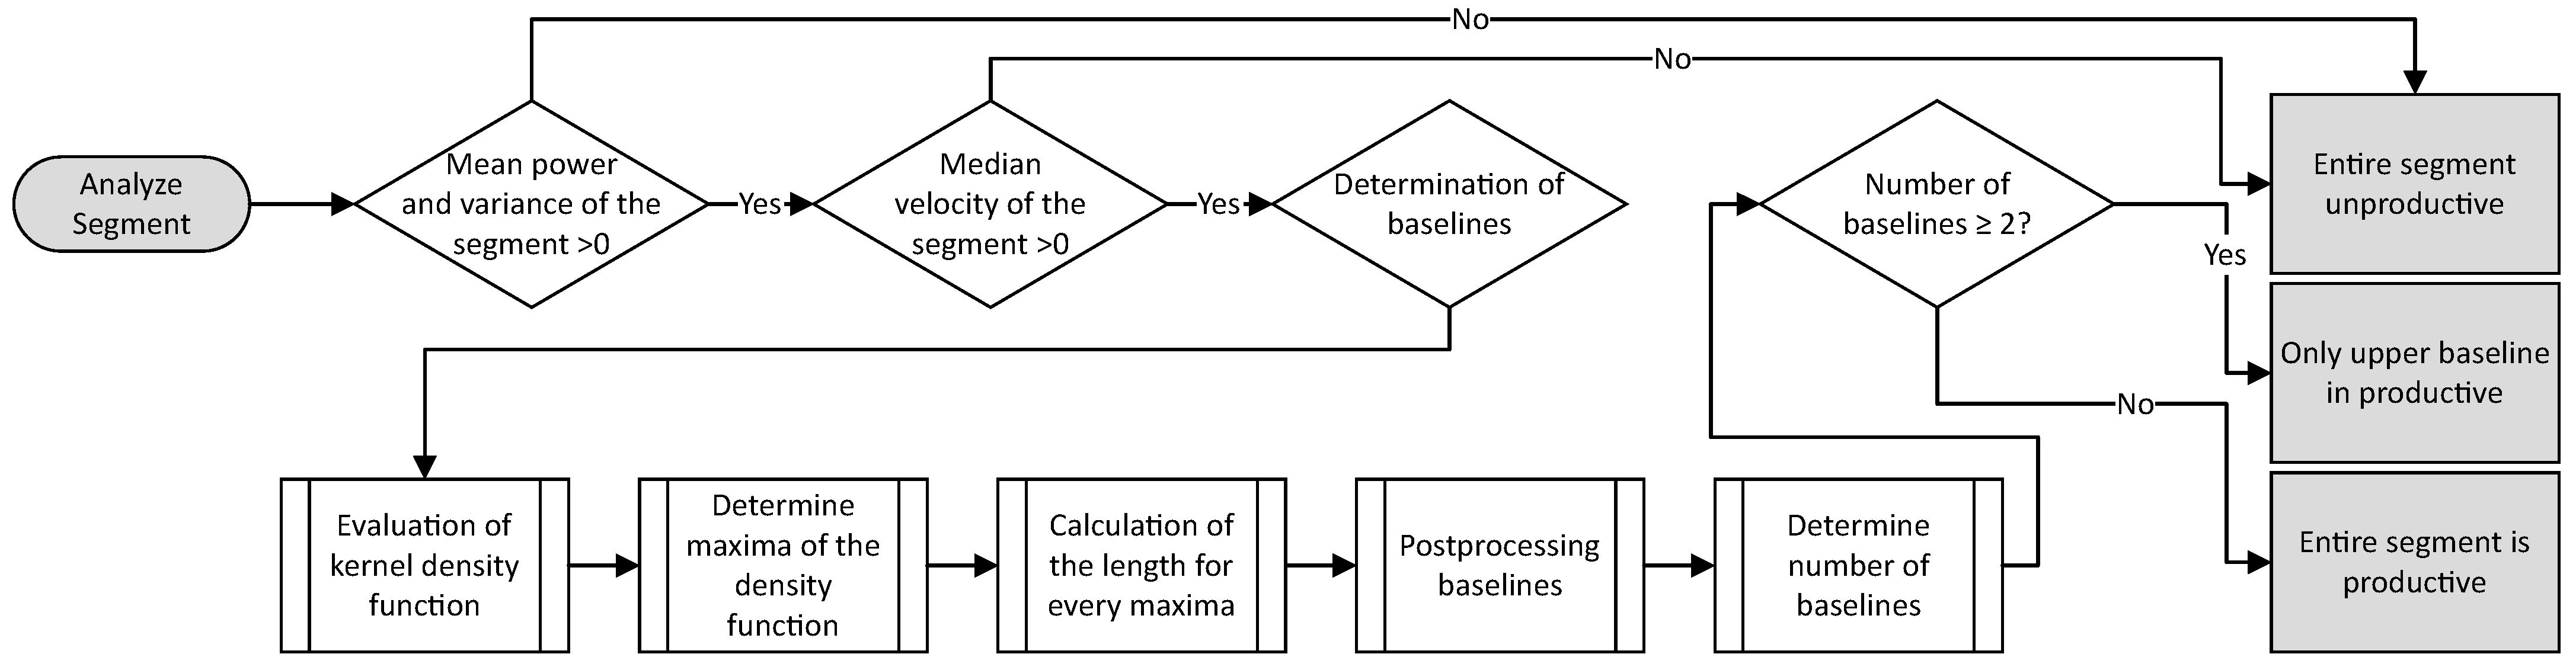
- The velocities of the X and Y axes are both zero over the entire segment.
- The spindle speed is zero.
- The spindle speed is increased or decreased.
- The spindle has reached setpoint speed but has not yet fully penetrated the material.
4. Implementation
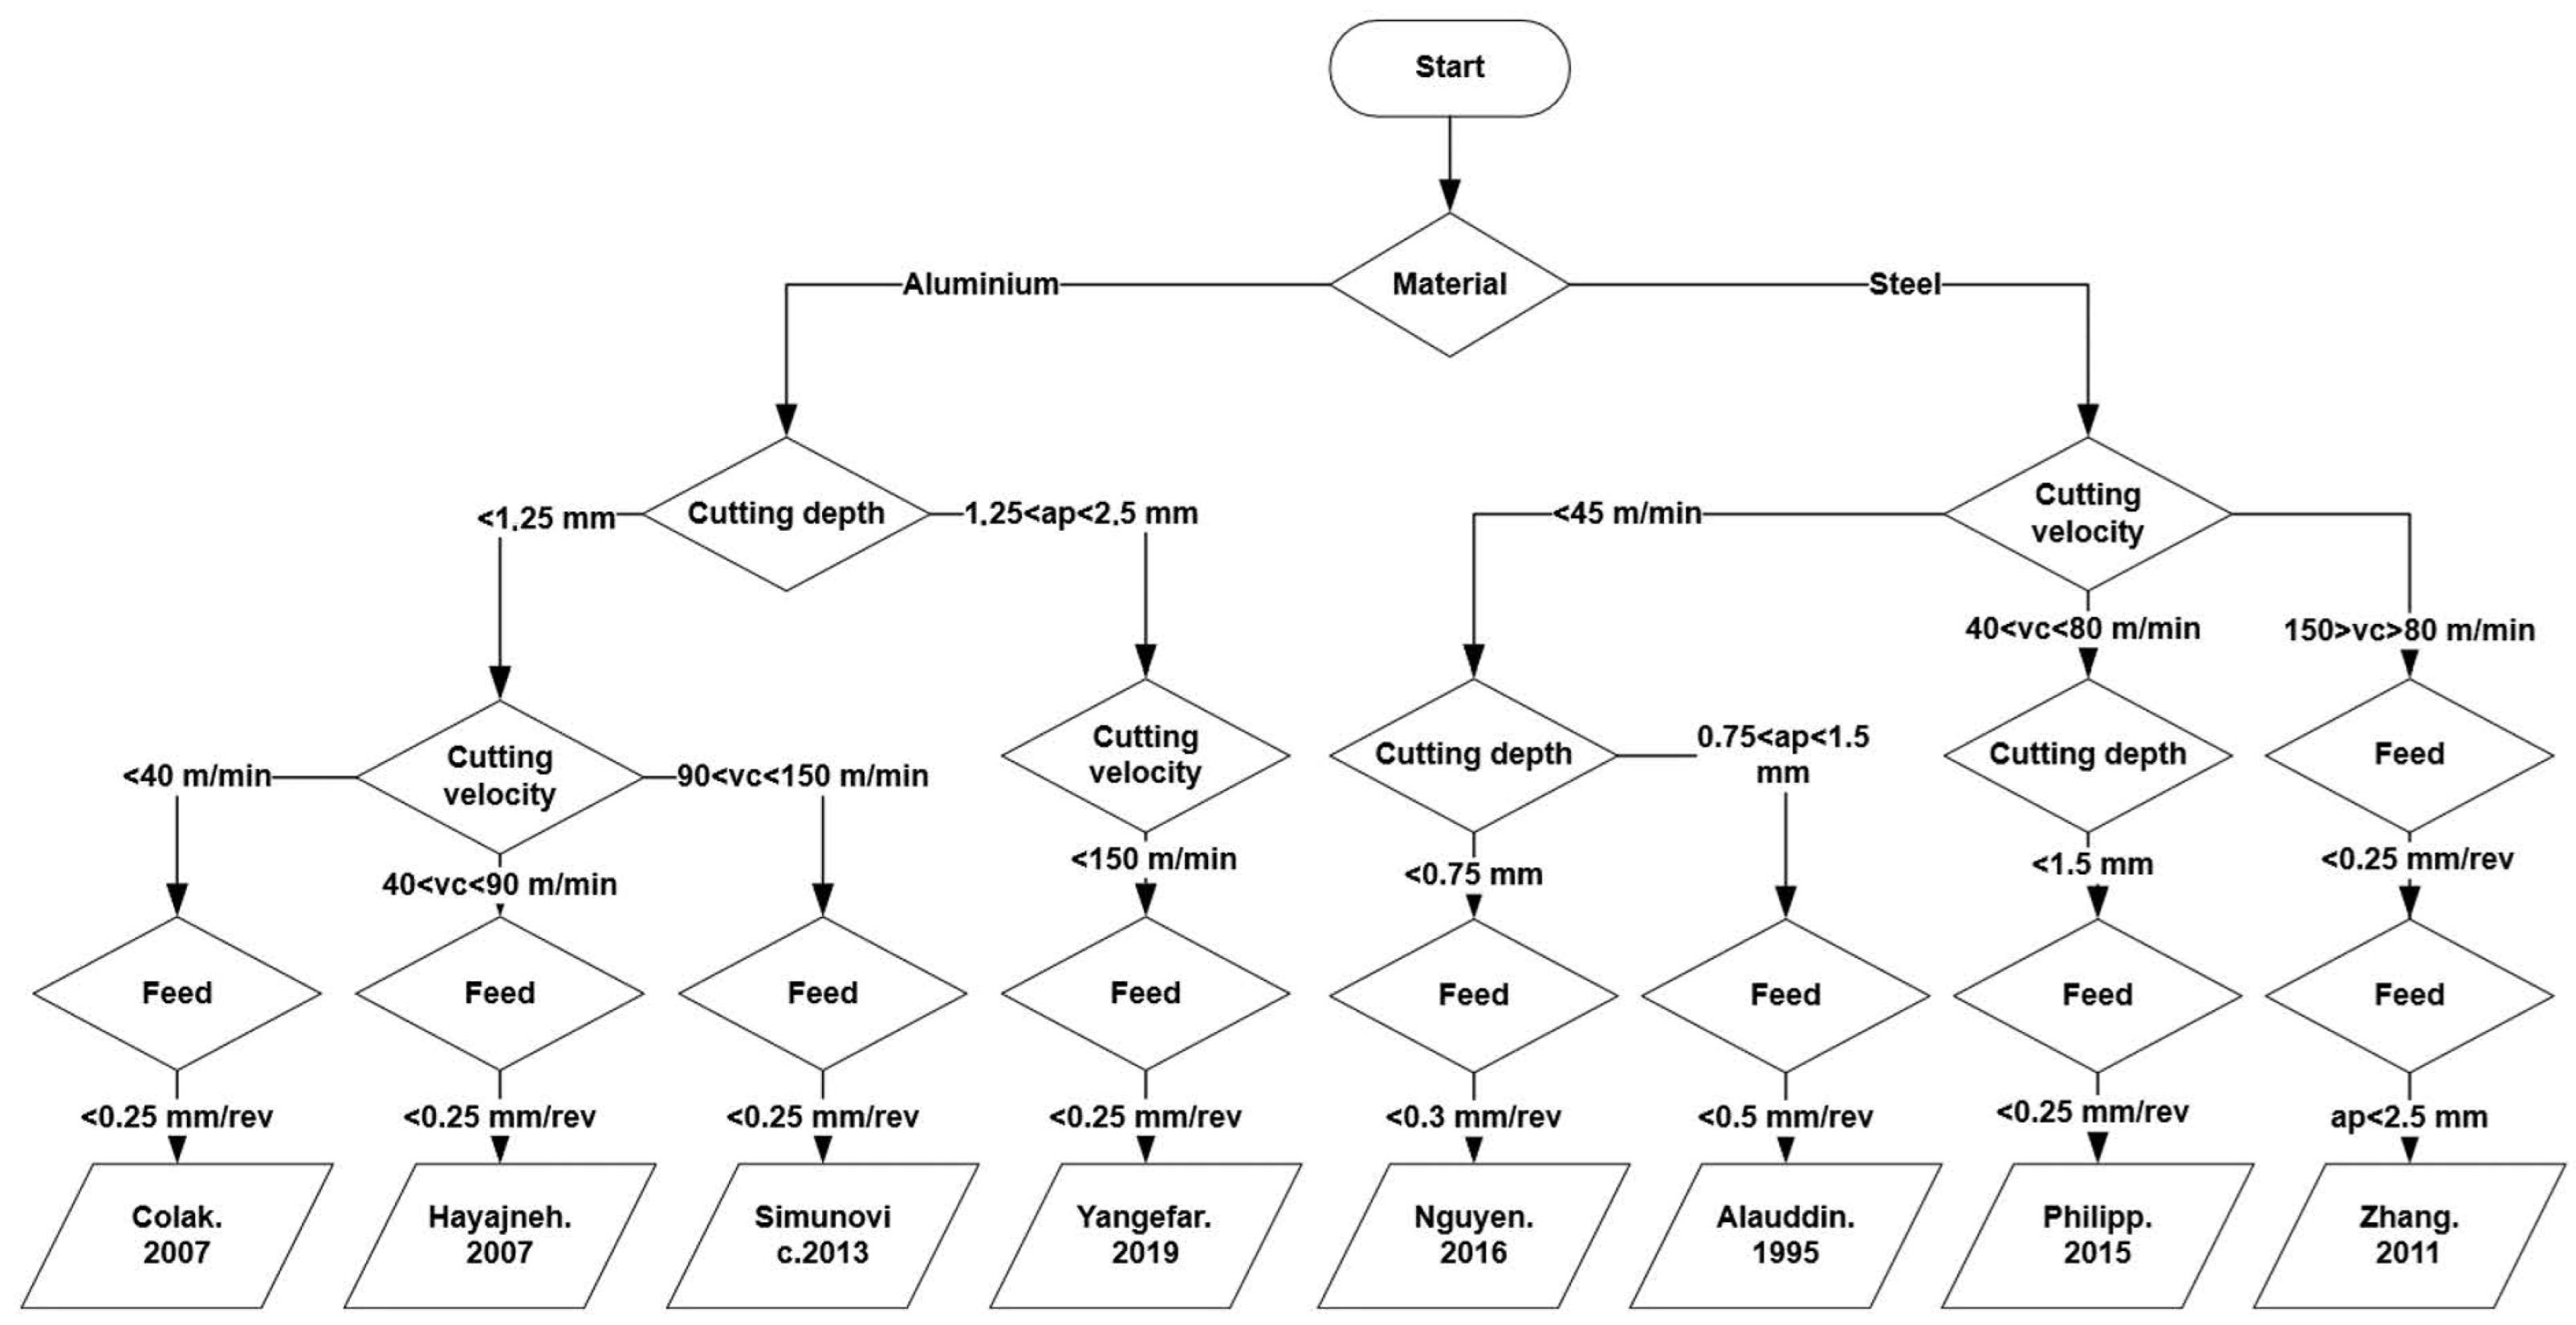
4.1. Determination of Milling Parameters
4.1.1. Retrieving Product Data from the Management Shell
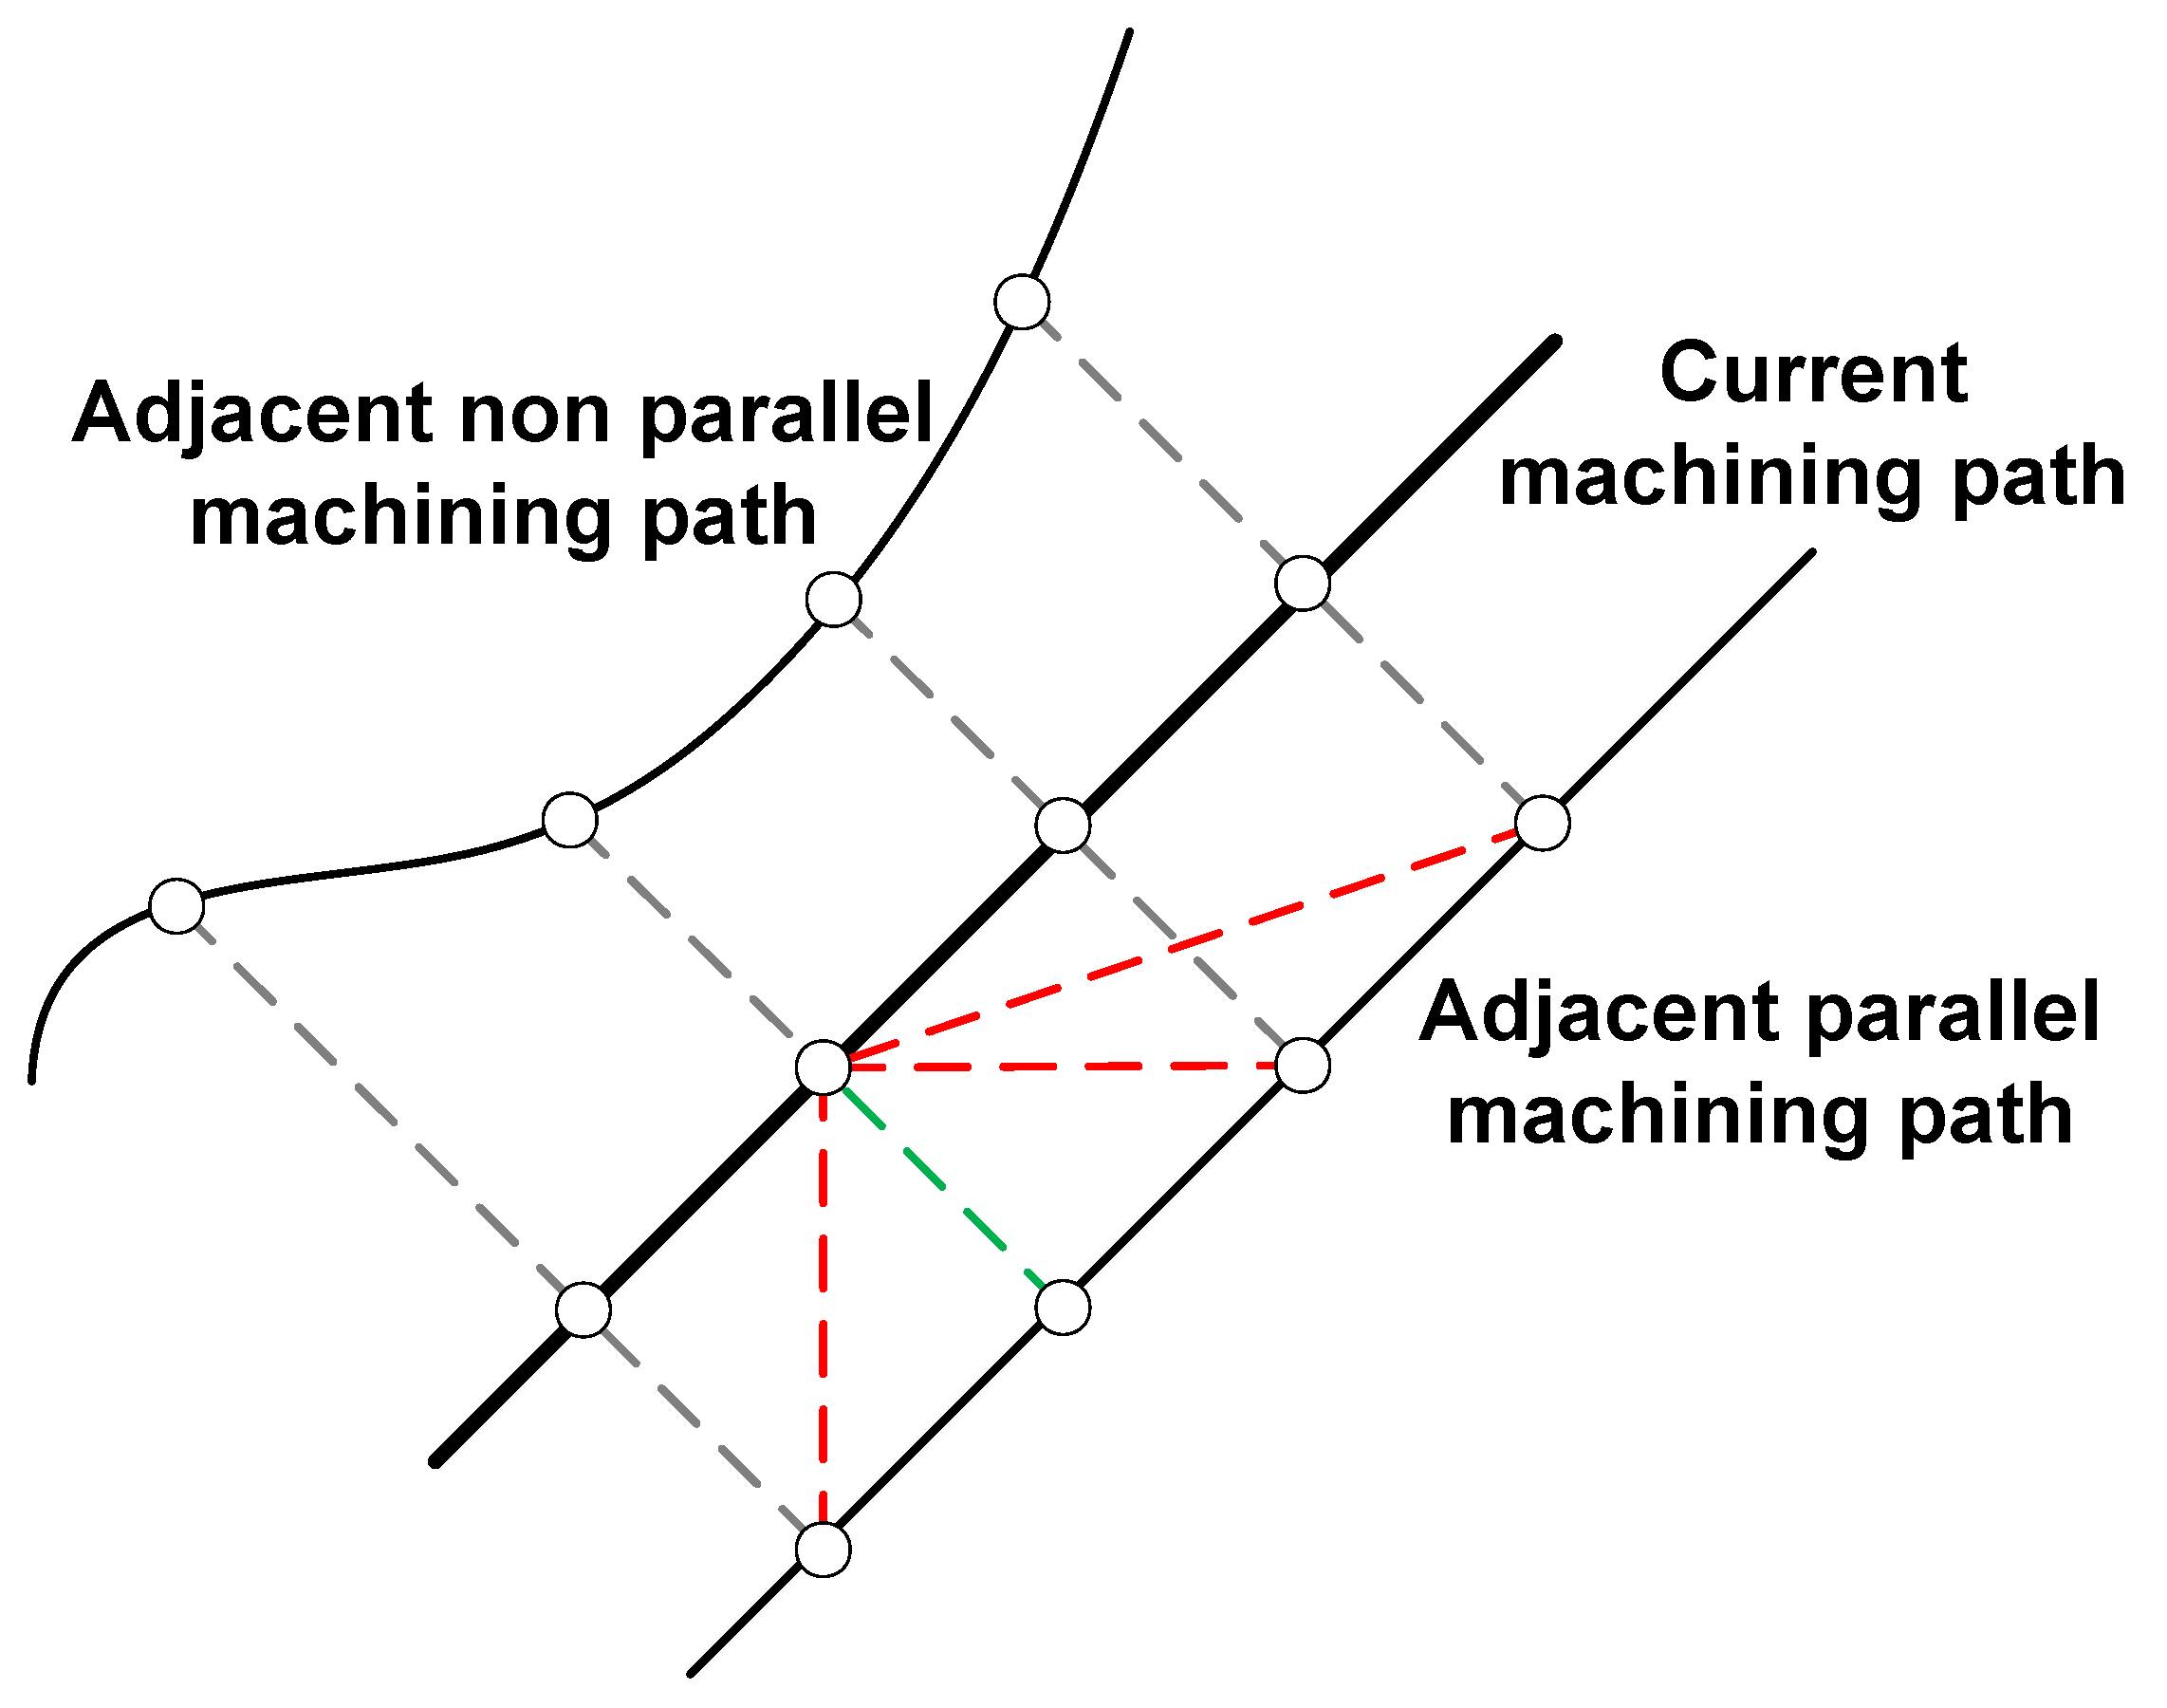
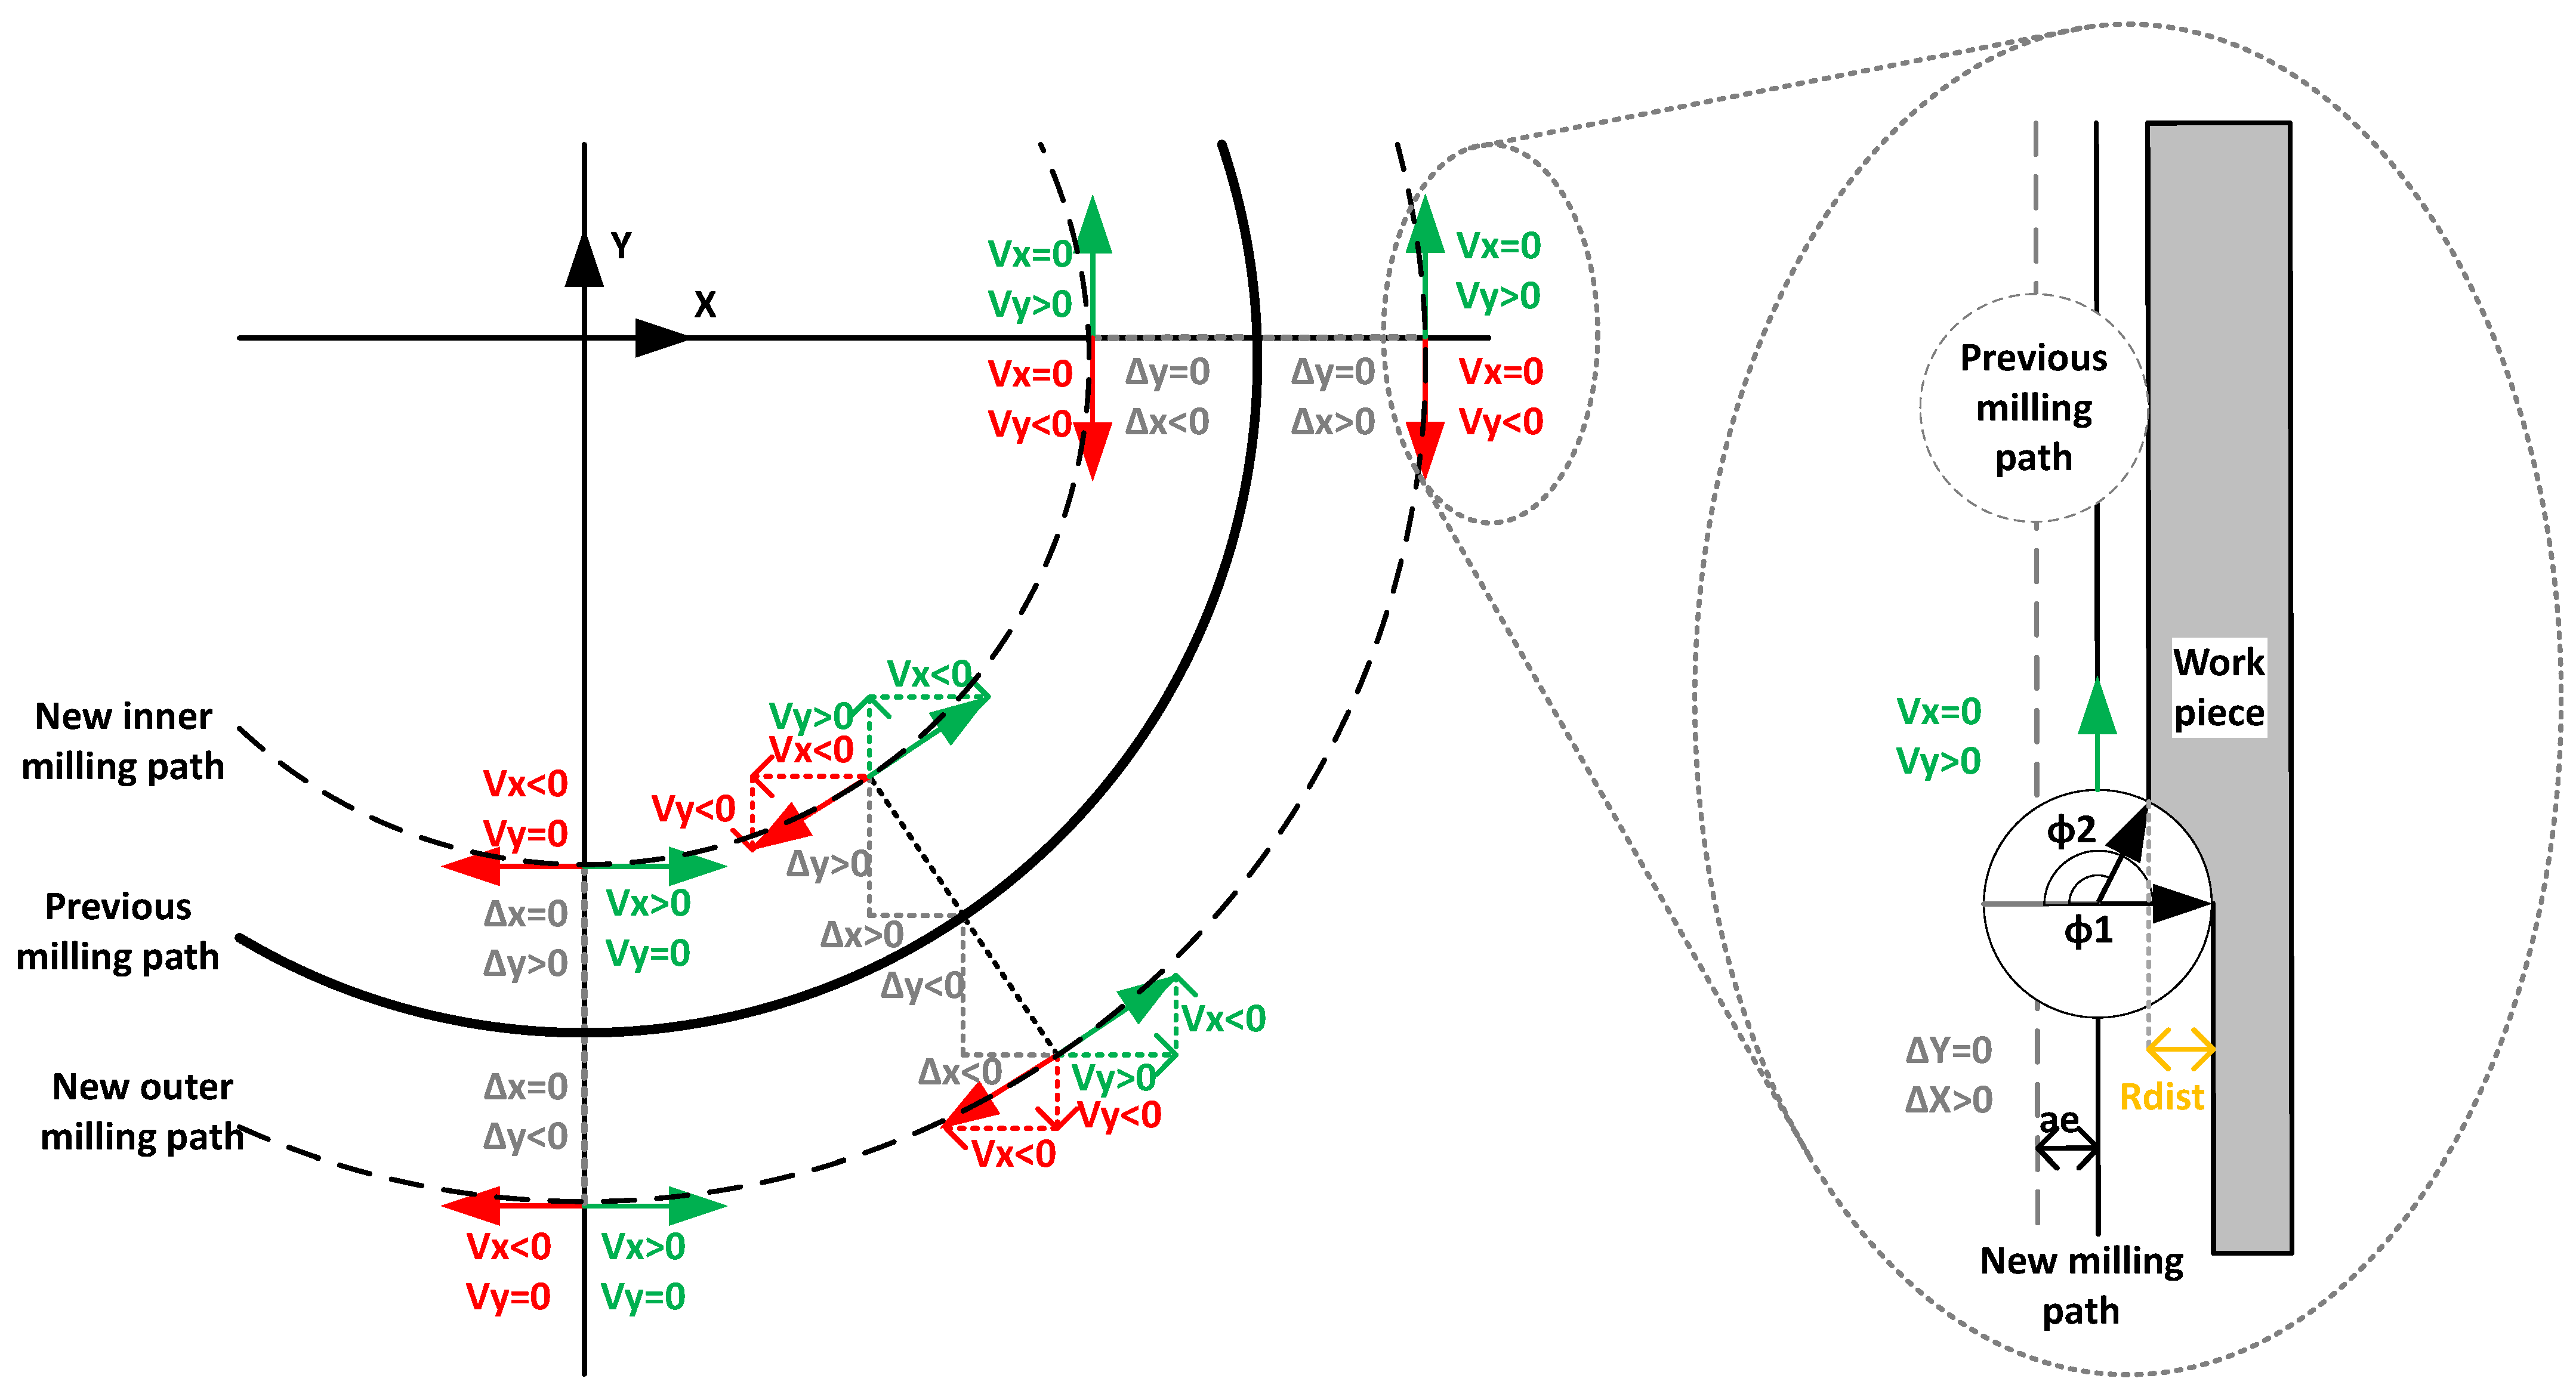
4.1.2. Determination of the Cutting Width
4.1.3. Determination of Tool Angles
4.1.4. Determination of the Cutting Depth
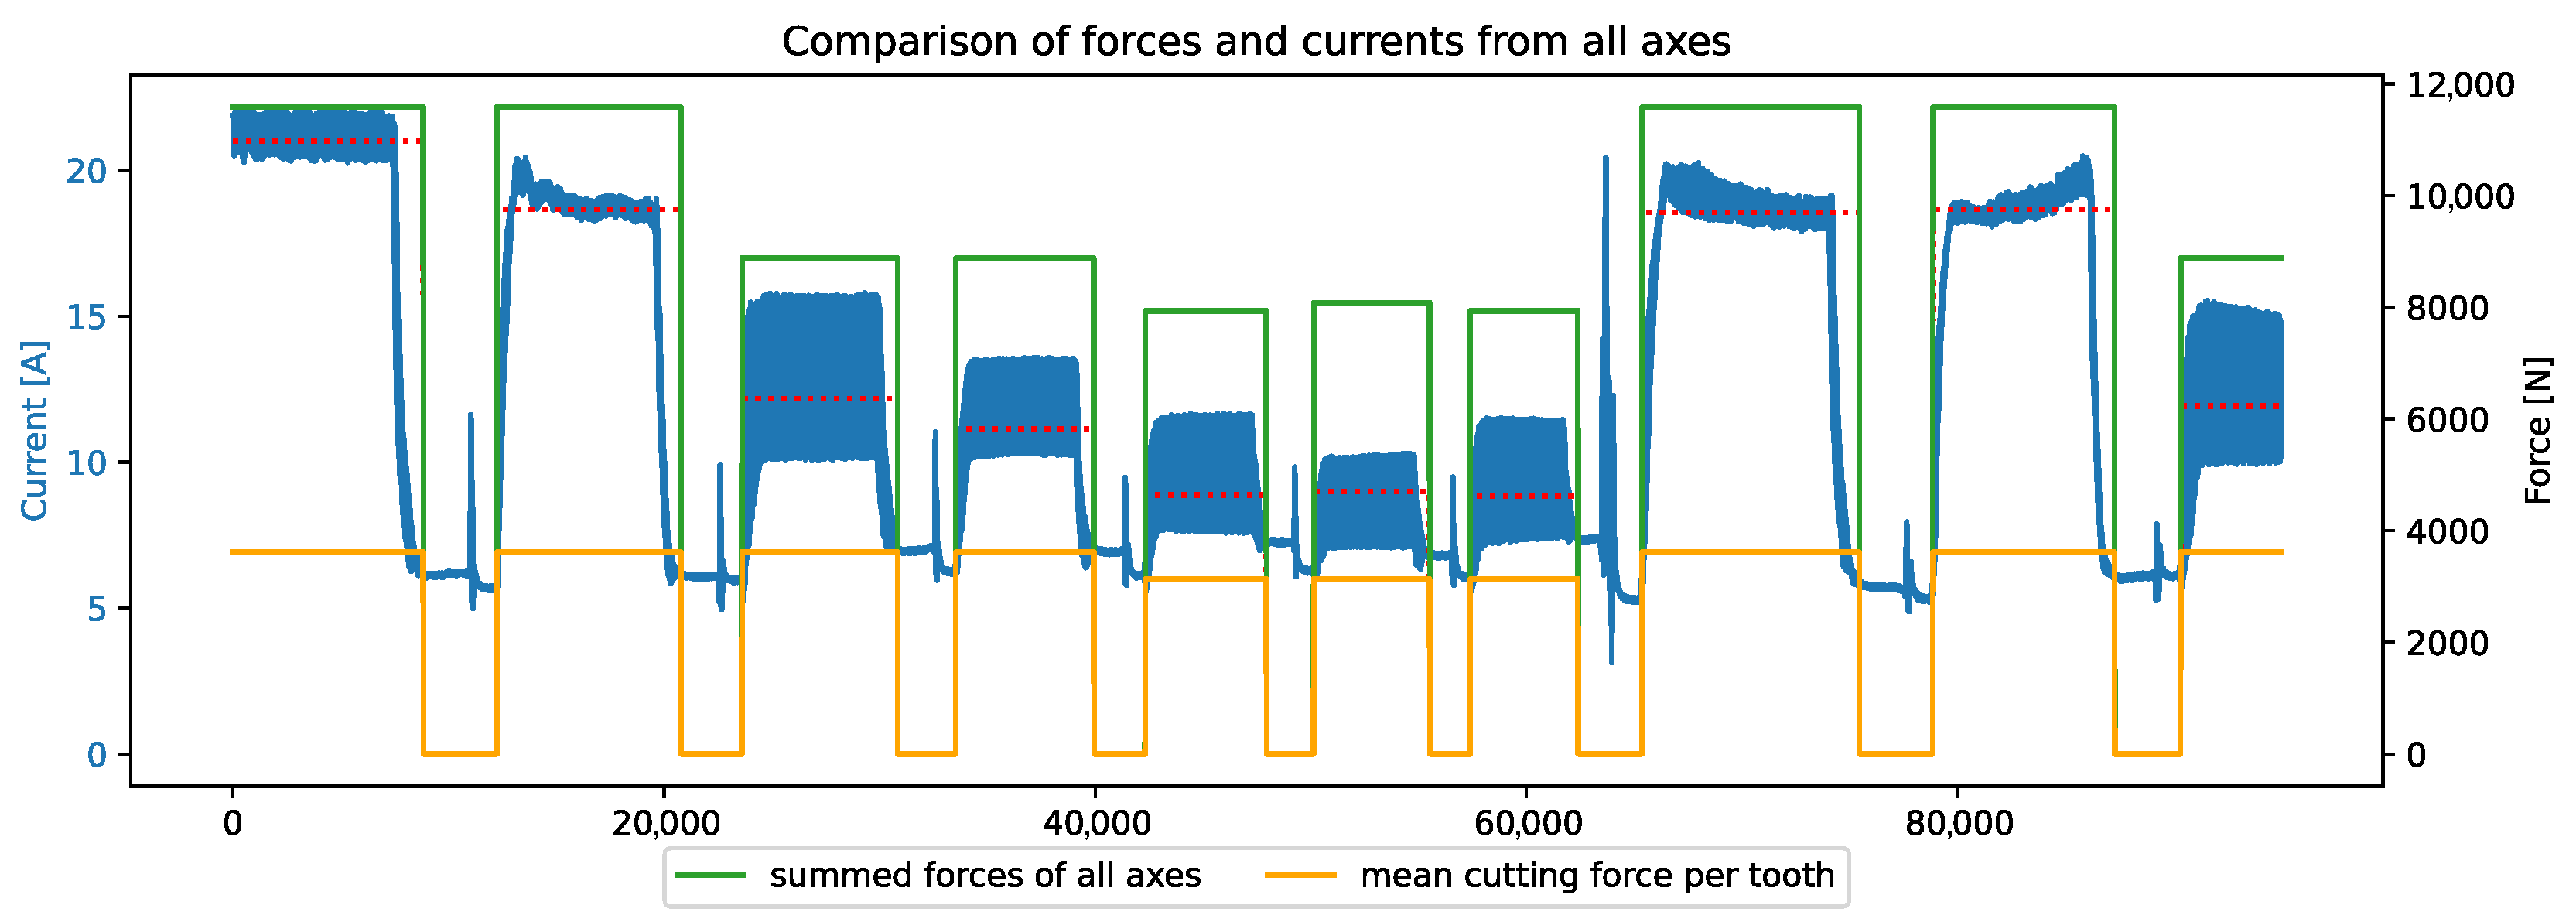
4.1.5. Calculation of Further NC Parameters from the Measured Data
4.2. Optimization Models
4.2.1. Surface Quality
4.2.2. Energy Consumption
4.2.3. Tool Wear
4.2.4. Setting up an Optimization Function
4.2.5. Particle Swarm Optimization
4.3. Calculation of Parameters
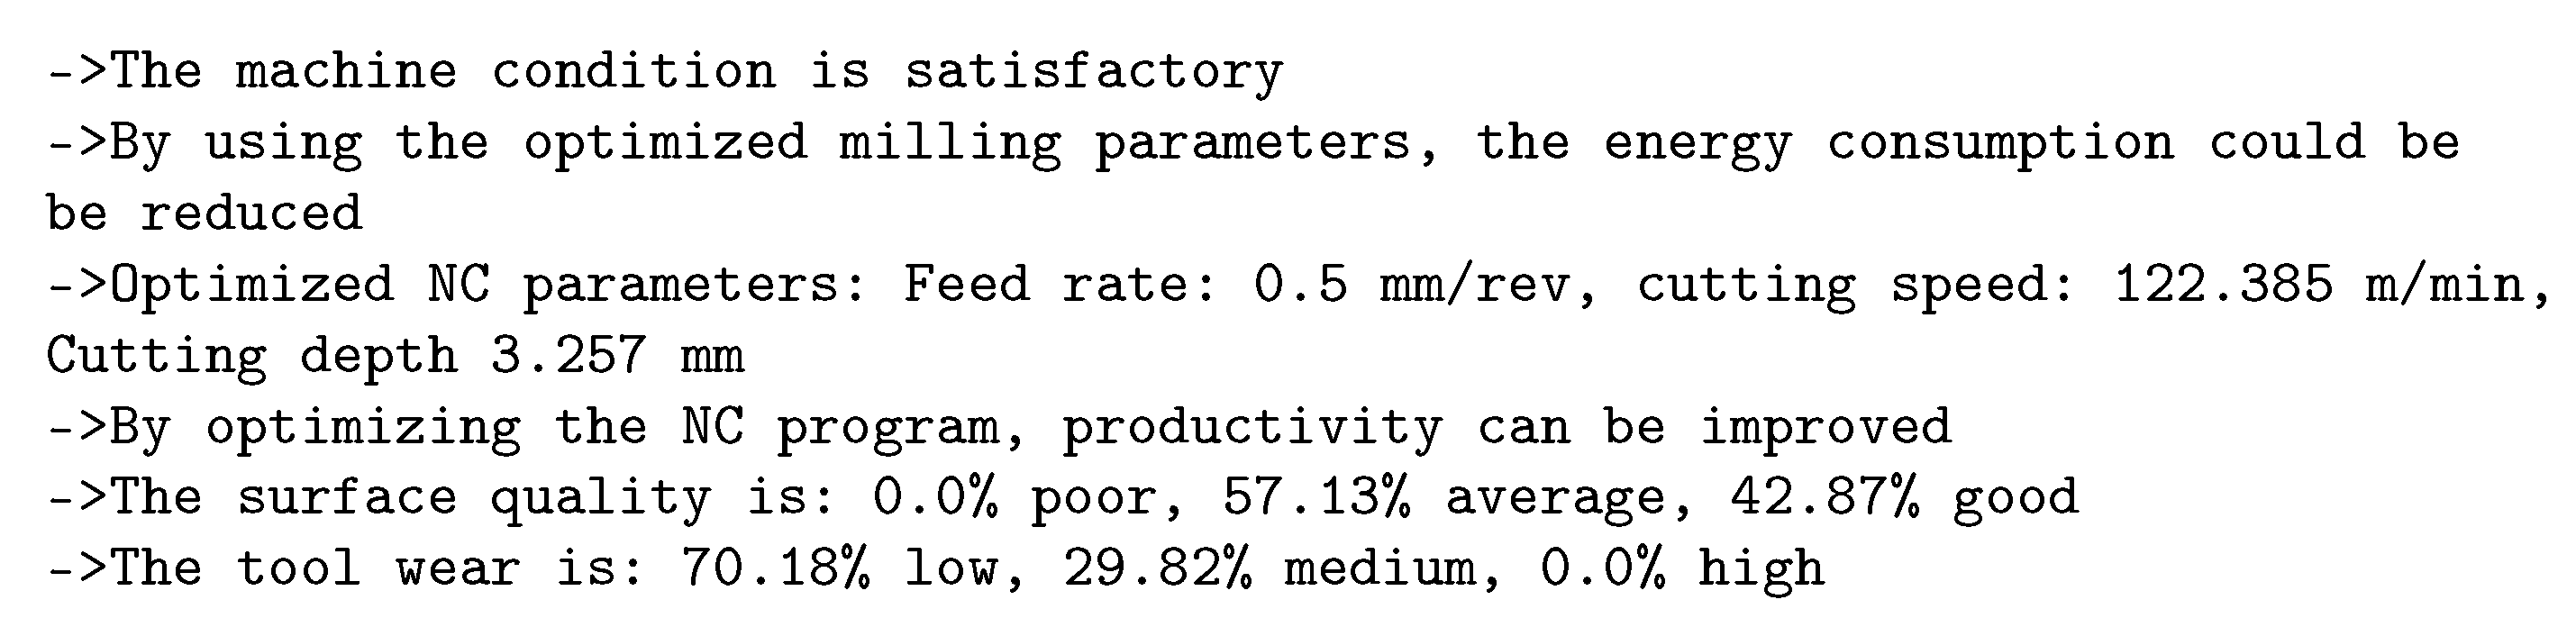
4.4. Fuzzy System
- (a)
- “By using the optimized milling parameters, the surface quality could be improved”.
- (b)
- “The tool wear could be reduced by using the optimized milling parameters”.
- (c)
- “The milling conditions are [Good/Average/Bad]”.
- (d)
- “Attention! The spindle current is higher than expected”.
- (e)
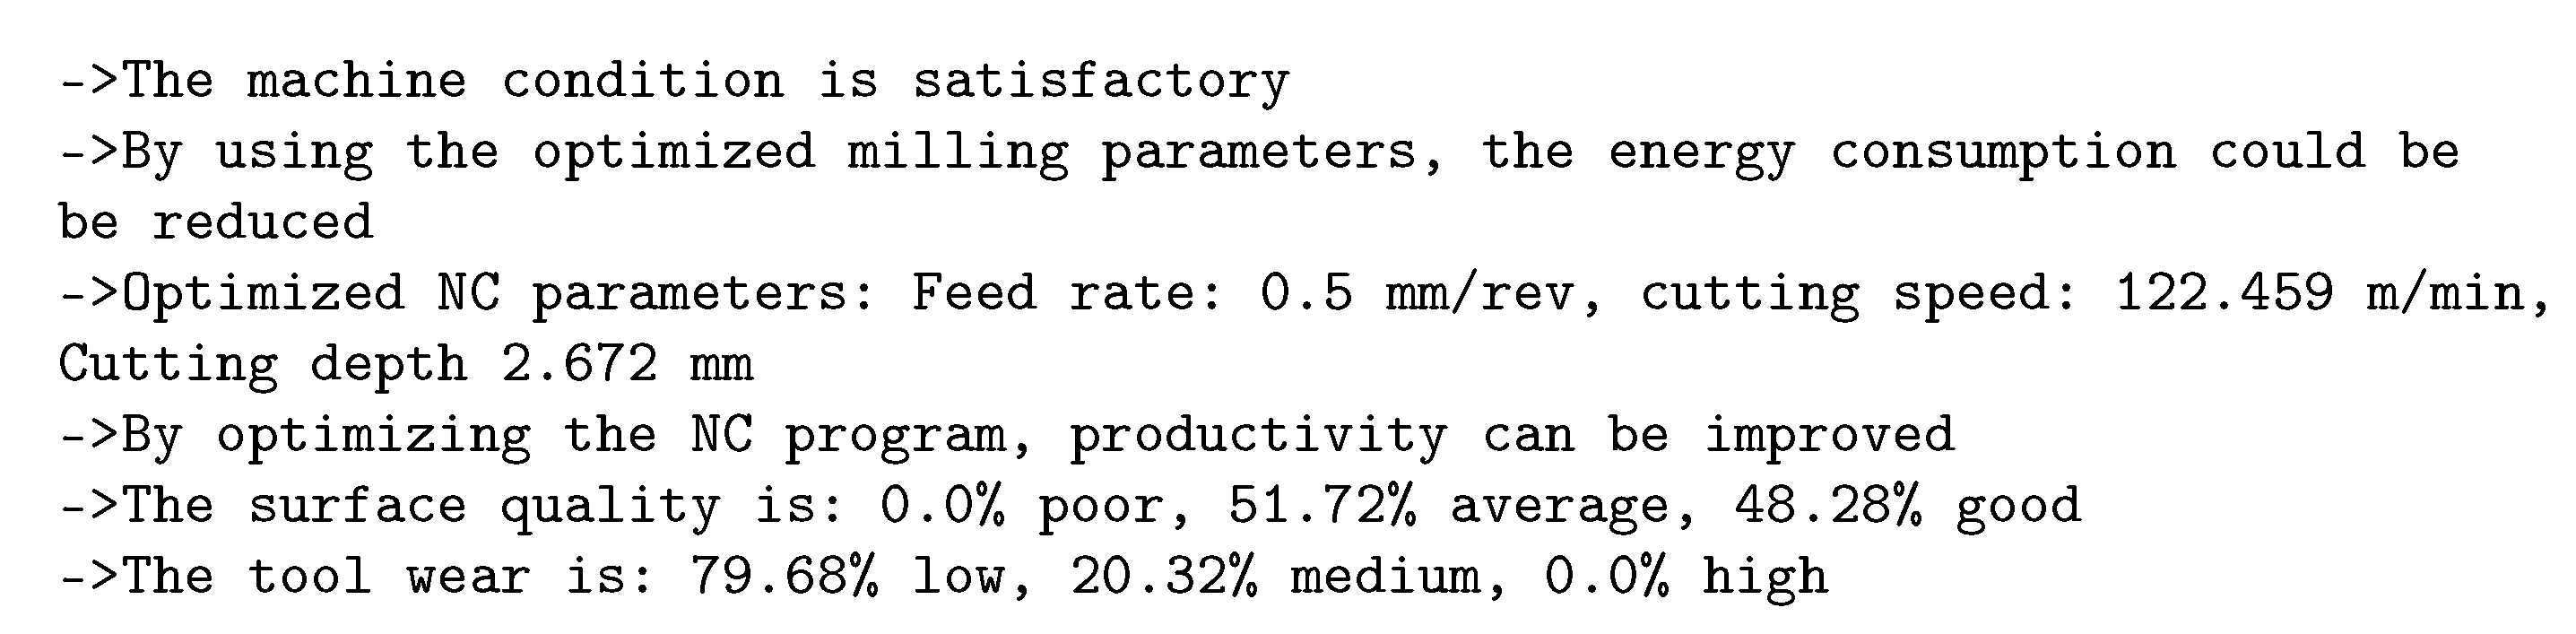
- “By using the optimized milling parameters, the energy consumption could be reduced”.
- (f)
- “Optimizing the NC program can improve productivity”.
- (g)
- “The metal removal rate seems to be [low/very low]; by choosing the optimized parameters, it can be improved”.
4.4.1. Fuzzification of Input and Output Variables
4.4.2. Establishing and Evaluating a Rule Base
5. Validation
6. Evaluation
7. Summary and Outlook
Author Contributions
Funding
Data Availability Statement
Conflicts of Interest
Abbreviations
| Name | Symbol | Unit |
| Feed Rate | mm/min | |
| Cutting Speed | m/min | |
| Width of Cut (Engagement) | mm | |
| Depth of Cut | mm | |
| Tool Diameter | D | mm |
| Spindle Speed | n | - |
| Tooth Feed | mm/rev | |
| Number of Teeth on Tool | z | - |
| Cutting Force | F | N |
| Active Force | N | |
| Passive Force | N | |
| Feed Direction Angle | ° | |
| Feed Force | N | |
| Feed Normal Force | N | |
| Specific Cutting Force | ||
| Energy Consumption | E | W |
| Basic Energy Requirement | W | |
| Material Removal Rate | ||
| Wear Mark Width | B | |
| Average Roughness | ||
| Standard Deviation | - | |
| Entry Angle | ° | |
| Exit Angle | ° |
References
- Bhat, S. Practical Docker with Python; Apress: Berkeley, CA, USA, 2022. [Google Scholar] [CrossRef]
- BDEW. (15 Februaury 2023) Industriestrompreise1 (Inklusive Stromsteuer) in Deutschland in den Jahren 1998 bis 2023 (in Euro-Cent pro Kilowattstunde) [Graph]. Available online: https://de.statista.com/statistik/daten/studie/252029/umfrage/industriestrompreise-inkl-stromsteuer-in-deutschland/ (accessed on 7 September 2023).
- Moradnazhad, M.; Unver, H.O. Energy efficiency of machining operations: A review. Proc. Inst. Mech. Eng. Part B J. Eng. Manuf. 2017, 231, 1871–1889. [Google Scholar] [CrossRef]
- Shin, S.J.; Woo, J.; Rachuri, S. Energy efficiency of milling machining: Component modeling and online optimization of cutting parameters. J. Clean. Prod. 2017, 161, 12–29. [Google Scholar] [CrossRef]
- Tapoglou, N.; Mehnen, J.; Butans, J.; Morar, N.I. Online on-board Optimization of Cutting Parameter for Energy Efficient CNC Milling. Procedia CIRP 2016, 40, 384–389. [Google Scholar] [CrossRef]
- Tapoglou, N.; Mehnen, J.; Vlachou, A.; Doukas, M.; Milas, N.; Mourtzis, D. Cloud-Based Platform for Optimal Machining Parameter Selection Based on Function Blocks and Real-Time Monitoring. J. Manuf. Sci. Eng. 2015, 137, 040909. [Google Scholar] [CrossRef]
- Ströbel, R.; Probst, Y.; Deucker, S.; Fleischer, J. Time Series Prediction for Energy Consumption of Computer Numerical Control Axes Using Hybrid Machine Learning Models. Machines 2023, 11, 1015. [Google Scholar] [CrossRef]
- Maher, I.; Eltaib, M.E.H.; Sarhan, A.A.D.; El-Zahry, R.M. Investigation of the effect of machining parameters on the surface quality of machined brass (60/40) in CNC end milling—ANFIS modeling. Int. J. Adv. Manuf. Technol. 2014, 74, 531–537. [Google Scholar] [CrossRef]
- Çolak, O.; Kurbanoğlu, C.; Kayacan, M.C. Milling surface roughness prediction using evolutionary programming methods. Mater. Des. 2007, 28, 657–666. [Google Scholar] [CrossRef]
- Hayajneh, M.; Tahat, M.S.; Bluhm, J. A Study of the Effects of Machining Parameters on the Surface Roughness in the End-Milling Process. Jordan J. Mech. Ind. Eng. 2007, 1, 1–5. [Google Scholar]
- Simunovic, K.; Simunovic, G.; Saric, T. Predicting the Surface Quality of Face Milled Aluminium Alloy Using a Multiple Regression Model and Numerical Optimization. Meas. Sci. Rev. 2013, 13, 265–272. [Google Scholar] [CrossRef]
- Yeganefar, A.; Niknam, S.A.; Asadi, R. The use of support vector machine, neural network, and regression analysis to predict and optimize surface roughness and cutting forces in milling. Int. J. Adv. Manuf. Technol. 2019, 105, 951–965. [Google Scholar] [CrossRef]
- Nguyen, H.T.; Hsu, Q.C. Surface Roughness Analysis in the Hard Milling of JIS SKD61 Alloy Steel. Appl. Sci. 2016, 6, 172. [Google Scholar] [CrossRef]
- Alauddin, M.; El Baradie, M.A.; Hashmi, M. Computer-aided analysis of a surface-roughness model for end milling. J. Mater. Process. Technol. 1995, 55, 123–127. [Google Scholar] [CrossRef]
- Philip, S.D.; Chandramohan, P.; Rajesh, P.K. Prediction of surface roughness in end milling operation of duplex stainless steel using response surface methodology. J. Eng. Sci. Technol. 2015, 10, 340–352. [Google Scholar]
- Zhang, S.; Li, J.F.; Ding, T.C. Statistical Modeling of Surface Roughness in Hard Milling H13 Steel. Mater. Sci. Forum 2011, 697–698, 61–66. [Google Scholar] [CrossRef]
- Palanisamy, P.; Rajendran, I.; Shanmugasundaram, S. Prediction of tool wear using regression and ANN models in end-milling operation. Int. J. Adv. Manuf. Technol. 2008, 37, 29–41. [Google Scholar] [CrossRef]
- Xu, L.H.; Huang, C.Z.; Niu, J.H.; Wang, J.; Liu, H.L.; Wang, X.D. Prediction of cutting power and surface quality, and optimization of cutting parameters using new inference system in high-speed milling process. Adv. Manuf. 2021, 9, 388–402. [Google Scholar] [CrossRef]
- Gupta, A.; Singh, H.; Aggarwal, A. Taguchi-fuzzy multi output optimization (MOO) in high speed CNC turning of AISI P-20 tool steel. Expert Syst. Appl. 2011, 38, 6822–6828. [Google Scholar] [CrossRef]
- Yang, W.A.; Guo, Y.; Liao, W.H. Optimization of multi-pass face milling using a fuzzy particle swarm optimization algorithm. Int. J. Adv. Manuf. Technol. 2011, 54, 45–57. [Google Scholar] [CrossRef]
- Ströbel, R.; Mau, M.; Deucker, S.; Fleischer, J. Training and Validation Dataset 2 of Milling Processes for Time Series Prediction; Institut für Produktionstechnik (WBK): Karlsruhe, Germany, 2023. [Google Scholar] [CrossRef]
- Ströbel, R.; Probst, Y.; Fleischer, J. Training and Validation Dataset of Milling Processes for Time Series Prediction; Institut für Produktionstechnik (WBK): Karlsruhe, Germany, 2023. [Google Scholar] [CrossRef]
- Dijmarescu, M.R.; Dijmarescu, M.C.; Voiculescu, I.; Popovici, T.D.; Tarba, I.C. Study on the influence of cutting parameters on surface quality when machining a CoCrMo alloy. IOP Conf. Ser. Mater. Sci. Eng. 2018, 400, 022020. [Google Scholar] [CrossRef]


| Paper | Cutting Speed | Tooth Feed | Cutting Depth | Material |
|---|---|---|---|---|
| [11] | 41.5–150 m/min | 0.01–0.02 mm/rev | 0.13–0.97 mm | aluminium |
| [10] | 45–90 m/min | 0.025–0.2 mm/rev | 0.25–1.25 mm | aluminium |
| [9] | 23.5–47 m/min | 0.025–0.2 mm/rev | 0.25–1.26 mm | aluminium |
| [12] | 30–120 m/min | 0.01–0.1 mm/rev | 1.0–2.0 mm | aluminium |
| [16] | 90–150 m/min | 0.04–0.16 mm/rev | 1–2.5 mm | steel |
| [13] | 25–75 m/min | 0.1–0.3 mm/rev | 0.2–0.6 mm | steel |
| [15] | 31.41–62.83 m/min | 0.04–0.2 mm/rev | 0.4–1.2 mm | steel |
| [14] | 22–40 m/min | 0.1–0.52 mm/rev | 0.6–1.4 mm | steel |
| Code | Description |
|---|---|
| Productivity | Share of total productive energy |
| Energy per path | Total energy divided by path |
| Deviation spindle current | Mean value of the difference between measured spindle current and predicted spindle current in the considered period |
| Deviation energy consumption | Deviation between the energy consumption predicted with the current NC parameters and the energy consumption predicted with the optimized NC parameters |
| Surface quality | Mean value of the surface quality calculated for the actual machine parameters with the model in the considered period |
| Difference surface quality | Difference between the optimized and actual surface quality |
| Tool wear | Mean value of tool wear calculated for the actual machine parameters with the model in the considered period |
| Material removal rate | Removed material volume in the last 5 min |
| Recommendation | |||||||
|---|---|---|---|---|---|---|---|
| Indicator | (a) | (b) | (c) | (d) | (e) | (f) | (g) |
| Productivity | |||||||
| Energy per way | |||||||
| Deviation spindle current | |||||||
| Deviation energy consumption | |||||||
| Surface quality | |||||||
| Difference surface quality | |||||||
| Tool wear | |||||||
| Difference tool wear | |||||||
| Machining volume | |||||||
| Cutting Volume: | Low | Cutting Volume: | Large | ||||||
|---|---|---|---|---|---|---|---|---|---|
| Energy per path | Low | Medium | High | Energy per path | Low | Medium | High | ||
| Productivity | Productivity | ||||||||
| Poor | Bad | Very bad | Very bad | Poor | Medium | Bad | Very bad | ||
| Average | Medium | Medium | Poor | Average | Good | Good | Medium | ||
| Good | Very good | Good | Medium | Good | Very good | Good | |||
Disclaimer/Publisher’s Note: The statements, opinions and data contained in all publications are solely those of the individual author(s) and contributor(s) and not of MDPI and/or the editor(s). MDPI and/or the editor(s) disclaim responsibility for any injury to people or property resulting from any ideas, methods, instructions or products referred to in the content. |
© 2024 by the authors. Licensee MDPI, Basel, Switzerland. This article is an open access article distributed under the terms and conditions of the Creative Commons Attribution (CC BY) license (https://creativecommons.org/licenses/by/4.0/).
Share and Cite
Bott, A.; Anderlik, S.; Ströbel, R.; Fleischer, J.; Worthmann, A. Framework for Holistic Online Optimization of Milling Machine Conditions to Enhance Machine Efficiency and Sustainability. Machines 2024, 12, 153. https://doi.org/10.3390/machines12030153
Bott A, Anderlik S, Ströbel R, Fleischer J, Worthmann A. Framework for Holistic Online Optimization of Milling Machine Conditions to Enhance Machine Efficiency and Sustainability. Machines. 2024; 12(3):153. https://doi.org/10.3390/machines12030153
Chicago/Turabian StyleBott, Alexander, Simon Anderlik, Robin Ströbel, Jürgen Fleischer, and Andreas Worthmann. 2024. "Framework for Holistic Online Optimization of Milling Machine Conditions to Enhance Machine Efficiency and Sustainability" Machines 12, no. 3: 153. https://doi.org/10.3390/machines12030153