
Data Farming Process and Initial Network Analysis Capabilities

1
Blue Canopy Group, 4924 Andrea Avenue, Annandale, VA 22003, USA
2
Meyercraft, Inc., McLean, VA 22101, USA
*
Author to whom correspondence should be addressed.
†
These authors contributed equally to this work.
Axioms 2016, 5(1), 4; https://doi.org/10.3390/axioms5010004
Submission received: 9 December 2015
/
Revised: 13 January 2016
/
Accepted: 20 January 2016
/
Published: 27 January 2016
(This article belongs to the Special Issue Data Farming: Mathematical Foundations and Applications)
Abstract
:Data Farming, network applications and approaches to integrate network analysis and processes to the data farming paradigm are presented as approaches to address complex system questions. Data Farming is a quantified approach that examines questions in large possibility spaces using modeling and simulation. It evaluates whole landscapes of outcomes to draw insights from outcome distributions and outliers. Social network analysis and graph theory are widely used techniques for the evaluation of social systems. Incorporation of these techniques into the data farming process provides analysts examining complex systems with a powerful new suite of tools for more fully exploring and understanding the effect of interactions in complex systems. The integration of network analysis with data farming techniques provides modelers with the capability to gain insight into the effect of network attributes, whether the network is explicitly defined or emergent, on the breadth of the model outcome space and the effect of model inputs on the resultant network statistics.
1. Introduction
Data Farming is a quantified approach that examines questions in large possibility spaces using modeling and simulation. It evaluates whole landscapes of outcomes to draw insights from outcome distributions and outliers. This evaluation is made possible by “growing” massive amounts of data through the execution of many simulation runs. The name Data Farming was initially coined in 1997 [1]. Since that time the data farming community has grown to include people from over a dozen nations. Data farming continues to evolve from initial work in a United States Marine Corps effort called Project Albert [2] to the present. The Scythe is the publication of the International Data Farming Community that contains proceedings of the now 29 workshops that have been held over the years and more information can be found at www.datafarming.org.
Data farming uses simulation in a collaborative and iterative team process [3] that has been used primarily in defense applications [4]. This process normally requires input and participation by subject matter experts, modelers, analysts, and decision-makers. Data farming is a process that has been developed to support decision-makers by answering questions that are not currently addressed. Data farming uses an inter-disciplinary approach that includes modeling and simulation, high performance computing, and statistical analysis to examine questions of interest with large number of alternatives. Data farming allows for the examination of uncertain events with numerous possible outcomes and provides the capability of executing enough experiments so that both overall and unexpected results may be captured and examined for insights.
In 2010, the NATO Research and Technology Organization started the three-year Modeling and Simulation Task Group “Data Farming in Support of NATO” to assess and document the data farming methodology to be used for decision support. This group was called Modeling and Simulation Group-088 and the first half of this article is a summary of the six data farming disciplines outlined during the course of MSG-088 [5]. Upon completion of MSG-088, a follow-on task group called “Developing Actionable Data Farming Decision Support” was initiated by NATO and was designated MSG-124. This task group is performing work in selected application areas important to NATO, one of which is cyber defense and the other is operation planning.
A variety of the application areas of interest involve networks, either defined or emergent. In this article we begin by describing data farming and its components and then drill into the application of integrating new analytic techniques into the process. Thus in the second part of this article overviews efforts to define and integrate network analysis tools and methods into the data farming process. By applying the data farming experimental process across the network attribute space we gain insight into network-related cause and effects, examining whether network features affect the model outcomes or how model parameter variation affects network evolution and attributes.
1.1. Data Farming Process
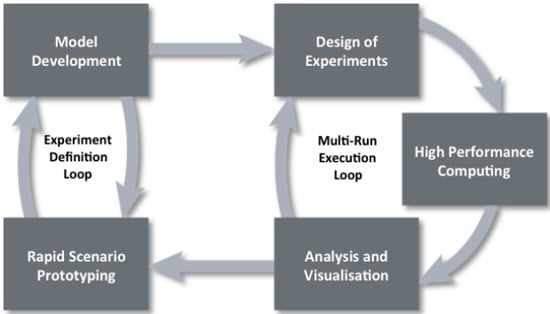
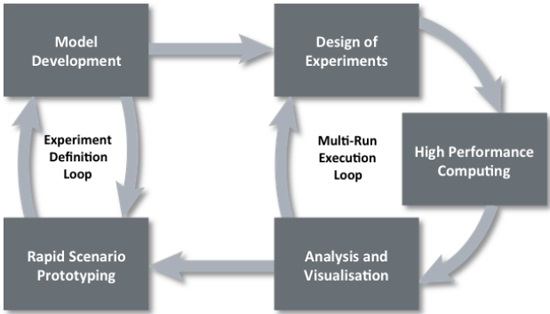
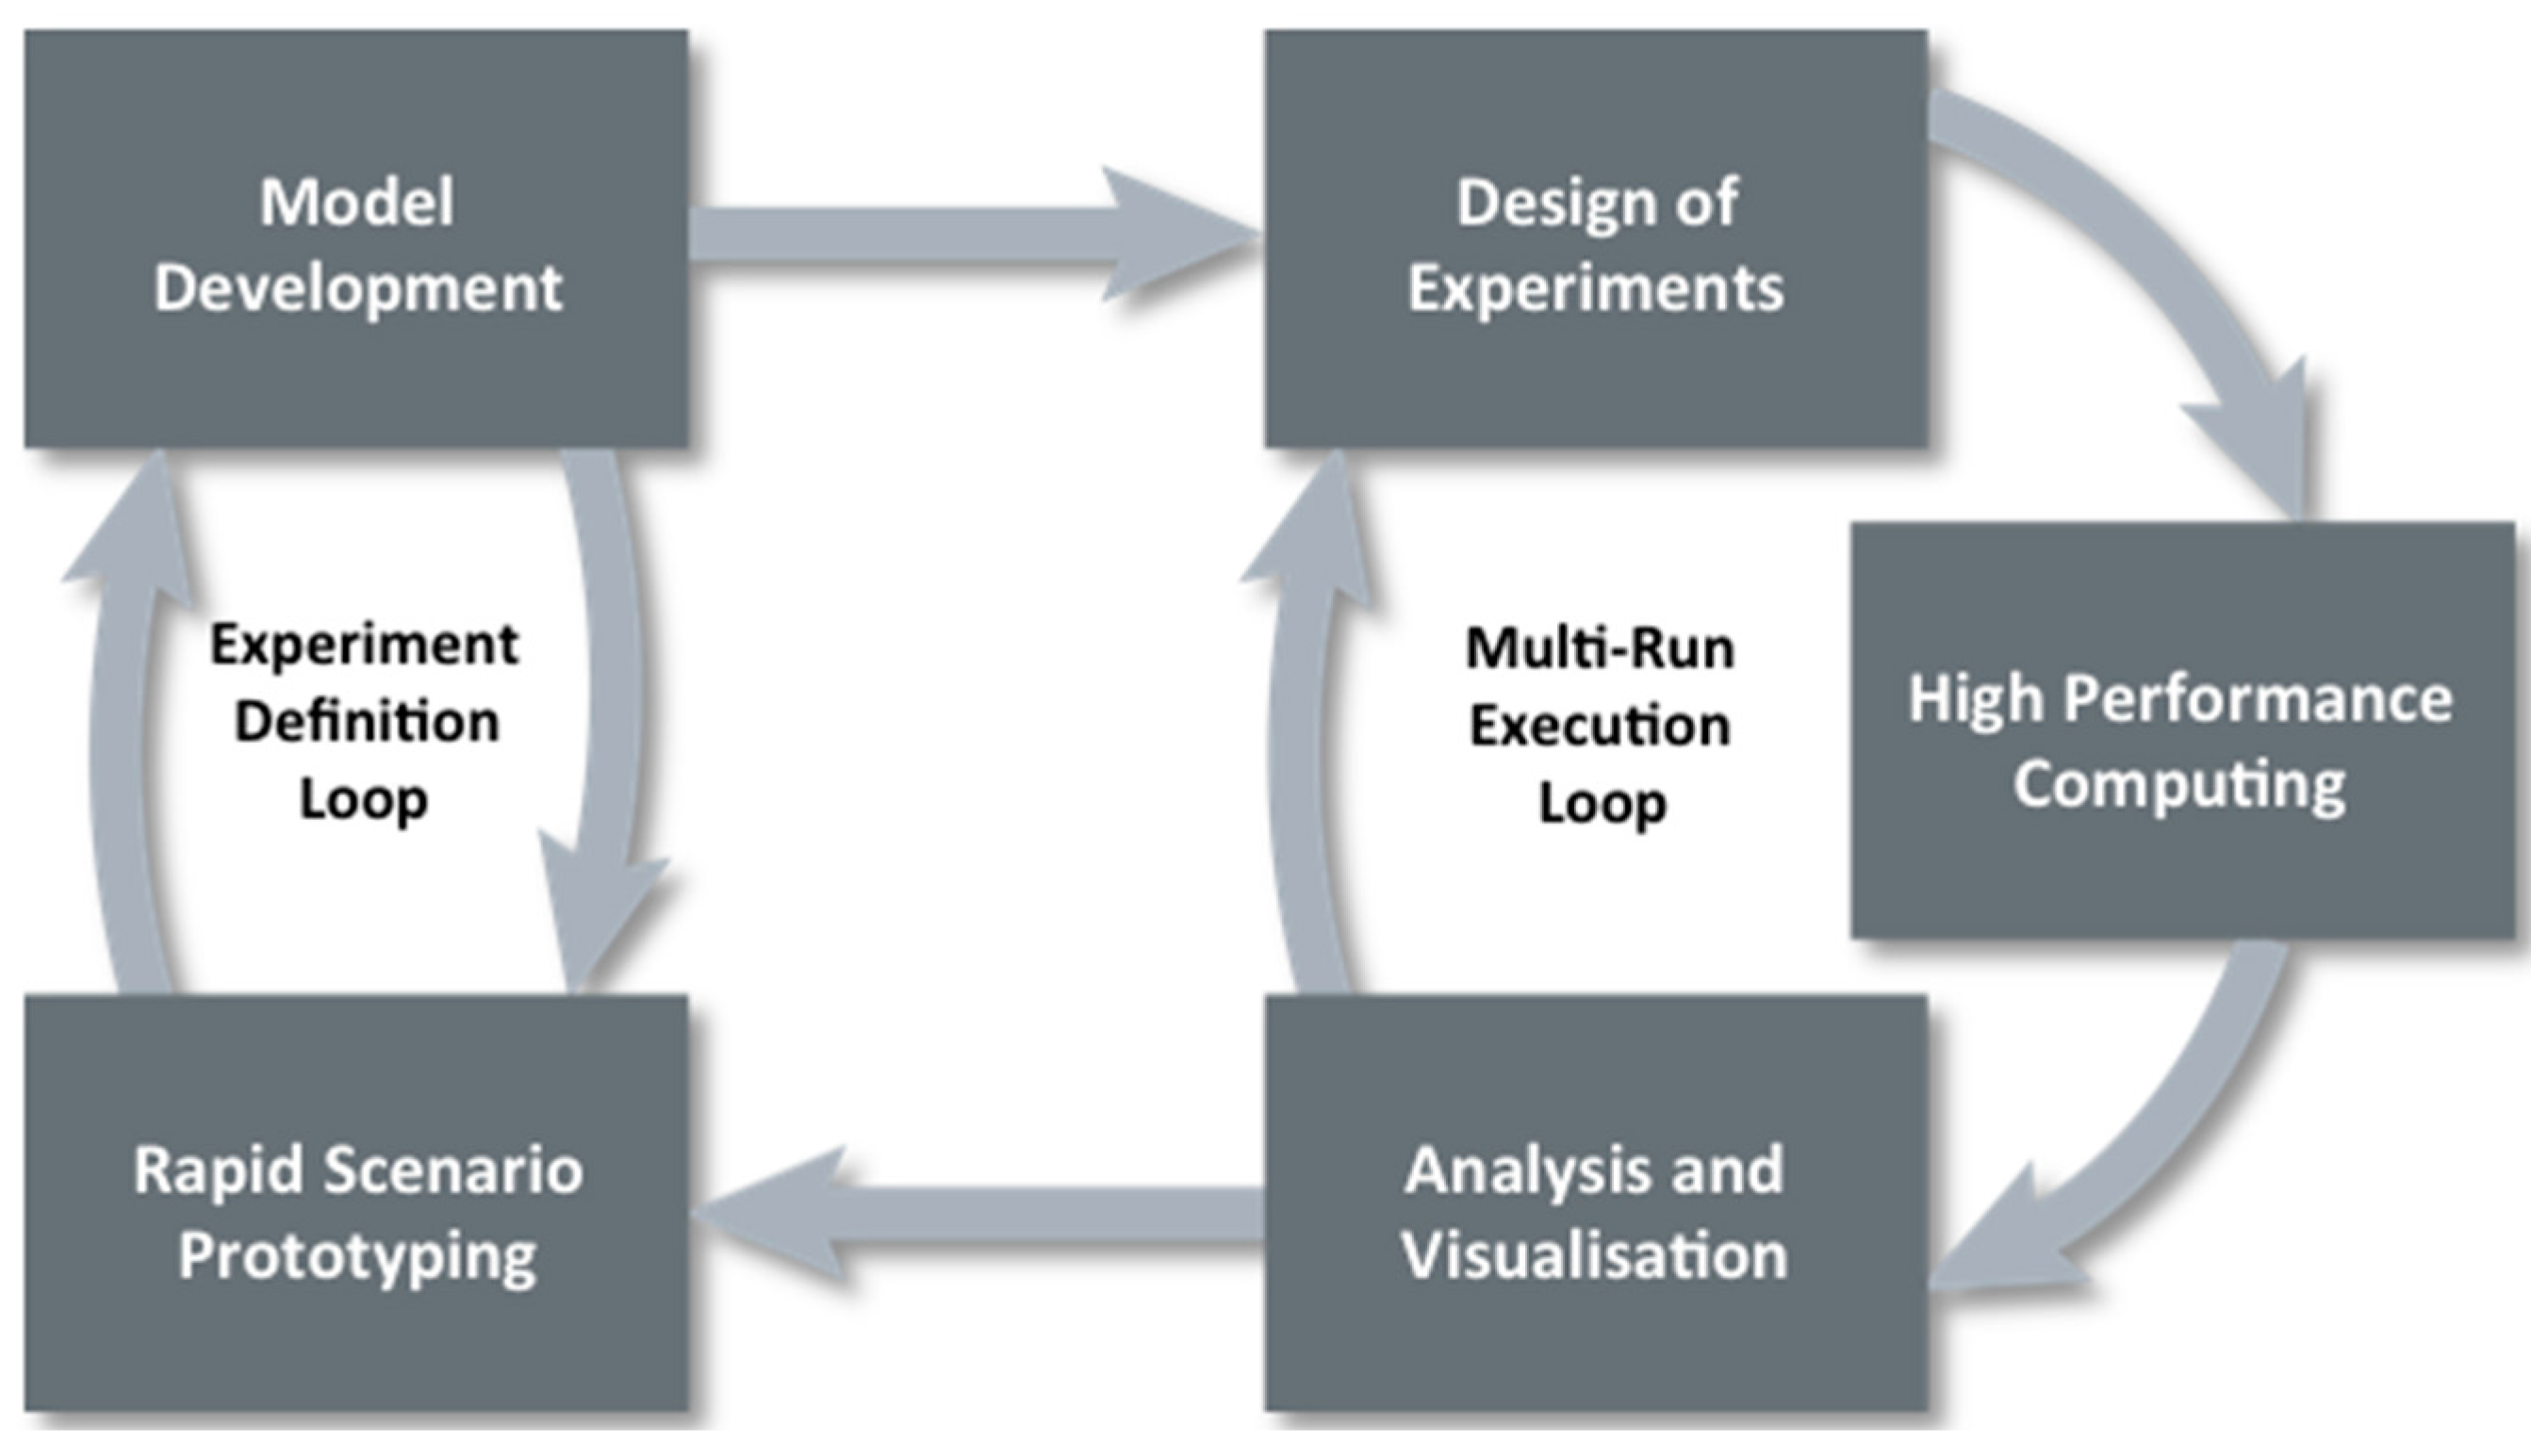
Data farming uses an iterative approach that is illustrated by the loop of loops in Figure 1 (www.datafarming.org). The first realm, rapid prototyping, works with the second realm, model development, iteratively in an experiment definition loop. A rapidly prototyped model provides a starting point in examining the initial questions and the model development regimen supports the model implementation, defining the resolution, scope, and data requirements. The third realm, design of experiments, enables the execution of a broad input factor space while keeping the computational requirements within feasible limits. High performance computing, realm four, allows for the execution of the many simulation runs that is both a necessity and a major advantage of data farming. The fifth realm, analysis and visualization, involves techniques and tools for examining the large output of data resulting from the data farming experiment. The final realm, collaborative processes, underlies the entire data farming process and these processes will be described in turn below.
Figure 1.
Data farming loop of loops.
1.2. Rapid Scenario Prototyping
The model development and the rapid prototyping realms of data farming together make up the experiment definition loop in Figure 1. As such, they work hand-in-hand with each other and we could choose either realm to begin our detailed description of data farming. Thus the rapid scenario prototyping process is a good place to start our discussion, although starting with model development realm would also be appropriate.
As with the data farming process in general, the rapid scenario prototyping should always be within the context of the questions to be answered. These questions have to be prepared in such a way that simulation can help to find answers and to get insights. The most important step here is to define measurements to be collected by means of simulation together with required input and output data for the simulation. In most cases this step already requires some rough ideas about the scenario settings. Thus, this realm simply represents the initial formation of the basics of a scenario to be simulated.
1.3. Model Development
As stated in the previous subsection, the model development realm works hand-in-hand with the rapid scenario prototyping realm in the experiment definition loop on the left side of Figure 1. The fundamental output of this loop is a scenario instantiated in a working simulation model that captures the essence of a question and that can be sent to the multi-run execution loop of the data farming process. Of course, more insight into the question, refinement of the question, and/or deeper examination of the question may be enabled later through a return to the experiment definition loop later in the process.
When developing models, both modeling and subject matter experts should be present. Rapid scenario prototyping provides model requirements for model development. For example, it is important to do one thing well, such as creating aggregated models that combine simple models instead of building single monolithic models, whenever possible. The more independent models are from each other, the better the potential results. Thus, one needs to encourage modularization and clear separation of different models, including development practices for using models of different aggregation level and scope. Other important characteristics of models as they are developed include reusability, interoperability, repeatability, and thorough documentation. And, finally, openness should be encouraged, including the sharing of source code when possible given other constraints.
1.4. Design of Experiments
Design of experiments is one of the three realms of data farming in the multi-run execution loop. Along with the realms of high performance computing and analysis and visualization, the realm of design of experiments allow us to perform multiple runs to gain simulation results over a wide landscape of possibilities. Simulation models have many inputs or parameters (factors) that can be changed to explore alternatives. A designed experiment is a carefully chosen set of combinations of these inputs, called design points, at which the simulation model will be run. Design of experiments provides smarter ways of setting up the experiment that facilitate follow-on analysis and visualization of results in a reasonable amount of time.
Changing the factors in a brute force way, by looking at all possible combinations, is impractical or impossible, except for extremely simplistic simulations with only a handful of factors. Changing the factors all at once limits your insights. It will allow you to see whether or not this changes the responses, but you will not be able to tell why the changes occur. For example, if mission effectiveness improves when you equip a squad with better sensors and better weapons, you will not know whether it is the weapon or the sensor that has the most impact. Changing the factors one at a time also limits your insights. If the squad gets a very small improvement from a better weapon, a very small improvement from a better sensor, but a large improvement from both, you will not be able to identify this interaction (or synergistic effect) if the experimental design does not involve factors for both the weapon and the sensor.
1.5. High Performance Computing
High Performance Computing (HPC) consists of both hardware and software resources. HPC systems can be configured as a single supercomputer with thousands of processors, as a network of clustered computers, or even as a single powerful desktop computer with multi-core processors. The hardware on these systems includes such things as processors, memory, networking hardware, and disk storage. HPC software includes, among other things: the operating system; underlying or supporting software which provide the environment to execute the model; and the data farming software, which enables running instances of the model across the HPC systems’ “compute units”. By generating and managing each of the model runs over a set of design points or input sets, the data farming software provides the infrastructure “glue” that “sticks together” the model, its set of inputs, the design, and the HPC resources.
The main purpose of HPC in the context of data farming is to provide the means to execute a data farming experiment. Other purposes of HPC are for use in analysis and visualization of the output and for generating designs used in future data farming experiments. Given the large number of model runs made in a typical data farming experiment, HPC facilitates conducting the experiment in a timely manner as well as supporting the storage and analysis of huge volumes of output.
1.6. Analysis and Visualization
Analysis in the data farming context is the process of examining data that is produced by data farming processes using statistical, summarization and presentation techniques to highlight useful information, extract conclusions, and support decision-making. Visualisation is a collection of graphical and visual analysis techniques used to optimize and speed the process of exploring data, conveying understanding, and presenting in data farming processes. Much of the current usage of analysis and visualization in the data farming process has been the analytic examination of multiple replicate and excursion model output.
In order to exploit the potentially huge data output from the high performance computing execution of the design of experiments, highly effective analysis techniques must be employed. Statistical analysis and visualisation can be used to discern whether data may has useful meaningful value and aid in the translation of data into information that is useful in making progress in understanding possible answers to the questions at hand. The ability to use multiple techniques provides the ability to explore, investigate, and answer the questions posed. Every technique has strengths and limitations, therefore, especially for high-dimensional data, use of a family of techniques is preferable to use of a single technique. As stated earlier, data farming gives us the ability to map the landscape of possibilities and in the process discover outliers. These outliers should always be considered and only be eliminated for appropriate reasons and can be investigated as a separate cohort of the data using various analysis and visualisation techniques.
1.7. Collaboration
The spirit of collaboration is the key tenet of data farming. It underlies the loop of loops in Figure 1 and holds within it much of the power of data farming. Throughout the development of data farming and the formation of the data farming community, people have openly shared experiences and expertise. One focus for collaborative efforts has been and continues to be the international workshops. The first international workshop took place in 1999 at the Maui High Performance Computing Center. The first 4 workshops were methodology driven, dealing with complex adaptive systems modeling and agent based representation, with statistical experiment design and experiment evaluation. The subsequent workshops were and continue to be application driven and contributions to the overall advancement of data farming takes place in the development of simulation models, scenarios within the models, and computer clusters to run the models audacious numbers of times.
The real work is in making progress on important questions and the real secret is the combination of military subject matter experts and highly knowledgeable and multi-disciplinary scientists. This special mix of personnel has been the hallmark of the international workshops and this mix has promoted much networking opportunity. It has been a dynamic combination to have data farming work teams headed up by a person who really knows and cares about the question (e.g., a military officer who knows that the answers may have an impact on both mission success and lowering casualties) and supported by men and women with technical prowess who can leverage the tools available.
MSG-088 documented the following aspects of the collaborative processes in data farming: defining the characteristics and dimensions of collaboration in data farming, collaboration within and between the realms in data farming, collaboration of the people, collaboration of the data farming results, application of collaboration tools. This information can be found in the full report as well as information on the current status of data farming in the attending nations and ideas about the future development of data farming.
1.8. Summary of Data Farming
Data Farming is now documented as a process through the efforts of the 37 authors of the Final Report of MSG-088. Many of these data farmers plus more are applying data farming to questions of interest to NATO within MSG-124. Also, data farming work in being done throughout the world in many contexts and the greater Data Farming Community has already met again at the 29th Workshop which took place in March 2015 in Finland. The workshops are now called International What-if? Workshops (IWWs), because the key question that data farmers ask over and over again is “what if”? One of the topics recently pursued during these workshops is networks and the remainder of this paper will present some of the work started in this area.
2. Data Farming and Network Analysis Capabilities
Data farming is a process that leverages software experiment development and high performance computing to automate and optimize the creation and execution of software-based experiments over a very large range of input factors and to extensively explore and gain insights from the experimental outcome space. Data farming is a cross discipline capability that has been used, in particular, to address complex systems due to its potential for efficient examination of multi-dimensional input factor spaces. In physical complex systems, factors such as chaos effects, non-linearity, the non-closed nature of real-world systems, issues of availability and resolution of initial and ongoing state data, and limitations of resources prevent confidence in prediction from such experimentation. When systems involve social entities they become yet more complex with intangibles such as morale, trust and charisma coming into play along with adaptation and co-evolution.
Social network analysis and graph theory are widely used techniques for the evaluation of social systems. Incorporation of these techniques into the data farming process provides analysts examining complex systems with a powerful new suite of tools for more fully exploring and understanding the effect of interactions in complex systems. Many complex systems involve networks: sometimes specifically delineated, but also implicitly in the structure of entity relationships, or emergent from behaviors and interaction.
The integration of network analysis with data farming techniques provides modelers with the capability to gain insight into the effect of network attributes, whether the network is explicitly defined or emergent, on the breadth of the model outcome space and the effect of model inputs on the resultant network statistics. In this portion of this paper we document steps taken to undertake this integration. The objectives of this effort were to: build tools to extract emergent network data structures from modeling systems; develop and integrate network analysis capabilities into existing data farming data infrastructure; and demonstrate the utility of these capabilities by applying the tools to real-world problems.
2.1. Data Farming with Social Network Analysis
DoD directive 2000.19E, dated February 14, 2006 stated, “The Joint Improvised Explosive Device Defeat Organization shall focus (lead, advocate, coordinate) all Department of Defense actions in support of Combatant Commanders’ and their respective Joint Task Forces’ efforts to defeat improvised explosive devices as weapons of strategic influence.”
In 2009, the authors began a study to examine the applicability and utility of agent-based modeling (ABM) and related techniques such as data farming to the Joint Improvised Explosive Device Defeat Organization (JIEDDO) mission which is quoted above. The goal for this ongoing study was to address the following two questions:
- “Does ABM and data farming have applicability to Counter-Improvised Explosive Device (C-IED) questions and problems?”
- “How should ABM and related capabilities be applied to C-IED questions and problems?”
The answers to both “Does?” and “How?” may be different for different classes of questions or problems. As a result, part of the purpose of the ABM study was to provide analysts straightforward procedures to determine when ABMs might be applicable and what tools and experimental design is appropriate for their questions. The ABM study encompassed two components or phases: (1) an educational component to gain an internal understanding and capability in these processes; and (2) an analytic component to apply these processes to questions of tactical, operational, and strategic interest to C-IED efforts.
In September of 2009, the author organized an interagency workshop on agent-based modeling (ABM) and data farming. The workshop, which was implemented to support the study, had three goals: to examine the applicability of ABM and data farming technologies to hard C-IED questions; to educate participants in ABM-related methods, tools, capabilities and plans; and to identify data, capabilities, collaboration, and research needed to address hard C-IED questions. The focus was to advance technical methods that will support the C-IED effort. Participating organizations included intelligence agencies, the United States Department of Defense, national laboratories, federally funded research and development centers, and universities including the Naval Postgraduate School and George Mason. More than 50 modelers, analysts, and subject matter experts attended.
The workshop participants identified a set of specific questions and problems that could be addressed by agent-based models and data farming. The questions covered C-IED needs in various categories including: insurgent network evolution and adaptation; red-teaming and technical gaming; C-IED initiative assessment; and recidivism. The workshop established five teams, and produced 24 task plans that described the potential use of ABMs and other techniques to address relevant questions.
The authors used the forum of the International Data Farming Workshops (IDFW) hosted by the Naval Postgraduate School’s SEED Center for Data Farming and its international partners to begin to address the C-IED questions [6] over the period from 2009 to 2014. The output from the September 2009 C-IED workshop on agent-based modeling was reviewed, problems that could feasibly be addressed in a rapid prototyping process extracted, and experiments and experimental designs that addressed the C-IED questions were developed. The questions of interest focused on the following topics:
- Self-organizing graphs of data relationships
- Indirect network attack
- Identifying important link layers for impacting the insurgent networks in Afghanistan
- Define the concept of a “High Value Target”
- Emergence of insurgent cells
- Emergence of insurgent networks
The scope of related techniques of interest for addressing these study topics included: agent-based models and modeling environments; social networking analysis tools; data farming tools; and analysis and visualization capabilities for model outputs, especially in the context of Social Network Analysis (SNA).
2.2. C-IED and Social Networks
Within insurgent, IED-using networks there are two of interest: IED Emplacement Networks (consisting of personnel that is directly involved with IED usage) and IED Enabling Networks (consisting of communities that indirectly support the IED Emplacement networks) [7]. Significant effort has gone into examining and impacting IED enabling networks including Carley [8], Reed [9], and Carley, Dombroski, Tsvetovat, Reminga, & Kamneva [10]. IED Enabling Networks were being addressed in the macro country-level by Human Terrain activities such as Eldridge [11], Golinghorst [12] and Silverman [13] and modeling efforts such as TRAC Monterey’s Cultural Geography Model [14]. Previous modeling work on terrorist network recruitment processes [15] with Mark Sageman indicated the potential ability to experiment with factors associated with the recruitment into insurgent networks. The experiments that had been undertaken are aimed at gaining a rudimentary understanding of the social and social network processes that drive recruitment into insurgencies and insights into methods of impacting these processes.
SNA techniques were explored by the team in detail to determine which Measurements of Effectiveness (MOEs) would be most beneficial for analyzing the types of networks produced by our agent based modeling. This would allow a preliminary exploration of questions regarding C-IED—including insurgent network evolution and adaptation.
These are some of the hard IED questions related to attacking the network:
- What do insurgent networks look like? Who is in the network? Who is not?
- How do we distinguish networks that should be attacked vs. networks that should be attritted vs. networks that should be co-opted?
- Will removing specific nodes destabilize a network? What are the 2nd and 3rd order effects? What are the potential unintended consequences?
Given that a network perspective is a primary component of the questions, decided to start looking at network analysis and visualization tools within the context of an abstracted “insurgent” scenario in an agent-based model. These tools may provide insights into C-IED topics of interest such as “Emergence of Insurgent Cells.” The effort started with some simple networks to understand the issues and the intent was to progress to more complexity in follow-on work.
Why networks? Networks are useful representational schemes for understanding relations and interactions between agents (in the case of the examined models, individuals) and events. Types of relations between two or more agents include such things as similarity (homophily) or spatial (distance) comparisons. Interactions might include events such as sensing or shooting, or other acts between agents. A network (graph) visualization view, by using a different representation of relational data, has the potential of aiding the discovery of underlying relationships that are hidden from other techniques, yet complements those techniques at the same time.
Understanding social networks, their nature in insurgencies and IED networks, and how to impact them, is important to the C-IED battle. These experiments explored methods of extracting, analyzing, and visualizing dynamic social networks that are inherent in agent-based models in order to build tools to examine and manipulate insurgencies.
Initial experiments were aimed at simply demonstrating the ability to extract network data from agent-based models that did not have explicitly defined networks. This initial set of experiments, undertaken in a modeling environment called Pythagoras, were followed by basic clique creation experiments as the initial basis of the investigations to examine the types of network statistics that can be used as MOEs and as pointers to unique and emergent behaviors of interest.
2.3. Pythagoras—Test Environment for Data Farming Network Analysis
Pythagoras [16] is an agent-based scenario model editing and execution application. It also comes with a graphical user interface, which provides the user the ability to build very simple or very complicated experiments. Although Pythagoras was designed with combat scenarios in mind, it is arguably more generalized than many other ABMs and focuses more on the intangible, human factors, and entity interaction aspects of scenarios. Pythagoras has been used for many combat and noncombat related studies including: Littoral Obstacle Clearing [17], Social Development of Terrorists, Environmental Studies, Thermobaric Weaponry, and analysis of various historic battles [16].
Pythagoras’ interface allows the development and manipulation of terrain, agent hierarchies, and hundreds of input factors. It is developed in Java and includes a batch command line version for data farming. Pythagoras runs are instantiated with two separate random seeds: one for initial conditions and one for stochastic agent interactions. Experiments are fully repeatable by re-using the seeds. Pythagoras was developed so that agent populations and agent rules and parameters can be instantiated with a probabilistic distribution. For example, an agent class may have a “maximum speed” attribute. Typically, agents instantiated would all have the same single value for this attribute. Pythagoras’ “soft logic” allows the attribute value to be assigned a range and a distribution so that non-homogeneous populations can be generated. Similar statistical distributions can be optionally applied to decision logic.
Pythagoras also implements a unique representation of agent inclinations. A Pythagoras scenario can have a multi-dimensional spectrum of “sides” with agents able to realign themselves across this spectrum to migrate to different factions as their “personality” changes due to events and triggers. This inclination modeling capability allows Pythagoras to uniquely and simply represent “personalities” that evolve with inter-agent interactions and that affect behaviors.
Pythagoras produces end-of-run output and time series data of movement, interactions and events on a regular time step. Additionally, though, Pythagoras has the potential to produce time series of node and link network data, a common structure that represents network interaction.
2.4. Data Farming Models and Social Networks
Pythagoras became a basic tool during the workshops for developing methodologies to data farm and analyze scenarios. The need to establish basic capabilities and test established network analysis statistics and methods in the context of parameter-driven experimental designs and data farming became the focus of the ongoing effort, which extends to today.
Some of the basic concept experiments that were used to test and prototype basic network data farming methods included: the Lost Boys, the Peace, the CliqueCreator, and the Village scenarios.
2.4.1. The LostBoys Scenario
This scenario, based on Sageman [15] concepts of terrorist cell recruitment of young men, instantiated the concept of terrorist emergence and recruitment. Young males leave home to go to university and find themselves in an environment that allows them to become associated with new groups and ideas without the tempering influence of family. “LostBoys” start in purple (part red, part blue) range. In this case, red and blue are proxies for predilection to violence and sociability. They can change based on interaction with Population, Family, and other LostBoys. LostBoys tend to move toward, and thus interact more frequently with, other LostBoys of similar sidedness. Once together, the group “cohesion” is enhanced by continual reinforcement of sidedness. The Population (grey) can infuse LostBoys with random sidedness providing some variation. Family members can reinforce the original color of the LostBoys if approached. Family agents can revisit on a periodic basis that can be adjusted in the model. A variety of excursions of this scenario were examined using a set of color “inclination” tools developed. The scenario, shown in Figure 2, examines formation of tight groups of LostBoys and the likeliness of reinforced behaviors. On the right, the dark center region represents “university,” the pale region at the top represents “home,” and potential recruiters of very strong red-blue “viewpoints” can be found in the four corners.
Figure 2.
Spatial view the LostBoys scenario. Color definitions are in the text.
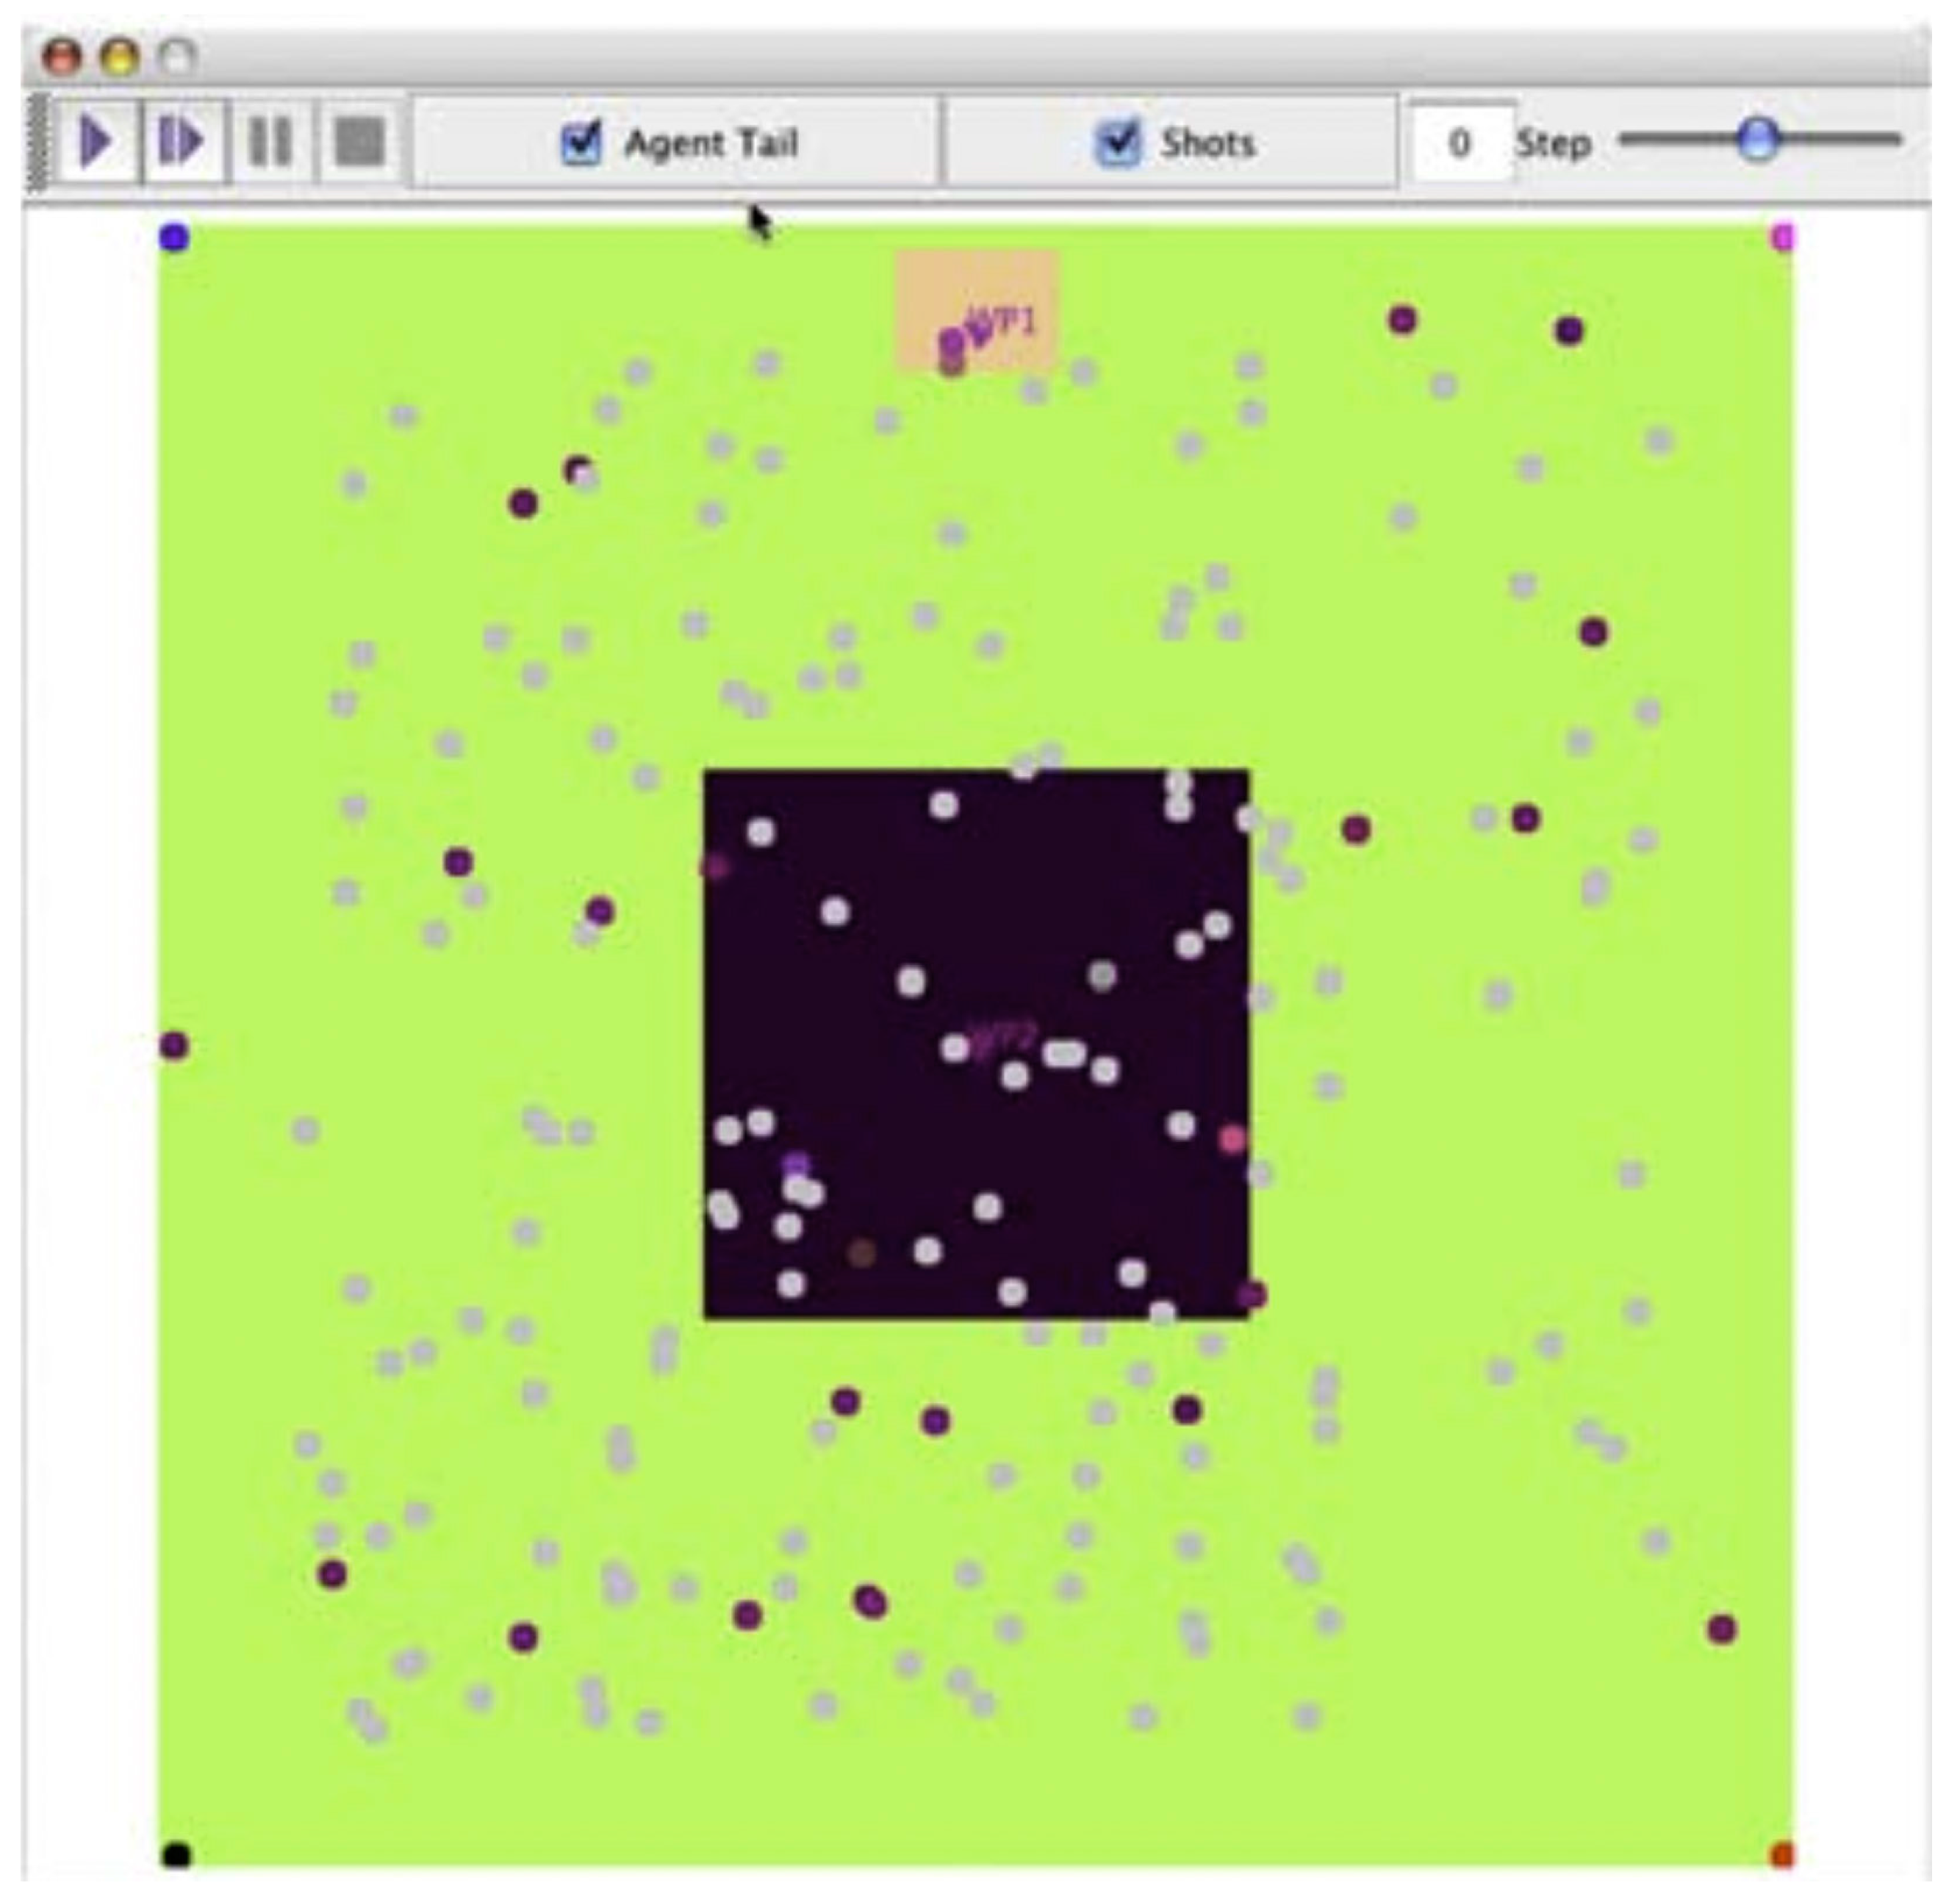
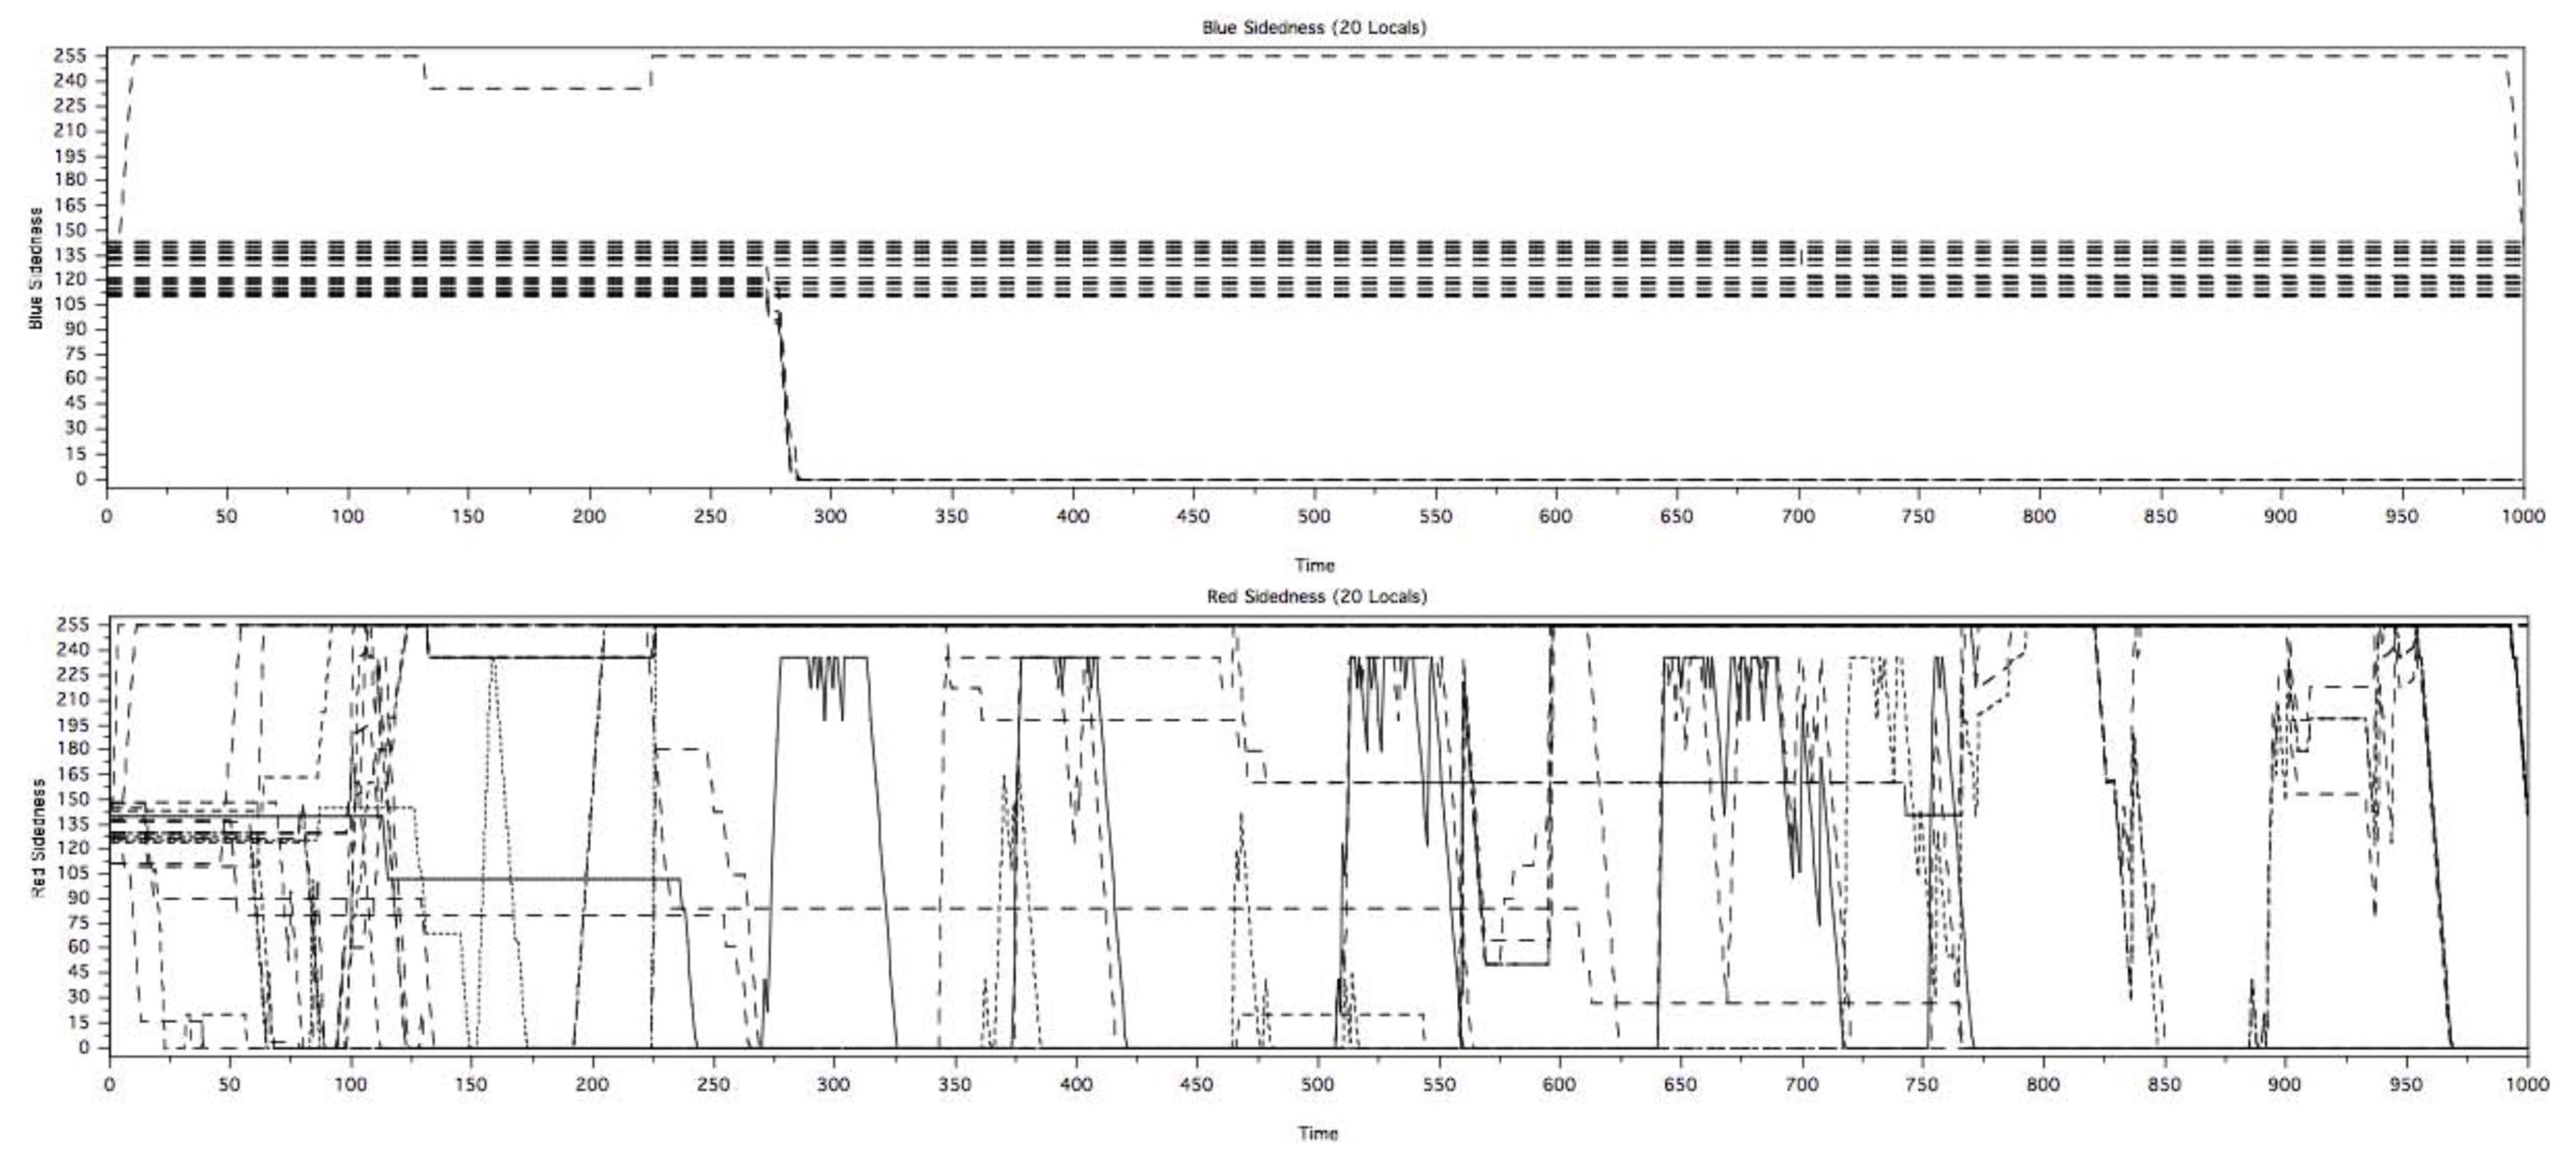
Figure 3 shows views of the state of the personality attributes over time. The Clique scenario in Pythagoras demonstrates Sageman’s view of marginalized potential recruits being subject to various competing influences, but being overwhelmed by the peer pressure that comes about during the formation of cliques. All of this analysis was done purely from the perspective of the n-dimensional “personality” space that is represented in Pythagoras using its “Sidedness” parameters.
Figure 3.
Time series of color change in the clique Scenario.
Although these plots provide some insights into the personality changes in the agents, it did a poor job providing insights into how the relationships of the agents changed and affected the personalities. It was decided for a future workshop to examine the ability to use network analysis to examine the state of the model with time.
2.4.2. The Peace Scenario
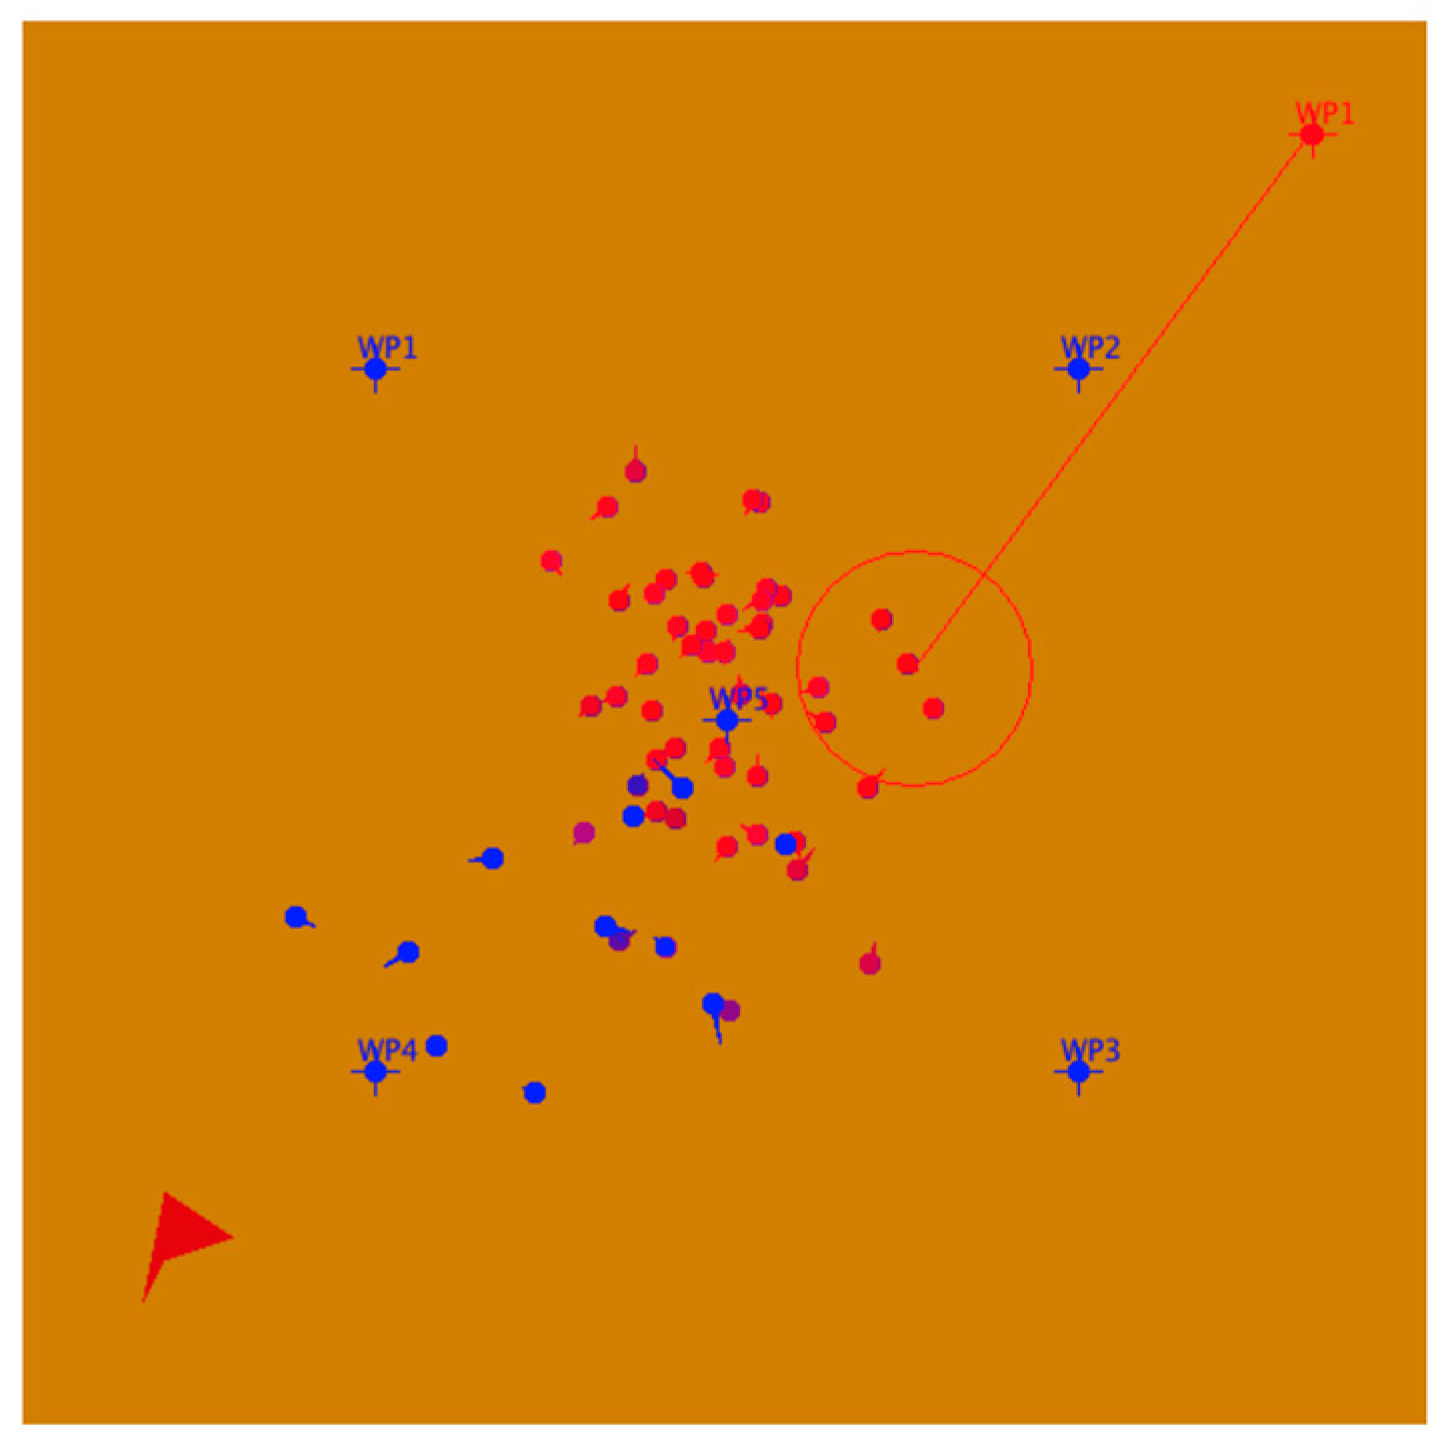
The “Peace” scenario is a very simple model provided as part of the Pythagoras distribution. The scenario is composed of a single red Instigator (top right of the figure) with a weapon called “Loudspeaker,” a population of 50 purple Locals (starting centered in the figure), and a small blue force of 10 Marines (starting in the bottom left) with a weapon called “Hershey Bar.”
A snap shot of the scenario is provided in Figure 4. At each time step, the red Instigator broadcasts a message that changes purple Local agents within the wide range of the broadcast by making them more “red” and less “blue.” Concurrently, blue Marines move around and interact with purple Locals within their range using Hershey Bars, making them more “blue” and less “red.” Marines must be close to the Local agent to allow interaction. These interactions have a random component, so that the competition between the red and blue messages affects each Local agent differently.
Figure 4.
Pythagoras “Peace” Scenario spatial view. Blue represents Marines, red the Instigator, and shades in between are Locals.
Figure 4.
Pythagoras “Peace” Scenario spatial view. Blue represents Marines, red the Instigator, and shades in between are Locals.
As the Local agents are affected by the Instigator and Marines, their “personalities” change which can in turn change the agent’s behaviors. This first data farming experiment was defined to answer capability rather than application-oriented questions: Can dynamic network data be extracted from an experiment that was not explicitly designed for network analysis? How do networks evolve in agent base models? Can new insight be gained by examining these extracted networks?
A very basic approach was used to begin to address these questions. Assuming that an agent-based simulation produces a time-series of state data and MOEs, data farming tools and methods need to allow the analyst to conduct tests to:
- Detect the presence of a network or networks
- Distinguish different networks and different classes of networks
- Determine when networks achieve equilibrium
- Determine what model inputs have significant impact on the state and behaviors of the network
- Examine the utility and approach of applying specific SNA statistics, methods, and concepts using the data farming output
- Establish whether specific network attributes correlate with models MOEs, and
- Delineate the data requirements for the various types of networks that might be extracted from modeling.
The intent was to develop and document software and processes for applying these capabilities to detecting and analyzing emergence and evolution of networks. Because the questions were primarily capability-oriented, it was decided that the experiment should use “personality” attributes that are impacted by events and interactions, be simple (representing few agent classes), and include movement and interactions so that personality (homophily), position (proximity), and interaction (communications) could all be examined [6].
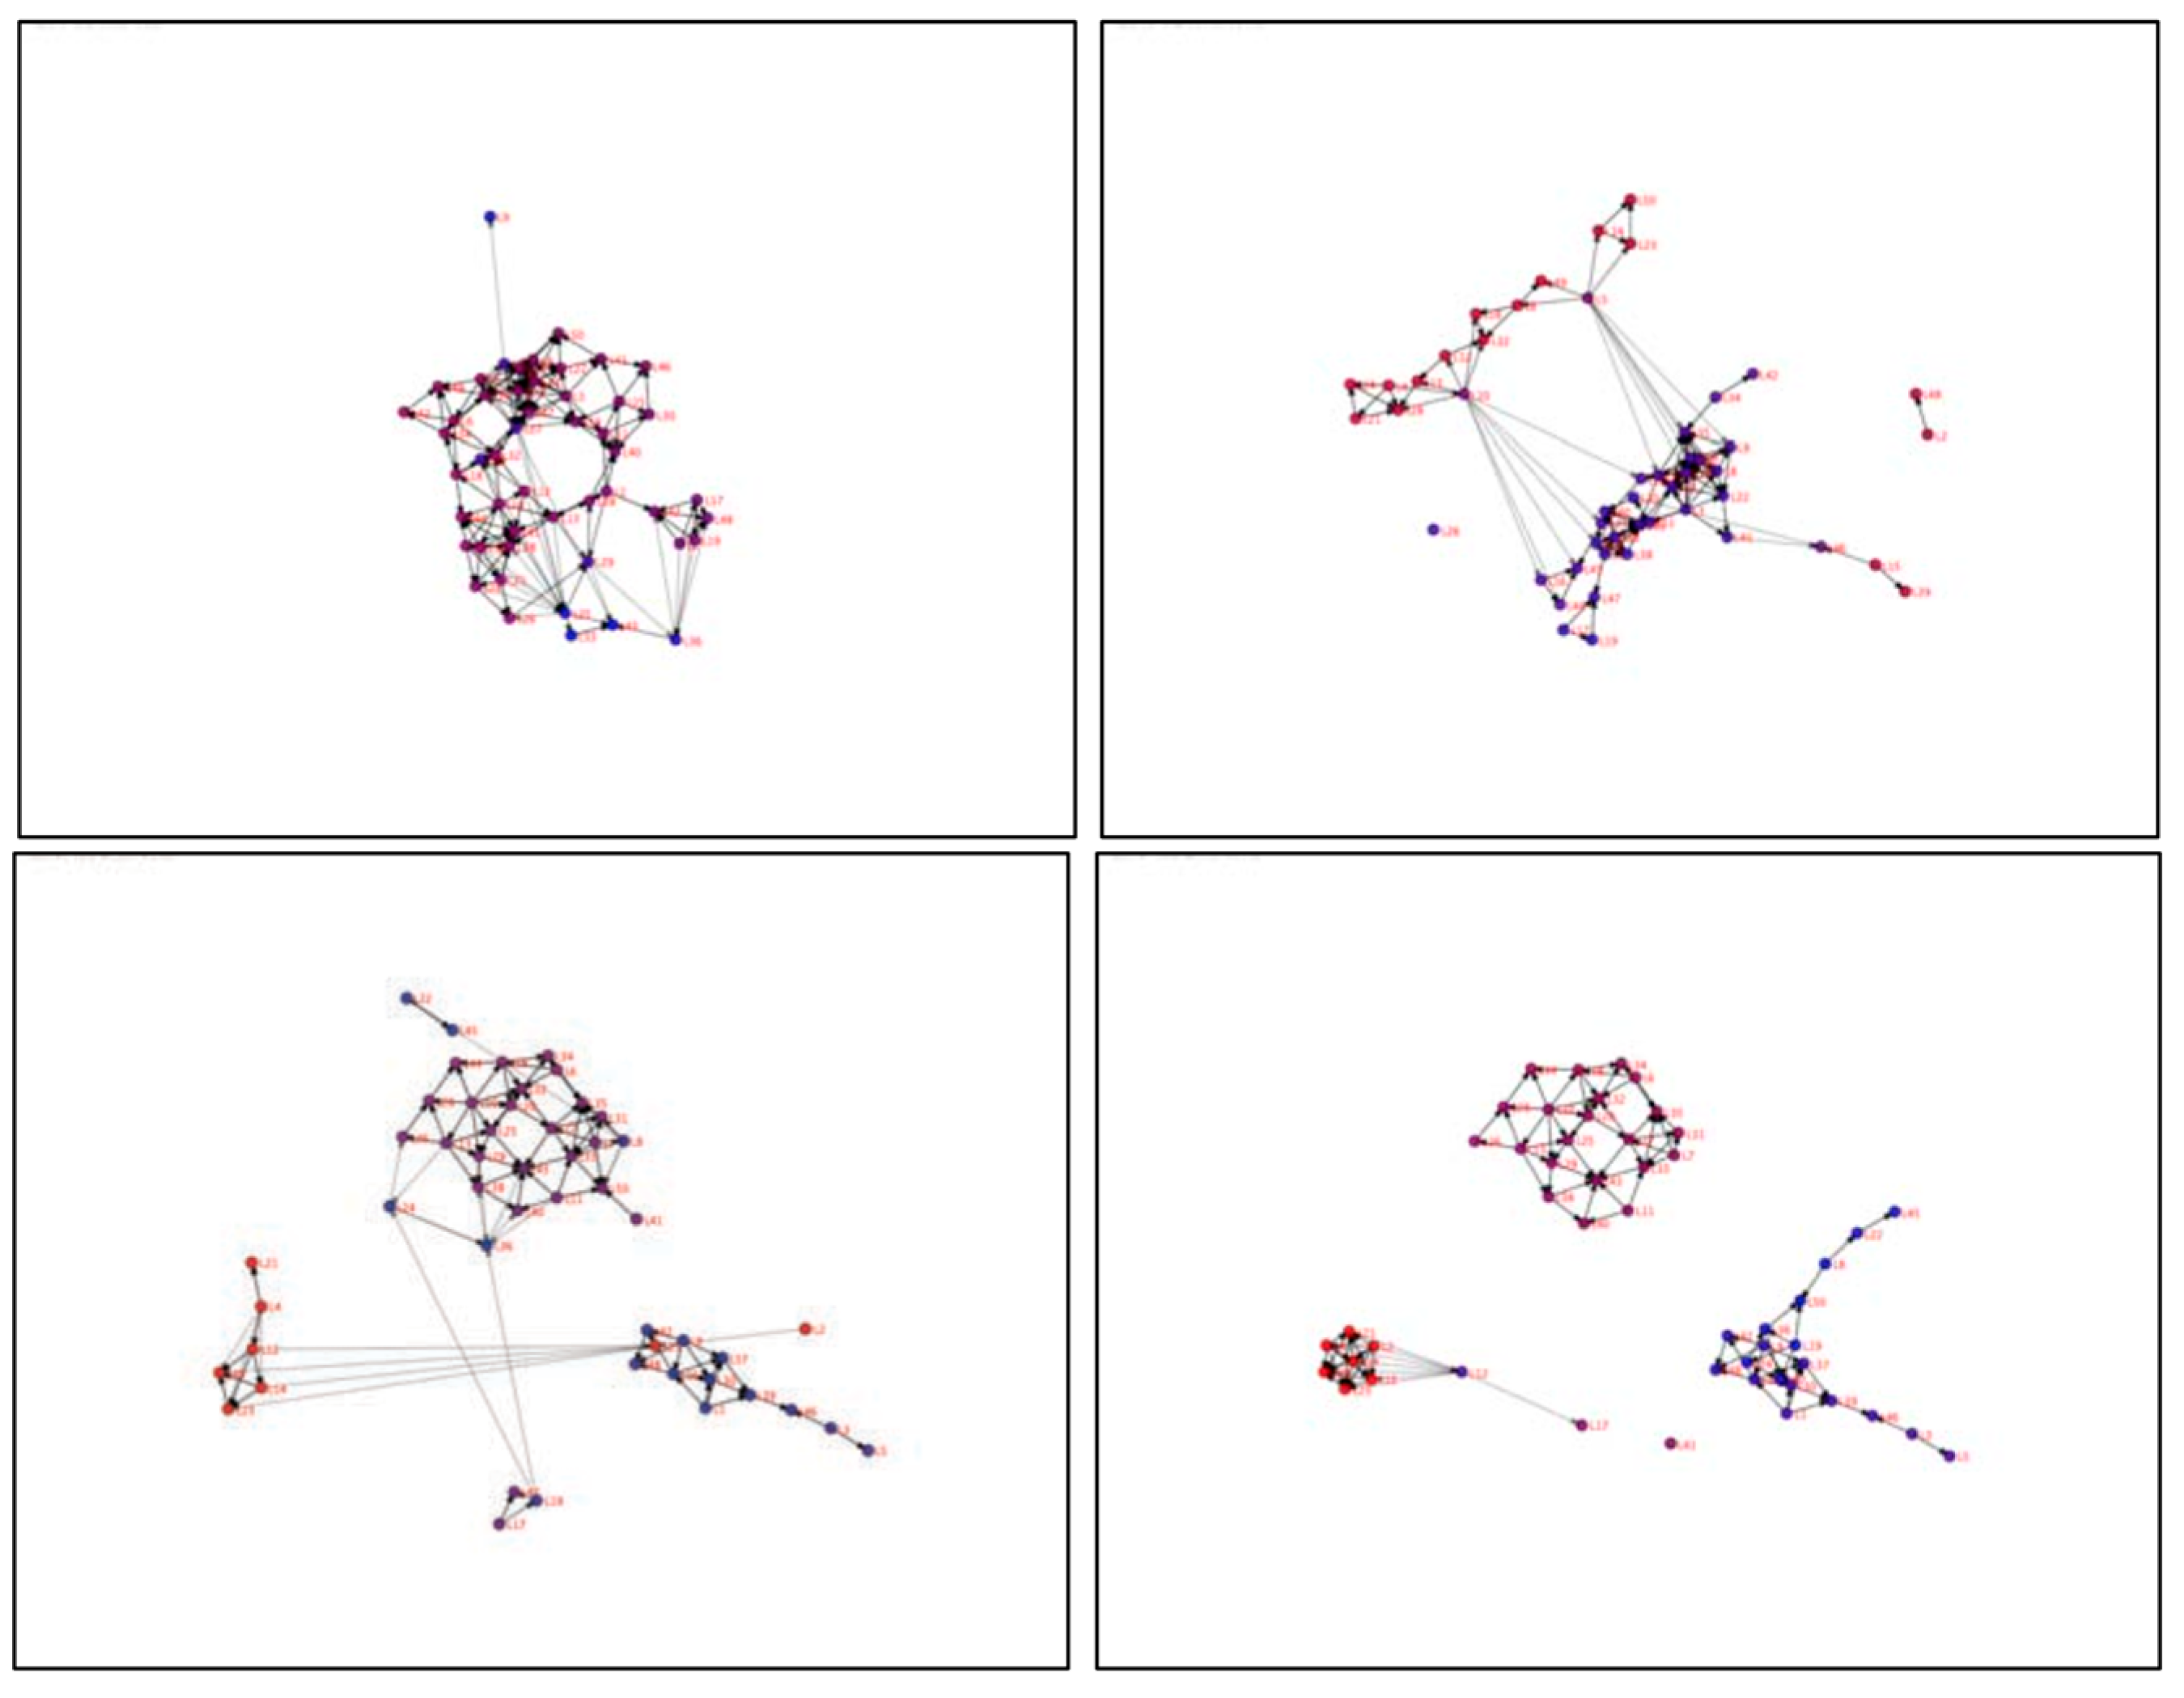
The Peace Scenario was highly successful. Figure 5 is a series of four snapshots showing the evolution of the network homophily network among the Local agents as it evolves based on interaction with the Instigator and Marines. Significant and changing network features and attributes such as cliques, components, path length, and diameter were extracted across an entire data farming parameter space. The simple experiment demonstrated the ability to extract network attributes, visualize and analyze network features through an experimental design, and show correlation between aspects of the network and the model outcomes. Surprisingly, very simple agent behavior generated unique and complex evolving networks.
Figure 5.
Snapshots from four timesteps of a dynamic network view of the “Peace” Scenario.
2.4.3. The CliqueCreator Scenario
The illustrative “CliqueCreator” scenario was developed to establish a highly simple dynamic network generator using Pythagoras’ “relative” color change capability as a tool for experimenting with SNA extraction and analysis. CliqueCreator has a single agent class with 100 instantiated agents that are uniformly distributed across Pythagoras’s red and blue color spaces. The agents’ only “weapon” is “Chat” which enacts a relative color change on other agents with which the agent interacts. As the scenario is executed, entities move through various color states, becoming more red or more blue depending on the interactions with other red or blue entities. States will change depending on whether two entities engage in “chatting” and form a connection. The more any two agents interact, the more “alike” they become.
The CliqueCreator scenario provided the initial context for data farming experiments and continued capability development efforts. The focus of the scenario selection was to represent dynamic homophily, communication, and proximity networks and use the results to explore the various network analysis methods and tools. Multiple excursions and replications of the Pythagoras-based CliqueCreator scenario were used to produce the data for analysis with the candidate tools. CliqueCreator provided a simple basis to experiment with various SNA measures and analysis techniques.
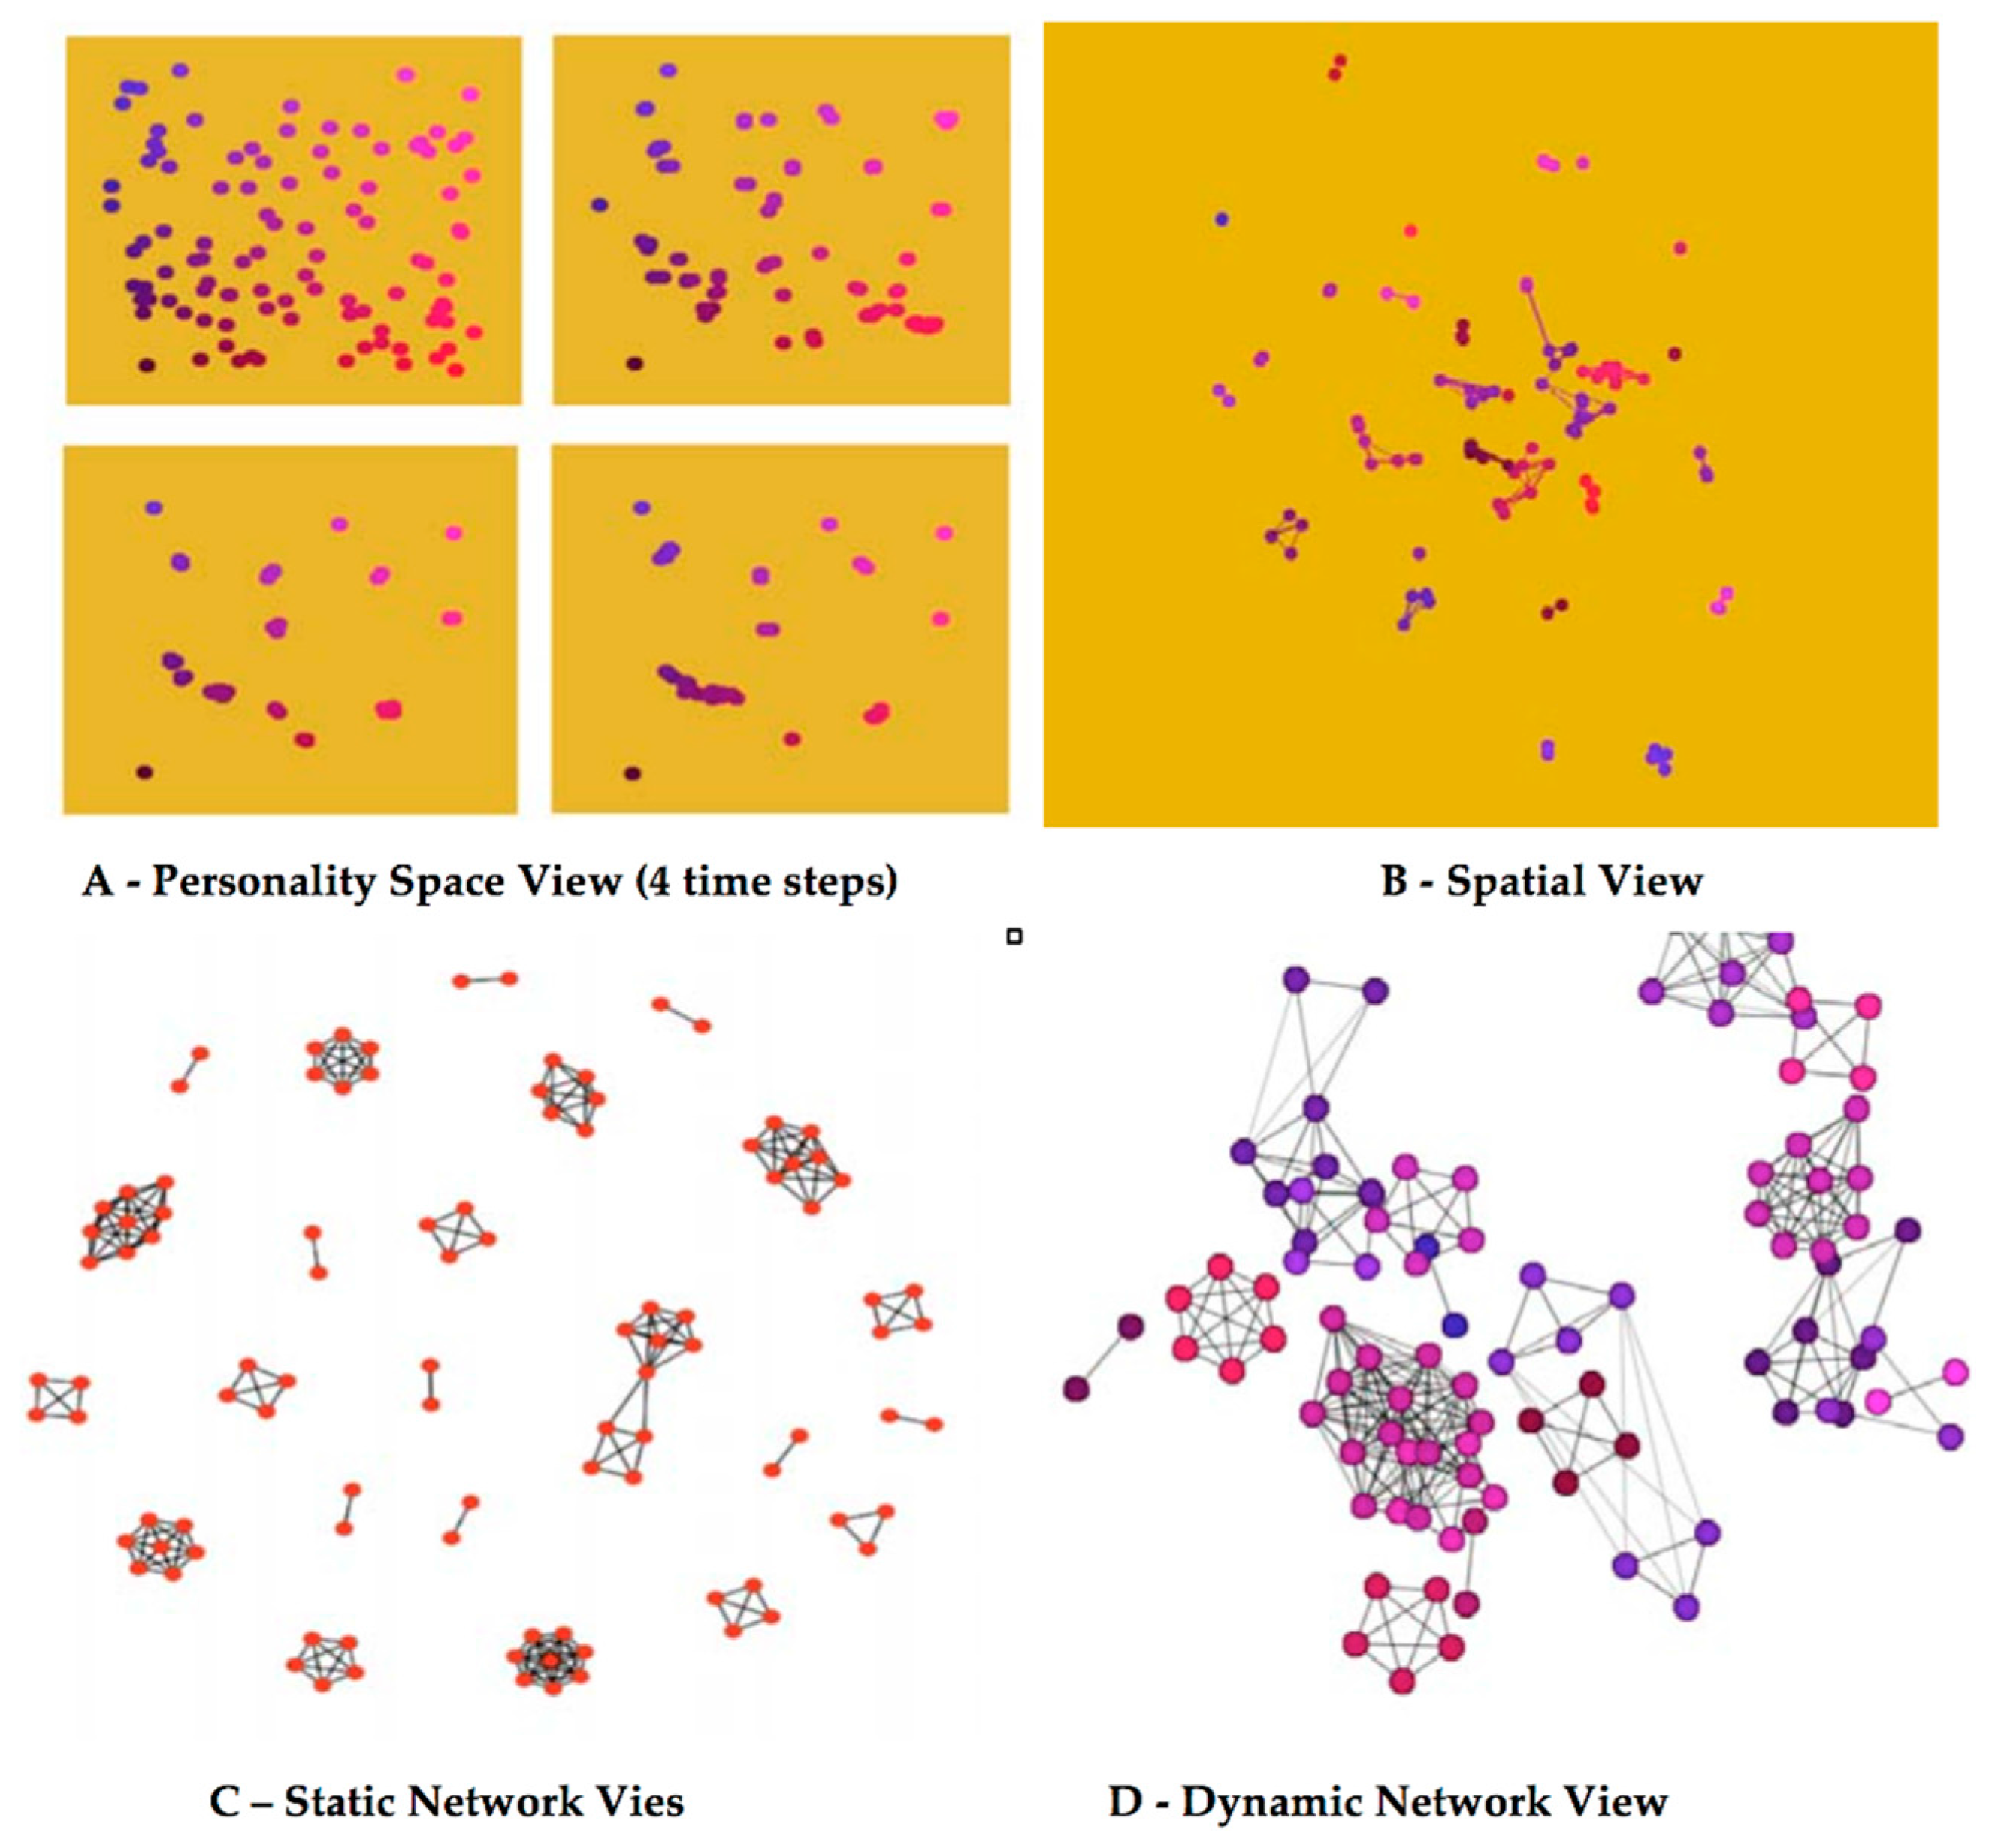
Figure 6 demonstrates basic network visualization views derived to view the scenario. A spatial view showed the physical relationship between entities and where connections or bonds were formed. The “personality” space view displays the entities by relative location in colorspace. This colorspace view is used to illustrate the homophilic state of the participating entities in the simulation. Figure 6 shows “snap-shots” from four different views of this model using different attributes and methods to show changes in agents and their relationships. As “cliques” emerge and evolve, their movement may result in interactions with other cliques, resulting in “theft” of members and large-scale movement in “personality” attributes.
Figure 6A shows a view of the animated movement of agents in the color-based “personality”-space. This figure shows four time-steps of this view. In the image the location of the agents is based on their location in color space. The “redness” (0–255) of the agent is represented on the x-axis. The “blueness” (0–255) of the agent is represented on the y-axis. As the scenario proceeds left to right, top to bottom, the agents congregate into color groups. These groups do not represent the cliques formed though, because the spatial aspect is not represented.
Figure 6B shows the more traditional spatial view with interaction shown as lines (edges). The figure shows the agents at a time-step midway in the scenario. “Chats” are shown as lines between agents. This view, though, focuses on the location of the agent spatially.
Figure 6C,D represents the same agent network, derived from the CliqueCreator scenario, using social network analysis “layout” generated by the R SNA plug-in and SoNIA software packages. Figure 6C shows a traditional network view of the agents in a homophilic sense using the Personality. 6C shows a static network layout representation of one of the CliqueCreator time-steps using the default R SNA package default layout algorithm. The SNA R package plots each time-step independently, not accounting for the layout defined in the previous time-step. As a result, the dynamic evolution is difficult to examine.
Figure 6.
Four Unique Visualizations of the CliqueCreator Scenario. A to D are described in text.
Figure 6D shows a snapshot of dynamic view produced with SoNIA. It should be noted that neither Figure 6A,C,D represent the spatial data shown in Figure 6B in any way. The “physical” location is ignored in these representations. In Figure 6A location represents color and in Figure 6C,D the location is purely a function of the layout algorithm, which is designed to optimize the display of the network, not the spatial location.
Part of a toolset to examine social network dynamics is the ability to analyze the ongoing agent interactions, behaviors, and network responses. Co-visualizing the various aspects (layers) of network dynamics can potentially provide powerful insight into the network, as shown in Figure 6.
Part of the intent of this experiment is to begin to understand the utility of various SNA statistics as data farming measurement of effective output. Step one in this process is to delineate which outputs and analysis methods provide insight into network evolution and impact on agent behaviors.
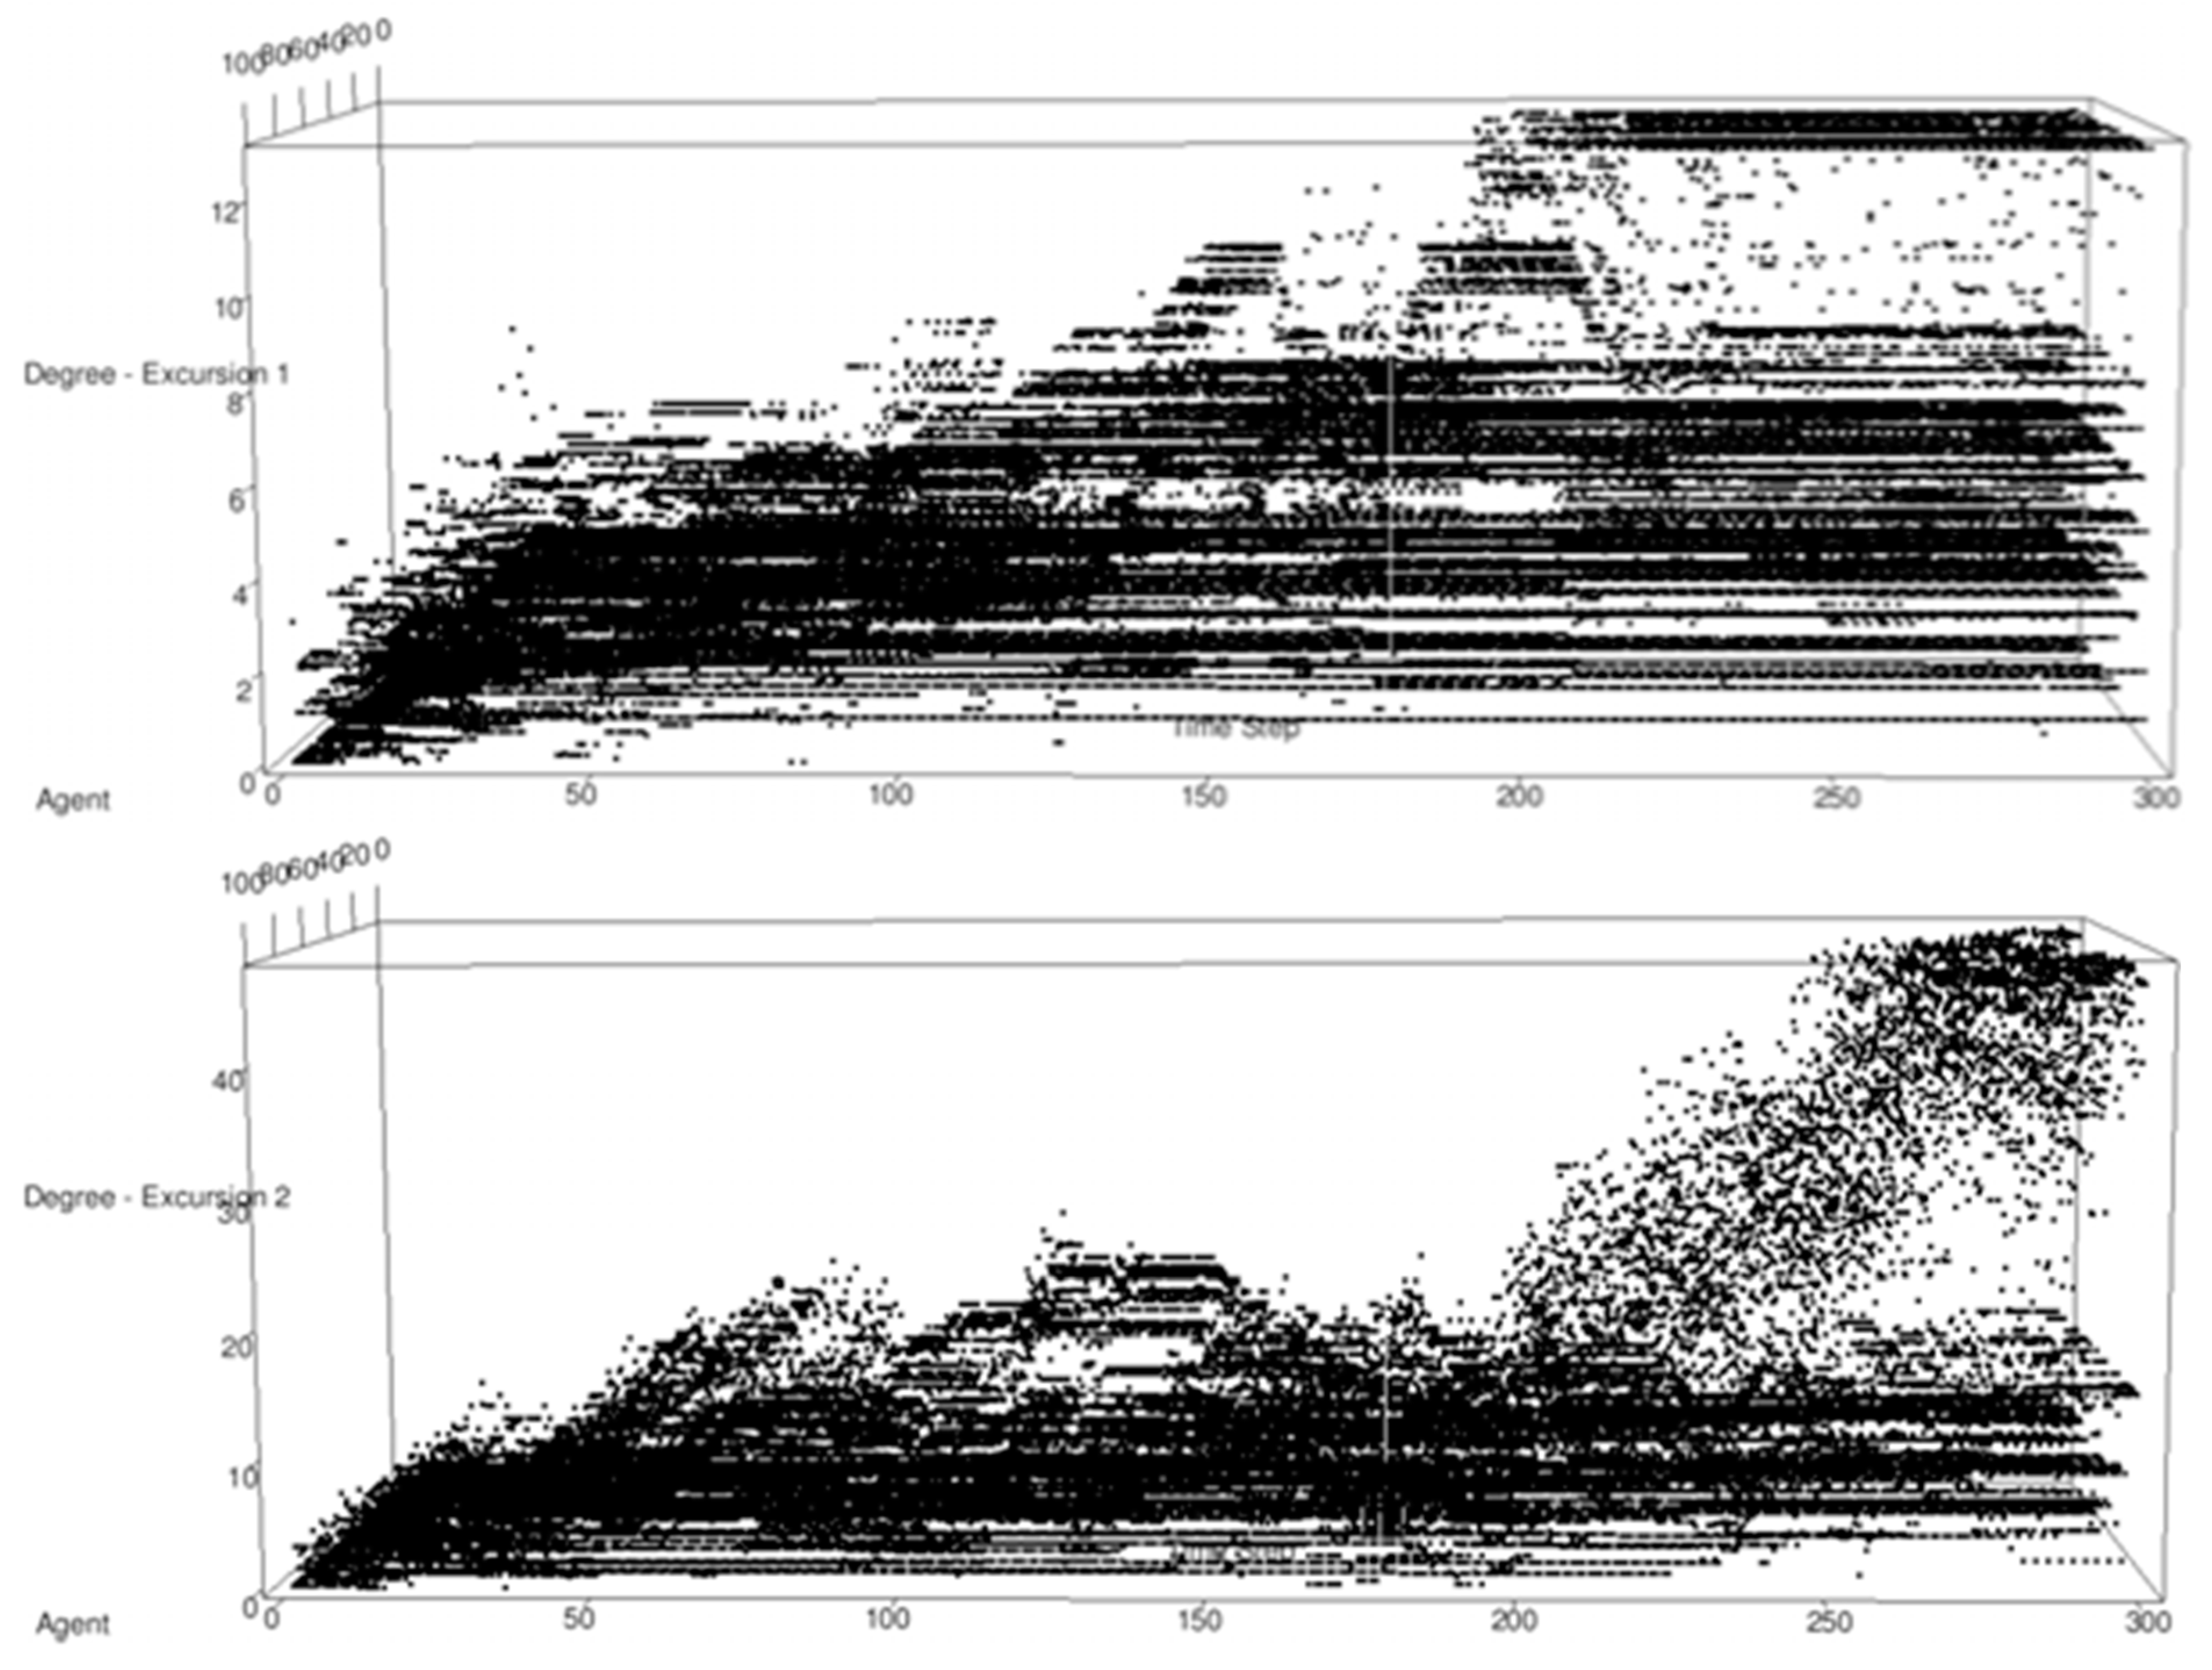
The initial focus was on node statistics and time-series output of betweenness, eigenvector centrality and degree. These values were generated for every node during data farming. Although data for 27 excursions of data farming was collected, it was decided to initially compare three excursions, where the primary variation was the color distance that defined what is considered a friend (a homophilic link).
Figure 7 represents executions of excursions 1 and 2 using a data farming design space. The plots represent the degree of each of the 100 agents over time. The vertical axis is degree (the number of links associated with a node), the horizontal axis is time, and the axis going into the page is agent number. In Figure 7, various pattern differences, related to the evolution and devolution of cliques and components are evident. There are obvious differences between the excursions, with excursion 1 (top) appearing to reach convergence, but 2 (bottom image) never converging in terms of the number of components. It can be seen that some agents reach a steady component state and maintain it for some time, while other groups of agents participate in behaviors, which lead to the growth and reduction of degree for groups of agents.
Figure 7.
CliqueCreator excursion time series. Two excursion described in text.
The CliqueCreator scenario was used to begin asking and answering questions about how the agent’s personalities changed the emergence and attributes of the network and how the method to define the network (agent proximity, distance in personality space, or number of communication interactions) impacted the analysis. CliqueCreator was used in subsequent workshops, in conjunction with controlling the initial population attribute distributions to examine how population variations affect network attributes and evolution.
2.4.4. The Village Scenario
The purpose of this experiment was to model and analyze a real world problem. The author queried subject matter experts in the Afghanistan theatre of operations and was provided anecdotal commentary on the effectiveness of Marine Corps Female Engagement Teams in impacting local village insurgency recruitment. This feedback prompted the generation of related tactical-level questions: How can Coalition Forces impact insurgent and Afghanistan IED network recruitment? Are the attributes of village social networks important factors in the tendency for individuals to employ IEDs? How do Female Engagement Teams (FETs) impact the IED network?
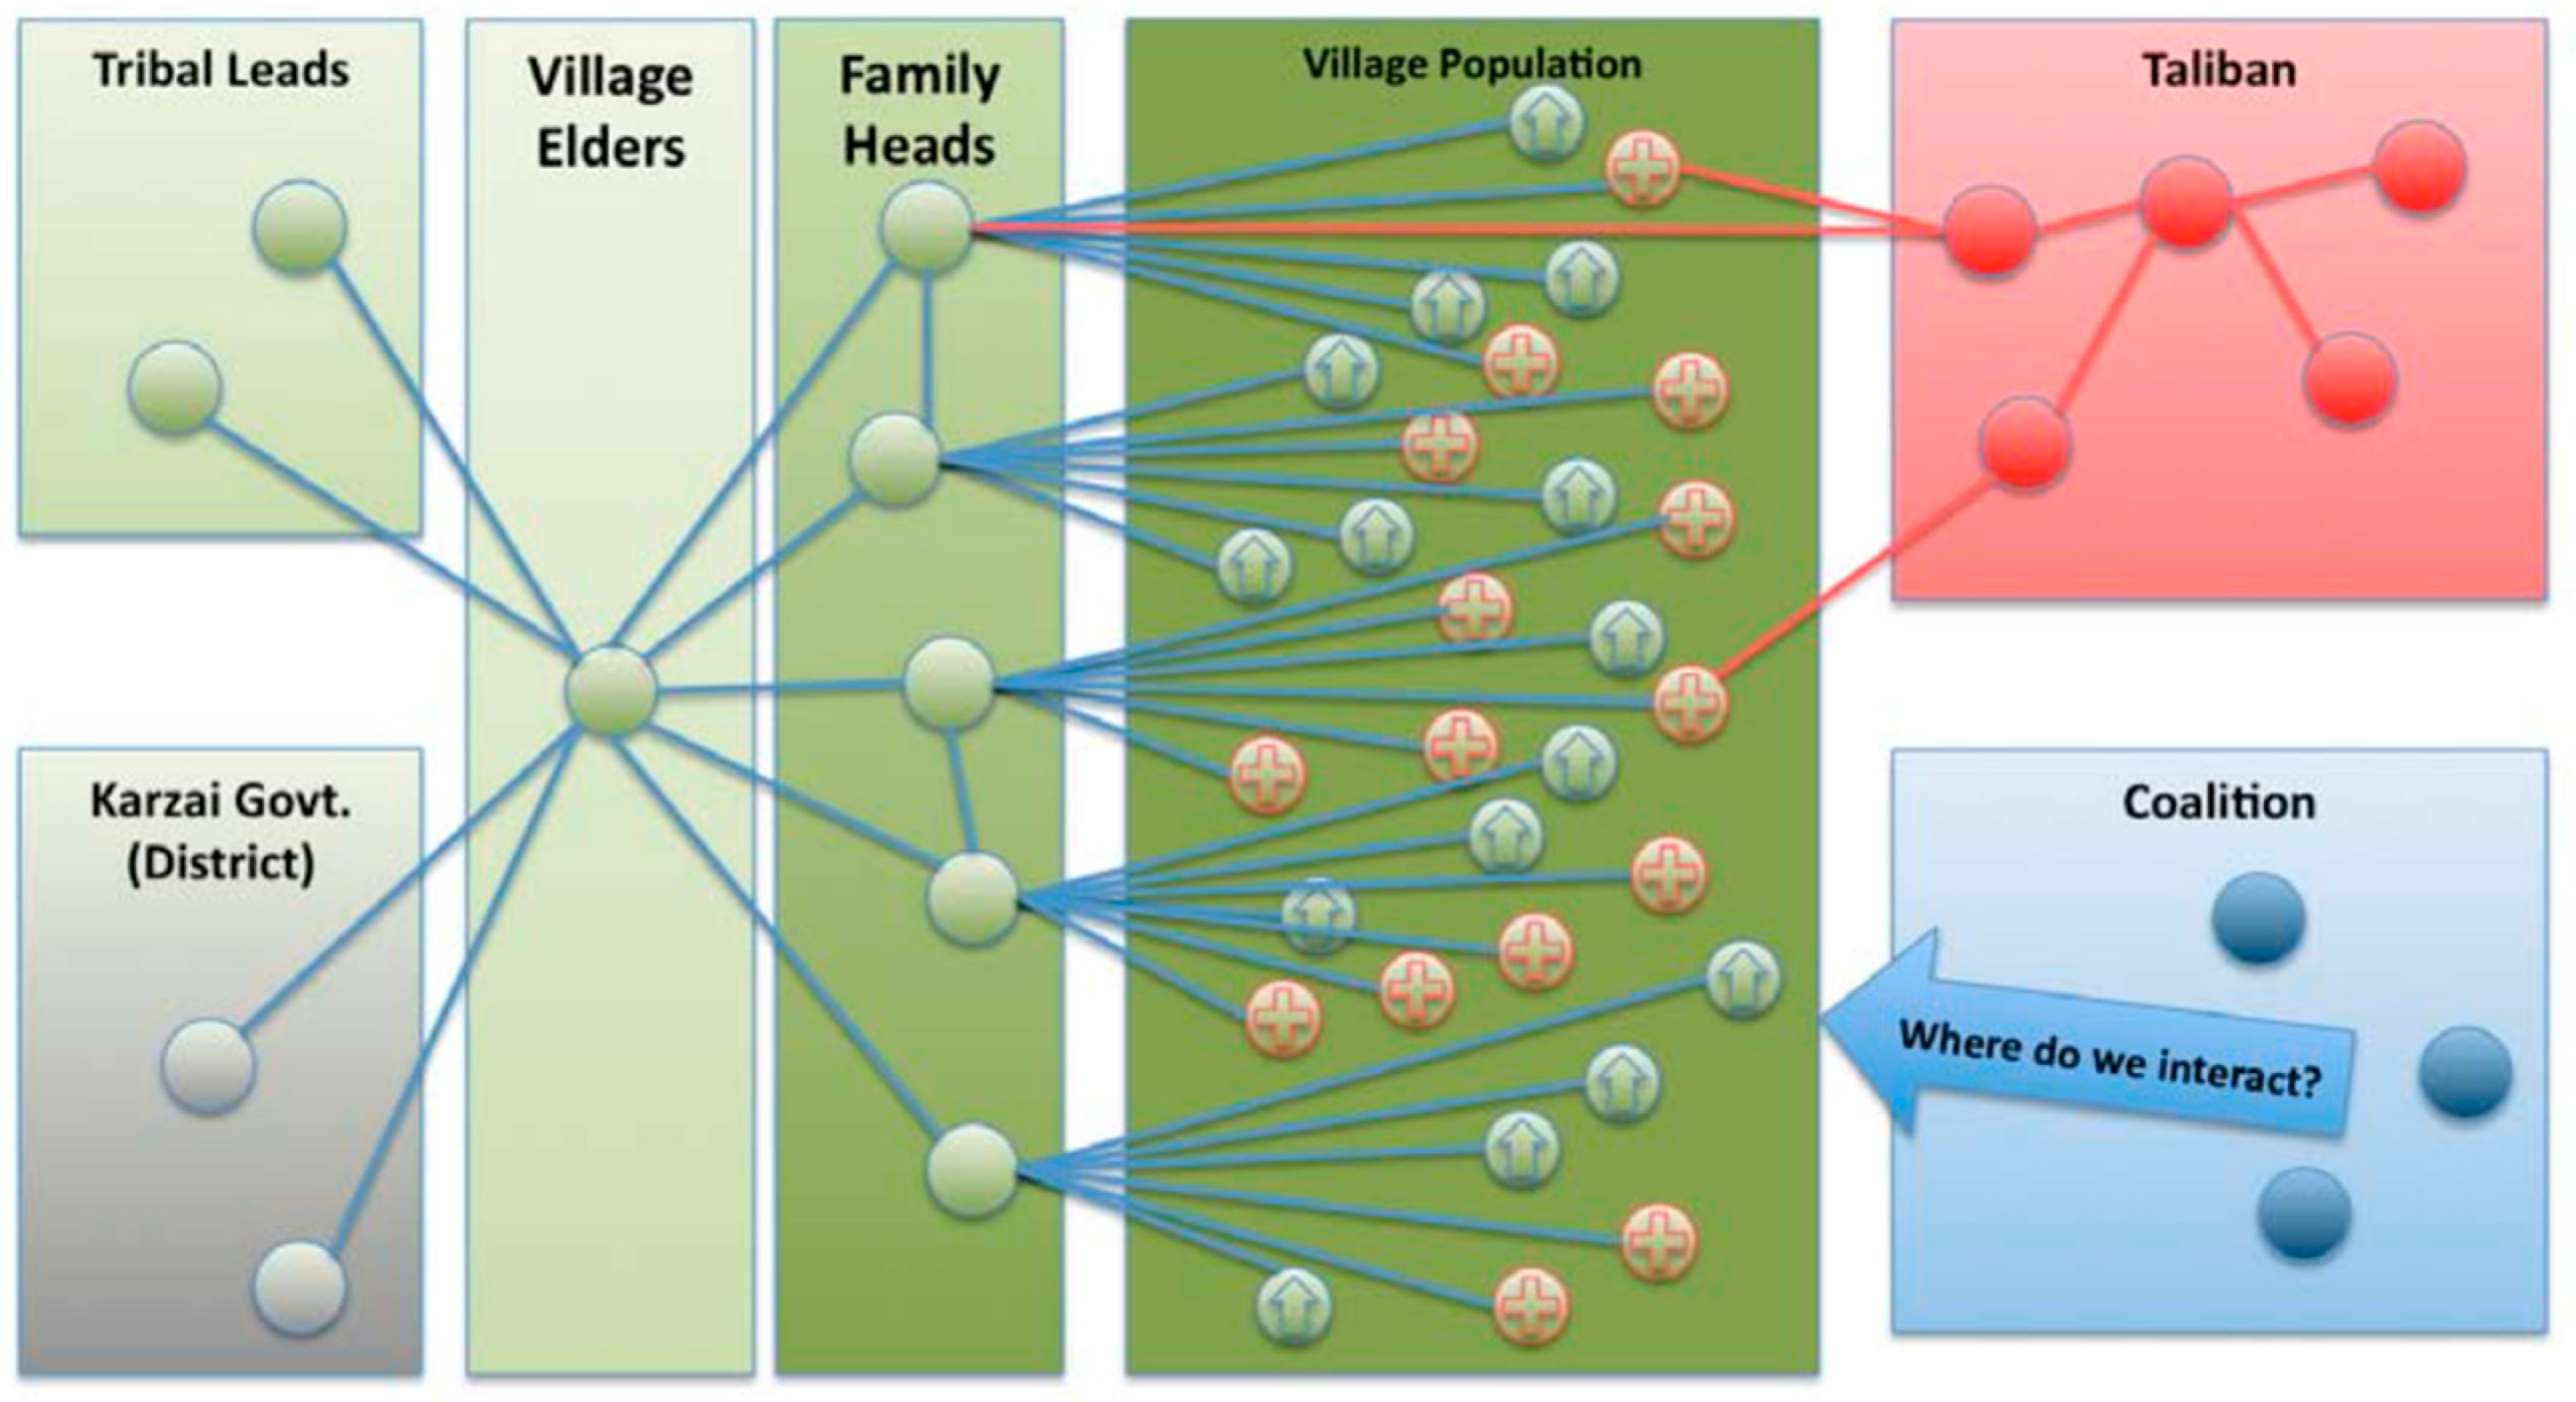
Analysis of these questions led to a desire to build a scenario that would evolve to addressing these questions. First, though, some basic understanding of the time scale of the problem and how that time scale would transform into model space was required. How is the rate and extent of diffusion of ideas, attributes, and personality attributes (“memes”) affected by the implementation of different daily interaction environments (e.g., sexually segregated work vs. family)? What is the diffusion rate for ideas (“memes”) passed by FETs inserted into the female networks compared to the overall population? What is the diffusion rate for ideas passed by Taliban teams inserted into the male networks compared to the overall population? Figure 8 represents the set of networks, hierarchies and relationships that are the target make up of an “Afghan Village” scenario [6].
Figure 8.
CliqueCreator excursion time series.
An existing Afghani village, Kace Satar, was examined and will be used as a basis and target for ongoing scenario development. This village is at the intersection of the Helmand, Farah, and Nimroz provinces in Southern Afghanistan. The population within a 7 km range is approximately 300. The specific distribution of population classes is currently uncertain, but discussion with subject-matter experts (SMEs) indicates that the social interactions and hierarchies shown in Figure 8 are of significance and have real impact on potential recruitment. These networks include:
- Village Family Leadership and hierarchy—Although the family leadership and relationships are primary, they can be subordinate to broader and external Tribal leadership. These “command” structures can be hierarchical or matrix but can also be considered somewhat stable. Removal of some central figures can cause significant change to the overall network structure.
- Taliban—The insurgents can be completely independent of the other hierarchies and maybe working in opposition to tribal and family goals.
- District—The Karzai leadership and judicial structure is also independent of the tribal and family structure and also may be in opposition to tribal intent.
- Young males (recruitment age)—Some research has indicated that there are specific personality attributes that can affect the likeliness of recruitment into insurgent behaviors. Eventually, these can be considered as potential “Personality” attributes for young male villagers. Some of these attributes might include: Status (degree of recognition desired); Thrill (desire for adventure); Revenge (outlet for frustration); Identity (need for belonging); and Money (survival).
- Village Women/Village Men—Women have influence in Afghani society. This influence is not generally exercised in public, however, but through interaction with family.
The experiment focused on an implementation of a preliminary representation of the day-to-day periodic relationships of men, women, and families in the Afghan Village. A six family scenario (180 agent) that establishes a “daily” period of home to work (100 time steps per cycle; 8 “days”), where work is segregated by gender was developed. Each family is represented by an attribute range and “FamilyTalk” and “WorkTalk” interactions can change a non-family “personality” attribute relative to the color of two agents interacting.
Initial results from this experiment were consistent with real-world assumptions about the relative time frame of the model versions. Adding work interactions has significant impact on the speed of convergence (full distribution of the “meme”) to the family-only scenario. Depending on the number, consistency and communication parameters of the FETs, the model showed a large variation in the speed with which convergence might occur.
This experiment was initially data farmed over variations in the parameters that affect the women’s network density, in this case the range of the “chat” communication and the distance in “personality” space that is considered to be a link. The time to convergence and pervasiveness of a message injected by a FET is examined visually over the variation to the parameters. As expected, the higher density female network resulted in the message being more pervasively distributed, more quickly into the male network.
The intent of this experiment was to begin building the very basic components needed to consider a more complex Afghan Village model. The results of this experiment are still being explored.
2.5. Way Ahead
The initial context for this activity was insurgent warfare and Counter-Improvised Explosive Devise (C-IED) efforts. We continue to explore methods of extracting, analyzing, and visualizing dynamic social networks that are inherent in agent-based models in order to build tools to examine and better understand insurgencies. The effort began with the study of the emergence and evolution of networks in an Afghan Village context and the examination of the types of network statistics that can be used as MOEs and pointers to potential tactics to prevent the enabling of IED emplacement networks.
The ability to identify, extract, and visualize emergent complex networks from relatively simple agent-based scenarios has been demonstrated. We began examining the usage of SNA statistics extracted from the emergent networks in illustrative scenarios as a basis for data farming. These statistics were explored in detail to determine which MOEs would be most beneficial for analyzing the types of networks produced by agent based models.
Additionally, beyond the Counter-IED focus of this effort, the network analysis tools and methods the author has developed can be applied to data farmable models that cover a host of not obviously network-oriented topics: Humanitarian Assistance/Disaster Relief, Logistics, Force Protection, Proximity/Response Time Studies, Aircraft Combat and Dogfights, and others.
In the context of basic social dynamic research the following research is currently being considered for ongoing research:
- Expand the population variation experiment to further explore the effects of network, population and individual agent attributes on the stability and consistency of network structures.
- Examine issues of time-scale in the context of integrated network and physical world modeling.
This research suggests the following topics related to the C-IED effort for follow-on activity:
- Data farm time and scale parameters related to the velocity of information movement within the network and evaluate the results with subject matter experts.
- Expand the modeling of the Afghan Village Scenario. Add the hierarchical network such as the village leadership, local and national government, and related communities. Add female engagement team behaviors. Add Taliban and recruitment behaviors. Add coalition force agents and behaviors.
- Continue analysis and data farming to drill down into variations in the male network density to better understand how message distribution rates are correlated to the relative densities of the networks.
- Consider other modeling environments for the implementation of additional C-IED scenarios.
3. Summary
Data farming is an important methodology for examining complex systems due to its potential for broad examination of multi-dimensional input factor spaces and the resultant landscape of outcomes. The integration of network analysis capabilities into data farming environments provide the opportunity to examine systems involving social entities whose behaviors encompass adaptation and co-evolution, social feedback processes, and intangibles such as morale, trust and charisma.
The drill-down into C-IED modeling demonstrates that we have only touched on the potential for these methods and have demonstrated the need for additional, more detailed and in depth experimentation. We have defined a useful methodology and now need to drill into specific questions more deeply.
The C-IED problems addressed in the experiments described are a small part of the tapestry of possible crises that are facing our society. Efforts are currently underway to exercise data farming in the broader realm of the global issues [18]. It is the intent of this author to apply the tools developed here in the context interacting global systems and trade-offs such as fossil fuel availability, climate change, water and food distribution, natural disaster relief, and political and social infrastructure. In order to accomplish this challenging intent, a community of data farmers must have additional empowering tools and capabilities. Although many more are needed, this paper has described some efforts in that direction.
Author Contributions
Gary Horne conceived the concept of data farming, which is summarized in Section 1 of the paper. He has led the data farming community since its inception. Theodore Meyer has led the integration of network analysis techniques into the data farming paradigm, which is describe in Section 2. The paper is the joint effort of both authors.
Conflicts of Interest
The authors declare no conflict of interest.
References and Notes
- Horne, G. Data Farming: A Meta-Technique for Research in the 21st Century; Naval War College: Newport, RI, USA, 1997. [Google Scholar]
- Hoffman, F.G.; Horne, G.E. Maneuver Warfare Science 1998; Marine Corps Combat Development Command: Quantico, VA, USA, 1998. [Google Scholar]
- Horne, G.E.; Meyer, T.E. Data farming: Discovering surprise. In Proceedings of the 36th conference on Winter Simulation, Washington, DC, USA, 5 December 2004; Winter Simulation Conference: Washington, DC, USA, 2004; pp. 807–813. [Google Scholar]
- Horne, G.; Meyer, T. Data farming and defense applications. In Proceedings of the MODSIM World Conference and Expo, Hampton Roads Convention Center, Hampton, VA, USA, 13–15 October 2010.
- Horne, G.; Åkesson, B.; Anderson, S.; Bottiger, M.; Britton, M.; Bruun, R.; Choo, C.; Erdoğan, O.; Ergün, İ.; Geiger, A.; et al. MSG-088 Data Farming in Support of NATO, Final Report. NATO Science and Technology Office (STO): Paris, France, 2014. [Google Scholar]
- Meyer, T.; Byers, K.; Lesnowicz, E.; McDonald, M.; Upton, S.; Silwood, N.; Engleback, N.; Middleton, D.; Malcolm, P.; Askman, V.; et al. Utility of distillation modeling for countering IEDs. In Proceedings of the International Data Farming Community (Issue 7, Workshop 19, SEED Center for Data Farming), Naval Postgraduate School, Monterey, CA, USA, February 2010.
- Norman, C. Network Analysis: Current and Completed Studies by the JIEDDO J9 662 Chartered Analytic Program. White Paper. Joint Improvised Explosive Device Defeat 663 Organization, J-9 ORSA Division. 2010. [Google Scholar]
- Carley, K.M. A Dynamic Network Approach to the Assessment of Terrorist Groups and the Impact of Alternative Courses of Action. In Proceedings of the Visualising Network Information, Neuilly-sur-Seine, France, 17–20 October 2006.
- Reed, B. A Social Network Approach to Understanding an Insurgency. Available online: http://stinet.dtic.mil/oai/oai?&verb=getRecord&metadataPrefix=html&identifier=ADA 486072 (accessed on 12 September 2015).
- Carley, K.M.; Dombroski, M.; Tsvetovat, M.; Reminga, J.; Kamneva, N. Destabilizing dynamic covert networks. In Proceedings of the 8th international Command and Control Research and Technology Symposium, Washington, DC, USA, 7–19 June 2003.
- Eldridge, E.B.; Neboshynsky, A.J. Quantifying Human Terrain; Naval Postgraduate School: Monterey, CA, USA, 2008. [Google Scholar]
- Golinghorst, K.R. Mapping the Human Terrain in Afghanistan; Army Command and General Staff College: School of Advanced Military Studies, Fort Leavenworth, KS, USA, 2010. [Google Scholar]
- Silverman, B. Human Terrain Data—What Should We Do With It? University of Pennsylvania (ESE): Philadelphia, PA, USA, 2007. [Google Scholar]
- Jackson, L.; Alt, J.; Perkins, T. Cultural geography modeling and analysis. In Proceedings of the International Data Farming Community (Issue 6, Workshop 18, SEED Center for Data Farming), Naval Postgraduate School, Monterey, CA, USA, 27 March 2009.
- Sageman, M. Understanding Terror Networks; University of Pennsylvania Press: Philadelphia, PA, USA, 2004. [Google Scholar]
- Bitinas, E. Pythagoras: The newest member of the Project Albert family. Computing Advances in Military OR—WG 31. In Proceedings of the 70th Military Operations Research Society Symposium, Ft. Levenworth, KS, USA, 18–20 June 2002.
- Paterson, R.; Bitinas, E. Modeling Obstacle Reduction with the Pythagoras Agent-based Distillation. Maneuver Warfare Science 2003; Horne, G., Johnson, S., Eds.; USMC Combat Development Command: Quantico, VA, USA, 2003. [Google Scholar]
- Anderson, S.; Horne, G.; Meyer, T.; Triola, L. Data farming and the exploration of inter-agency, and inter-disciplinary, and international “What-if?” questions. In Proceedings of the MODSIM World 2011, Virginia Beach, VA, USA, 11–14 October 2011.
© 2016 by the authors; licensee MDPI, Basel, Switzerland. This article is an open access article distributed under the terms and conditions of the Creative Commons by Attribution (CC-BY) license (http://creativecommons.org/licenses/by/4.0/).
Share and Cite
MDPI and ACS Style
Horne, G.; Meyer, T. Data Farming Process and Initial Network Analysis Capabilities. Axioms 2016, 5, 4. https://doi.org/10.3390/axioms5010004
AMA Style
Horne G, Meyer T. Data Farming Process and Initial Network Analysis Capabilities. Axioms. 2016; 5(1):4. https://doi.org/10.3390/axioms5010004
Chicago/Turabian StyleHorne, Gary, and Theodore Meyer. 2016. "Data Farming Process and Initial Network Analysis Capabilities" Axioms 5, no. 1: 4. https://doi.org/10.3390/axioms5010004
Note that from the first issue of 2016, this journal uses article numbers instead of page numbers. See further details here.