


A Novel Methodology for Forecasting Business Cycles Using ARIMA and Neural Network with Weighted Fuzzy Membership Functions

1
IT College, Gachon University, Seongnam 08013, Republic of Korea
2
IT College, Jangan University, Hwaseong 16419, Republic of Korea
*
Authors to whom correspondence should be addressed.
Axioms 2024, 13(1), 56; https://doi.org/10.3390/axioms13010056
Submission received: 23 November 2023
/
Revised: 3 January 2024
/
Accepted: 5 January 2024
/
Published: 18 January 2024
(This article belongs to the Special Issue Advanced Computing Methods for Fuzzy Systems and Neural Networks)
Abstract
:Economic forecasting is crucial since it benefits many different parties, such as governments, businesses, investors, and the general public. This paper presents a novel methodology for forecasting business cycles using an autoregressive integrated moving average (ARIMA), a popular linear model in time series forecasting, and a neural network with weighted fuzzy membership functions (NEWFM) as a forecasting model generator. The study used a dataset that included seven components of the leading composite index, which is used to predict positive or negative trends in several economic sectors before the GDP is compiled. The preprocessed time series data comprising the leading composite index using ARIMA were used as input vectors for the NEWFM to predict comprehensive business fluctuations. The prediction capability significantly improved through the duplicated refining process of the dataset using ARIMA and NEWFM. The combined ARIMA and NEWFM techniques exceeded ARIMA in both classification and prediction, yielding an accuracy of 91.61%.
Keywords:
time series prediction; neural fuzzy networks; autoregressive integrated moving average; NEWFM; gross domestic product (GDP)MSC:
68T051. Introduction
The economy is constantly evolving, undergoing shifts that can bring positive change and rejuvenate conditions but also present potential challenges and crises. It is easier to respond to crises and navigate obstacles with more foresight and strategic acumen when one can accurately predict the expected path of economic change ahead of time. Business cycle forecasting captures the cyclical pattern of changing economic situations using observed economic data and forecasts future economic fluctuations. In addition to stochastic and statistics methods, many linear and nonlinear forecasting models have been introduced to deal with a financial crisis since the Great Depression in the 1930s and recently in 2008. The business cycle is forecasted by applying traditional probability and statistical techniques by several research groups. The dating algorithm is applied sequentially to augment the sample period, revealing a reliable advance signaling system for the US business cycle, allowing insight into the last eight turning points [1]. Layton reported a comprehensive proxy for the business cycle to evaluate the effectiveness of leading indicators in predicting future phase shifts [2]. A hybrid forecasting model for capital markets is reported by McDonald et al., in which a combination of linear time series models like ARIMA with the flexibility of a self-organizing fuzzy neural network (SOFNN) is introduced. The performance of this system is evaluated using various datasets, proving effective for time series forecasting [3]. A business cycle forecasting model using economic indicators based on the Fuzzy Interactive Naive Bayesian (FINB) network is introduced by Chai et al. [4]. However, these methods are not efficient in forecasting the business cycle using time series data and only predict the short-term index of the business cycle to eliminate complexity. This inefficiency arises from the inability of assumptions based on probability distributions to overcome the ambiguity and incompleteness of actual information [5]. Research on linear and nonlinear prediction models was conducted while reflecting the time series characteristics of economic data. The study involved the utilization of models such as support vector regression (SVR), fuzzy logic, neural network, and ARIMA. The support vector (SV) method estimates regressions, creates multidimensional splines and solves linear operator equations [6]. The term “intuitionistic fuzzy set” (IFS), which is a generalization of the term “fuzzy set,” is defined and an example is provided [7]. To capitalize on the distinct advantages of ARIMA and ANN models in linear and nonlinear modeling, a hybrid methodology combining both models was presented [8]. The combined model can be a useful tool to increase forecasting accuracy attained by either of the models employed alone according to experimental results using real datasets. The ARIMA model is used in a number of areas, such as forecasting electricity consumption, gold and stock prices, supply chain and operations, economic indicators, sales forecasting, weather forecasting, and natural disaster prediction. Various combinations of these models were formulated to generate a consolidated model. The existing literature proposes the development of a unified model through the amalgamation of these various models [9,10]. The use of a support vector machine (SVM) for multivariate fuzzy linear and nonlinear regression models highlights its computational efficiency in solving complex problems [11]. These models are inefficient in extracting accurate patterns from time series data and, also, in processing large amounts of data. Atanassov reported an intuitionistic fuzzy set (IFS) to reflect the ambiguity and uncertainty of economic data [7], but in the past, there were few attempts to apply fuzzy to time series problems.
Autoregressive integrated moving average (ARIMA) method has been used for traditional econometric time series analysis. It is a combined type of autoregressive (AR) and moving average (MA) parts, which refines the time series by reducing the noise of the data, thereby enhancing the classification rate. However, it has limitations as a linear model for dealing with chaotic economic data. To improve the prediction accuracy, the time series preprocessed by ARIMA was used as input vectors to the neural network with weighted fuzzy membership functions (NEWFM) and went through the iterated training process of neural networks to determine the optimum forecasting values using the fuzzy rules extracted by the NEWFM. The NEWFM algorithm assigns weights to fuzzy membership functions and learns the weights in a similar way to a neural network. It excels in forecasting uncertain and ambiguous data. The leading composite index (LCI) was used to predict economic fluctuations. The time series of LCI components showing different signs, that is, good or bad signs for each specific economic field, were integrated by the NEWFM and used as comprehensive economic fluctuations.
In this study, a hybrid forecasting approach combining ARIMA and NEWFM is proposed to supplement the drawback of ARIMA as a linear model and to take advantage of a nonlinear system using the NEWFM. Linear regression analysis was performed using Minitab software Version 21.1.0 to compare approximation performance. The time series processed by both models were used as predictors, while GDP was used as response variables. The ARIMA–NEWFM model had a higher approximation performance in terms of coefficient of determination but a lower error rate in terms of . The performance of classification and prediction was compared between a method using ARIMA and a method using both ARIMA and NEWFM. The method using ARIMA and NEWFM together obtained 91.61% accuracy and outperformed ARIMA in both classification and prediction. Therefore, the hybrid forecasting approach, combining ARIMA and NEWFM, offers a promising solution to linear models’ limitations in capturing business cycle complexity.
In summary, the main contributions of this study are as follows:
- The proposed approach is efficient for handling large amounts of time series data.
- It overcomes the limitations of linear models and takes advantage of nonlinear models to improve prediction and classification performance.
- Through experiments, it is demonstrated that the proposed integrated model outperformed the single linear model ARIMA in both classification and prediction.
The rest of this paper is structured as follows. Section 2 and Section 3 show the experimental method and dataset, respectively. Section 4 and Section 5 contain experimental details on ARIMA and NEWFM. In addition, results for two kinds of experiments are shown. Section 6 and Section 7 include a discussion and conclusion respectively.
2. Methodology
Extensive research has been continuously conducted to predict business cycles using information technology [12,13,14,15]. New approaches include business cycle forecasting models based on Bayesian networks [4], wavelet transformation [10], principal component analysis [10], chaos theory [10], and fuzzy neural networks [16,17,18].
Herein, a forecasting model, referred to as the ARIMA–NEWFM model, is introduced, utilizing both ARIMA and NEWFM. Whereas ARIMA stands as a widely employed traditional econometric tool for time series analysis. Datasets are adjusted by the autocorrelation and smoothening function, thereby increasing the classification rate. However, it has limitations when dealing with chaotic datasets as a linear model. The NEWFM performs a supplementary function as a nonlinear system. Datasets preprocessed by ARIMA were used as input vectors to the NEWFM model and again went through the training process of neural networks to determine the optimum output values of fuzzy membership functions using the NEWFM algorithm. The seven components of the LCI, such as jobs, production, and consumption, were used as datasets for the ARIMA–NEWFM model. These indices conveyed signals of positive outcomes (in blue) or negative outcomes (in red) in various economic sectors ahead of the GDP compilation by the statistical authority, as shown in Figure 1.
3. Dataset
The identical sample dataset utilized in our prior research on business cycle forecasting grounded in chaos theory [10] was selected. As a main economic indicator, nearly all advanced countries compile and publish three composite indices: leading, coincident, and lagging. These indices are indispensable for developing economic plans or strategies in advance for enterprises and governments. The components of the LCI, which provide a variety of early indications regarding the economic outlook for jobs, output, and consumption, were employed. The monthly observation datasets for 180 months from January 1991 to December 2005 were used for training, whereas the monthly data during the 12 months of the following year were used as test data for Outlook. GDP is used as the target in the learning process of neural networks and the function is performed to classify the category of the economic phase into trough (Class 0) and peak (Class 1), as presented in Table 1.
4. Autoregressive Integrated Moving Average (ARIMA) Model
In this section, the experiment using ARIMA is explained [19].
4.1. Characteristics of the Model
ARIMA is a widely used tool to analyze time series data, particularly economic datasets such as a business cycle. Additionally, ARIMA models are also used in various fields, such as predicting gold prices and stock prices. The process involves a series of four stages: identification, estimation, diagnostic examination, and time series forecasting. It fits a nonstationary dataset into a stationary dataset using a noise-filtering function. The method involves identifying a model from a general class and checking it against historical data to ensure its accuracy. On the other hand, traditional forecasting models have limitations due to their complexity and lack of guidelines and statistical tests for verifying model validity. Using the regression equation, autoregression predicts the value for the subsequent time step based on observations from earlier time steps. The integrated moving average makes the series stationary by differencing the raw observations. The process of changing a nonstationary time series into a stationary one is called differencing. An observation value is subtracted from a prior observation value to complete the process. Until a steady series is achieved, the process is repeated. The AR part adjusts the time series using a regression function to determine the appropriate time lags influencing the past time series. The MA part smoothens the time series using regression errors such that it differs from the traditional method of obtaining the MA by calculating the means of consecutive data points. The integrating side replaces the time series using the differencing process. The general formula for describing AR(p) is as follows:
where is the value of the variable at time t, and c represents the intercept term. α is the coefficient of the lagged variable . is the error term. The AR part depends on past observations while the MA part depends on error terms. The general description of MA(q) is as follows:
The combination of autoregressive (AR) and moving average (MA) models results in the autoregressive integrated moving average (ARIMA) model. The general form of an ARIMA (p, d, q) equation is given as:
The number of lag observations (p) in the model is used to fine-tune the line being fitted in order to predict the series. The number of differencing changes required for the time series to become stationary is denoted by d, while q is used to describe the moving average window’s size. Moreover, ARIMA (0, 0, 0) is classified as the white noise model due to the absence of the AR part. If is considered nonstationary, then its first difference (d = 1) becomes invariable. So ARIMA (p, 1, q) is written as:
After the differencing process of the time series, this equation can be used to forecast the datasets.
4.2. Implementation Using Minitab Software
The Minitab software Version 21.1.0 [17] was used to fit the ARIMA models to the time series. Minitab suggests appropriate time lags of autocorrelation on its own time series by implementing the autocorrelation function (ACF) and then testing the influencing strength of those time lags by implementing the partial autocorrelation function (PACF). The results of the Minitab implementation showed that the ACF suggested up to 6 appropriate time lags shown as spikes beyond the red horizontal dotted lines (Figure 2), whereas the PACF showed the strongest autocorrelation at lag 1 beyond the red horizontal dotted lines (Figure 3). With few time series, time lag 1 was selected to avoid excluding many of them.
4.3. Selection and Assessment
Determining an ARIMA model for time series using Minitab can be an iterative process. A trial-and-error process is required to determine the appropriate parameters. After an iterative experimental process to determine the parameters, the ARIMA (1,1,3) model, that is, a time lag of order 1, the difference of order 1, and an MA of order 3, was selected. In addition, the seasonal effect of the 12 months, that is, the annual cycle, could be determined to help forecast future values. The assessment of this model’s fit to the data was finally conducted. Minitab produced the following output for the assessment of this model (Table 2). As presented in Table 2, (a) the final estimates of parameters, that is, the probability values of the ARIMA (1,1,3) model, were all significant at the 0.0% level for AR and MA, which evidences an efficient model. In addition, according to the suggestion of (c) Box–Pierce chi-square statistics in Table 2, the seasonal effect of 12 months could be determined, which was also significant at the 0.0% level [20].
Time series data analysis with autoregressive (AR) and moving average (MA) components is presented in Table 1. A strong positive relationship with the previous observation is indicated by the positive value of 1.0245 for the AR1 coefficient. Furthermore, it appears to be a highly significant predictor based on the low p-value (0.000). The coefficient AR2 is 0.169 with a higher p-value (0.221), suggesting a weaker or nonsignificant relationship. The negative AR3 coefficient (−0.2837) and low p-value (0.001) suggest a significant negative relationship with the third lag. The coefficients of MA1 and MA2 are both positive; however, the p-value of MA2 (0.073) is on the borderline, suggesting that it may be marginally significant. The highest MA3 coefficient (0.7640) and a very low p-value (0.000) suggest a strong positive impact on the current observation. The constant term is not statistically significant (p-value: 0.376), suggesting that the mean of the differenced series is not significantly different from zero. One regular difference was applied to make the series stationary. Relatively small residual sums of squares (SS) (0.115198) suggest that the model fits the data well. The Ljung–Box test examines whether there is significant autocorrelation in the residuals at different lags. The low p-values for all lags (12, 24, 36, 48) indicate that there is significant evidence to reject the null hypothesis of no autocorrelation in the residuals. This suggests that the model has successfully captured the autocorrelation patterns in the data. The significance of the AR and MA components of the ARIMA model suggests that it has successfully captured the temporal dependencies in the time series. A good fit is indicated by the relatively small residuals, and the Ljung–Box test indicates that no significant autocorrelation remains in the residuals.
4.4. Forecasting Time Series Using the ARIMA (1,1,3) Model
This section addresses learning with the ARIMA model and includes graphics to illustrate the findings. Using the fitted values of the observed 180 data points during the period 1991–2005, Minitab provided the following output for the outlook. The predicted values for the 12 months of the following year are shown on the right side of Figure 4. The middle value between the lower and upper values was used. The classification rate of the model was 83.79% for training and 83.33% for forecast (Table 3). Reflecting these classification capabilities, the fitted values (in red) show a reasonable approximation over time with the original data values (Figure 5).
5. Neural Network with Weighted Fuzzy Membership Functions (NEWFM) Model
In this section, the characteristics of the NEWFM learning model and the results of classification and forecasting using the ARIMA–NEWFM model are presented.
5.1. Characteristics of the Model
It is a synthesized type of fuzzy logic and a neural network that performs supervisory learning. The preprocessed values of the time series, called FITs, produced by the ARIMA (1,1,3) model were used as input vectors to the NEWFM. The overall mechanism of business cycle forecasting, named ARIMA–NEWFM, is illustrated in Figure 6. The weights of the membership functions were self-adaptively trained to determine the approximate output that satisfies the target within the hidden layer (). After the iterated learning process, the NEWFM algorithm produced fuzzy distribution graphs, called hyperboxes, by feature (LCI), containing extracted fuzzy rules classifying categories into classes of 0 and 1, as shown in Figure 6.
These fuzzy rules were then applied to classify the time series. The time series of LCIs were adjusted and transformed into the optimum forecasting values of fuzzy membership functions through the iterative training process of neural networks using the NEWFM algorithm [13,14].
Finally, these dataset variables in the summed-up output classified as and were integrated into a defuzzified single time series showing both the economic phases of the trough (recession) and peak (boom) of the business cycle.
5.2. Classification Using the ARIMA–NEWFM Model
The FITS, dataset variables preprocessed by ARIMA, were trained and tested using the NEWFM. These preprocessed 180 monthly data instances of FITS corresponding to LCI components for the period from January 1991 to December 2005 were used for training, and the 12 monthly data samples from January 2006 to December 2006 of the following year were used for the forecasting test, as shown in Table 4. After 300,000 iterations of learning in the experiment, the fuzzy rules to forecast were obtained, that is, seven hyperboxes by LCI, each of which contains the classification rules for Class 0 (trough) and Class 1 (peak) (Figure 7).
Then, these fuzzy rules derived from the training process were applied to test the data, that is, the nontrained time series of the following year, for the outlook. The classification rate shows the same rate of 91.61% for both the training and testing. Table 4 lists the final classification performance results.
5.3. Defuzzification and Trend Line of the Business Cycle
The dataset variables in the summed-up output classified as and obtained from the aforementioned experiments are easily integrated into a single time series using the well-known Sugeno equation (Equation (5)) without a time-consuming defuzzification operation [18].
Figure 8 shows the time series plot of the ARIMA–NEWFM model together with GDP. The time series comprising 192 monthly LCI and GDP data points from 1991 to 2006 generated an upward and downward trend line of the business cycle. This trend line of the ARIMA–NEWFM model (in blue) demonstrates the approximate wave of fluctuations with that of GDP (in red), which was the target class. This implies that the ARIMA–NEWFM model successfully integrated seven LCIs and rendered an early indicator of the overall business cycle fitted as GDP. However, GDP requires a considerable time lag for compilation by a statistical authority. Thus, the ARIMA–NEWFM model provides another early economic indicator, capturing signals of an economic boom or recession, nearly the same as GDP, which is the main indicator representing the business cycle.
6. Results and Discussion
In this section, a comparison is made between two models—ARIMA and ARIMA–NEWFM—in terms of classification accuracy and regression forecasting. Furthermore, the experimental results are discussed.
6.1. Forecasting Capability
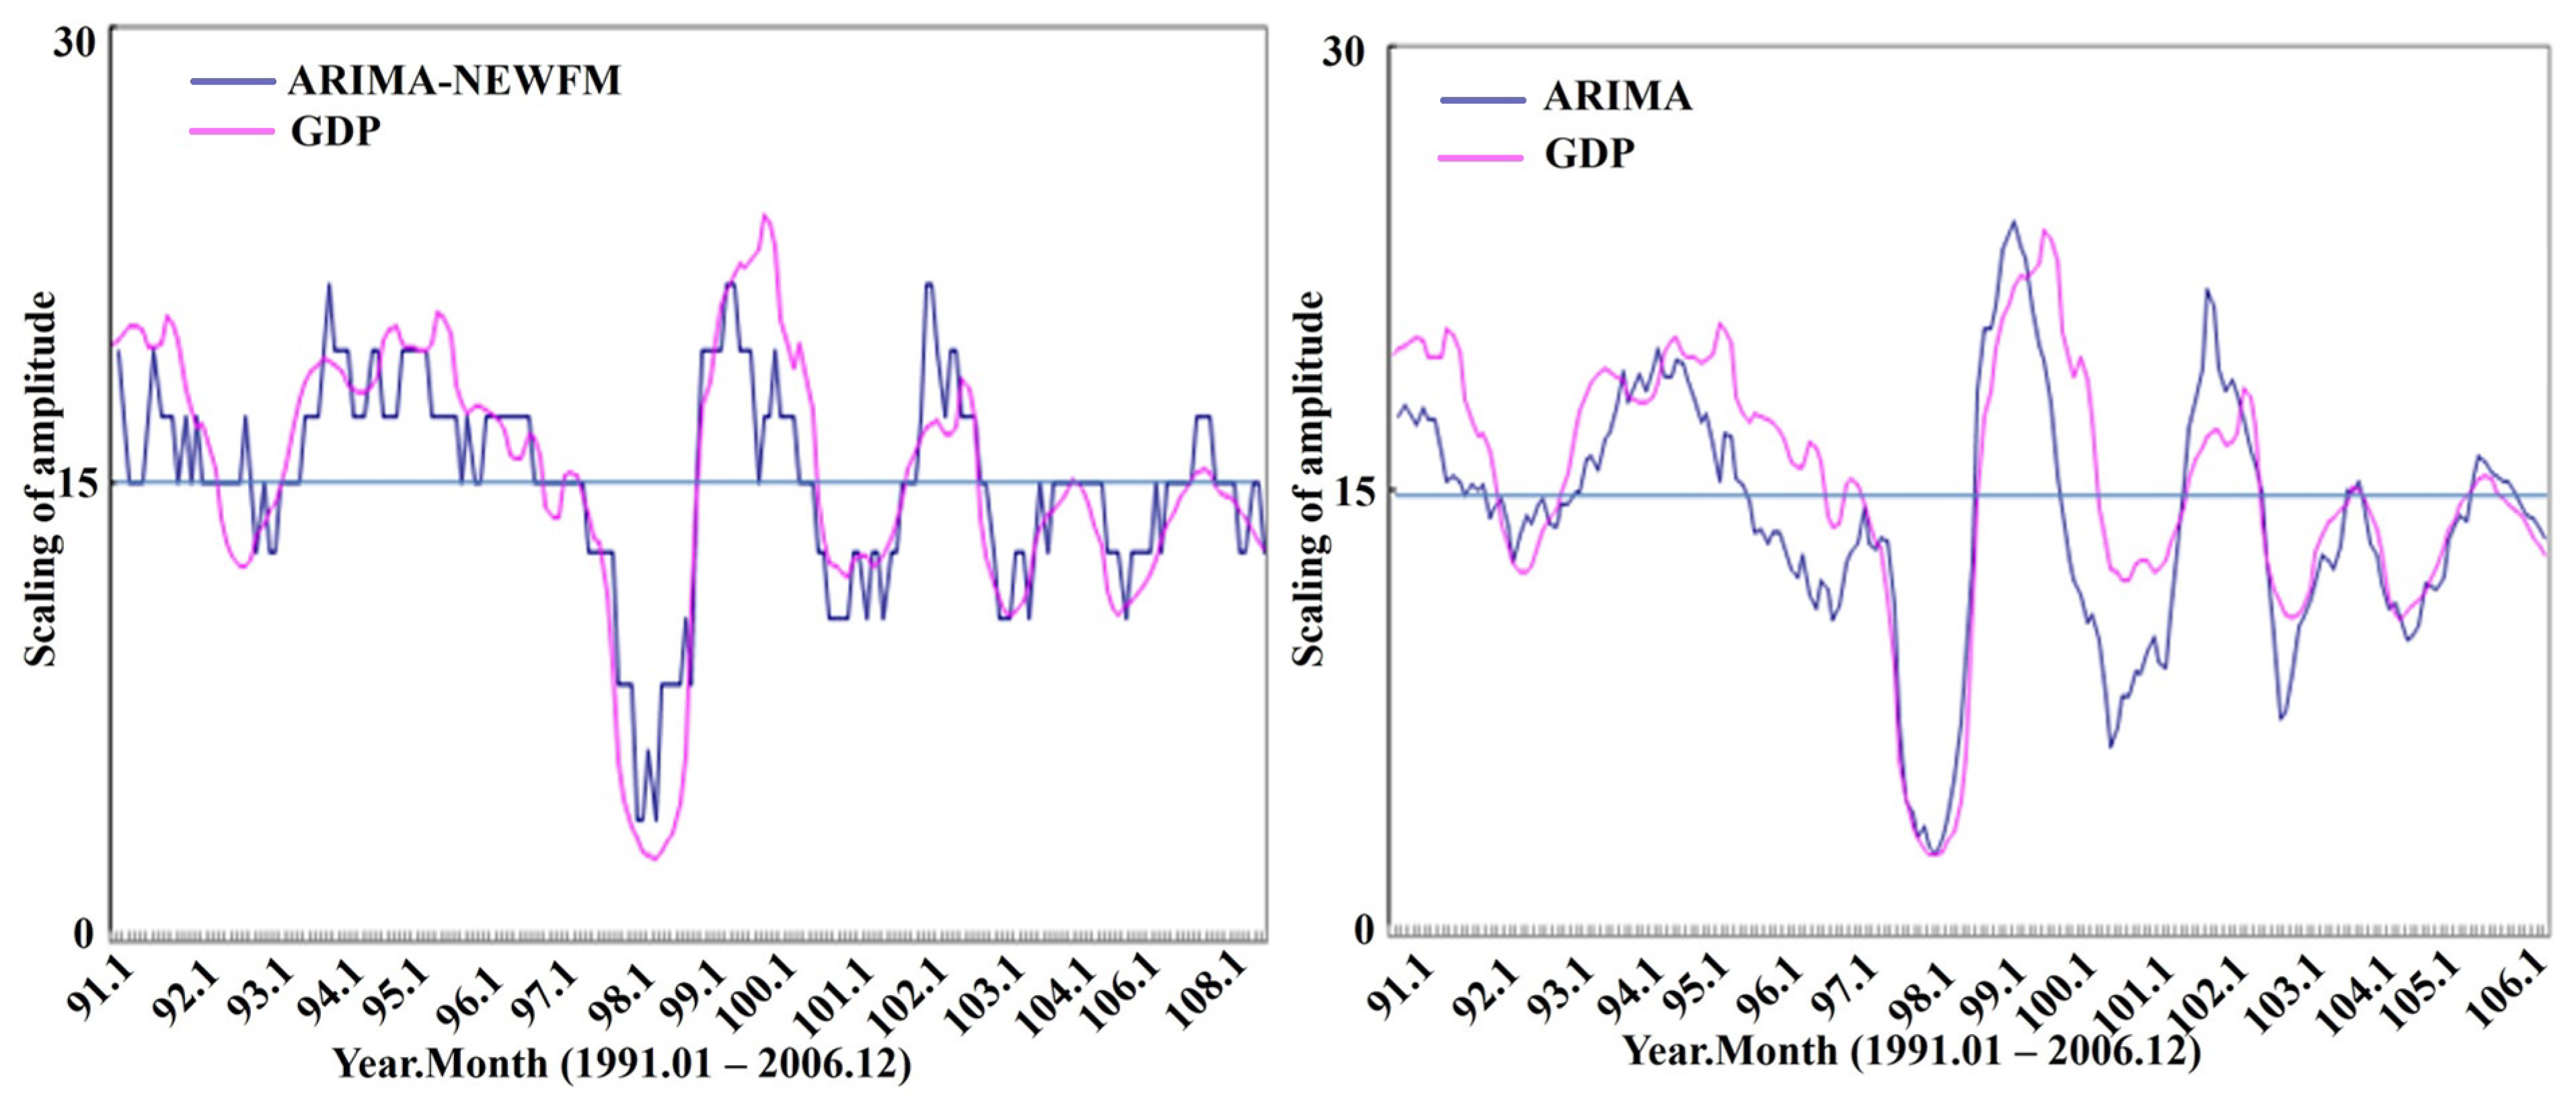
Table 5 and Figure 9 show the comparative classification performances of ARIMA and ARIMA–NEWFM. The classification rate of 91.61% for the ARIMA–NEWFM model was higher than that of 83.79% for the ARIMA model. In addition, linear regression analysis was implemented using the Minitab software Version 21.1.0 to compare the approximation performance of both models. Minitab provides diagnostic outputs on the way the model fits the data. For linear regression, the time series processed by ARIMA and ARIMA–NEWFM were used as predictors, whereas those of GDP were used as response variables. Table 6 and Table 7 present the results of the linear regression analysis. The approximation performance of 71.0% for the ARIMA–NEWFM model in terms of coefficient of determination was higher than that of 69.1% for the ARIMA model. Furthermore, the error rate of 2.0471% for the ARIMA–NEWFM model in terms of was less than that of 2.1696% for the ARIMA model.
The squared sum of regression, (Equation (6)) is the value of the portion explained by the response variables of the total variation in the data. Therefore, the higher the value of the more useful the model. The sum of the squared error in terms of (Equation (7)) is not explained by the model and is attributed to the error. The equations used are as follows:
where denotes the estimated response variable, denotes the observed time series, and and denote the mean responses.
6.2. Discussion
ARIMA is a widely used traditional econometric tool for time series analysis. However, as a linear model, its effectiveness in adjusting and smoothening functions on a nonstationary dataset is limited. Meanwhile, the supplementary function works well by using the NEWFM, which can process the nonlinear dataset to obtain optimum values of fuzzy membership functions through the iterated training process of neural networks. Thus, ARIMA–NEWFM, combining the two models, can significantly enhance the classification rate, thereby increasing the approximation performance with GDP (Table 5).
7. Conclusions
The study has explored a novel methodology for forecasting business cycles by employing ARIMA and NEWFM models. This approach enhanced the advantages of both models to obtain a significantly improved classification rate, thereby increasing the approximation performance with GDP as well. Using this model, the components of LCIs successfully integrated different good or bad signals into a single indicator and provided an early indicator of a comprehensive business cycle, admirably fitted as GDP, which requires a considerable time lag for compilation. Consequently, the ARIMA–NEWFM model presents another method for forecasting the business cycle for developing economic plans or strategies in advance for enterprises and governments. In addition, this model can be used in many applications such as stock price forecasting, gold price forecasting, and power usage forecasting related to the forecasting of time series data.
8. Limitations
- There is a limitation in the present model. In this study, NEWFM was implemented using JAVA programming language. So, program execution speed is somewhat slow. The speed of the program might be improved by implementing a tensorflow version of NEWFM. Further experiments using different datasets that are sufficiently long to cover the lost time series in adjusting and smoothening process of the time series by ARIMA are required.
- The presented ARIMA and ARIMA-NEWFM models, despite their high accuracy and reliability, face limitations due to the manual specification of model parameters, requiring multiple trials and modifications to find the optimal configuration.
- This study may face limitations due to the limited number of observations of the GDP series. The presented work is restricted to the use of monthly observation datasets from 1991 to 2005 for training and the following 12 months for testing the outlook.
- The model’s reliability and accuracy depend on the reliability and differencing of historical data, which must be collected accurately and over a long period for accurate results and forecasts.
- The model’s limitations include its reliance on data collection and the manual trial-and-error process needed to determine optimal parameter values.
9. Future Work
- The accuracy and robustness of forecasting could be improved by combining the advantages of the hybrid ARIMA and NEWFM models. The suggested methodology’s performance can be improved over extended periods. This could entail finding the best configurations by methodically changing the parameters in the ARIMA and NEWFM models. Various forecasting models, such as deep learning and machine learning techniques, can be examined and contrasted with the suggested ARIMA and NEWFM methodologies. To assess the methodology’s practical applicability, it can be tested in real-time forecasting scenarios, but it will have some limitations.
- The ARIMA-NEWFM and ARIMA models are suitable for current observations, but future research could benefit from comparing other forecasting techniques, such as exponential smoothing, vector autoregressive models, neural networks, etc.
Author Contributions
Conceptualization, methodology, software, validation, formal analysis, investigation, data curation, writing—original draft preparation are done by S.H.C. and B.W. Writing—review and editing, visualization, supervision, project administration, funding acquisition are done by J.S.L. and H.Y. All authors have read and agreed to the published version of the manuscript.
Funding
This work was supported by the National Research Foundation of Korea (NRF) grant funded by the Korea government (MSIT) (RS-2023-00249862).
Data Availability Statement
The data can be obtained by contacting the corresponding author.
Acknowledgments
This work was supported by the National Research Foundation of Korea (NRF) grant funded by the Korea government (MSIT) (RS-2023-00249862).
Conflicts of Interest
The authors declare no conflict of interest.
References
- Layton, A.P. Dating and predicting phase changes in the US business cycle. Int. J. Forecast. 1996, 12, 417–428. [Google Scholar] [CrossRef]
- Layton, A.P. A further test of the influence of leading indicators on the probability of US business cycle phase shifts. Int. J. Forecast. 1998, 14, 63–70. [Google Scholar] [CrossRef]
- McDonald, S.; Coleman, S.; McGinnity, T.M.; Li, Y. A hybrid forecasting approach using ARIMA models and self-organising fuzzy neural networks for capital markets. In Proceedings of the 2013 International Joint Conference on Neural Networks (IJCNN), Dallas, TX, USA, 4–9 August 2013; pp. 1–7. [Google Scholar] [CrossRef]
- Chai, S.H.; Lim, J.S. Business Cycle Forecasting using Fuzzy Interactive Naïve Bayesian Network. Indian J. Sci. Technol. 2015, 8, 1–6. [Google Scholar] [CrossRef]
- Hung, K.C.; Lin, K.P.A. Long-term business cycle forecasting through a potential intuitionistic fuzzy least-squares support vector regression approach. Inf. Sci. 2013, 224, 37–48. [Google Scholar] [CrossRef]
- Vapnik, V.; Golowich, S.; Smola, A. Support vector machine for function approximation, regression estimation, and signal processing. Adv. Neural Inf. Process. Syst. 1996, 9, 281–287. [Google Scholar]
- Atanassov, K.T. Intuitionistic fuzzy sets. Fuzzy Sets Syst. 1968, 20, 87–96. [Google Scholar] [CrossRef]
- Zhang, G.P. Time series forecasting using a hybrid ARIMA and neural network model. Neurocomputing 2003, 50, 159–175. [Google Scholar] [CrossRef]
- Li, X.; Hu, B.; Du, R. Predicting the parts weight in plastic injection molding using least squares support vector regression. IEEE Trans. Syst. Man Cybernet. Part C Appl. Rev. 2008, 38, 827–833. [Google Scholar] [CrossRef]
- Chai, S.H.; Lim, J.S. Forecasting business cycle with chaotic time series based on neural network with weighted fuzzy membership functions. Chaos Solitons Fractal 2016, 90, 118–126. [Google Scholar] [CrossRef]
- Hong, D.H.; Hwang, C. Support vector fuzzy regression machines. Fuzzy Sets Syst. 2003, 138, 271–281. [Google Scholar] [CrossRef]
- Faruk, D.Ö. A hybrid neural network and ARIMA model for water quality time series prediction. Eng. Appl. Artif. Intell. 2010, 23, 586–594. [Google Scholar] [CrossRef]
- Lim, J.S. Finding Features for Real-Time Premature Ventricular Contraction Detection Using a Fuzzy Neural Network System. IEEE Trans. Neural Netw. 2009, 20, 522–527. [Google Scholar] [CrossRef]
- Lim, J.S. Finding Fuzzy Rules for IRIS by Neural Network with Weighted Membership Functions. Int. J. Fuzzy Log. Intell. Syst. 2004, 4, 211–216. [Google Scholar]
- The Bank of Korea. The Korean Business Cycle; Monthly Bulletin; The Bank of Korea: Seoul, Republic of Korea, 2004; pp. 31–53. [Google Scholar]
- Chai, S.H.; Lim, J.S. Economic Turning Point Forecasting Using Neural Network with Weighted Fuzzy Membership Functions. In New Trends in Applied Artificial Intelligence; Springer: Berlin/Heidelberg, Germany, 2007; pp. 145–154, IEA/AIE 2007, LNAI 4570. [Google Scholar]
- Minitab Inc. Minitab Release 14; Minitab Inc.: Arizona AZ, USA, 2005. [Google Scholar]
- Tagaki, T.; Sugeno, M. Fuzzy Identification of systems and its Application to Modeling and Control. IEEE Trans. SMC 1985, 15, 116–132. [Google Scholar]
- Adhikari, R.; Agrawal, R.K. An Introductory Study on Time Series Modeling and Forecasting; LAP Lambert Academic Publishing: London, UK, 2013; ISBN 978-3-659-33508-2. [Google Scholar]
- Example of ARIMA. Available online: https://support.minitab.com/en-us/minitab/21/help-and-how-to/statistical-modeling/time-series/how-to/arima/before-you-start/example/ (accessed on 25 October 2023).
Figure 1.
The representation of the business cycle.
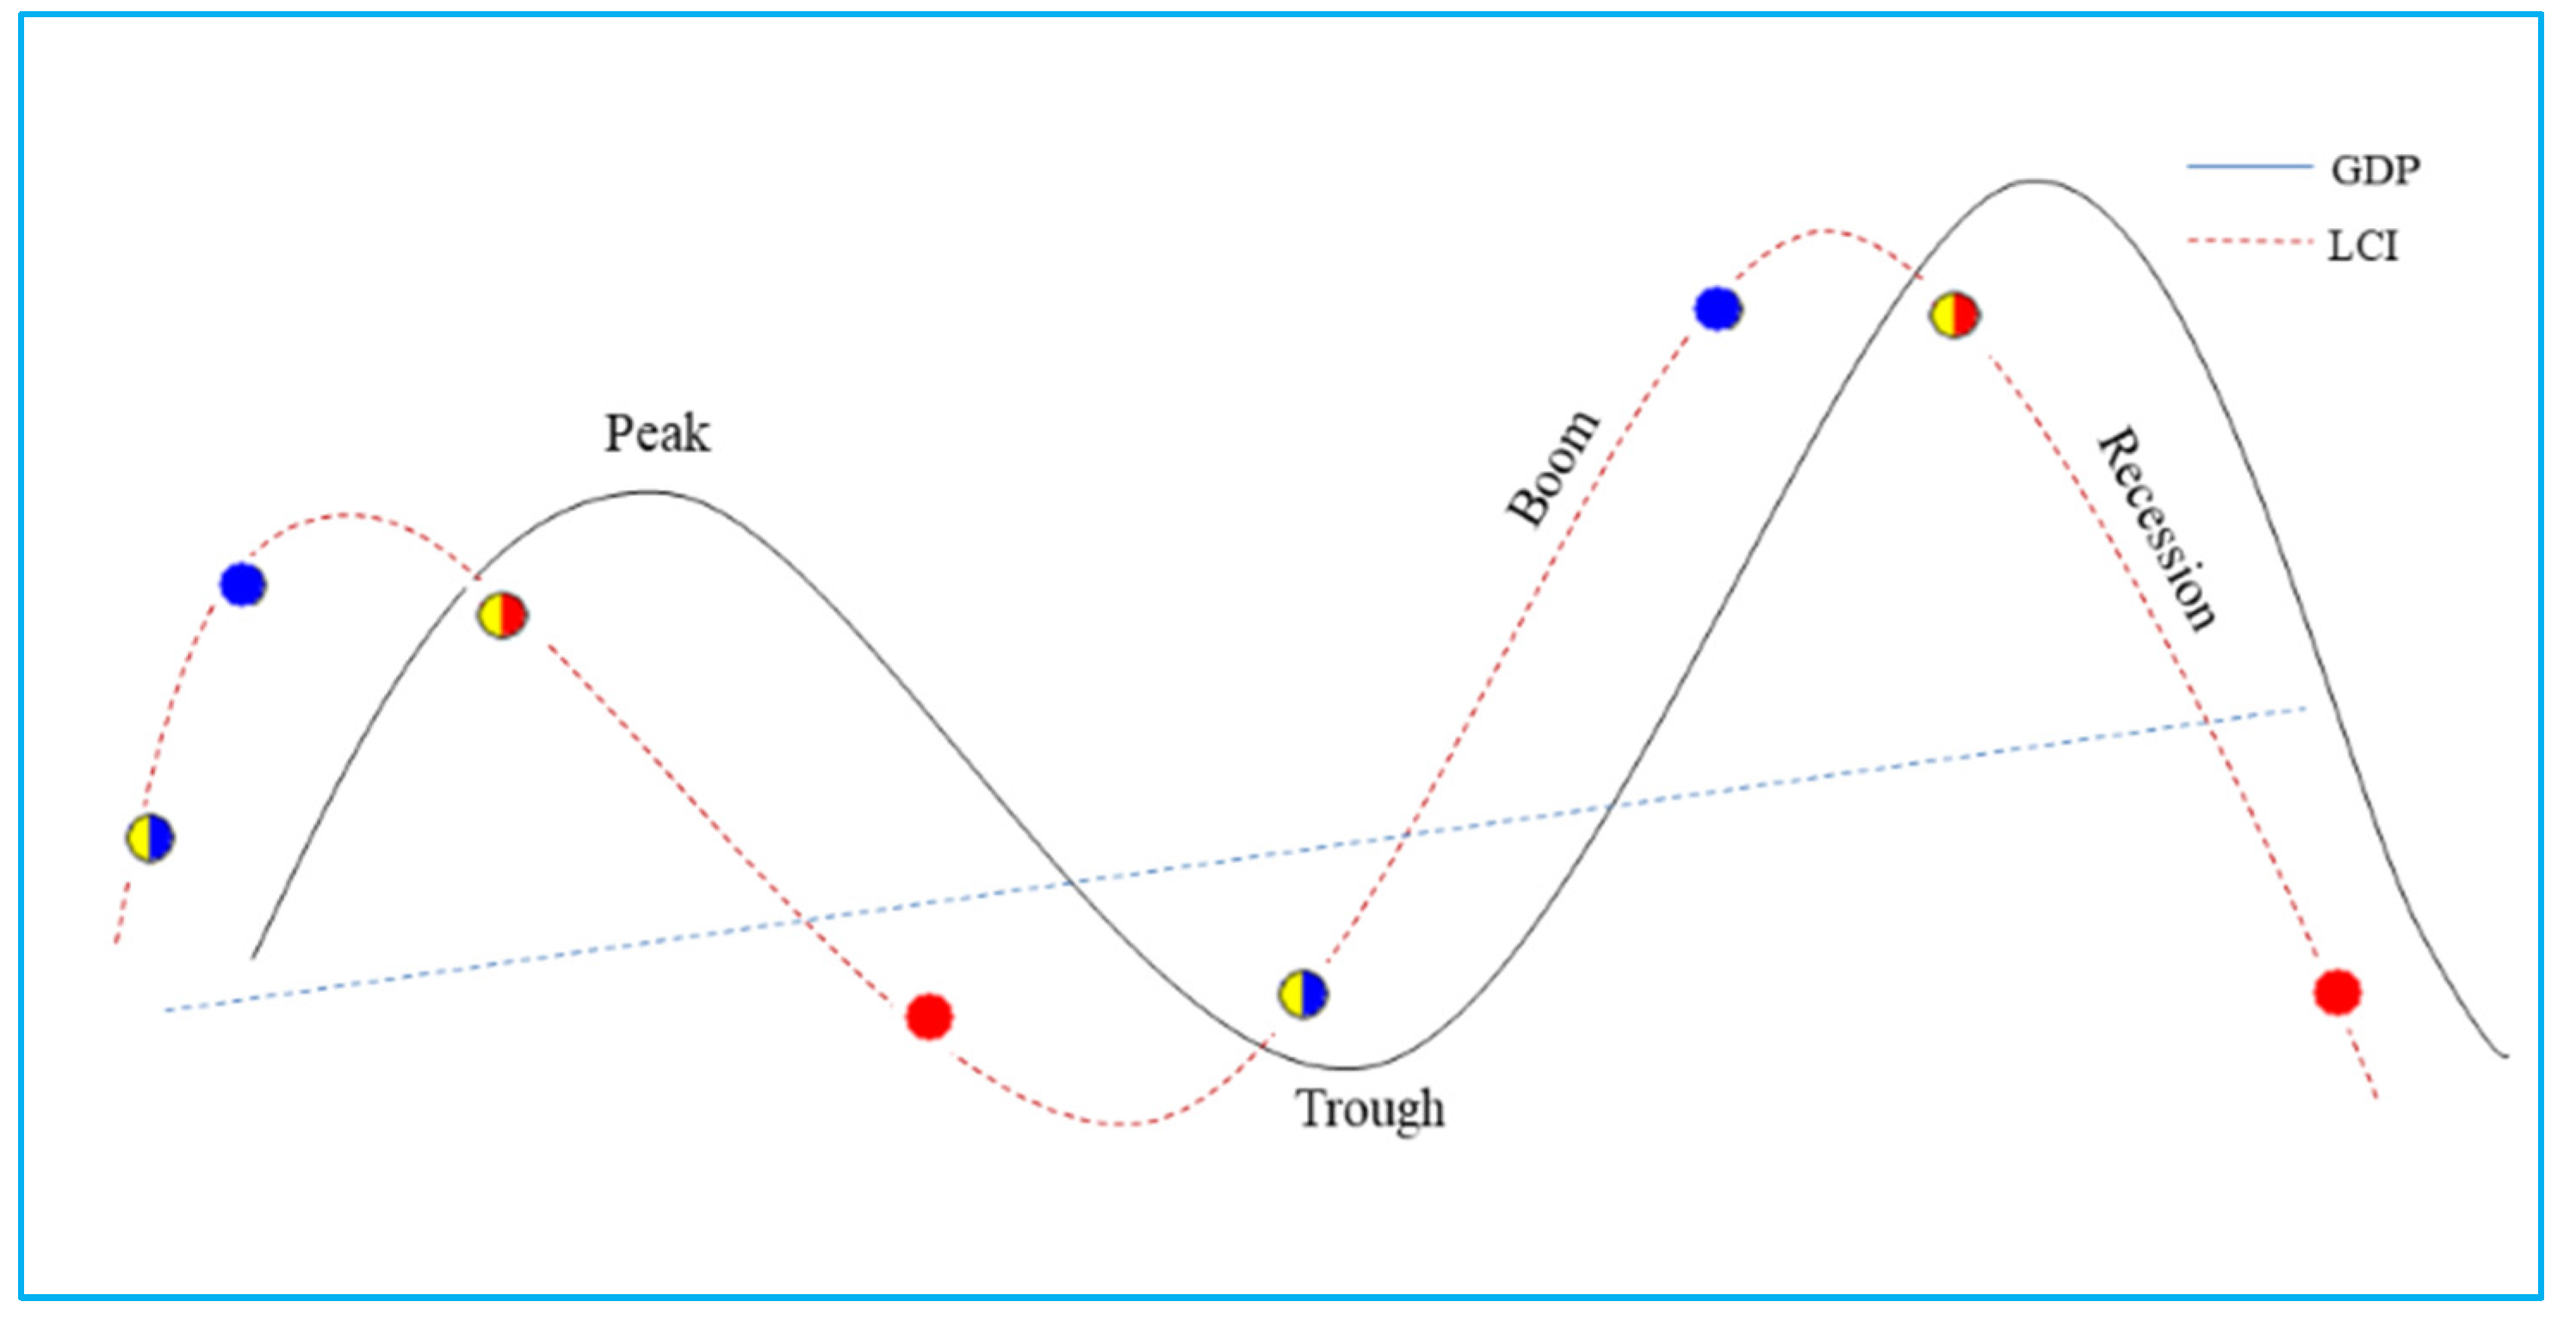
Figure 2.
Autocorrelation function for LCI.
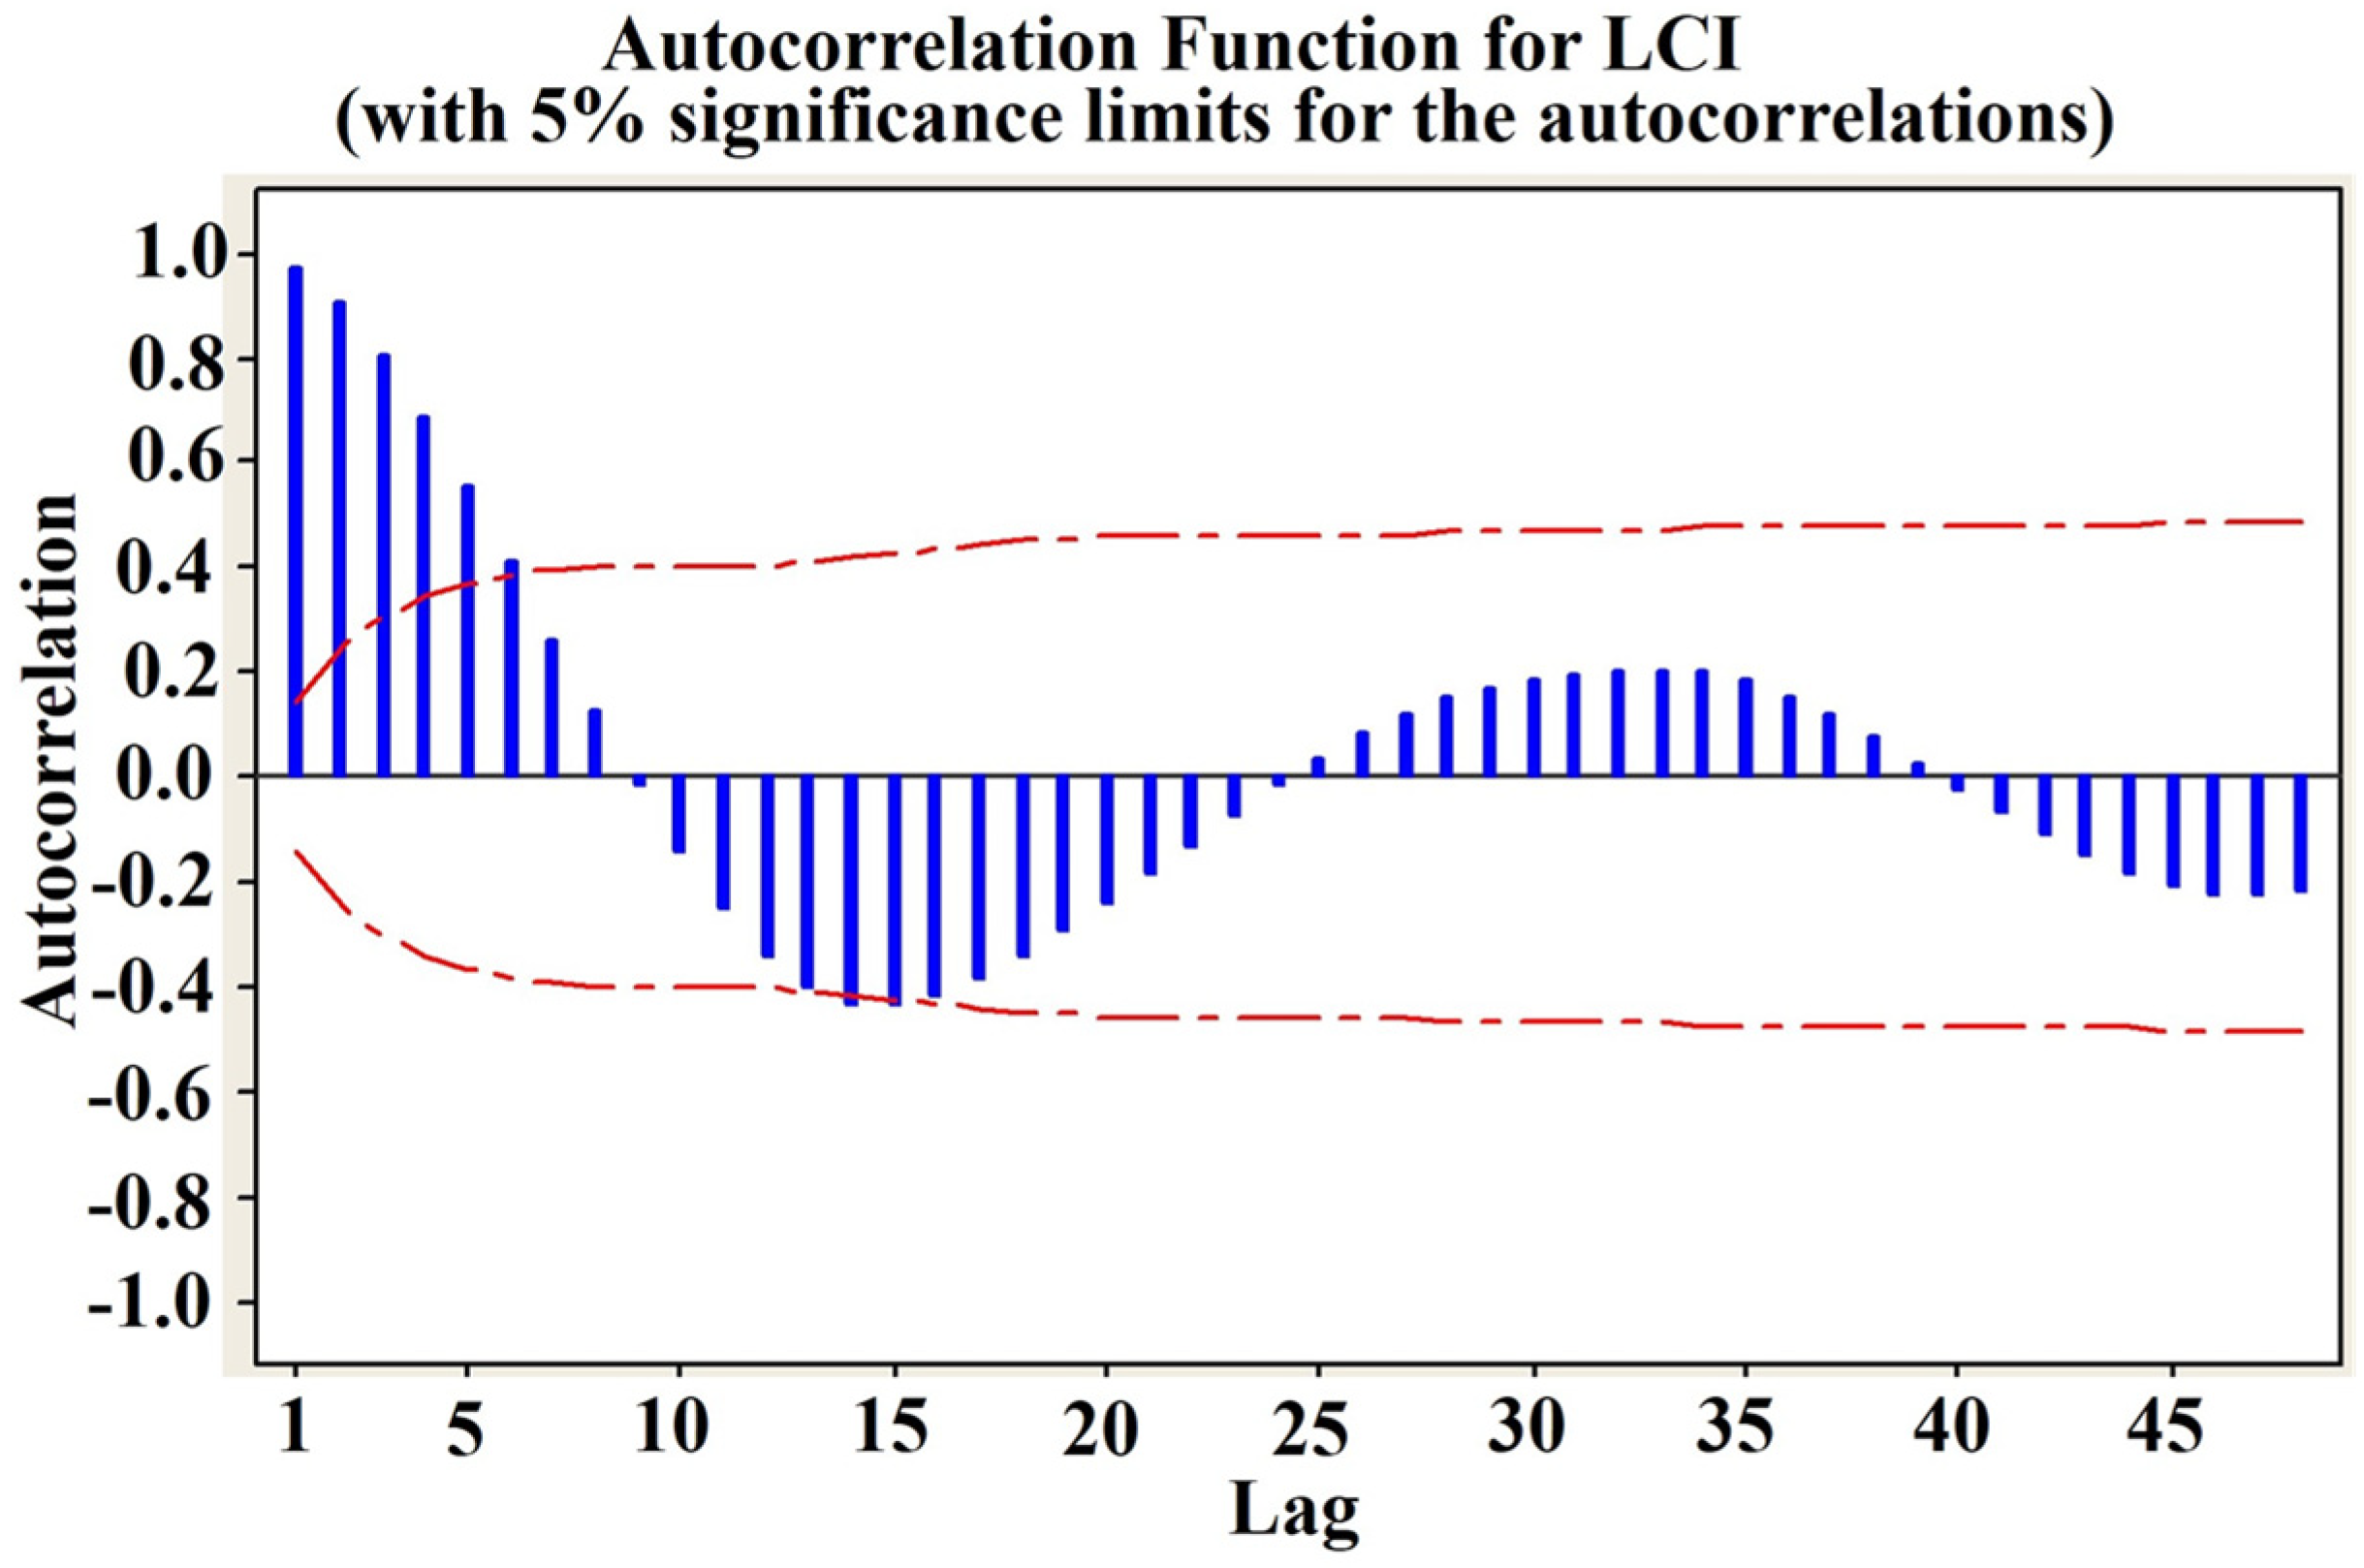
Figure 3.
Partial autocorrelation function for LCI.

Figure 4.
Time series plot for ARIMA.
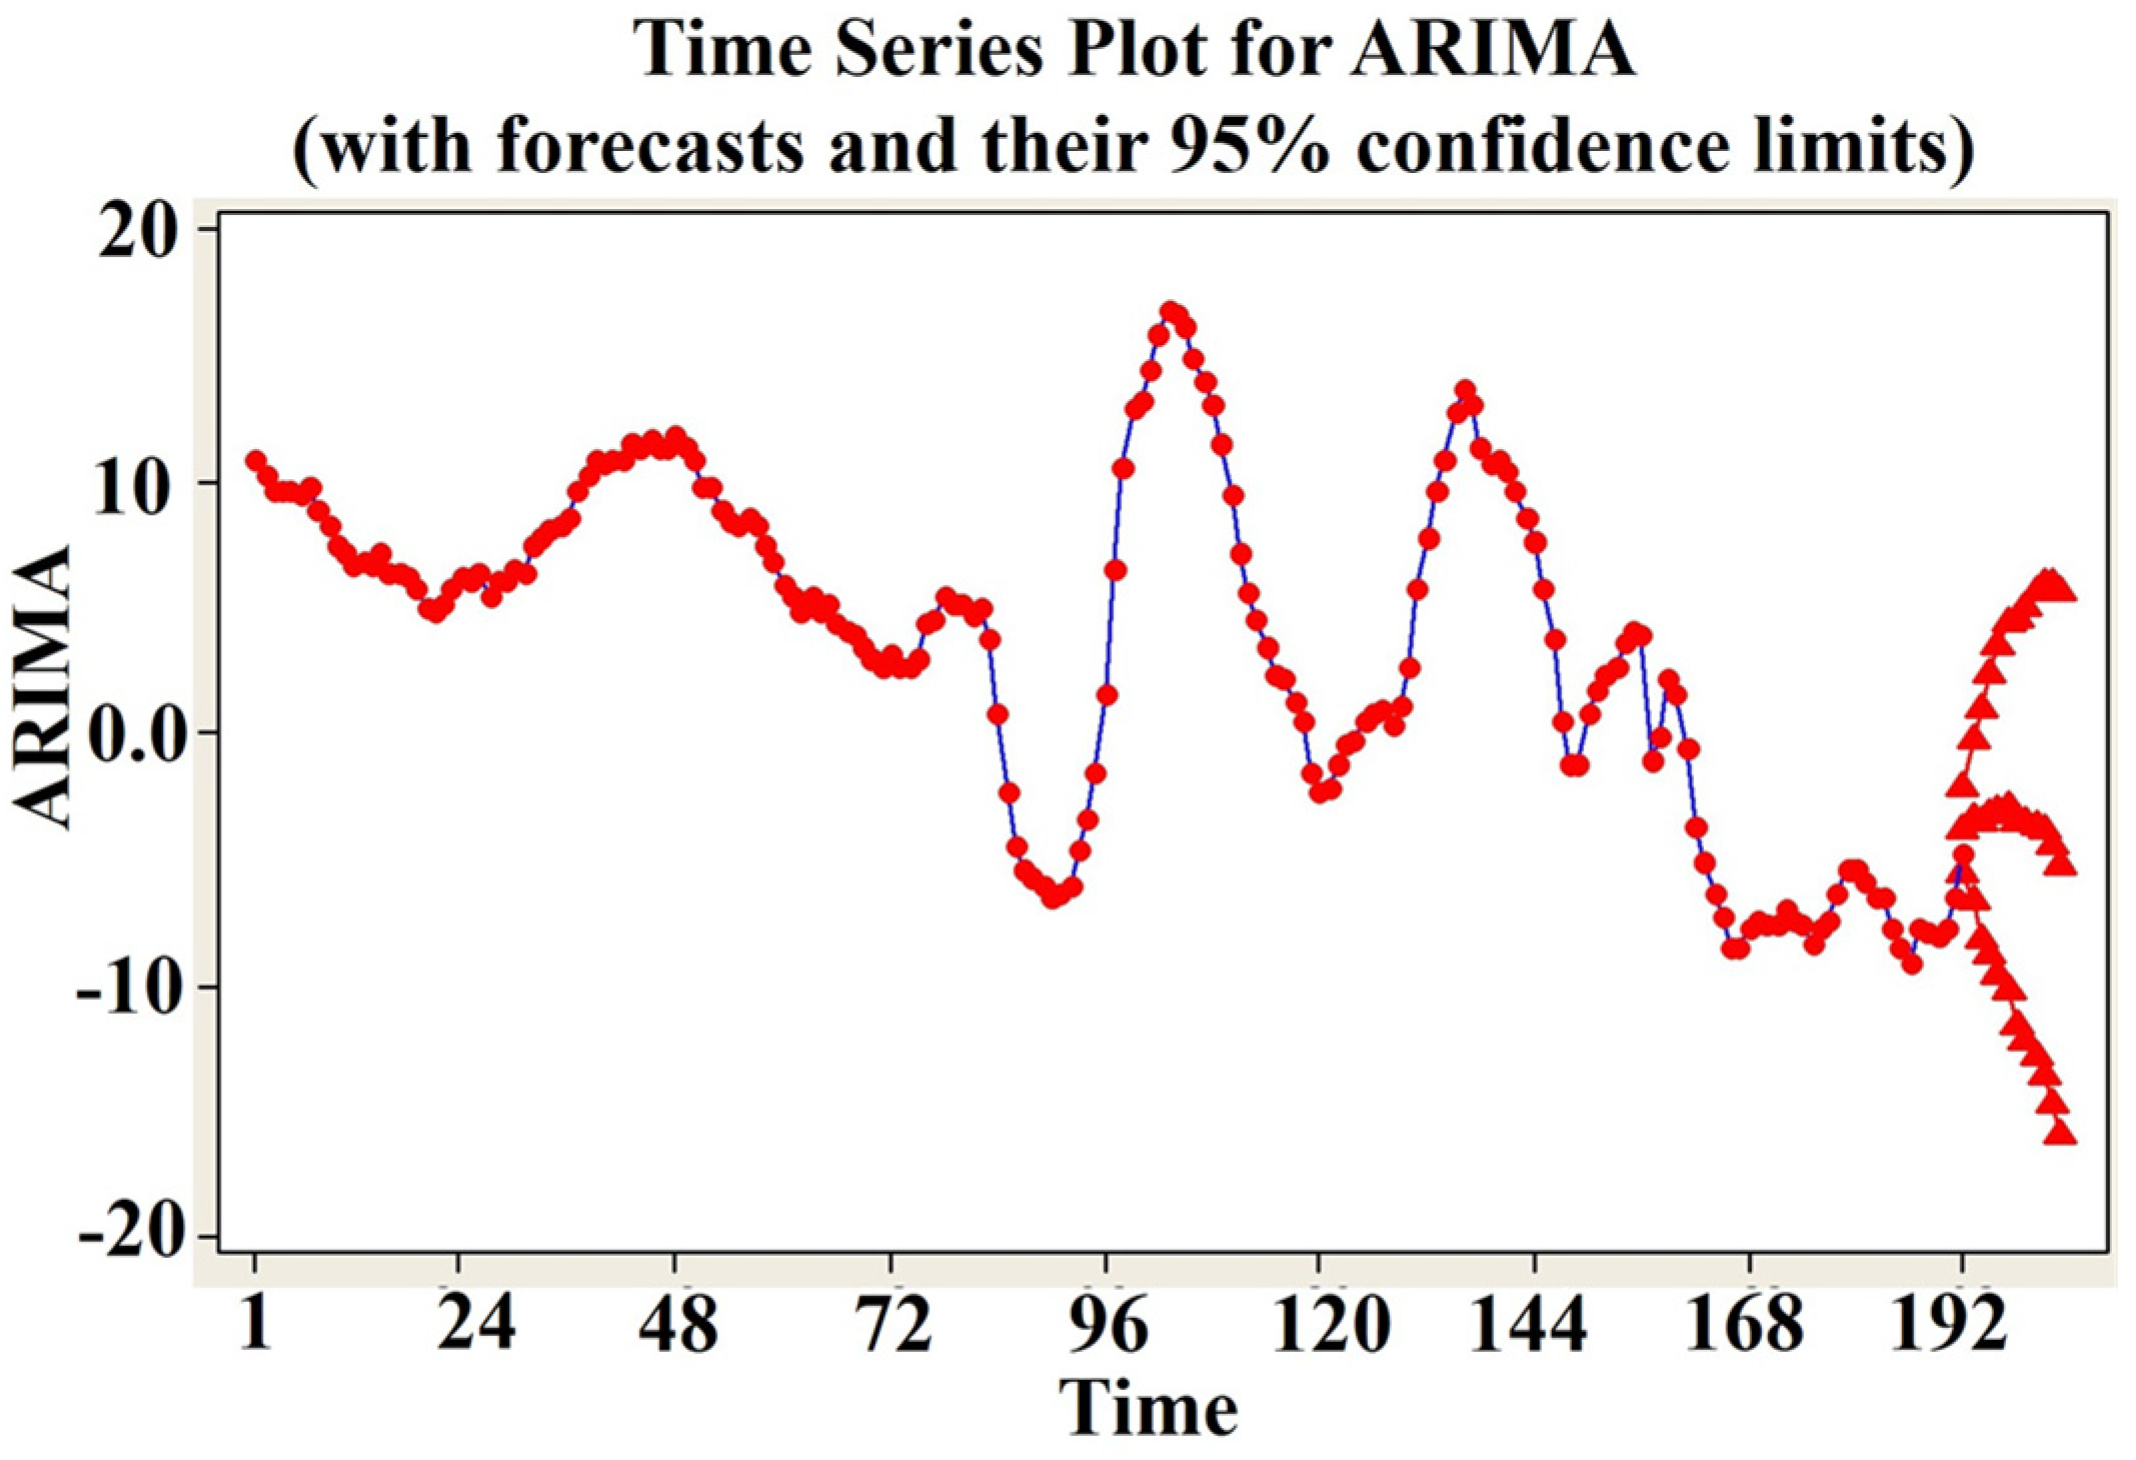
Figure 5.
Time series plot of ARIMA and GDP.

Figure 6.
The architecture of the ARIMA–NEWFM model proposed in this study.
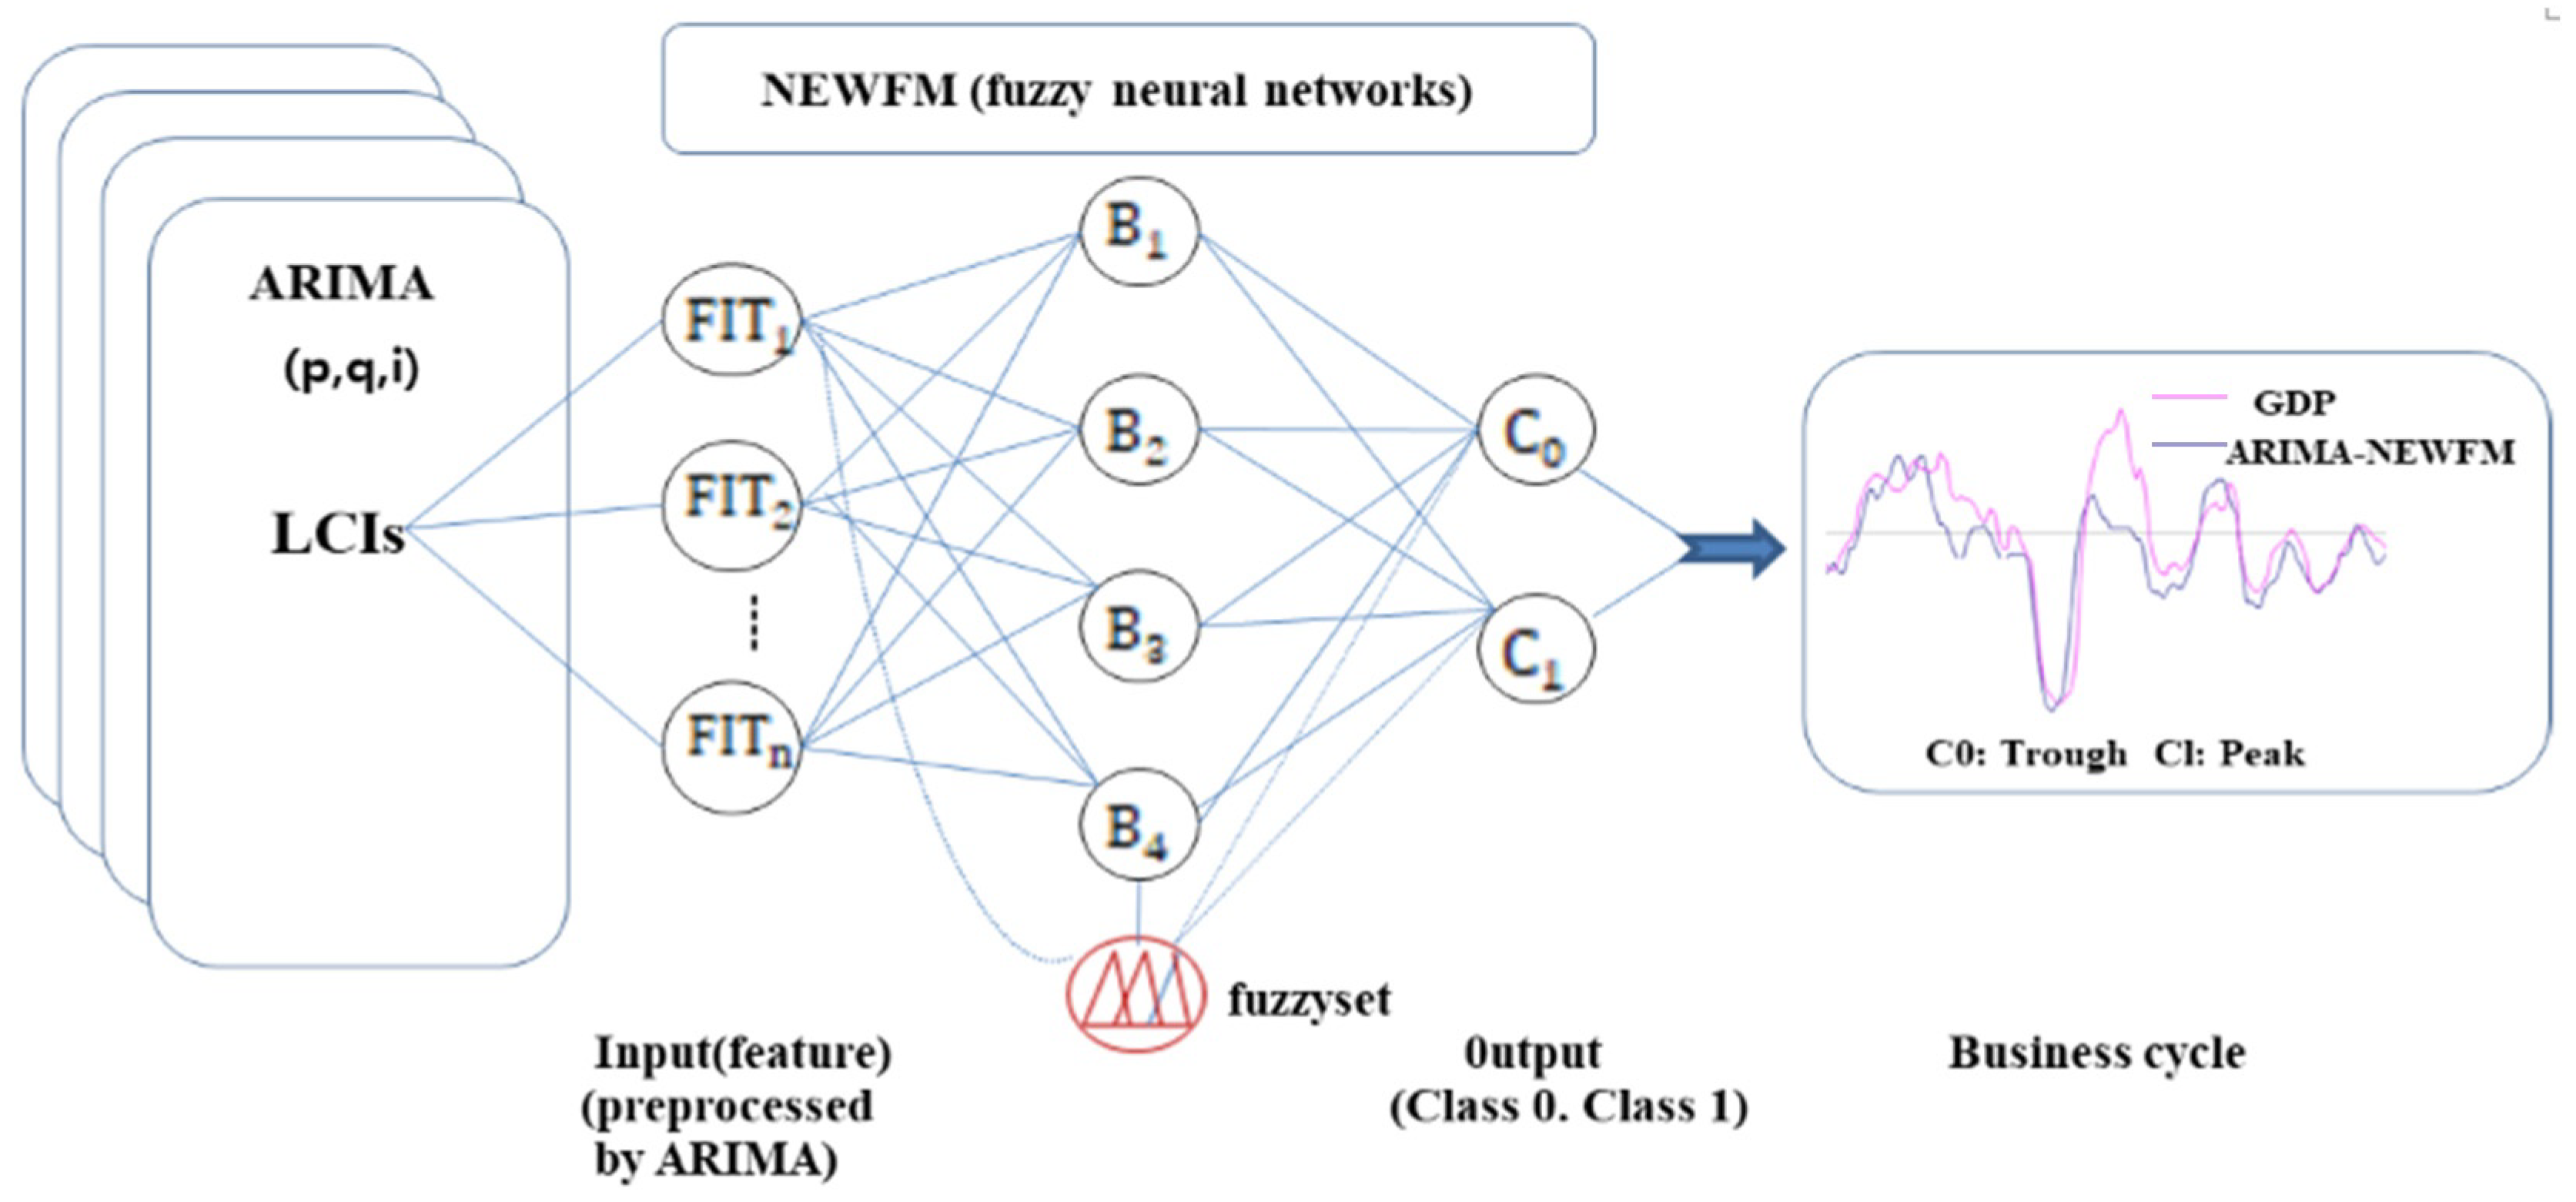
Figure 7.
Hyperboxes by LCI, each of which contains the classification rules for Class 0 (trough) and Class 1 (peak).
Figure 7.
Hyperboxes by LCI, each of which contains the classification rules for Class 0 (trough) and Class 1 (peak).

Figure 8.
Forecasting result by ARIMA–NEWFM model.
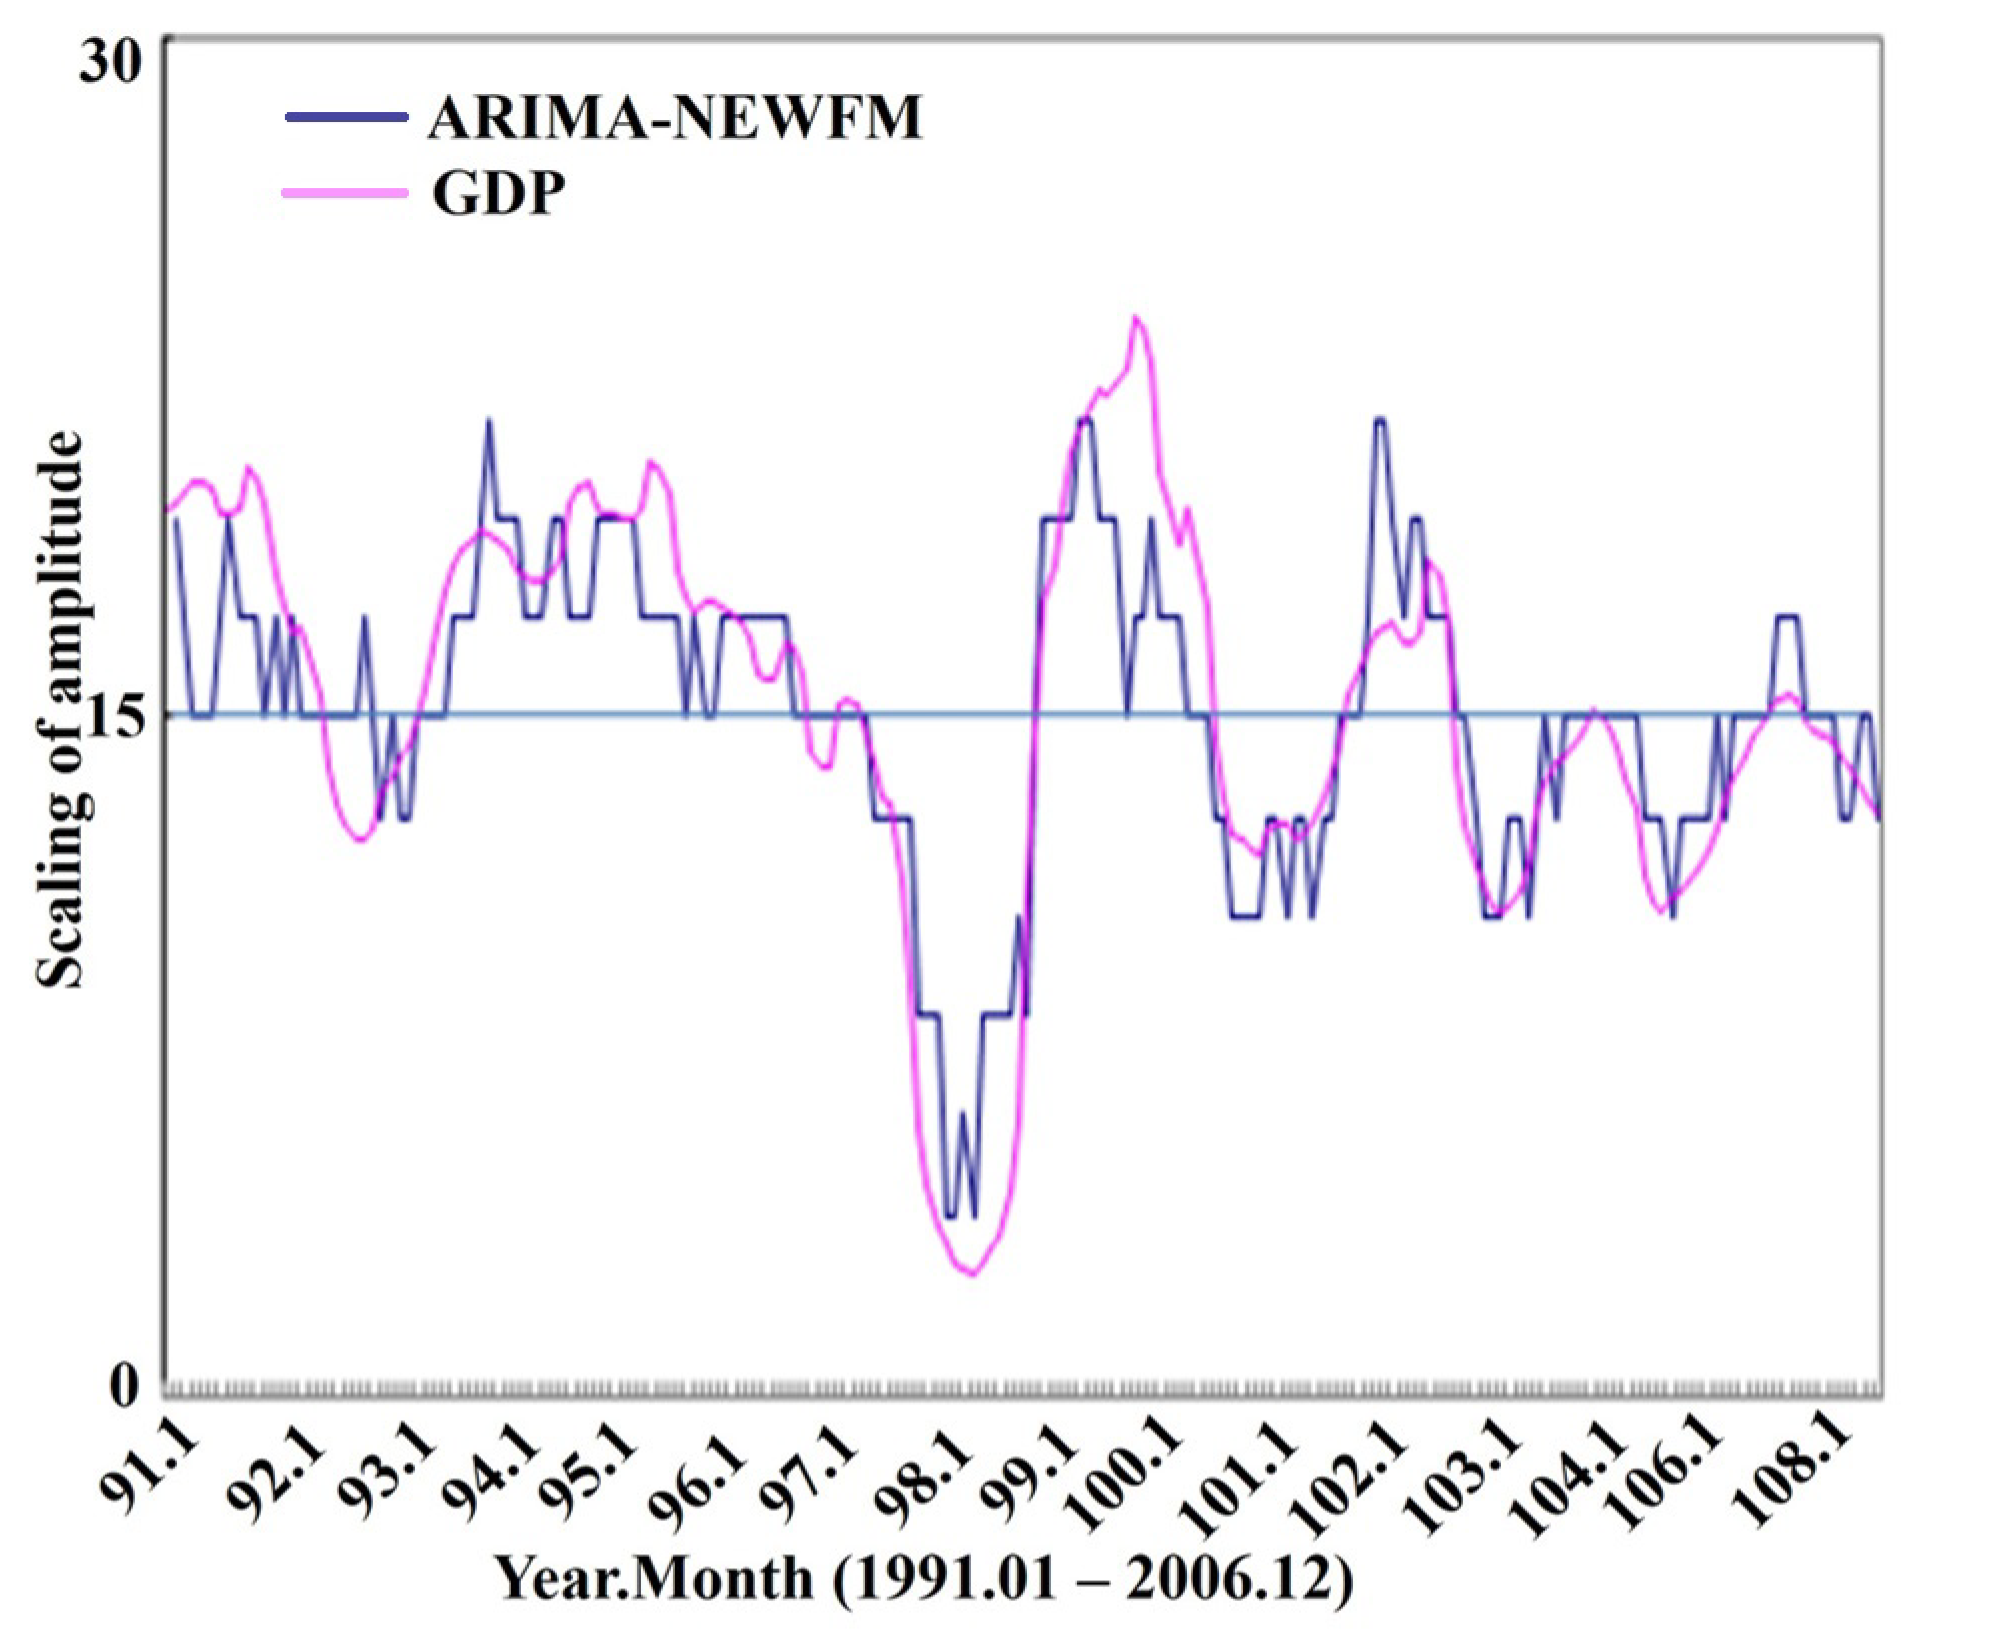
Figure 9.
Forecasting results after comparison of ARIMA–NEWFM and ARIMA models.

Table 1.
Dataset Configuration.
| Constituents of LCI (Input) | Number of Data Instances | Target | Trough (Class 0) | Peak (Class 1) | |
|---|---|---|---|---|---|
| Training (Fitting) | Testing (Forecast) | ||||
| Dataset related to jobs, consumption, trade, production, and finance | 180 (1991.1–2005.12) | 12 (2006.1–2006.12) | GDP | GDP < 5.5% (GDP average growth rate) | GDP > 5.5% (GDP average growth rate) |
Table 2.
Estimates of parameters for the model.
| (a) Final Estimates of Parameters | ||||
| Type | Coef. | SE Coef. | T-Value | p-Value |
| AR 1 | 1.0245 | 0.0887 | 11.55 | 0.000 |
| AR 2 | 0.169 | 0.137 | 1.23 | 0.221 |
| AR 3 | −0.2837 | 0.0875 | −3.24 | 0.001 |
| MA 1 | 0.0888 | 0.0743 | 1.19 | 0.234 |
| MA 2 | 0.1303 | 0.0723 | 1.80 | 0.073 |
| MA 3 | 0.7640 | 0.0644 | 11.86 | 0.000 |
| Constant | −0.000106 | 0.000119 | −0.89 | 0.376 |
| Differencing: 1 regular difference | ||||
| Number of observations: original series 192, after differencing 191 | ||||
| (b) Residual Sums of Squares | ||||
| DF | SS | MS | ||
| 184 | 0.115198 | 0.0006261 | ||
| Back forecasts excluded | ||||
| (c) Modified Box–Pierce (Ljung–Box) Chi-Square Statistic | ||||
| Lag | 12 | 24 | 36 | 48 |
| Chi-Square | 52.71 | 81.40 | 96.38 | 102.08 |
| DF | 5 | 17 | 29 | 41 |
| p-Value | 0.000 | 0.000 | 0.000 | 0.000 |
Table 3.
Classification performance of ARIMA.
| Data | Classification Rate (%) | Error Rate (%) |
|---|---|---|
| Training (year/month) 180 (91/1 to 05/12) | 83.79 | 16.21 |
| Forecasting (year/month) 12 (06/1 to 06/12) | 83.33 | 16.67 |
Table 4.
Classification performance of ARIMA–NEWFM Model.
| Data | Classification Rate (%) | Error Rate (%) |
|---|---|---|
| Training (year/month) 180 (91/1 to 05/12) | 91.61 | 8.39 |
| Forecasting (year/month) 12 (06/1 to 06/12) | 91.61 | 8.39 |
Table 5.
Comparison of ARIMA–NEWFM and ARIMA.
| Data | Classification Rate (%) | |
|---|---|---|
| ARIMA–NEWFM | ARIMA | |
| Training (year/month) 180 (91/1 to 05/12) | 91.61 | 83.79 |
| Forecasting (year/month) 12 (06/1 to 06/12) | 91.61 | 83.33 |
Table 6.
Summation of the analysis using linear regression.
| Models | GDP | |
|---|---|---|
| (%) | ||
| ARIMA–NEWFM | 71.0 | 2.0471 |
| ARIMA | 69.1 | 2.1696 |
Table 7.
Analysis results using the Minitab tool and linear regression method.
| Regression Analysis | ||||||||||||||||||||
| GDP versus ARIMA–NEWFM | GDP versus ARIMA | |||||||||||||||||||
| regression equation | GDP = 0.122 + 0.864 ARIMA–NEWFM | GDP = 0.237 + 0.812 ARIMA 191 cases used, 1 case contains missing values | ||||||||||||||||||
| Predictor | Constant | ARIMA–NEWFM | Constant | ARIMA | ||||||||||||||||
| Coef. | 0.12236 | 0.86434 | 0.23706 | 0.81173 | ||||||||||||||||
| SE Coef. | 0.02634 | 0.04010 | 0.02224 | 0.03948 | ||||||||||||||||
| T | 4.65 | 21.55 | 10.66 | 20.56 | ||||||||||||||||
| p | 0.000 | 0.000 | 0.000 | 0.000 | ||||||||||||||||
| S = 0.103798, R-Sq = 71.0%, R-Sq(adj) = 70.8% | S = 0.107141, R-Sq = 69.1%, R-Sq(adj) = 68.9% | |||||||||||||||||||
| Analysis of Variance | ||||||||||||||||||||
| Source | DF | SS | MS | F | P | DF | SS | MS | F | P | ||||||||||
| Regression | 1 | 5.0048 | 5.0048 | 464.52 | 0.000 | 1 | 4.8518 | 4.8518 | 422.66 | 0.000 | ||||||||||
| Residual Error | 190 | 2.0471 | 0.0108 | 189 | 2.1696 | 0.0115 | ||||||||||||||
| Total | 191 | 7.0518 | 190 | 7.0214 | ||||||||||||||||
Disclaimer/Publisher’s Note: The statements, opinions and data contained in all publications are solely those of the individual author(s) and contributor(s) and not of MDPI and/or the editor(s). MDPI and/or the editor(s) disclaim responsibility for any injury to people or property resulting from any ideas, methods, instructions or products referred to in the content. |
© 2024 by the authors. Licensee MDPI, Basel, Switzerland. This article is an open access article distributed under the terms and conditions of the Creative Commons Attribution (CC BY) license (https://creativecommons.org/licenses/by/4.0/).
Share and Cite
MDPI and ACS Style
Chai, S.H.; Lim, J.S.; Yoon, H.; Wang, B. A Novel Methodology for Forecasting Business Cycles Using ARIMA and Neural Network with Weighted Fuzzy Membership Functions. Axioms 2024, 13, 56. https://doi.org/10.3390/axioms13010056
AMA Style
Chai SH, Lim JS, Yoon H, Wang B. A Novel Methodology for Forecasting Business Cycles Using ARIMA and Neural Network with Weighted Fuzzy Membership Functions. Axioms. 2024; 13(1):56. https://doi.org/10.3390/axioms13010056
Chicago/Turabian StyleChai, Soo H., Joon S. Lim, Heejin Yoon, and Bohyun Wang. 2024. "A Novel Methodology for Forecasting Business Cycles Using ARIMA and Neural Network with Weighted Fuzzy Membership Functions" Axioms 13, no. 1: 56. https://doi.org/10.3390/axioms13010056
Note that from the first issue of 2016, this journal uses article numbers instead of page numbers. See further details here.