
Optimizing Supplier Selection and Order Lot-Sizing Decisions in a Two-Stage Supply Chain

The Harold and Inge Marcus Department of Industrial and Manufacturing Engineering, The Pennsylvania State University, University Park, PA 16802, USA
*
Author to whom correspondence should be addressed.
Axioms 2023, 12(7), 615; https://doi.org/10.3390/axioms12070615
Submission received: 27 March 2023
/
Revised: 22 May 2023
/
Accepted: 13 June 2023
/
Published: 21 June 2023
(This article belongs to the Special Issue Applied Mathematical Modeling and Optimization)
Abstract
:This paper analyzes different lot-sizing policies for the supplier selection and order allocation problem in a two-stage supply chain. The supply chain consists of multiple candidate suppliers and a single buyer. In this system, selected suppliers produce a product in batches at finite production rates, ship it to the buyer, and the buyer sells it to the market at a constant demand rate. Our goal is to evaluate two lot-sizing policies and select the one that optimizes the supply chain by minimizing the total cost and maximizing supplier efficiency. A bi-objective mixed-integer nonlinear programming (BOMINLP) model is proposed. The first objective consists of the development of a coordination mechanism for supplier selection and order allocation that minimizes the entire supply chain cost, and the second objective comprises a data envelopment analysis (DEA) approach to evaluate the overall performance of suppliers to optimize supplier efficiency. Then, the lot-for-lot and order frequency policies are applied to the BOMINLP model separately to determine the set of selected suppliers as well as the corresponding order quantities and number of orders allocated to each selected supplier per replenishment cycle. Numerical examples that illustrate the solution approach and compare the two lot-sizing policies are provided.
Keywords:
supply chain management; supplier selection; inventory lot sizing; finite production rates; data envelopment analysisMSC:
90B50; 90C11; 90C291. Introduction
In the supply chain management (SCM) field, choosing the appropriate set of suppliers to provide materials and components to a manufacturer or products to a retailer is a widespread problem that has attracted a lot of attention for decades. In today’s competitive global market, customers with high expectations frequently desire supply chains to improve their comprehensive capabilities, including lower costs and higher efficiency. On the buyers’ side, managers of purchasing departments are constantly looking for competitive suppliers that can meet customers’ needs and maintain a long-term relationship with them. However, most buyers contract orders to suppliers for production instead of manufacturing products by themselves. Therefore, buyer–supplier coordination is critical to secure profit for both parties [1].
Suppliers are regularly seeking solutions to reduce their price without losing the quality of both product and service to be more competitive in the market. Hence, buyers and suppliers sometimes have different goals. For example, disagreements arise when buyers want suppliers to maximize quality and efficiency while suppliers want to minimize their costs. A solution to this disagreement can be obtained in a constructive way through the development of a buyer–supplier inventory coordination mechanism, where buyers and suppliers cooperate in optimizing the overall performance of the supply chain, leading them to decisions that benefit all system members [2].
In this study, we examine the impact of different lot-sizing policies on supplier selection and order allocation that minimize the overall supply chain cost in a multi-supplier single-buyer supply chain. However, according to previous studies, it is not adequate to select suppliers by just considering the supply chain cost. It is better to identify all the appropriate criteria and apply the concept of efficiency to overcome this limitation. Thus, by using data envelopment analysis (DEA) and defining the most relevant criteria, it is possible to evaluate the performance of each supplier, determine their efficiency score, and select the most efficient ones [3,4]. Accordingly, we propose a bi-objective mixed-integer nonlinear programming (BOMINLP) model with the objectives of minimizing cost and optimizing supplier efficiency. The global criterion method (GCM) is applied to normalize and allocate weights to the objective functions of the model by considering the viewpoint of decision-makers [5]. GCM allows decision-makers to consider the trade-off between minimizing cost and maximizing the supply chain efficiency simultaneously. Accordingly, the model’s output provides an optimal solution for efficient supplier selection and order allocation while minimizing the cost and maximizing the efficiency of the supply chain under assigned weights [4]. The proposed model considers finite production rates for candidate suppliers and a fixed demand rate for the buyer. All suppliers produce the same product with negligible differences in quality.
The rest of this paper is organized as follows. A literature review of relevant studies is provided in Section 2. The problem statement is introduced in Section 3. Mathematical formulations for the lot-for-lot and order frequency policies taking into account supplier selection, inventory coordination, and DEA are presented in Section 4. In Section 5, results of a numerical example are presented and analyzed. Finally, Section 6 provides conclusions from our study and suggestions for future research.
2. Literature Review
Over the past decade, e-commerce has become an essential part of the retail industry, experiencing an annual growth between 14% and 17% according to the U.S. Census Bureau [6]. Due to their rapid development, supply chain management and buyer–supplier coordination in retail industries are crucial processes that have become increasingly complex in recent years because they involve designing, planning, and monitoring the interactions with suppliers. In this section, a literature review of scholarly work related to two critical issues in supply chain optimization is performed: supplier selection and buyer–supplier coordination.
2.1. Supplier Selection
There is a large amount of literature that focuses on supplier evaluation and selection methods. Different decision-making methods have replaced the traditional cost-based method, considering both qualitative and quantitative factors, and evaluating the performance of candidate suppliers based on multiple conflicting criteria. Dickson [7] recognized and ranked 23 criteria in suppliers’ evaluation and selection and is considered as one of the trailblazing works in the supplier selection field. Weber et al. [8] reviewed and assorted 74 related articles published since 1966 and concluded that the three most commonly used and essential criteria for supplier selection are cost, delivery performance, and product quality. Kleinsorge et al. [9] employed a data envelopment analysis (DEA) model to assess the comparative efficiency of sustainable supplier selection in the presence of cardinal as well as ordinal data. Narasimhan et al. [10] proposed a simple framework for supplier evaluation and selection by applying a DEA model to evaluate available suppliers with multiple inputs and outputs. Ho et al. [11] comprehensively reviewed articles related to multi-criteria decision-making approaches for supplier evaluation and selection from 2000 to 2008. They noticed that the most popular individual method was DEA, and the most popular integrated method was AHP-GP (analytic hierarchy process–goal programming). In addition, they observed that the traditional single criterion approach, which is focused on the lowest cost, is no longer the most widely adopted method in modern supply management. The evidence is that companies tend to use multiple criteria, such as quality, delivery, price, and cost, to evaluate supplier performance. Chai et al. [12] reviewed 123 articles published between 2008 and 2012 on applying decision-making methods for supplier selection. These articles are divided into seven categories according to different uncertainties to examine the research trend of uncertain supplier selection. Under this framework, they studied 26 decision-making methods, including DEA, from three perspectives: multicriteria decision-making (MCDM) techniques, mathematical programming (MP) techniques, and artificial intelligence (AI) techniques. The most widely used methods for supplier selection at that time include fuzzy sets [13], mixed-integer nonlinear programming (MINLP) [14], GP [15], AHP [16], analytic network process (ANP) [17], and DEA [18]. Zimmer et al. [19] reviewed up to 143 related articles from 1997 to 2014. They concluded that the fuzzy, AHP, and ANP methods dominate the current research studies. Chai and Ngai [20] systematically reviewed articles published from 2013 to 2018 that orient various decision-making techniques in supplier selection problems. Emerging techniques such as quality function deployment (QFD), Monte Carlo methods, multiagent systems, Markov chain simulation, and triple bottom line (TBL) are also discussed in this work. Islam et al. [21] proposed a hybrid approach that integrated machine learning and optimization models for supplier selection and order allocation planning, which leveraged historical data to predict supplier performance and optimize order allocation decisions for multiple criteria, including cost, quality, and lead time. Tong et al. [22] proposed an extended the PROMETHEE II approach for sustainable supplier selection in small- and medium-sized enterprises (SMEs), which consider multiple criteria, including environmental, social, and economic dimensions, and showed that the proposed approach can provide a useful tool for SMEs to achieve sustainable supplier selection and enhance their competitiveness in the market. Hanh et al. [23] proposed a pricing strategy and order quantity allocation model for a three-echelon supply chain with price-sensitive demand, which maximizes the total profit of the supply chain by determining optimal pricing decisions and order allocation policies for the manufacturer, distributor, and retailer. Joy et al. [24] analyzed a decision support system (DSS) for supplier selection in the glove industry, which integrated MCDM methods, expert opinions, and a knowledge-based system, and concluded that the DSS provides an effective and reliable tool for supplier selection. Saputro et al. [25] proposed a hybrid approach that combines MCDM and simulation-optimization techniques for strategic supplier selection, which can capture the dynamic and uncertain nature of the decision-making problem and interdependencies between different criteria.
2.2. Buyer–Supplier Coordination
Inventory management has always been one of the main factors in supplier selection problems. Inventory is considered one of the most critical assets of a company because the inventory level can directly affect the overall cost and resulting profit of the company’s shareholders. Goyal [26] examined a single-buyer single-vendor system with an infinite production rate with the objective of minimizing buyer’s and vendor’s costs in the early research on buyer–vendor coordination models. Cachon and Lariviere [27] studied revenue-sharing mechanisms through a game theoretical model, within a single-vendor single-buyer supply chain model. They compared these types of agreements with buyback policies and quantity discount schedules. Jaber et al. [28] established a coordination mechanism based on quantity discounts for maximizing a three-level supply chain performance under price-sensitive demand. They developed a subsequent profit-sharing model to split the benefits achieved through coordination. Sarmah et al. [29] explored profit-sharing within a two-stage supply chain using credit as the mechanism for surplus transfers. Goyal and Gupta [30] reviewed published literature on handling integrated inventory models (buyer–supplier coordination) and concluded that two-stage buyer–vendor inventory coordination models enable the net profit to be fairly distributed to all coordinators in the supply chain system according to the discount policy.
Researchers have studied supply chain’s buyer–vendor coordination problems in the past decades with different assumptions and objectives. Chen [3] suggested a framework firstly using the strengths, weaknesses, opportunities, and threats (SWOT) analysis approach as a framework to evaluate the company’s competitive position and develop a strategic plan. Then, they choose candidate suppliers based on the criteria and indicators of supplier selection. Finally, a data envelopment analysis (DEA) model is applied to determine the optimal set of suppliers. Kamali et al. [31] developed a multi-objective MINLP integrated inventory model in which quantity discount schemes are used to optimize the overall performance of a single-buyer multiple-vendor supply chain by minimizing the total system cost, including the cost of the buyer and selected suppliers, the number of defective items, and number of late deliveries. Hammami et al. [32] studied the supplier selection problem under uncertain fluctuating exchange rates and price discounts using the mixed-integer scenario-based stochastic programming method. Giri and Bardhan [33] developed a buyer–vendor coordination model to find the optimal delivery batch size and number of shipments that minimize the system average cost in a single-vendor single-buyer supply chain with a constant production rate and a demand rate dependent on the on-hand inventory of buyers. Adeinat and Ventura [34] proposed an MINLP model for a single-buyer multi-supplier supply chain that produces a single product to determine the optimal strategy for setting the selling price and replenishment cycle. Karush–Kuhn–Tucker conditions were applied to examine the influence of supplier capacity changes on the optimal solution. Hariga et al. [35] studied a single-buyer single-vendor case with finished products packed in returnable transport items (RTIs). They concluded that renting RTIs is optimal to increase return under a high shortage cost and the risk of late RTI returns. In addition, they showed that the supply chain’s performance is highly dependent on the average RTI return time.
Yousefi et al. [36] presented a multi-objective approach for testing the impact of visibility in the supplier selection problem by applying GCM to integrate objectives including maximizing supplier visibility, minimizing the effect of defective or delayed parts, and minimizing the cost of the supply chain. Adeinat and Ventura [37] developed an MINLP model to maximize the profit per time unit for the integrated pricing, supplier selection, and inventory replenishment problem in a serial supply chain under price-sensitive demand. In addition, they provided a heuristic algorithm which can deal with the problem promptly. Yousefi et al. [4] proposed a two-stage hybrid model under a fixed demand rate for efficient supplier selection, order allocation, and pricing in a supply chain concerning coordination among members. Duan and Ventura [38] presented a two-stage piecewise-linear approximation methodology to solve the joint pricing, supplier selection, and inventory replenishment problem, and modeled the price-sensitive demand using the logit function. They concluded that the logit demand function could be a suitable choice to capture the global price change in real-life applications by comparing it with different price-sensitive demand functions on pricing and replenishment decisions. Ventura et al. [1] studied a supplier selection and order quantity allocation problem in a two-stage supply chain with single-buyer and multiple candidate suppliers under price-sensitive demand and finite production rates. They presented two MINLP models to find optimal solutions of supplier selection, retail price, order quantity, and number of orders per replenishment cycle for each selected supplier. Liberopoulos and Deligiannis [39] developed an optimal inventory control policy for a supplier when the buyer’s purchase decision is influenced by past service levels, which considers the buyer’s ordering behavior and the supplier’s capacity constraints and trade credit terms, and they showed that the optimal policy can achieve substantial cost savings for both parties. Schmelzle and Mukandwal [40] investigated the impact of supply chain relationship configurations on supplier performance by analyzing buyer–supplier relationships in the aerospace industry, which identified the key dimensions of relationship quality, including trust, communication, and coordination, and they showed that high-quality relationships lead to improved supplier performance in terms of cost, quality, and delivery. Ventura et al. [41] studied a multi-period dynamic supplier selection and inventory lot-sizing problem with multiple products in a serial supply chain which incorporated a richer cost structure involving joint replenishment costs for raw material replenishment and production, and an accurate representation of the transportation costs using a vector of full-truck load costs for different size trucks. They proposed two mixed-integer linear programming formulations: integrated and sequential. The integrated model solves the problem to optimality while the sequential approach provides near optimal solutions in a timely manner. Rohaninejad et al. [42] proposed an integrated lot-sizing and scheduling model that used machine learning techniques to mitigate uncertainty in demand and processing time, which leverages historical data to predict demand and processing time and optimizes lot-sizing and scheduling decisions to minimize the total cost while ensuring customer satisfaction and operational efficiency.
3. Problem Statement
In this study, we consider a supply chain consisting of a single buyer and multiple suppliers. We are interested in selecting efficient suppliers and allocating appropriate orders to them to satisfy the market demand, minimize the total cost and maximize the overall efficiency of the supply chain. Figure 1 shows the structure of the supply chain. The buyer first estimates the product demand through analysis and forecasting on the collected market data. Later, the buyer selects the preferred set of suppliers to replenish the inventory to ensure the right amount of stock to meet customer demand at minimum cost. In this study, a bi-objective model is developed to support the buyer’s decision-making process. The model provides an inventory coordination mechanism between the buyer and selected suppliers that minimizes the supply chain cost while considering two different lot-sizing policies and maximizes supplier efficiency using DEA.
Structurally, our approach integrates buyer–supplier coordination and DEA. The buyer–supplier coordination model aims at calculating the optimal order quantity and order frequency for each selected supplier within a replenishment cycle that minimizes the supply chain’s total cost. This cost includes buyer’s purchasing cost, ordering cost, and inventory holding cost, and supplier’s production cost, setup cost, and inventory holding cost. A DEA model is applied to evaluate the efficiency of suppliers. Selected suppliers must be able to fulfill the buyer’s demand according to relevant evaluation standards. Finally, a bi-objective model is formulated by combining the buyer–supplier coordination and DEA models.
DEA is a nonparametric method in operations research and economics to estimate production frontiers [43]. It produces a single aggregate measure of relative efficiency among comparable units, called decision making units (DMUs), which is a function of the inputs and outputs of processes operating at the DMUs [44]. Inputs cover elements that can be reduced by decision-makers to improve the supply chain system, such as cost, defect rate, and delivery delay. On the other hand, outputs include profitability, quality, and delivery reliability that decision-makers can increase to make the supply chain system more competitive.
Two objective functions are considered in this study. The first objective function, , represents the total cost of the supply chain and should be minimized. The second objective function, , represents the supply chain efficiency and should be maximized. The two objective functions act against each other, which means that we cannot achieve minimum supply chain cost and maximum supply chain efficiency at the same time. Therefore, we apply the global criterion method (GCM) and derive the final objective function, , allowing decision-makers to assign weights to objective functions and based on how much they value these objectives [45]. The use of GCM can help decision-makers adjust the supplier selection and order allocation strategy to meet the changing demand of the market.
Yousefi et al. [4] proposed a model that only allows a single buyer to assign one order to each selected supplier per replenishment cycle, as shown in Figure 2. However, it is possible to improve their model by applying different lot-sizing policies to reduce the supply chain’s total cost and improve the supply chain efficiency . In this study, we apply the lot-for-lot and order frequency policies to test their performance in minimizing the supply chain’s total cost and maximizing the supply chain efficiency. A lot-for-lot policy is usually used when storage space is limited or for intermittent in-demand items. This policy is characterized by low inventory holding costs, but high setup costs. The order frequency policy is very similar to the lot-for-lot policy. Suppose the buyer assigns consecutive orders to a supplier. In that case, the supplier can batch the orders and deliver the product in small lots to the buyer. Hence, compared with the lot-for-lot policy, the order frequency policy reduces the overall setup cost for each selected supplier per replenishment cycle. The inventory holding cost of suppliers could be different for this policy because the suppliers’ production rates may be higher or lower than the demand rate. A more detailed explanation can be found in the Section 4.
The following assumptions and notation are used throughout the rest of the paper.
- Assumptions [1]:
| 1. Inventory shortage for the buyer and suppliers is not allowed. |
| 2. Suppliers produce the single product. |
| 3. The market’s demand rate for the product is known and constant over time. |
| 4. The buyer can purchase the required quantity of products from multiple suppliers. |
| 5. Lead-times are either negligible or constant. |
| 6. The production rate of each supplier is finite. |
| 7. None of the suppliers are preselected. |
| 8. The holding cost is proportional to the average inventory. |
- Indices:
| . |
| . |
| . |
| . |
- Parameters:
| Demand rate for the buyer. | |
| Fixed ordering cost for supplier . | |
| Unit price for supplier . | |
| Finite production rate for supplier . | |
| Inventory holding cost per unit and unit time for the buyer. | |
| Inventory holding cost per unit and unit time for supplier . | |
| Production setup cost for supplier . | |
| Variable production cost per unit for supplier . | |
| Amount of the th input for supplier . | |
| Amount of the th output for supplier . | |
| wi | Weight assigned to objective function by the decision-maker. |
| Extremely small positive number. | |
| Extremely large positive number. | |
| Maximum number of suppliers that the buyer can select. | |
| Maximum number of orders submitted to suppliers per replenishment cycle. | |
| Weight assigned to objective function by the decision-maker. | |
| n | Number of candidate suppliers. |
| l | Number of input elements of processes operating at each candidate supplier. |
| s | Number of output elements of processes operating at each candidate supplier. |
- Sets:
| S | Set of candidate suppliers, i.e., . |
| Set of suppliers with a production rate greater than or equal to the demand rate, i.e., . | |
| Set of suppliers with a production rate smaller than the demand rate, i.e., . |
- Variables and functions:
| Buyer’s order quantity of each delivery from supplier . | |
| Proportion of units produced by supplier k per cycle to the buyer’s total demand. | |
| Total purchased quantity from all suppliers per cycle, . | |
| Binary variable that indicates whether supplier is selected. | |
| Total number of orders submitted to supplier per replenishment cycle. | |
| Time needed for supplier to produce order of size . | |
| Time needed to consume supplier ’s order of size . | |
| Replenishment cycle time for the buyer, . | |
| Objective function representing the supply chain’s total cost per time unit. | |
| Objective function representing the supply chain efficiency. | |
| Final bi-objective function. | |
| Variable that helps simplify the objective function and has no practical meaning, . | |
| Variable that helps simplify the objective function and has no practical meaning, . | |
| Inefficiency score for supplier . | |
| Value of the th input for supplier (non-negative). | |
| Value of the th output for supplier (non-negative). | |
| Improvement to the supply chain’s total cost when using different lot-sizing policies. | |
| Utilization level of selected supplier . |
4. Model Development
The model presented in this section evaluates how different lot-sizing policies influence the supply chain efficiency and total cost, including the buyer’s purchasing cost, ordering cost, and inventory holding cost, and suppliers’ production cost, setup cost, and inventory holding cost. The model determines the optimal set of selected suppliers, order quantities, and order frequencies.
This section is organized as follows. We first derive the buyer’s cost functions in Section 4.1. Then, mathematical models for the lot-for-lot and order frequency policies are shown in Section 4.2 and Section 4.3, respectively.
4.1. Buyer’s Cost
The buyer’s cost in the supply chain consists of three components: purchasing cost (), ordering cost (), and inventory holding cost (). In a replenishment cycle, the buyer submits orders of size to selected supplier k. Equation (1) shows that the purchasing cost () per time unit is equal to the total number of units ordered from each selected supplier per replenishment cycle multiplied by the corresponding unit price , i.e., , and divided by the cycle length , where .
In Equation (2), the ordering cost () per time unit is equal to multiplied by the corresponding fixed ordering cost , , and divided by the cycle length.
Equation (3) shows the average inventory from supplier ’s orders in a replenishment cycle, , where the buyer’s inventory of an order received from supplier will steadily go from to in time units, which is the time needed to consume the order of size , i.e., .
In each replenishment cycle, the buyer receives units from selected supplier with corresponding inventory holding cost . Hence, the buyer’s total inventory holding cost () per time unit is calculated by Equation (4).
Finally, the buyer’s total cost per time unit can be written as shown in Equation (5). The three terms in Equation (5) represent the buyer’s entire cost per time unit, including purchasing, ordering, and inventory holding.
4.2. Lot-for-Lot Policy
The lot-for-lot policy is flexible as suppliers only react to actual demand. There is no batching in the production of individual orders. This policy aims to reduce the inventory level as much as possible to minimize the inventory holding costs. However, it increases production setup costs because production starts every time an order is received.
4.2.1. Suppliers’ Cost
The suppliers’ cost includes three components: cost of production (), setup cost (), and inventory holding cost (). Similar to the method of calculating the buyer’s ordering cost, Equation (6) states the cost of production () per time unit of suppliers is equal to the total number of products ordered from each selected supplier per cycle, i.e., , multiplied by the corresponding variable production cost and divided by the cycle length .
Equation (7) shows that each selected supplier incurs in a fixed setup cost every time an order of units is produced. represents the total number of orders submitted to supplier per replenishment cycle. Hence, the setup cost () per time unit is equal to the sum over all suppliers of multiplied by the corresponding fixed setup cost and divided by the cycle length.
In the same way as calculating the buyer’s inventory holding cost, the supplier’s average inventory per time unit, denoted as , can be calculated by Equation (8). represents the time needed for supplier to produce an order of size , which equals . The suppliers’ inventory holding cost ( per time unit is shown in Equation (9).
Finally, the suppliers’ cost () per time unit is displayed in Equation (10), which corresponds to the sum of the three cost components derived above.
4.2.2. Supply Chain’s Total Cost
The supply chain’s total cost per time unit is obtained by adding together the buyer’s and suppliers’ costs, as shown in Equation (11). Equation (12) indicates that our goal is to minimize .
The first objective function needs to be simplified to facilitate calculations for the solver. Equation (13) states that the total purchased quantity from all suppliers each cycle equals the sum of units produced by each selected supplier. The variable here is only used to help simplify the objective function and has no practical meaning, as is the case with in Equation (15). Equation (14) calculates , which is the proportion of units produced by supplier k per cycle to the buyer’s total demand. After performing these transformations, we can simplify Equation (12) by setting and including Equations (13)–(15). Finally, Equation (16) shows the simplified continuous quadratic objective function .
4.2.3. Supply Chain Efficiency
The second objective function represents the supply chain efficiency which is calculated as the sum of each selected supplier’s efficiency. A DEA model is employed to evaluate the efficiency of each supplier, where represents supplier ’s inefficiency score that can be calculated by the DEA model with input and output criteria of DMUs. These criteria are divided into two classes: desirable and undesirable. Undesirable criteria comprise costs, defect rate, and delivery delays. Desirable criteria consist of profitability, quality, and reliability of delivery. According to Equation (27) below, if supplier k is not selected, i.e., , then as well. However, if supplier k is selected, i.e., , then based on Equations (25) and (26), is set between 0 and 1. Detailed calculation of these equations will be given in the constraint subsection of the model. Considering the related constraints, Equation (17) calculates the supply chain efficiency. The purpose of Equation (17) is to select suppliers that maximize the supply chain efficiency.
4.2.4. Final Objective Function Z
Clearly, objective functions and cannot reach their limit at the same time. In other words, optimizing one function will cause the other function to deviate from its optimal point. Thus, GCM is used to simultaneously optimize a global criterion which is a measure of how close the decision maker can get to the ideal solution. GCM determines an optimal solution that minimizes the sum of the relative deviations of both objective functions from their optimal values , [45]. The final bi-objective function using GCM is shown in Equation (18).
With this method, decision-makers can assign different weights to the objective function to satisfy their requirements. In Equation (18), and represent the weights of the objective functions, and and denote the optimal values of and calculated independently. The sum of the weights assigned to the two objective functions must be equal to , i.e., . Note that the objective functions and have different units and may also have different sizes. Therefore, we need to normalize the equations before adding them up with the corresponding weights. Hence, the objective function which needs to be minimized is normalized through . Additionally, the objective function which needs to be maximized is normalized through . In this way, objective functions are normalized into uniform, dimensionless scales. Thus, they can be incorporated in the same equation for further calculations. Finally, GCM is applied to minimize the objective function which combines objective functions and with corresponding weights to find the optimal solution that minimizes and maximizes simultaneously.
4.2.5. Constraints
Due to the simplification of objective function as shown in Equation (16), the corresponding constraints need to be rewritten accordingly. Equation is converted to Equation (19) according to , and .
Supplier consolidation is a strategy that has increased in popularity in the last two decades and is aimed at reducing the number of suppliers by focusing on and strengthening ties with the most successful ones. The benefits of this strategy are to reduce costs, improve quality, and increase efficiency. Equation (20) ensures that the maximum number of selected suppliers is restricted to a limit .
Equation (21) keeps the cycle length within a reasonable range by limiting the sum of orders from all selected suppliers in each replenishment cycle.
Equation (22) guarantees that the buyer only assigns orders to selected suppliers.
According to Equation (13), (14), and (19), Equation (23) replaces
Equation (24) indicates that the proportion of units produced by supplier k per cycle to the total demand must be positive if supplier is selected.
Equation (25) states that the weighted sum of outputs cannot exceed the corresponding weighted sum of inputs. Equation (26) shows the weighted sum of the inputs for each supplier is equal to a binary value. In addition, the input and output data are normalized through this equation to avoid the effect of units in the model when .
Equation (27) calculates the degree of inefficiency of each supplier considering each supplier’s weighted sum of the outputs.
Equations (28) and (29) show that input and output weights for selected suppliers are required to be positive.
According to Equations (13)–(15), Equations (30) and (31) are created and added to the model as constraints due to the change of variables in Equation (16):
Equations (32)–(36) limit the range of variables in the model.
Finally, BOMINLP model implementing the lot-for-lot policy is expressed as follows:
subject to Equations (19)–(36).
4.3. Order Frequency Policy
The order frequency policy allows each selected supplier to produce all orders received from the buyer in a replenishment cycle in a single batch of size and deliver them to the buyer in small lots of size . This policy allows each selected supplier to maintain a low inventory level and reduce the setup cost by having a single setup per replenishment cycle. As we discussed in Section 3, there are two conditions that need to be considered in the relationship between production rate and demand rate when applying the order frequency policy. These two conditions are and , which lead to different inventory holding costs in the single-buyer multi-supplier supply chain with finite production rates [1]. Detailed analysis of both conditions is given in the following paragraphs.
For both conditions, and , according to the previous description of the order frequency policy, the setup cost only occurs once for each selected supplier per replenishment cycle. Hence, Equation (7) that represents the supplier’s setup cost per time unit can be written as shown in Equation (38).
Under the order frequency policy, the suppliers’ inventory holding cost can be determined for the two conditions as shown below.
- Condition 1 :
When the production rates of suppliers are greater than or equal to the demand rate, Equations (8) and (9) can be rewritten as Equations (39) and (40) to represent suppliers’ inventory, , , and inventory holding cost (), as shown in [1].
- Condition 2 :
When the production rates of suppliers are lower than the demand rate, Equations (8) and (9) can be rewritten as Equations (41) and (42) to represent suppliers’ inventory, , , and inventory holding cost (), as shown in [1].
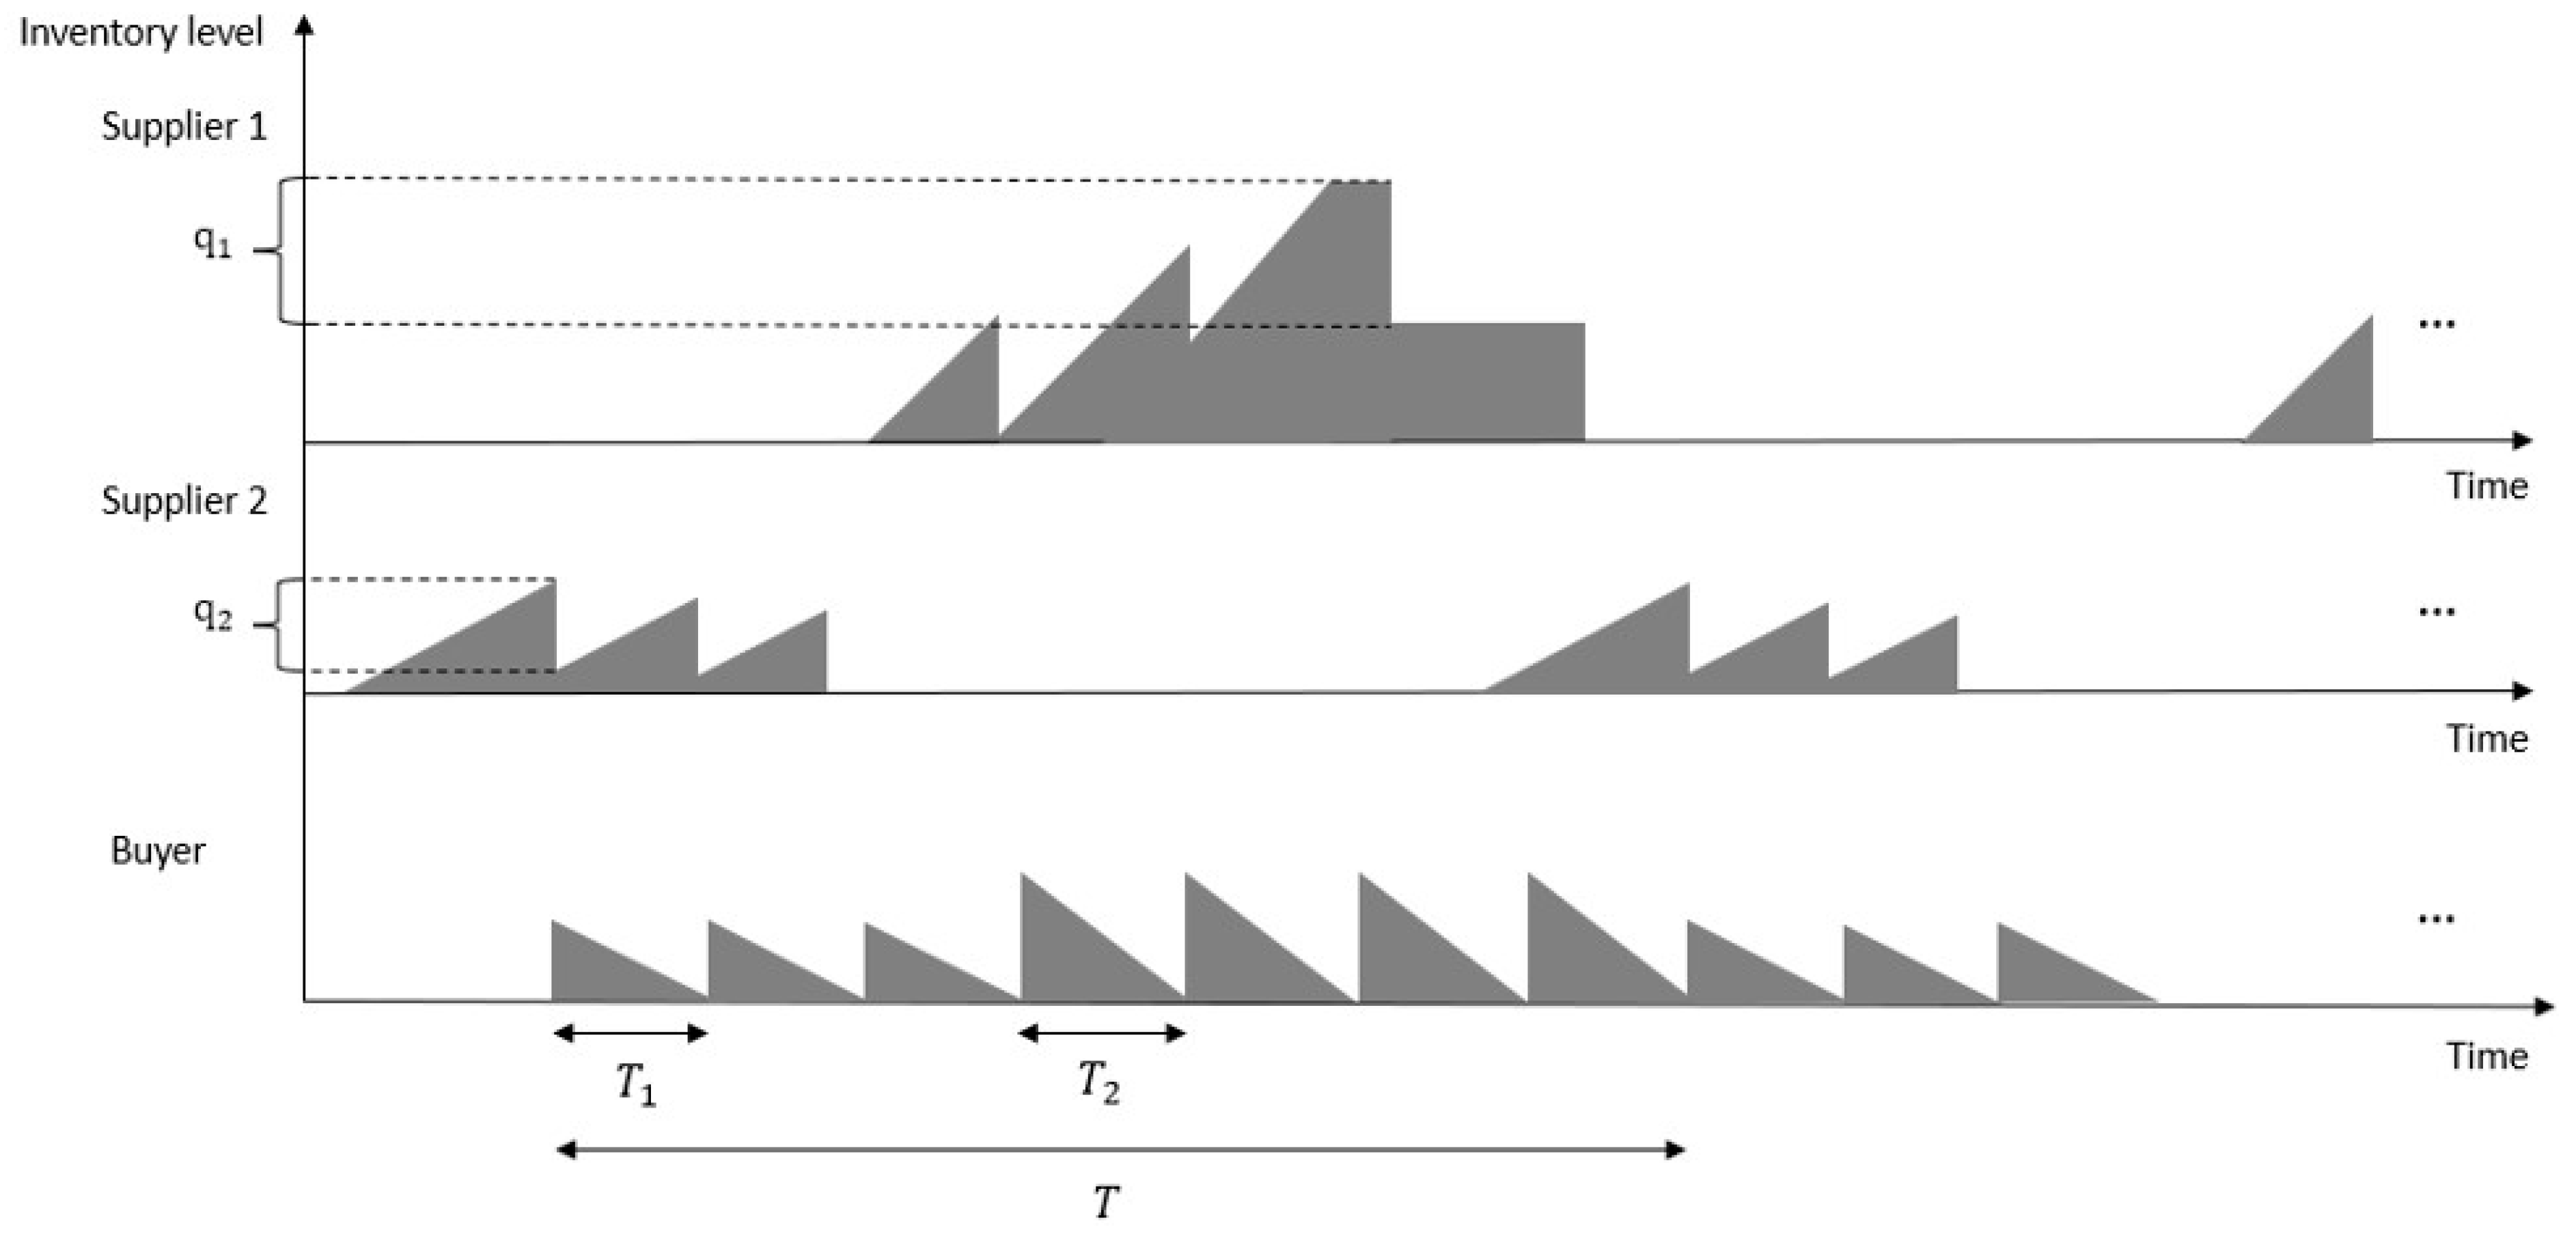
Figure 3 illustrates the inventory levels for a two-supplier system under the order frequency policy with and . In this example, and .
Equation (12) representing the supply chain’s total cost per time unit can be written as Equation (43). Consequently, the final bi-objective function becomes Equation (44) using the supply chain’s total cost in Equation (43) and the supply chain efficiency in Equation (17).
Lastly, BOMINLP model implementing the order frequency policy is expressed as follows:
subject to Equations (19)–(36).
The optimal order quantity and number of orders that should be allocated to each selected supplier per replenishment cycle with optimized supply chain’s total cost and efficiency for the lot-for-lot and order frequency policies under different conditions can be determined by solving models BOMINLP and , respectively.
5. Numerical Example and Analysis
In this section, we examine the performance of the lot-for-lot and order frequency policies which have been employed in BOMINLP models and , respectively. We use the example described in [1] to illustrate the benefits of applying the two different lot-sizing policies. The data is collected from previous studies that focus on supplier selection and inventory lot-sizing problems. Table 1 provides data for the buyer including buyer’s inventory holding cost, maximum number of selected suppliers, and the fixed demand rate. Data for each supplier is given in Table 2, including fixed ordering cost, unit price, setup cost, inventory holding cost, variable production cost per unit, and finite production rate. Note that in this numerical example, Equations (40)–(43) are used for the order frequency policy calculations because according to Table 1 and Table 2. Hence, all the suppliers belong to supplier set and supplier set is empty.
We evaluate the efficiency of each candidate supplier for efficient supplier selection using the DEA model. An input is an element that can be employed by decision-makers to improve the supply chain system, such as shipping cost, defect rate, and delivery delay. An output represents an element, such as profitability, service quality, and delivery reliability, that decision-makers utilize to make the supply chain system more competitive. The input and output data for each supplier are listed in Table 3. Friedman and Sinuany-Stern [46] stated that there is a rule of thumb suggesting that the number of the candidate suppliers (n), inputs (l), and outputs (s) should satisfy n ≥ 3 (l + s). Therefore, in this example, we have one input, two outputs, and ten candidate suppliers, thus satisfying the rule. Note that researchers do not have a unified standard for the precise values of n, l, and s. Still, they all agree that too few suppliers (n) could make the results unreliable.
The input is the total cost of shipments measured by the cost of 100 lbs. per shipment (TC) obtained from an actual Hewlett-Packard (HP) carrier [47]. Each supplier has a fixed TC based on the distance between the production center and the buyer’s warehouse. This situation usually occurs between suppliers and buyers who have a long-term cooperative relationship. In this case, instead of calculating the distance required to ship an order, the driver’s hourly salary and the working hours per day are combined to calculate the shipping cost. The buyer and suppliers agreed on a fixed shipping price per 100 lbs. per shipment to calculate the shipping cost for each delivery more efficiently. The outputs are the ratings for service–quality experience (EXP) and service–quality credence (CRE). The ratings for EXP and CRE provide different aspects of the shipper–carrier relationship. EXP summarizes the totality of contacts and actions between carrier and shipper, based on evaluation of past and present transactions. CRE is future-oriented, defining the shape of expectations of future performance [47]. Kleinsorge et al. [9] use EXP and CRE to demonstrate how these two intangible outputs can be integrated into an overall model of carrier performance. Based on the managers’ satisfaction with each determinant, they gave an arbitrary grade between 0 and 300 points for EXP, and an arbitrary grade between 0 and 100 points for CRE concerning the evaluated carrier.
The input and output data of suppliers employed in [9] were collected from a single HP carrier in a case study that applied DEA for monitoring customer-supplier relationships over 18 periods. In later research, Talluri and Baker [48] separated the data into 18 parts and considered them as 18 different suppliers. They used the data as part of the data set to illustrate their multi-phase mathematical programming approach for effective supply chain design. In addition, they stated that the primary purpose of sorting data this way was to help them illustrate their approach. Hence, the decision-making process was not affected by applying this assumption. The data of each period can represent an independent supplier. Yousefi et al. [4] selected 10-period data from [48] as the input and output data for 10 independent suppliers.
Solutions for the numerical example were found using the Gurobi solver implemented in Python on a Windows 10 PC with a 2.60 GHz Inter® CoreTM i7 CPU and 8 GB of RAM. First, we tested the situation when each selected supplier only receives one order per replenishment cycle. Table 4 shows the results for model with for different sets of weights . By setting , we can simulate the conditions where each selected supplier can only receive one order per cycle which means that no lot-sizing policy is applied due to the limited number of orders in this example. We compared these results with the results of using the lot-for-lot and order frequency policies to determine the benefits of applying different lot-sizing policies. Solutions were found in 0.09 s with a relative optimality gap of 0.0003% for the five cases we considered. In Table 4, we can observe that the supply chain’s total cost and the supply chain efficiency both increase if decision-makers increase the value of . When decision-makers set , the supply chain’s total cost becomes huge because, in this situation, decision-makers only pursue the maximization of the supply chain efficiency score and ignore the need of minimizing the supply chain’s total cost . This result also matches our previous remark that and act against each other. Therefore, we can conclude that increasing the value of can only increase the supply chain’s total cost . Based on this finding, when comparing the results of the lot-for-lot and order frequency policies in the following paragraphs, we will put more focus on the condition that to observe the impact of different lot-sizing policies on . In addition, when , the value of remains equal to 6
Next, we tested the performance of the lot-for-lot policy, i.e., Model . As mentioned in Section 4.2, the lot-for-lot policy can reduce the supplier’s inventory holding cost but generates a setup cost every time an order is produced. Table 5 and Table 6 show detailed results of the lot-for-lot policy when , respectively, with . Solutions were found in 0.46 s and 1.26 s with relative optimality gaps of 0.0001% and 0.0002%, respectively. The utilization level of the selected supplier’s capacity is provided in the last column of the tables. We also show the improvement to the supply chain’s total cost , denoted as . The results indicate that there is a $7.27 improvement to which is not a large amount compared to a million-level cost. The improvement of is not significant because the supplier’s inventory holding cost and the setup cost in this example are low. Then, we performed sensitivity analysis to test if the lot-for-lot policy exhibits better performance when the and values are increased. The sensitive analysis results are shown in Table 7. We can observe that the supply chain’s total cost for each value increases as the and values become larger, but the cost for the larger value of increases at a much slower rate. This observation further enhances our conclusion that lot-for-lot policy can reduce the supply chain’s total cost. In addition, the value of , while using the lot-for-lot policy with different and values, remains unchanged to 6 when .
We also tested the performance of the lot-for-lot policy when different weights are assigned to . Table 8 shows the results of decreasing and increasing . We can see that if decision-makers increase the value of , the supply chain’s total cost increases compared to its results in Table 7, and the supply chain efficiency increases from 6 to 10 as increases. This situation is consistent with the previous assertion that increasing will cause to rise. Note that when , the lot-for-lot policy is still effective because there is still a 50% weight set on . However, when , the lot-for-lot policy cannot reduce because, in this case, the model only aims to maximizing , thus ignoring the need of minimizing .
We then applied the order frequency policy, i.e., Model , to the illustrative example. Table 9 and Table 10 show the results of the order frequency policy under the same conditions as the lot-for-lot policy. The solutions were found in 0.10 s and 12.61 s with relative optimality gaps of 0.0001% and 0.0003%, respectively. Again, the utilization level is listed in the last column of each table. In Table 6 and Table 9, we observe that the order frequency policy provides the same result than the lot-for-lot policy when , , and . According to Equations (12) and (42), the calculation equation of the supply chain’s total cost in lot-for-lot and order frequency policies can be converted to each other when , thus showing the same results. Notably, in this case, the order frequency policy cannot further improve the value of obtained by the lot-for-lot policy because the setup cost for each supplier in the numerical example is fairly low, relative to the supplier’s inventory holding cost . Hence, we will use sensitivity analysis to investigate if the order frequency policy performs better when becomes relatively greater than .
Table 11 provides the sensitivity analysis results of both lot-sizing policies with fixed inventory holding cost and increasing production setup cost values for suppliers when with . The execution time and relative optimality gap for each iteration are shown in the last two columns of the table. In Table 11, we can see that the order frequency policy shows better performance than the lot-for-lot policy as values increase. The improvement of the order frequency policy also gets larger as values increase. This is because the order frequency policy is best when handling situations with high values, relative to values for each supplier. Suppliers gain huge benefits from the order frequency policy by reducing the overall setup cost, thus further reducing the supply chain total cost provided by the lot-for-lot policy.
To further illustrate the benefits of using the order frequency policy, we continue increasing the costs for both lot-sizing policies under different values. The results are shown in Table 12. When , we can see significant improvements in reducing the supply chain’s total cost by using the order frequency policy compared to the results of using the lot-for-lot policy. If decision-makers increase the value of , we can see that increases while the supply chain efficiency increases from 6 to 10. This situation is also consistent with the previous clarification that increasing in will cause to rise. When , the order frequency policy is still effective and showing better performance than the lot-for-lot policy because 50% of the weight set on . However, when , the order frequency cannot further reduce because, in this case, the model only aims at maximizing , thus ignoring the need of minimizing .
6. Conclusions and Extensions
In this study, we have tested the performance of the lot-for-lot and order frequency policies on minimizing the supply chain’s total cost and maximizing the supply chain efficiency for the supplier selection and order allocation problem in a two-stage supply chain with a fixed demand rate and finite suppliers’ production rates. We have shown how different lot-sizing policies and different values of the maximum number of orders submitted to suppliers per replenishment cycle can affect the values of and . Sensitivity analysis results have also indicated that using the lot-for-lot and order frequency policies can both reduce . It is worth noticing that the order frequency policy provides better performance than the lot-for-lot policy when the setup cost of each supplier is fairly high relative to the inventory holding cost . Compared to the lot-for-lot policy, suppliers applying the order frequency policy have a higher inventory level with larger batches. When the setup cost is fairly high relative to the inventory holding cost, the order frequency policy can significantly reduce the production setup cost and create negligible additional inventory holding cost for each supplier, thus providing significant improvement to . Furthermore, the improvement of using the order frequency policy compared to the lot-for-lot policy is not substantial if both the setup cost and inventory holding cost for each supplier are low.
Based on traditional supplier selection problems, we have also considered the customer’s expectation of the continuous growth of service quality (e.g., higher product quality and faster delivery time). At the same time, in the competitive global market, reasonable evaluation and selection of suppliers can also improve the organizations’ competitiveness in the market. Hence, the second objective function , which represents the supply chain efficiency, is used to evaluate the efficiency of candidate suppliers based on various evaluation criteria (e.g., delivery rate, product quality, customer satisfaction, and service level). Finally, we have suggested the use of GCM, which allows decision-makers to decide whether they want to increase the supply chain efficiency by raising costs according to market changes. The results of changing the values are shown in Table 4, Table 8 and Table 12. Based on these results, we can conclude that, by increasing the value of , the efficiency of the supply chain increases, but the total cost also increases. Hence, we do not recommend decision-makers paying full attention to supplier chain efficiency by assigning all the weight to objective function , i.e., , especially when the demand rate is high. According to Table 4, Table 8 and Table 12, this decision can significantly increase the supply chain’s total cost .
There are some limitations of our model as well. First, we assume the demand rate to be fixed. In the real-world market, the demand is usually price-sensitive. Many functions can be used to represent changes in market demand due to price changes, such as the power function, logit function, or others [1,38]. Hence, characterizing demand more realistically is a research direction worth thinking about. Second, to limit the cycle time to a reasonable value, we restricted the maximum number of orders submitted to suppliers per replenishment cycle. Thus, developing alternative strategies to avoid unrealistic cycle lengths can also be a direction of future research [49]. In addition, our model is based on a single-buyer multi-vendor coordination framework with a single product. Thus, analyzing a more realistic supply chain that includes multiple buyers, several suppliers, and multiple products to obtain results that can be applied to more complex real-world situations is another area of great interest [4,41]. Finally, the profit-sharing mechanism can benefit all members of the supply chain system in many cases [1]. Therefore, considering a profit-sharing agreement between the buyer and suppliers when the demand is price-sensitive may improve our proposed model further.
Author Contributions
The authors have conceptualized the research study, developed the methodology, solved an illustrative example, written and edited the manuscript. All authors have read and agreed to the published version of the manuscript.
Funding
This research was funded by the College of Engineering ROCKET Seed Grant Program of Penn State University.
Institutional Review Board Statement
This manuscript is based on the MS Thesis of Mr. Qingyuan Lu which was approved by his MS Committee on 9 December 2021 at the Pennsylvania State University.
Informed Consent Statement
Not applicable.
Data Availability Statement
All data used in the numerical example is provided in the main text.
Conflicts of Interest
The authors declare no conflict of interest.
References
- Ventura, J.A.; Bunn, K.A.; Venegas, B.B.; Duan, L. A coordination mechanism for supplier selection and order quantity allocation with price-sensitive demand and finite production rates. Int. J. Prod. Econ. 2021, 233, 108007. [Google Scholar] [CrossRef]
- Lumineau, F.; Henderson, J.E. The influence of relational experience and contractual governance on the negotiation strategy in buyer–supplier disputes. J. Oper. Manag. 2012, 30, 382–395. [Google Scholar] [CrossRef] [Green Version]
- Chen, Y.J. Structured methodology for supplier selection and evaluation in a supply chain. Inf. Sci. 2011, 181, 1651–1670. [Google Scholar] [CrossRef]
- Yousefi, S.; Rezaee, M.J.; Solimanpur, M. Supplier selection and order allocation using two-stage hybrid supply chain model and game-based order price. Oper. Res. 2021, 21, 553–588. [Google Scholar] [CrossRef]
- Hwang, C.L.; Masud, A.S.M. Multiple Objective Decision Making—Methods and Applications: A State-of-the-Art Survey; Springer: New York, NY, USA, 1979. [Google Scholar]
- Civi, H.; Doucette, J.; Alade, Y.; Lokhandwala, T. Six Ways for Retailers to Drive Rapid E-Commerce Growth. EY Parthenon. 11 September 2020. Available online: https://www.ey.com/en_us/strategy/six-ways-for-retailers-to-drive-rapid-e-commerce-growth (accessed on 27 February 2023).
- Dickson, G.W. An analysis of vendor selection: Systems and decisions. J. Purch. 1966, 2, 5–17. [Google Scholar] [CrossRef]
- Weber, C.A.; Current, J.R.; Benton, W.C. Vendor selection criteria and methods. Eur. J. Oper. Res. 1991, 50, 2–18. [Google Scholar] [CrossRef]
- Kleinsorge, I.K.; Schary, P.B.; Tanner, R.D. Data envelopment analysis for monitoring customer-supplier relationships. J. Account. Public Policy 1992, 11, 357–372. [Google Scholar] [CrossRef]
- Narasimhan, R.; Talluri, S.; Mendez, D. Supplier evaluation and rationalization via data envelopment analysis: An empirical examination. J. Supply Chain. Manag. 2006, 37, 28–37. [Google Scholar] [CrossRef] [Green Version]
- Ho, W.; Xu, X.; Dey, P.K. Multi-criteria decision-making approaches for supplier evaluation and selection: A literature review. Eur. J. Oper. Res. 2010, 202, 16–24. [Google Scholar] [CrossRef]
- Chai, J.; Liu, J.N.K.; Ngai, E.W.T. Application of decision-making techniques in supplier selection: A systematic review of literature. Expert Syst. Appl. 2013, 40, 3872–3885. [Google Scholar] [CrossRef]
- Ordoobadi, S.M. Development of a supplier selection model using fuzzy logic. Supply Chain. Manag. Int. J. 2009, 14, 314–327. [Google Scholar] [CrossRef]
- Mendoza, A.; Ventura, J.A. Modeling actual transportation costs in supplier selection and order quantity allocation decisions. Oper. Res. 2013, 13, 5–25. [Google Scholar] [CrossRef]
- Choudhary, D.; Shankar, R. A goal programming model for joint decision making of inventory lot-size, supplier selection and carrier selection. Comput. Ind. Eng. 2014, 71, 1–9. [Google Scholar] [CrossRef]
- Deng, X.; Hu, Y.; Deng, Y.; Mahadevan, S. Supplier selection using AHP methodology extended by D numbers. Expert Syst. Appl. 2014, 41, 156–167. [Google Scholar] [CrossRef]
- Zhang, X.; Deng, Y.; Chan, F.T.; Mahadevan, S. A fuzzy extended analytic network process-based approach for global supplier selection. Appl. Intell. 2015, 43, 760–772. [Google Scholar] [CrossRef]
- Azadi, M.; Jafarian, M.; Saen, R.F.; Mirhedayatian, S.M. A new fuzzy DEA model for evaluation of efficiency and effectiveness of suppliers in sustainable supply chain management context. Comput. Oper. Res. 2015, 54, 274–285. [Google Scholar] [CrossRef]
- Zimmer, K.; Frohling, M.; Schultmann, F. Sustainable supplier management—A review of models supporting sustainable supplier selection, monitoring, and development. Int. J. Prod. Res. 2015, 54, 1412–1442. [Google Scholar] [CrossRef]
- Chai, J.; Ngai, E.W.T. Decision-making techniques in supplier selection: Recent accomplishments and what lies ahead. Expert Syst. Appl. 2020, 140, 112903. [Google Scholar] [CrossRef]
- Islam, S.; Amin, S.H.; Wardley, L.J. Machine learning and optimization models for supplier selection and order allocation planning. Int. J. Prod. Econ. 2021, 242, 108315. [Google Scholar] [CrossRef]
- Tong, L.Z.; Wang, J.; Pu, Z. Sustainable supplier selection for SMEs based on an extended PROMETHEE Ⅱ approach. J. Clean. Prod. 2022, 330, 129830. [Google Scholar] [CrossRef]
- Hanh, N.T.M.; Chen, J.M.; Van Hop, N. Pricing strategy and order quantity allocation with price-sensitive demand in three-echelon supply chain. Expert Syst. Appl. 2022, 206, 117873. [Google Scholar] [CrossRef]
- Joy, T.M.; Aneesh, K.S.; Sreekumar, V. Analysis of a decision support system for supplier selection in glove industry. Mater. Today Proc. 2023, 72, 3186–3192. [Google Scholar] [CrossRef]
- Saputro, T.E.; Figueira, G.; Almada-Lobo, B. Hybrid MCDM and simulation-optimization for strategic supplier selection. Expert Syst. Appl. 2023, 219, 119624. [Google Scholar] [CrossRef]
- Goyal, S.K. An integrated inventory model for a single supplier-single customer problem. Int. J. Prod. Res. 1976, 15, 107–111. [Google Scholar] [CrossRef]
- Cachon, G.; Lariviere, M. Supply chain coordination with revenue-sharing contracts: Strengths and limitations. Manag. Sci. 2005, 51, 30–44. [Google Scholar] [CrossRef] [Green Version]
- Jaber, M.Y.; Osman, I.H.; Guiffrida, A.L. Coordinating a three-level supply chain with price discounts, price dependent demand, and profit-sharing. Int. J. Integr. Supply Manag. 2006, 2, 28–48. [Google Scholar] [CrossRef]
- Sarmah, S.P.; Acharya, D.; Goyal, S.K. Coordination and profit-sharing between a manufacturer and a buyer with target profit under credit option. Eur. J. Oper. Res. 2007, 182, 1469–1478. [Google Scholar] [CrossRef]
- Goyal, S.K.; Gupta, Y.P. Integrated inventory models: The buyer-vendor coordination. Eur. J. Oper. Res. 1989, 41, 261–269. [Google Scholar] [CrossRef]
- Kamali, A.; Ghomi, S.M.T.F.; Jolai, F. A multi-objective quantity discount and joint optimization model for coordination of a single-buyer multi-vendor supply chain. Comput. Math. Appl. 2011, 62, 3251–3269. [Google Scholar] [CrossRef] [Green Version]
- Hammami, R.; Temponi, C.; Frein, Y. A scenario-based stochastic model for supplier selection in global context with multiple buyers, currency fluctuation uncertainties, and price discounts. Eur. J. Oper. Res. 2014, 233, 159–170. [Google Scholar] [CrossRef]
- Giri, B.C.; Bardhan, S. A vendor–buyer JELS model with stock dependent-demand and consigned inventory under buyer’s space constraint. Oper. Res. 2015, 15, 79–93. [Google Scholar] [CrossRef]
- Adeinat, H.; Ventura, J.A. Determining the retailer’s replenishment policy considering multiple capacitated suppliers and price-sensitive demand. Eur. J. Oper. Res. 2015, 247, 83–92. [Google Scholar] [CrossRef]
- Hariga, M.; Glock, C.H.; Kim, T. Integrated product and container inventory model for a single-vendor single-buyer supply chain with owned and rented returnable transport items. Int. J. Prod. Res. 2015, 54, 1964–1979. [Google Scholar] [CrossRef]
- Yousefi, S.; Mahmoudzadeh, H.; Rezaee, M.J. Using supply chain visibility and cost for supplier selection: A mathematical model. Int. J. Manag. Sci. Eng. Manag. 2016, 12, 196–205. [Google Scholar] [CrossRef]
- Adeinat, H.; Ventura, J.A. Integrated pricing and lot-sizing decisions in a serial supply chain. Appl. Math. Model. 2018, 54, 429–445. [Google Scholar] [CrossRef]
- Duan, L.; Ventura, J.A. Technical Note: A joint pricing, supplier selection, and inventory replenishment model using the logit demand function. Decis. Sci. 2020, 52, 512–534. [Google Scholar] [CrossRef]
- Liberopoulos, G.; Deligiannis, M. Optimal supplier inventory control policies when buyer purchase incidence is driven by past service. Eur. J. Oper. Res. 2022, 300, 917–936. [Google Scholar] [CrossRef]
- Schmelzle, U.; Mukandwal, P.S. The impact of supply chain relationship configurations on supplier performance: Investigating buyer–supplier relations in the aerospace industry. Int. J. Logist. Manag. 2022. [Google Scholar] [CrossRef]
- Ventura, J.A.; Golany, B.; Mendoza, A.; Li, C. A Multi-product dynamic supply chain inventory model with supplier selection, joint replenishment, and transportation cost. Ann. Oper. Res. 2022, 316, 729–762. [Google Scholar] [CrossRef]
- Rohaninejad, M.; Janota, M.; Hanzálek, Z. Integrated lot-sizing and scheduling: Mitigation of uncertainty in demand and processing time by machine learning. Eng. Appl. Artif. Intell. 2023, 118, 105676. [Google Scholar] [CrossRef]
- Charnes, A.; Cooper, W.W.; Rhodes, E. Measuring the efficiency of decision-making units. Eur. J. Oper. Res. 1978, 2, 429–444. [Google Scholar] [CrossRef]
- Klimberg, R.K.; Ratick, S.J. Modeling data envelopment analysis (DEA) efficient location/allocation decisions. Comput. Oper. Res. 2008, 35, 457–474. [Google Scholar] [CrossRef]
- Miettinen, K.M. Nonlinear Multi-Objective Optimization; International Series in Operations Research and Management Science, 12; Kluwer Academic Publishers: Boston, MA, USA, 1999. [Google Scholar]
- Friedman, L.; Sinuany-Stern, Z. Combining ranking scales and selecting variables in the DEA context: The case of industrial branches. Comput. Oper. Res. 1998, 25, 781–791. [Google Scholar] [CrossRef]
- Parasuraman, A.; Zeithaml, V.A.; Berry, L.L. A conceptual model of service quality and its implications for future research. J. Mark. 1985, 49, 41–50. [Google Scholar] [CrossRef]
- Talluri, S.; Baker, R.C. A multi-phase mathematical programming approach for effective supply chain design. Eur. J. Oper. Res. 2002, 141, 544–558. [Google Scholar] [CrossRef]
- Li, X.; Ventura, J.A.; Chandra, M.J. A joint supplier selection and lot-sizing problem considering a quality constraint and quantity discounts. In Proceedings of the 67th Annual Conference and Expo of the Institute of Industrial Engineers, New Orleans, LA, USA, 30 May–2 June 2017; pp. 325–330. [Google Scholar]
Figure 1.
Structure of the supply chain.
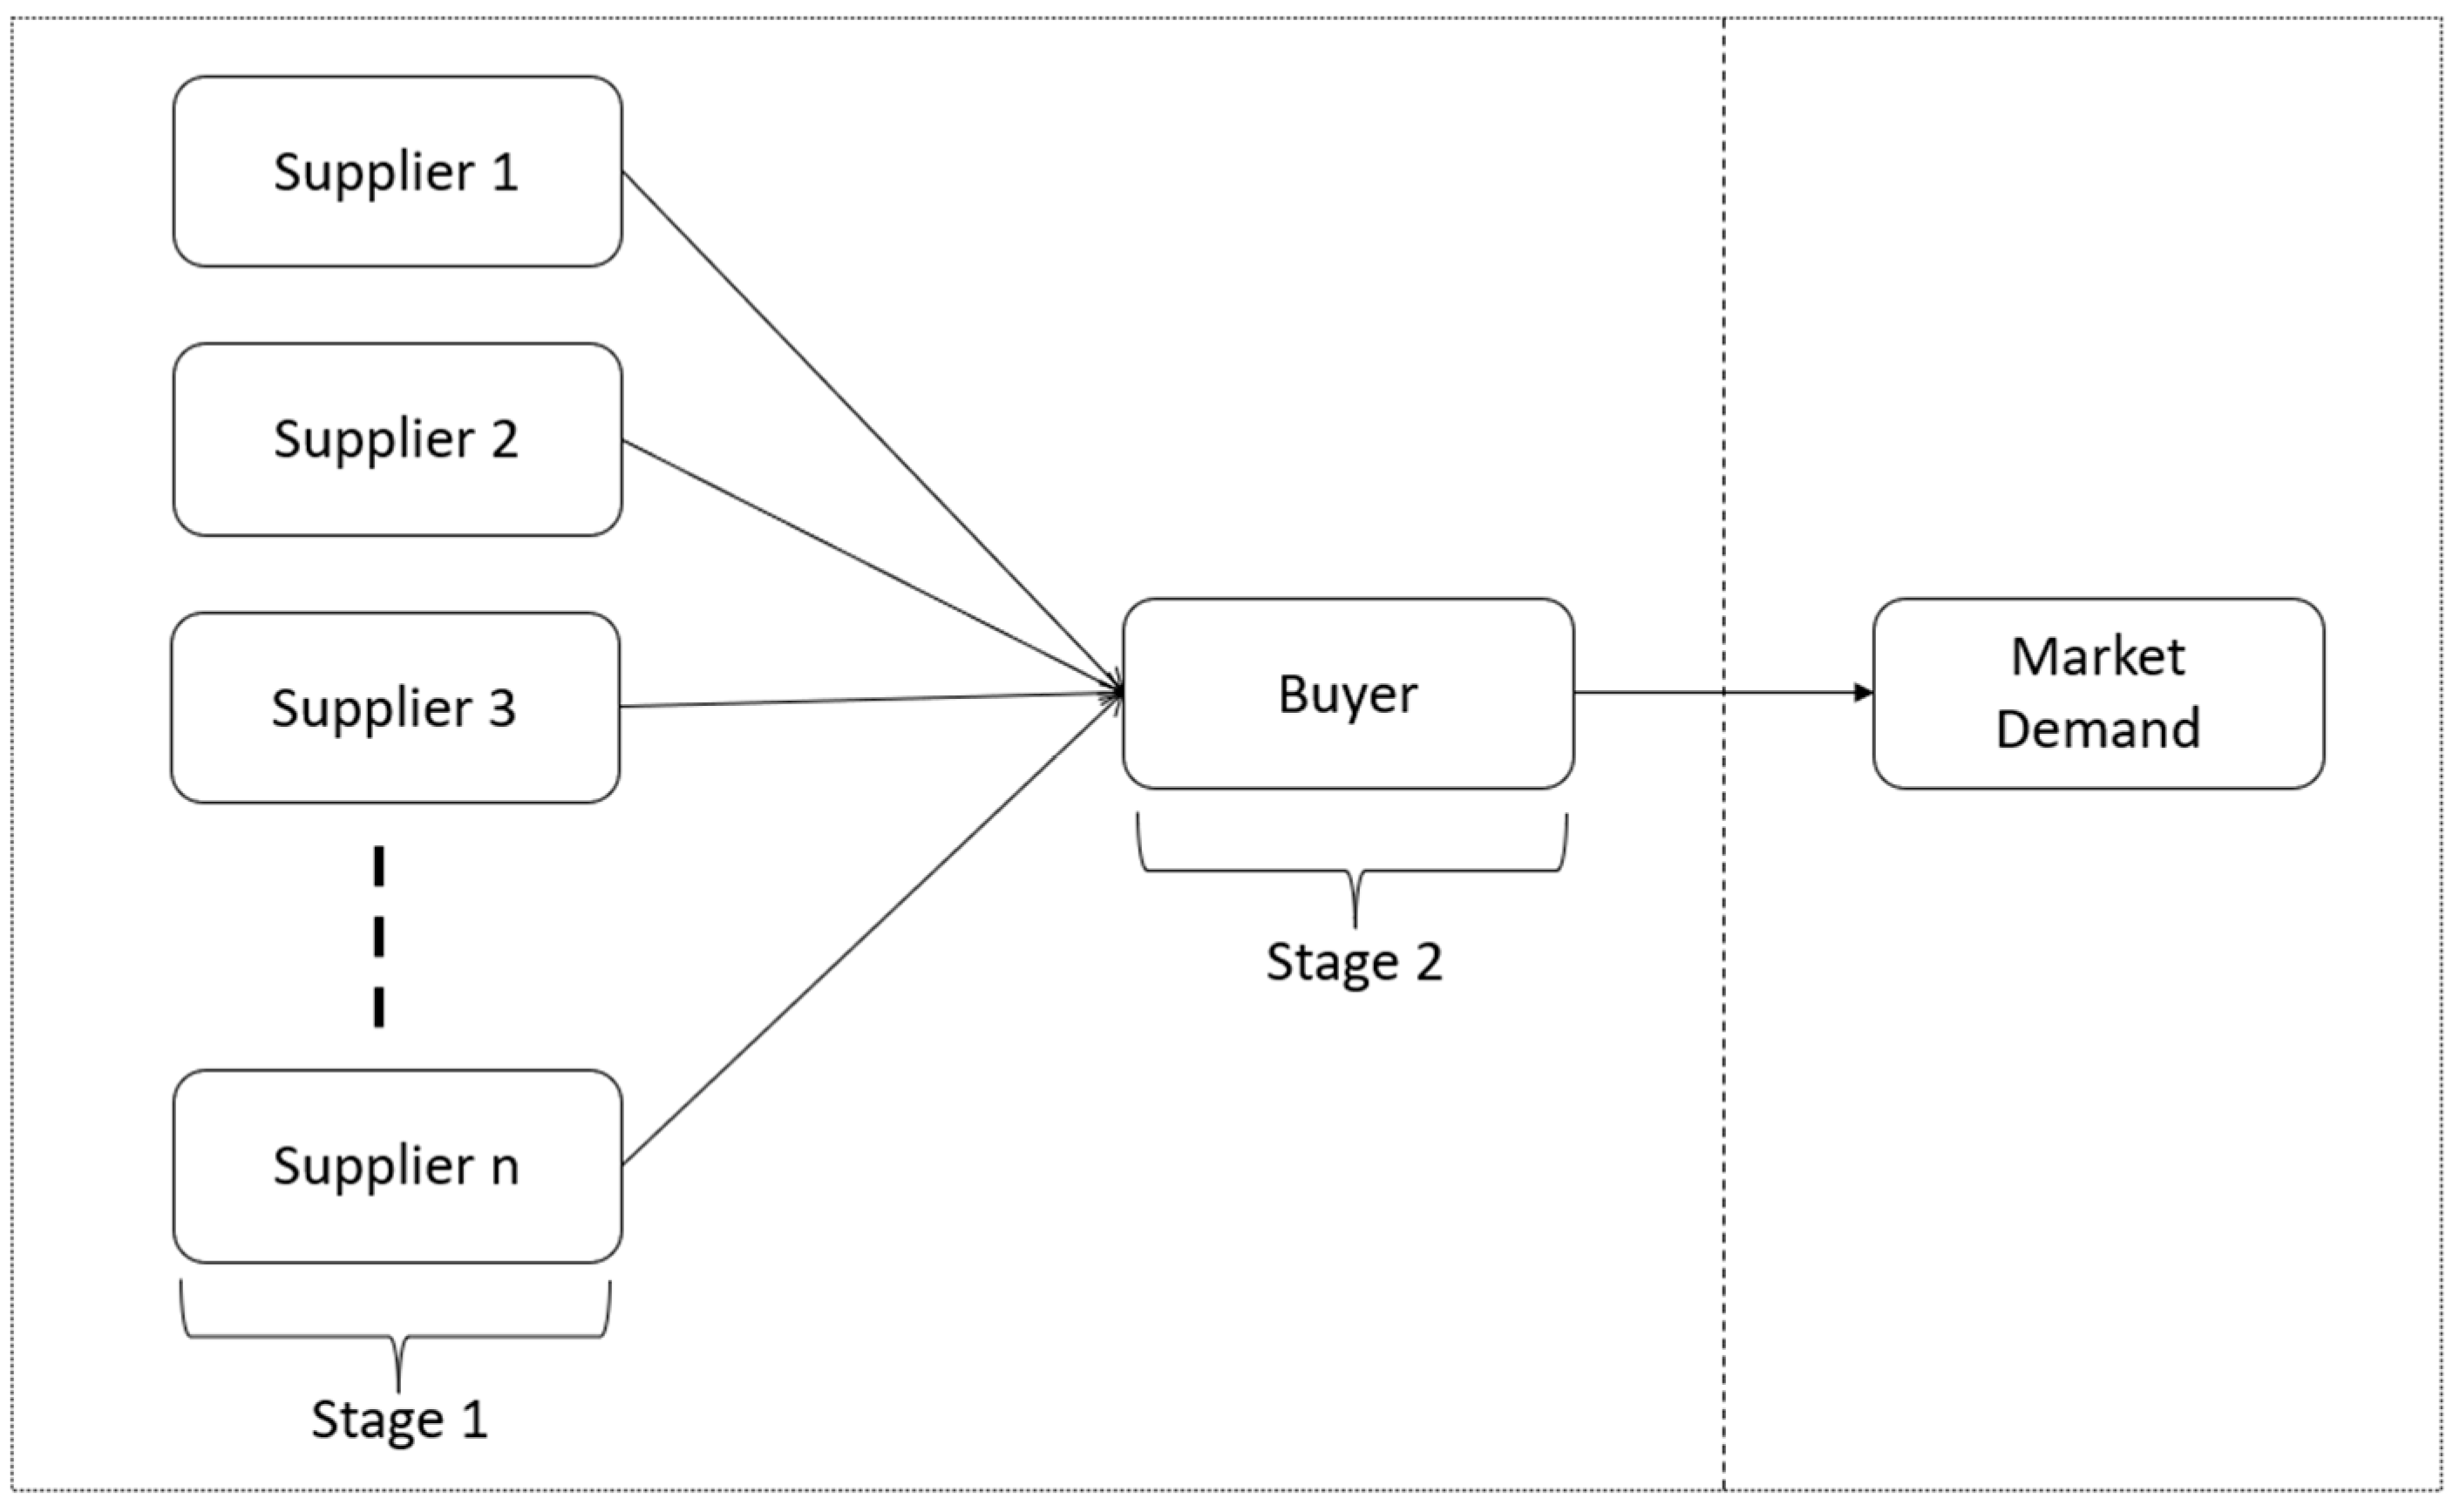
Figure 2.
Inventory levels for a supply chain with a single buyer and three suppliers.

Figure 3.
Inventory levels of the buyer and suppliers under the order frequency policy.

Table 1.
Buyer’s data for numerical example.
| Parameter | Buyer’s Holding Cost (hB) ($/Unit/Year) | Max. # Suppliers (N) | Buyer’s Demand (D) (Unit/Year) |
|---|---|---|---|
| Value | 2.6 | 6 | 200,000 |
Table 2.
Suppliers’ data for numerical example.
| Supplier (k) | Fixed Ordering Cost (Ak) ($/Order) | Variable Ordering Cost (ck) ($/Unit) | Holding Cost () ($/Unit/Year) | Production Rate (Pk) (Units/Year) | Production Setup Cost (Sk) ($/Order) | Variable Production Cost (vk) ($/Unit) |
|---|---|---|---|---|---|---|
| 1 | 40 | 9.0 | 2.29 | 42,000 | 43 | 4.04 |
| 2 | 19 | 9.1 | 1.96 | 34,000 | 39 | 6.48 |
| 3 | 25 | 8.7 | 2.74 | 36,500 | 42 | 7.17 |
| 4 | 39 | 10.5 | 0.54 | 63,000 | 30 | 5.87 |
| 5 | 27 | 9.5 | 1.50 | 45,500 | 38 | 6.30 |
| 6 | 33 | 8.9 | 1.25 | 64,000 | 42 | 4.85 |
| 7 | 30 | 8.7 | 2.00 | 41,500 | 40 | 5.08 |
| 8 | 23 | 10.4 | 2.09 | 36,000 | 39 | 7.00 |
| 9 | 20 | 9.0 | 1.90 | 66,500 | 38 | 6.00 |
| 10 | 34 | 10.5 | 1.71 | 61,000 | 32 | 5.25 |
Table 3.
Input and output data for each supplier.
| Supplier (k) | 1 | 2 | 3 | 4 | 5 | 6 | 7 | 8 | 9 | 10 |
|---|---|---|---|---|---|---|---|---|---|---|
| TC (Iuk, u = 1) ($/100 lbs./shipment) | 253 | 268 | 259 | 180 | 257 | 248 | 330 | 327 | 330 | 321 |
| EXP (Ovk, v = 1) (points) | 240 | 210 | 270 | 200 | 160 | 230 | 170 | 180 | 170 | 200 |
| CRE (Ovk, v = 2) (points) | 90 | 80 | 70 | 70 | 70 | 80 | 60 | 70 | 60 | 80 |
Table 4.
Results when no lot-sizing policy is applied and different weights (w1, w2).
| Objective Function Weights (w1, w2) | q1 (Units /Order) | q2 (Units /Order) | q3 (Units /Order) |
q4 (Units /Order) | q5 (Units /Order) | q6 (Units /Order) | q7 (Units /Order) | q8 (Units /Order) | q9 (Units /Order) | q10 (Units /Order) | Average Cost (Z1) ($/Year) | Supply Chain Efficiency (Z2) |
|---|---|---|---|---|---|---|---|---|---|---|---|---|
| (1, 0) | 1451.82 | 0.00 | 0.00 | 0.00 | 0.00 | 2212.29 | 1434.53 | 0.00 | 1814.77 | 0.00 | 2,803,487.31 | 6 |
| (0.75, 0.25) | 1075.20 | 0.00 | 0.00 | 0.00 | 0.00 | 1638.40 | 1049.79 | 0.00 | 1356.61 | 0.00 | 2,804,864.61 | 10 |
| (0.50, 0.50) | 2421.26 | 0.00 | 0.00 | 0.00 | 0.00 | 3689.54 | 2392.43 | 0.00 | 3026.57 | 0.00 | 2,805,625.74 | 10 |
| (0.25, 0.75) | 675.57 | 0.00 | 0.00 | 0.00 | 0.00 | 1029.44 | 667.53 | 0.00 | 844.47 | 0.00 | 2,808,629.22 | 10 |
| (0, 1) | 0.00 | 0.00 | 0.00 | 9.92 | 0.00 | 0.00 | 0.00 | 0.23 | 11.06 | 9.30 | 8,254,870.71 | 10 |
Table 5.
Results of the lot-for-lot policy when m = 4, and (w1, w2) = (1, 0).
| Entity | Order Quantity (qk) (Units/Order) | Number of Orders/Cycle (Yk) | Total Cost (Z1) ($/Year) | Utilization () (%) |
|---|---|---|---|---|
| Supplier 1 | 1451.82 | 1 | 172,586.29 | 100 |
| Supplier 6 | 2212.29 | 1 | 312,997.71 | 100 |
| Supplier 7 | 1434.53 | 1 | 213,411.70 | 100 |
| Supplier 9 | 1814.77 | 1 | 317,460.39 | 78.9 |
| Buyer | 6913.41 | - | 1,787,031.21 | - |
| Supply Chain | - | - | 2,803,487.31 | - |
Table 6.
Results of the lot-for-lot policy when m = 20, and (w1, w2) = (1, 0).
| Entity | Order Quantity (qk) (Units/Order) | # Orders/Cycle (Yk) | Total Cost (Z1) ($/Year) | Utilization () (%) |
|---|---|---|---|---|
| Supplier 1 | 1662.66 | 4 | 172,660.28 | 100 |
| Supplier 6 | 2002.58 | 5 | 312,993.87 | 100 |
| Supplier 7 | 1623.10 | 4 | 213,465.84 | 100 |
| Supplier 9 | 1642.66 | 5 | 317,446.51 | 78.9 |
| Buyer | 31,369.24 | - | 1,786,913.55 | - |
| Supply Chain | - | - | 2,803,480.04 | - |
Table 7.
Sensitivity analysis results of the lot-for-lot policy with increased Sk and values for suppliers when m = 4 and m = 20, and (w1, w2) = (1, 0).
Table 7.
Sensitivity analysis results of the lot-for-lot policy with increased Sk and values for suppliers when m = 4 and m = 20, and (w1, w2) = (1, 0).
| Settings | Maximum Number of Orders /Cycle (m) | Selected Suppliers | Number of Orders/Cycle (Yk) | Total Cost (Z1) ($/Year) | Total Cost Improv. (ITC) ($/Year) | CPU Time (s) | Optimality Gap (%) |
|---|---|---|---|---|---|---|---|
| Holding cost: + 10 Prod. Setup cost: Sk × 2 | 4 | (1-6-7-9) | (1-1-1-1) | 2,833,103.28 | 105.42 | 0.09 | 0.0001 |
| 20 | (1-6-7-9) | (4-5-4-5) | 2,832,997.87 | 14.85 | 0.0097 | ||
| Holding cost: + 20 Prod. Setup cost: Sk × 3 | 4 | (1-6-7-9) | (1-1-1-1) | 2,859,193.49 | 219.17 | 0.09 | 0.0004 |
| 20 | (1-6-7-9) | (4-5-4-5) | 2,858,974.49 | 31.61 | 0.0003 | ||
| Holding cost: + 30 Prod. Setup cost: Sk × 5 | 4 | (1-6-7-9) | (1-1-1-1) | 2,894,392.41 | 356.93 | 0.12 | 0.0001 |
| 20 | (1-6-7-9) | (4-5-4-5) | 2,894,035.48 | 33.16 | 0.0009 |
Table 8.
Sensitive analysis results of the lot-for-lot policy with increased and values for suppliers when m = 4 and m = 20, and different weights (w1, w2).
Table 8.
Sensitive analysis results of the lot-for-lot policy with increased and values for suppliers when m = 4 and m = 20, and different weights (w1, w2).
| Settings | Objective Function Weights (w1, w2) | Maximum Number of Orders /Cycle (m) | Selected Suppliers | Number of Orders /Cycle (Yk) | Total Cost (Z1) ($/Year) | Total Cost Improvement (ITC) ($/Year) | Supply Chain Efficiency (Z2) | CPU Time (s) | Optimality Gap (%) |
|---|---|---|---|---|---|---|---|---|---|
| Holding cost: Prod. setup cost: | (0.5, 0.5) | 4 | (1-6-7-9) | (1-1-1-1) | 2,836,278.26 | 2366.58 | 10 | 0.12 | 0.0001 |
| 20 | (1-6-7-9) | (3-3-4-3) | 2,833,911.68 | 10.34 | 0.0097 | ||||
| (0, 1) | 4 | (1-6-9-10) | (1-1-1-1) | 6,798,597.37 | 0 | 10 | 0.03 | 0.0004 | |
| 20 | (1-6-9-10) | (1-1-1-1) | 6,798,597.37 | 21.61 | 0.0003 | ||||
| Holding cost: Prod. setup cost: | (0.5, 0.5) | 4 | (1-6-7-9) | (1-1-1-1) | 2,864,705.23 | 4768.92 | 10 | 0.09 | 0.0001 |
| 20 | (1-6-7-9) | (4-5-4-3) | 2,859,936.31 | 32.57 | 0.0097 | ||||
| (0, 1) | 4 | (4-6-9-10) | (1-1-1-1) | 9,468,356.33 | 0 | 10 | 0.09 | 0.0004 | |
| 20 | (4-6-9-10) | (1-1-1-1) | 9,468,356.33 | 31.61 | 0.0003 | ||||
| Holding cost: Prod. setup cost: | (0.5, 0.5) | 4 | (1-6-7-9) | (1-1-1-1) | 2,894,444.24 | 0 | 10 | 0.09 | 0.0001 |
| 20 | (1-6-7-9) | (1-1-1-1) | 2,894,444.24 | 31.08 | 0.0097 | ||||
| (0, 1) | 4 | (4-6-9-10) | (1-1-1-1) | 12,807,896.21 | 0 | 10 | 0.09 | 0.0004 | |
| 20 | (4-6-9-10) | (1-1-1-1) | 12,807,896.21 | 32.37 | 0.0003 |
Table 9.
Results of the order frequency policy when Yk = Xk, m = 4, and (w1, w2) = (1, 0).
| Entity | Order Quantity (qk) (Units/Order) | Number of Orders/Cycle (Yk) | Total Cost (Z1) ($/year) | Utilization () (%) |
|---|---|---|---|---|
| Supplier 1 | 1451.82 | 1 | 172,586.29 | 100 |
| Supplier 6 | 2212.29 | 1 | 312,997.71 | 100 |
| Supplier 7 | 1434.53 | 1 | 213,411.70 | 100 |
| Supplier 9 | 1814.77 | 1 | 317,460.39 | 78.9 |
| Buyer | 6913.41 | - | 1,787,031.21 | - |
| Supply chain | - | - | 2,803,487.31 | - |
Table 10.
Results of the lot-for-lot policy when m = 20, and (w1, w2) = (1, 0).
| Entity | Order Quantity (qk) (Units/Order) | Number of Orders/Cycle (Yk) | Total Cost (Z1) ($/Year) | Utilization () (%) |
|---|---|---|---|---|
| Supplier 1 | 1451.82 | 1 | 172,586.29 | 100 |
| Supplier 6 | 2212.29 | 1 | 312,997.71 | 100 |
| Supplier 7 | 1434.53 | 1 | 213,411.70 | 100 |
| Supplier 9 | 1814.77 | 1 | 317,460.39 | 78.9 |
| Buyer | 6913.41 | - | 1,787,031.21 | - |
| Supply chain | - | - | 2,803,487.31 | - |
Table 11.
Sensitivity analysis results for both lot-sizing policies with fixed holding cost and increasing setup cost Sk values for suppliers when m = 20 and (w1, w2) = (1, 0).
Table 11.
Sensitivity analysis results for both lot-sizing policies with fixed holding cost and increasing setup cost Sk values for suppliers when m = 20 and (w1, w2) = (1, 0).
| Production Setup Cost ($/Order) | Selected Suppliers | Number of Orders /Cycle (Yk) | Total Cost (Z1) ($/Year) | Total Cost Improvement (ITC) ($/Year) | Supply Chain Efficiency (Z2) | CPU Time (s) | Optimality Gap (%) | |
|---|---|---|---|---|---|---|---|---|
| Sk × 2 | Lot-for-lot | (1-6-7-9) | (1-1-1-1) | 2,807,644.99 | 507.52 | 6 | 20.92 | 0.0002 |
| Order frequency | (1-6-7-9) | (1-2-1-2) | 2,807,137.47 | 34.65 | 0.0001 | |||
| Sk × 3 | Lot-for-lot | (1-6-7-9) | (1-1-1-1) | 2,811,094.37 | 1048.91 | 6 | 23.72 | 0.0009 |
| Order frequency | (1-6-7-9) | (2-2-2-3) | 2,810,045.46 | 34.32 | 0.0005 | |||
| Sk × 5 | Lot-for-lot | (1-6-7-9) | (1-1-1-1) | 2,816,817.29 | 2348.52 | 6 | 27.27 | 0.0003 |
| Order frequency | (1-6-7-9) | (2-3-2-3) | 2,814,468.77 | 40.60 | 0.0014 |
Table 12.
Sensitivity analysis results for both lot-sizing policies with fixed holding cost and further increasing setup cost Sk values for suppliers when m = 20 with different weights (w1, w2).
Table 12.
Sensitivity analysis results for both lot-sizing policies with fixed holding cost and further increasing setup cost Sk values for suppliers when m = 20 with different weights (w1, w2).
| Production Setup Cost ($/Order) | Objective Function Weights (w1, w2) | Policy | Selected Suppliers | Number of Orders /Cycle (Yk) | Total Cost (Z1) ($/Year) | Total Cost Improvement (ITC) Y($/ear) | Supply Chain Efficiency (Z2) | CPU Time (s) | Optimality Gap (%) |
|---|---|---|---|---|---|---|---|---|---|
| Sk × 10 | (1, 0) | Lot-for-lot | (1-6-7-9) | (1-1-1-1) | 2,829,147.55 | 6346.49 | 6 | 78.32 | 0.0063 |
| Order frequency | (1-6-7-9) | (3-4-3-5) | 2,825,827.99 | 117.34 | 0.0001 | ||||
| (0.5, 0.5) | Lot-for-lot | (1-6-7-9) | (6-4-3-2) | 2,833,736.63 | 10,403.08 | 10 | 90.09 | 0.0038 | |
| Order frequency | (1-6-7-9) | (3-8-3-5) | 2,823,333.55 | 85.57 | 0.0016 | ||||
| (0, 1) | Lot-for-lot | (1-6-9-10) | (1-1-1-1) | 26,316,625.35 | 0 | 10 | 97.04 | 0.0004 | |
| Order frequency | (1-6-9-10) | (1-1-1-1) | 26,316,625.35 | 83.61 | 0.0003 | ||||
| Sk × 15 | (1, 0) | Lot-for-lot | (1-6-7-9) | (1-1-1-1) | 2,837,469.06 | 8270.18 | 6 | 77.81 | 0.0024 |
| Order frequency | (1-6-7-9) | (3-5-4-6) | 2,829,198.88 | 110.97 | 0.0024 | ||||
| (0.5, 0.5) | Lot-for-lot | (1-6-7-9) | (5-4-3-3) | 2,840,528.38 | 10,961.88 | 10 | 90.28 | 0.0007 | |
| Order frequency | (1-6-7-9) | (3-3-4-8) | 2,829,566.50 | 90.08 | 0.0007 | ||||
| (0, 1) | Lot-for-lot | (1-4-6-10) | (1-1-1-1) | 38,138,068.01 | 0 | 10 | 103.77 | 0.0066 | |
| Order frequency | (1-4-6-10) | (1-1-1-1) | 38,138,068.01 | 114.52 | 0.0003 | ||||
| Sk × 20 | (1, 0) | Lot-for-lot | (1-6-7-9) | (1-1-1-1) | 2,844,597.44 | 10,008.75 | 6 | 97.63 | 0.0001 |
| Order frequency | (1-6-7-9) | (4-6-4-6) | 2,834,588.69 | 115.35 | 0.0065 | ||||
| (0.5, 0.5) | Lot-for-lot | (1-6-7-9) | (5-3-3-5) | 2,849,472.77 | 14,385.89 | 10 | 60.56 | 0.0001 | |
| Order frequency | (1-6-7-9) | (5-5-3-6) | 2,835,086.88 | 80.34 | 0.0065 | ||||
| (0, 1) | Lot-for-lot | (1-4-6-10) | (1-1-1-1) | 49,463,941.05 | 0 | 10 | 119.72 | 0.0029 | |
| Order frequency | (1-4-6-10) | (1-1-1-1) | 49,463,941.05 | 106.29 | 0.0018 |
Disclaimer/Publisher’s Note: The statements, opinions and data contained in all publications are solely those of the individual author(s) and contributor(s) and not of MDPI and/or the editor(s). MDPI and/or the editor(s) disclaim responsibility for any injury to people or property resulting from any ideas, methods, instructions or products referred to in the content. |
© 2023 by the authors. Licensee MDPI, Basel, Switzerland. This article is an open access article distributed under the terms and conditions of the Creative Commons Attribution (CC BY) license (https://creativecommons.org/licenses/by/4.0/).
Share and Cite
MDPI and ACS Style
Ventura, J.A.; Lu, Q. Optimizing Supplier Selection and Order Lot-Sizing Decisions in a Two-Stage Supply Chain. Axioms 2023, 12, 615. https://doi.org/10.3390/axioms12070615
AMA Style
Ventura JA, Lu Q. Optimizing Supplier Selection and Order Lot-Sizing Decisions in a Two-Stage Supply Chain. Axioms. 2023; 12(7):615. https://doi.org/10.3390/axioms12070615
Chicago/Turabian StyleVentura, José A., and Qingyuan Lu. 2023. "Optimizing Supplier Selection and Order Lot-Sizing Decisions in a Two-Stage Supply Chain" Axioms 12, no. 7: 615. https://doi.org/10.3390/axioms12070615
Note that from the first issue of 2016, this journal uses article numbers instead of page numbers. See further details here.