Joint Inversion of 2D Gravity Gradiometry and Magnetotelluric Data in Mineral Exploration


College of Geo-Exploration Sciences and Technology, Jilin University, Changchun 130026, China
*
Author to whom correspondence should be addressed.
Minerals 2019, 9(9), 541; https://doi.org/10.3390/min9090541
Submission received: 23 July 2019
/
Revised: 1 September 2019
/
Accepted: 4 September 2019
/
Published: 7 September 2019
(This article belongs to the Special Issue Novel Methods and Applications for Mineral Exploration)
Abstract
:We have developed a mineral exploration method for the joint inversion of 2D gravity gradiometry and magnetotelluric (MT) data based on data-space and normalized cross-gradient constraints. To accurately explore the underground structure of complex mineral deposits and solve the problems such as the non-uniqueness and inconsistency of the single parameter inversion model, it is now common practice to perform collocated MT and gravity surveys that complement each other in the search. Although conventional joint inversion of MT and gravity using model-space can be diagnostic, we posit that better results can be derived from the joint inversion of the MT and gravity gradiometry data using data-space. Gravity gradiometry data contains more abundant component information than traditional gravity data and can be used to classify the spatial structure and location of underground structures and field sources more accurately and finely, and the data-space method consumes less memory and has a shorter computation time for our particular inversion iteration algorithm. We verify our proposed method with synthetic models. The experimental results prove that our proposed method leads to models with remarkable structural resemblance and improved estimates of electrical resistivity and density and requires shorter computation time and less memory. We also apply the method to field data to test its potential use for subsurface lithofacies discrimination or structural classification. Our results suggest that the imaging method leads to improved characterization of geological targets, which is more conducive to geological interpretation and the exploration of mineral resources.
1. Introduction
The necessity for the accurate exploration of subsurface structures and conditions are driving the development of various strategies for the joint use of information from multiple geophysical data [1,2,3,4,5,6,7,8,9]. Different geophysical data can provide different information on the distribution of subsurface properties, while different geophysical exploration methods have different detection capabilities for underground targets. However, the uncertainty and non-uniqueness of the inversion interpretation is a common problem in geophysics [10]. To suppress the inversion results’ non-uniqueness and obtain more accurate information for underground media, comprehensive geophysical methods that study the same geological target from different aspects have led to very effective research methods and development trends [11].
Joint inversion is a combination of multiple geophysical data to invert the same subsurface target through the correlation of the petrophysical and geometric parameters of the geological body. Joint inversion can improve the non-uniqueness of geophysical inversion. After more than a decade of development, geophysical workers have proposed many different joint inversion methods. The study of joint inversion for geophysical exploration can be classified into two categories. The first category relies on the coupling of petrophysical properties. By determining the petrophysical relationship functions of different physical properties (e.g., how petrophysical characteristics relate resistivity and seismic velocity in porous media), the coupling inversion of different physical properties was realized [12,13]. However, this method is limited by its difficulty in finding the accurate physical relationships of rock in complex underground areas. Therefore, a drawback of joint inversion based on the empirical relationship of the rock’s physical properties restricts the development of joint inversion. The second category is based on the similar structural distribution of subsurface parameters. Joint inversion is realized by minimizing structural differences [14,15,16]. Among these differences, the cross-gradient inversion algorithm proposed by Gallardo and Meju [16] is a joint inversion method that has received extensive attention. This method assumes that the boundaries of the anomalous bodies are identical or partially identical in different geophysical fields and have been widely used in the comprehensive interpretation of geophysics [17,18,19,20,21,22,23,24].
Gravity and magnetotelluric explorations have the characteristics of wide coverage, high efficiency, and low cost, so they have been widely used in resource exploration and are especially popular in the comprehensive interpretation of joint inversion [8,21,22,23,24]. In the above study, joint inversion based on cross-gradient constraints is mainly applied to gravity data and other geophysical data and is rarely applied to the gravity gradiometry data and other geophysical data. With the commercialization of gravity gradiometry measurement and the rapid development of computer technology, gravity gradiometry inversion has been widely applied in oil, gas, and mineral exploration [25,26,27]. Gravity gradiometry data can provide more abundant multi-component information, as each gradient component contains different information content. Compared with the gravity data, this data has a higher resolution in reflecting the details of the anomalous body [28,29,30]. If gravity gradiometry data are added to the joint inversion, they will help to better describe the spatial structure and location of the field source and improve the level of geological interpretation. Moreover, the above joint inversion methods are performed in model-space, which require extremely long computing times and high levels of memory usage if the number of meshes is large. If the inversion calculation process is transformed from the model-space into data-space, it may effectively solve the problem of long calculation times and large memory usage [31,32].
In this paper, we present an approach for the joint inversion of magnetotelluric (MT) and gravity gradiometry data based on normalized cross-gradient constraints and data-space. Considering that the gravity gradiometry data contains more information than traditional gravity data, and due to the lack of vertical resolution of the gravity gradiometry method, we constructed a new joint inversion objective functional, including a multi-component gravity gradiometry and MT data misfit terms, as well as their model constraints and normalized cross-gradient constraints. The joint inversion of the gravity gradiometry and MT data is superior to the separate inversion or the joint inversion of gravity and MT data, which could reduce the non-uniqueness and improve the resolution of the inversion results. Moreover, we applied the data-space method to the joint inversion calculation, the data-space joint inversion consumes less memory and has a shorter computation time. We used synthetic models of the subsurface to test the resolution, computational efficiency, and memory usage of the algorithm. Then, we applied this approach to the interpretation of geophysical field data collected in a mining study area from Jilin Province, China.
2. Forward Problem
2.1. Gravity and Gravity Gradiometry Forward Problem
We begin with a brief description of the gravity and gravity gradiometry fields. The gravity field, which is the first derivatives of the gravity potential , is defined as
The gravity gradiometry field, which is the second derivatives of the gravity potential , is defined as
where
here, is the space vector of the observation point to the anomalous point , and is the gravitational constant, while is the anomalous density distribution with a domain s.
The most common method to calculate the gravity and gravity gradiometry fields from the subsurface density is to divide the 2D domain into geometrically simple bodies with constant densities. In this case, the domain studied is divided into a finite number of rectangular units of uniform densities (the analytical formulas for the fast computation of gravity fields caused by a polygon are given by Singh [33], and gravity gradiometry fields caused by a polygon are given by Won [34]). Considering that there are Nd observations and Nm rectangular units, the discrete forward modeling operators for gravity or gravity gradiometry can be expressed in a matrix form:
where, is a vector of the observed data (gravity or gravity gradient) of the order Nd, is a vector of the remaining densities of the order Nm, and is expressed as a forward problem kernel functional, a rectangular matrix of a size Nd × Nm. According to Equation (4), the observed data are linearly related to the residual density, and it can be observed that the Jacobian matrix of the observed data is independent of the residual density and only depends on the position of the rectangular unit relative to the observation point.
2.2. MT Forward Problem
In a non-uniform electrical structure, the MT field can be decomposed into primary and secondary fields. The primary field is the field generated by the background, and the secondary field is the field generated by the anomalous body. In the two-dimensional case, take the y-axis as strike direction. From the Maxwell equation of secondary field, two types of polarization modes (transverse electric (TE) and transverse magnetic (TM)) of the expression can be obtained. Two models of the secondary field Helmholtz equations can be obtained through the derivation of the Maxwell equation [35].
TE-mode expression:
TM-mode expression:
where, is the admittivity, is the impedance rate, is the difference of the admittivity between two-dimensional inhomogeneous medium and a one-dimensional homogeneous medium, and the subscript s and p, respectively, represent the secondary field and the primary field, . The primary field, , can be obtained via the analytic solution of a one-dimensional homogeneous layered medium. Wanamaker [35] used triangular meshes to solve the partial differential Equations (5) and (6) by the finite element method, In this way, the secondary field and can be calculated, and the reciprocity principle can be used to calculate the Jacobian matrix of the MT sounding response.
3. Joint Inversion Methodology
The traditional gravity and MT joint inversion objective functional contains the data misfit terms of gravity and MT method, and the model smoothing constraint terms [8,21,22,23,24]. In the proposed method of gravity gradiometry and MT joint inversion, the objective functional contains three components of the gravity gradiometry data misfit term and the MT data misfit term, along with added model smoothing constraints and normalized cross-gradient constraints. The expressions are as follows:
where , , ,
, ,
, .
Here, , , and are respectively the data covariance matrix of the gravity gradiometry observation data , , and . Cd4 is the data covariance matrix of the MT observation data, and are the model covariance matrix of density and resistivity , respectively, and are the prior model parameters, and are damping parameters, f1(m), f2(m) and f3(m) are forward responses of the three components of the gravity gradiometry, f4(m) is an MT forward response, is a gradient, is a normalized cross-gradient functional as a parameter gradient of the density and resistivity model, and χ1 and χ2 are the normalized operators of resistivity and density, respectively. For our particular test cases, the normalized operators are determined by , and . Max and Min are the maximum and minimum values, respectively. and are represented as a separate inversion density and resistivity model, respectively.
In this paper, the Gaussian Newton algorithm (GN) is used to solve the joint inversion objective functional (7) in model-space [19,20,21,22,23,24]. Firstly, the nonlinear objective functional (7) and the constraint condition are transformed into linear equations by the Taylor expansion. Then, the Lagrangian operator method is used [36,37], which adds a constraint condition to the objective functional (7):
where ,
where A and B represent the Jacobian matrix of the forward response and the normalized cross-gradient functional , and Λ is a column vector of the Lagrange multipliers.
The solution of Equation (8) is determined using iterative model updates from a starting model by solving the equation . The model update is expressed as:
Substituting Equation (11) into the constraint condition, the expression of the Lagrange multiplier Λ is given as
Finally, we obtained the model expression of the model-space as follows:
In this paper, we transformed the inversion computing space from a model-space to a data-space. The formula for the joint inversion in the data-space can be directly derived from those in the model-space using the matrix identity that changes the size of the inverse matrix. We obtained the model expression of the data-space as follows:
Comparing the model expressions Equations (14) and (15) in different spaces, is an M × M dimensions matrix, and is an N × N dimensions matrix. M is the number of model parameters and N is the number of data. In general, the number of model parameters will be much larger than the number of data, and the Equation (14) needs to solve the inverse of the M × M dimension matrix during the joint inversion process with the model-space method, which results in increased storage requirements and computational time. Therefore, cross-gradient joint inversion can be more effectively implemented in data-space than model-space.
In this paper, the model covariance matrices of the two methods are constructed differently. The model covariance matrix () is directly required for the data-space method, while its inverse is required in the model-space method. In the model-space method, the inverse of the model covariance is usually implemented as a sparse model roughness operator [38,39,40]. The exact inverse of a specific roughness operator cannot be determined in practice because of the size of this matrix, which, in general, will be full. In the data-space method, the model covariance matrix is not directly constructed, and the products of the model covariance matrix with any model vector are computed by solving a diffusion equation [31,32]. Thus, the diffusion equation has to be repeatedly solved in QMR (quasi-minimal residual), unlike in the model space method, but using the operator splitting solution [32] makes it less computationally expensive. In summary, we use different model covariance matrices in model-space and data-space, so we will get two different inversion results.
4. Synthetic Example
4.1. Compare Gravity and Gravity Gradiometry Data
To verify the validity and feasibility of our proposed data-space joint inversion of the gravity gradiometry and MT data, we tested the separate inversion, the joint inversion of gravity and MT data, and the joint inversion of the gravity gradiometry and MT data in the data-space using a complex combined model that is more similar to the real underground structure, including some typical geological elements and fault structures, as shown in Figure 1. Four anomalous bodies are embedded in the uniform half-space E. Anomalous bodies A, B, and C are isolated crustal rocks of different sizes and different buried depths. Anomalous body D is a low-resistivity and high-density body in the deep region of the model. It is buried under the high-resistivity and low-density anomaly bodies B and C, with a ladder fracture structure on its left. The density model and the resistivity model adopt the same mesh (140 × 60) in the joint inversion mesh region, and the resistivity model requires the extension of the mesh (156 × 76) outside the joint inversion mesh region. Gravity and gravity gradiometry methods use the same observation point. There are 30 observation points with a point spacing of 0.2 km from a horizontal distance from 0 to 6 km. The MT data contain the apparent phase and apparent resistivity for 10 frequencies in the range of 1 to 1000 Hz for nine stations spaced 0.6 km from each other. To simulate the noisy data, a 5% random Gaussian noise was added to the MT, gravity, and gravity gradiometry forward response data.
The initial model of all inversions uses a uniform half-space with a density of 0 kg/m3 and a resistivity of 100 Ω·m. The reference model is set to the initial model. Figure 2 and Figure 3 show the forward response results of resistivity and density models of different methods. The forward response calculated by either the separate inversion or joint inversion results is basically consistent with theoretical model responses. Figure 4 shows the separate inversion results of the MT, gravity and gravity gradiometry for the complex combined model. The data misfit of MT, gravity and gravity gradiometry inversion are RMSMT = 0.95, RMSGrv = 0.71, and RMSGrad = 0.80, respectively (Figure 5a). Notably, the gravity inversion (Figure 4b) cannot recover the true space geometry and position of the anomalous bodies, and the vertical resolution of the inversion results is very poor, and it is difficult to accurately identify low-density anomalous bodies. However, the inversion result of the gravity gradiometry (Figure 4c) can roughly reflect the spatial position and geometry of the true anomalous bodies. Compared with the results of the gravity inversion, the distribution of the recovered underground anomaly can be improved, but the gravity gradiometry inversion results still have problems, such as the upset of the center of the anomalous bodies, the blurring of the boundary between the anomalous bodies and the surrounding rock, and the inability to recover the exact physical parameter value. The resistivity model (Figure 4a) recovers the gross structure of the synthetic model better than the density model (Figure 4b,c), as the MT data cover an adequate frequency range for distinguishing deep anomalous bodies. The results of the joint inversion are shown in Figure 6. For the joint inversion of gravity and MT (Figure 6a,b), the final models of resistivity and density are obtained with the data misfit (RMSMT = 0.66, RMSGrv = 1.0), as shown in Figure 5b. The structural features of the anomalous bodies are very similar in the resistivity and density models as required by our joint inversion algorithm. The deep anomalous body of the density model can be identified as an indirect contribution propagated from the resistivity model by the cross-gradient constraints. For the joint inversion of the gravity gradiometry and MT (Figure 6c,d), the final models of resistivity and density are obtained with data misfit (RMSMT = 0.83, RMSGrad = 0.80), as shown in Figure 5c. The resistivity and density models show improved features when compared to the above separate and joint inversion results. The density models’ anomalous bodies boundaries become clearer, and the geometrical and physical values of the anomaly more closely reflect the true model, as an indirect result of the resistivity model using the cross-gradient constraints. In particular, the vertical resolution has been significantly improved. The resistivity model also improves the horizontal resolution due to the structural similarity of the density. The results of the gravity gradiometry and MT joint inversion are better than the results of the separate inversion and gravity and MT joint inversion, both in space form and the numerical recovery of physical properties.
We also calculate the cross-gradient values of every pair of models from the data-space separate inversion of MT and gravity data (Figure 4a,b), the data-space separate inversion of MT and gravity gradiometry data (Figure 4a,c), the data-space joint inversion of MT and gravity data (Figure 6a,b), and the data-space joint inversion of MT and gravity gradiometry data (Figure 6c,d). The final cross-gradient values obtained for every model combination after applying separate and joint inversions are illustrated in the detailed maps of the cross-gradient values, as shown in Figure 7. Note that the joint inversion yields much smaller cross-gradient values for every pair of models than those of separate inversions. Meanwhile, the cross-gradient values of joint inversion base on MT and gravity gradiometry data are much smaller than those of joint inversion based on MT and gravity. This result serves as quantitative evidence that the proposed method ensures a higher level of structural conformity.
4.2. Test the Partially Structurally Consistent and Inconsistent Model
To test the adaptability and accuracy of our proposed data-space joint inversion of the gravity gradiometry and MT data in various scenarios, we tested the models that were partially structurally consistent and inconsistent. The mesh division and distribution of the observation points of the model are the same as those of theoretical model 1. We also added 5% Gaussian noises to the resistivity and density model responses.
The initial model of all inversions uses a uniform half-space with a density of 0 kg/m3 and a resistivity of 100 Ω·m. The reference model is set to the initial model. In the partially structurally consistent model (Figure 8a,b), the joint inversion results are shown in Figure 9a,b. The data misfit of the MT and gravity gradiometry inversion are RMSMT = 0.75 and RMSGrad = 0.95, respectively. In the structurally inconsistent model (Figure 10a,b), the joint inversion results are shown in Figure 11a,b. The data misfit of MT and gravity gradiometry inversion are RMSMT = 0.97 and RMSGrad = 0.73, respectively. All joint inversions converge to the RMS misfit threshold of one or less. We find that the proposed method can recover the geometry and physical parameter values of the underground anomaly sources in the partially structurally consistent and inconsistent models. The results show that the joint inversion of MT and gravity gradiometry is suitable for various scenarios (structural consistent and structural inconsistent models), which can recover the true model. Different geophysical methods are mutually constrained by the structural similarities at the same model boundaries, while the structural similarity constraints are not effective at different model boundaries, and joint inversion only performs smoothing model constraints.
4.3. Compare Joint Inversion of Model-Space and Data-Space
In this section, we will test the advantages of the joint inversion of gravity gradiometry and MT data in the data-space compared to the model-space in terms of the computational time and memory storage. We designed a density and resistivity model that increases the number of meshes and observation points, as shown in Figure 12. The density model and the resistivity model adopt the same mesh (341 × 121) in the joint inversion mesh region, and the resistivity model requires an extension of the mesh (357 × 135) outside the joint inversion mesh region. There are two rectangular bodies embedded in the uniform half-space. The sizes of the two rectangular bodies are 0.6 × 1.0 km2. The gravity gradiometry method has 79 observation points, with a point spacing of 0.1 km from a horizontal distance of −1 to 7 km. The MT data contain the apparent phase and apparent resistivity for 10 frequencies in the range of 1 to 1000 Hz for 39 stations spaced 0.2 km from each other.
Regardless of the data-space or the model-space method, the initial model uses a uniform half-space, with a density of 0 kg/m3 and a resistivity of 100 Ω·m. The reference model is set to the initial model. For the model-space joint inversion of gravity gradiometry and MT, the sixth iteration model (Figure 13a,b) attained data misfits of 1.05 and 1.14 for gravity gradiometry and MT, respectively. For the data-space joint inversion of gravity gradiometry and MT, the sixth iteration model (Figure 13c,d) attained data misfits of 1.05 and 1.00 for gravity gradiometry and MT. We can find that the inversion results of the two methods can recover the geometry of the double anomaly. However, the resistivity and density models (Figure 13c,d) show improved features when compared to the model-space joint inversion results (Figure 6b,e). The density and resistivity models’ anomalous body boundaries become clearer, and the geometrical and physical values of the anomaly more closely reflect those of the true model. The inconsistencies of the inversion results are mainly due to the different model covariance matrices used by the two methods. In terms of inversion calculation time, the model-space method consumes approximately 13.15 h, whereas the data-space method consumes approximately 3.92 h for our particular test example. In addition, the maximum memory requirements are approximately 4.1 and 0.62 GB, respectively, as shown in Table 1. The data-space method can be applied to the joint inversion MT and gravity gradiometry, which can greatly reduce memory consumption and effectively improve the calculation speed. This method allows us to invert the multi-parameter joint inversion of large areas of large data volume with a personal computer (PC) in a relatively short period of time.
5. Field Example
5.1. Geologic Background of the Study Area
The study area is located in Liangjiang Town, Antu County, Jilin Province (Figure 14). The area belongs to the eastern part of the northern margin of the North China plate in the geotectonic position, and its northeast side is adjacent to the Xingmeng-Jihei orogenic belt. The oldest formations exposed in the study area are the Paleoproterozoic formations, followed by the Middle Proterozoic, Mesozoic, and Cenozoic formations. However, Paleozoic formations are generally missing. Due to the special geotectonic environment in the study area, the magmatic action in the area is strong, and intrusive rocks of different ages are widely developed. According to the characteristics of the times, these rocks can be divided into two parts: Late Archean and Mesozoic granitic rocks. The area is located in the eastern part of the Jihei trough fold system, and the Jiamusi block and the north edge of the North China plate collide with the wrinkled orogenic belt and are in the superposition of the western Pacific tectonic domain (NE-trending structure) and the ancient Asian domain (EW-trending structure). The fold structure and fault structure are very developed. The mineral resources in the area are also very rich, with many types of deposits, many mineralization periods, large scales, as well as high gold grade and concentrated distribution. The main minerals include gold, molybdenum, iron, copper, and nickel. The representative deposit in the area is the Haigou gold mine. The formation and distribution of the Haigou gold deposits are closely controlled by the structure of the area. The deposit is a large-scale sulphide-like quartz vein- type gold deposit, belonging to the orogenic gold deposit. Other mineral resources in the area include coal mines, peat, and oil shale deposits, which are important metallogenic prospects for endogenous metals and non-metals.
5.2. Data Acquisition and Inversion
We conducted a geophysical survey along with one profile in the study area. Figure 15 shows the geological map of the study area. The black solid line indicates the position of the survey line. The survey line runs in a north-east direction and measures 18 km in length. A total of 181 controlled-source audio-frequency magnetotelluric (CSAMT) points are collected, and the distance between the observation points is 100 m. Each observation point acquired the apparent resistivity of 10 frequencies (16–8192 Hz) in TM mode. Using the full regional apparent resistivity method [41], we convert the CSAMT apparent resistivity data to the near-source corrected apparent resistivity data, as shown in Figure 16a. Meanwhile, the gravity Bouguer data were extracted with 40 m spacing along our study profile to furnish 451 gravity data for inversion. We transform the gravity data (Figure 16b) into gravity gradiometry data (Figure 16c–e) by Fourier transform, i.e., the space domain and frequency domain integration and derivation [42].
The CSAMT, gravity, and gravity gradiometry data were inverted to resistivity and residual density models using the separate inversion, the joint inversion of CSAMT and gravity data using the model-space method, and the joint inversion of CSAMT and gravity gradiometry data using the data-space method. The density model and the resistivity model use the same mesh (327 × 61) in the joint inversion region. Outside the joint inversion region, the resistivity model also needs to expand the mesh size (343 × 73). The initial model is a uniform half-space with a density of 0 kg/m3 and a resistivity of 102.5 Ω·m. The results of the separate inversion are shown in Figure 17 and Figure 18. In the separate inversion using the model-space method, the data misfit of the CSAMT, gravity, and gravity gradiometry are RMSCSAMT = 1.08, RMSGrv = 0.48, and RMSGrad = 0.97, respectively. In the separate inversion using the data-space method, the data misfit of the CSAMT, gravity, and gravity gradiometry are RMSCSAMT = 1.08, RMSGrv = 0.93 and RMSGrad = 0.99, respectively. The separate inversion results obtained by the two methods are, generally, features of the same trend. The inconsistencies of the inversion results are mainly due to the different covariances of the models used by the two methods. The structural similarities of the separate inversion results of the three geophysical exploration methods are very different in both the model-space and data-space methods. These differences create great difficulties for geological interpretation. Compared with the gravity inversion results, the gravity gradiometry inversion results identify greater underground structural distribution and can obtain more underground information and help geological interpretation.
The results of the joint inversion are shown in Figure 19, Figure 20 and Figure 21. For the joint inversion of gravity and CSAMT data using the model-space method (Figure 19a,b), the final models of resistivity and density are obtained with the data misfit (RMSCSAMT = 1.08, RMSGrv = 0.64). For the joint inversion of gravity gradiometry and CSAMT data using the model-space method (Figure 20a,b), the final models of resistivity and density are obtained with data misfit (RMSCSAMT = 1.00, RMSGrad = 0.99). For the joint inversion of gravity gradiometry and CSAMT data using the data-space method (Figure 21a,b), the final models of resistivity and density are obtained with data misfit (RMSCSAMT = 1.64, RMSGrad = 1.29). Note that the structural similarity between the different physical properties in the results of joint inversion, which is due to the contribution of cross-gradient constraints in the objective functional, and the result of the joint inversion is more conducive to geological interpretation. Comparing the joint inversion results of the two different data sets, we find that the results of the joint inversion of gravity and MT can roughly divide the underground structure. However, the results of the joint inversion of the gravity gradiometry and MT can clearly and meticulously identify the underground structural information, which facilitates more accurate geological interpretation and detection of geological resources. Meanwhile, the joint inversion based on data-space (Figure 21a,b) has more advantages in memory storage and computing time than model-space (Figure 20a,b).
5.3. Geological Interpretation
The geophysical models selected for the final interpretation are represented in the composite form of an RGB (red-green-blue) image, which facilitates an integrated analysis of the multiple models and a visualization of the significant units. Figure 22 shows the RGB images composed of separately and jointly estimated models using the data-space method. By comparing the composite image of the separate inversion and joint inversion, it can be found that the composite images obtained by joint inversion are superior to those obtained by separate inversion, and a clearer anomalous source boundary can be obtained, mainly due to the inconsistency of the separate inversion results of the different methods. The composite image color contains the resistivity and residual density information, from which the inversion results can be analyzed intuitively to accurately identify, and possibly classify, the underground geological structures. We predict that the combined analysis of the constituent parameter values in the RGB image will be of immense value to the search for multiple parameter cross-correlations that can help in lithology classification and the understanding of complex subsurface processes.
We produced a geological interpretation for this area using the RGB composite image (Figure 22c) and a geological map (Figure 15). First, we divided the survey line into four segments (I–IV) according to the distribution of gravity anomalies from the northwest side to the southeast side of the profile from high to low to high and then low. Segment I is located at the northwest end of the study area, and the surface reveals the medium and fine-grained alkali-feldspar granite with low density and high resistivity. The gravity anomaly of this segment is characterized by a mid–high anomaly with a gentle change, and it can be inferred that it is a comprehensive reflection of the background value increase caused by the relatively mid–high density Qingbaikouan period Diaoyutai formation near the northwest end of the survey line. The surface lithology of segment II is the sandstone and conglomerate of the Cretaceous Dalizi formation. The gravity anomaly value of this segment is the smallest, and the resistivity is low. This resistivity is presumed to be caused by the Cretaceous Dalizi formation and the Changcai formation, with large sediment thickness caused by the Yalu River fault. The surface of segment III reveals the Diaoyutai formation, Mayihe rock formation, and Archean gneiss. The gravity anomaly value of this segment is the highest, and the resistivity is high. This resistivity is mainly caused by the Archean granodiorite gneiss and Early Proterozoic Mayihe rock formation marble. The local peak depression of the gravity gradiometry anomaly is caused by the Jurassic medium-fine-grained monzonite granite. Segment IV is located at the southeast end of the survey line, is a low-gravity anomaly area. Here, there are Manjiang formations and Cretaceous Dalazi formations on the surface. It was speculated that this segment was caused by the basalt of the Manjiang formation and the sandstone of the Cretaceous Dalazi formation under a cover layer, the Jurassic Tuntianying formation andesite, and the Jurassic medium-fine-grained monzonite granite with relatively low-density and low-resistivity. Moreover, through the geological map and the RGB composite map, we can infer the distribution of the fault structure (F_1–F_4) below the survey line. Based on the above inference results, we finally obtained a comprehensive interpretation profile, as shown in Figure 23. The corresponding lithostratigraphic units in Figure 23 are shown in Table 2.
The Haigou gold deposit discovered in the study area is mainly controlled by the fault structure. The vein is mainly distributed in the ore-controlling fault zone. The main mineralized surround rock of the gold vein is monzonitic granite. According to the comprehensive interpretation profile results (Figure 23) and the deposit formation of the known mining area, it can be helpful to determine the ore-forming target area of the profile. We preliminarily predicted that the ore-forming target area would be mainly concentrated near the fault structure F_3. The interlaminar fault zone is the center of the regional tectonic, magmatic activity, and later ore-forming hydrothermal activities. Prospecting work should pay attention to the mineralization clues of the contact sites between the Mesozoic intrusive rocks and Paleoproterozoic Mayihe rock formation, particularly the Jurassic medium-fine-grained monzonite granite. In this paper, the data-space joint inversion of MT and gravity gradiometry data could accurately divide the stratum structure and fault zone and have the ability to find the prospecting target area, thereby providing a powerful basis for the mining of the deposit.
6. Conclusions
We developed an approach to the joint inversion of MT and gravity gradiometry data based on normalized cross-gradient constraints and data-space. This study shows that the normalized cross-gradient and data-space techniques can be successfully adapted to the problem of 2D joint inversion of collocated MT and gravity gradiometry data from measurements at different spatial scales. Numerical modeling results showed that joint inversion of MT and gravity gradiometry data lead to models that are in superior structural accord and closer to the ground-truth than those derived from separate methods and conventional joint inversion of MT and gravity data. The joint inversion models recovered the salient features of the range of resistivity and density amplitude, low-density zones and steep features that posed significant imaging problems to the separate methods. Moreover, the data-space method can be applied to the joint inversion MT and gravity gradiometry, which can greatly reduce memory consumption and effectively improve calculation speed. This method allows us to invert the joint inversion of a large data volume with a personal computer (PC) in a relatively short period of time. Note that the resistivity and density estimates provided improved information that can facilitate the lithotype and structural classification of the subsurface. Application of this approach to field data sets from a mining study area are available yielded CSAMT and gravity gradiometry models that are in excellent geometrical accord and remarkable consistency. We suggest that joint inversion of collocated MT and gravity gradiometry profiles and the use of the RGB composite image results in structural or lithological classification will lead to improved subsurface characterization in complicated geological terrains and should be seen as the way forward in deep subsurface minerals and petroleum resources exploration studies.
Author Contributions
Conceptualization, R.Z.; methodology, R.Z. and T.L.; software, R.Z.; validation, T.L.; formal analysis, R.Z. and T.L.; investigation, R.Z. and T.L.; resources, R.Z. and T.L.; data curation, R.Z. and T.L.; writing—original draft preparation, R.Z.; writing—review and editing, R.Z. and T.L.; supervision, T.L.; project administration, T.L.; funding acquisition, T.L.
Funding
This research was funded by the Nation Key R&D Program of China (2017YFC0601606) and Jilin University PhD Graduate Interdisciplinary Research Funding Project (10183201838).
Conflicts of Interest
The authors declare no conflict of interest.
References
- Auken, E.; Pellerin, L.; Christensen, N.B. A survey of current trends in near-surface electrical and electromagnetic methods. Geophysics 2006, 71, G249–G260. [Google Scholar] [CrossRef]
- Kowalsky, M.B.; Chen, J.; Hubbard, S.S. Joint inversion of geophysical and hydrological data for improved subsurface characterization. Lead. Edge 2006, 25, 730–731. [Google Scholar] [CrossRef]
- Colombo, D.; De Stefano, M. Geophysical modeling via simultaneous joint inversion of seismic, gravity, and electromagnetic data: Application to prestack depth imaging. Lead. Edge 2007, 26, 326–331. [Google Scholar] [CrossRef]
- Alpak, F.O.; Torres-Verdin, C.; Habashy, T.M. Estimation of in situ petrophysical properties from wireline formation tester and induction logging measurements: A joint inversion approach. J. Pet. Sci. Eng. 2008, 63, 1–17. [Google Scholar] [CrossRef]
- Fregoso, E.; Gallardo, L.A. Cross-gradients joint 3D inversion with applications to gravity and magnetic data. Geophysics 2009, 74, L31–L42. [Google Scholar] [CrossRef]
- Linde, N.; Tryggvason, A.; Peterson, J.E. Joint inversion of cross hole radar and seismic traveltimes acquired at the South Oyster Bacterial Transport Site. Geophysics 2008, 73, G29–G37. [Google Scholar] [CrossRef]
- Moorkamp, M.; Lelièvre, P.G.; Linde, N.; Khan, A. Integrated Imaging of the Earth: Theory and Applications; John Wiley & Sons: New Jersey, NJ, USA, 2016. [Google Scholar]
- Moorkamp, M.; Heincke, B.; Jegen, M.; Roberts, A.W.; Hobbs, R.W. A framework for 3D joint inversion of MT, gravity and seismic refraction data. Geophys. J. Int. 2011, 184, 477–493. [Google Scholar] [CrossRef]
- Gallardo, L.A.; Meju, M.A. Structure-coupled multiphysics imaging in geophysical sciences. Rev. Geophys. 2011, 49, RG1003. [Google Scholar] [CrossRef]
- Tarantola, A. Inversion Problem Theory and Methods for Model Parameter Estimation; SIAM: Philadelphia, PA, USA, 2005. [Google Scholar]
- Yang, W.C. Theory and Methods of Geophysical Inversion; Geological Publishing House: Beijing, China, 1997. (In Chinese) [Google Scholar]
- Heincke, B.; Jegen, M.; Hobbs, R. Joint inversion of MT, gravity and seismic data applied to sub-basalt imaging. SEG Expand Abstr. 2006, 2006, 784–789. [Google Scholar]
- Gao, G.; Abubakar, A.; Habashy, T.M. Joint petrophysical inversion of electromagnetic and full-waveform seismic data. Geophysics 2012, 77, WA3–WA18. [Google Scholar] [CrossRef]
- Haber, E.; Oldenburg, D. Joint inversion: A structural approach. Inverse Probl. 1997, 13, 63–77. [Google Scholar] [CrossRef]
- Zhang, J.; Morgan, F.D. Joint seismic and electrical tomography. In Symposium on the Application of Geophysics to Engineering and Environmental Problems; SEG: Denver, CO, USA, 1997; pp. 391–396. [Google Scholar]
- Gallardo, L.A.; Meju, M.A. Characterization of heterogeneous near-surface materials by joint 2d inversion of dc resistivity and seismic data. Geophys. Res. Lett. 2003, 30, 1658. [Google Scholar] [CrossRef]
- Abubakar, A.; Gao, G.; Havashy, T.M.; Liu, J. Joint inversion approaches for geophysical electromagnetic and elastic full-waveform data. Inverse Probl. 2012, 28, 055016. [Google Scholar] [CrossRef]
- Hamdan, H.A.; Vafidis, A. Joint inversion of 2D resistivity and seismic travel time data to image saltwater intrusion over karstic areas. Environ. Earth Sci. 2013, 68, 1877–1885. [Google Scholar] [CrossRef]
- Li, T.L.; Zhang, R.Z.; Pak, Y.C. Joint Inversion of magnetotelluric and first-arrival wave seismic traveltime with cross-gradient constraints. J. Jilin Univ. Earth Sci. Ed. 2015, 45, 952–961. [Google Scholar]
- Gallardo, L.A.; Meju, M.A. Joint two-dimensional DC resistivity and seismic travel time inversion with cross-gradients constraints. J. Geophys Res. Solid Earth 2004, 109, B03311. [Google Scholar] [CrossRef]
- Gallardo, L.A.; Fontes, S.L.; Meju, M.A.; Buonora, M.P.; De Lugao, P.P. Robust geophysical integration through structure-coupled joint inversion and multispectral fusion of seismic reflection, magnetotelluric, magnetic, and gravity images: Example from santos basin, offshore brazil. Geophysics 2012, 77, B237–B251. [Google Scholar] [CrossRef]
- Li, T.L.; Zhang, R.Z.; Pak, Y.C. Multiple joint inversion of geophysical data with sub-region cross-gradient constraints. Chin. J. Geophys. 2016, 59, 2979–2988. [Google Scholar]
- Zhang, R.Z.; Li, T.L.; Deng, H. 2D joint inversion of MT, gravity, magnetic and seismic first-arrival traveltime with cross-gradient constraints. Chin. J. Geophys. 2019, 62, 2139–2149. [Google Scholar]
- Zhang, R.Z.; Li, T.L.; Zhou, S.; Deng, X.H. Joint MT and gravity inversion using structural constraints: A case study from the Linjiang copper mining area, Jilin, China. Minerals 2019, 9, 407. [Google Scholar] [CrossRef]
- Zhdanov, M.S.; Ellis, R.; Mukherjee, S. Three-dimensional regularized focusing inversion of gravity gradient tensor component data. Geophysics 2004, 69, 1–4. [Google Scholar] [CrossRef]
- Martinez, C.; Li, Y.; Krahenbuhl, R. 3D inversion of airborne gravity gradiometry data in mineral exploration: A case study in the Quadrilátero Ferrífero, Brazil. Geophysics 2013, 78, B1–B11. [Google Scholar] [CrossRef]
- Geng, M.; Huang, D.; Yang, Q. 3D inversion of airborne gravity-gradiometry data using cokriging. Geophysics 2014, 79, G37–G47. [Google Scholar] [CrossRef]
- Pilkington, M. Analysis of gravity gradiometer inverse problems using optimal design measures. Geophysics 2012, 77, G25–G31. [Google Scholar] [CrossRef]
- Pilkington, M. Evaluating the utility of gravity gradient tensor components. Geophysics 2014, 79, G1–G14. [Google Scholar] [CrossRef] [Green Version]
- Kivior, I.; Markham, S.; Hagos, F. Improved imaging of the subsurface geology in the Mowla Terrace, Canning Basin using gravity gradiometry data. ASEG Ext. Abstr. 2018, 2018, 1–10. [Google Scholar] [CrossRef]
- Siripunvaraporn, W.; Egbert, G. An efficient data-subspace inversion method for 2-D magnetotelluric data. Geophysics 2000, 65, 791–803. [Google Scholar] [CrossRef]
- Siripunvaraporn, W.; Egbert, G.; Lenbury, Y.; Uyeshima, M. Three–dimensional magnetotelluric inversion: Data-space method. Phys. Earth Planet. Inter. 2005, 150, 3–14. [Google Scholar] [CrossRef]
- Singh, B. Simultaneous computation of gravity and magnetic anomalies resulting from a 2D object. Geophysics 2002, 67, 801–806. [Google Scholar] [CrossRef]
- Won, I.J. Computing the gravitational and magnetic anomalies due to a polygon: Algorithms and Fortran subroutines. Geophysics 1987, 52, 202–205. [Google Scholar] [CrossRef]
- Wannamaker, P.E.; Stodt, J.A.; Rijo, L. A stable finite element solution for two-dimensional magnetotelluric modeling. Geophys. J. Int. 1987, 88, 277–296. [Google Scholar] [CrossRef]
- Menke, W. Geophysical Data Analysis: Discrete Inverse Theory, Revised Version: International Geophysics; Academic Press: San Diego, CA, USA, 1989. [Google Scholar]
- Tarantola, A. Inverse Problem Theory: Methods for Data Fitting and Model Parameter Estimation; Elsevier: New York, NY, USA, 1987. [Google Scholar]
- Constable, S.C.; Parker, R.L.; Constable, C.G. Occam’s inversion: A practical algorithm for generating smooth models from electromagnetic sounding data. Geophysics 1987, 52, 289–300. [Google Scholar] [CrossRef]
- deGroot-Hedlin, C. Removal of static shift in two dimensions by regularized inversion. Geophysics 1991, 56, 2102–2106. [Google Scholar] [CrossRef]
- deGroot-Hedlin, C.; Constable, S. Inversion of magnetotelluric data for 2D structure with sharp resistivity contrasts. Geophysics 2004, 69, 78–86. [Google Scholar] [CrossRef]
- Li, H.; Li, T.; Wu, L. Transformation of all-time apparent resistivity of CSAMT and analysis of its effect. Prog. Geophys. (In Chinese) 2015, 30, 0889–0893. [Google Scholar]
- ÖzgüArisoy, M.; Dikmen, Ü. Potensoft: MATLAB-based software for potential field data processing, modeling and mapping. Comput. Geosci. 2011, 37, 935–942. [Google Scholar]
Figure 1.
Theoretical model 1.
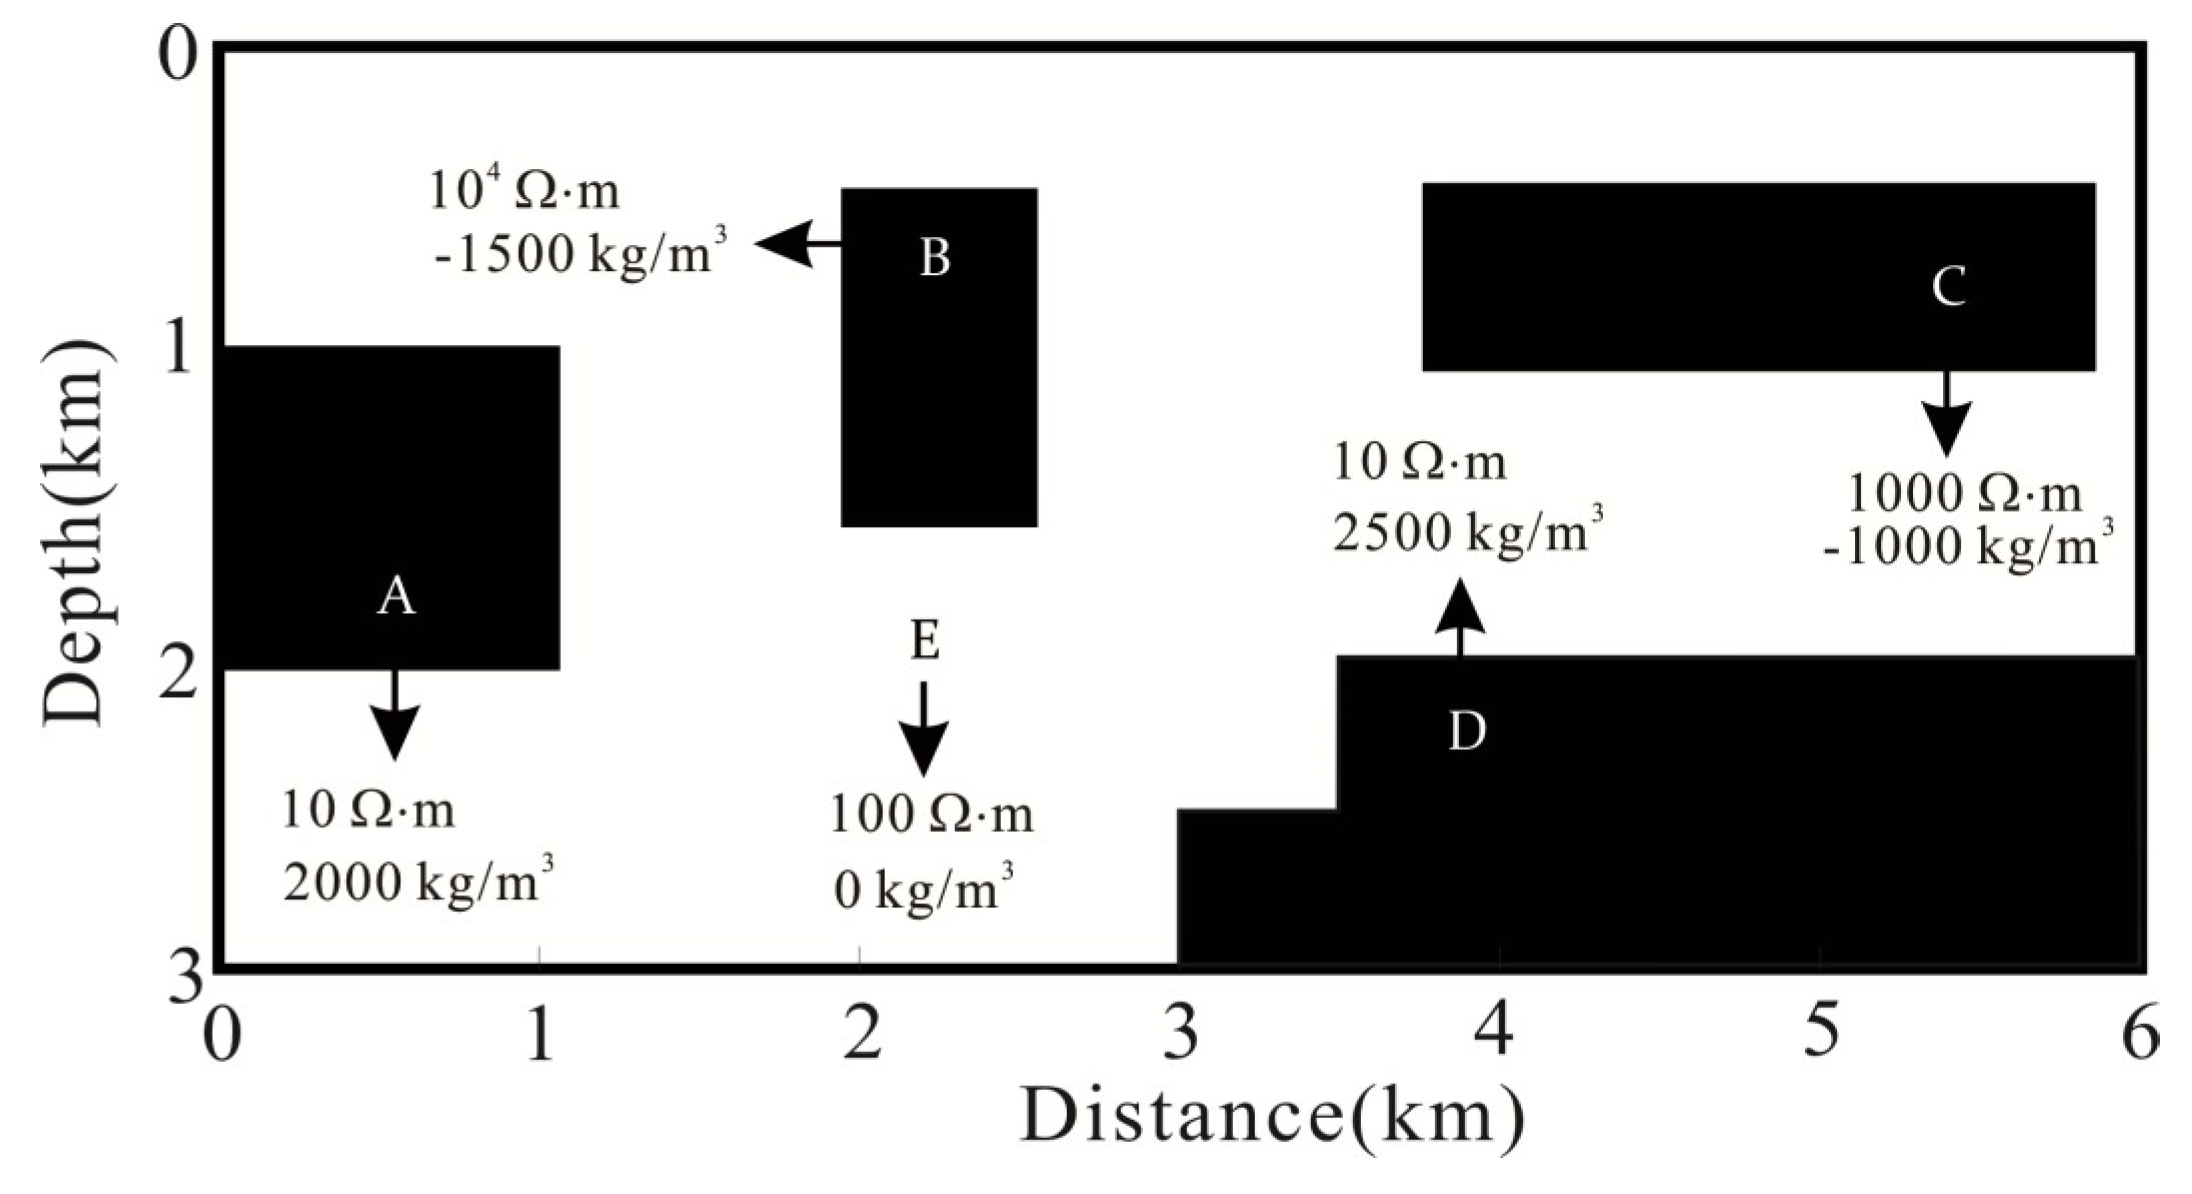
Figure 2.
Pseudo-sections illustrating the forward responses of apparent resistivity (a,c,e,g) and apparent phase (b,d,f,h) by the transverse magnetic mode. Forward response of theoretical resistivity model (a,b), forward response of separate inversion of magnetotelluric (MT) (c,d), forward response of joint inversion of gravity and MT (e,f), forward response of joint inversion of gravity gradiometry and MT (g,h).
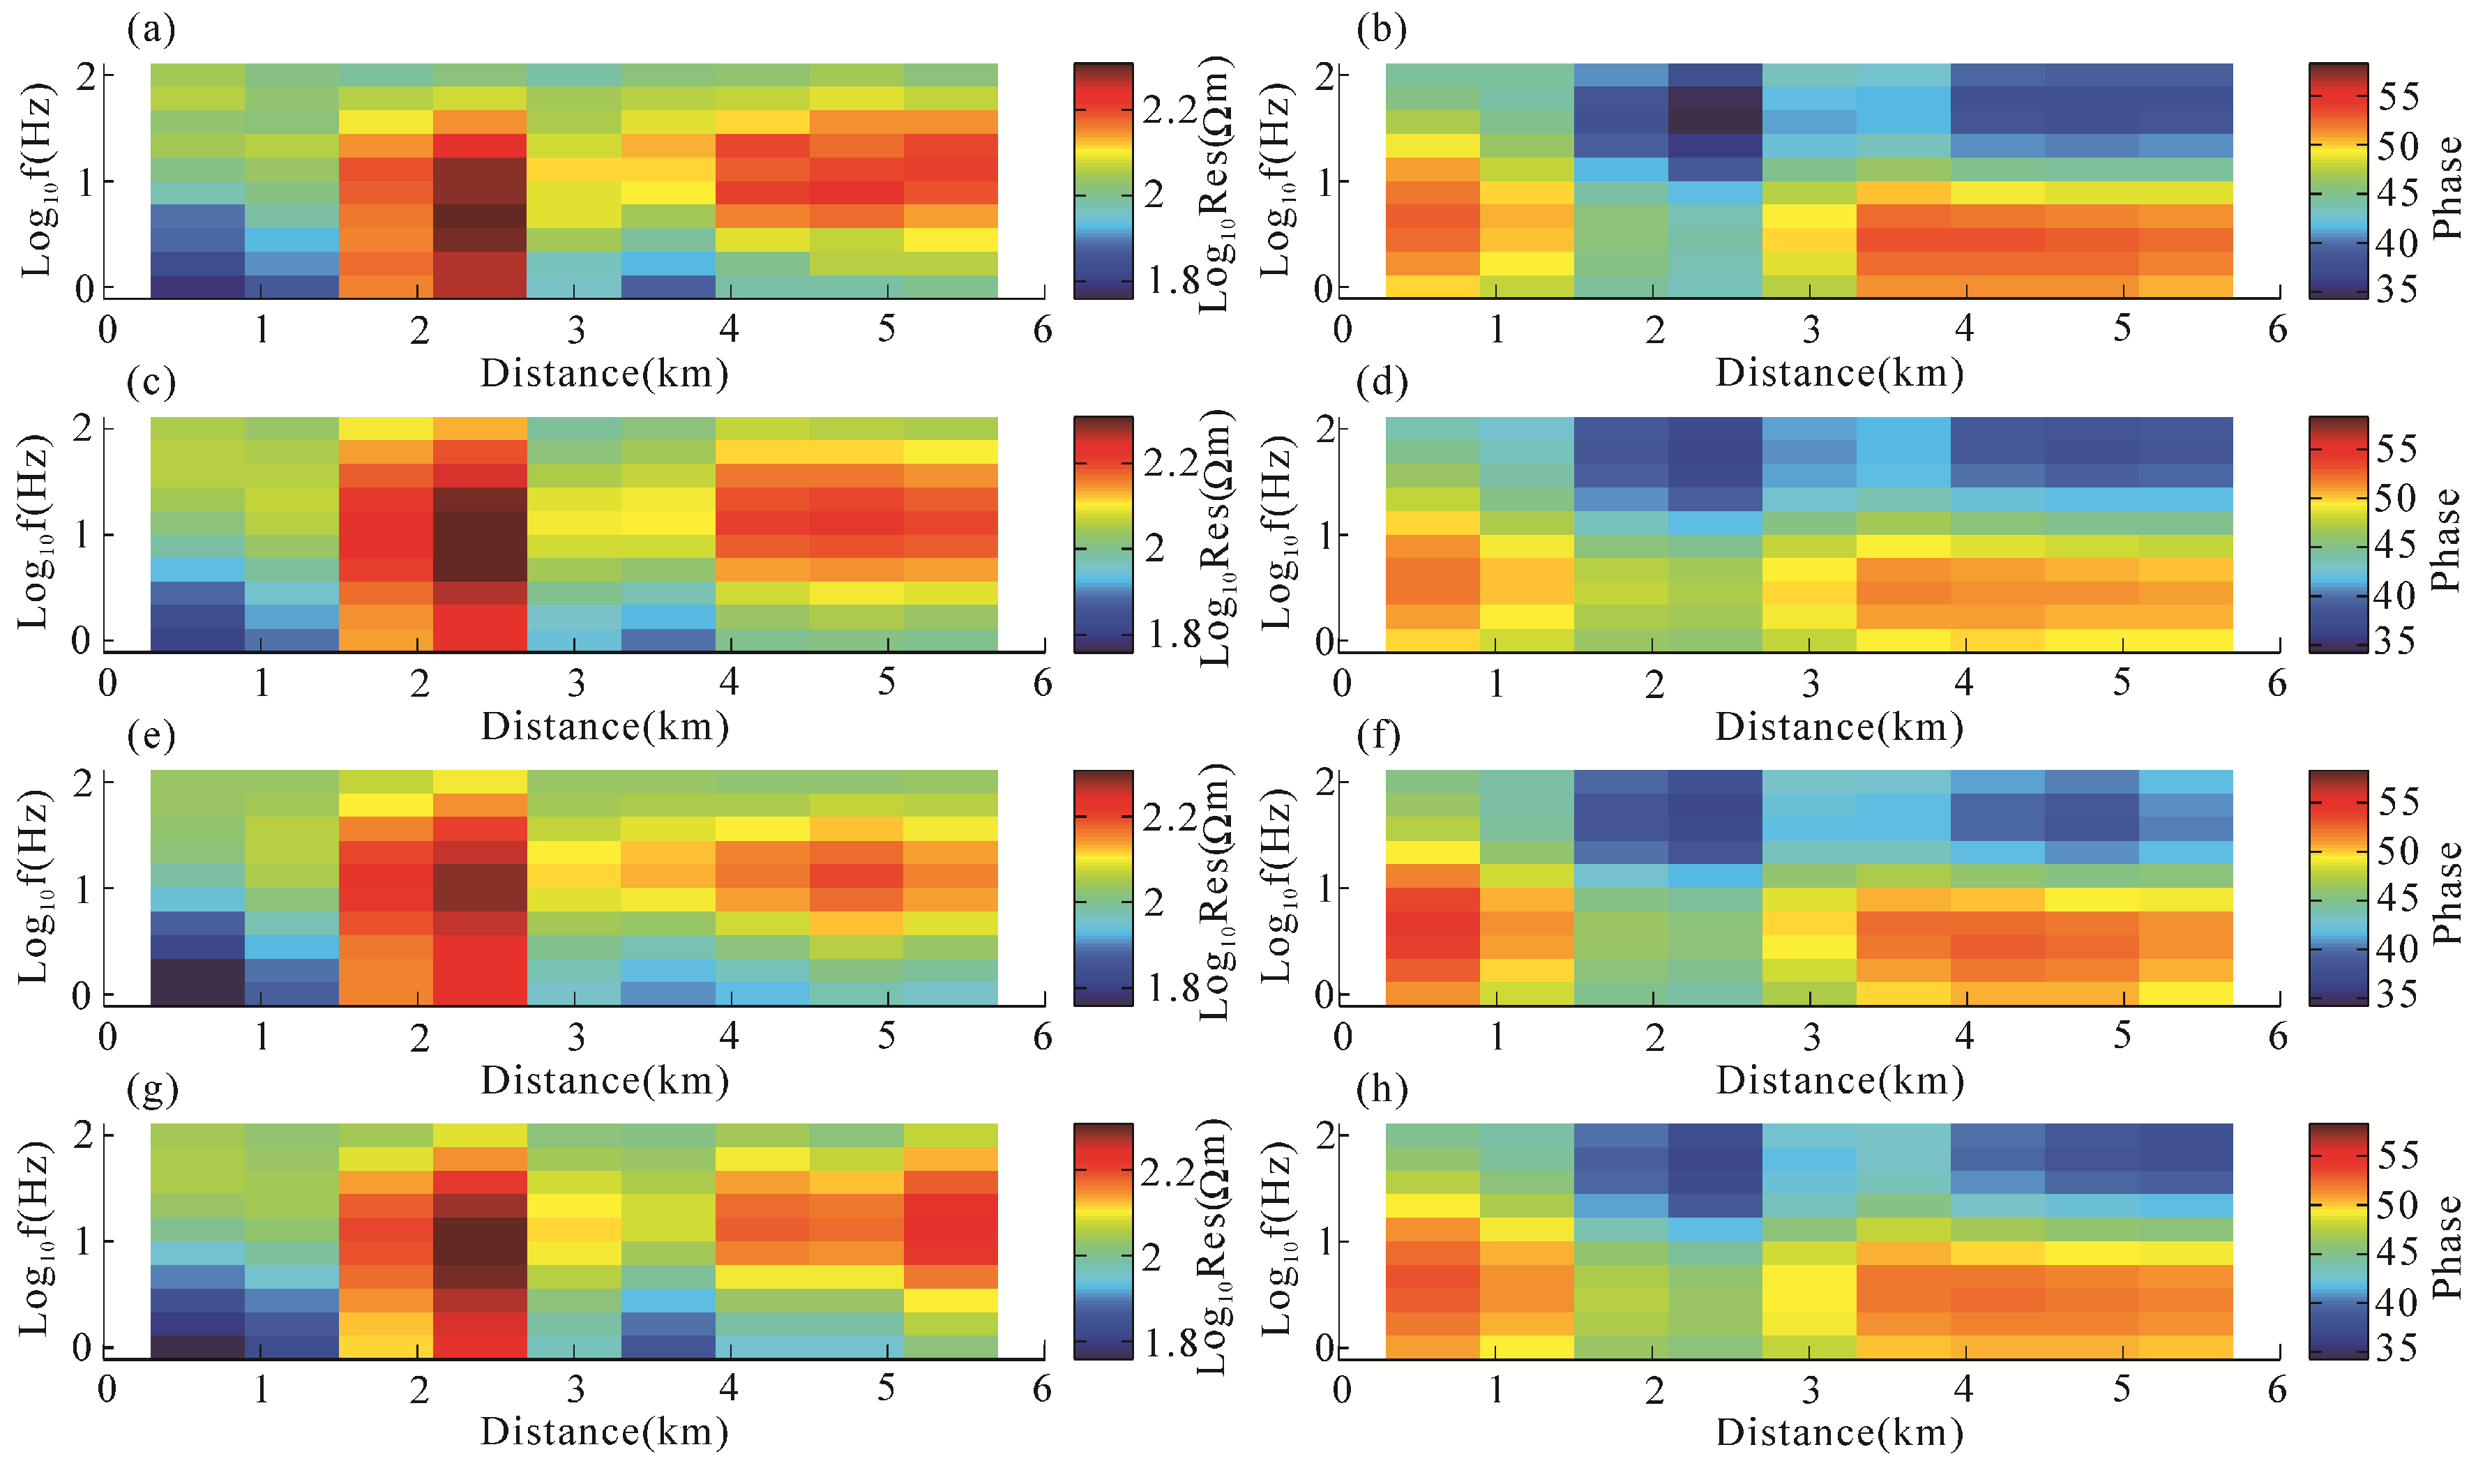
Figure 3.
Forward responses curves of gravity (a,b) and gravity gradiometry (c,d,e,f,g,h). Forward response of the separate inversion of the gravity (a), forward response of the separate inversion of the gravity gradiometry (c,e,g), forward response of the joint inversion of the gravity and MT (b), forward response of the joint inversion of the gravity gradiometry and MT (d,f,h). The blue line represents the forward response of the theoretical models. The red line represents the forward response of the inversion results.
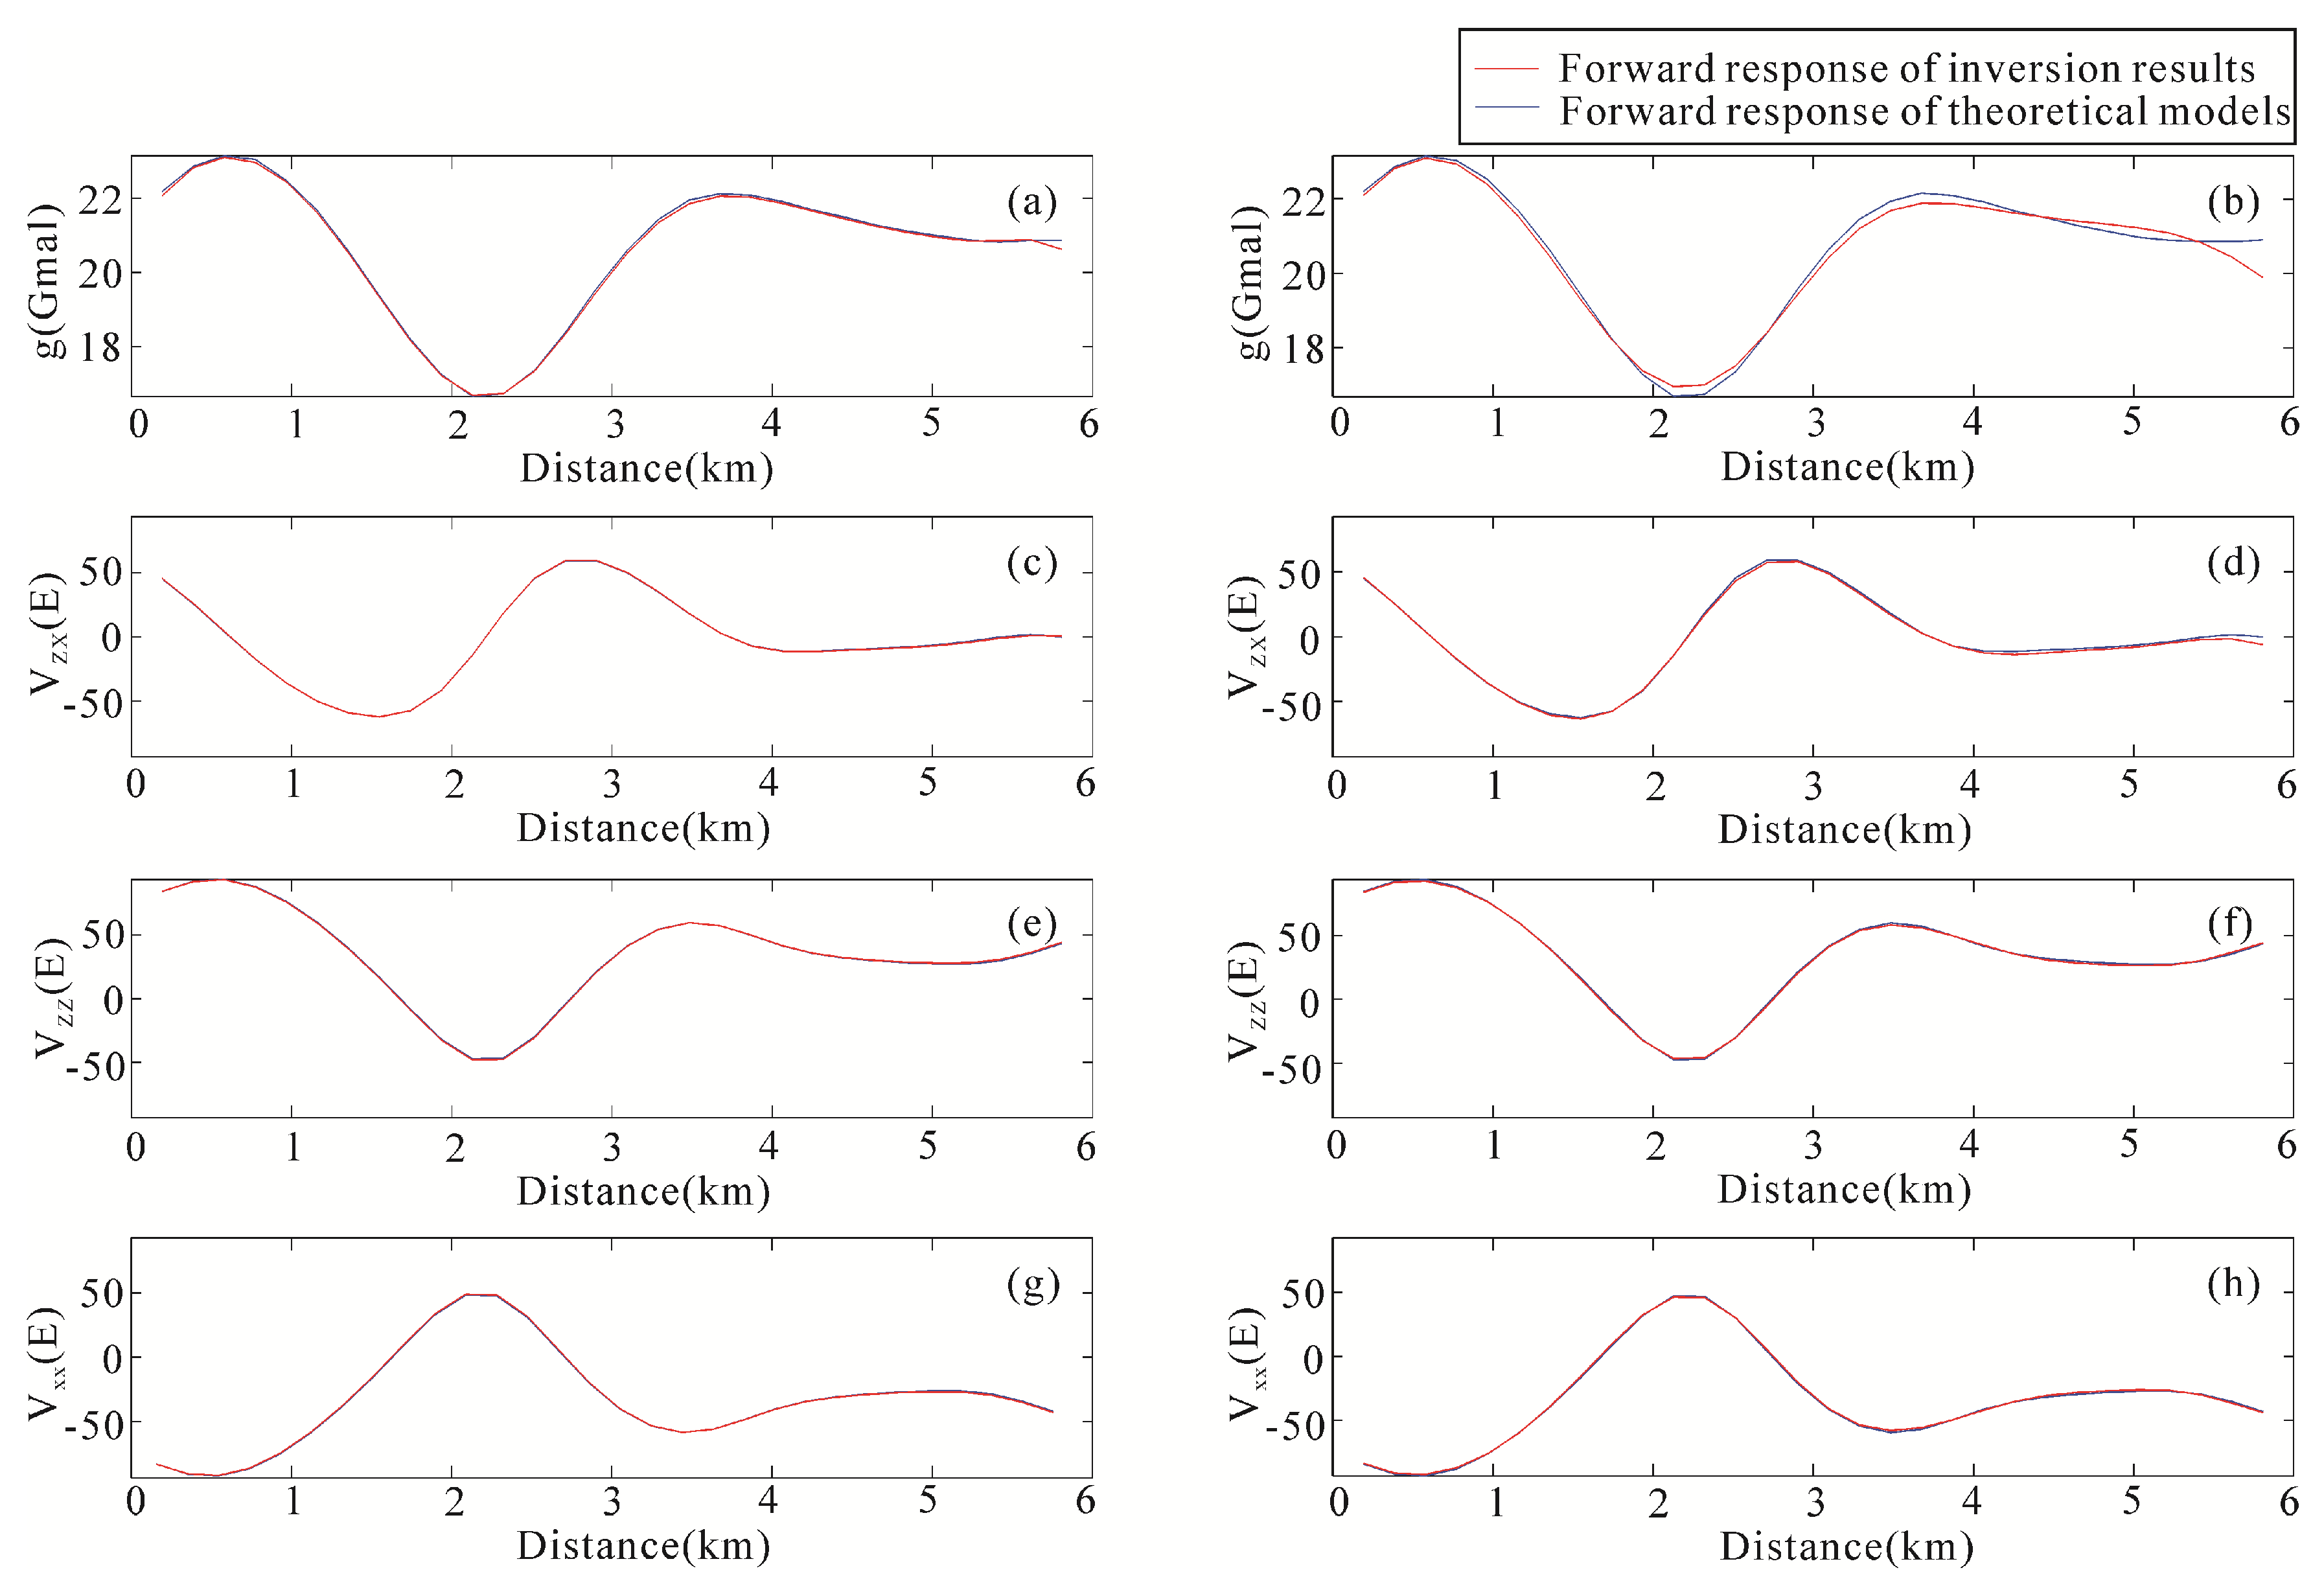
Figure 4.
The data-space separate inversion results of model 1. Separate inversion results of MT (a), gravity (b) and gravity gradiometry (c), resistivity model (a), density model (b,c).
Figure 4.
The data-space separate inversion results of model 1. Separate inversion results of MT (a), gravity (b) and gravity gradiometry (c), resistivity model (a), density model (b,c).
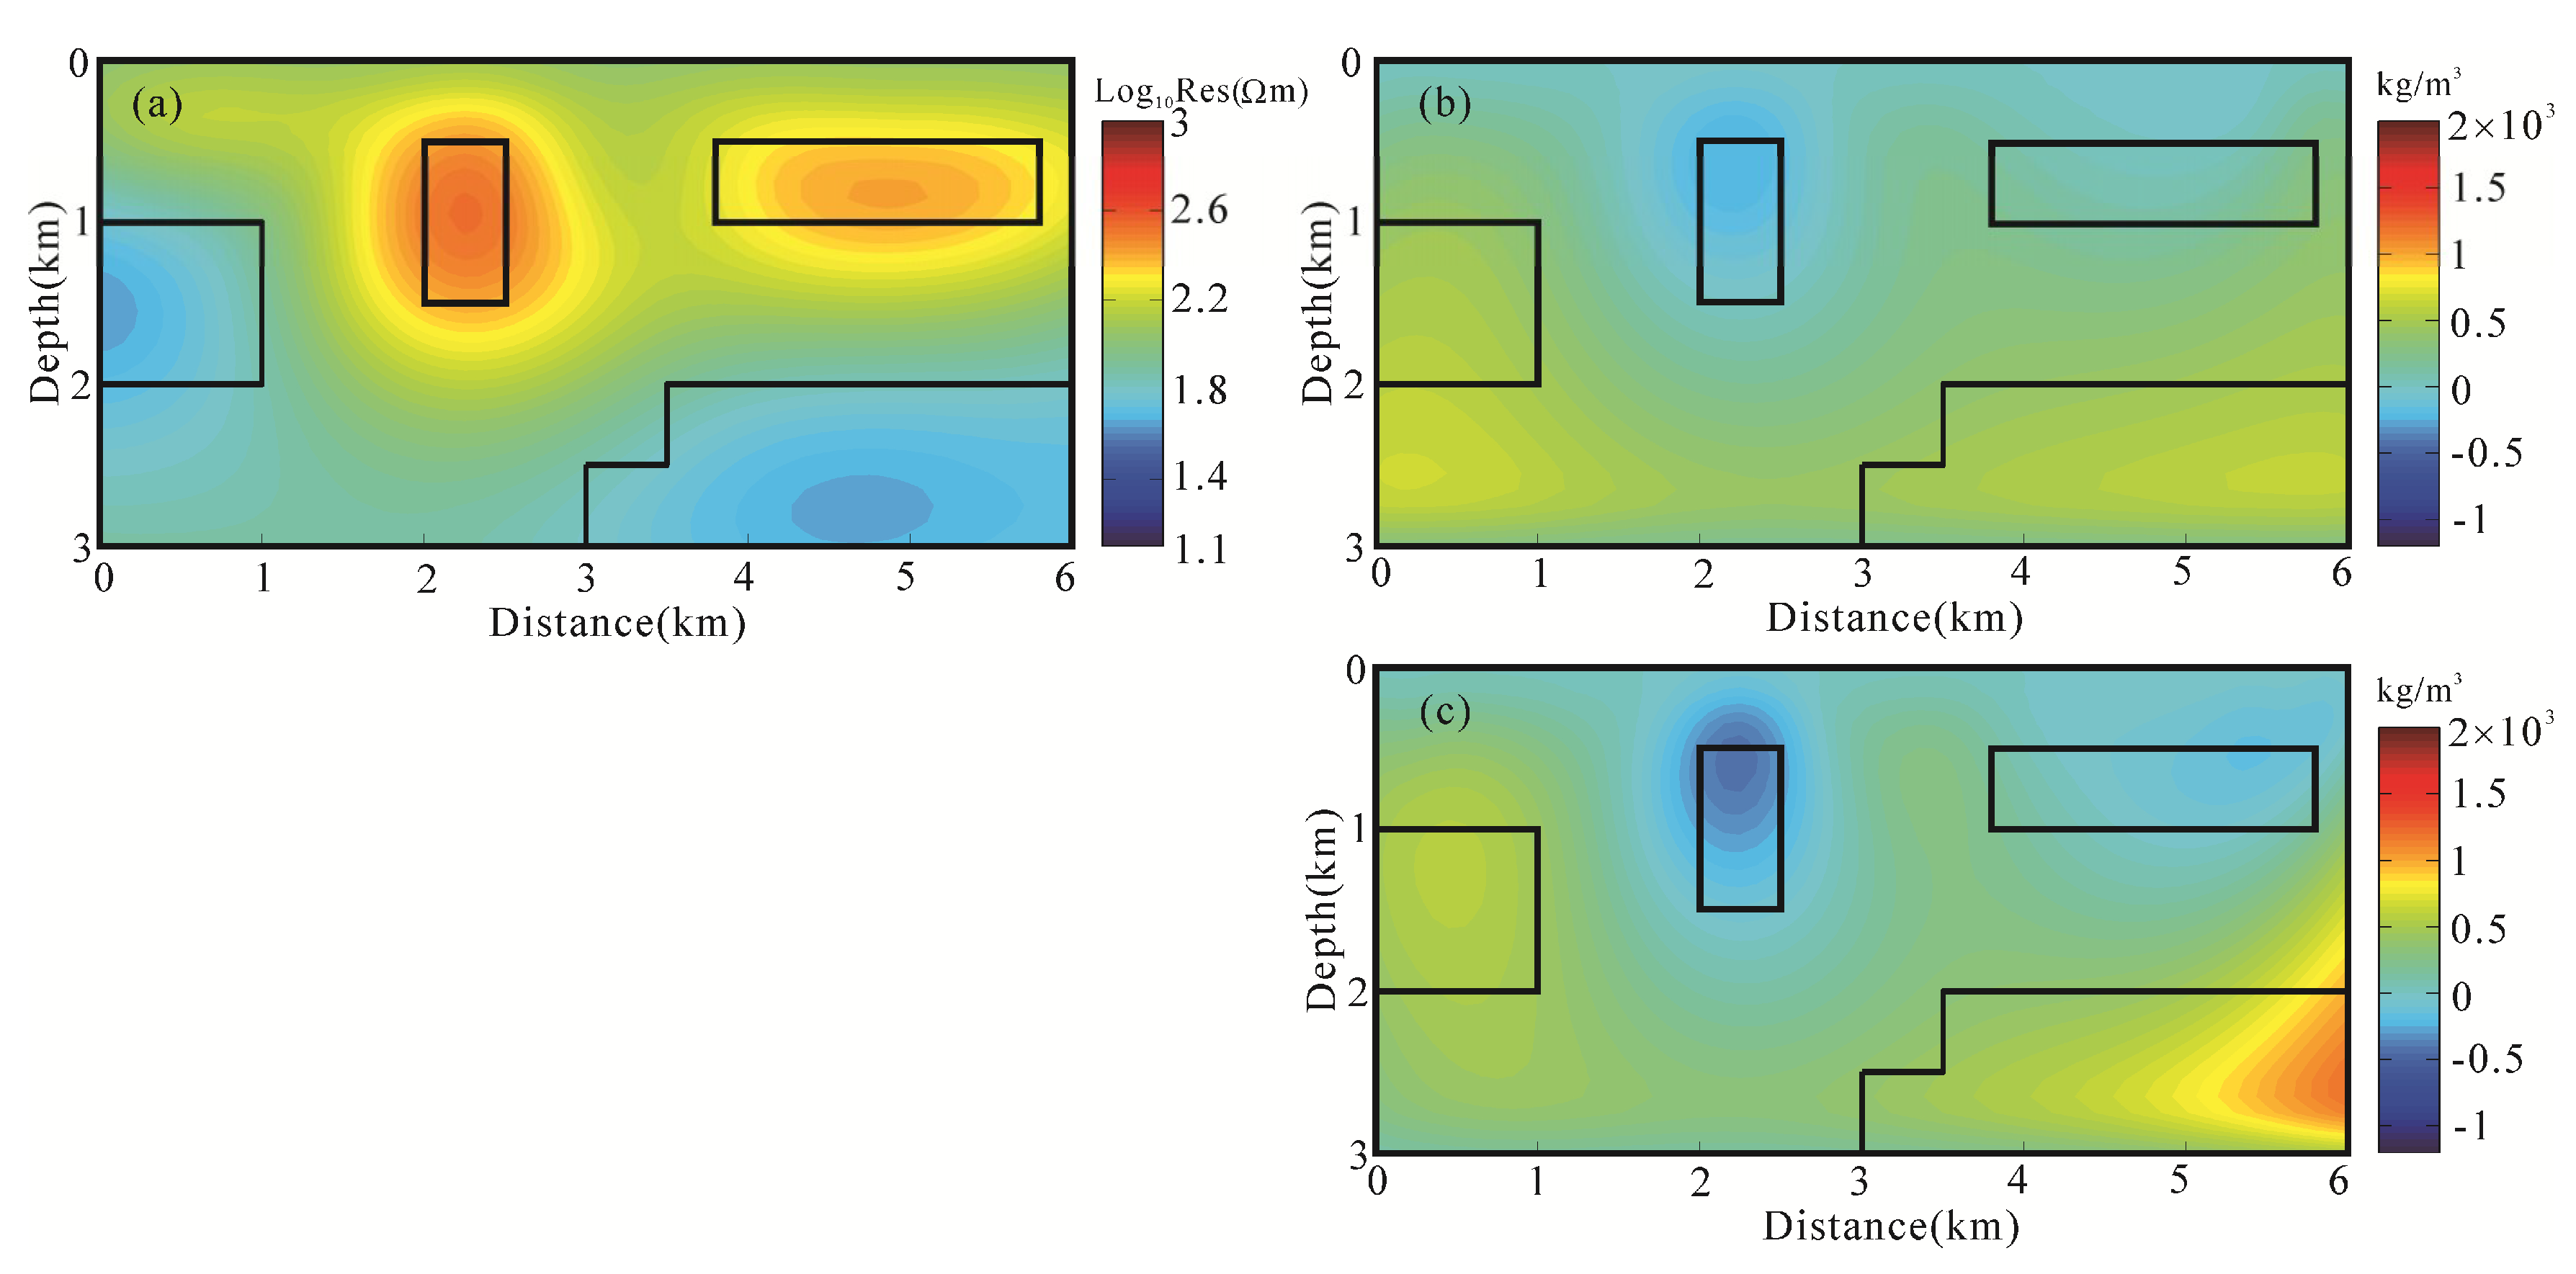
Figure 5.
The iterative curve of the root mean square (RMS) misfit of the separate inversion (a), joint inversion of gravity and MT data (b), and joint inversion of gravity gradiometry and MT data (c).
Figure 5.
The iterative curve of the root mean square (RMS) misfit of the separate inversion (a), joint inversion of gravity and MT data (b), and joint inversion of gravity gradiometry and MT data (c).
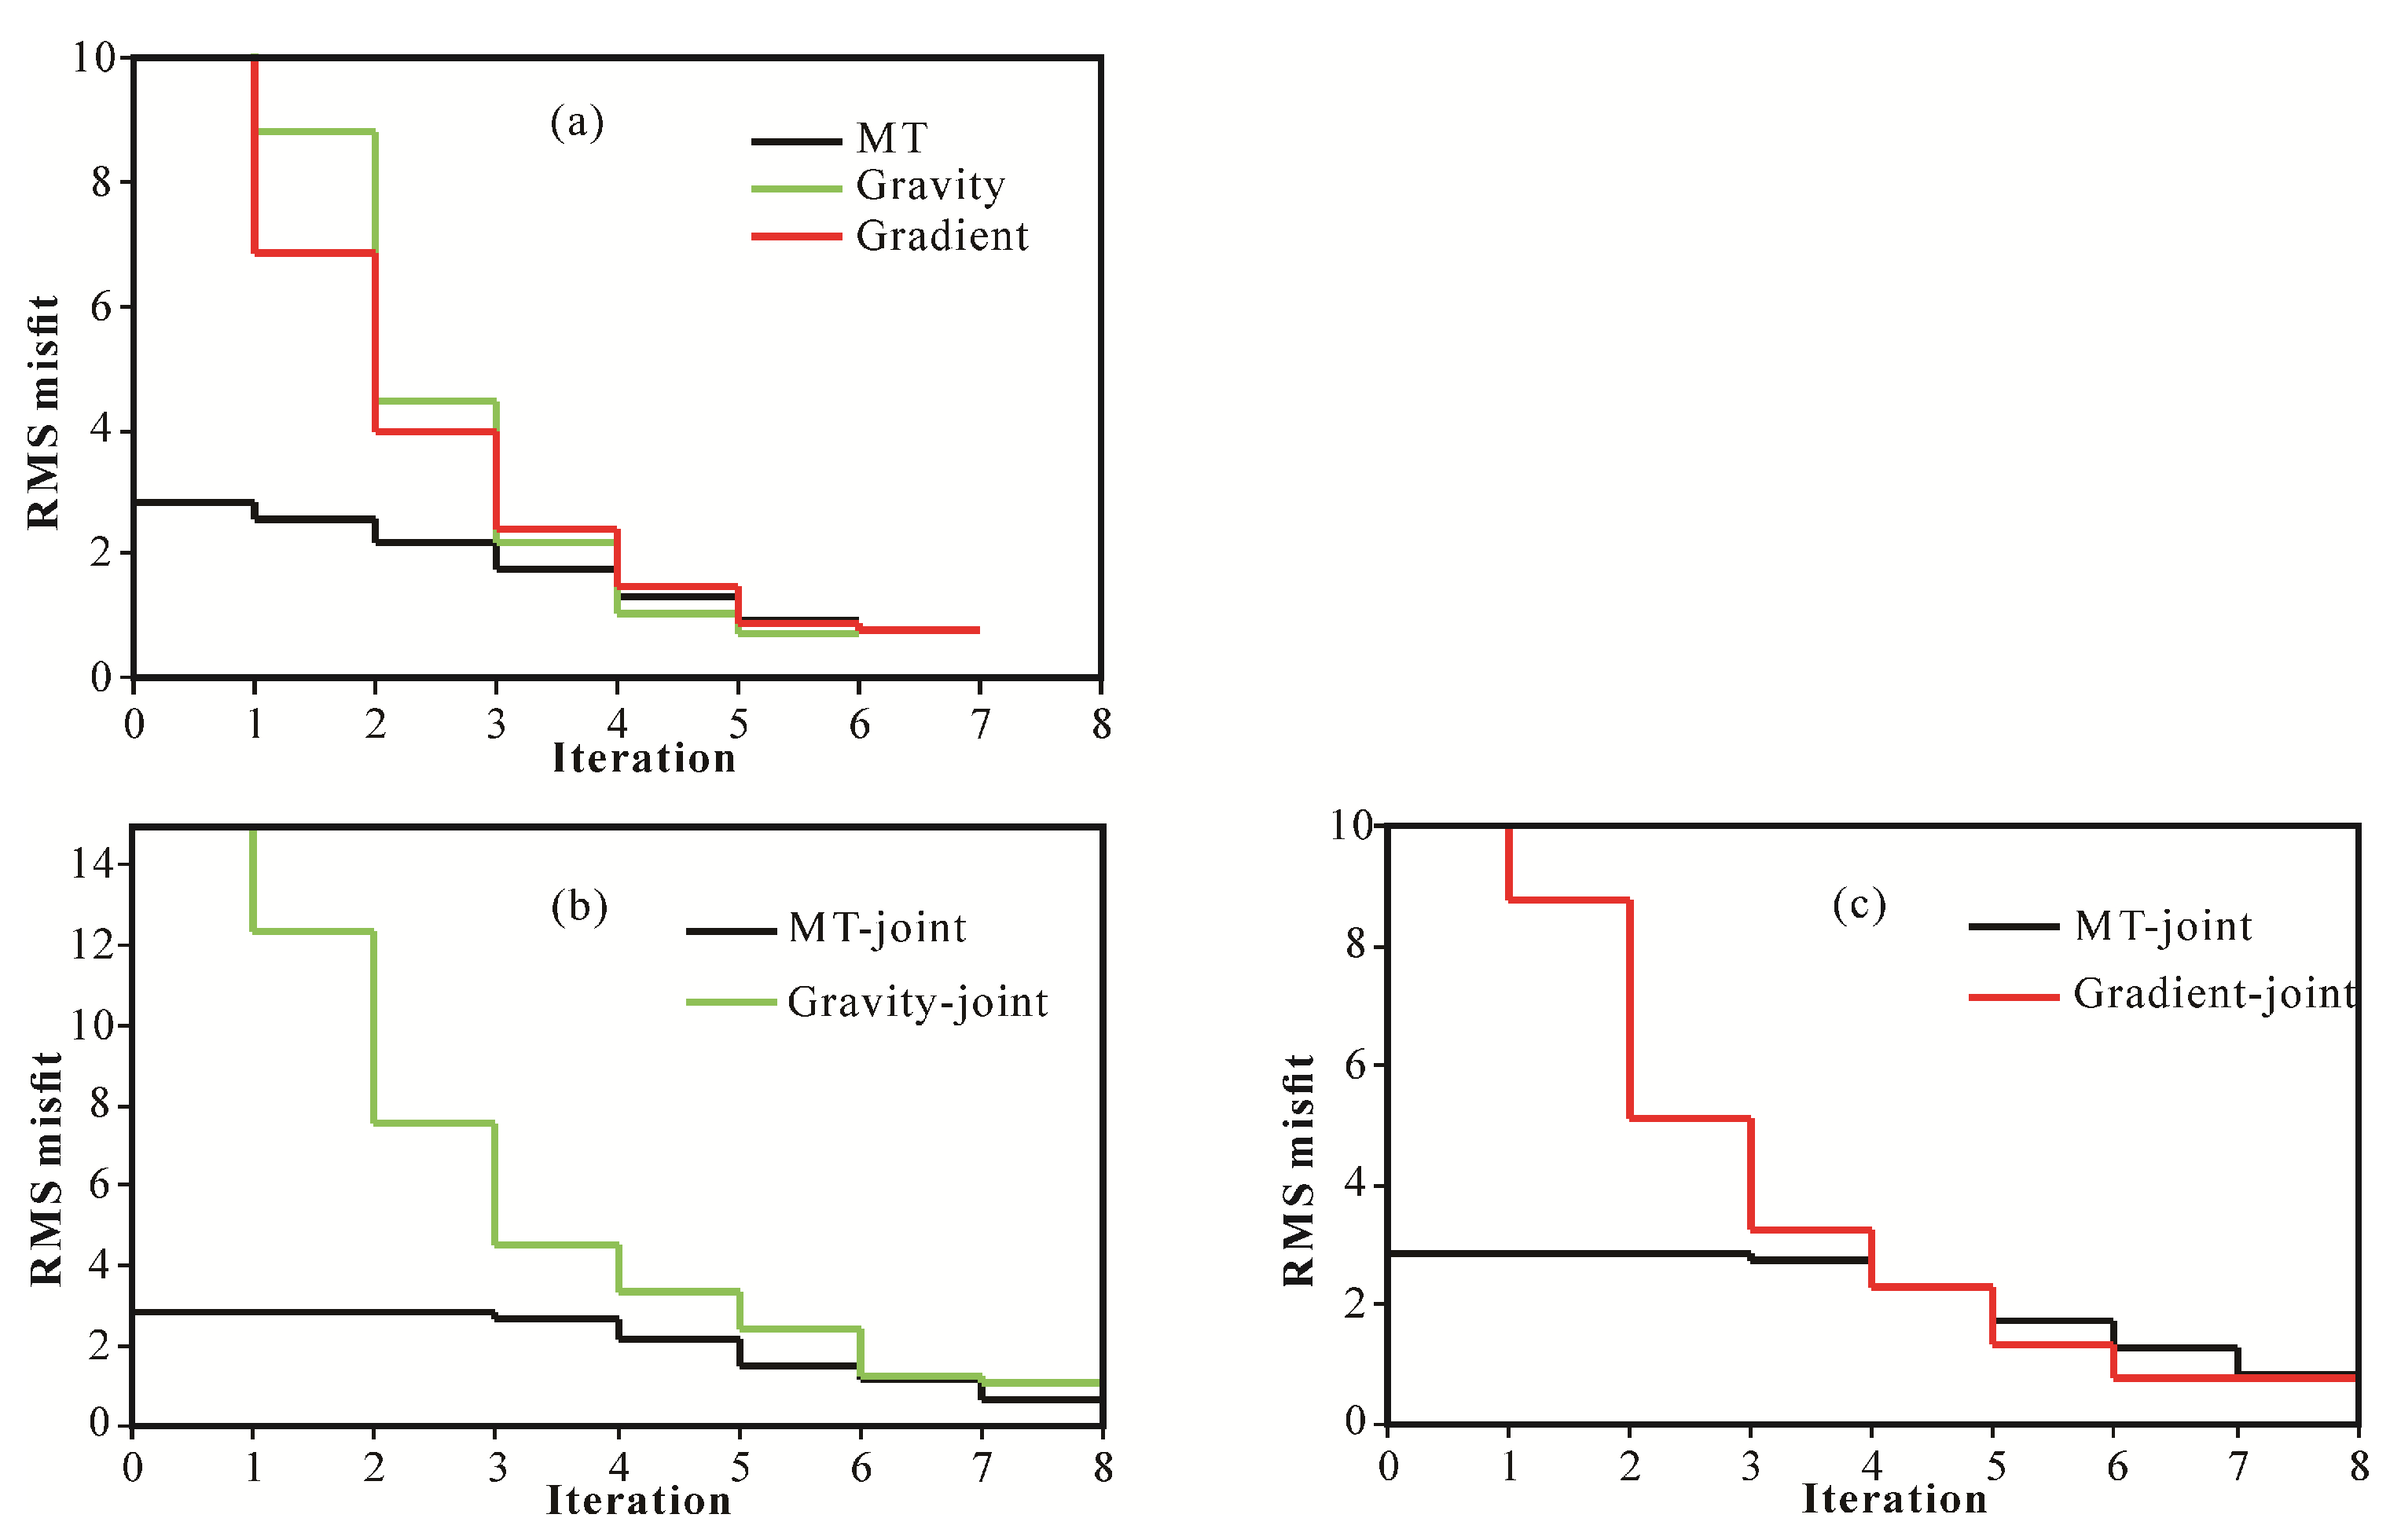
Figure 6.
The data-space joint inversion results of model 1. Joint inversion results of MT and gravity (a,b), MT and gravity gradiometry (c,d), resistivity model (a,c), density model (b,d).
Figure 6.
The data-space joint inversion results of model 1. Joint inversion results of MT and gravity (a,b), MT and gravity gradiometry (c,d), resistivity model (a,c), density model (b,d).
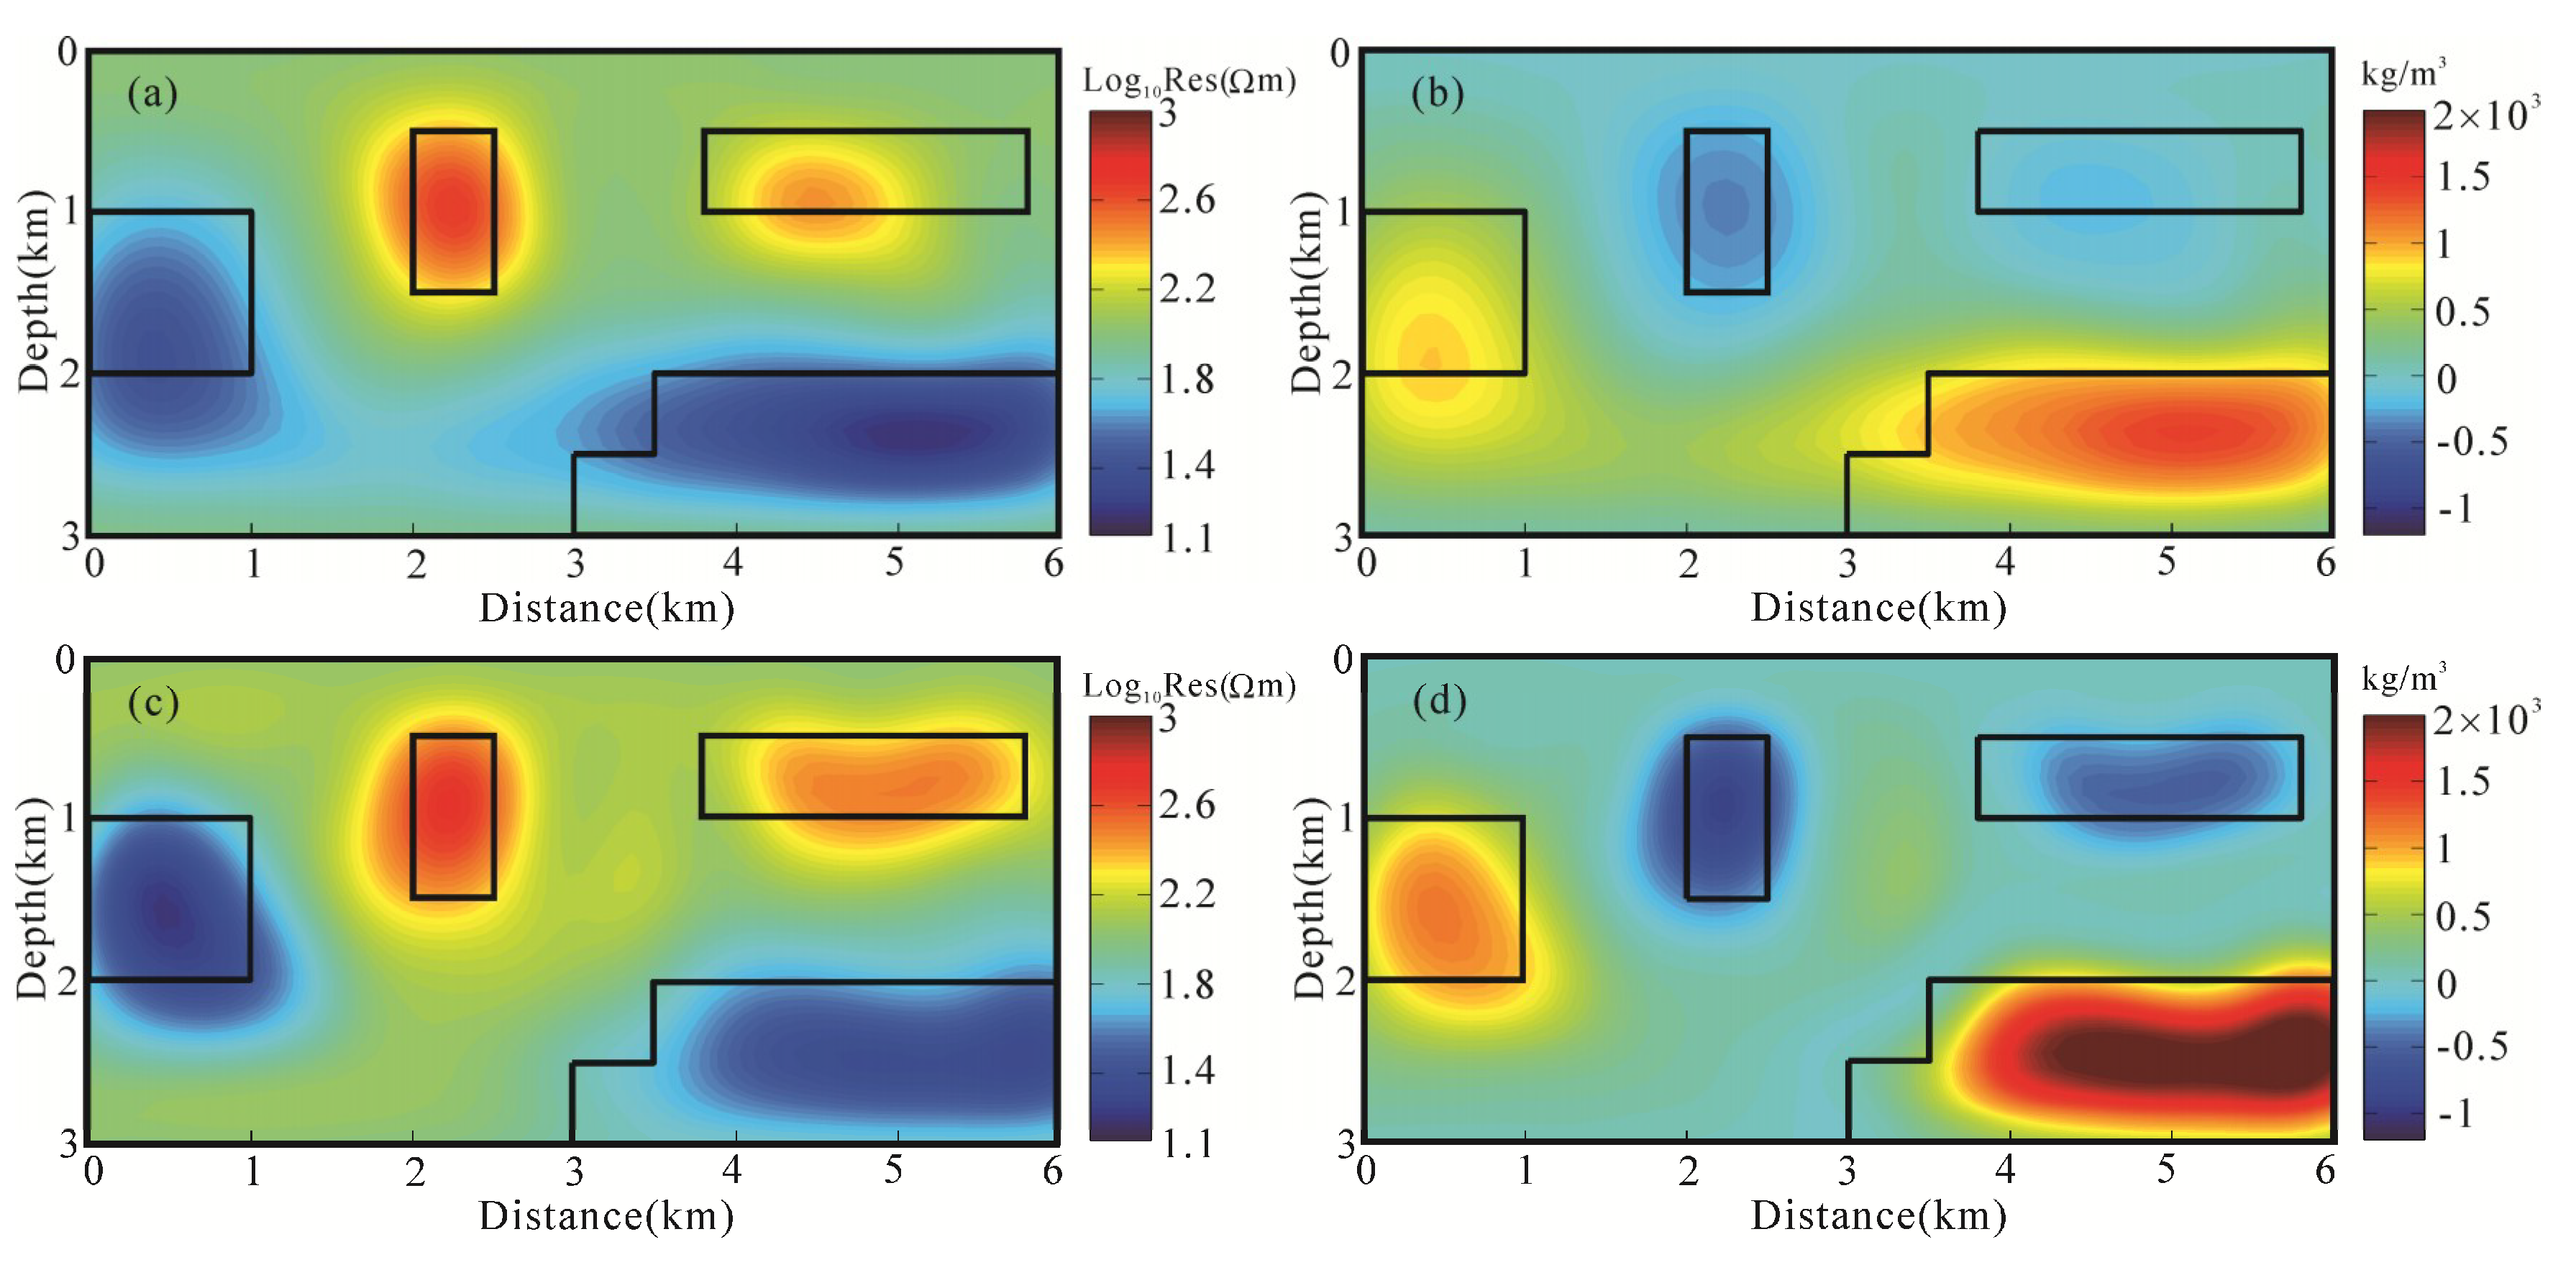
Figure 7.
Cross-gradient values attained for every pair of models for the data-space separate inversion of gravity and MT data (a), gravity gradient and MT data (b), and for the data-space joint inversion of gravity and MT data (c), gravity gradiometry and MT data (d).
Figure 7.
Cross-gradient values attained for every pair of models for the data-space separate inversion of gravity and MT data (a), gravity gradient and MT data (b), and for the data-space joint inversion of gravity and MT data (c), gravity gradiometry and MT data (d).
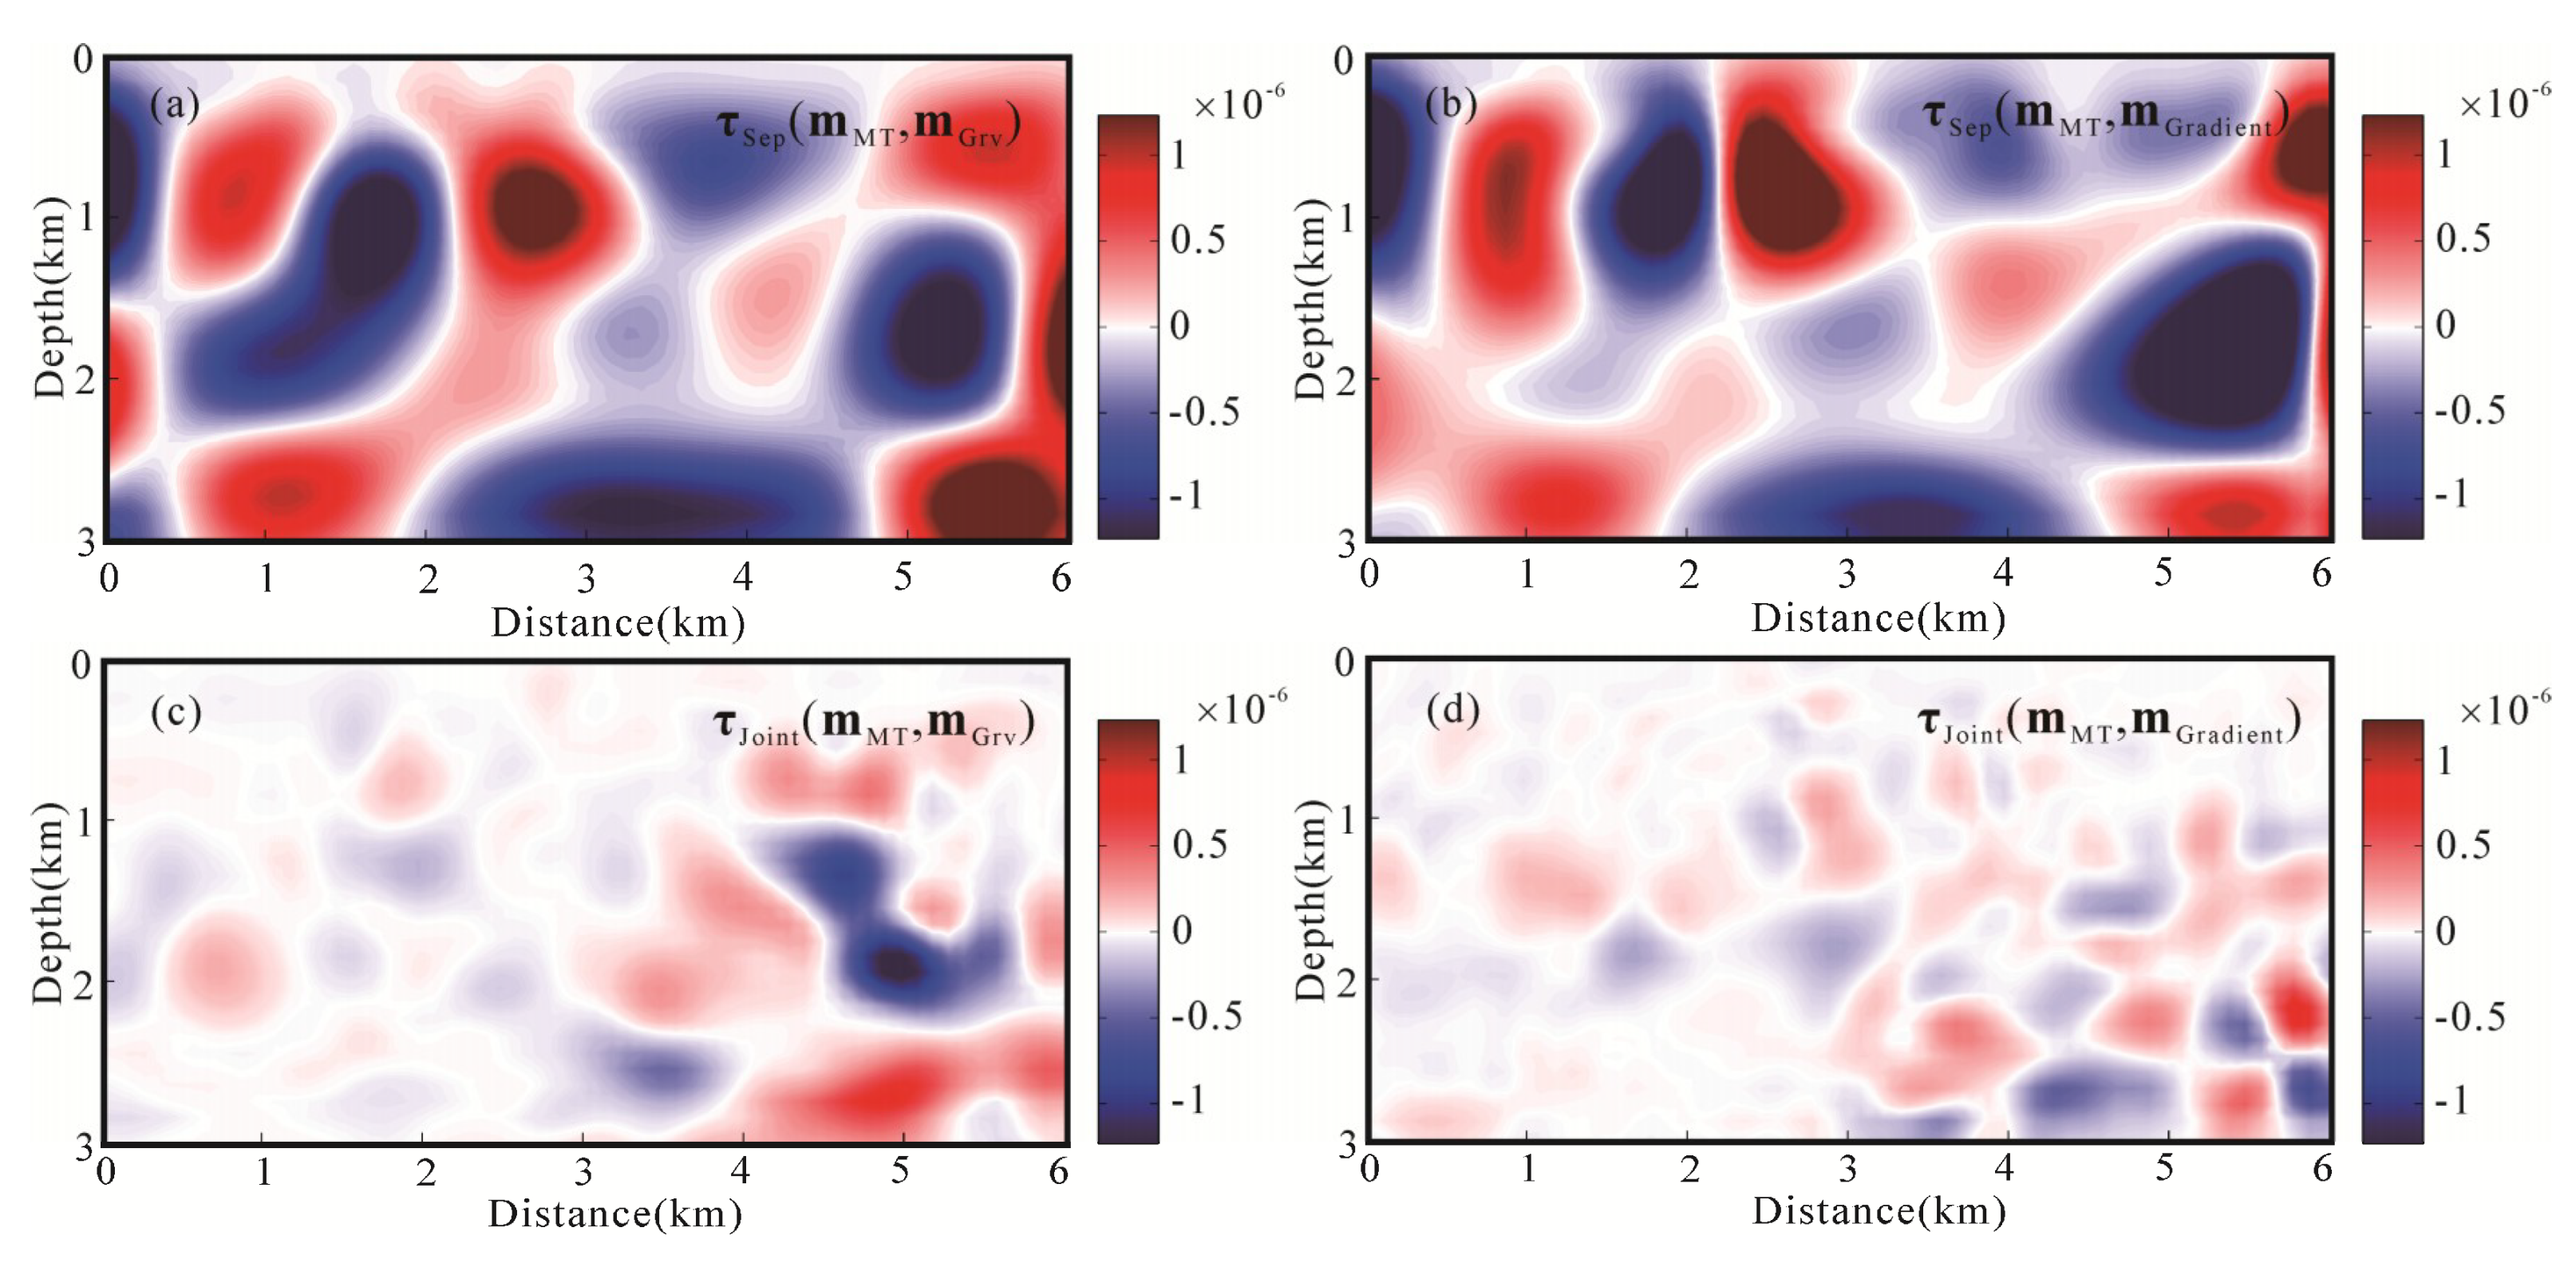
Figure 8.
The partially structurally consistent model. Resistivity model (a), density model (b).
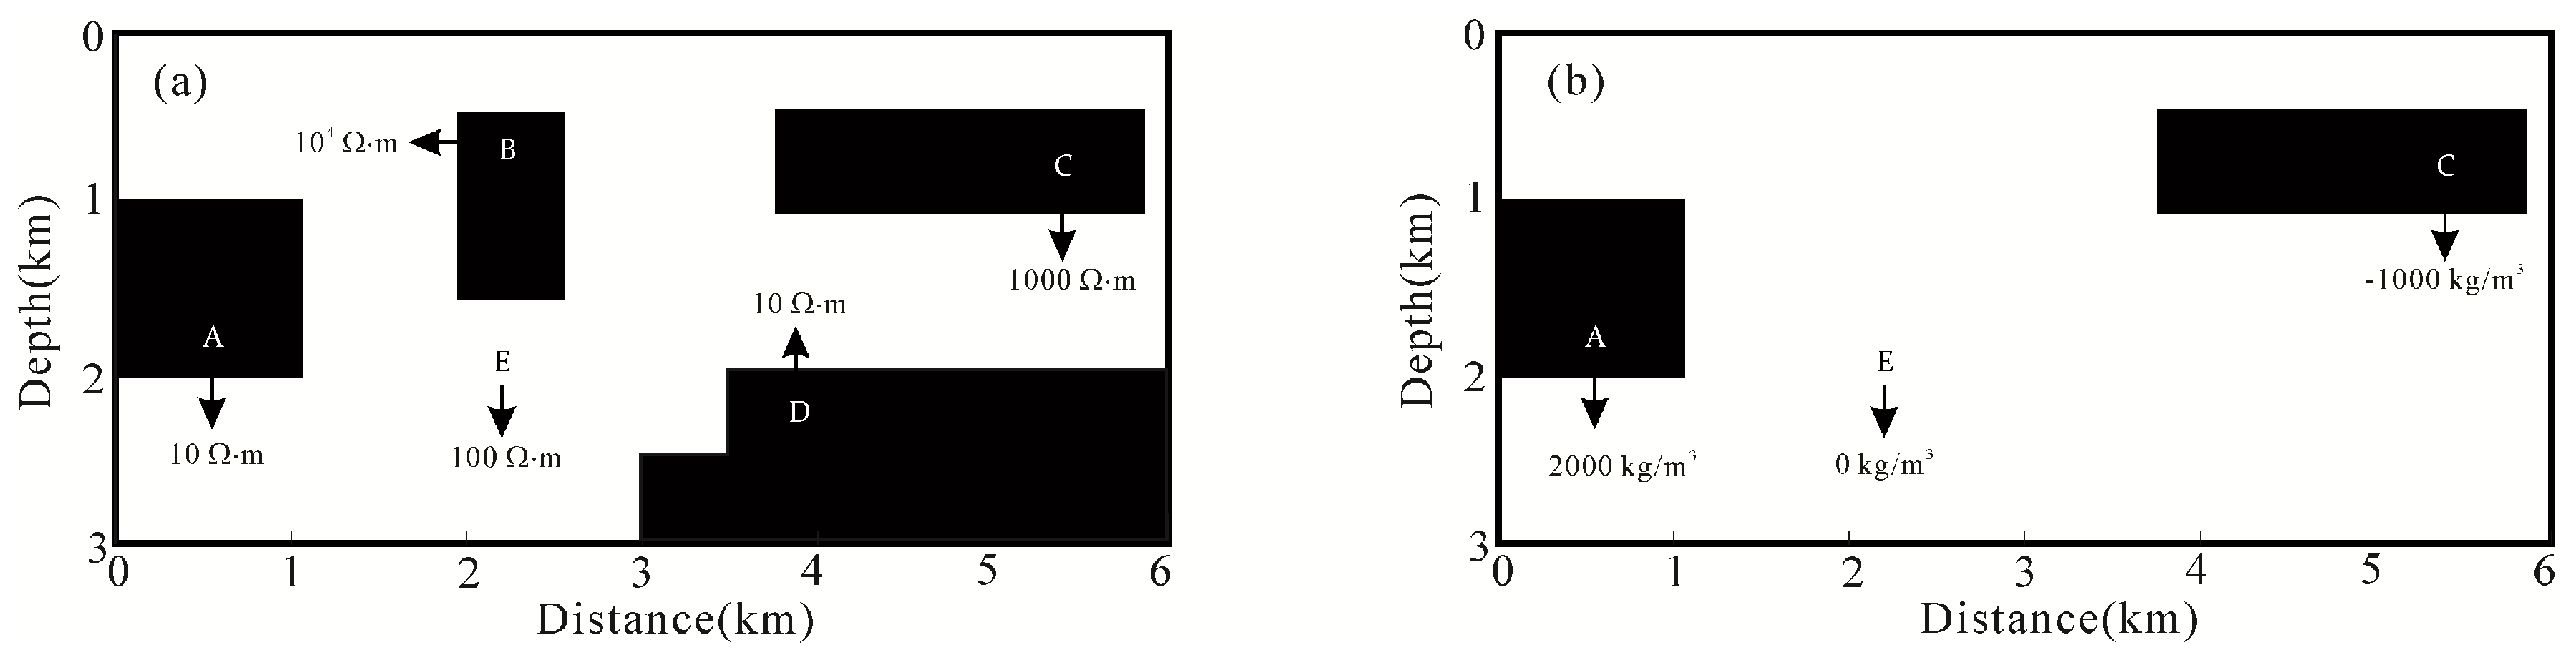
Figure 9.
Joint inversion results of partially structurally consistent model. Resistivity model (a), density model (b).
Figure 9.
Joint inversion results of partially structurally consistent model. Resistivity model (a), density model (b).

Figure 10.
The structurally inconsistent model. Resistivity model (a), density model (b).
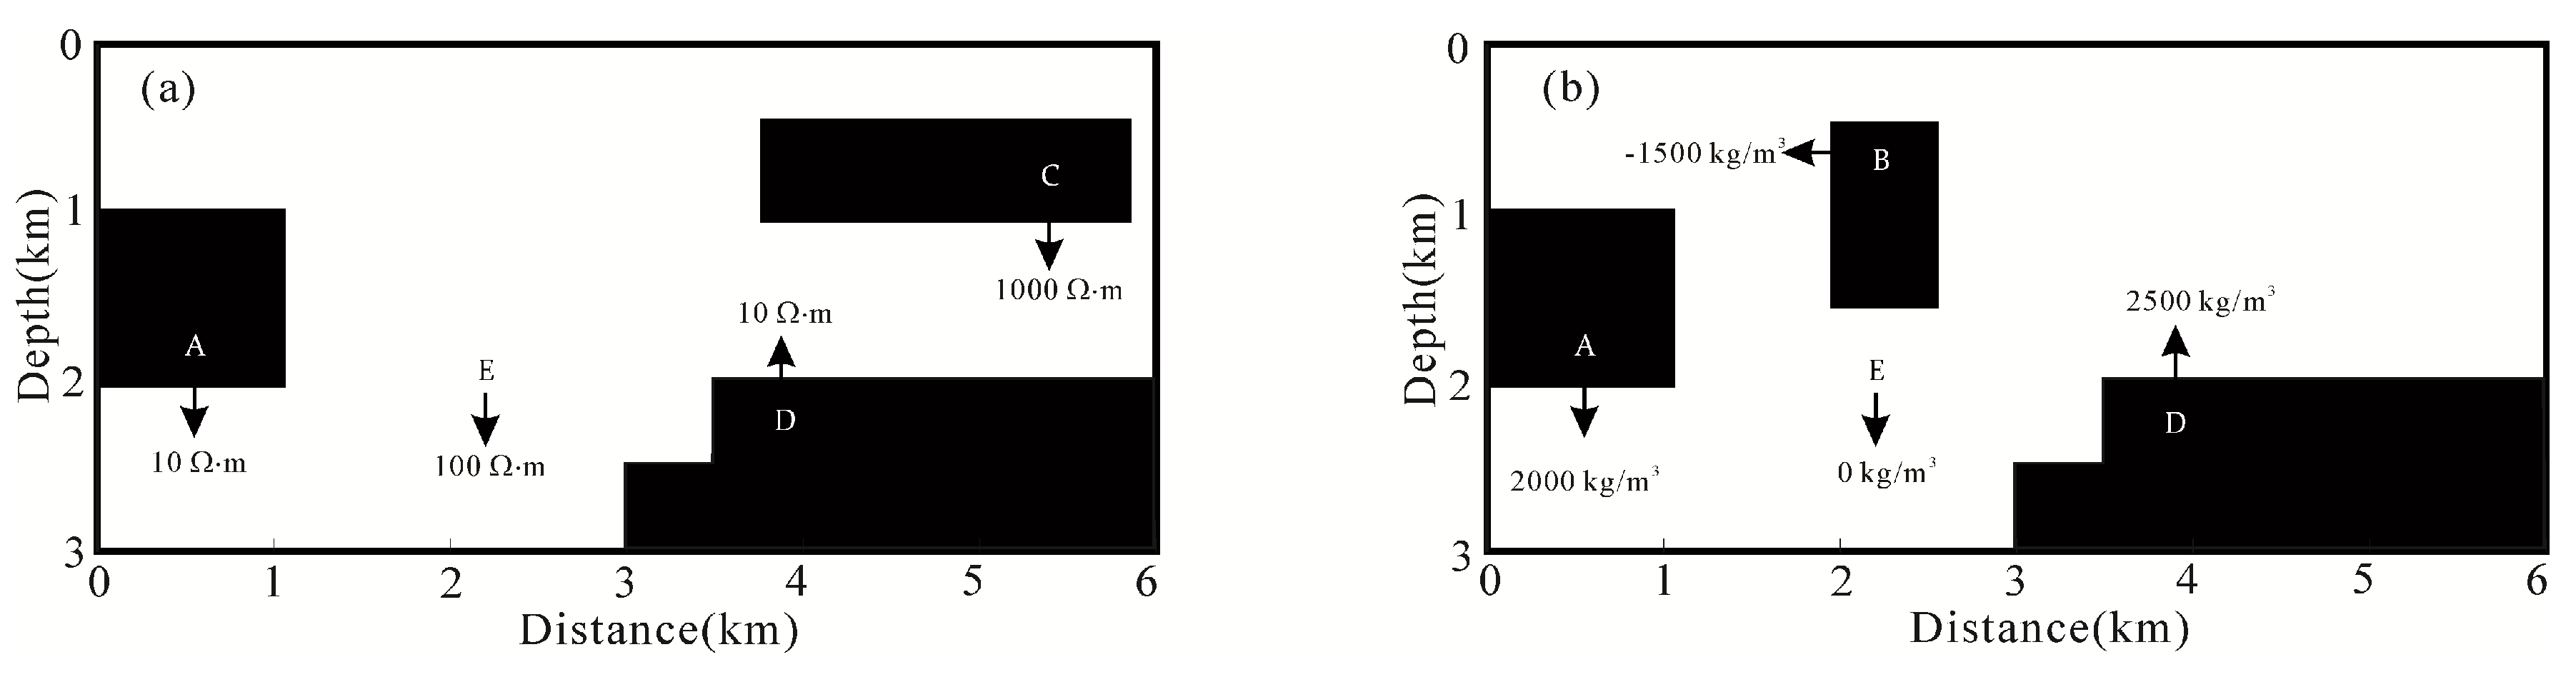
Figure 11.
Joint inversion results of structurally inconsistent model. Resistivity model (a), density model (b).
Figure 11.
Joint inversion results of structurally inconsistent model. Resistivity model (a), density model (b).
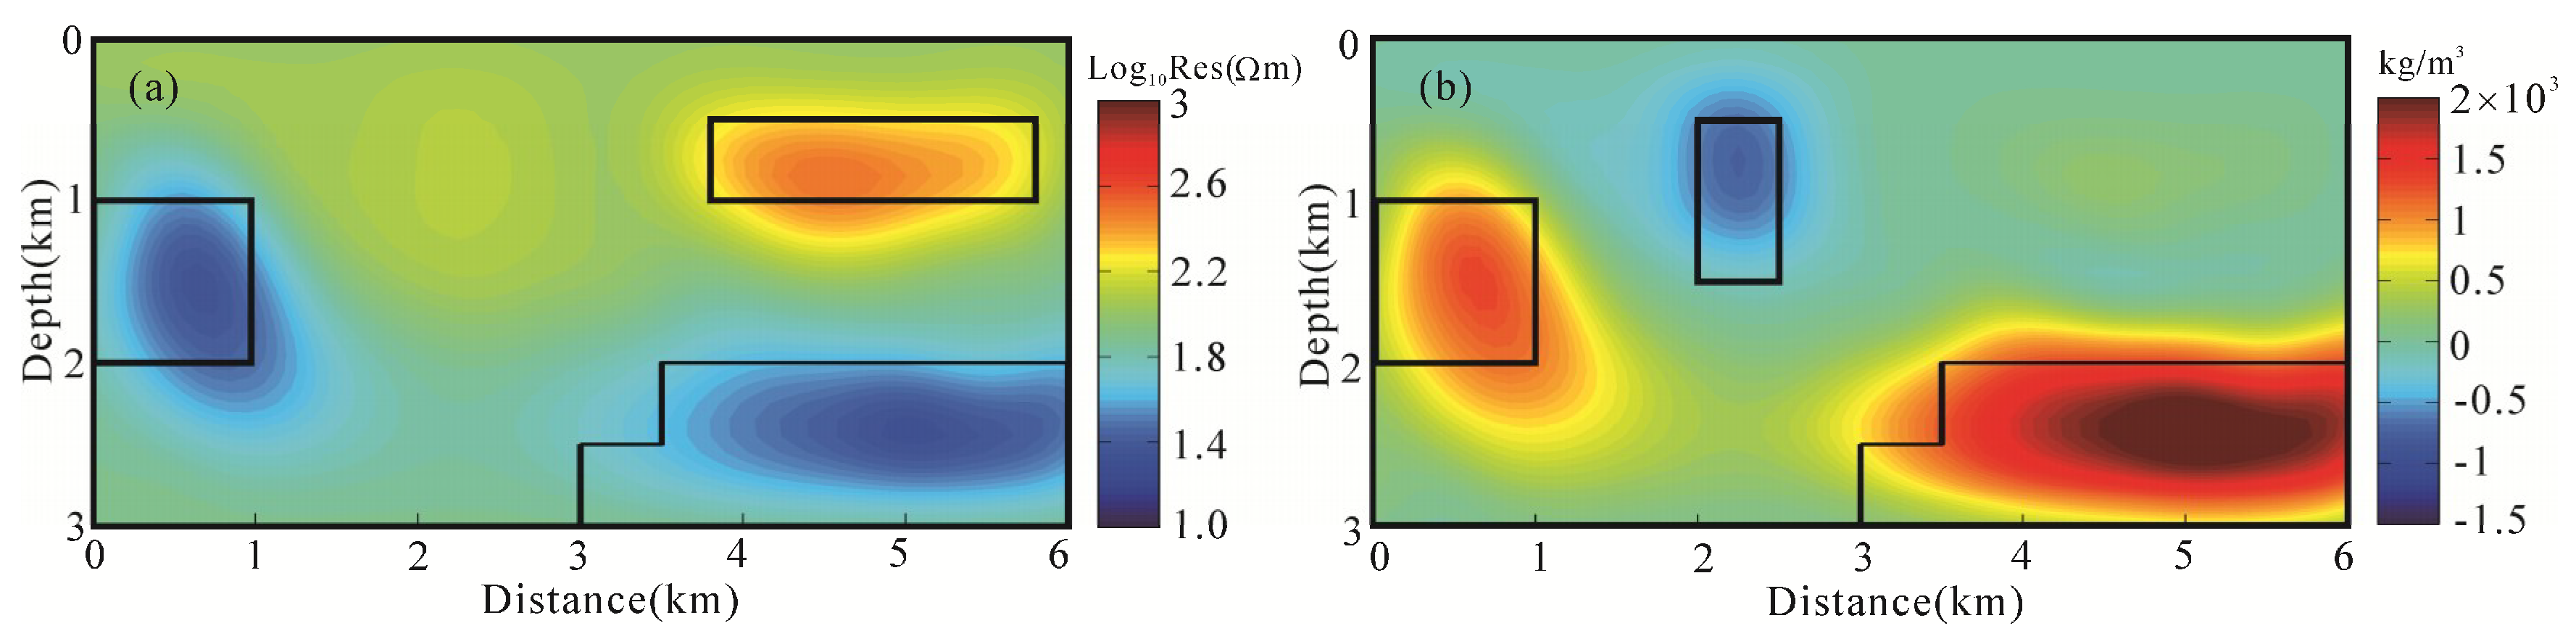
Figure 12.
Theoretical model 3.
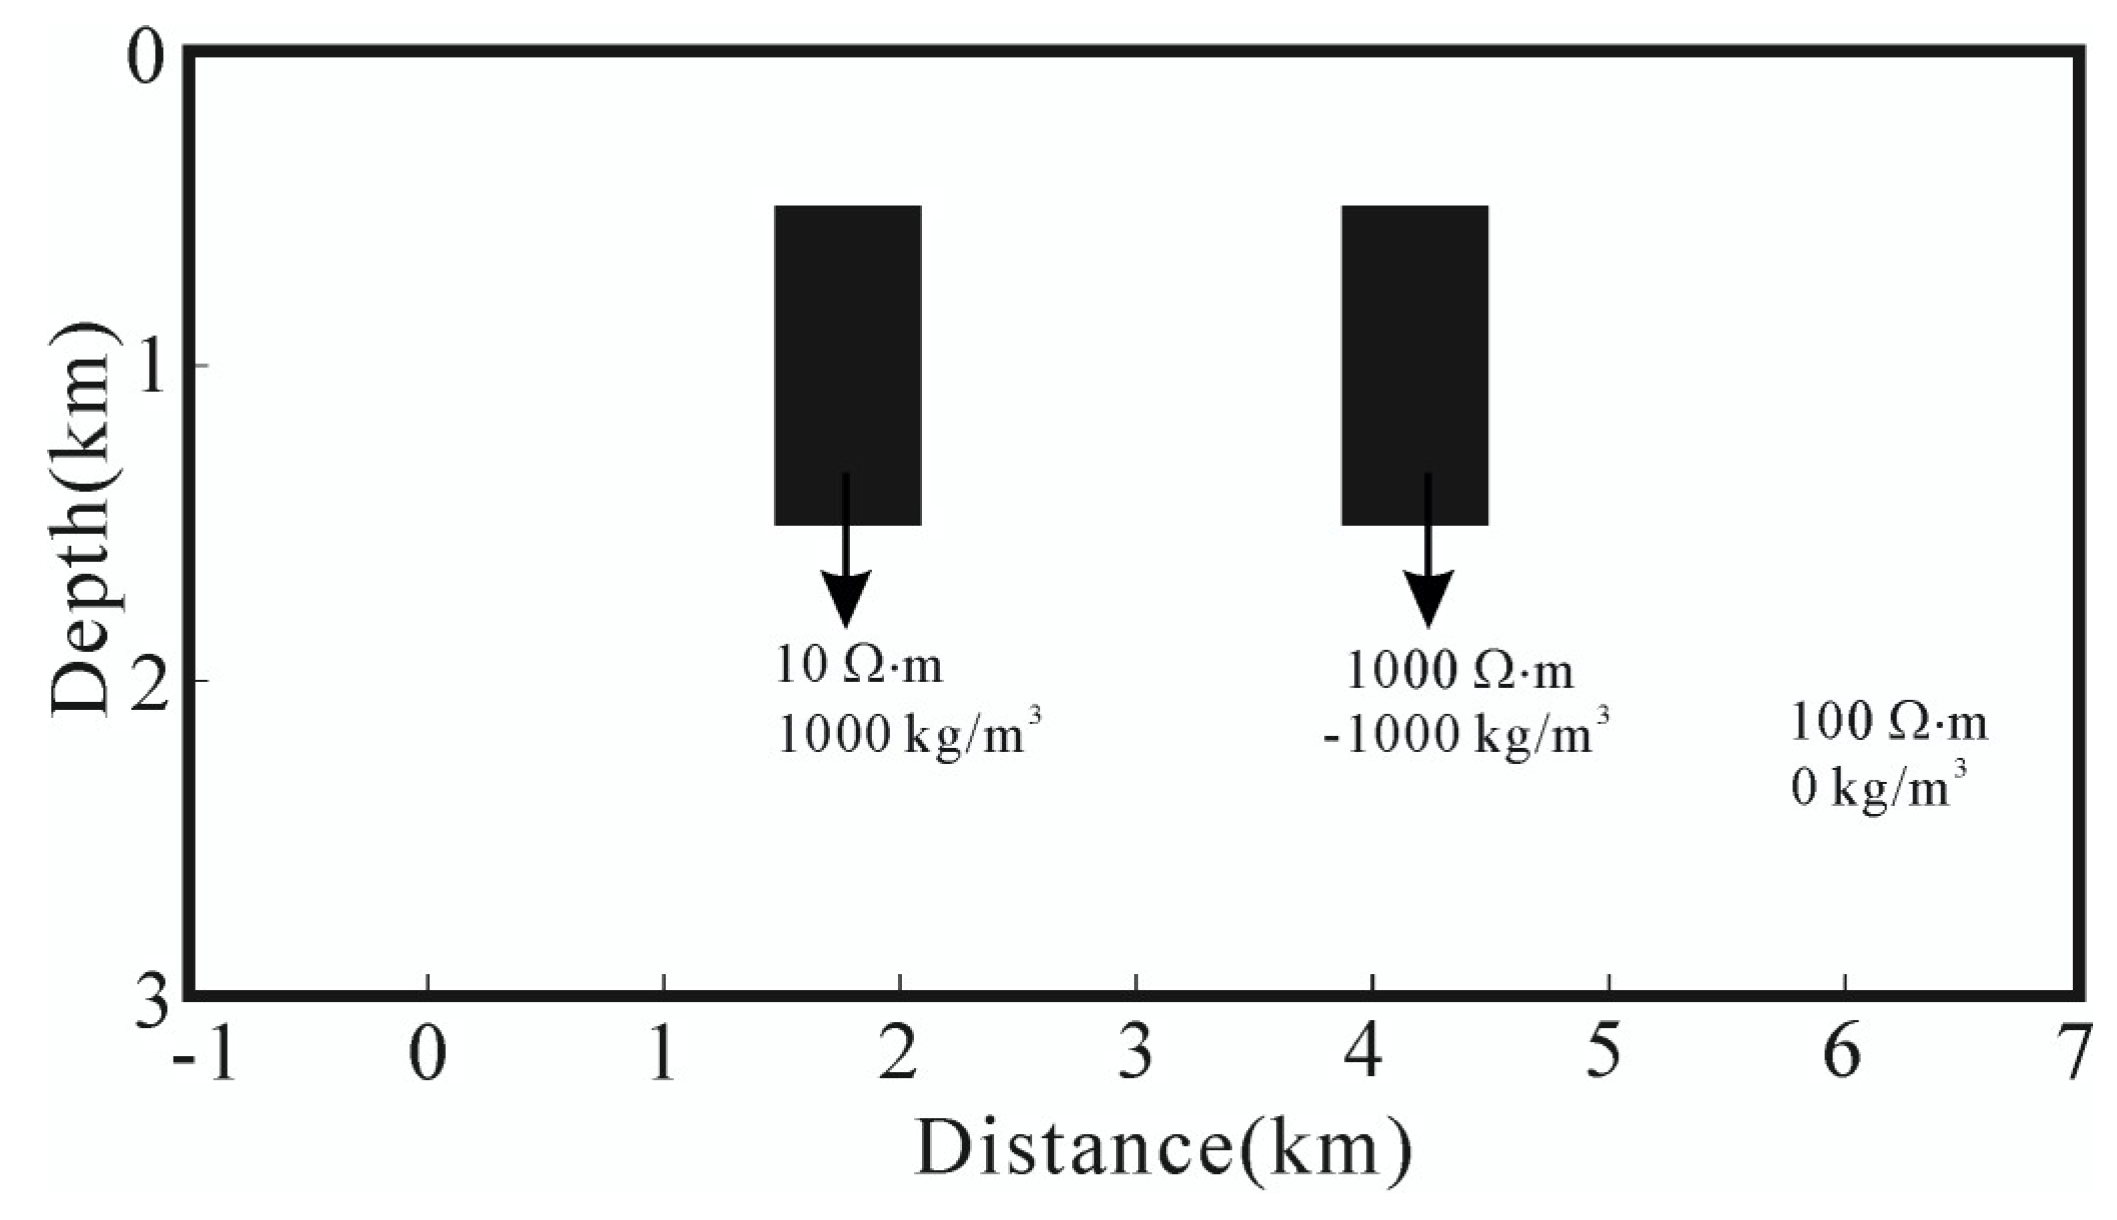
Figure 13.
The data-space and model-space joint inversion results of MT and gravity gradiometry data. the model-space joint inversion results (a,b), the data-space joint inversion results (c,d), resistivity model (a,c), density model (b,d).
Figure 13.
The data-space and model-space joint inversion results of MT and gravity gradiometry data. the model-space joint inversion results (a,b), the data-space joint inversion results (c,d), resistivity model (a,c), density model (b,d).
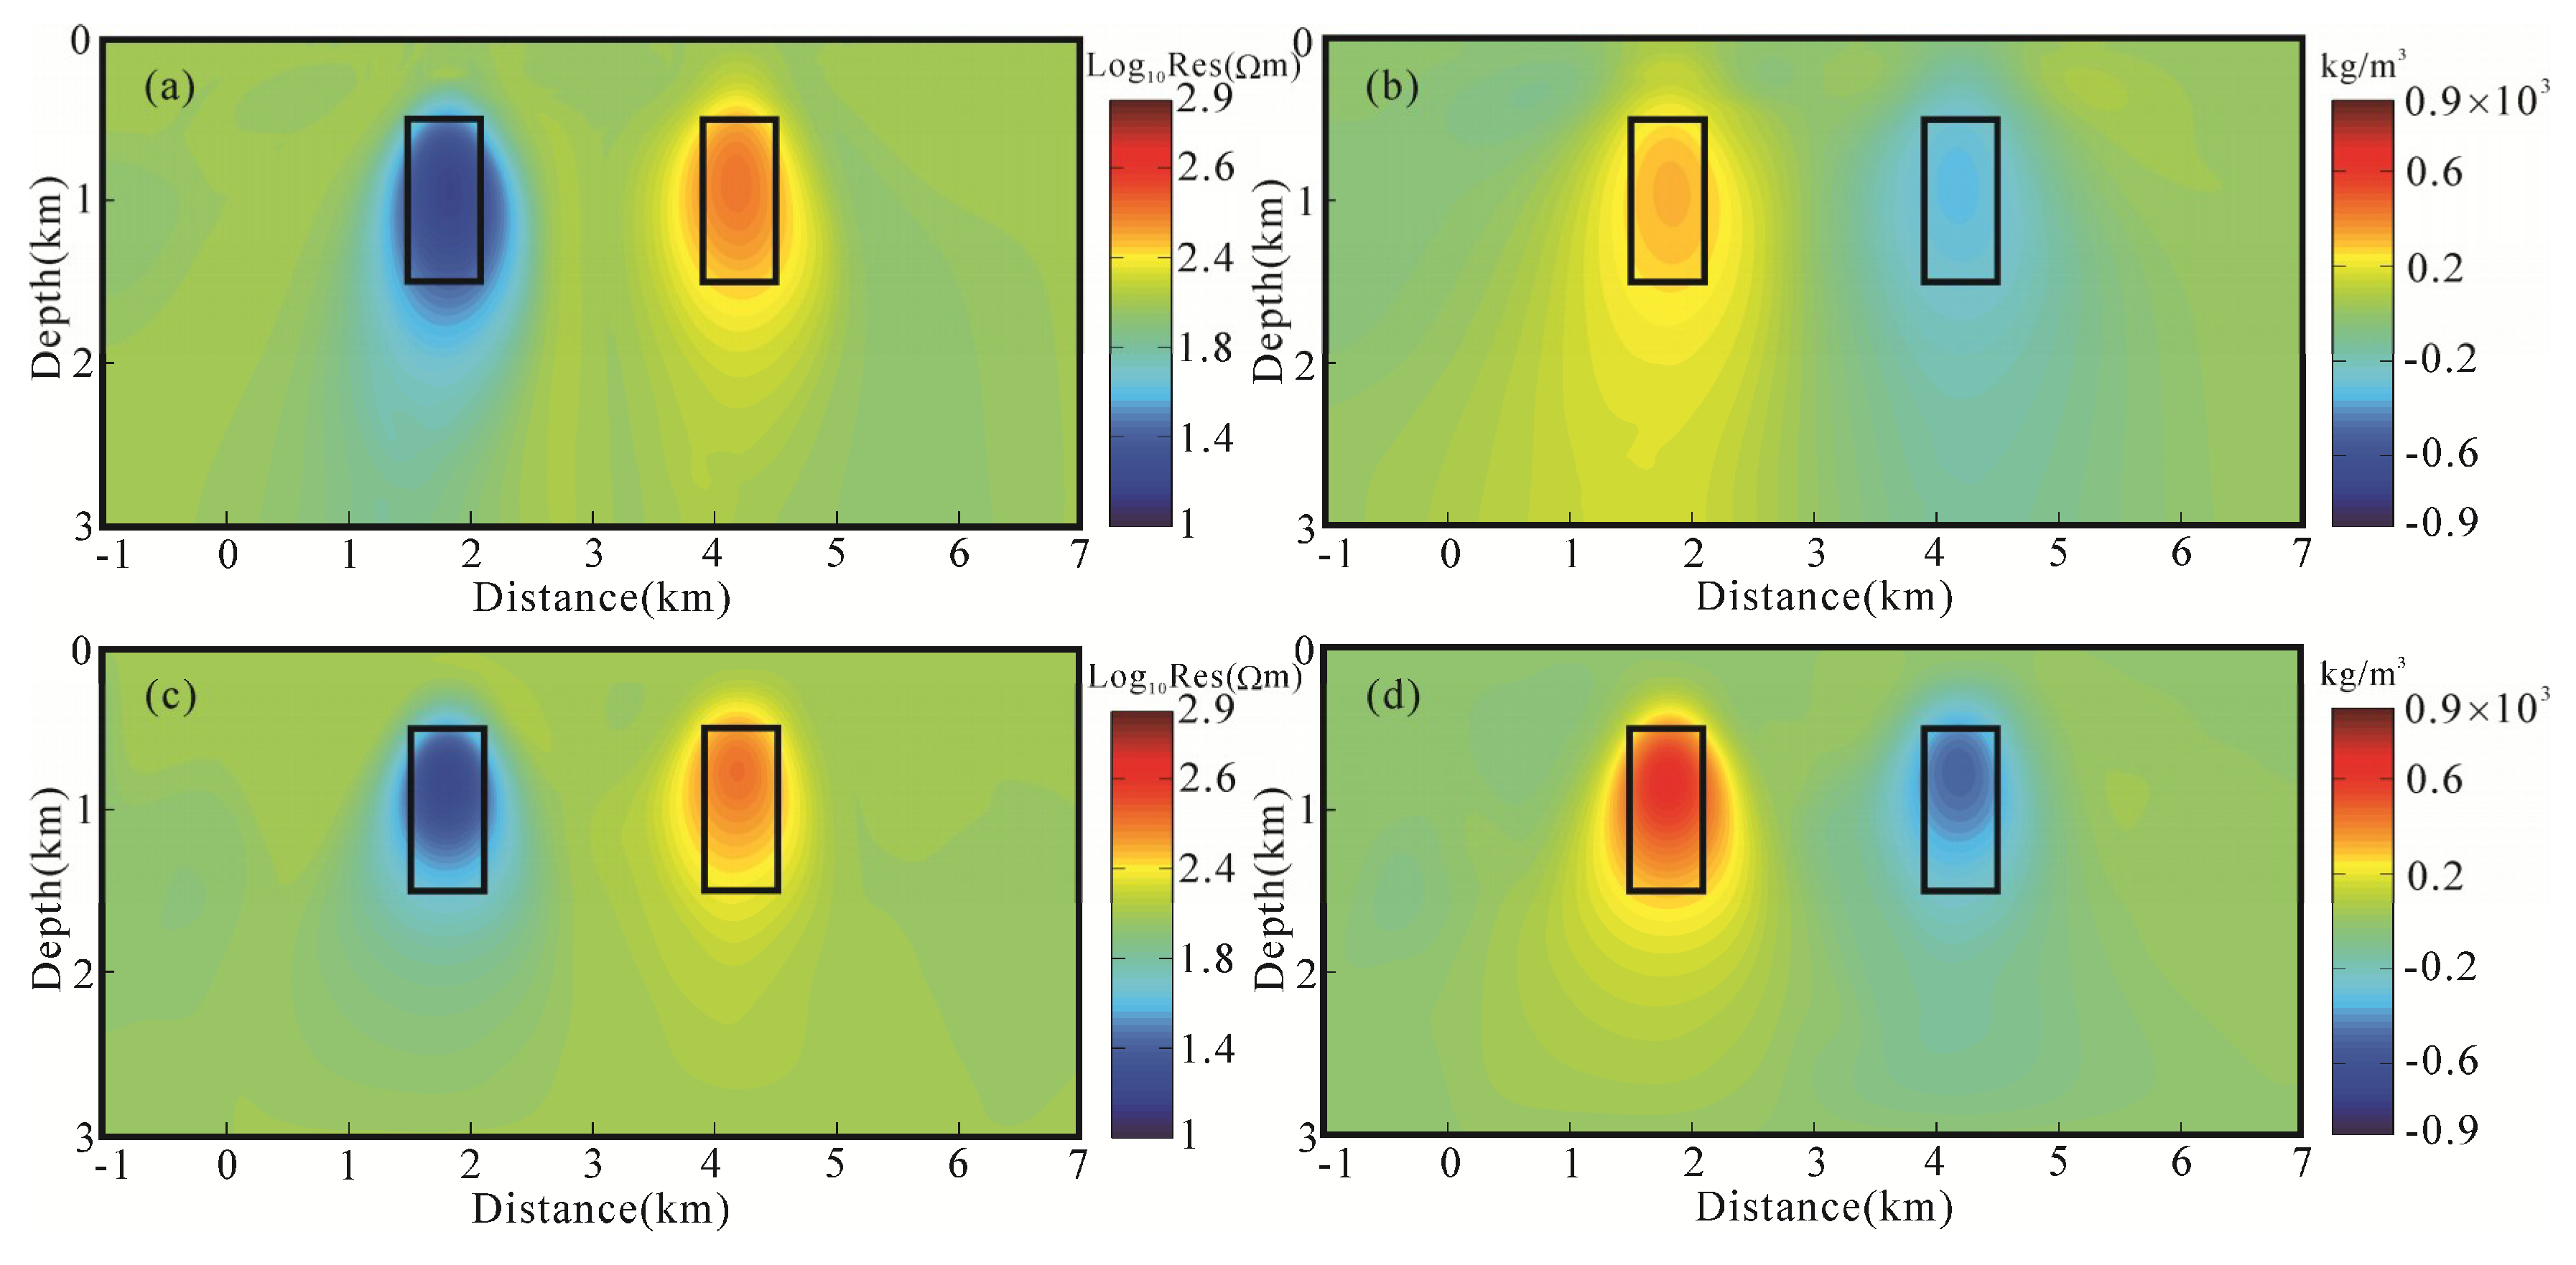
Figure 14.
Location of the study area.
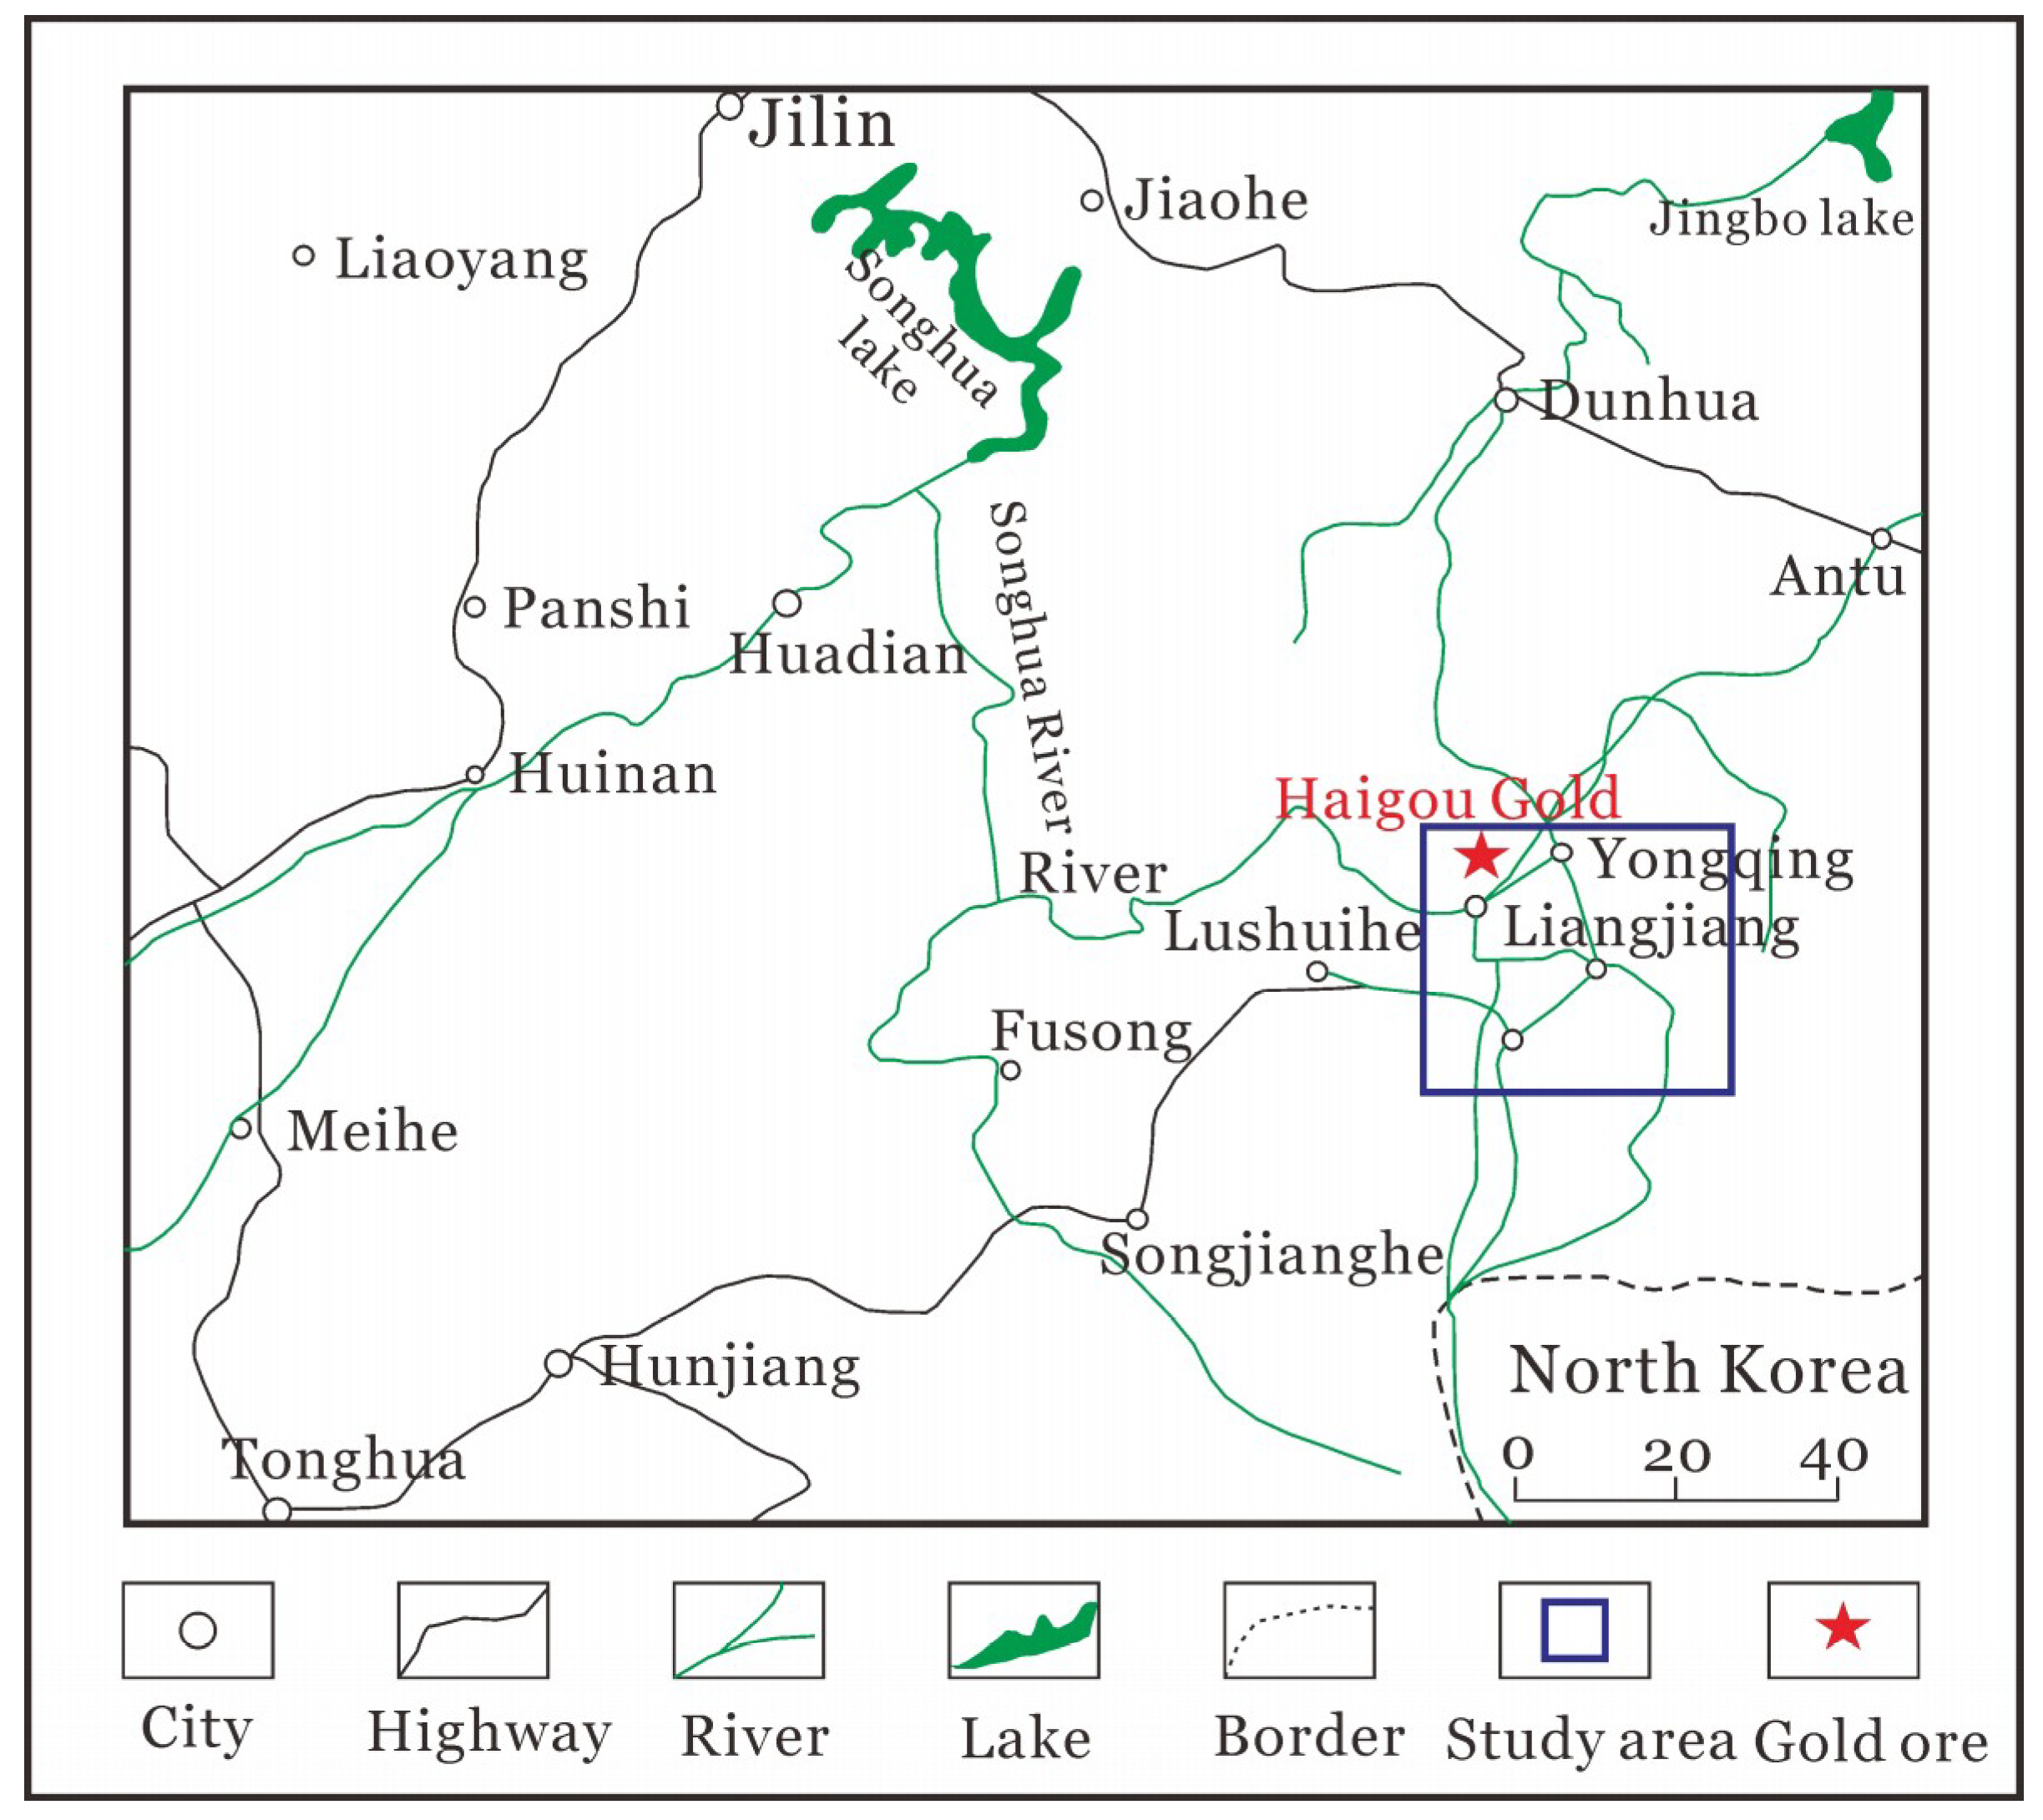
Figure 15.
The geological map of the study area.
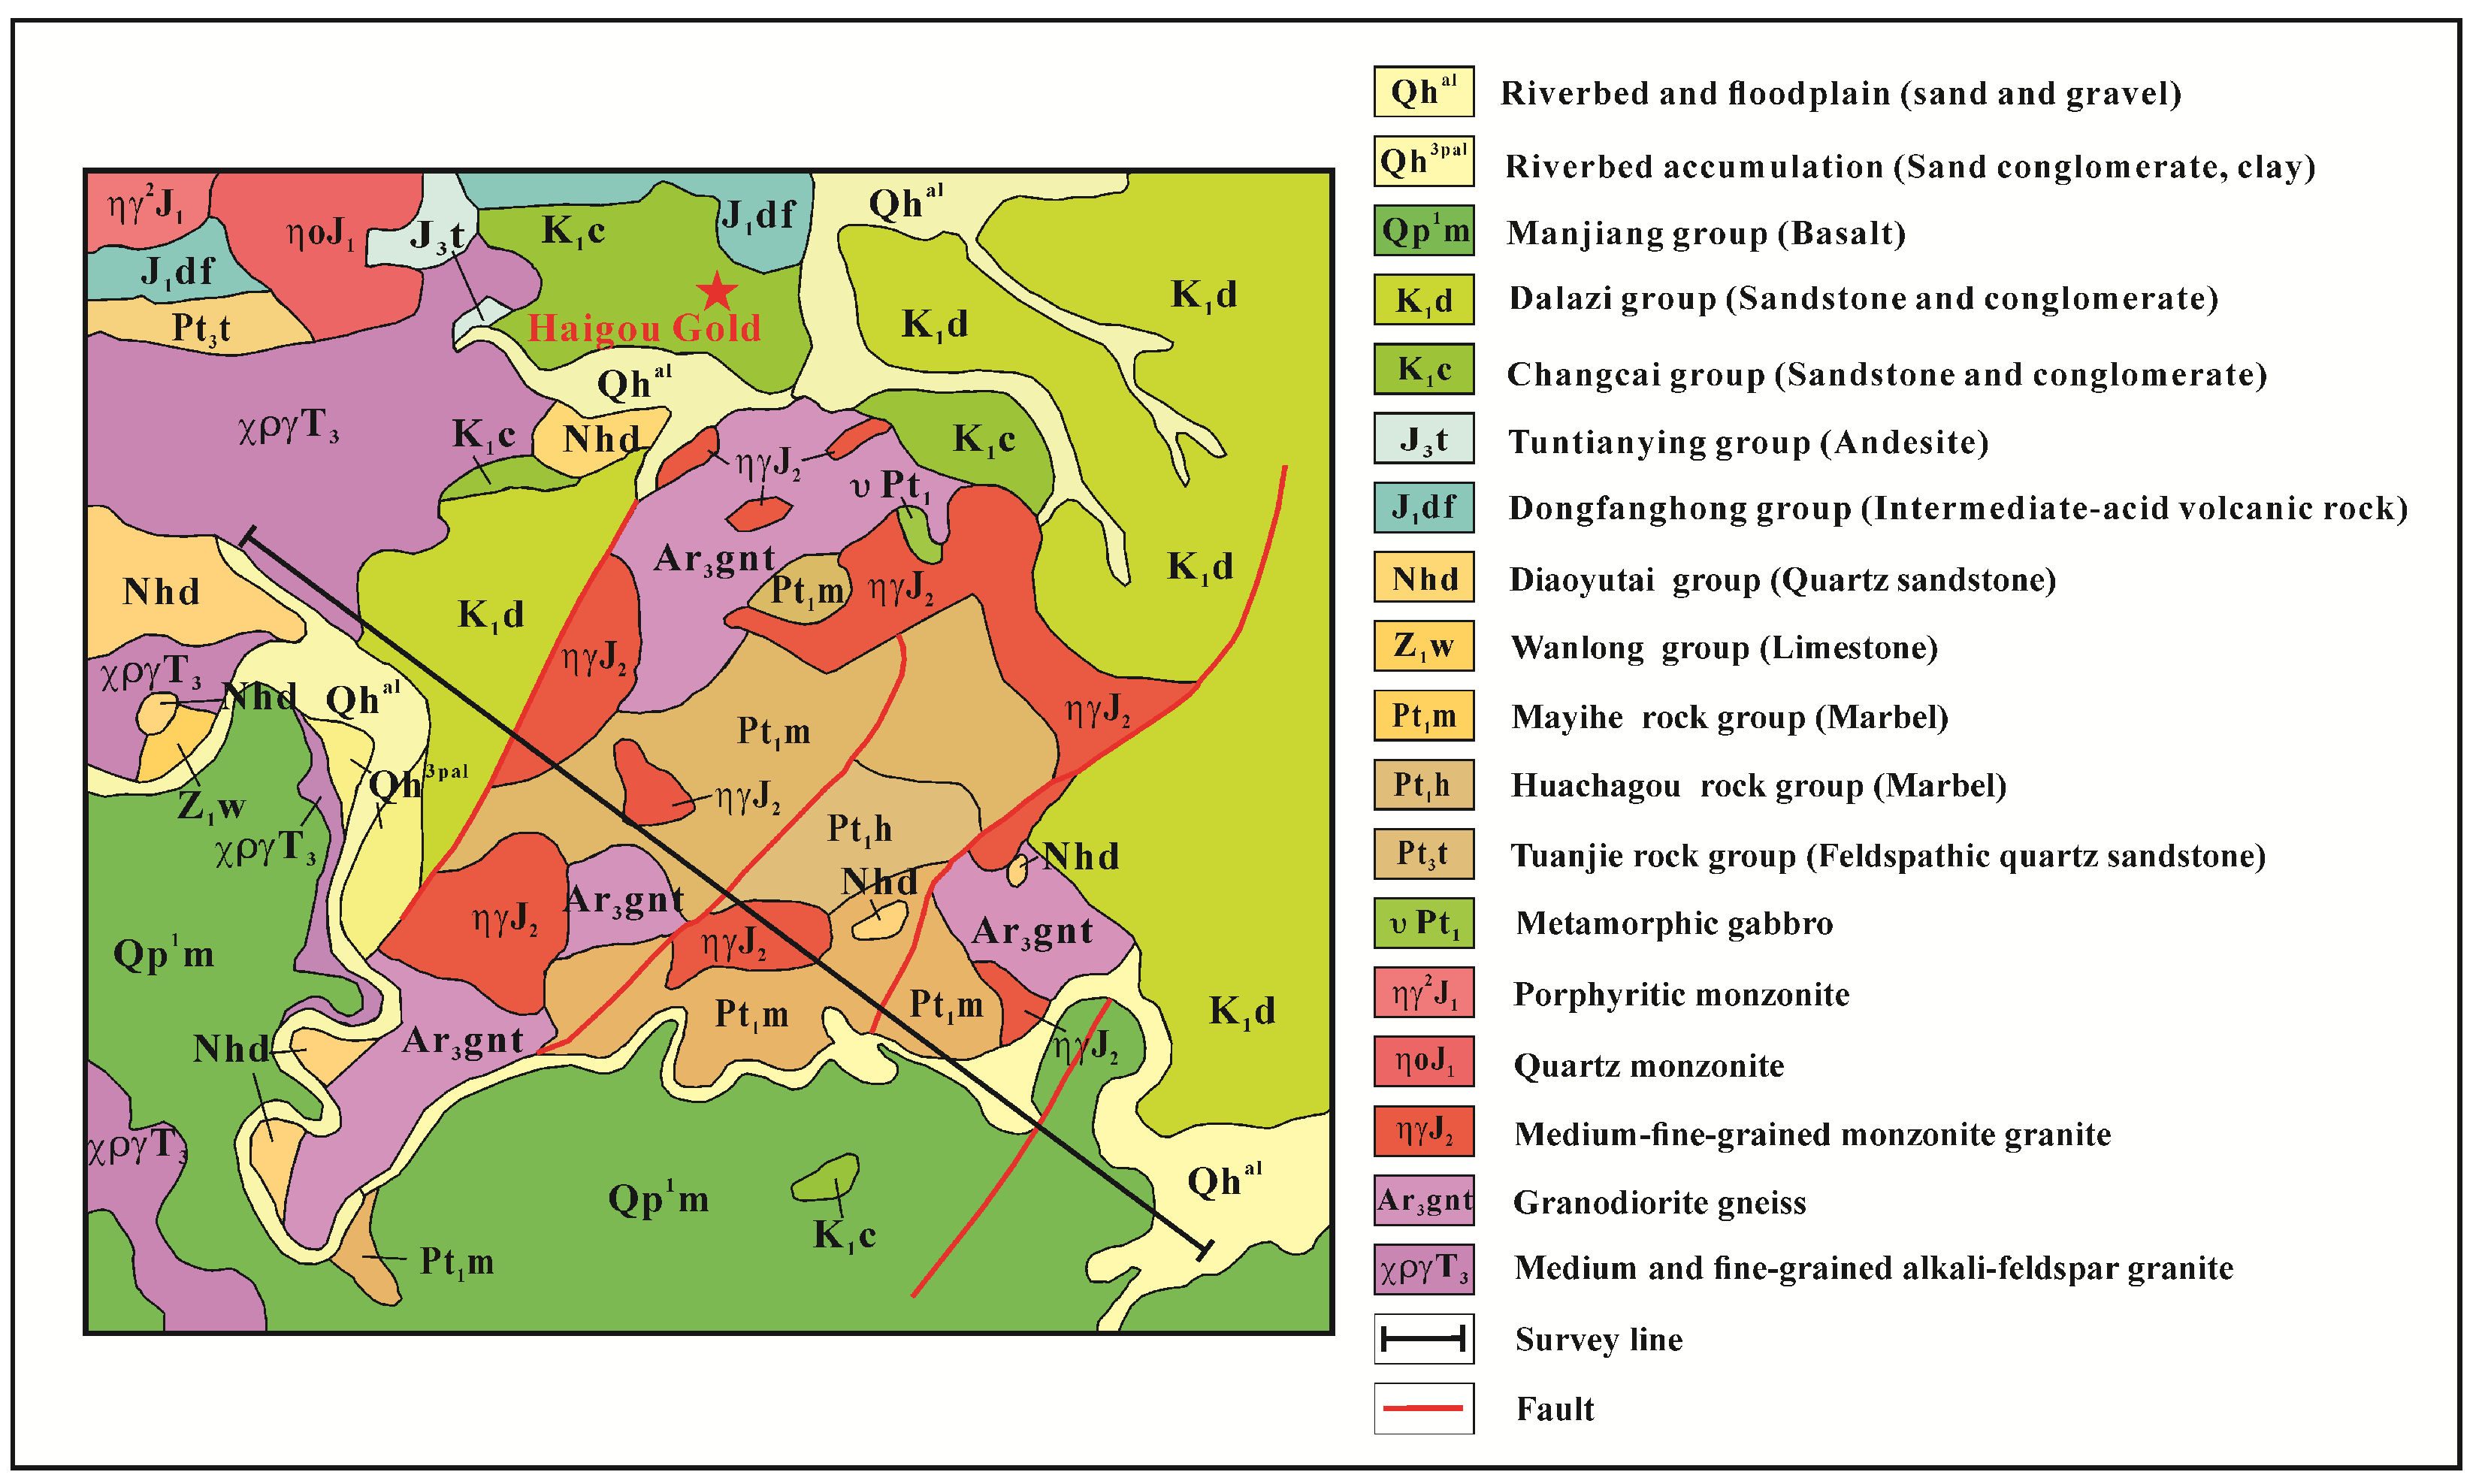
Figure 16.
Field observation data. The apparent resistivity in the TM mode after conversion (a), the gravity data (b), the gravity gradiometry data Vzz (c), the gravity gradiometry data Vxx (d), the gravity gradiometry data Vxz (e).
Figure 16.
Field observation data. The apparent resistivity in the TM mode after conversion (a), the gravity data (b), the gravity gradiometry data Vzz (c), the gravity gradiometry data Vxx (d), the gravity gradiometry data Vxz (e).

Figure 17.
Separate inversion results of the field data using the model-space. The controlled-source audio-frequency magnetotelluric (CSAMT) separate inversion (a), gravity separate inversion (b), gravity gradiometry separate inversion (c).
Figure 17.
Separate inversion results of the field data using the model-space. The controlled-source audio-frequency magnetotelluric (CSAMT) separate inversion (a), gravity separate inversion (b), gravity gradiometry separate inversion (c).
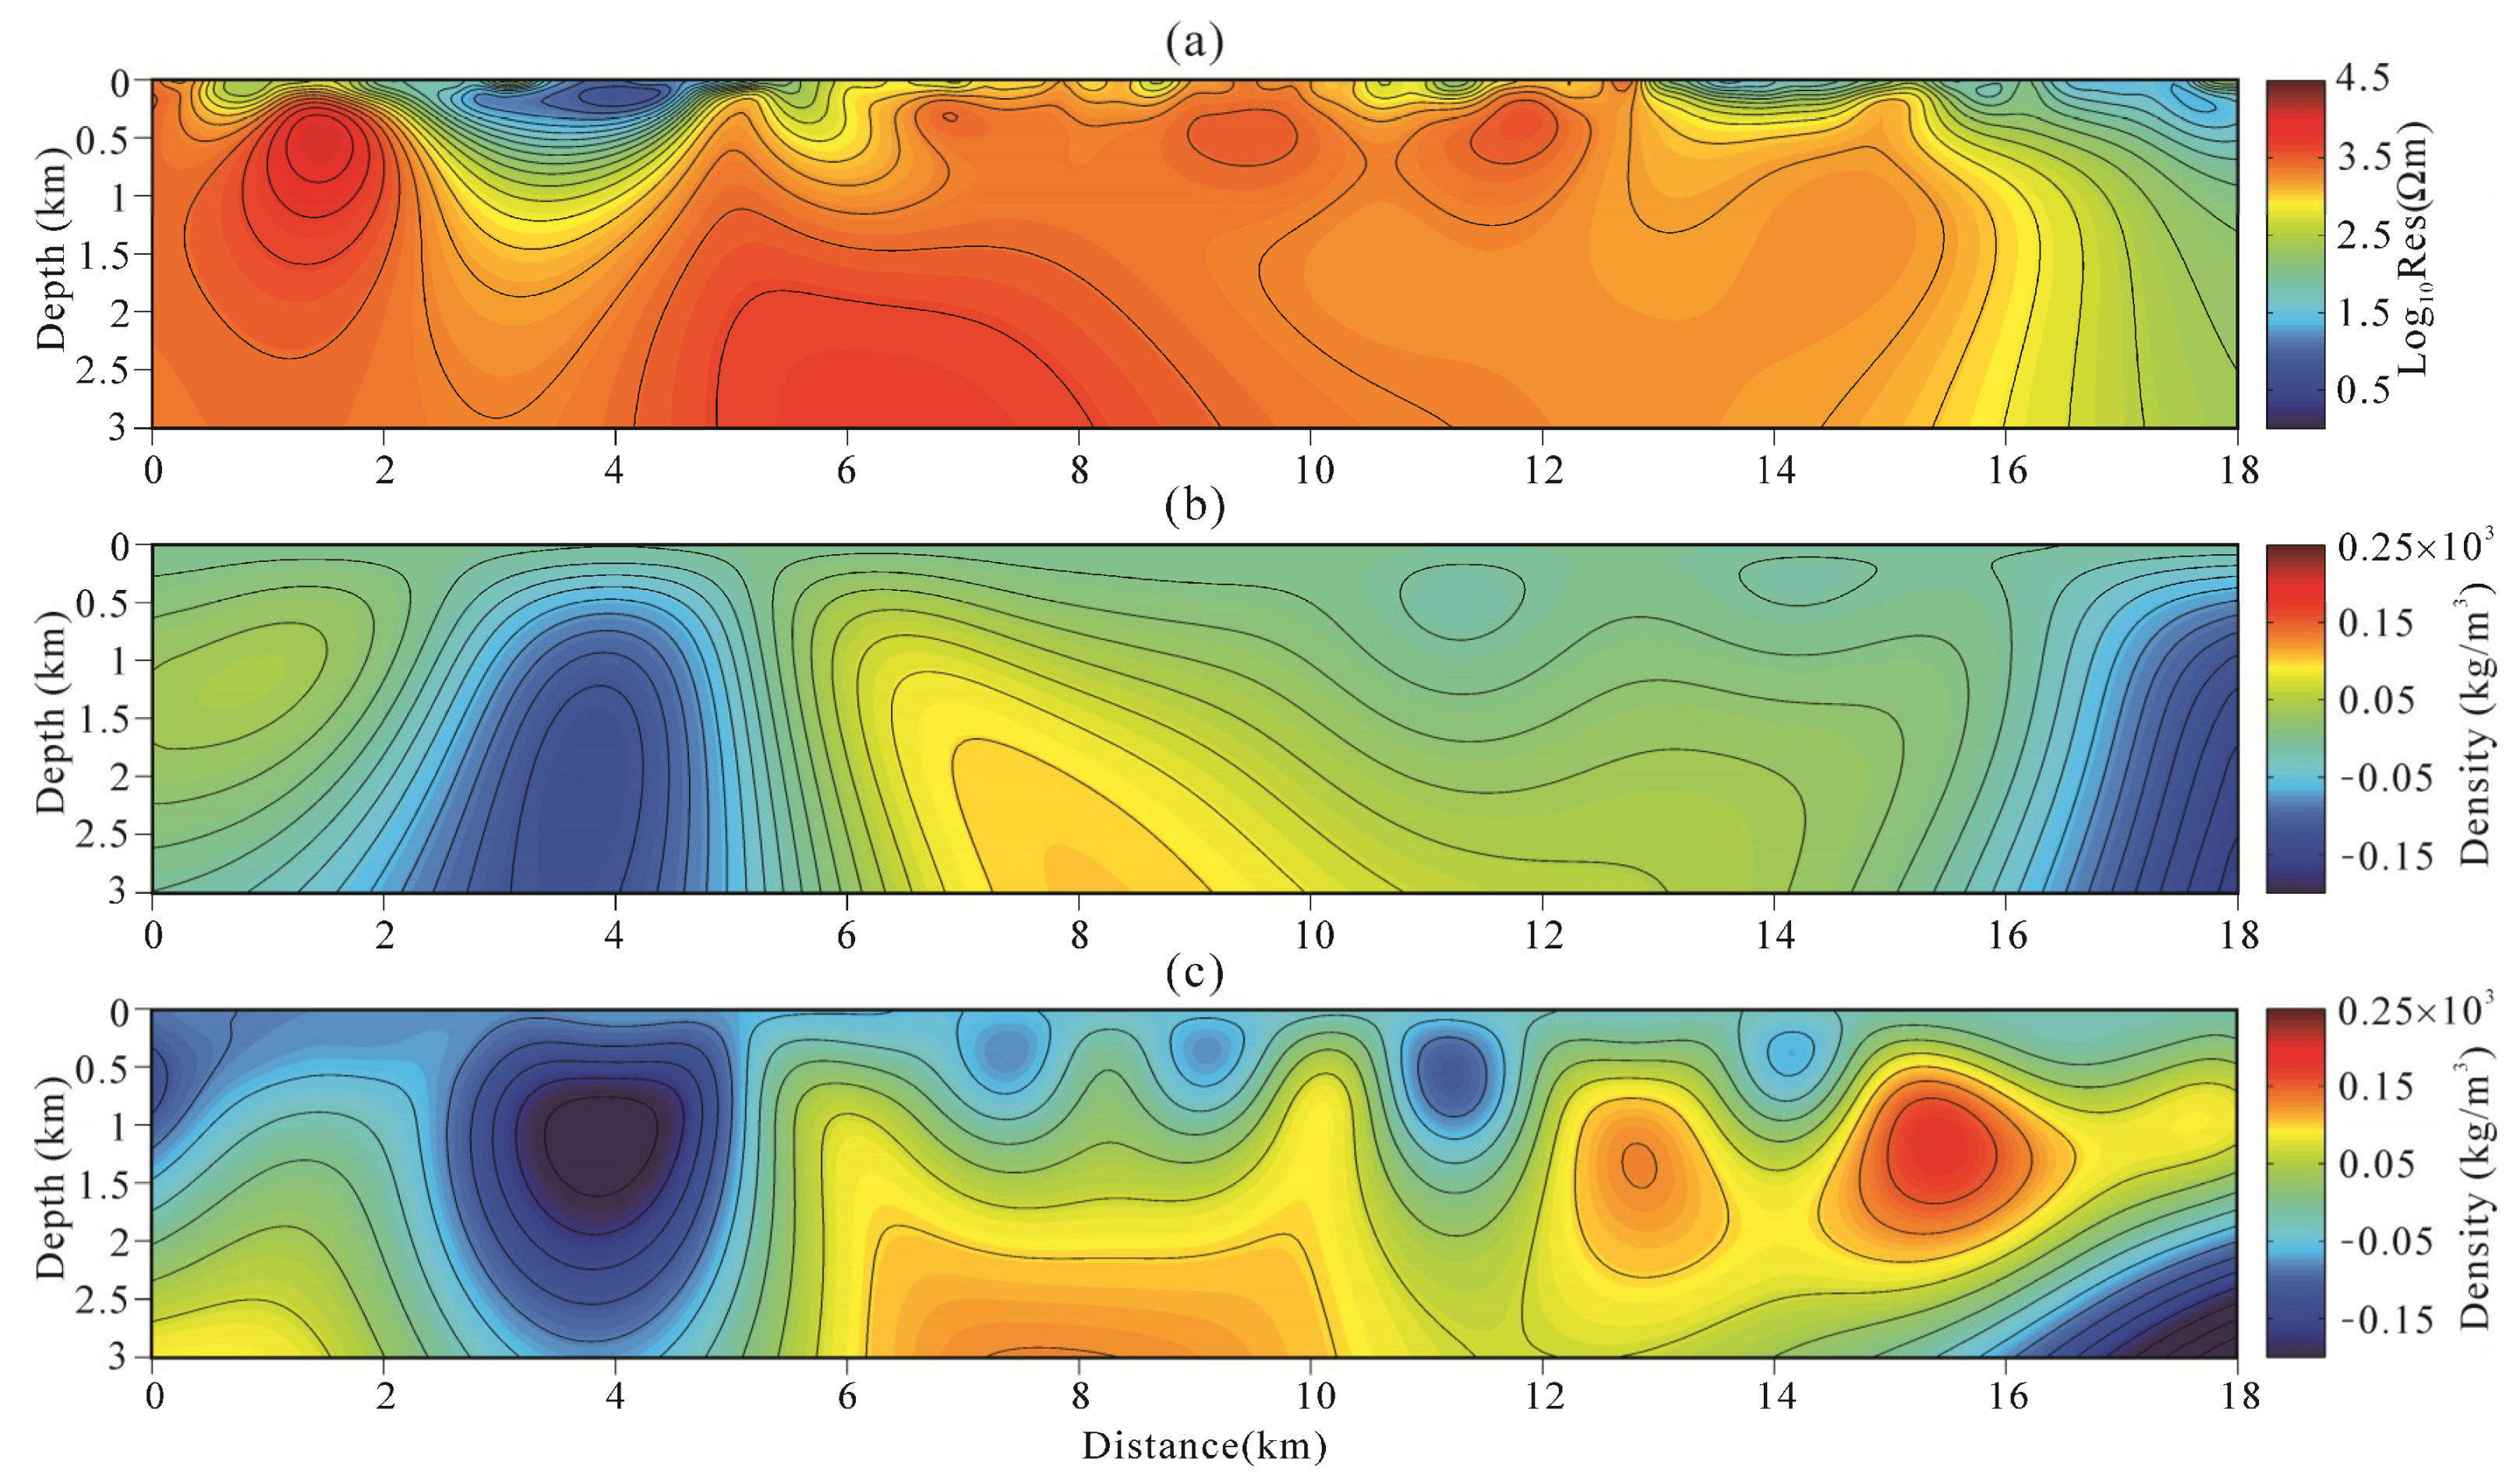
Figure 18.
Separate inversion results of field data using the data-space. CSAMT separate inversion (a), gravity separate inversion (b), gravity gradiometry separate inversion (c).
Figure 18.
Separate inversion results of field data using the data-space. CSAMT separate inversion (a), gravity separate inversion (b), gravity gradiometry separate inversion (c).
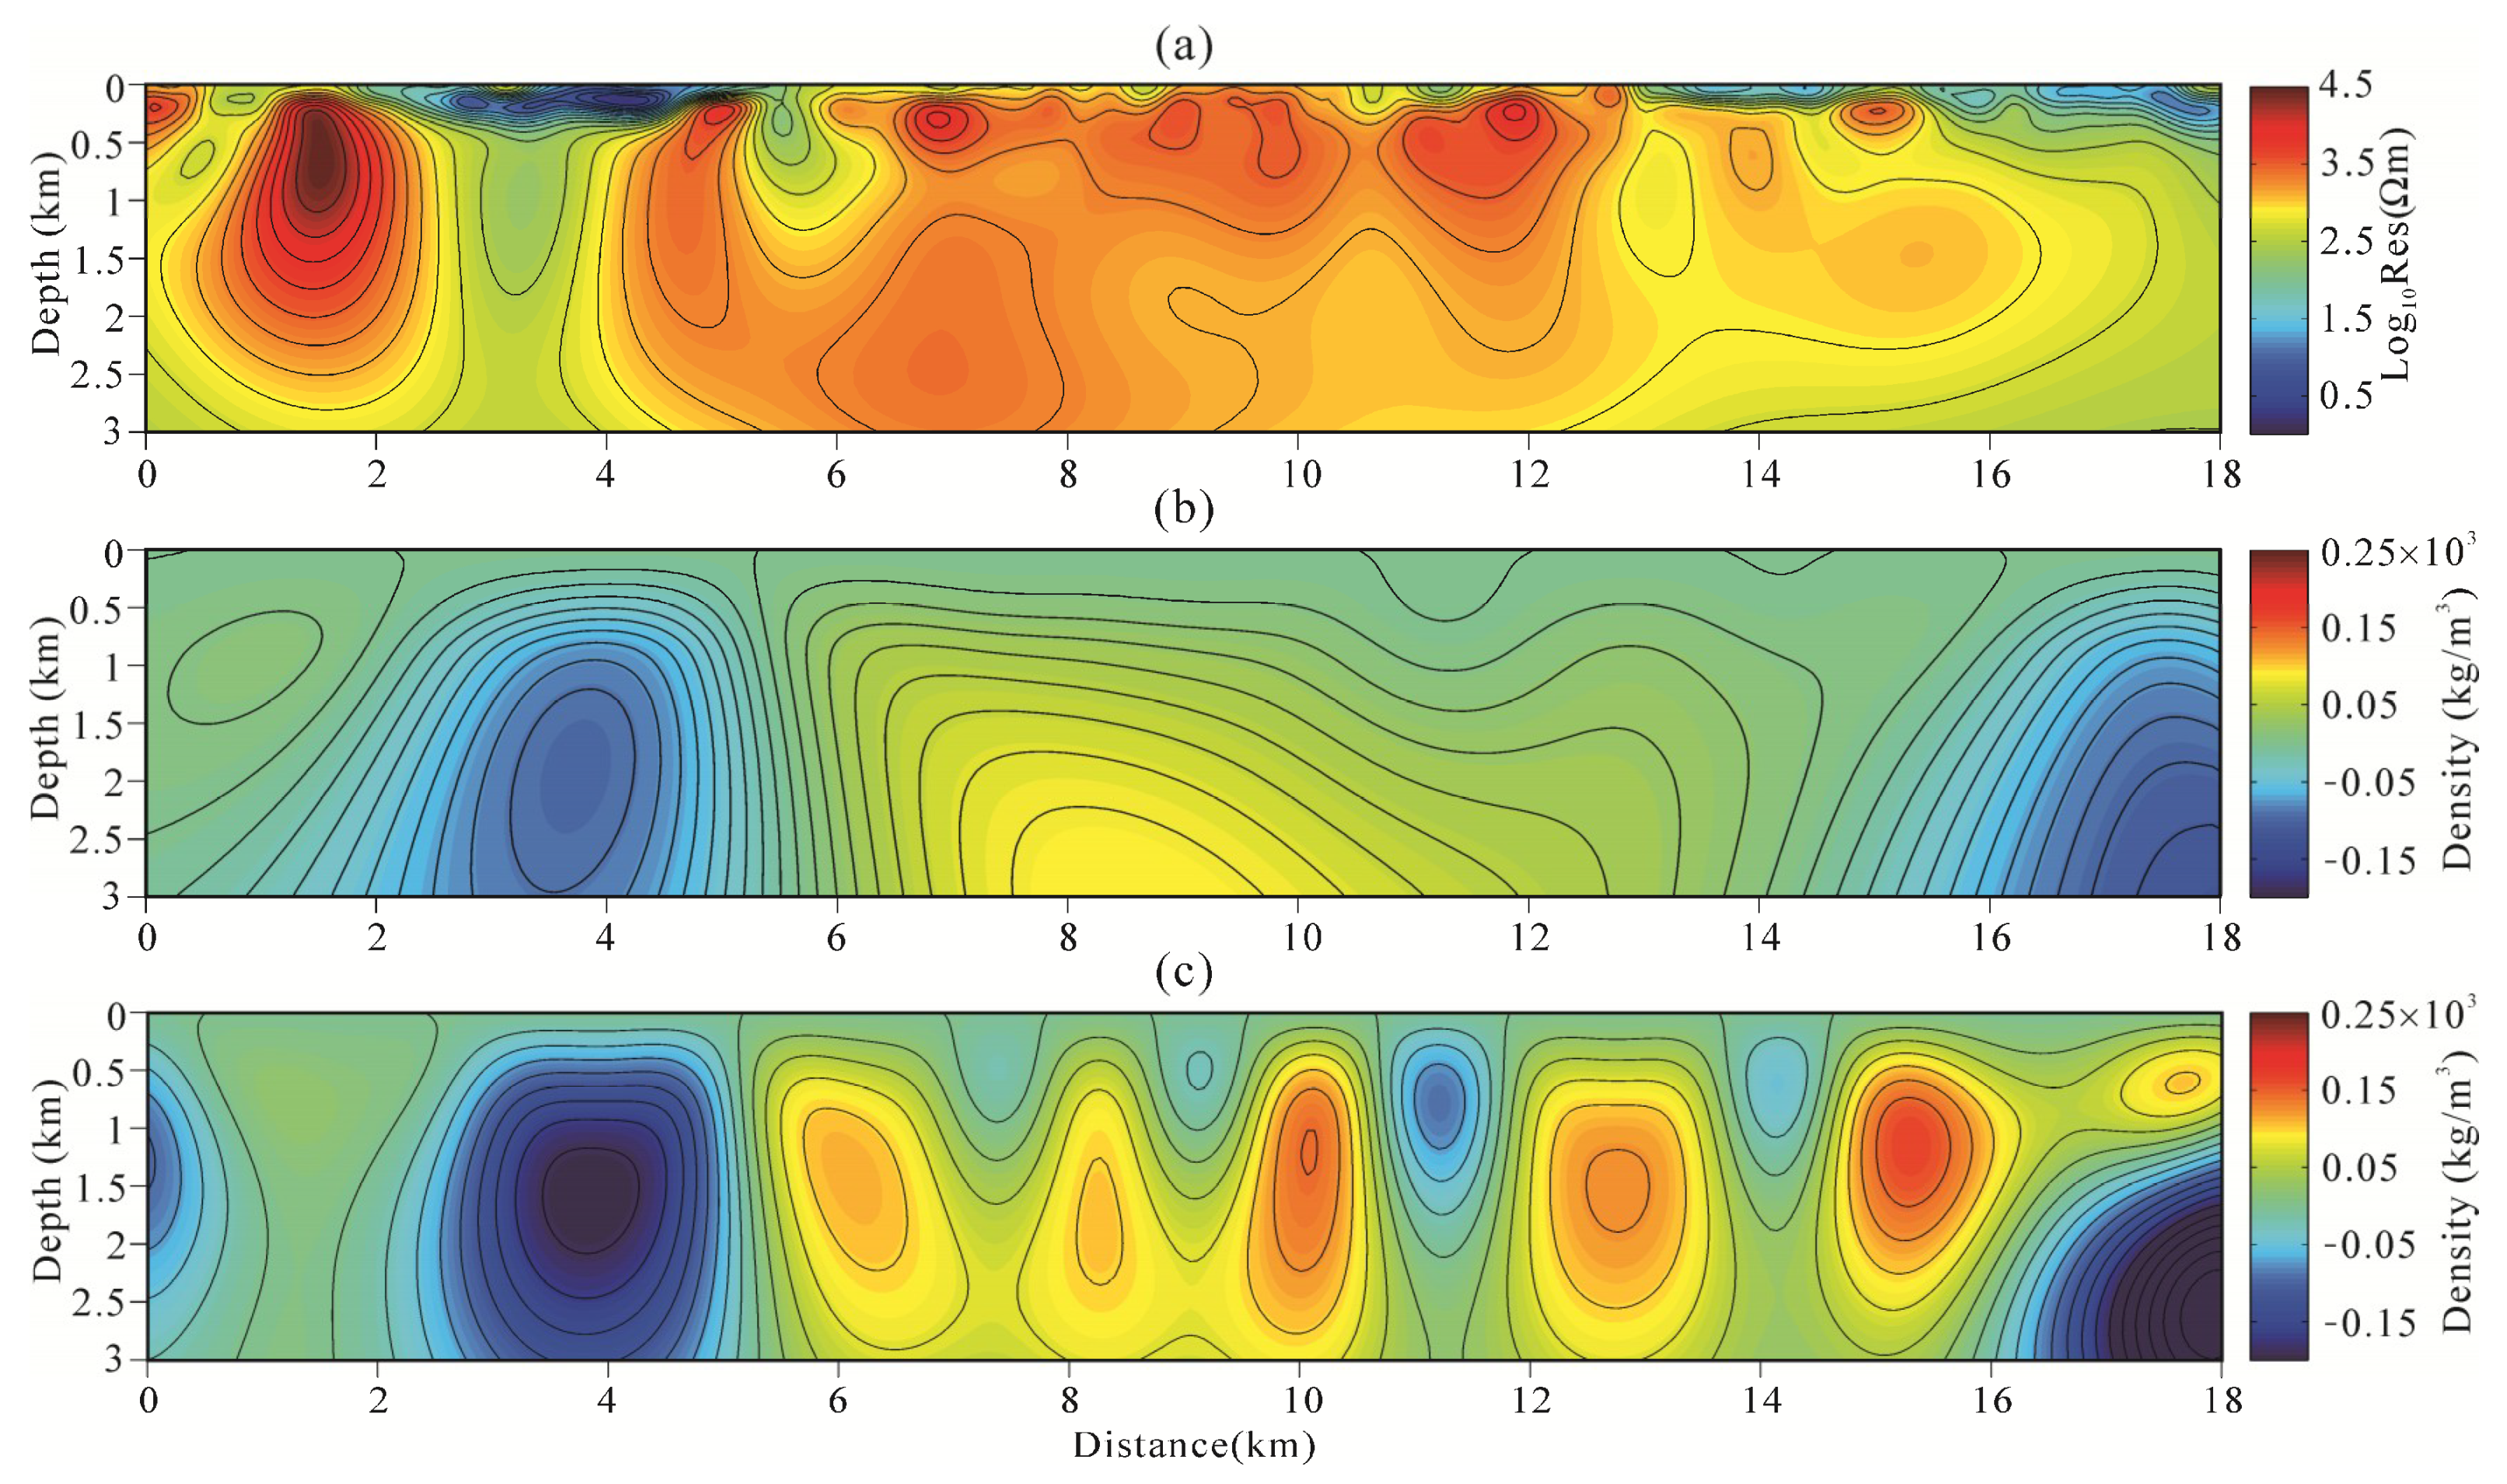
Figure 19.
Joint inversion results of CSAMT and gravity data using the model-space method. Resistivity model (a), density model (b).
Figure 19.
Joint inversion results of CSAMT and gravity data using the model-space method. Resistivity model (a), density model (b).
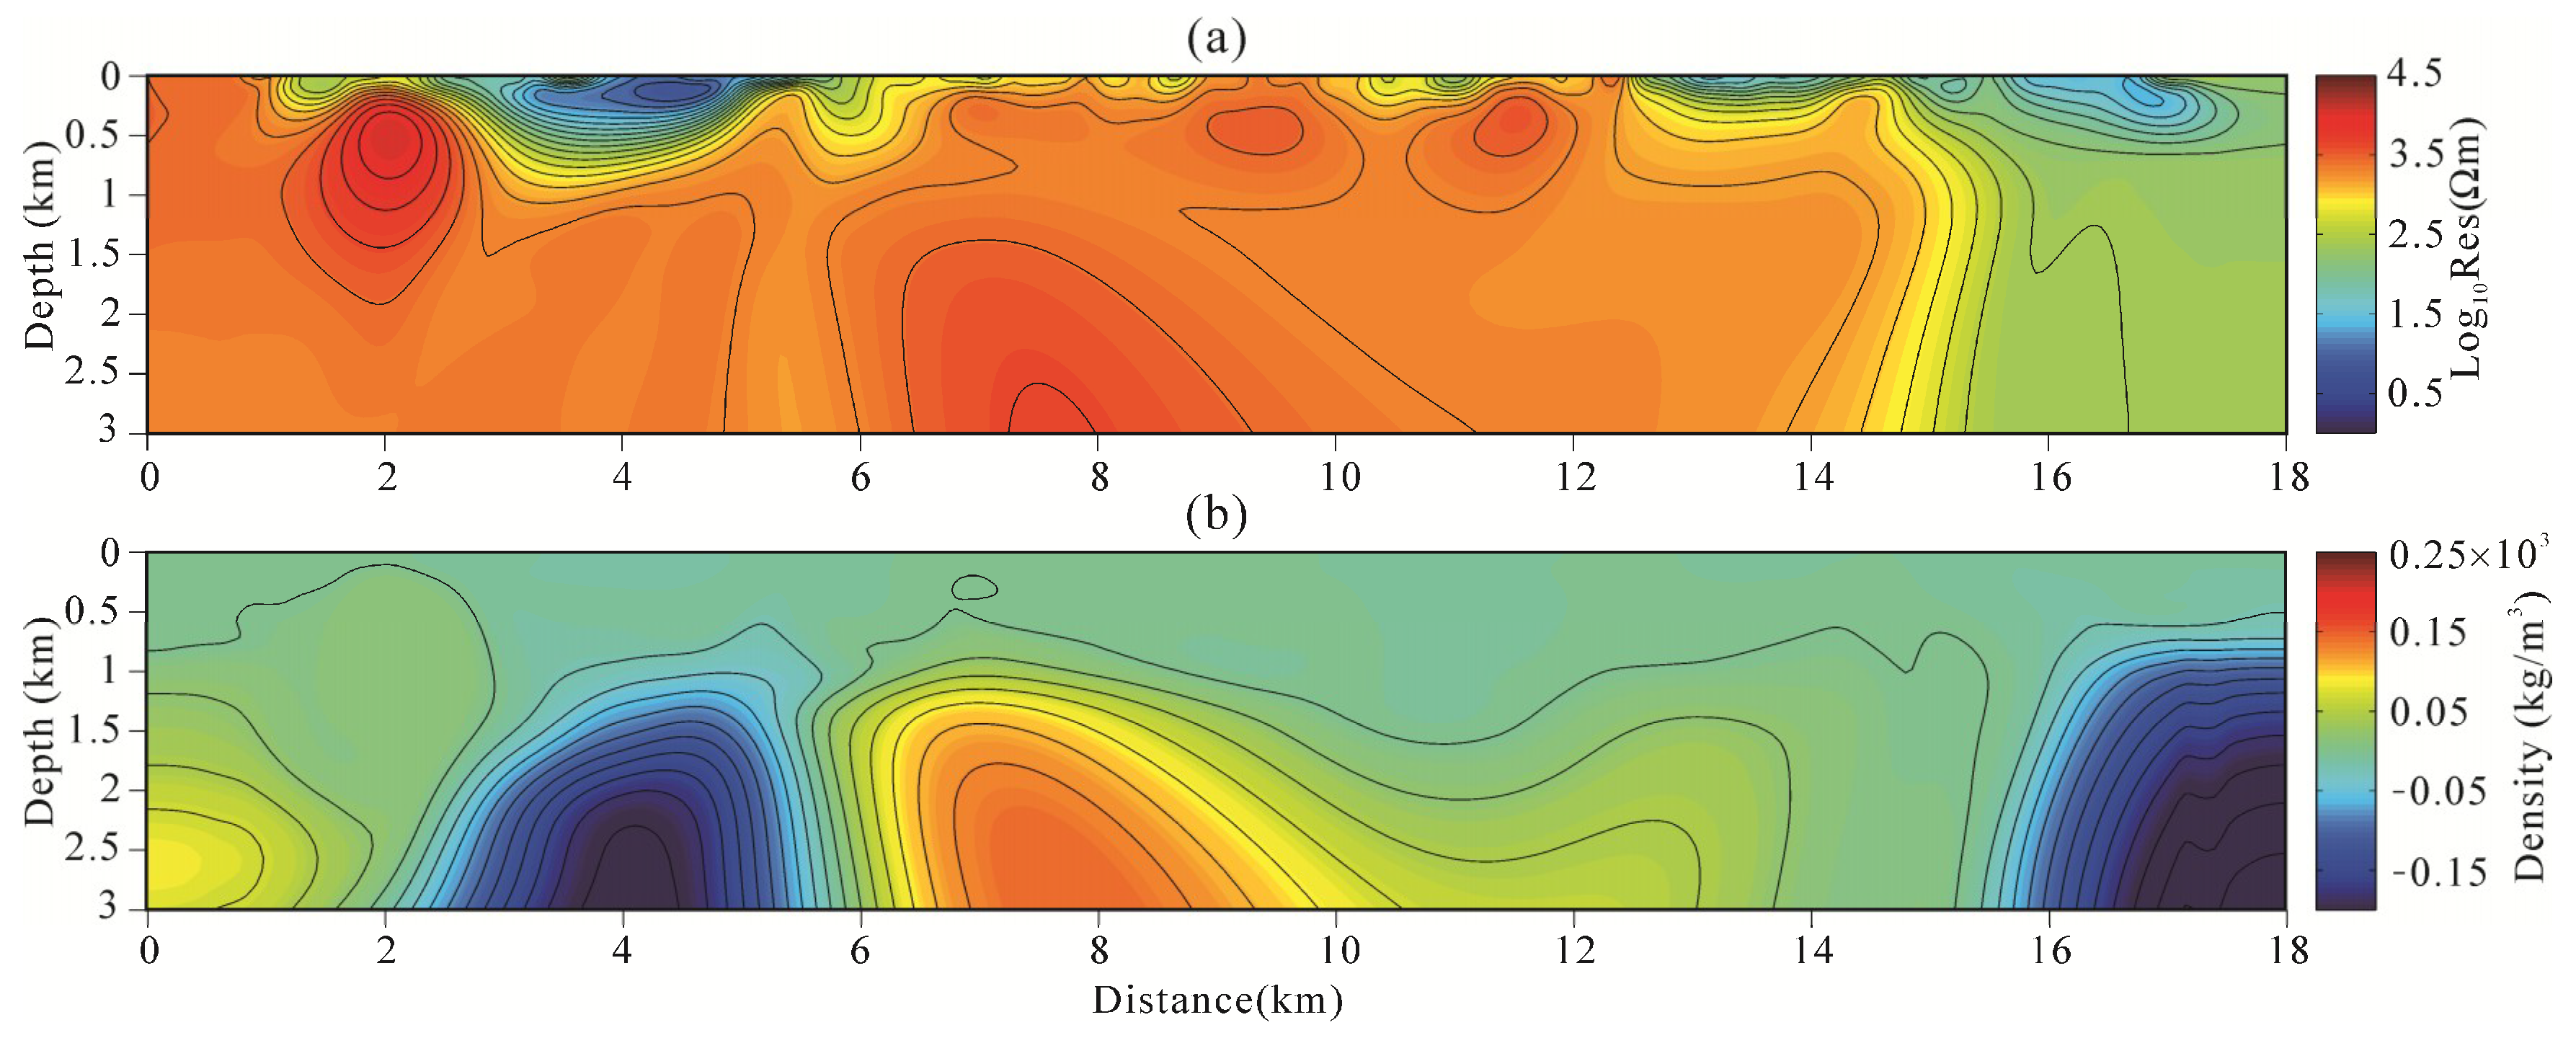
Figure 20.
Joint inversion results of CSAMT and gravity gradiometry data using the model-space method. Resistivity model (a), density model (b).
Figure 20.
Joint inversion results of CSAMT and gravity gradiometry data using the model-space method. Resistivity model (a), density model (b).
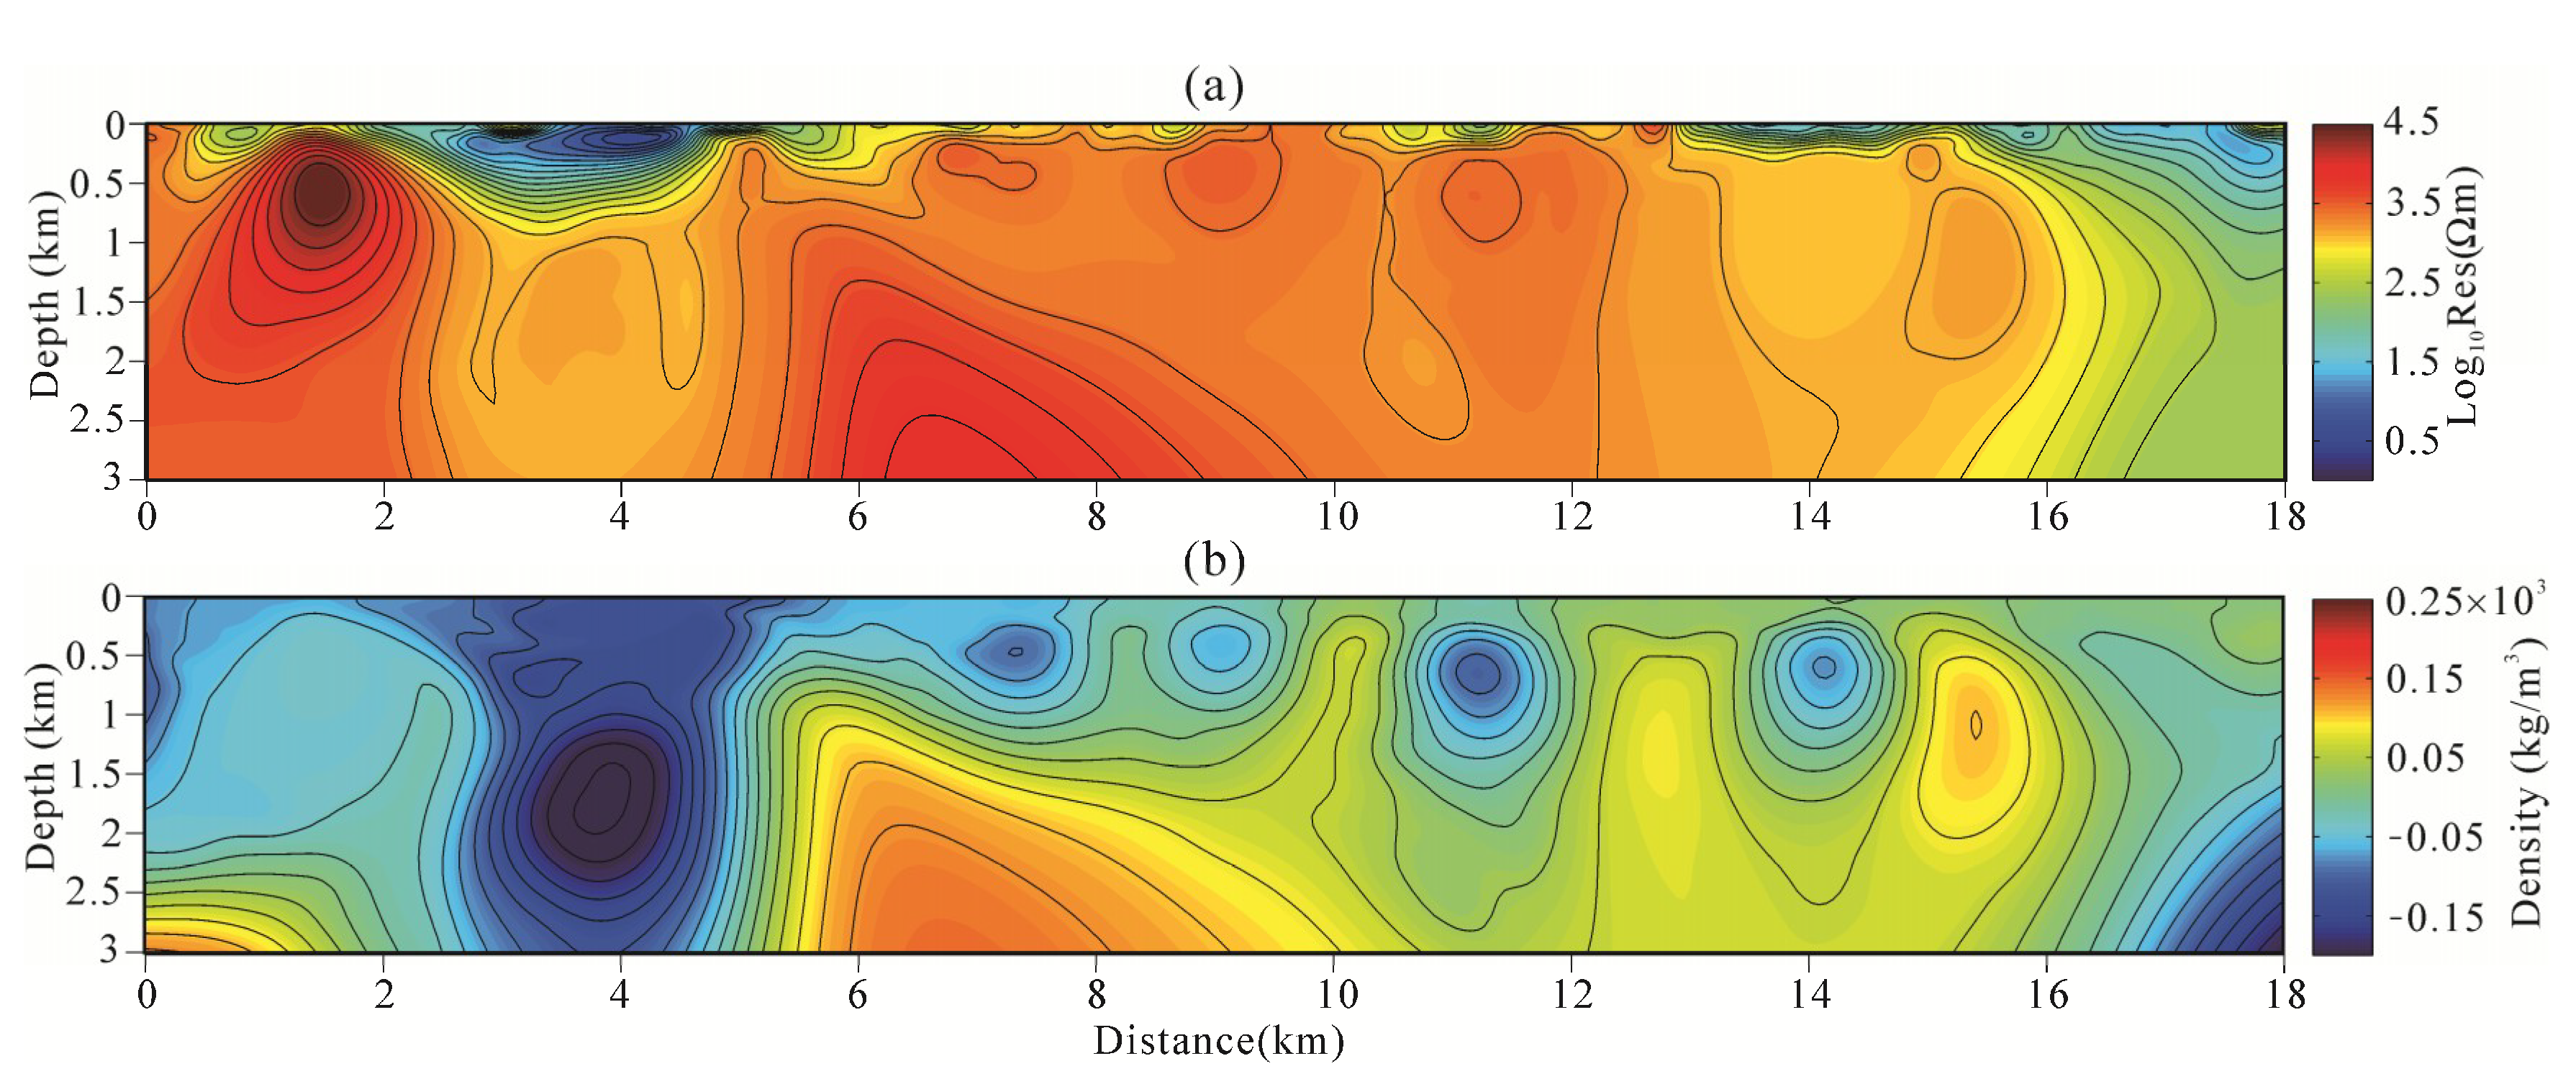
Figure 21.
Joint inversion results of CSAMT and gravity gradiometry data using the data-space method. Resistivity model (a), density model (b).
Figure 21.
Joint inversion results of CSAMT and gravity gradiometry data using the data-space method. Resistivity model (a), density model (b).
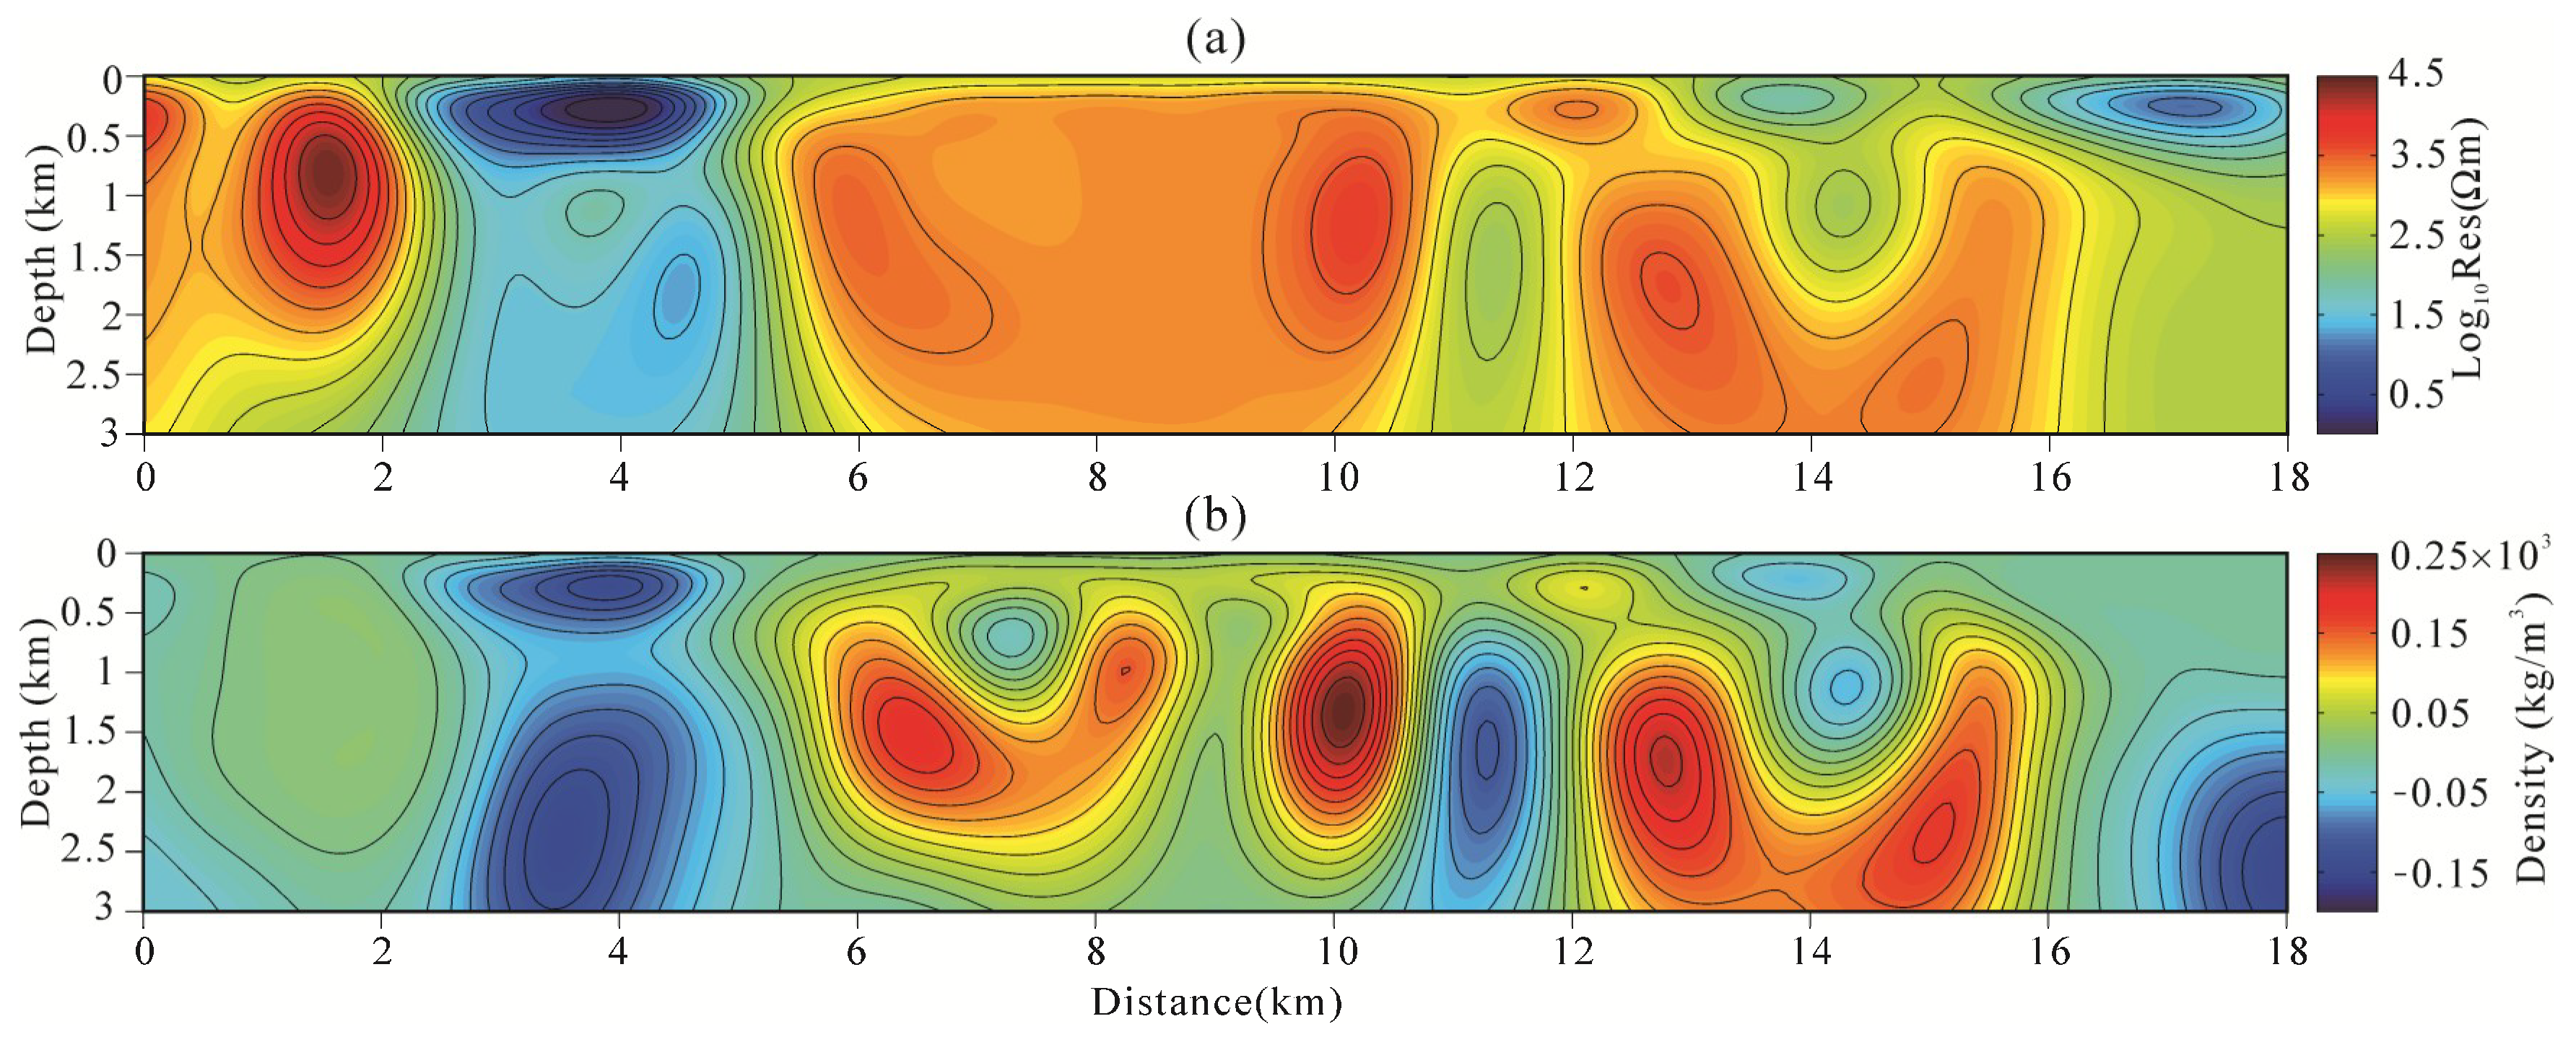
Figure 22.
The RGB composite image of the separate inversion of gravity and CSAMT data using the data-space method (a), the separate inversion of gravity gradiometry and CSAMT data using the data-space (b), and the joint inversion of gravity gradiometry and CSAMT data using the data-space (c).
Figure 22.
The RGB composite image of the separate inversion of gravity and CSAMT data using the data-space method (a), the separate inversion of gravity gradiometry and CSAMT data using the data-space (b), and the joint inversion of gravity gradiometry and CSAMT data using the data-space (c).
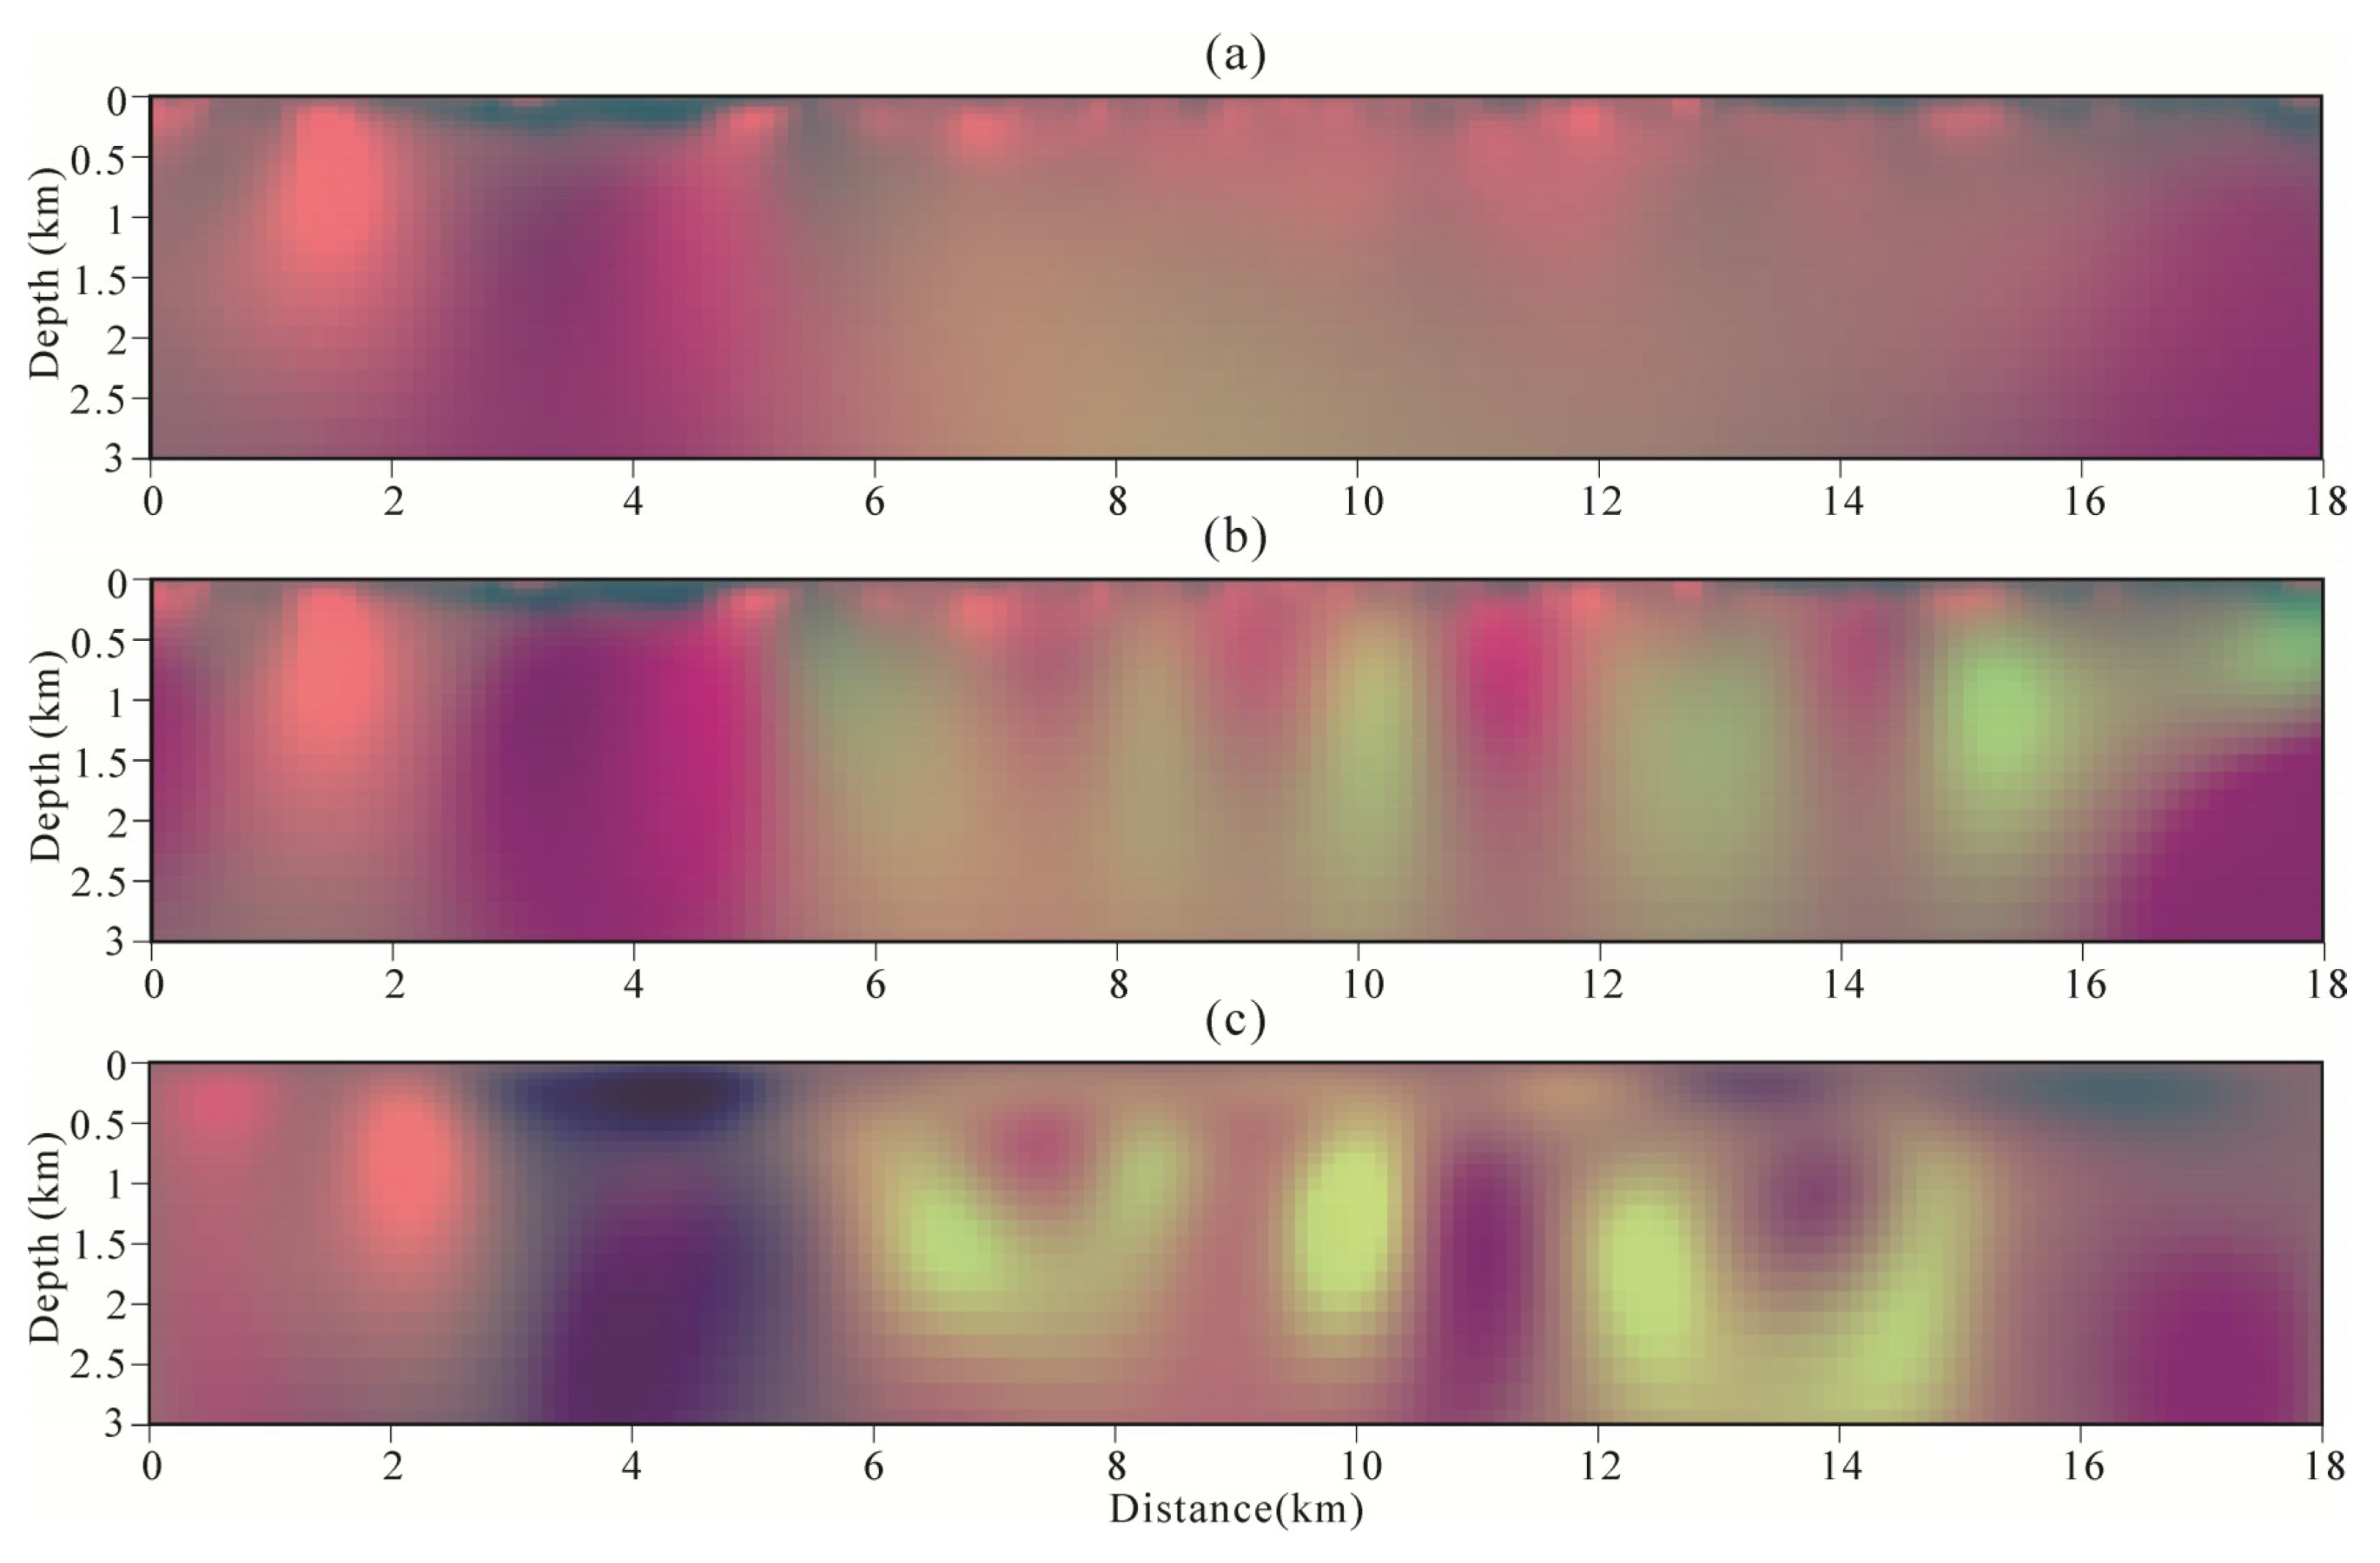
Figure 23.
Comprehensive geological interpretation profile.


Table 1.
Comparison of computational time and memory storage in the data-space and model-space joint inversion.
Table 1.
Comparison of computational time and memory storage in the data-space and model-space joint inversion.
| Model-Space | Data-Space | |
|---|---|---|
| Computational Time | 13.15 h | 3.92 h |
| Memory Storage | 4.1 GB | 0.62 GB |
Table 2.
Stratigraphic lithology.
| Geological Time | Lithostratigraphic Units | Lithology | Unit | |
|---|---|---|---|---|
| Era | Period | Formation | ||
| Cenozoic | Neogene | Manjiang (Qp1m) | Basalt | K |
| Mesozoic | Triassic | (χργT3) | Medium and fine-grained alkali-feldspar granite | A |
| Jurassic | Tuntianying (J3t) | Andesite | D | |
| Dongfanghong (J1df) | Intermediate-acid volcanic rock | D | ||
| (ηγJ2) | Medium-fine-grained monzonite granite | G | ||
| Cretaceous | Dalazi (K1d) | Sandstone | C | |
| Changcai (K1c) | Sandstone | C | ||
| Proterozoic | Qingbaikouan | Diaoyutai (Nhd) | quartz sandstone | B |
| Paleoproterozoic | Mayihe (Pt1m) | Marble | L | |
| Archeozoic | (Ar3gnt) | Granodiorite gneiss | E | |
© 2019 by the authors. Licensee MDPI, Basel, Switzerland. This article is an open access article distributed under the terms and conditions of the Creative Commons Attribution (CC BY) license (http://creativecommons.org/licenses/by/4.0/).
Share and Cite
MDPI and ACS Style
Zhang, R.; Li, T. Joint Inversion of 2D Gravity Gradiometry and Magnetotelluric Data in Mineral Exploration. Minerals 2019, 9, 541. https://doi.org/10.3390/min9090541
AMA Style
Zhang R, Li T. Joint Inversion of 2D Gravity Gradiometry and Magnetotelluric Data in Mineral Exploration. Minerals. 2019; 9(9):541. https://doi.org/10.3390/min9090541
Chicago/Turabian StyleZhang, Rongzhe, and Tonglin Li. 2019. "Joint Inversion of 2D Gravity Gradiometry and Magnetotelluric Data in Mineral Exploration" Minerals 9, no. 9: 541. https://doi.org/10.3390/min9090541
Note that from the first issue of 2016, this journal uses article numbers instead of page numbers. See further details here.