A Comparative Study of Different Columns Sizes for Ultrafine Apatite Flotation
by
Elves Matiolo
1,*, 
Hudson Jean Bianquini Couto
1,
Michelle Fernanda de Lira Teixeira
2,
Renata Nigri de Almeida
1 and
Amanda Soares de Freitas
1,3 1
Centro de Tecnologia Mineral (CETEM/MCTI), Rio de Janeiro 21941-908, Brazil
2
Copebras—China Molybdenum Company Ltd (CMOC International Brasil), Ouvidor (GO) 75715-000, Brazil
3
Centro de Tecnologia Mineral (CETEM/MCTIC), Universidade Federal do Rio Grande do Sul (UFRGS), Porto Alegre 90040-060, Brazil
*
Author to whom correspondence should be addressed.
Minerals 2019, 9(7), 391; https://doi.org/10.3390/min9070391
Submission received: 19 April 2019
/
Revised: 7 June 2019
/
Accepted: 21 June 2019
/
Published: 28 June 2019
(This article belongs to the Special Issue Recent Trends in Phosphate Mining and Beneficiation and Related Waste Management)
Abstract
:The desliming operation to discharge ultrafine particles less than 20 µm prior to concentration by flotation is a common practice in phosphate ores beneficiation plants. The first industrial application for the beneficiation of the phosphate material with particle sizes <44 µm in Brazil was in the Araxá plant concentrator in the beginning of the 1980s. This work shows the comparative flotation results with two different phosphate slime samples (<40 µm) obtained from the Copebras (CMOC International) industrial plant located in Catalão (Goiás state, Brazil), considering a circuit with rougher/cleaner configuration with different columns sizes, as follows: Circuit 1 (rougher—4” diameter column; cleaner—2” diameter column) and circuit 2 (rougher—6” diameter column; cleaner 4” column). The results indicate that better flotation apatite recovery results were achieved for the circuit with higher size columns (6” and 4”). The results can be explained by the application of a cavitation tube in the rougher stage in the 6” column. The improved flotation performance can be attributed to increased probabilities of collision and attachment and the reduced probability of detachment by the small size bubbles generated by the cavitation tube in comparison with the bubbles produced by the porous tube of the 4” column flotation.
1. Introduction
Flotation is considered the most effective technology to concentrate phosphate bearing minerals from sedimentary and igneous phosphates ores [1,2,3]. One of the main disadvantages of phosphate upgrading by flotation is the high sensitivity of collectors to slimes (size fraction <44 µm). Therefore, desliming is a necessary pre-request for successful flotation [4,5,6,7] and, following this trend, the classical aim of desliming is to remove fine particles (<37–45 µm) from the flotation feed. Fine/ultrafine particles account for 10–30% of losses of phosphate values in the worldwide beneficiation of phosphate ores, for instance, in Florida [8], India [9], Iran [3], Australia [6], Jordan [10], China [11], and Brazil [12,13,14,15].
There are several characterization and process studies focused on the exploitation of phosphate bearing minerals from slimes. In the case of slimes from phosphate ores from Florida, chemical and physical characterizations of slimes show that the P2O5 content ranges from 10% to 25% and the particle size distribution indicates that d80 are under 30 µm with significant amount (>10–30%) under 2–5 µm. Additionally, the mineralogical composition of the slimes indicates a high content of clay minerals, which are extremely deleterious to the flotation process [8]. Similar chemical and physical characteristics of the slimes can be found in phosphate ores from Brazil [13,14,15], Australia [6], and India [9]. Regarding the technological approaches to the concentration of ultrafine phosphate bearing minerals from slimes, one strategy is based on desliming in hydrocyclones with low diameters (40 mm) to remove particles under 5–10 µm, followed by the flotation of the desliming product [8,13,14,15]. Other alternatives tested as well were flotation using a Jameson Cell [6], column flotation [3,16], and also flotation with nanobubble injection in conventional flotation machines without desliming prior to flotation [3].
Pradip and Sankar [9] carried out studies with a slime sample from the Maton rock phosphate beneficiation plant located in Rajasthan, India. One of the major sources of losses in phosphate values is due to slimes generated during the washing of the crushed ore product, called “crusher slimes”. The slimes fraction (75%; 37 µm) consists of carbonate-fluorapatite in association with quartz, kaolinite, and limonite, and assays 18–21% P2O5, accounting for 10–15% losses of phosphate values in the plant. In this work, the authors concluded that it is possible to float phosphate ore slimes, all passing 37 µm (50%; 8 µm), from Maton, India using a sodium oleate collector, under reagent conditions very different from what is required and currently practiced in the plant for a relatively coarser feed (80%; 74 µm). It should also be possible to condition the slimes separately and then combine them with the coarse ore feed in the existing flotation circuit in the plant.
In contrast with the established methods of phosphate beneficiation where classification by hydrocyclone is mainly used to remove ultrafine particles as tailings, Teague and Lollback [6] describe a process which successfully beneficiates phosphate ore with a high proportion of ultrafine particles (80% <20 µm) to be recovered via flotation without prior classification to remove ultrafine particles (<2–5 µm). The process uses conditioning with reagents at high wt % solids (at least 70 wt %) and flotation with Jameson cells in a rougher, scavenger, cleaner configuration to recover at least 80% P2O5 at a grade of 32% P2O5 or greater. The Jameson cell was found to have an advantage over conventional flotation cells when treating ultrafine particles, due to their intense mixing zone and propensity to form small bubbles. Pourkarimi et al. [3] carried out studies with a slime sample from the Esfordi phosphate processing plant from the central desert in Iran in Yazd province. The ore contained about 10% of the mass, with a grade of more than 16% P2O5 and d80 of less than 30 μm. The authors compared the results considering flotation in the presence and absence of nanobubbles using a Denver flotation cell and carried out the generation of nanobubbles based on the cavitation phenomenon through a venturi tube. The flotation results indicated that the existence of nanobubbles in the process had positive effects, so that more than 90% of phosphates with a grade of more than 40% were recoverable in the presence of nanobubbles, while in their absence, under the same conditions, the P2O5 grade was 37%. The recovery of apatite in flotation in the presence of nanobubbles significantly increased up to more than 30%, compared to flotation in the absence of nanobubbles.
One alternative to the flotation of phosphate slimes is the application of the column flotation [10,12,13,14,15,16]. Al-Thyabat et al. [7] evaluated the floatability of Jordanian phosphate slime (<38 μm) in a batch column flotation cell, 100 cm high and 5 cm in diameter. Flotation was conducted using sodium oleate as a collector and methyl isobutyl carbinol (MIBC) as a frother. Rougher flotation yielded a concentrate assaying 29.19% P2O5 with 90.29% recovery at the following flotation parameters: A total 2.6 cm/s superficial gas velocity, 20 ppm frother dosage, 0.205 mmol/L collector concentration, and 40% weight solids. It was also found that conditioning with the same collector dosage, but with a different solids weight percent, gave different flotation results.
The Brazilian phosphate industry has made great efforts to develop technology for the production of phosphates from slimes as shown by Guimarães and Peres [12,13,14]. The first industrial application was in the Araxá concentrator in the beginning of the 1980s, in a circuit consisting of desliming in 40 mm hydrocyclones and apatite flotation in column machines. This technology has been upgraded since 1984 by means of significant improvements in the desliming operation, concerning equipment and process control, utilization of a more adequate reagent system, and the use of flotation machines that provide improved performance and metallurgical yield. The concept of this process was still expanded to other Brazilian plants located in Catalão (Goiás state), Tapira (Minas Gerais state), and Cajati (São Paulo state) in the 1990s. It is estimated that the apatite concentrate from slimes represents 11% to 13% of the overall production. The apatite concentrate grade achieved from slimes are P2O5 at 33.0–35%; Fe2O3 at 3.0–6.5%; Al2O3 at 0.4–1.0%; MgO at 0.1–1.6%, and SiO2 at 1.5–5.5%. More recently, Matiolo et al. [15] showed the results of a flowsheet developed for apatite concentration from a slime sample provided by the industrial phosphate ore plant Copebras (China Molybdenum-CMOC International), located in Catalão (Goiás state, Brazil). Considering the flowsheet with the desliming in the hydrocyclones (40 mm in diameter) in two stages, followed by apatite flotation in the column, a final concentrate of 35.6% P2O5 was obtained, with main impurities of Fe2O3 and SiO2 around 4.0% and 5.1%, respectively, using only rougher flotation. Taking into account the mass and metallurgical balances of desliming and flotation, the overall mass recovery was around 9.5% and the P2O5 recovery was 25.5%.
This work is the continuation of previous work with the Copebras phosphate slime samples. by Matiolo et al [15] This article does a comparison considering a circuit with rougher/cleaner configuration with different sized columns flotations, as follows: Circuit 1 (ro—ugher4” diameter column; cleaner—2” diameter column), and circuit 2 (rougher—6” diameter column; cleaner 4” column). The influence of collector and depressant dosages, pulp pH, superficial wash water velocity (Jw), ore variability, and superficial air velocity (Jg) were evaluated on the flotation separation parameters (P2O5 grade and recovery and impurities content) for both circuits. The chemical quality target for the apatite concentrate is P2O5 > 33.0%, SiO2 < 8%, and Fe2O3 < 6.5%.
2. Experimental
2.1. Ore Sample
The two slime samples tested in this work were provided by Copebras (CMOC International) located in Catalão (Goiás state), Brazil. Detailed information on the sample preparation procedures can be found in the study by Matiolo et al. [15]. The slime samples were collected from the overflow of the hydrocyclones, which was around 10 tons (dry basis) of the slime in pulp with 16% solid content by weight. The sample characterization included chemical analyses by X-ray fluorescence (PANalytical AXIOS WDS, PANalytical, Almero, the Netherlands) and mineralogical characterization by XDR (Rietveld method) (Bruker-D4 Endeavor, Bruker, Germany). The particle size distribution was determined by the laser diffraction technique using a Malvern Master size particle analyzer (Malvern Panalytical Ltd., Malvern, UK).
The particle size distribution of slime Sample 1 showed that the characteristics for diameters D32, D10, D50, and D90 were, respectively, 2.6 µm, 1.0 µm, 5.7 µm, and 24.7 µm, whereas for Sample 2 the values were D32 = 5.0 µm, D10 = 2.1 µm, D50 = 13.8 µm, and D90 = 43 µm. The chemical analyses for both samples showed that the P2O5 grade was around 12–13% and the CaO was around 11–14%. In terms of the major contaminants, SiO2 and Fe2O3 stood out, with grades of 19.7% and 27.7% for Sample 1 and 15.8% and 24.8% for Sample 2, respectively (Table 1). The main mineral phases in the samples were apatite (around 33%), goethite with a 26% grade content, and quartz with 18%.
2.2. Desliming
Figure 1 shows the apparatus for the desliming operation of the slime samples. Each container, holding 1 m3 (40 in total) of the slime sample, was connected to a vertical pump with a system that allowed pulp recirculation to the container and also to a 3.6 m3 tank. In this tank, water was added to adjust the solids in the pulp to around 8%, which represented the solids to the feed of the desliming stage. From the storage tank, the pulp was pumped to the hydrocyclone apparatus. Desliming was carried out in two stages, where the underflow from the first stage fed the second stage. The underflow of the second stage fed the apatite flotation and the overflow from both stages was discharged as tailings. The hydrocyclone used was supplied by Weir Minerals. The apex finder was 7 mm in the first stage and 5.5 mm in the second. In both stages, the vortex finder was 10 mm and the operational pressure was 4 kgf/cm2 in the first stage and 3 kgf/cm2 in the second.
3. Flotation Studies
3.1. Reagents
Soybean oil soap was used as an apatite collector and was obtained after saponification for a period of 15 min with a fatty acid/NaOH ratio of 5:1. Gelatinized corn starch was used as the gangue mineral depressant, with a starch/NaOH ratio of 4:1 and a reaction time of 10 min, in a solution with concentration at 20% w/w. After the saponification and gelatinization, both reagents were diluted in distilled water, producing 1% w/w solutions. For pH adjustment, a 2% NaOH solution was used. Tap water from the city of Rio de Janeiro’s supply network was used to attain the correct percentage of pulp solids in the flotation studies.
3.2. Pilot Plant Flotation Tests
Figure 2a shows the schematic flowsheet considering the desliming and flotation stages for apatite concentration from the slime samples and Figure 2b shows a general view of the columns at CETEM’s pilot plant (ERIEZ, Delta, Canada). The underflow obtained in the second stage of desliming, at 35% solid content by weight, fed the flotation circuit. The rougher/cleaner flotation trials were performed using columns with internal diameters of 6”, 4”, and 2” and a height of 7.0 m. The effective volume of each column was 100 L, 46 L, and 13 L, respectively. The main objective of this study was to compare the flotation performance considering a rougher/cleaner circuit for apatite flotation with the following two different circuits: Circuit 1 (rougher—4” diameter column; cleaner—2” diameter column) and circuit 2 (rougher—6” diameter column; cleaner 4” column). The solid feed rate in each circuit was 35 kg/h and 46 kg/h dry basis, respectively.
From the storage tank, the pulp was pumped to a cylindrical tank where it was conditioned with gelatinized corn starch and the pH was adjusted (between 9.5 and 10.8) with NaOH. The depressant dosage ranged from 2300 g/t up to 3000 g/t. After conditioning with the depressant, the pulp was conditioned with soybean oil soap in a cylindrical tank, at 35% solids by weight, with dosages from 70 g/t to 130 g/t. The mean residence time for conditioning was 10 min for the depressant and around 20 min for the collector. After conditioning, the pulp was diluted to 20% solids by weight and fed in the rougher column. The froth obtained in the rougher fed the cleaner, and the sink fractions from rougher and cleaner were discharged as final tailings. Bubbles were generated with controlled pressure and flow via a forced air passage in a porous tube at the bottom of the 4” and 2” columns. The bubble generation of the 6” column flotation was through the recirculation of a portion of the pulp through a cavitation tube. The operational pressure on the cavitation was around 3.5 kgf/cm2. The pulp/froth interface was controlled by a level sensor that was connected to the tailings pump and the wash water and air flow rate were controlled by a flow meter. After reaching the stationary stage, samples of the rougher and cleaner tailings and cleaner concentrate were collected simultaneously for 2 min for mass and metallurgical balances. The samples were flocculated and dried in an oven for 24 h at 80 °C. Then, the samples were weighed, disaggregated, and separated in aliquots for chemical analysis by X-ray fluorescence spectroscopy to determine the metallurgical balance.
4. Results and Discussion
4.1. Desliming
The mass and oxide balance for the optimized desliming conditions for Sample 1 are shown in Table 2. The feed of the first desliming stage contained 8% solids by weight and produced an underflow with 16% solids by weight and an overflow with 2–3% solids by weight, which was discharged as final tailings. The mass and P2O5 recoveries of the underflow were 70% and 78%, respectively. The P2O5 grade increased from 13.3% at the feed to 14.3% in the underflow. The P2O5 in the overflow was 10.1%. The underflow of the first stage fed the second stage, which was carried out in the same hydrocyclone applied in the first stage with an apex finder of 5.5 mm and the operation pressure was regulated to 3 kgf/cm2. The solids content in the overflow of the second stage was 4–5%, the d50 was 5 μm, and the P2O5 grade was 11% and was discharged with the final tailings together with the overflow produced at the first stage. The solids content in the underflow of the second stage was 35–36%, the d50 was 18 μm, and the P2O5 grade was 16.4%. The mass and P2O5 recoveries at the second stage were very similar to the first stage, reaching 70% and 77%. The underflow obtained at the second stage fed the conditioning circuit and then the flotation circuit. Considering both stages, the overall mass recovery was around 50% and the P2O5 recovery was 60%. Regarding the SiO2 and Fe2O3 contaminants, it was observed that the iron impurities tended to decrease after desliming, as opposed to what was observed for the SiO2 content, which tended to increase after this process.
The results of the desliming stage for Sample 2 are shown in Table 3. The P2O5 content at the flotation feed (underflow of second stage) was quite similar to that obtained for Sample 1, assaying around 16%. Regarding the SiO2 and Fe2O3 impurities, a reduction of the iron bearing minerals content in the flotation feed was observed when compared to the feed sample, as observed in Sample 1. The SiO2 content in the flotation feed was almost the same as that in the feed process sample.
4.2. Flotation Studies
This topic presents the results and discussion of the apatite flotation studies considering rougher/cleaner flotation in 6”, 4”, and 2” columns. As mentioned before, one circuit consisted of the application of a 6” column for the rougher stage and a 4” column for the cleaner. The second circuit applied the 4” column for rougher flotation and a 2” column for the cleaner. The influence of collector and depressant dosages, wash water superficial velocity, pH, and air superficial velocity were evaluated on flotation separation parameters. The flotation recovery was calculated as a function of the hydrocyclone underflow (flotation feed).
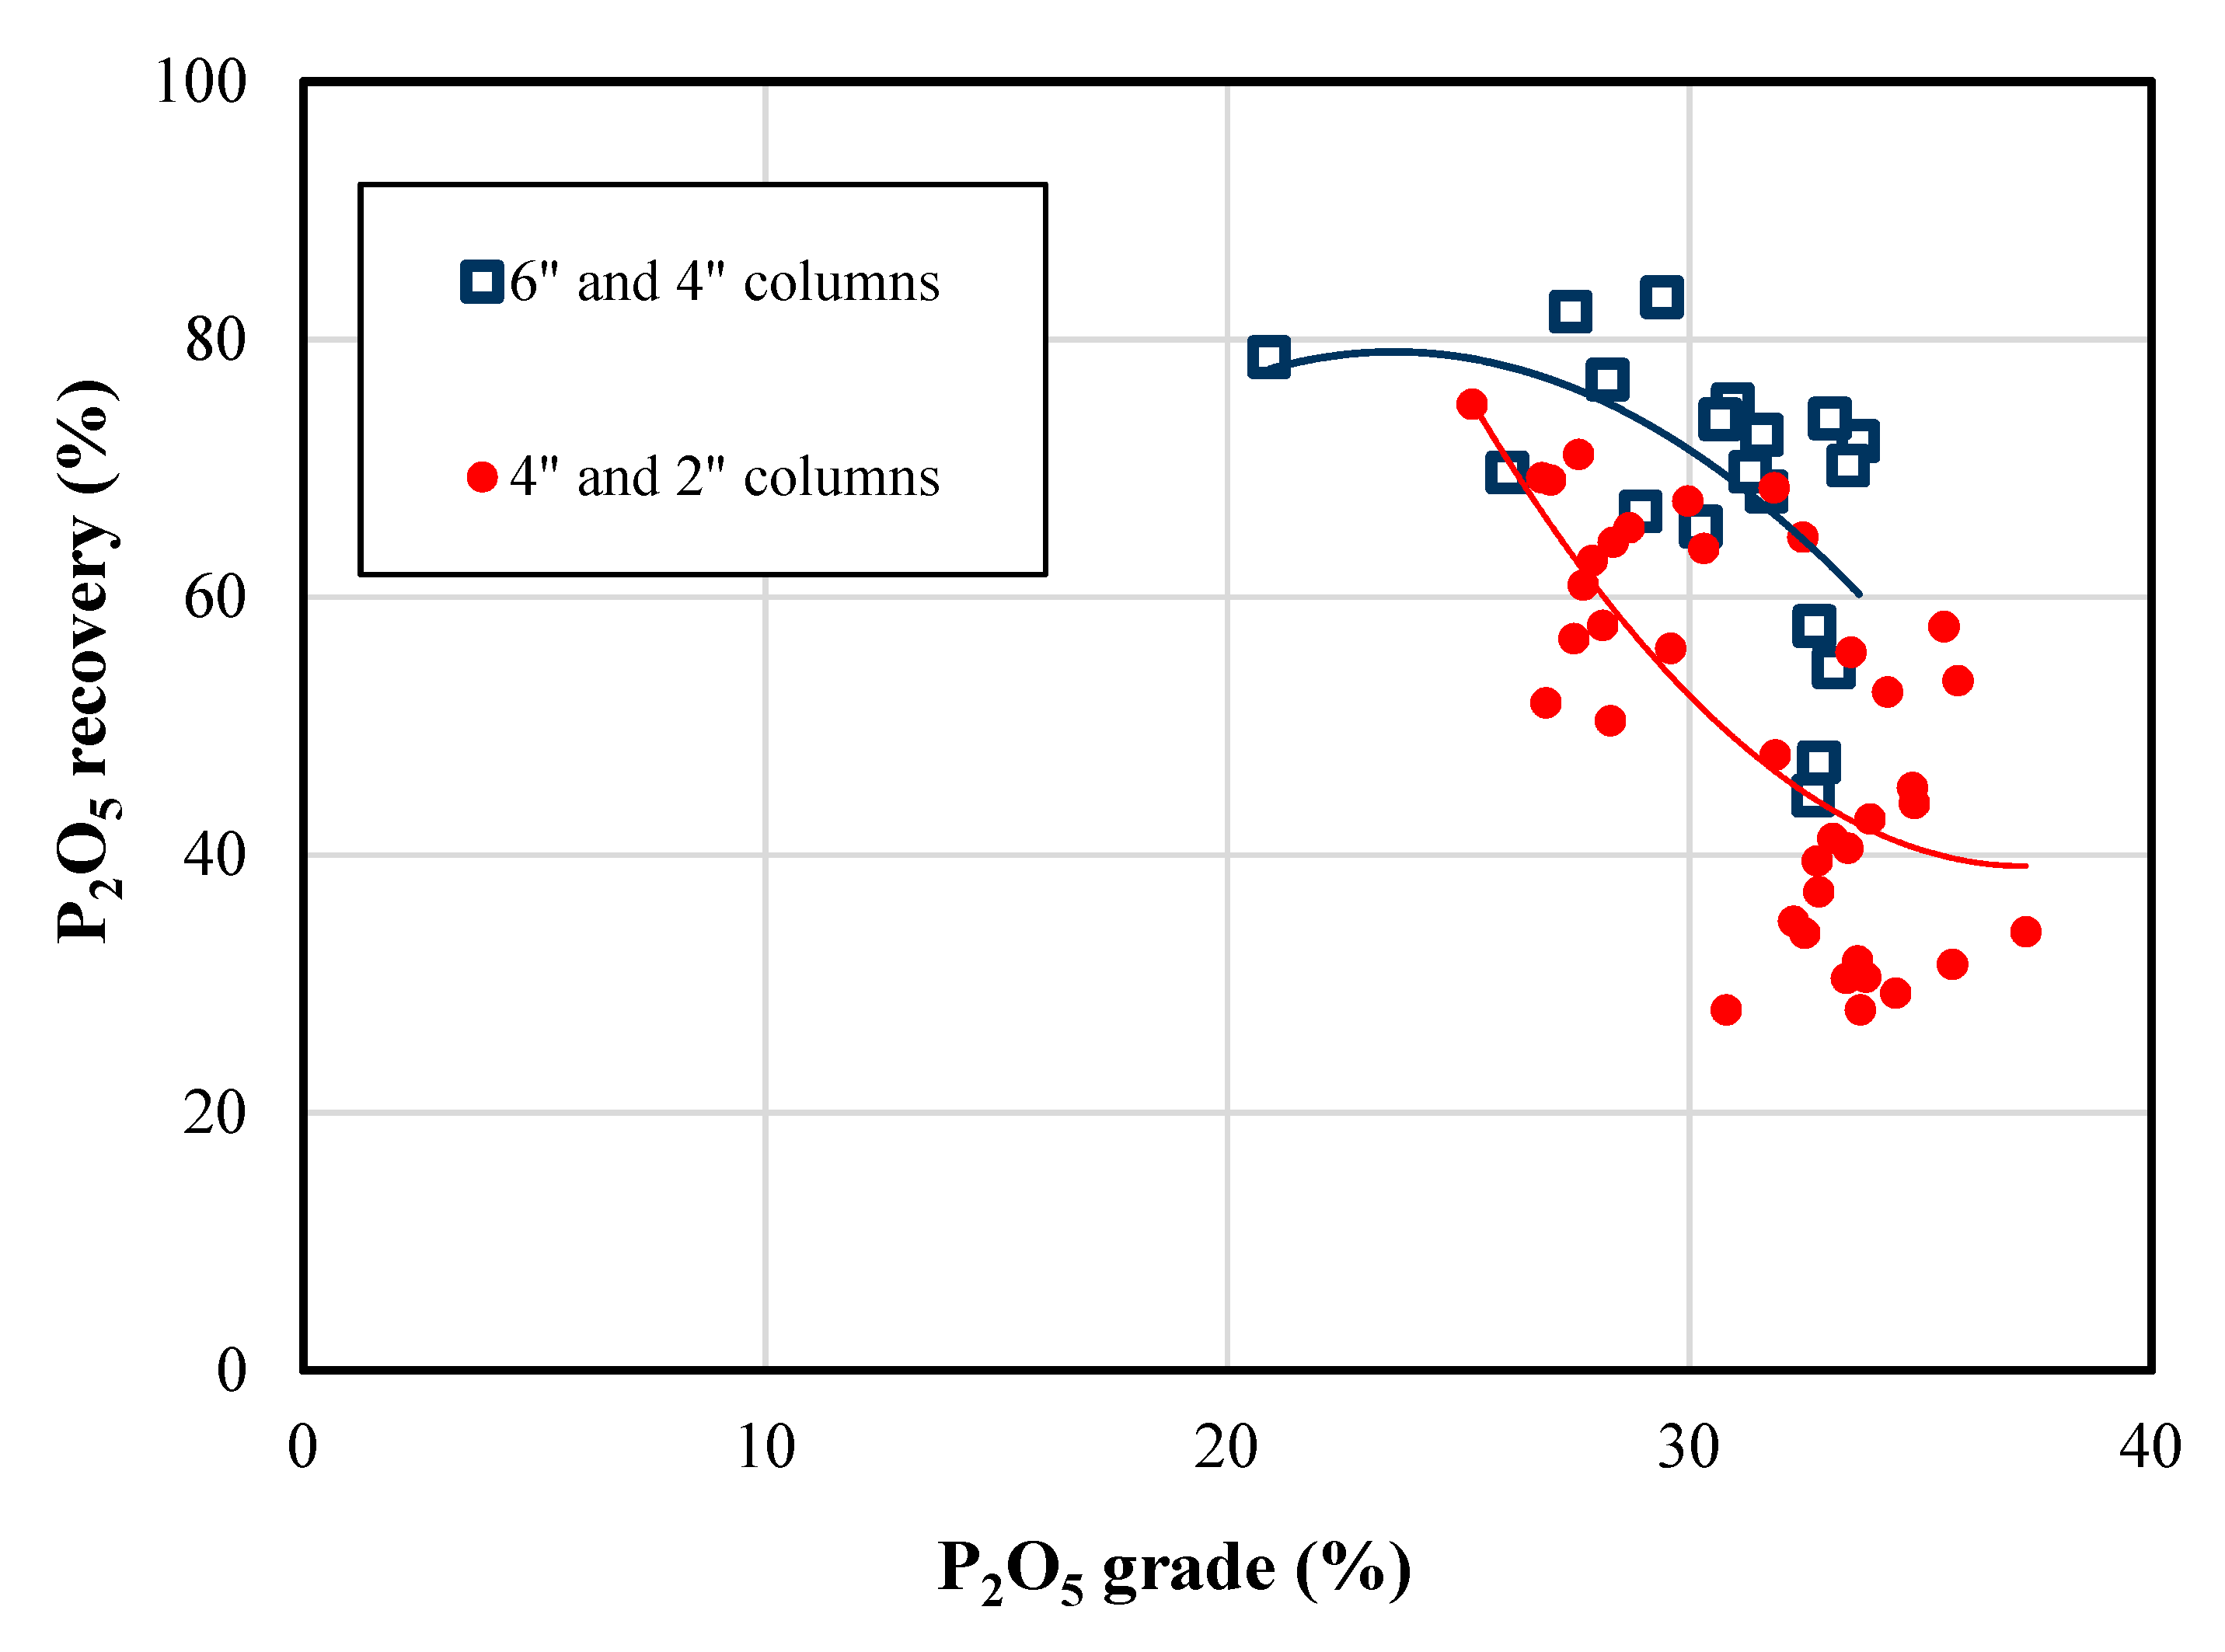
Figure 3 shows the curve of the P2O5 grade versus the recovery, considering apatite rougher/cleaner configuration for both circuits evaluated. As shown in the figure, the P2O5 recovery ranged from 80% to 25% with a P2O5 grade variation from 22% to almost 38%. In general terms, the flotation performance (grade and recovery) in the circuit with 6” and 4” columns was better compared to the circuit with 4” and 2” columns, especially for the P2O5 grade between 30% and 34%.
Figure 4a shows the comparative results for the P2O5 grade/recovery curve considering the rougher flotation in the 6” and 4” columns and for cleaner flotation considering the 4” and 2” columns (Figure 4b). The results for the circuit applied in the 6” and 4” columns were obtained with the flotation of Samples 1 and 2 and considering the Sample 1 flotation for the circuit with the 4” and 2” diameter columns. The performance (grade and recovery) of rougher flotation in the 6” diameter column was superior to the results obtained for the 4” diameter column. As it can be observed, the P2O5 recovery ranged from 90% to 40%, with a P2O5 grade variation from 17% to almost 34%. Furthermore, a linear relation between the P2O5 grade and losses was verified for the rougher tailings.
A fundamental difference between both columns is the fact that the bubble generator of the 6” column is a cavitation tube, while the bubble generator of the 4” column is a porous tube. Hydrodynamic cavitation to generate bubbles has been use to enhanced the flotation of fine and ultrafine particles [17,18,19]. Tao et al. [17] evaluated the effect of picobubble injection produced by the hydrodynamic cavitation principle in association with the conventional sized bubbles produced by a static mixer on the flotation response of fine coal particles. The results indicated that picobubbles significantly enhanced the coal flotation process with higher recovery and lower product ash. The flotation recovery increased by 10–30% depending on the process operating conditions. Zhou et al. [18] incorporated a cavitation tube in the feed line to a conventional flotation cell for the flotation of fine silica and ZnS precipitates (<5 µm). The results showed that there is a substantial increase in fine silica recovery for a given flotation period when using the cavitation tube (without added air). Additionally, a 40% increase in rate constant was obtained using a cavitation tube (1.3 mm nozzle diameter), even though the overall aeration was less (2.15 L/min compared to 3 L/min without the tube). This increase in the flotation rate constant again suggests that small bubbles generated by cavitation in the feed stream played a role in enhancing flotation kinetics.
As for cleaner flotation, it could be observed that the results obtained in the flotation with the 2” column showed a higher distribution compared to the results obtained for the 4” column. This can be explained by the fact that cleaner flotation in the 2” column had more process variables tested, focused on optimization of this stage, including changes in the superficial air velocity (Jg) and wash water (Jw), besides the reagents dosage variation. For the flotation in the 4” column as a cleaner, only the effect of the collector, depressant dosage, and pH were evaluated for Jg and the Jw kept fixed at 0.51 cm/s and 0.20 cm/s, respectively. The P2O5 losses on the cleaner flotation with the 4” column ranged from 2% to a maximum of 12%, considering the P2O5 grade variation from 9% to 25%. On the other hand, it could be observed that the cleaner flotation in the 2” column showed a much higher variation, especially for the P2O5 losses, which ranged from 10% to values up to 24% for the similar P2O5 content in the sink fraction.
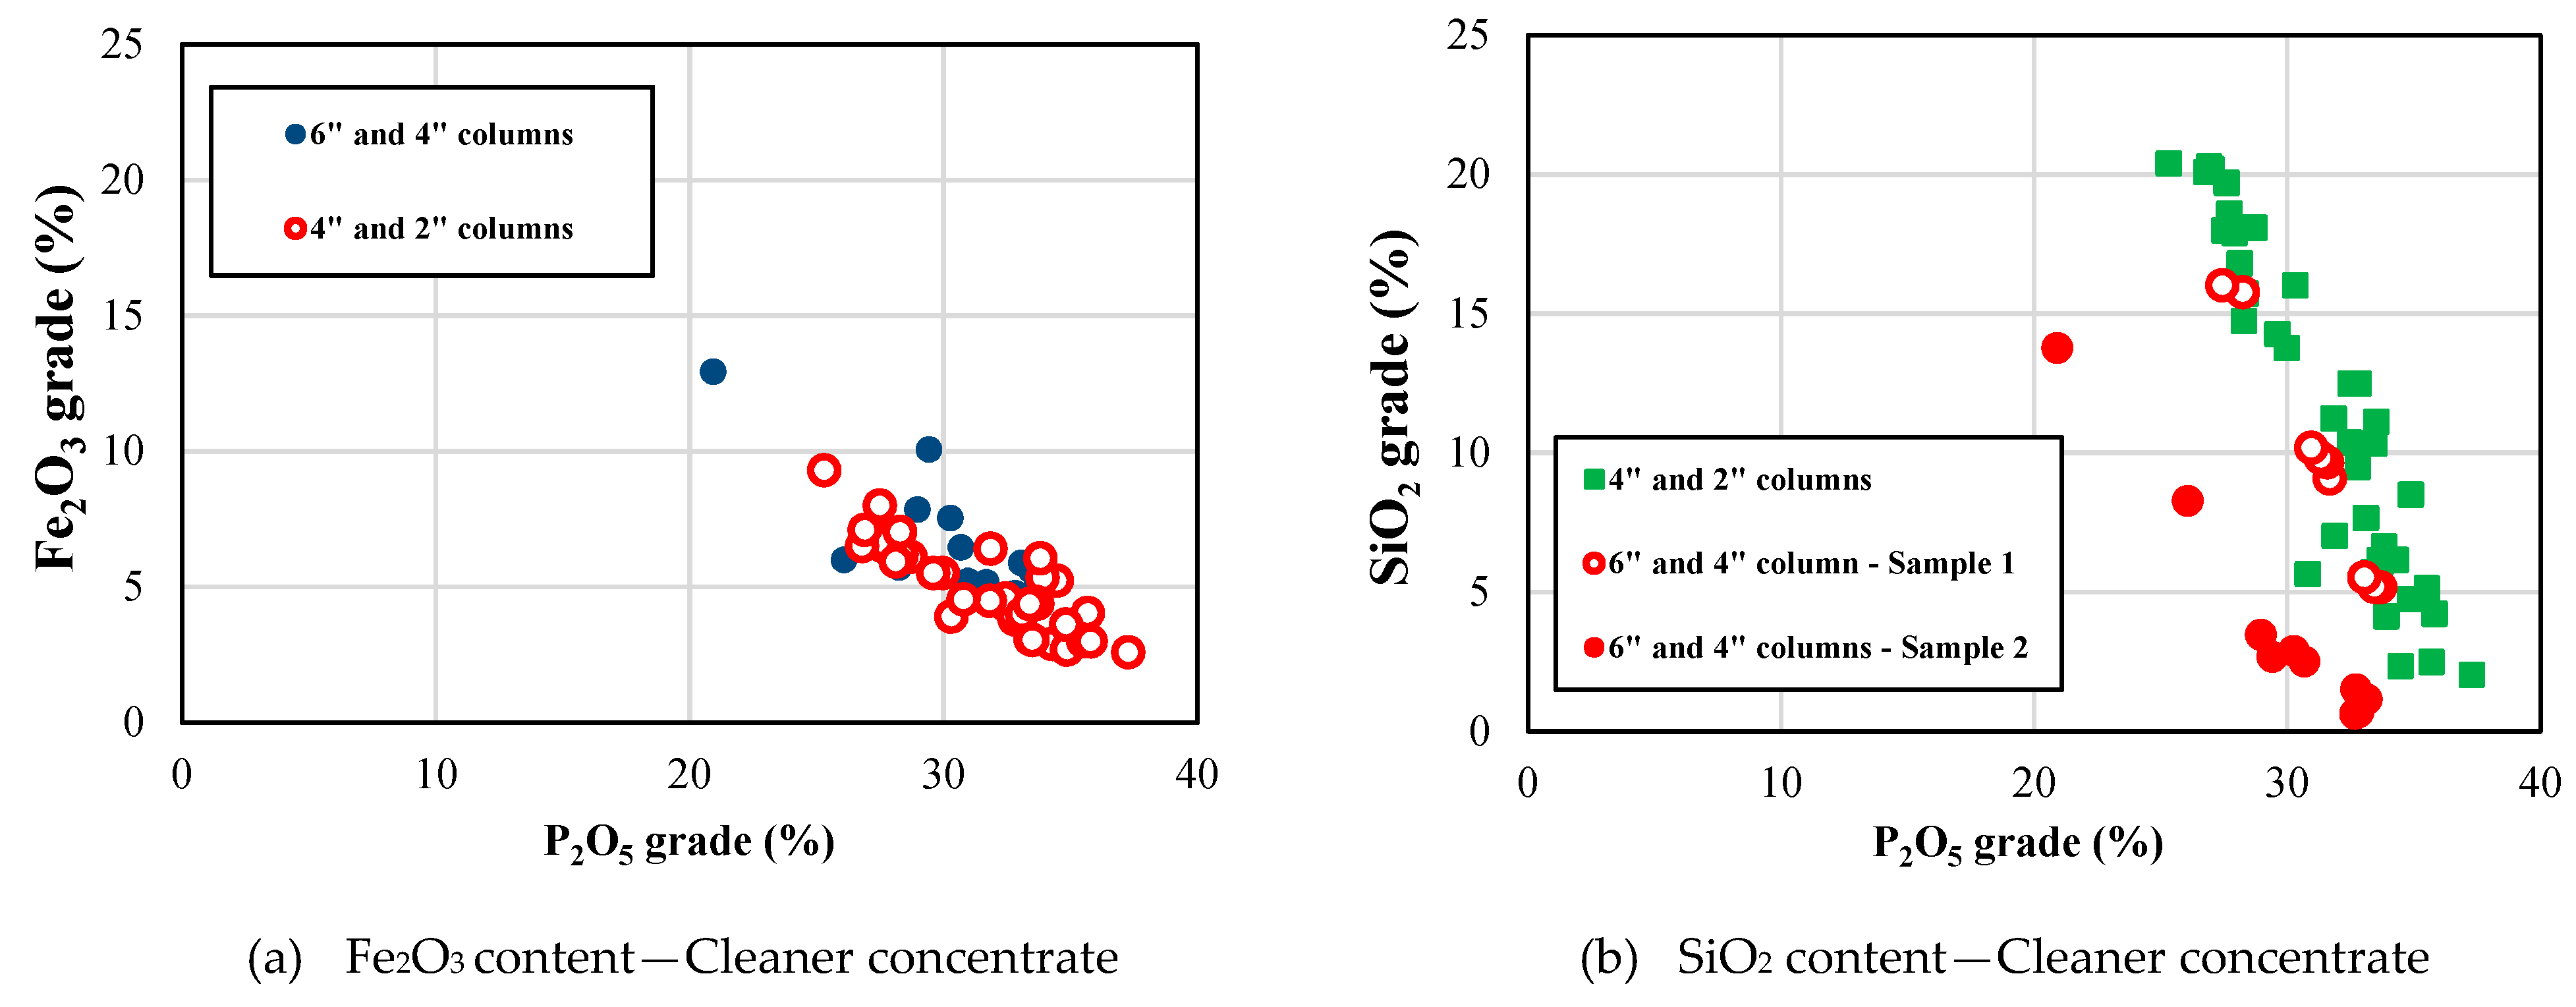
The relation between the P2O5 grade in the final apatite concentrate and the content of Fe2O3 and SiO2 impurities for both circuits evaluated are shown in Figure 5. The variation of the Fe2O3 content in the final apatite concentrate is very similar for both circuits and it is independent of the sample. The SiO2 content has the same trend observed for the iron impurities in Sample 1 for both circuits, whereas the SiO2 content in the final concentration of Sample 2 is significantly lower than that obtained for Sample 1. These results indicate that contamination of the apatite concentrate strongly depends on the ore characteristics that feed the plant and it is less influenced by the scale tested. As shown before, the SiO2 grade in Sample 2 is much lower when compared with Sample 1, unlike the iron content, which is quite similar in both samples.
A summary of the best results achieved using rougher/cleaner configuration for the circuit with the 4” and 2” columns is shown in Table 4 for the flotation studies with Sample 1. Considering the average results for the three tests, mass recovery was around 23% and P2O5 recovery and grade were 54% and 35.2%, respectively. The SiO2 and Fe2O3 impurities levels were 3.0% and 5.2%. Reagent consumptions were 117 g/t to the collector, around 2700 g/t to the depressant, and 410 g/t to NaOH and the pulp pH was fixed at 9.7.
Table 5 shows the effect of pulp pH variation, for the values 9.7 and 10.8, on the flotation performance for the experiments using the 6” and 4” columns in rougher/cleaner configuration in experiments with Sample 1. The collector dosage was 130 g/t and the depressant was 2900 g/t. It can be observed that a reduction of the pulp pH from 10.8 to 9.7 decreases the P2O5 content in the concentrate, going from 33.4% to 31.4%. The reason for the dilution of the concentrate is exclusively caused by the increase of the SiO2 from 5.3% to values around 10%, since the iron content is virtually the same. The increase in mass recovery, from 34.6% to 36.9% with the decrease of the pH value, is due the increase in the SiO2 content once the P2O5 recovery is almost the same for both pH values evaluated, reaching 72%.
Flotation results for Sample 2 in the experiments carried, out with the 6” and 4” columns, are shown in Table 6. The average collector dosage for the four tests was around 80 g/t and the depressant was 2600 g/t at the pulp pH of 9.7. The average mass and P2O5 recovery were 27% and 51% for a P2O5 grade of 32.8%. Compared to the results obtained from Sample 1, the SiO2 content in the final concentrate was much lower in the experiments with Sample 2, reaching an average grade of 1.0%. On the other hand, the iron content is very similar for both samples. The lower SiO2 content reached in the concentrate of Sample 2 can be explained by the lower grade in the slime feed sample that was analyzed at 12.5%, compared with the 19.7% of Sample 1.
Regarding the reagent consumption (collector and depressant), it was observed that the average collector dosage is similar to the levels applied at the industrial scale in Brazilian plants. On the other hand, the depressant dosage is much higher, reaching values up to 2500 g/t. Usually, the depressant dosage does not exceed 1200–1300 g/t. Matiolo et al [15] evaluated the depressant dosage on apatite flotation from slimes. The results indicated that both parameters (P2O5 grade and recovery) improve when the depressant dosage increases from 1230 g/t to values reaching higher than 1700 g/t. It was also found that to control the iron impurities in the final flotation concentrate, the depressant dosage must be up 2200 g/t to a maximum of 3000 g/t.
A similar approach to that evaluated in this study of recovering the valuable fine phosphate particles (<45 μm) from their slimes through the application of the column flotation technique was tested by Abdel-Khalek [20]. Tests were performed using oleic acid as a collector for the phosphate minerals and sodium silicate as a depressant for their associated gangues. The main operating parameters affecting the performance of column flotation were investigated. The results indicate that the best operating conditions for column flotation of phosphate slimes are as follows: A superficial gas velocity of 0.84 cm/s, a frother concentration of 0.1 kg/ton, a column height of 230.5 cm, and a superficial water velocity of 2.2 cm/s. Under these conditions, a product assaying 25.3% P2O5 and 14.64% I.R. (insoluble residue), with a P2O5 recovery of about 51.52%, is obtained from a feed containing 18.26% P2O5 and 24.03% I.R. Such grades and recoveries are not obtained by applying the conventional froth flotation technique, even after cleaning the rougher concentrate. Recovery of more than 50% of phosphate from disposed slimes will improve the economic viability of the beneficiation process for phosphate ores. It will also help to solve the environmental problems associated with the disposal of these slimes.
5. Conclusions
It was possible to obtain apatite concentrates from two different slime samples with P2O5 grades higher than 33%, which can be applied to SSP (single superphosphate) and TSP (triple superphosphate) production. Considering desliming and flotation, the overall mass recovery ranged from 9% to 12% and P2O5 recovery ranged between 29–42%. It is estimated that the earnings obtained by recovery of the apatite from slimes may represent an increase in 4% of the overall P2O5 recovery at industrial plants. The results obtained in this study indicate that the flotation results were better in the circuits with higher column flotation (6” and 4”). The results can be explained by the application of a cavitation tube in the rougher stage in the 6” column. The improved flotation performance can be attributed to increased probabilities of collision and attachment and the reduced probability of detachment by the small size bubbles generated by the cavitation tube in comparison to the bubbles produced by the porous tube of the 4” column flotation.
Author Contributions
Conceptualization, E.M., H.J.B.C and M.F.d.L.T; methodology, E.M., H.J.B.C and M.F.d.L.T.; formal analysis, E.M., H.J.B.C., M.F.d.L.T., R.N.d.A and A.S.d.F; investigation, E.M., H.J.B.C., M.F.d.L.T., R.N.d.A and A.S.d.F; resources, E.M., H.J.B.C. and M.F.d.L.T; data curation, E.M., H.J.B.C., M.F.d.L.T., R.N.d.A and A.S.d.F; writing—original draft preparation, E.M., H.J.B.C. and A.S.d.F; writing—review and editing, E.M., H.J.B.C., M.F.d.L.T., R.N.d.A and A.S.d.F; visualization, E.M., H.J.B.C., M.F.d.L.T., R.N.d.A and A.S.d.F; supervision, E.M., H.J.B.C., and M.F.d.L.T.; project administration, E.M., and M.F.d.L.T.,; funding acquisition, E.M., and M.F.d.L.T.
Funding
This research received no external funding.
Acknowledgments
The authors would like to thank the Brazilian Institutes supporting this research, namely CNPq for the scholarship to Amanda and Renata, and CETEM/MCTIC for the infrastructure. A special thanks to Copebras (CMOC International) for the financial support and permission to publish this work, and to process technician, Fabio Novaes, for his support during the experimental work.
Conflicts of Interest
The authors declare no conflict of interest.
References
- Houot, R. Beneficiation of phosphatic ores through flotation: Review of industrial applications and potential developments. Int. J. Miner. Process. 1982, 9, 353–384. [Google Scholar] [CrossRef]
- Dong, X.; Liu, S.; Yao, Y.; Liu, H.; Pei, Y. A review of new technological progress for benefication of refractory phosphate ore in China. IOP Conf. Ser.: Earth Environ. Sci. 2017, 63, 1–6. [Google Scholar]
- Pourkarimi, Z.; Rezai, B.; Noaparast, M. Nanobubbles effect on the mechanical flotation of phosphate ore fine particles. Physicochem. Probl. Miner. Process. 2018, 54, 278–292. [Google Scholar]
- Huynh, L.; Feiler, A.; Michelmore, A.; Ralston, J.; Jenkins, P. Control of slime coatings by the use of anionic phosphates: A fundamental study. Min. Eng. 2000, 13, 1050–1069. [Google Scholar] [CrossRef]
- Ahmed, H.A.M. Optimization of desliming prior to phosphate ore upgrading flotation. Phys. Probl. Min. Proc. 2007, 41, 79–88. [Google Scholar]
- Teague, A.J.; Lollback, M.C. The beneficiation of ultrafine phosphate. Min. Eng. 2012, 27–28, 52–59. [Google Scholar] [CrossRef]
- Al-Thyabat, S. Evaluation of mechanical flotation of non-slimed Jordanian siliceous phosphate. Arab. J. Sci. Eng. 2012, 31, 877–887. [Google Scholar] [CrossRef]
- Zhang, P.; Bogan, M. Recovery of phosphate from Florida beneficiation slimes I. Re-identifying the problem. Min. Eng. 1995, 8, 523–534. [Google Scholar] [CrossRef]
- Pradip, R.S.; Sankar, T.A.P. Selective flotation of Maton (India) phosphate ore slimes with particular reference to the effects of particle size. Internet J. Min. Proc. 1992, 36, 283–293. [Google Scholar]
- Al-Thyabat, S.; Yoon, R.H.; Shin, D. Floatability of fine phosphate in a batch column flotation cell. Min. Metal. Proc. 2011, 28, 1110–1116. [Google Scholar] [CrossRef]
- Liu, X.; Zhang, Y.; Liu, T.; Cai, Z.; Sun, K. Characterization and separation studies of fine sedimentary phosphate ore slime. Minerals 2017, 7, 94. [Google Scholar] [CrossRef]
- Guimarães, R.C.; Peres, A.E.C. Industrial practice of phosphate ore flotation at Serrana-Araxá, Brazil. In Proceedings of the XXI International Mineral Processing Congress, Rome, Italy, 23–27 July 2000. B9-17. [Google Scholar]
- Guimarães, R.C.; Peres, A.E.C. Experiência brasileira de produção de concentrado fosfático a partir de lamas. In Proceedings of the XIX Encontro Nacional de Tratamento de Minérios e Metalurgia Extrativa, Recife, Brasil, 26–29 November 2002; Volume I, pp. 247–253. (In Portuguese). [Google Scholar]
- Guimarães, R.C.; Peres, A.E.C. Production of phosphate concentrates from slimes: Brazilian experience. In Proceedings of the XXII International Mineral Processing Congress, Cape-Town, South Africa, 29 September–3 October 2003; pp. 606–612. [Google Scholar]
- Matiolo, E.; Couto, H.J.B.; Teixeira, M.F.L.; Freitas, A.S.; Almeida, R.N. Recovery of apatite from slimes of a Brazilian phosphate ore. J. Wuhan Inst. Technol. 2017, 39, 39–48. [Google Scholar]
- Ipek, H.; Ozdag, H. An investigation into the enrichment of phosphate slime by column flotation. Dev. Miner. Process. 2000, 13, C8a-1–C8a-5. [Google Scholar]
- Tao, Y.; Liu, J.; Yu, S.; Tao, D. Picobubble enhanced fine coal. Sep. Sci. Technol. 2006, 41, 3597–3607. [Google Scholar] [CrossRef]
- Zhou, Z.A.; Xu, Z.; Fich, J.A.; Hu, H.; Rao, S.R. Role of hydrodynamic cavitation in fine particle flotation. Int. J. Miner. Process. 1997, 51, 139–149. [Google Scholar] [CrossRef]
- Zhou, Z.A.; Xu, Z.; Finch, J.A.; Masliyah, J.H.; Chow, R.S. On the role of cavitation in particle collection in flotation—A critical review. II. Min. Eng. 2009, 22, 419–433. [Google Scholar] [CrossRef]
- Abdel-Khalek, N.A.; Hassan, F.; Arafa, M.A. Separation of valuable fine phosphate particles from their slimes by column flotation. Sep. Sci. Tech. 2000, 35, 1077–1086. [Google Scholar] [CrossRef]
Figure 1.
Apparatus for the desliming operation.
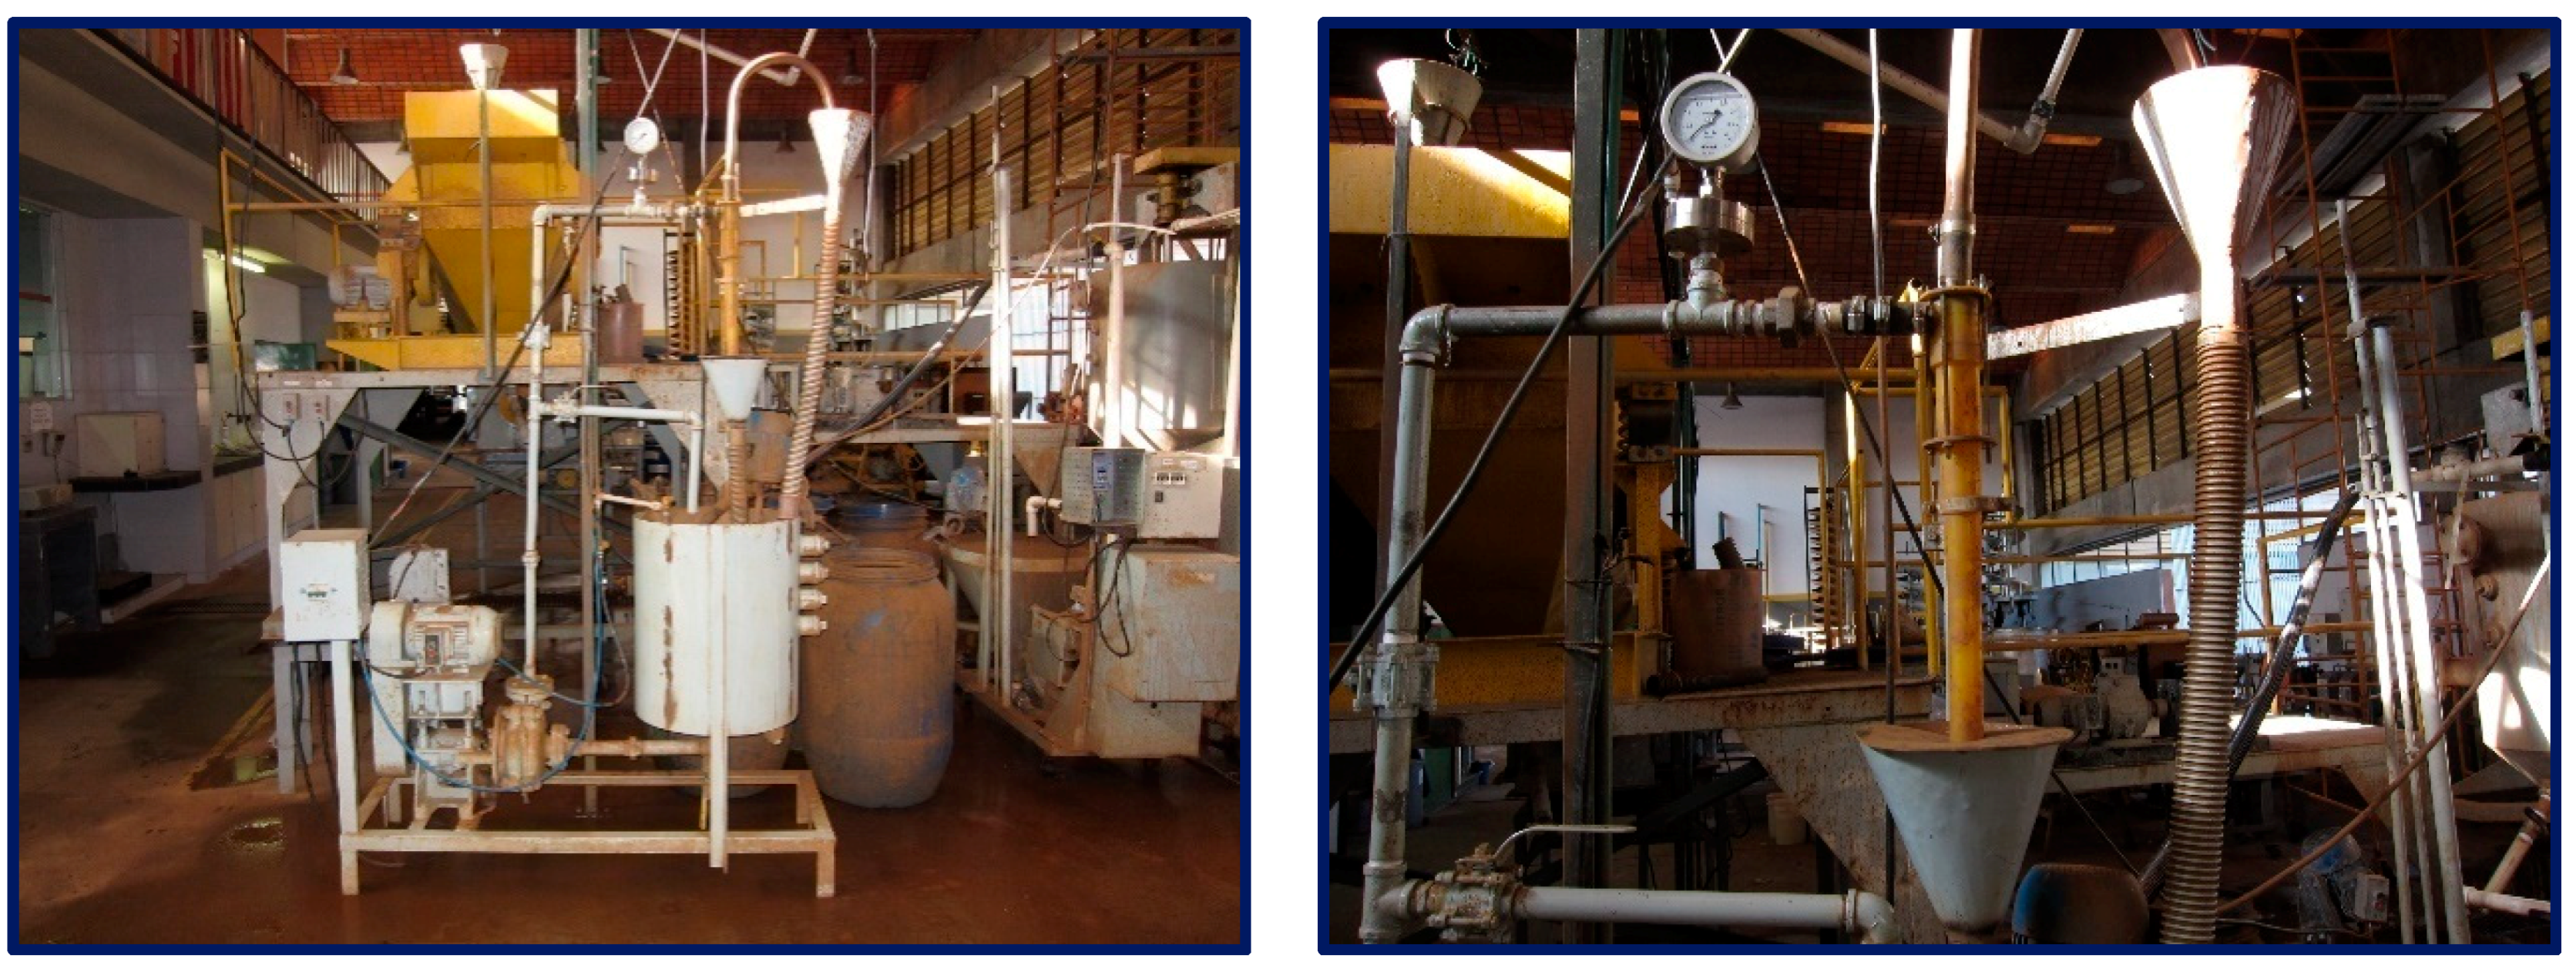
Figure 2.
Schematic flowsheet for the apatite concentration from (a) the slime samples and photo from (b) the column flotation units.
Figure 2.
Schematic flowsheet for the apatite concentration from (a) the slime samples and photo from (b) the column flotation units.
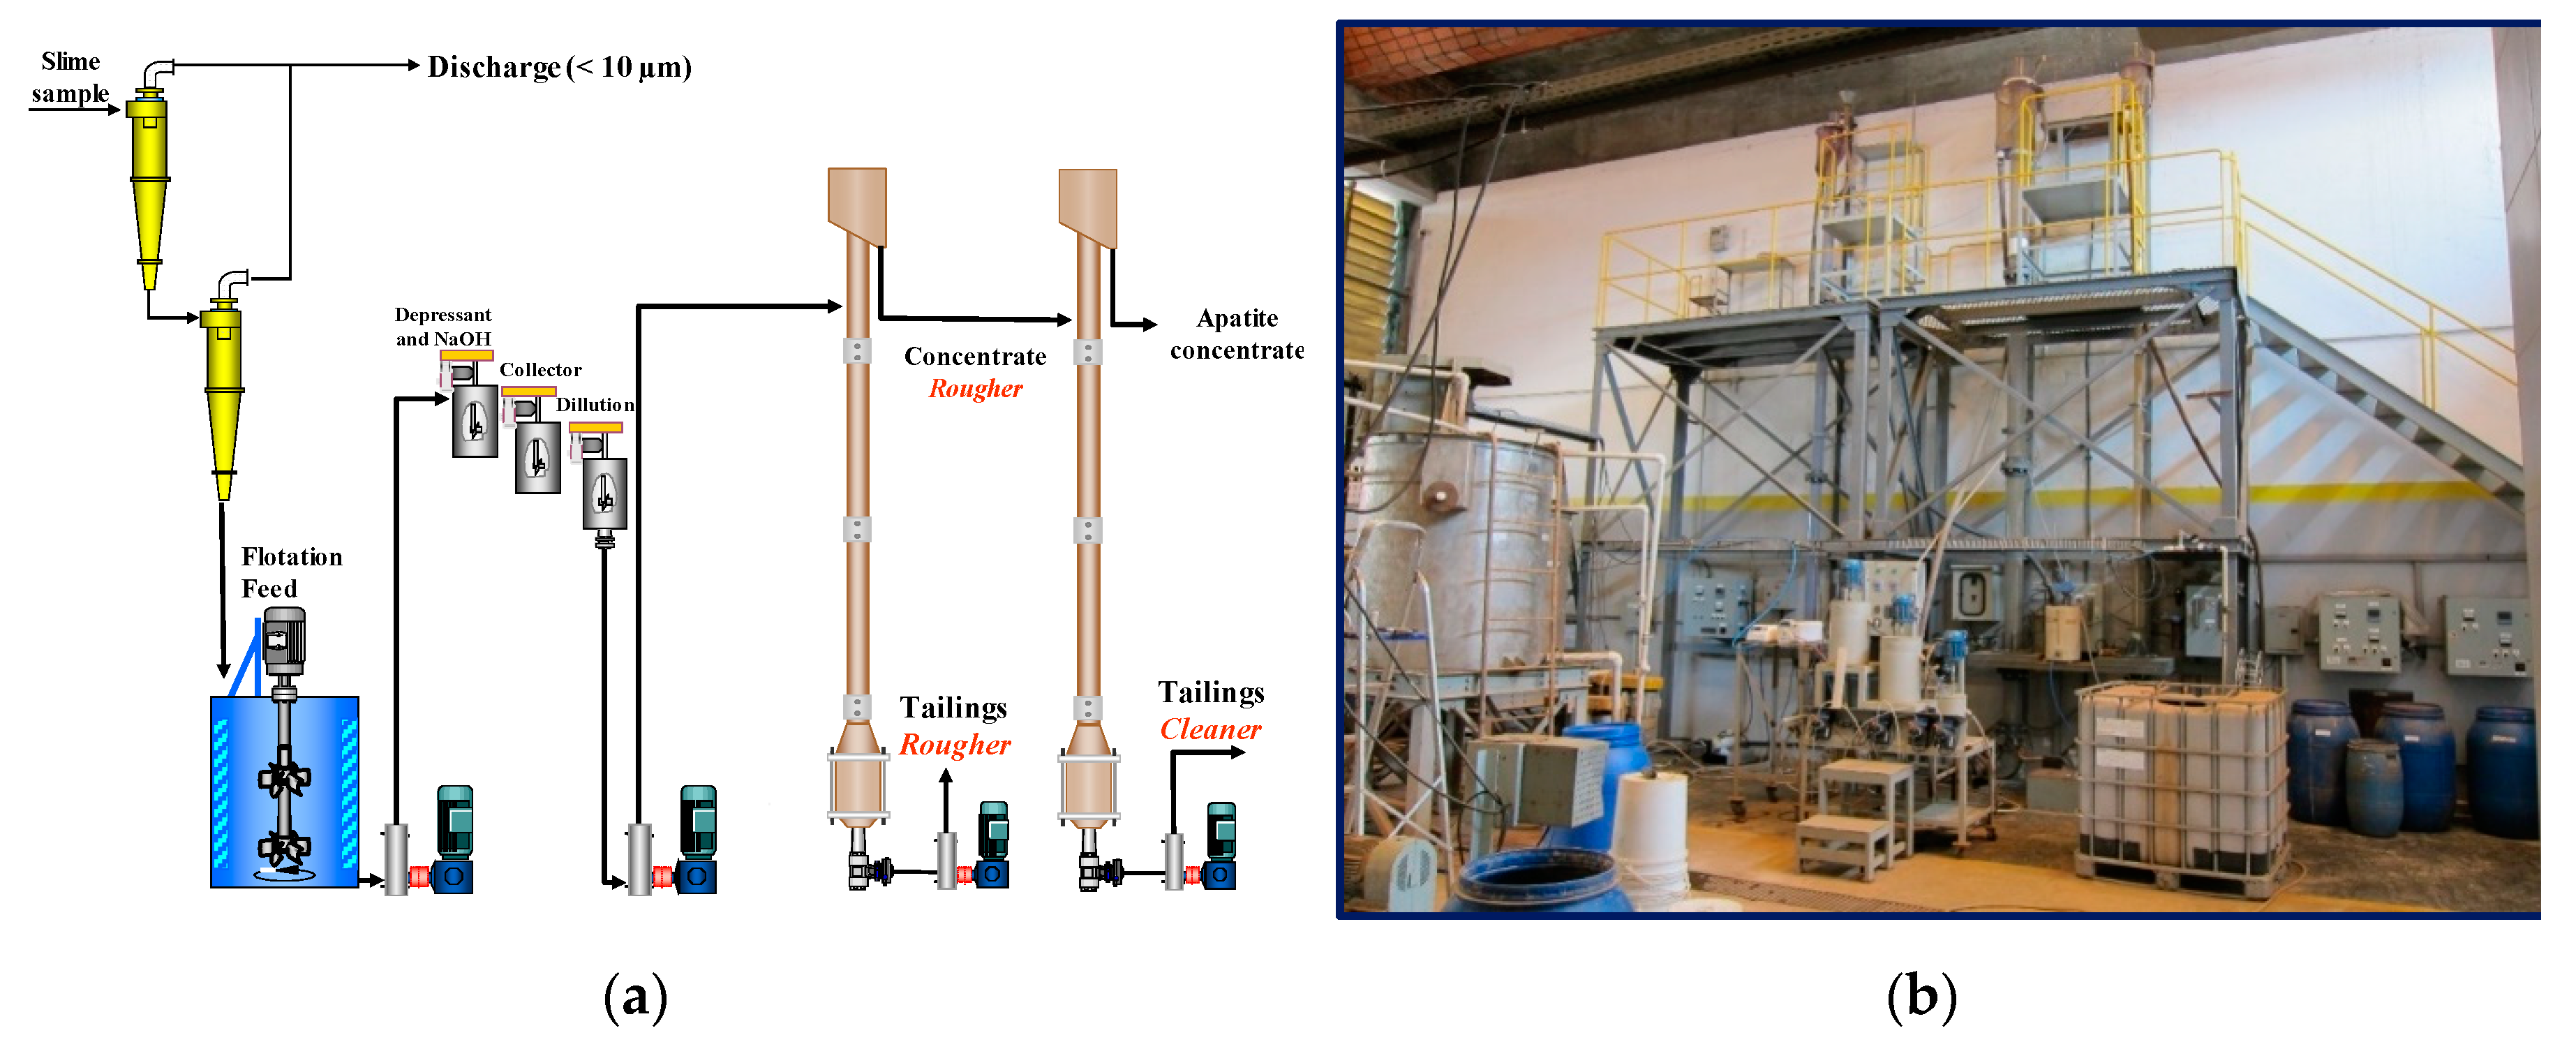
Figure 3.
P2O5 grade/recovery curves for rougher/cleaner flotation. Comparative results of the circuit with 6” and 4” and 4” and 2” column flotation.
Figure 3.
P2O5 grade/recovery curves for rougher/cleaner flotation. Comparative results of the circuit with 6” and 4” and 4” and 2” column flotation.
Figure 4.
P2O5 grade/recovery curves for rougher (a) and cleaner (b) stages. Comparative results for rougher flotation in 6” and 4” column flotation and for cleaner flotation in 4” and 2” column flotation.
Figure 4.
P2O5 grade/recovery curves for rougher (a) and cleaner (b) stages. Comparative results for rougher flotation in 6” and 4” column flotation and for cleaner flotation in 4” and 2” column flotation.
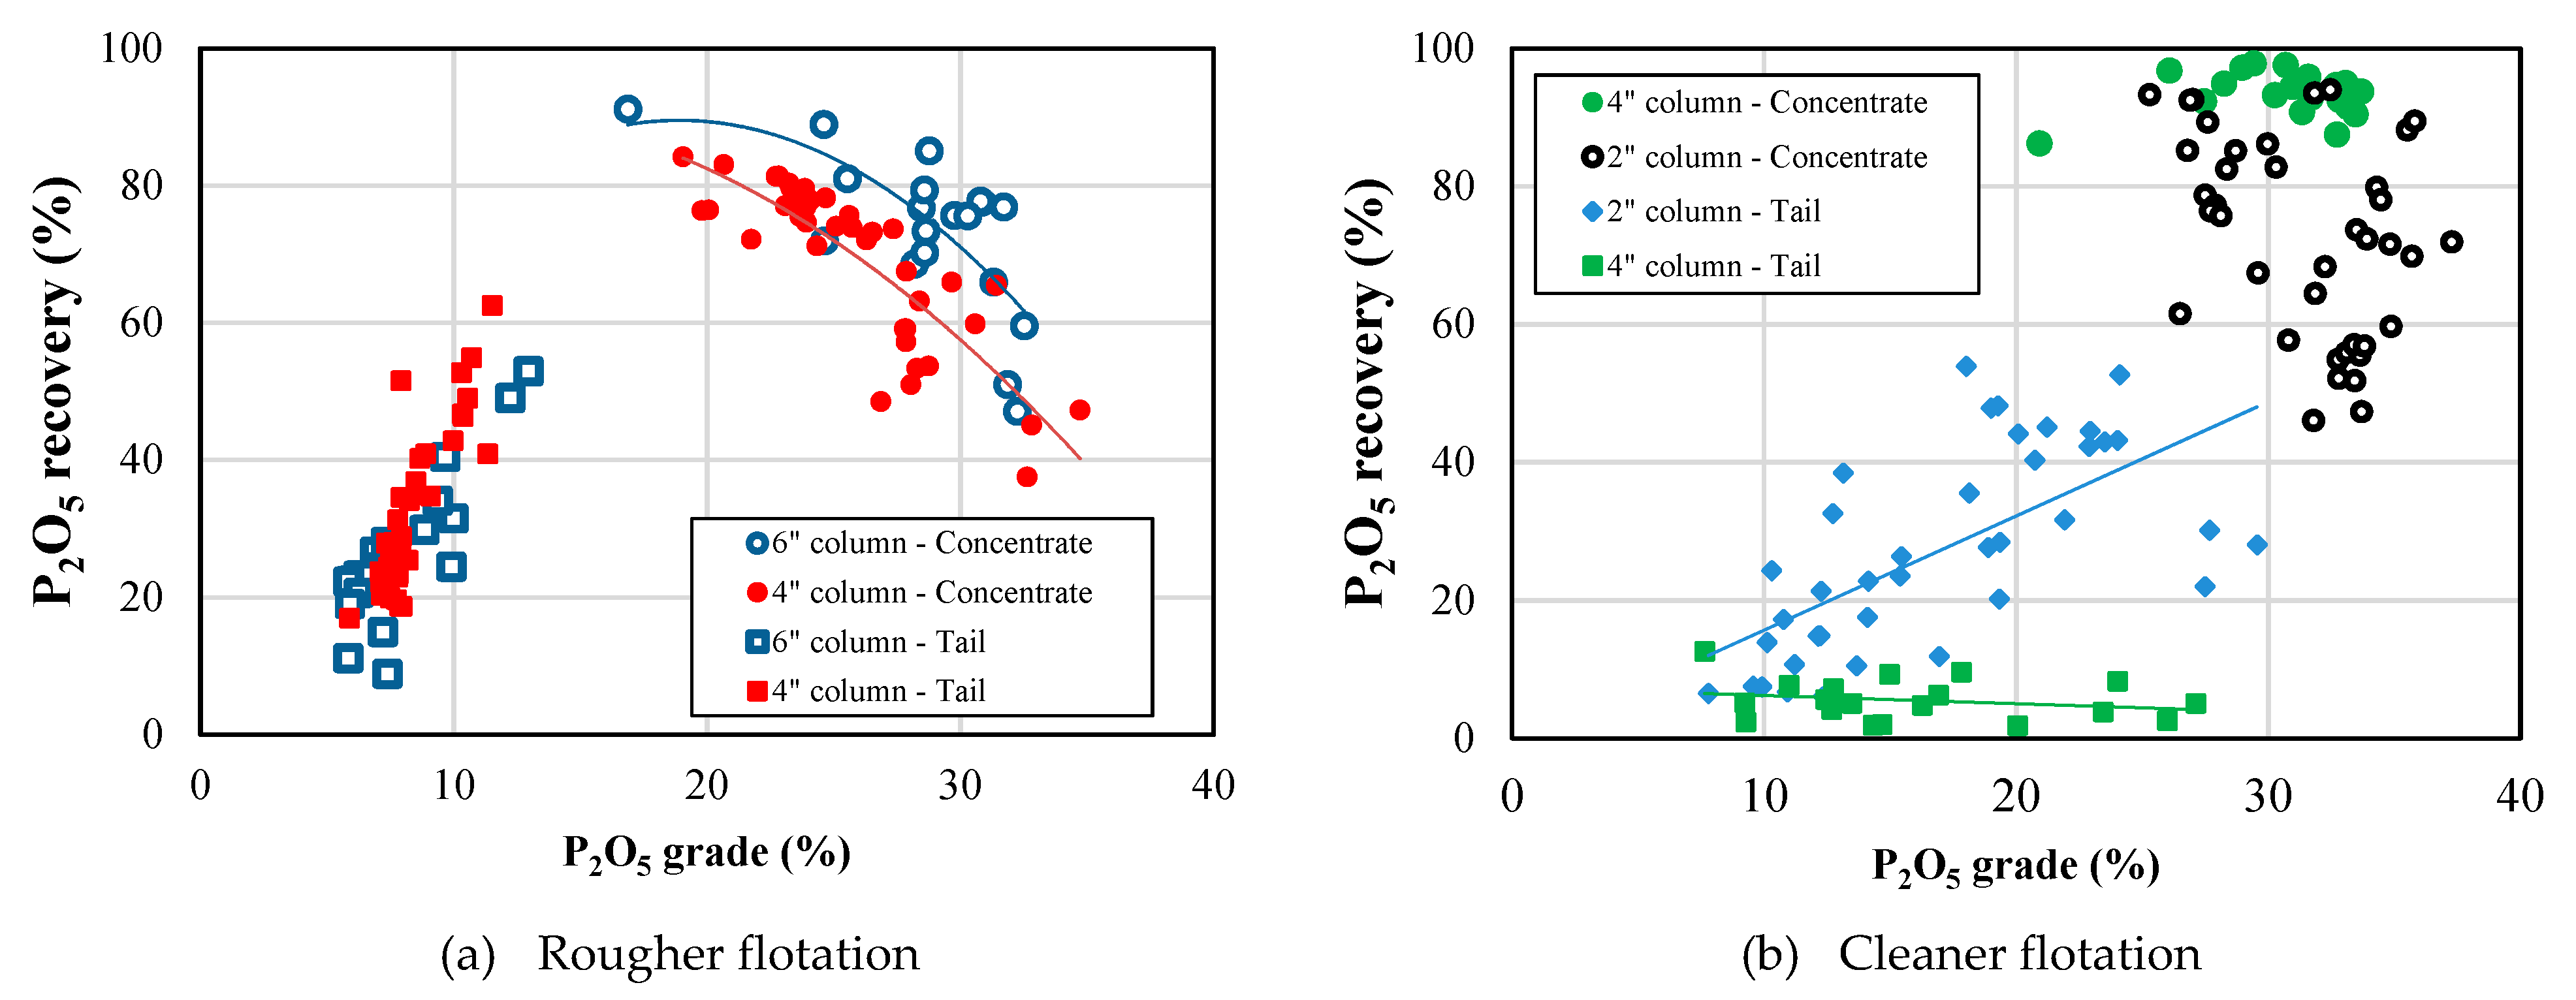
Figure 5.
Relation between the P2O5 grade and Fe2O3 (a) and SiO2 (b) impurities in the final apatite concentrate for both circuits. Flotation studies with Samples 1 and 2.
Figure 5.
Relation between the P2O5 grade and Fe2O3 (a) and SiO2 (b) impurities in the final apatite concentrate for both circuits. Flotation studies with Samples 1 and 2.

Table 1.
Chemical analysis of the slime samples.
| Sample | Al2O3 | BaO | CaO | Fe2O3 | MgO | P2O5 | SiO2 | Nb2O5 | CaO/P2O5 |
|---|---|---|---|---|---|---|---|---|---|
| 1 | 3.9 | 1.2 | 14.0 | 27.7 | 2.4 | 13.3 | 19.7 | 0.62 | 1.05 |
| 2 | 2.8 | 1.6 | 16.5 | 30.0 | 1.0 | 14.0 | 12.5 | 0.89 | 1.18 |
Table 2.
Metallurgical and mass balance of the desliming stage (Sample 1).
| Stage | Stream | Mass Rec (%) | Grade (%) | Distribution (%) | ||||||||||
|---|---|---|---|---|---|---|---|---|---|---|---|---|---|---|
| Al2O3 | CaO | Fe2O3 | MgO | P2O5 | SiO2 | Al2O3 | CaO | Fe2O3 | MgO | P2O5 | SiO2 | |||
| 1 | Over | 29.9 | 4.5 | 9.9 | 33.9 | 2.3 | 10.1 | 16.5 | 35.4 | 21.4 | 36.9 | 29.0 | 23.1 | 25.3 |
| Under | 70.1 | 3.5 | 15.5 | 24.7 | 2.4 | 14.3 | 20.7 | 64.5 | 78.5 | 63.0 | 70.9 | 76.8 | 74.6 | |
| 2 | Over | 29.8 | 4.4 | 11.5 | 31.1 | 2.5 | 11.3 | 17.3 | 37.5 | 21.3 | 40.0 | 31.5 | 22.5 | 24.0 |
| Under | 70.2 | 3.1 | 17.9 | 19.7 | 2.3 | 16.4 | 23.2 | 62.4 | 78.6 | 59.9 | 68.4 | 77.4 | 76.0 | |
| Feed | 100 | 3.8 | 13.8 | 27.4 | 2.4 | 13.0 | 19.4 | 100 | 100 | 100 | 100 | 100 | 100 | |
Table 3.
Metallurgical and mass balance of the desliming stage (Sample 2).
| Stage | Stream | Mass Rec (%) | Grade (%) | Distribution (%) | ||||||||||
|---|---|---|---|---|---|---|---|---|---|---|---|---|---|---|
| Al2O3 | CaO | Fe2O3 | MgO | P2O5 | SiO2 | Al2O3 | CaO | Fe2O3 | MgO | P2O5 | SiO2 | |||
| 1 | Over | 43.2 | 3.7 | 12.9 | 35.3 | 1.2 | 11.5 | 12.3 | 58.4 | 33.9 | 51.4 | 43.1 | 34.8 | 42.6 |
| Under | 56.8 | 2.0 | 19.2 | 25.5 | 1.2 | 16.4 | 12.6 | 41.6 | 66.1 | 48.6 | 56.9 | 65.2 | 57.4 | |
| 2 | Over | 15.0 | 2.8 | 10.9 | 28.8 | 1.1 | 12.7 | 10.5 | 20.3 | 8.9 | 17.9 | 13.5 | 11.7 | 12.0 |
| Under | 85.0 | 1.9 | 19.8 | 23.4 | 1.2 | 16.9 | 13.3 | 79.7 | 91.1 | 82.1 | 86.5 | 88.3 | 88.0 | |
| Feed | 100 | 2.7 | 16.5 | 29.7 | 1.2 | 14.3 | 12.5 | 100 | 100 | 100 | 100 | 100 | 100 | |
Table 4.
Summary of the best results obtained in experiments at 4” and 2” column flotation. Rougher/cleaner. Feed solids rate: 35 kg/h; pH = 9.7. Flotation studies with Sample 1.
Table 4.
Summary of the best results obtained in experiments at 4” and 2” column flotation. Rougher/cleaner. Feed solids rate: 35 kg/h; pH = 9.7. Flotation studies with Sample 1.
| Test | Recovery (%) | Grade (%) | Consumption (g/t) | ||||
|---|---|---|---|---|---|---|---|
| Mass | P2O5 | P2O5 | Fe2O3 | SiO2 | Collector | Depressant | |
| 1 | 24.2 | 52.7 | 34.3 | 2.9 | 6.2 | 123 | 2353 |
| 2 | 25.3 | 57.7 | 35.5 | 3.0 | 5.1 | 116 | 2737 |
| 3 | 22.7 | 53.5 | 35.8 | 3.0 | 4.2 | 113 | 3259 |
| Average | 24.1 | 54.6 | 35.2 | 3.0 | 5.2 | 117 | 2783 |
Table 5.
Effect of pH variation on the flotation performance for experiments at 6” and 4” column flotation. Rougher/cleaner. Feed solids rate: 45 kg/h. Flotation studies with sample 1.
Table 5.
Effect of pH variation on the flotation performance for experiments at 6” and 4” column flotation. Rougher/cleaner. Feed solids rate: 45 kg/h. Flotation studies with sample 1.
| Test | Recovery (%) | Grade (%) | Consumption (g/t) | |||||
|---|---|---|---|---|---|---|---|---|
| Mass | P2O5 | P2O5 | Fe2O3 | SiO2 | pH | Collector | Depressant | |
| 1 | 35.0 | 72.1 | 33.7 | 5.2 | 5.2 | 10.8 | 132 | 3004 |
| 2 | 33.5 | 70.2 | 33.5 | 5.6 | 5.2 | 127 | 2905 | |
| 3 | 35.3 | 73.8 | 33.1 | 5.9 | 5.5 | 129 | 2947 | |
| Average | 34.6 | 72.0 | 33.4 | 5.6 | 5.3 | 129 | 2952 | |
| 1 | 33.5 | 68.2 | 31.7 | 5.2 | 9.1 | 9.7 | 123 | 2815 |
| 2 | 37.9 | 72.6 | 31.6 | 4.9 | 9.7 | 125 | 2844 | |
| 3 | 36.2 | 69.7 | 31.3 | 5.1 | 9.8 | 133 | 3029 | |
| 4 | 39.9 | 74.9 | 31.0 | 5.2 | 10.2 | 130 | 2959 | |
| Average | 36.9 | 71.3 | 31.4 | 5.1 | 9.7 | 127 | 2911 | |
Table 6.
Summary of the best results obtained in experiments at 6” and 4” column flotation. Rougher/cleaner. Feed solids rate: 45 kg/h. pH = 9.7. Flotation studies with Sample 2.
Table 6.
Summary of the best results obtained in experiments at 6” and 4” column flotation. Rougher/cleaner. Feed solids rate: 45 kg/h. pH = 9.7. Flotation studies with Sample 2.
| Test | Recovery (%) | Grade (%) | Consumption (g/t) | ||||
|---|---|---|---|---|---|---|---|
| Mass | P2O5 | P2O5 | Fe2O3 | SiO2 | Collector | Depressant | |
| 1 | 25.6 | 47.2 | 32.8 | 4.8 | 0.7 | 72 | 3000 |
| 2 | 24.6 | 44.6 | 32.7 | 3.8 | 0.6 | 69 | 2880 |
| 3 | 27.4 | 54.5 | 33.1 | 4.2 | 1.2 | 94 | 2380 |
| 4 | 30.7 | 57.7 | 32.7 | 4.4 | 1.5 | 87 | 2215 |
| Average | 27.1 | 51.0 | 32.8 | 4.3 | 1.0 | 80 | 2618 |
© 2019 by the authors. Licensee MDPI, Basel, Switzerland. This article is an open access article distributed under the terms and conditions of the Creative Commons Attribution (CC BY) license (http://creativecommons.org/licenses/by/4.0/).
Share and Cite
MDPI and ACS Style
Matiolo, E.; Couto, H.J.B.; de Lira Teixeira, M.F.; de Almeida, R.N.; de Freitas, A.S. A Comparative Study of Different Columns Sizes for Ultrafine Apatite Flotation. Minerals 2019, 9, 391. https://doi.org/10.3390/min9070391
AMA Style
Matiolo E, Couto HJB, de Lira Teixeira MF, de Almeida RN, de Freitas AS. A Comparative Study of Different Columns Sizes for Ultrafine Apatite Flotation. Minerals. 2019; 9(7):391. https://doi.org/10.3390/min9070391
Chicago/Turabian StyleMatiolo, Elves, Hudson Jean Bianquini Couto, Michelle Fernanda de Lira Teixeira, Renata Nigri de Almeida, and Amanda Soares de Freitas. 2019. "A Comparative Study of Different Columns Sizes for Ultrafine Apatite Flotation" Minerals 9, no. 7: 391. https://doi.org/10.3390/min9070391
Note that from the first issue of 2016, this journal uses article numbers instead of page numbers. See further details here.