Spatial Mapping of Acidity and Geochemical Properties of Oxidized Tailings within the Former Eagle/Telbel Mine Site


Research Institute on Mines and Environment (RIME), Université du Québec en Abitibi Témiscamingue, 445 Boul. Université, Rouyn-Noranda, QC J9X 5E4, Canada
*
Authors to whom correspondence should be addressed.
Minerals 2019, 9(3), 180; https://doi.org/10.3390/min9030180
Submission received: 14 January 2019
/
Revised: 6 March 2019
/
Accepted: 12 March 2019
/
Published: 14 March 2019
(This article belongs to the Special Issue Towards a Sustainable Management of Mine Wastes: Reprocessing, Reuse, Revalorization and Repository)
Abstract
:At some orphaned and abandoned mine sites, acid mine drainage can represent a complex challenge due to the advanced tailings’ oxidation state as well as the combination of other factors. At the field scale, several parameters control sulfides’ oxidation rates and, therefore, the acidity generation. The objective of this paper is to map the acidity and geochemical properties of oxidized tailings within a closed tailings storage facility. Based on systematic sampling, various geochemical parameters were measured within the oxidized Joutel tailings, including the: Neutralization potential, acid-generating potential, net neutralization potential, neutralization potential ratio, paste pH, thickness of oxidized, hardpan, and transition zones. The different parameters were integrated in geographical information system (GISs) databases to quantify the spatial variability of the acidity and geochemical properties of oxidized tailings. The oxidized tailings were characterized by low sulfide (mainly as pyrite) and carbonate (mainly as siderite/ankerite) contents compared to unweathered tailings. Acidic zones, identified based on paste pH, were located in the eastern portion of the southern zone and at the northern tip of the northern zone.

1. Introduction
Mining operations generate large volumes of finely ground non-economic rock that is referred to as tailings. These materials are characterized by fine particle size distributions (PSD), especially compared to waste rocks [1]. Tailings from base and precious metal mines often contain iron sulfide minerals [2], most commonly as pyrite (FeS2) and pyrrhotite (Fe1−xS, x = 0 to 0.2). While some of the tailings at underground mine operations are used as backfill to support underground excavations (25% of total tailings produced in Canadian operations) [3,4,5], these solid wastes are mostly stored at the surface in tailings storage facilities (TSFs).
Under humid climatic conditions, such as those present in the southern and central latitudes of Canada, TSF designs usually rely on maintaining high degrees of saturation to control the diffusion of oxygen into the tailings and thus reduce sulfide oxidation. However, if the water table drops and the tailings desaturate, the sulfides present in the unsaturated zones will be exposed to atmospheric oxygen. Under these conditions, the oxidative dissolution of sulfides could potentially result in the production of acid and the leaching of metals [6]. When the acid-generating potential (AP) in tailings is higher than their neutralization potential (NP) [2,7,8], acidic drainage waters can result. Furthermore, high concentrations of sulfates, iron, and other potentially toxic metal(oid)s (e.g., As, Co, Ni) can be released [9,10,11]. This phenomenon is known as acid mine drainage (AMD) or acid rock drainage (ARD). In some cases, drainage waters can be near-neutral in pH and still contain concentrations of elements that surpass environmental standards and regulations. This phenomenon is known as contaminated neutral drainage (CND) [12] or metal leaching (ML). The cost of mine site reclamation is influenced by the type and quality of drainages produced in TSFs [13].
The process of sulfide oxidation can result in the generation of protons. This increases the acidity of pore waters and leads to the dissolution of carbonates, which buffer the acid. Depending on the geochemical conditions in the pore water, various reactions may occur, such as: Hydrolysis, precipitation, co-precipitation, and sorption [14,15,16,17]. During these reactions, the tailings’ mineralogical composition can change significantly depending on the dissolution rates of sulfides, carbonates, and, to a lesser extent, silicates. As a result of oxidation, neutralization, and hydrolysis reactions, novel phases may precipitate. The most common secondary phases are ferric oxyhydroxides (e.g., goethite, ferrihydrite, lepidocrocite), gypsum, and iron sulfates. These secondary phases affect the geochemical behavior of tailings considerably [10].
Ferric oxyhydroxides are known for their high affinity to limiting contaminant mobility through mechanisms, including co-precipitation, adsorption, and substitution. Under some specific conditions, the occurrence of secondary phases may also affect the hydrogeochemical behavior in TSFs by modifying the tailings’ hydrogeological properties, such as porosity. For example, the formation of hardpan within TSFs affects the water balance and flow paths [18,19]. Hardpan formation is more likely to occur at orphaned or abandoned mine sites.
Predicting and assessing the geochemical behavior of oxidized tailings is challenging relative to unweathered, fresh tailings. The geochemical behavior of oxidized tailings is determined by the reactivity and nature of novel secondary species and the residual reactive phases. Moreover, in the case of an already closed mine site, the uppermost tailings layer is generally oxidized, and the acidity is mainly already produced in some localized areas. Consequently, acidic leachates can result from two sources: (1) Ongoing sulfide oxidation, and (2) latent acidity present due to the oxidation of the ferrous iron. Due to the low permeability of tailings, the hydraulic residence time of porewaters is usually high. Thus, it may take up to several decades for the residual acidity to be flushed out completely. This phenomenon can be more complex due to the presence of hardpan close to the surface that has different hydrogeological properties [19,20,21,22,23]. The main objective of the study is to map the acidity and geochemical properties of the oxidized tailings. Elghali et al. (2019) [19] showed that Joutel’s tailings are an acid-generating base on punctual sampling.
2. Mine Site Description
Joutel is a closed gold mine site located at the north of Val d’Or (Quebec, Canada). The mine was operated by Agnico Eagle Mines Ltd. (Toronto, ON, Canada) between 1974 and 1994 [11,19,24,25]. The gold was associated to sulfide deposit, mainly as pyrite. The gold was extracted using bulk flotation followed by concentrate regrinding-cyanidization [24]. The produced tailings were deposited in an approximately 120 ha tailings storage facility (TSF). The TSF is divided into two zones. The northern zone, which was used from 1974 to 1986, is the first zone of the tailings deposition and is characterized by a highly elevated topography compared the southern zone. The southern zone was used from 1986 to 1993. The input locations for the tailings were located at the eastern side of the south zone and that for the northern zone is unknown.
The oxidized tailings from the north and south zone showed a saturated hydraulic conductivity of about 2.42 × 10⁻⁵ cm/s and 1 × 10⁻⁴ cm/s, respectively [19]. Moreover, the air entry values analyzed by Elghali et al. (2019) [19] were between 3.5 and 75 KPa and between 25 and 80 KPa for the tailings from the south and north zone, respectively. In addition, Joutel tailings are characterized by a heterogeneous particle size; their D90 (which corresponds to 90% passing on the cumulative particle size distribution curve) varied between 37 and 164 µm [19].
Joutel’s tailings were recently studied by Elghali et al. (2019) [19] to evaluate their acid generating potential. The main conclusions of this study showed that Joutel’s oxidized tailings could be acid generating if the leachates are not mixed with the unweathered tailings pore water, which means that the geochemistry of Joutel’s tailings is mainly controlled by the reactivity of the oxidized tailings. This study showed that the hardpan formed at the interface between oxidized and unweathered tailings may limit vertical water infiltration.
3. Materials and Methods
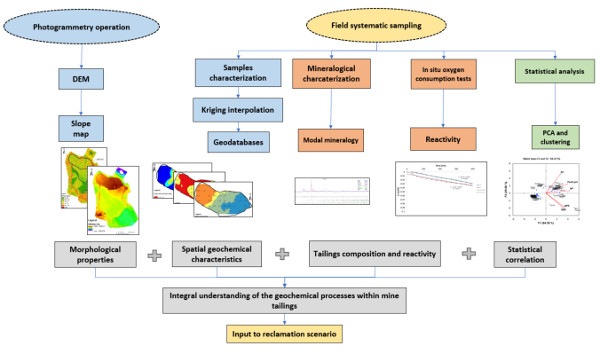
The methodologies used in this study combined geochemical, spatial, and statistical techniques to better understand the geochemical processes occurring within Joutel’s TSF. The methodologies used in this study are illustrated in Figure 1.
3.1. Materials Sampling and Methodology
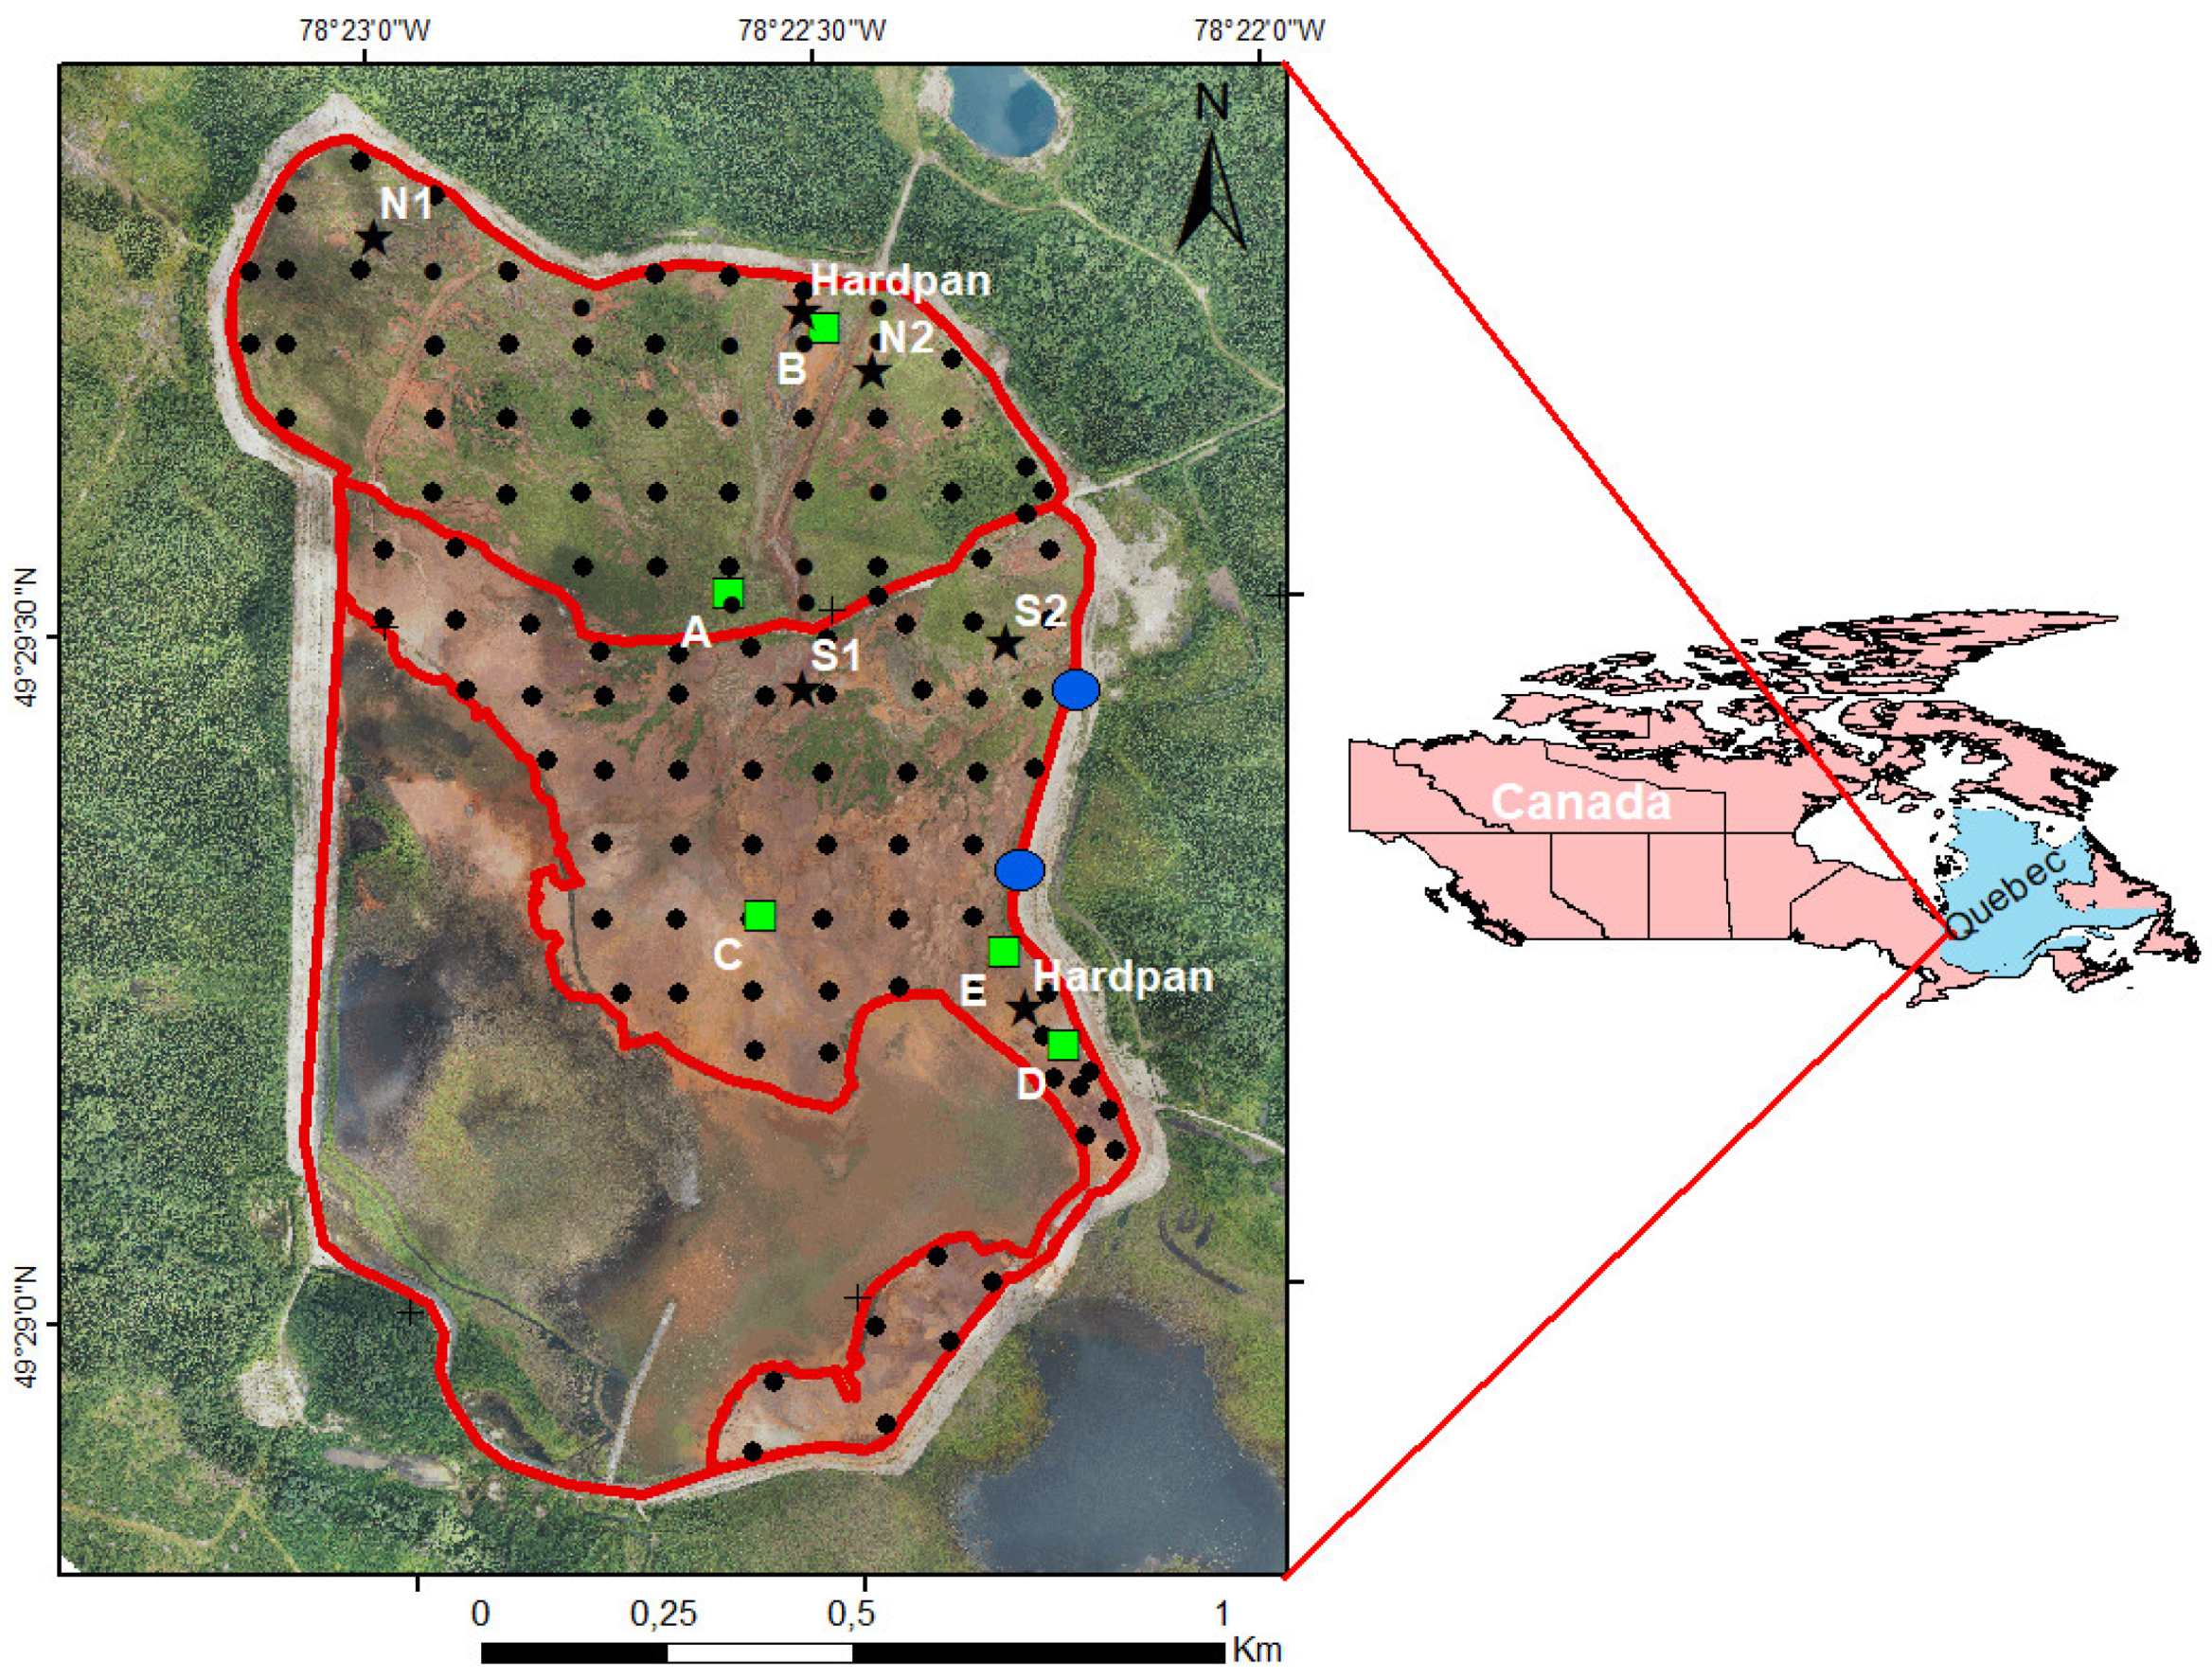
Sampling is a critical first step in the process of predicting the acid-generation potential (AGP) of mine wastes. The choice of a sampling strategy depends principally upon the objectives of the study. This may account for differences in the sampling strategies used in different studies on evaluating the AGP of mine wastes [11,12,24,26,27]. Various strategies have also been developed for evaluating soil and water pollution [28,29,30,31,32] and could be used for assessing the AGP of oxidized tailings considering that the particle sizes of mine tailings are comparable to fine soils. The sampling strategy used for this study was systematic [30,31,33]. A square sampling grid was constructed with lines oriented east-west and a line spacing of about 100 m; this configuration balanced restrictions due to cost with requirements for sampling resolution (Figure 2). Depending on the field constraints (e.g., presence of vegetation, streams), a predefined sampling point could be slightly moved. Oxidized tailings were sampled using a manual auger at each sampling point. Trenches were dug into the unweathered tailings to measure the thickness of the oxidation zone, hardpan, and transition zone. Each sample point was homogenized separately and submitted to several analyses. Approximately 1 kg of oxidized tailings was collected over the entire oxidized horizon from each point and each sample was spatially referenced using a GPS system. The sampling depth was variable depending on the thickness of the oxidized horizon; the depth of each sampling point is indicated in Table S1. Finally, a total of 122 samples were collected from the two tailings’ storage facilities. The main reason of sampling only the oxidized tailings for the spatial mapping is that the geochemistry of Joutel’s tailings is mainly controlled by the upper oxidized tailings due to the presence of hardpan layers [19]. Some areas at the south zone were not sampled due to the presence of more than 50 cm of water.
3.2. Methods
3.2.1. Geochemical and Mineralogical Characterization
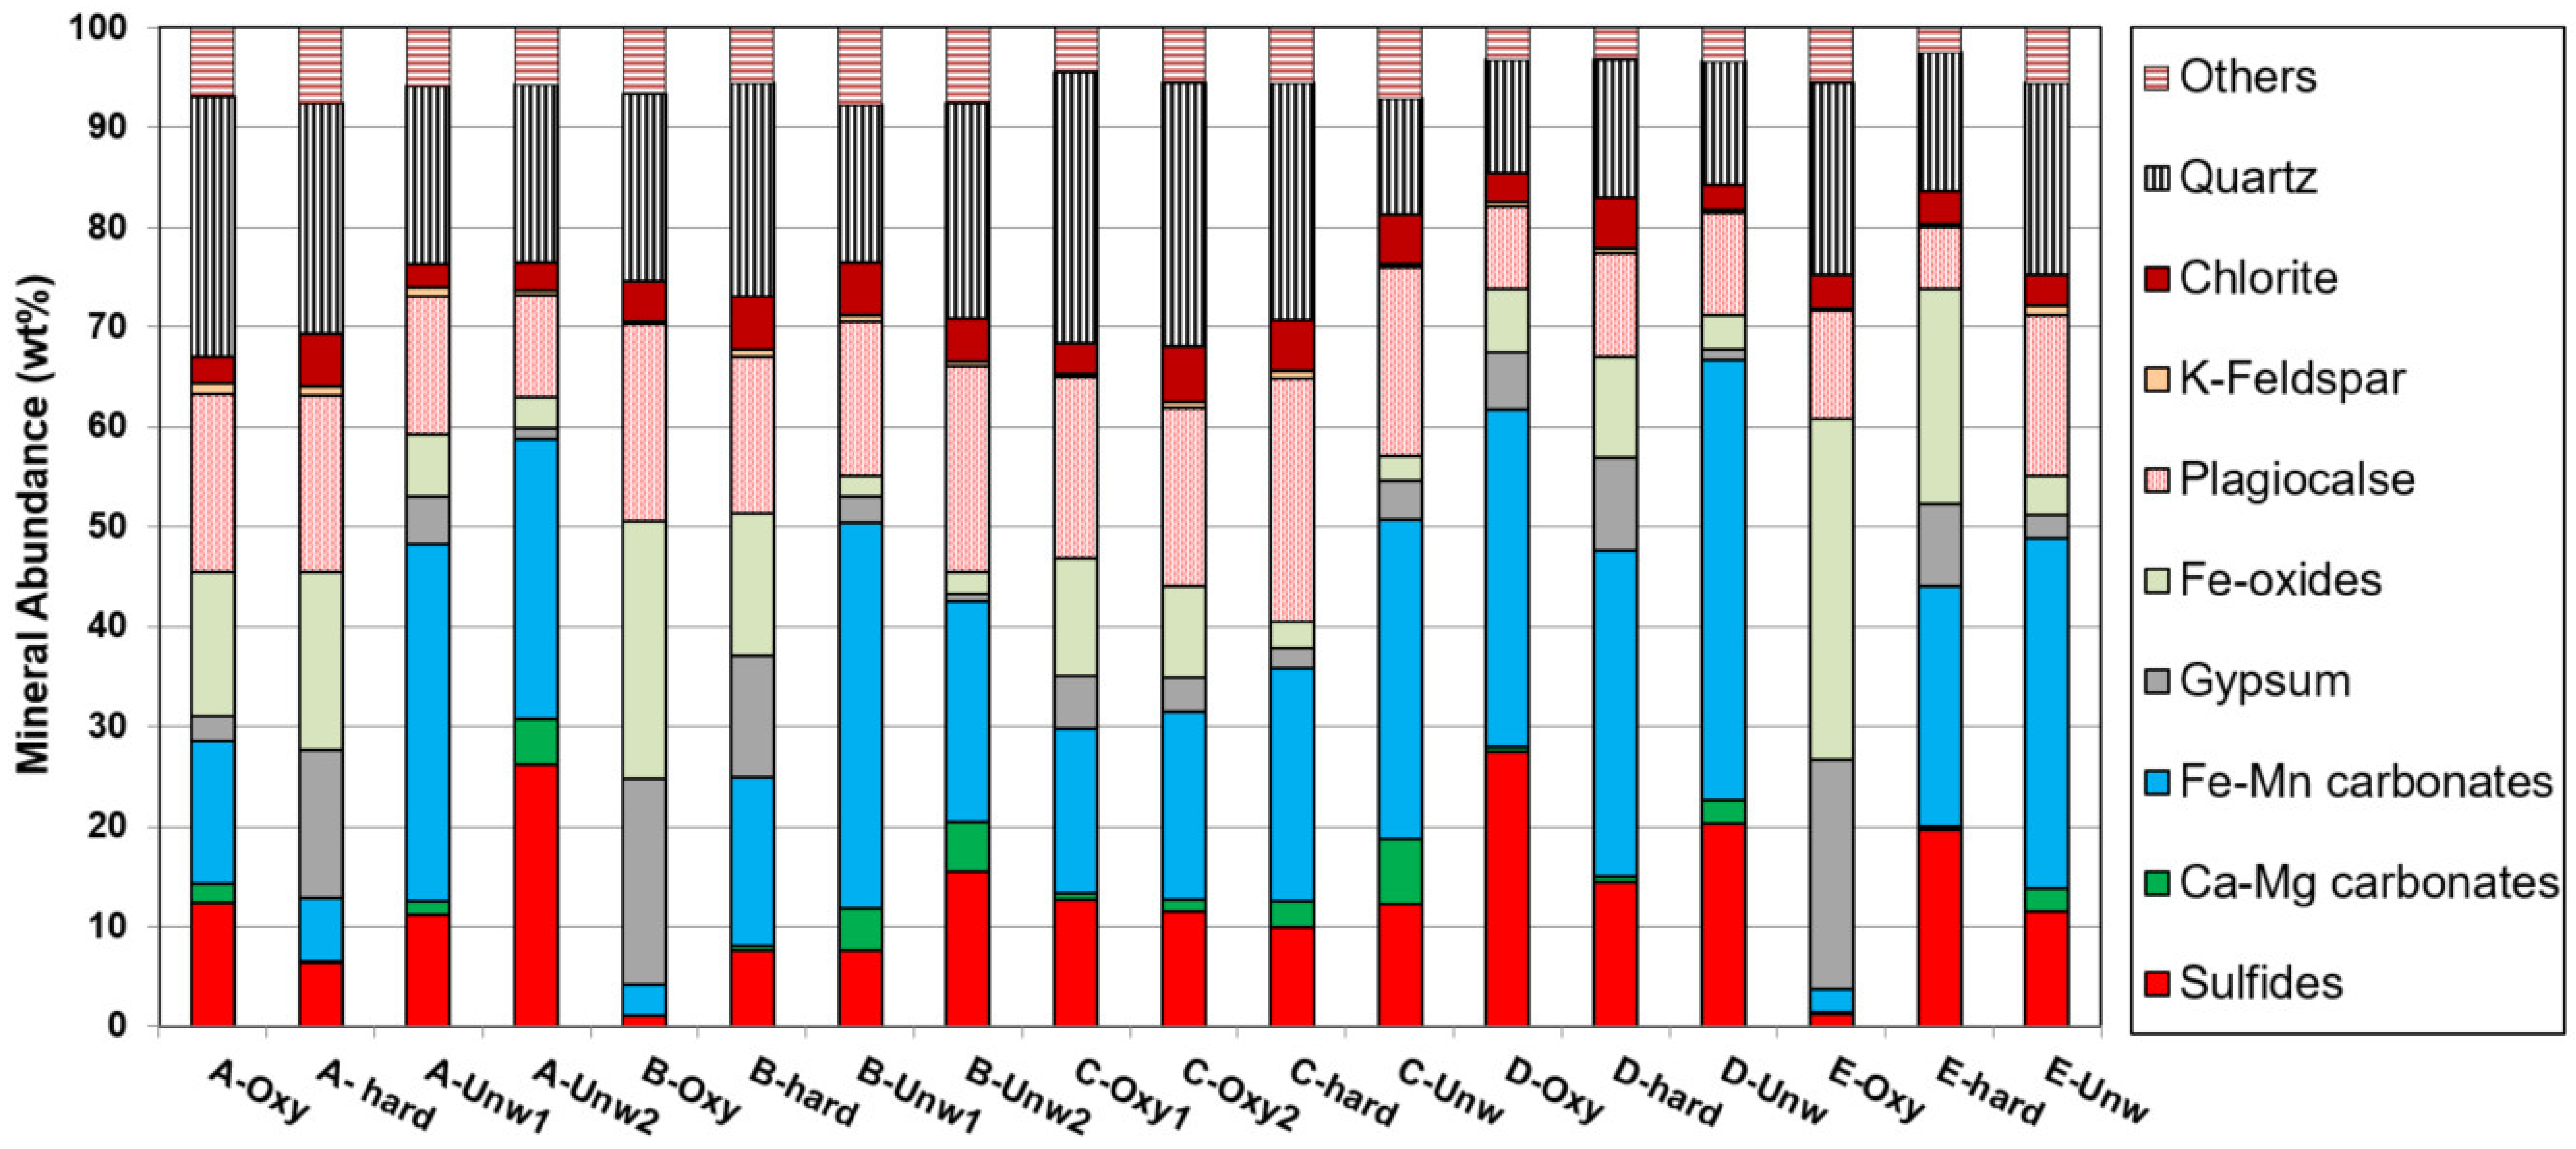
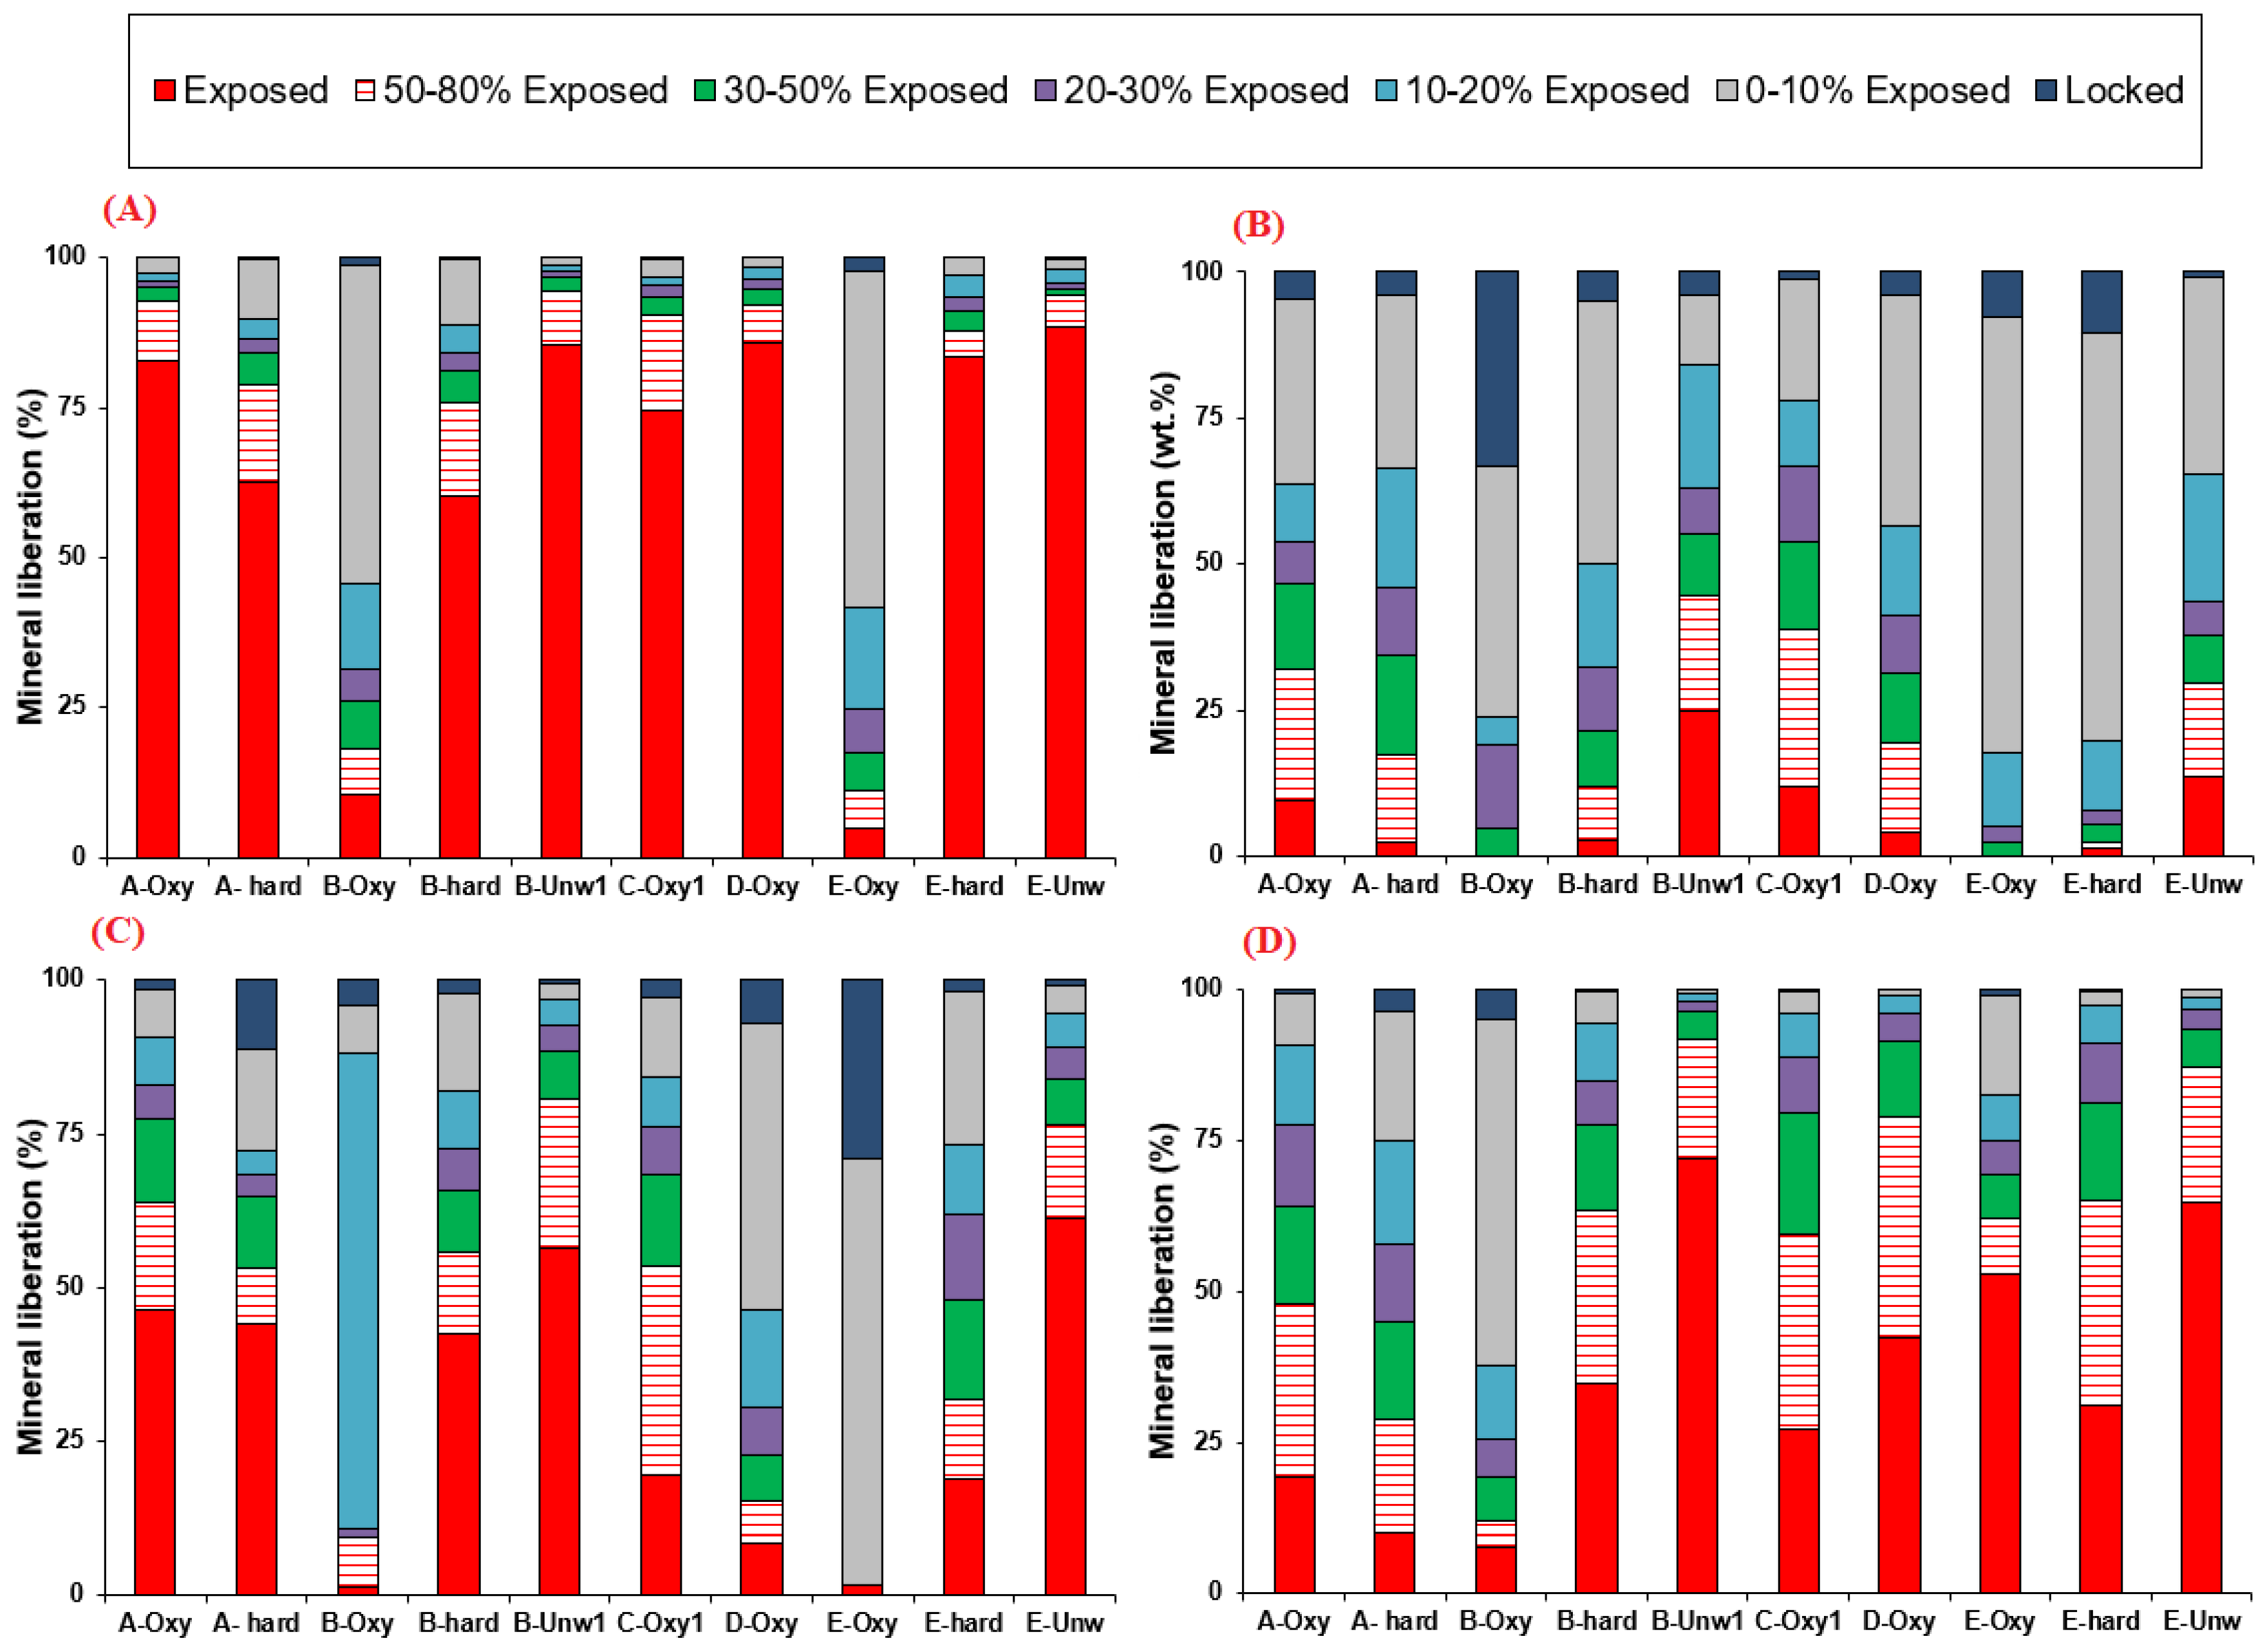
Total sulfur and total carbon were measured using an induction furnace (ELTRA CS-2000) with a detection limit of 0.09%. Sulfates within solid samples were analyzed after solid digestion using 40% HCl. Mineralogy of samples was investigated using the quantitative evaluation of materials by scanning electron microscopy (QEMSCAN). QEMSCAN is an automated system that produces particle maps (color coded by mineral) through the collection of rapidly acquired X-rays. The maps and corresponding data files quantify the modal mineralogy, texture, grain size, elemental deportment, and liberation of samples analyzed. The polished sections were analyzed by PMA (particle mineralogy analysis) mode. More than 10,000 grains were analyzed for each polished section to ensure enough data for good statistical representation. The measurement resolution varied from 2.5 µm to 6 µm depending on the particle size. A species identification protocol (SIP) specifically designed for the mineralogy was used for data processing [34,35]. The data enabled quantification of the mineralogical composition and mineral liberation of carbonates and sulfides. Five locations (A, B, C, D, and E) were sampled using a trench to identify the different tailings’ horizons (oxidized tailings, hardpan, and unweathered tailings). Depending on the thickness of the oxidized horizon, one or two samples were collected. A total of 18 samples were analyzed using QEMSCAN. The different locations and samples are described in Table 1. The modal mineralogy was analyzed for the 18 samples and the mineral liberation of sulfide and carbonate was analyzed for oxidized tailings, hardpan, and unweathered tailings from station B and E.
3.2.2. Acid Generation Potential Assessment
The paste pH of solid samples was analyzed using a pH meter after adding 5 mL of deionized water to 2.5 g of tailings; this method has a precision of ±0.02 units. The acid generation potential (AP) of each sample was calculated using the sulfide content (AP = 31.25 × %S-sulfide) [36,37]. The neutralization potential (NP) was calculated using the carbon content and using the Sobek method (NP = 83.3 × %C-carbonates) [7,36,38,39,40] with a correction factor of 50% applied due to presence of Fe-Mn carbonates. These phases overestimate the NP as calculated based on the carbon content (Figure S1); further details are provided in Section 3. The relative error associated with NP values determined by titration is approximately ±12 kg CaCO3/t [41] and that related to the AP calculation is approximately ±3 kg CaCO3/t. The net neutralization potential (NNP) is defined as the difference between the NP and the AP. The neutralization potential ratio (NPR) is defined as the ratio between the NP and the AP. Net acid generation (NAG) tests were performed on 2.5 g of pulverized tailings in 250 mL of 15% H2O2. In these tests, the samples are allowed to react until effervescence ceases [42,43,44]. The pH of the liquor is then analyzed and the sample is considered acid-generating if the final pH is <4.5 and non acid-generating if the final pH is >4.5 [45].
3.2.3. Field Oxygen Consumption Tests
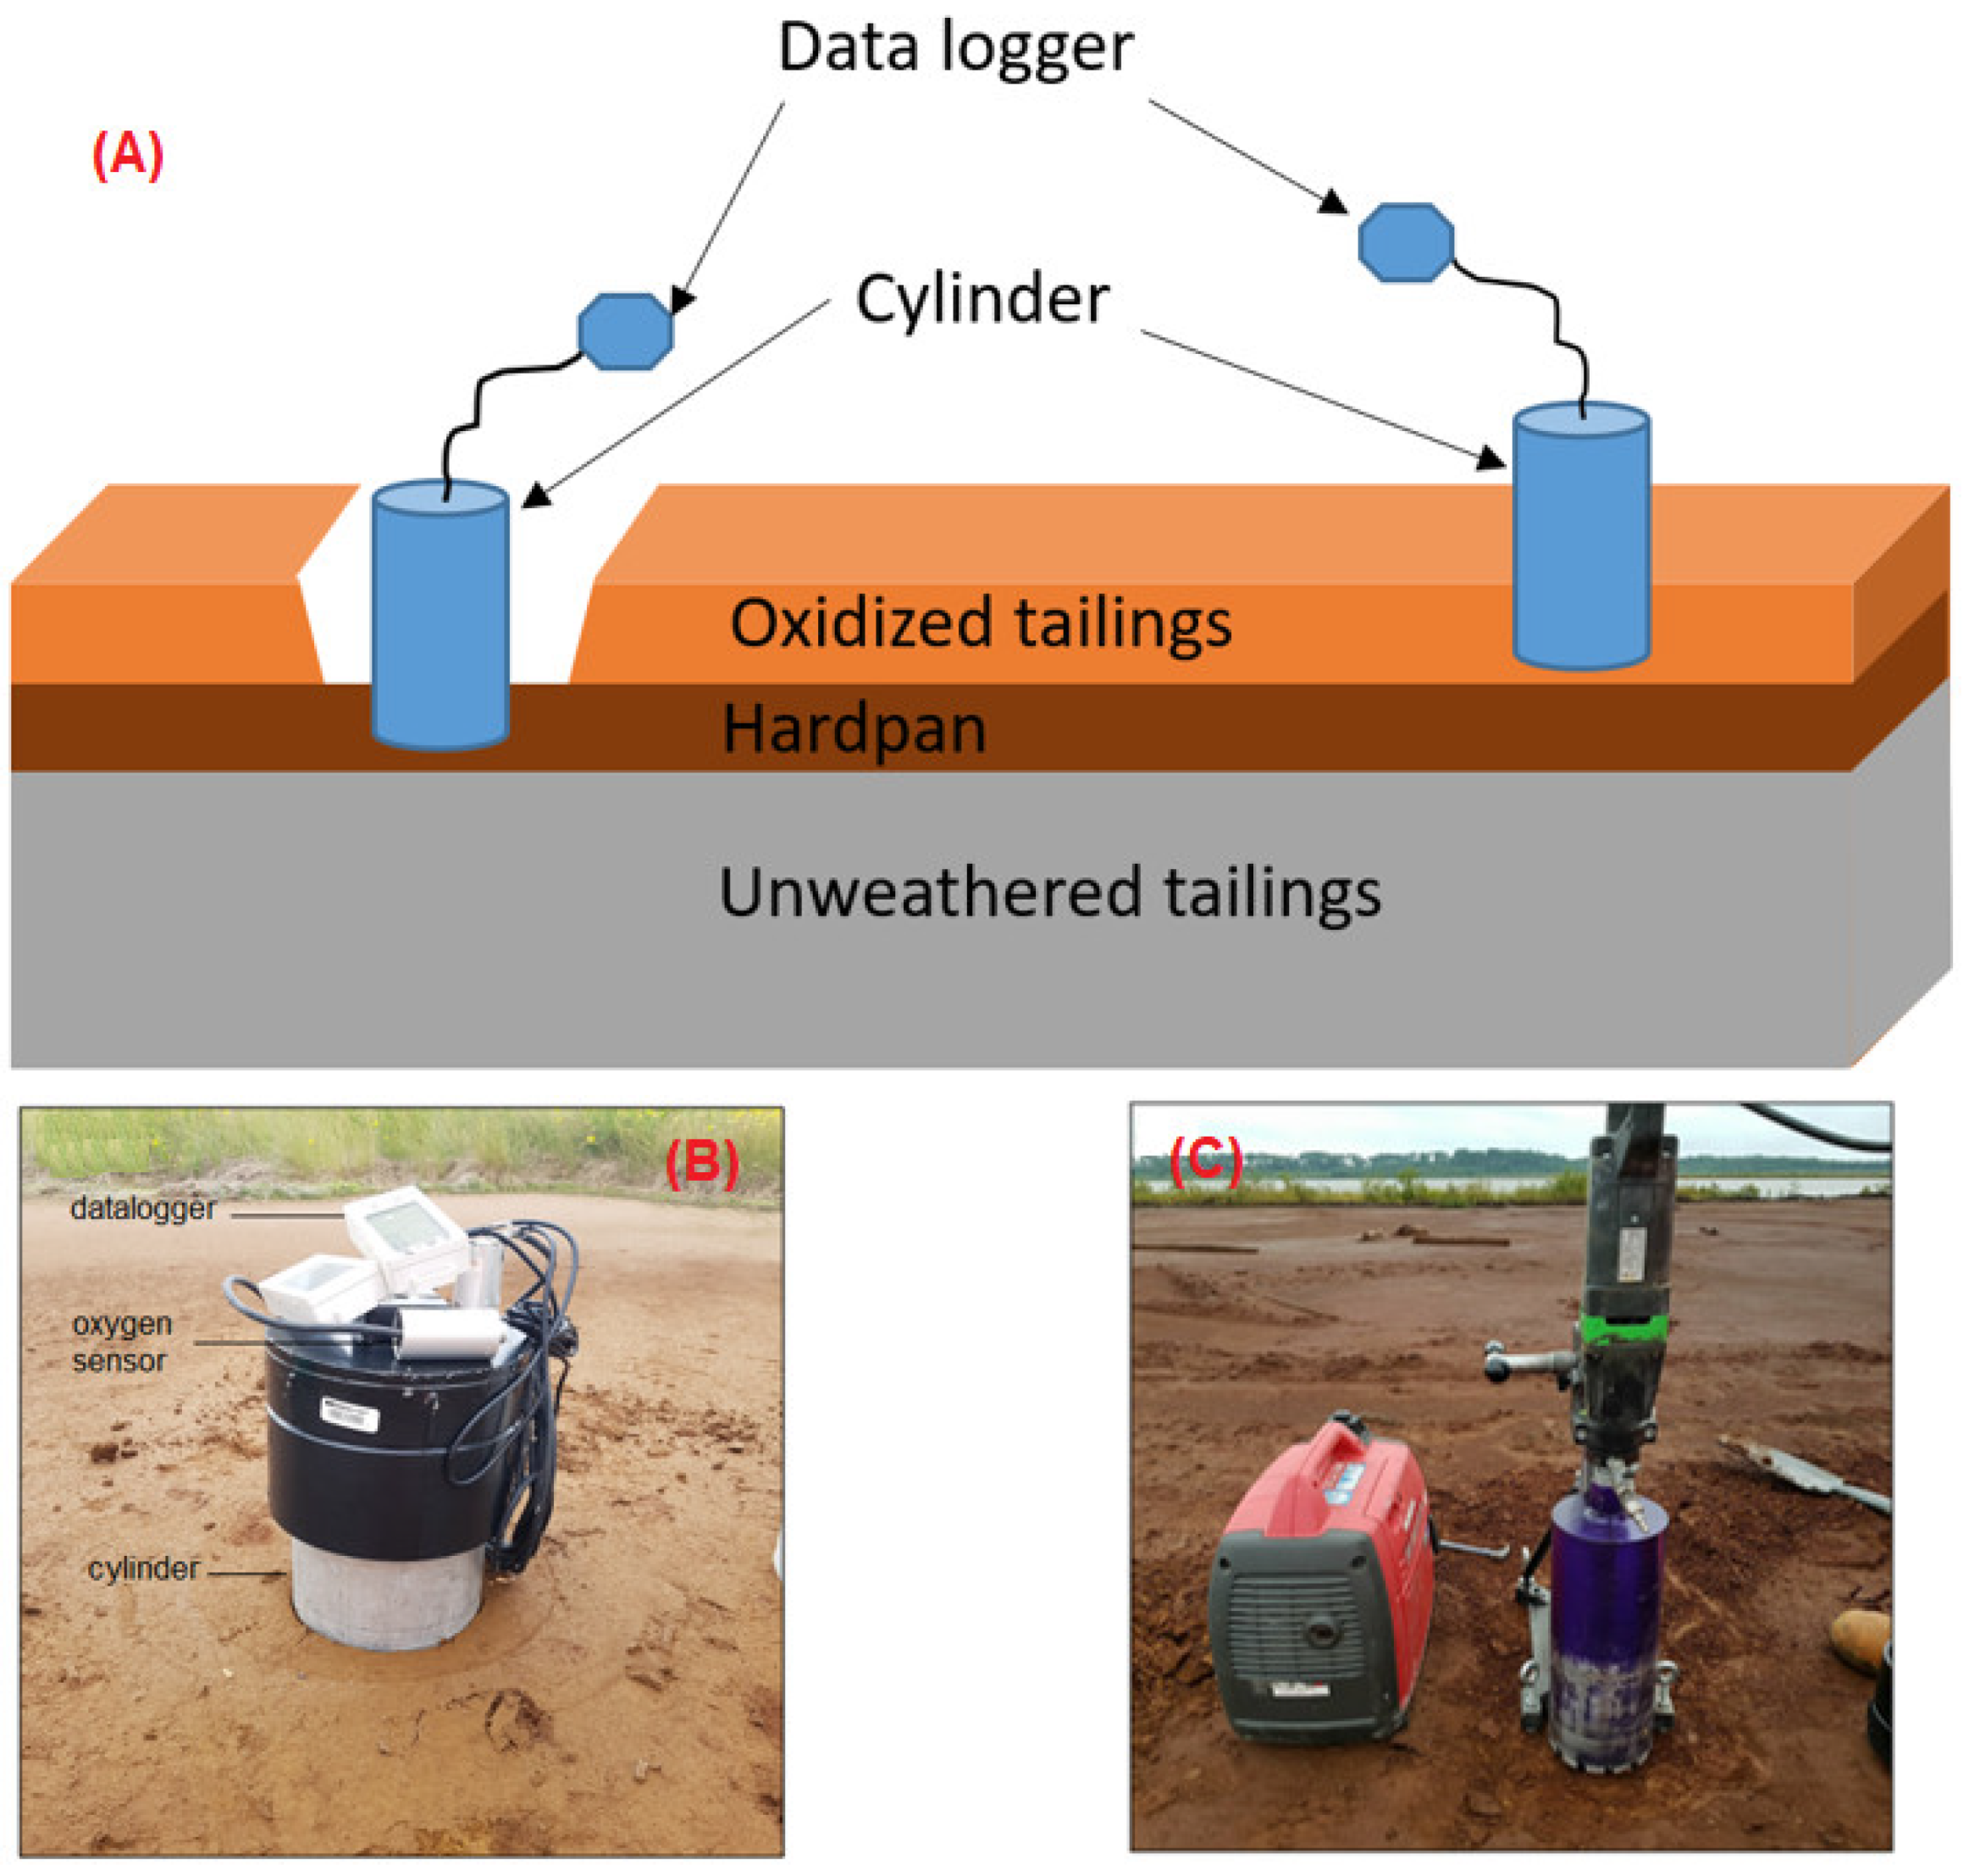
Oxygen consumption tests were used to determine the sulfide oxidation rates in the tailings [26,46,47,48]. High oxygen consumption means a high sulfide oxidation rate. In this study, six locations were chosen to evaluate in situ oxygen consumption rates: Four locations within the oxidized tailings (Figure 2) and two locations within hardpan layers (Figure 2: Hardpan). These tests involved installing aluminum cylinders with known dimensions in the tailings to form a closed system (~10 cm deep) (Figure 3A). For the hardpan locations, the cylinder was embedded using a drill (Figure 3C). The cylinders were covered with a plastic cap equipped with an oxygen sensor [46] (Figure 3B) and oxygen concentrations were logged for five days. The data was interpreted only for a short duration (3 h). Oxygen fluxes were calculated using the graphical method described in Mbonimpa et al. (2011) [48].
3.2.4. Spatial Mapping and Statistical Analysis
Due to differences in the deposition ages of the tailings in the northern and southern portions of the Joutel TSF, each zone was interpolated separately based on the systematic sampling approach (Section 3.1). During this study, various analyses were performed within the oxidized tailings zones. A total of 11 geodatabases were established using ArcGIS 10.3.1. The geodatabases produced for each zone were: C wt.%, total S wt.%, Ssulfides wt.%, paste pH, NP, AP, NNP, NPR, oxidized horizon thickness, transition zone thickness, and hardpan thickness. Other geodatabases, such as the slope map and the flow accumulation map, were produced for both zones using a digital elevation model with a 21-cm per pixel resolution produced using photogrammetry.
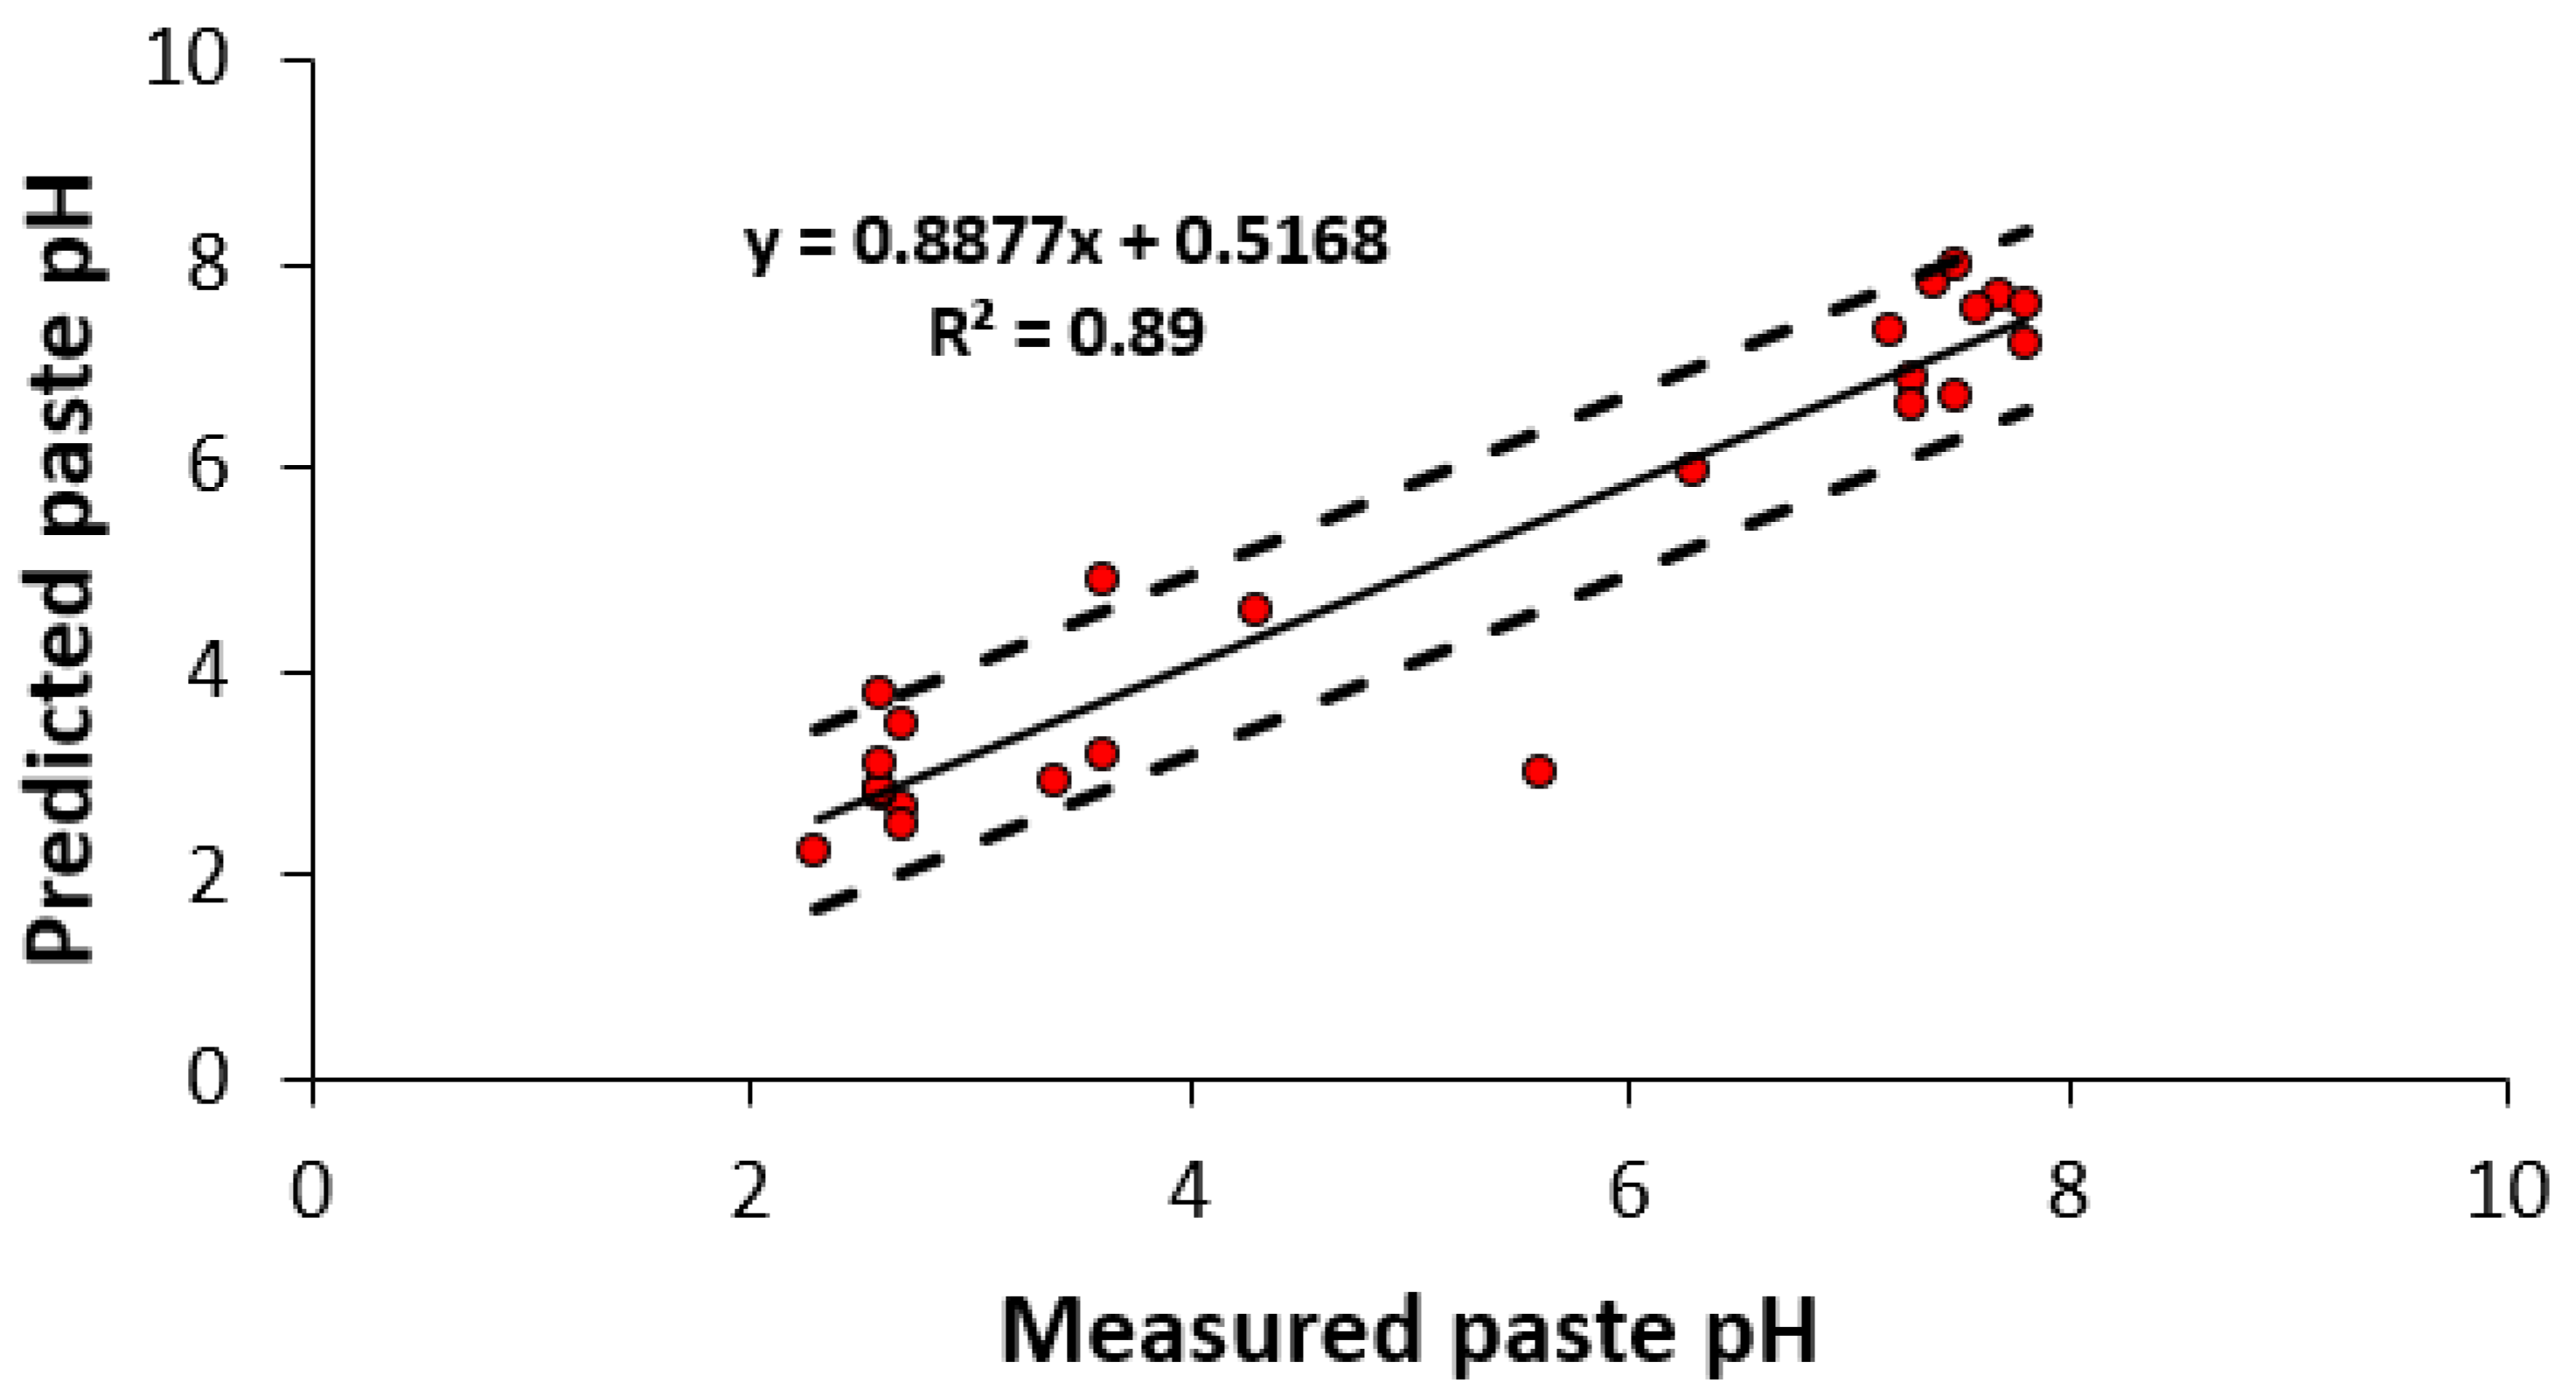
The included parameters were interpolated through kriging [29,49,50,51] with the geostatistical wizard of ArcGIS 10.3.1. Kriging, or interpolation method accuracy, was performed using the validation technique. Random sampling was done after data interpolation. Data were plotted on the interpolated map, and then the values estimated by kriging were compared to the measured values. Validation was performed only for the paste pH, as it was one of the most important parameters and the best reflection of the acidity of the oxidized tailings. A total of 25 points were used to validate the interpolation method. Descriptive statistics and principal component analysis (PCA) were done using the XL-stat extension for Microsoft Excel [52]. The results of the kriging validation are presented in Figure 4 and confirmed a reliable data interpolation. Among the 25 measured points, only two samples were considered as outliers (α = 0.05).
4. Results and Discussion
4.1. Results
4.1.1. Mineralogical Characteristics and the Effect of Siderite/Ankerite on the Tailings’ Neutralization Potential
Mineralogical Characteristics
The results of the modal mineralogy analysis of the studied samples are shown in Figure 5. The studied samples show high spatial variability in their mineralogical composition. Sulfide species detected within the different samples included pyrite as the main sulfide mineral, while pyrrhotite, chalcopyrite, and arsenopyrite were in trace concentrations. Carbonate species analyzed within the different samples were mainly Fe-Mn carbonates (siderite and ankerite) and, to a lesser extent, Ca-Mg carbonates (calcite and dolomite).
Unweathered samples showed sulfide contents between 7 and 27 wt.% for the north zone (stations A and B) and between 11 and 21 wt.% for the south zone (stations C, D, and E). Fe-Mn carbonate content was between 21 and 39 wt.% for the north zone and between 31 and 45 wt.% for the south zone. However, Ca-Mg carbonate contents, which are the main minerals responsible for acidity buffering during AMD formation, were ≤7 wt.% for the analyzed samples. The hardpan samples showed a sulfide content around 6 wt.% for the north zone and between 6 and 20 wt.% for the south zone. Gypsum content, which is the result of calcium and sulfates precipitation, was between 2 and 15 wt.% and Fe-oxy-hydroxides content was between 2 and 26 wt.%. The oxidized tailings showed a different mineralogical composition compared to that of the hardpan and unweathered tailings. The oxidized tailings contained high concentrations of Fe-oxy-hydroxides (6–35 wt.%). Their sulfide content was between 0.5 and 27 wt.% and Ca-Mg-carbonate was ≤12 wt.%.
Other minerals detected within the oxidized, hardpan, and unweathered tailings were mainly plagioclase, sericite/muscovite, quartz, and chlorite/clays. The detailed mineralogical composition of these samples is presented in Figure 5.
Mineral Liberation
Mineral liberation is a textural parameter, recognized as a key factor that influences the reactivity of mine waste [34,35,53]. Figure 6 presents results of the pyrite, pyrrhotite, calcite-dolomite, and ankerite-siderite liberation degree. Pyrite was almost liberated (exposed) for all analyzed samples except for oxidized tailings from stations B and E (Figure 6A), where the exposed pyrite was about 10 wt.%. Pyrrhotite was less liberated compared to pyrite (Figure 6B); exposed pyrrhotite was less than 25 wt.% for all the analyzed samples. The exposed part of the calcite-dolimite minerals varied between 2 and 62 wt.% for the analyzed samples and their lowest liberation degree was analyzed within the oxidized tailings from stations B and E. Ankerite-sedirite liberation dergree is illustrated in Figure 6D; their exposed samples varied between 7 and 72 wt.%.
Effect of Fe-Mn Carbonates on the Tailings’ Neutralization Potential
The presence of siderite and ankerite leads to the overestimation of the tailings’ NP when it is calculated based on the carbonate content. This was confirmed by comparing the NP calculated based on carbonate contents with that determined using the Sobek method (1978) [36] as modified by [54] (Figure S1). The overestimation of NP based on carbonate contents ranged between 10% and 54%. This difference was due to the presence of siderite and ankerite as the major carbonates. The neutralization potential of Fe-rich carbonates is balanced by the acidity due to the oxidation of Fe2+ to Fe3+ and subsequent precipitation of Fe3+ as ferric oxyhydroxide phases [37,55,56,57]. Therefore, Fe-rich carbonates do not provide an additional buffering capacity [37,55]. For this reason, the NP of the Joutel tailings was corrected conservatively using a factor of 50% for all samples in this study; i.e., NP = 0.5NPcarbonates.
4.1.2. Site Topography and Slopes
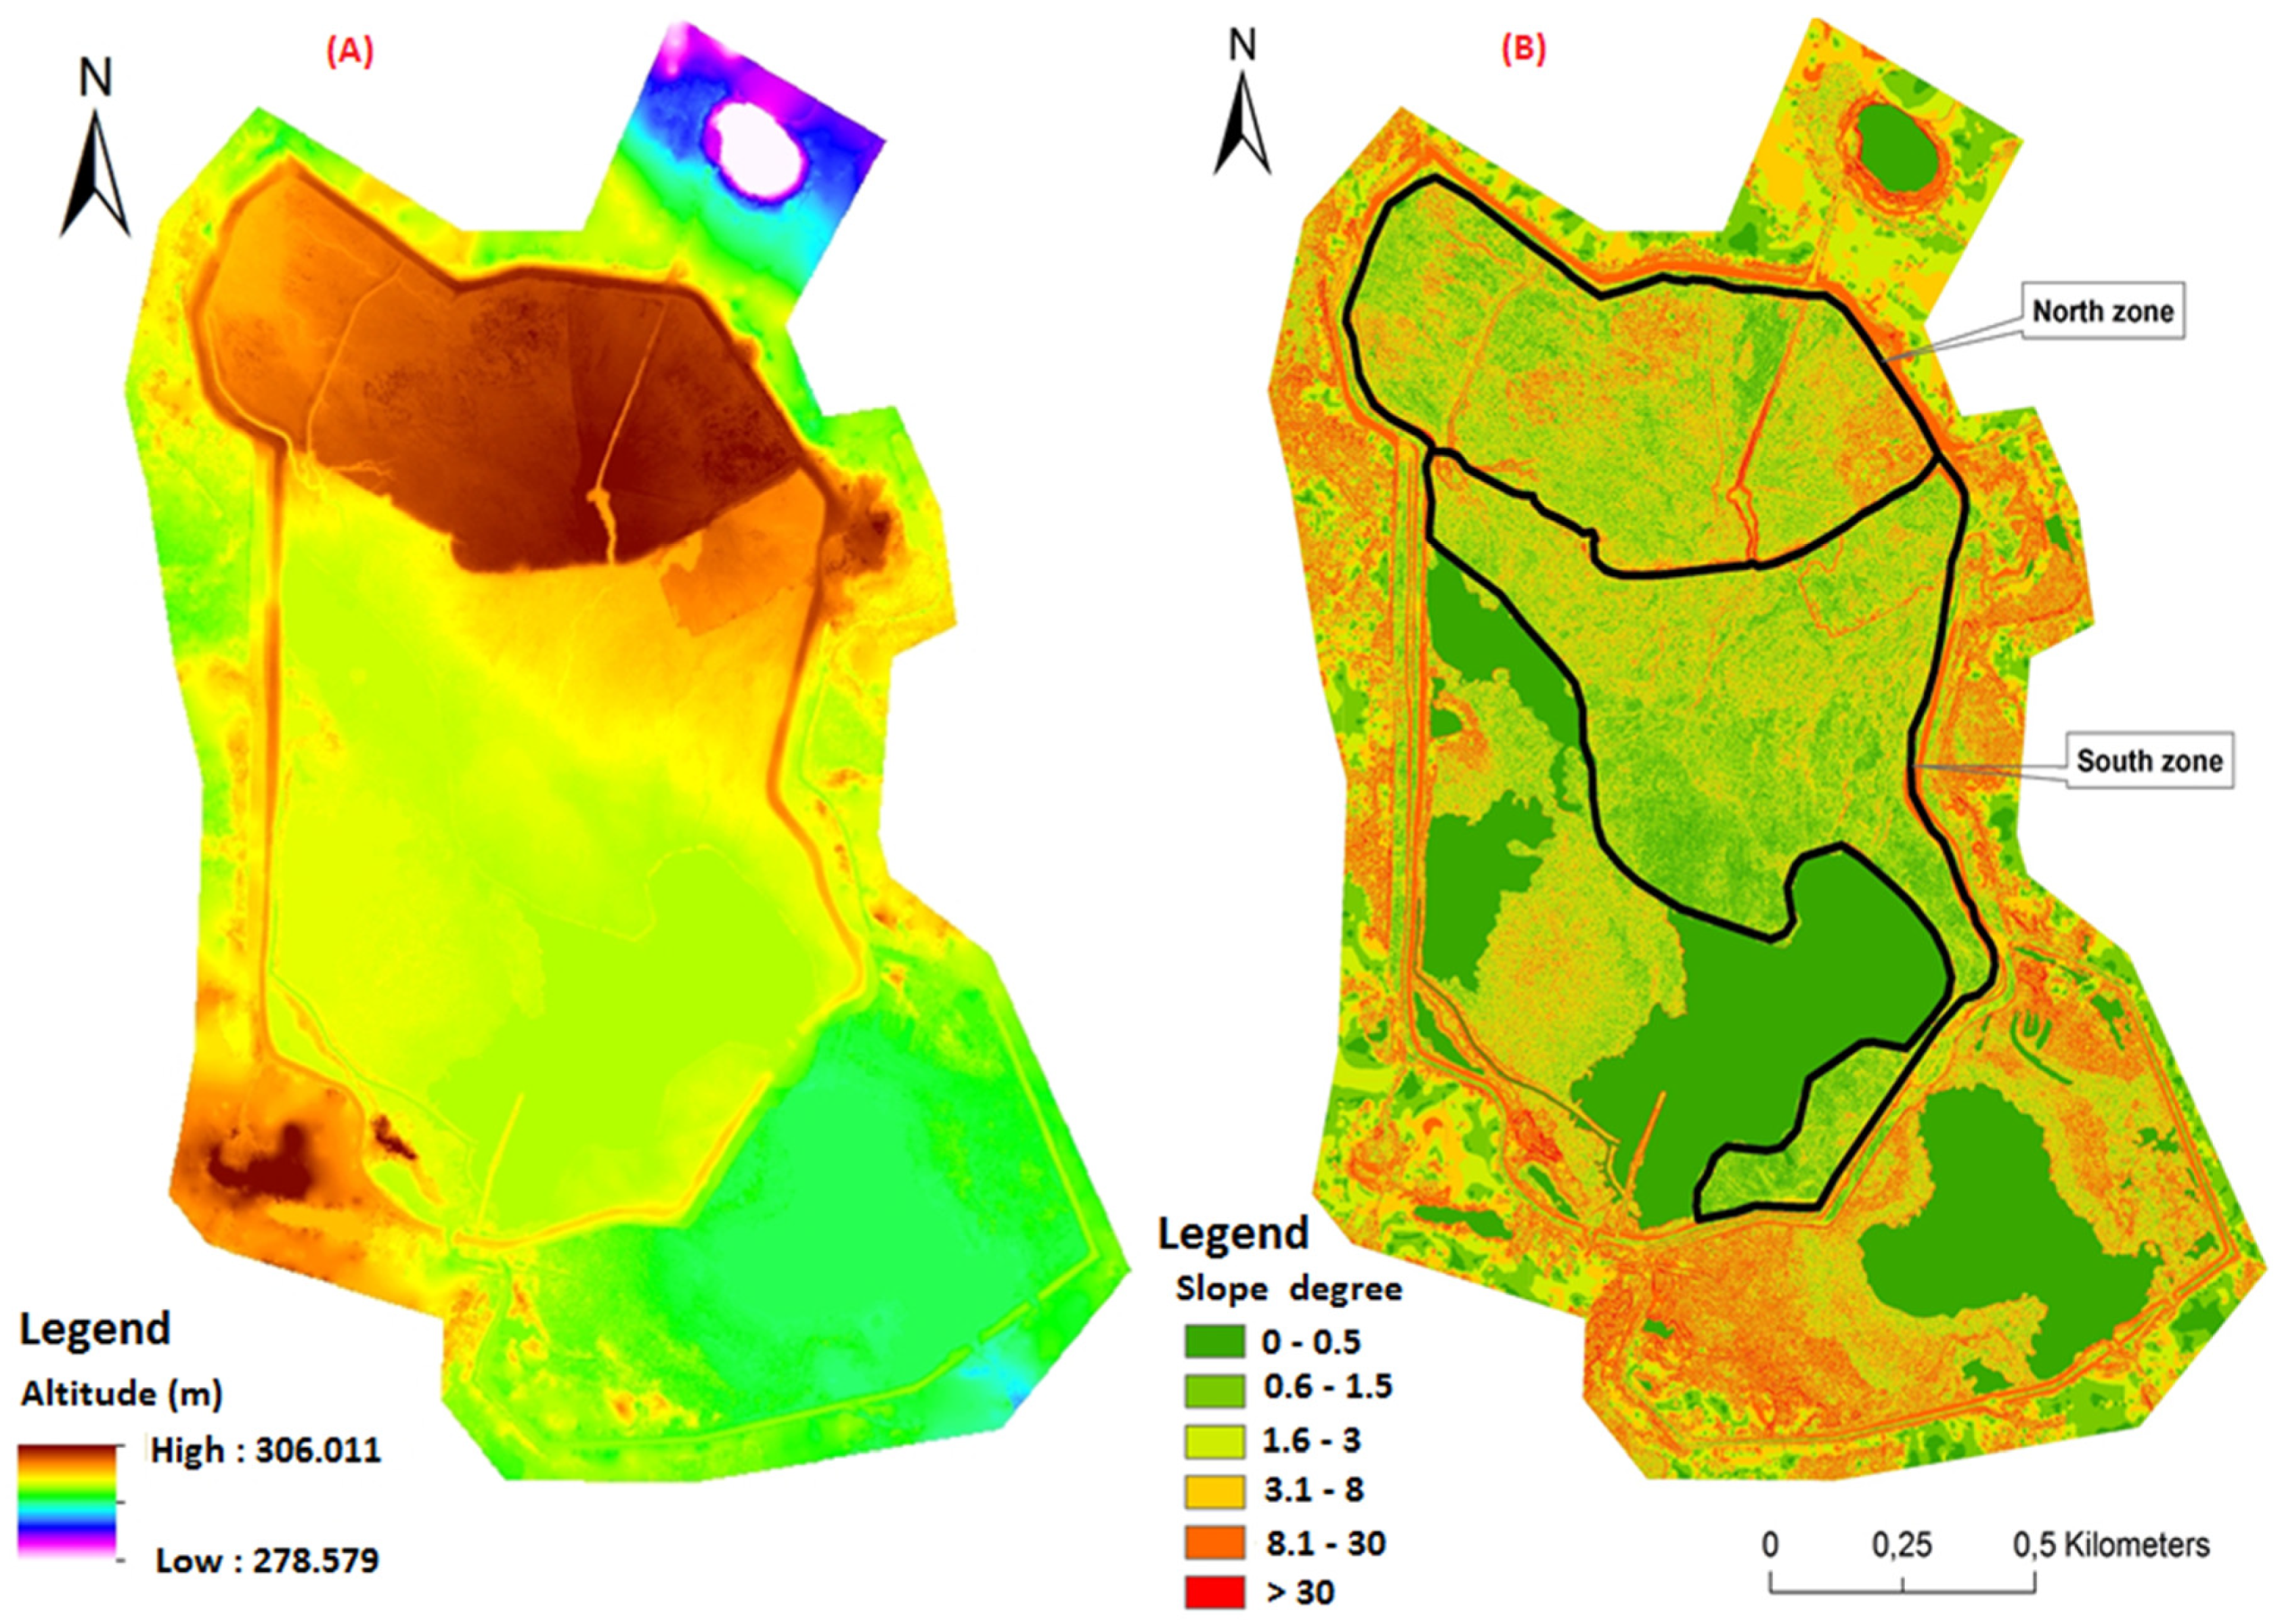
The results of the DEM and slope map are presented in Figure 7. The northern zone is characterized by high elevations compared to the southern zone (Figure 7A); the maximum elevation in the northern and southern zones are ~306 m and 280 m, respectively. The elevation decreases from north to south and from east to west (Figure 7). The slope within the Joutel TSF (Figure 7B) is weak and mostly lower than 8°, except in a few areas where the slope values are higher than 80° (streams and channels). Therefore, surface runoff is greatly influenced by the slope. These higher slope values correspond to streams. Combining the DEM and slope maps, the surface runoff flow directions are oriented NE-SW. Moreover, surface runoff is enhanced by the presence of several streams.
4.1.3. Paste pH, Oxidized Horizon, Hardpan, and Transition Horizon Thickness
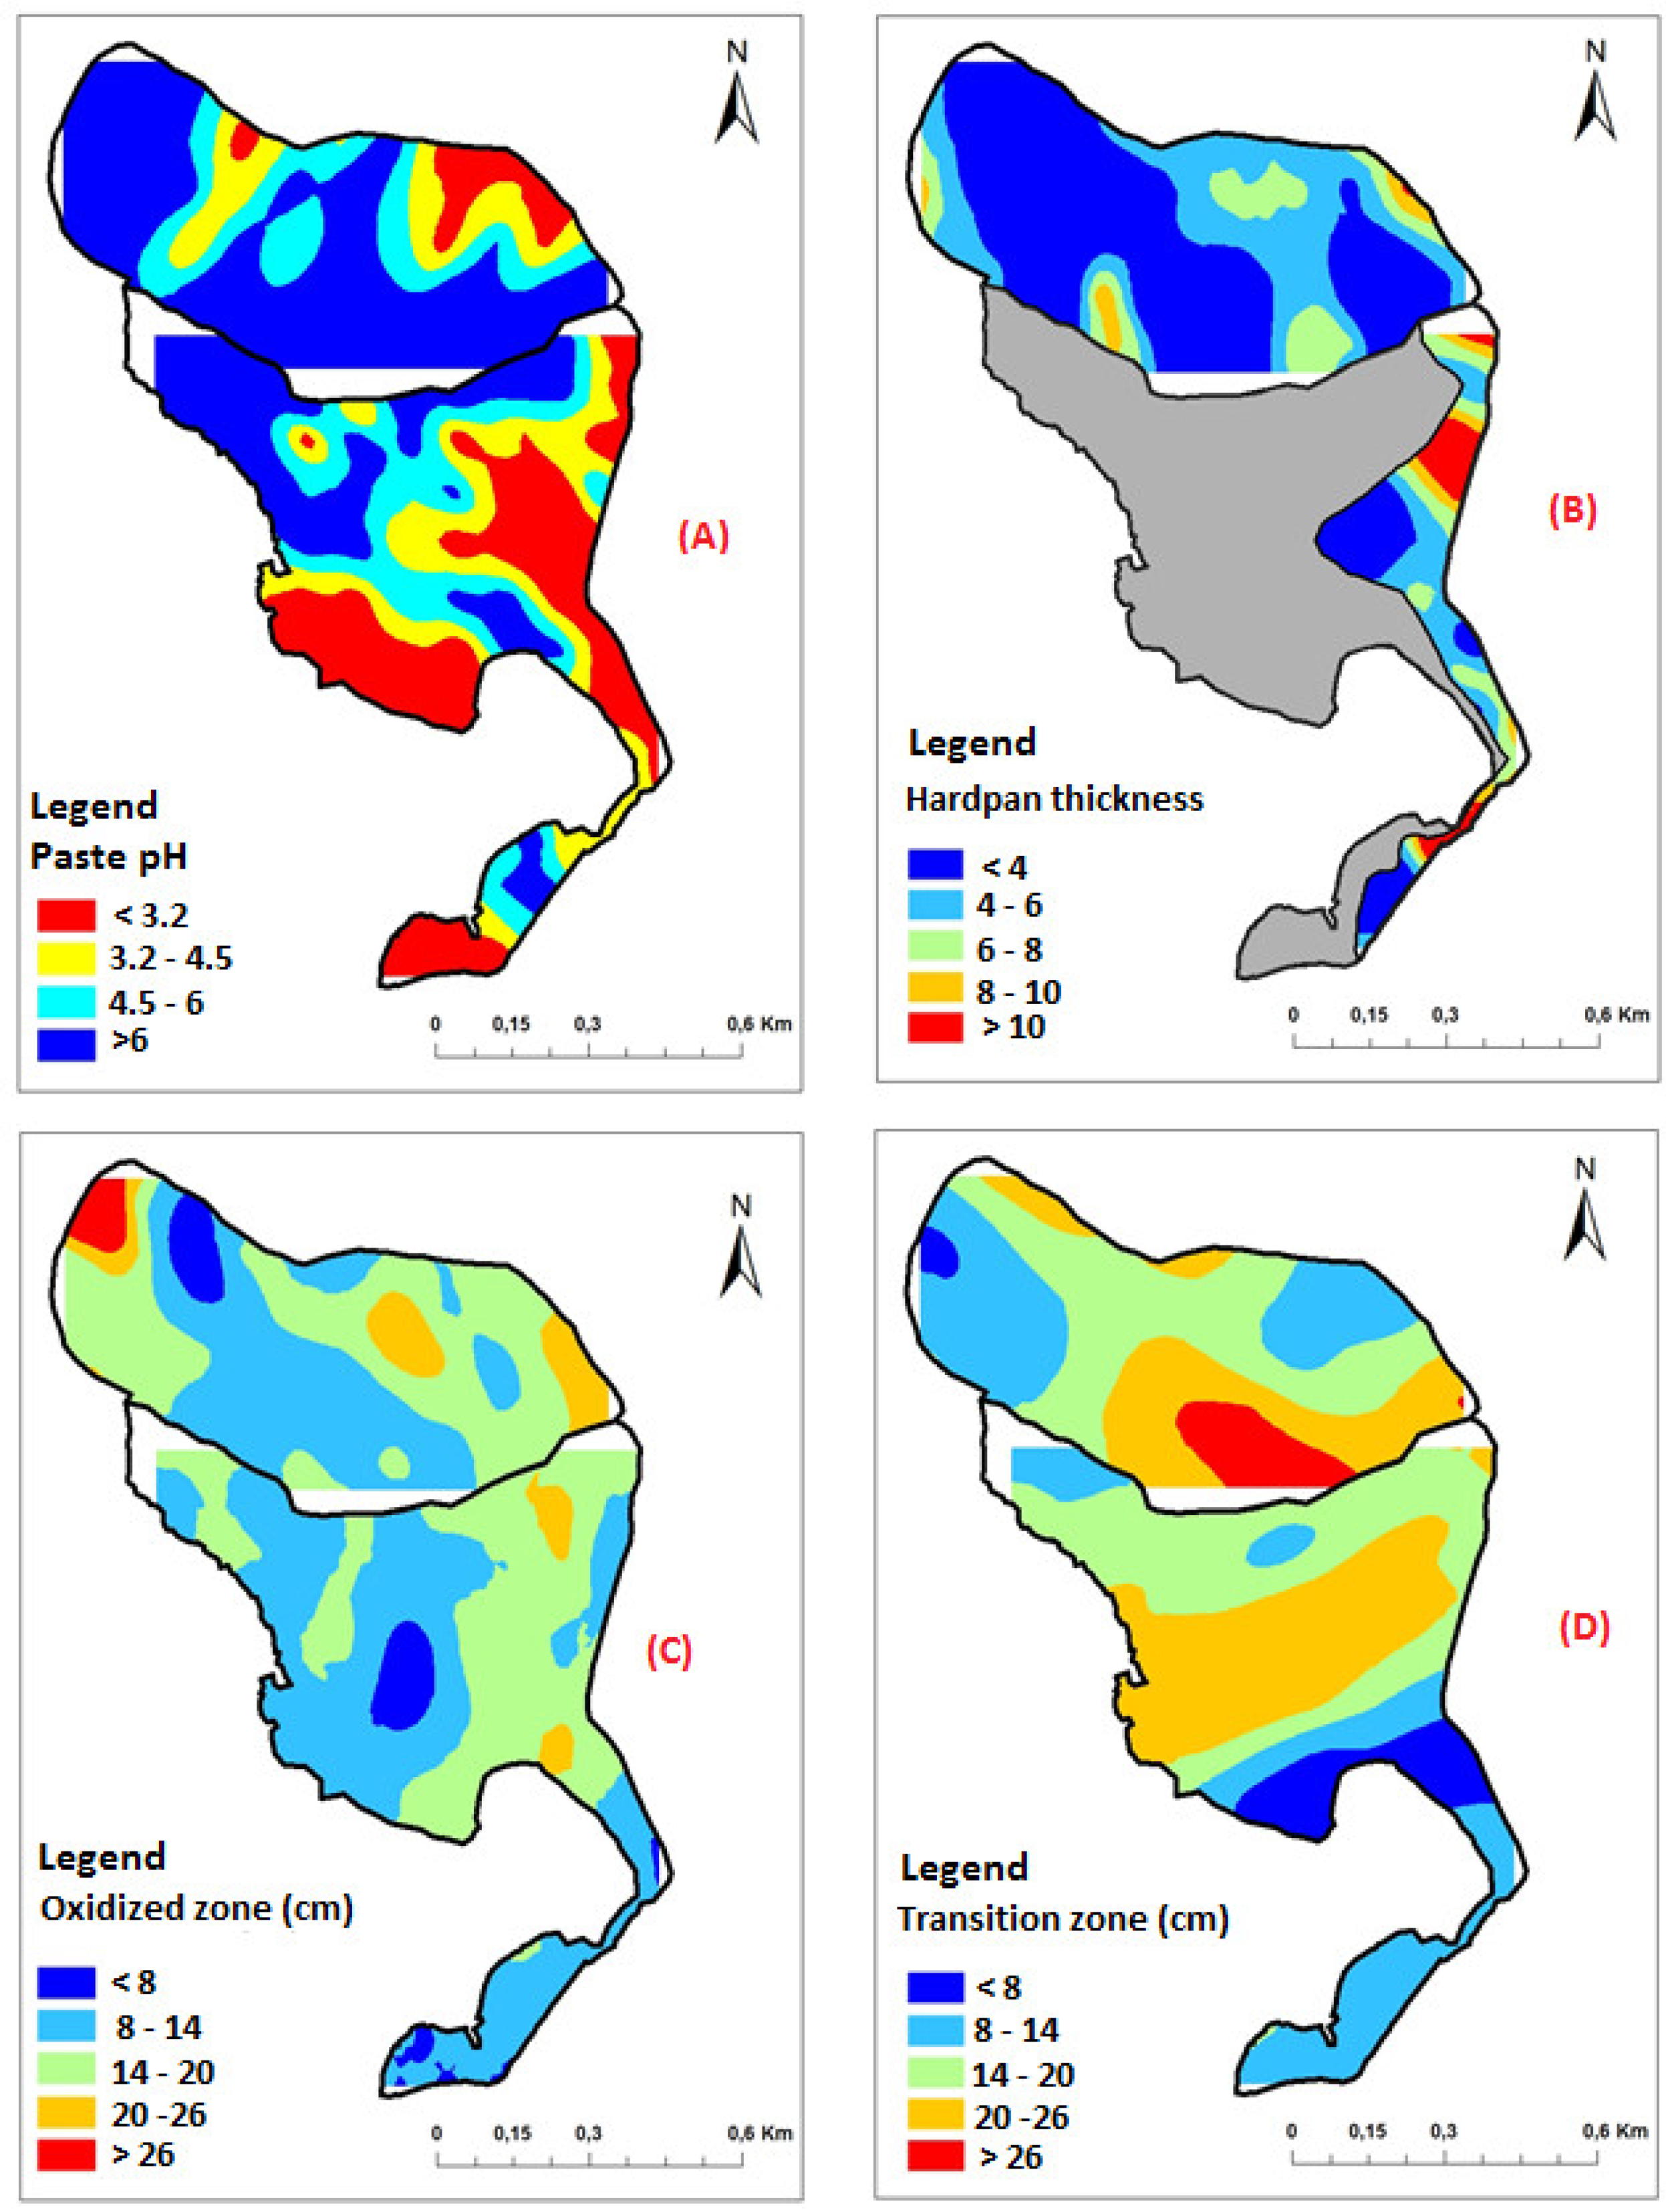
The paste pH mapping, illustrated in Figure 8A, showed high spatial variability within the oxidized tailings. In the northern zone, only some localized areas are characterized by acidic paste pH values (<3.2), while most of the northern zone is characterized by neutral paste pH values (>6). The southern zone is characterized by acidic paste pH values located at the eastern part. In general, the extent of the acidity is much higher in the southern zone than in the northern zone.
Hardpan is formed at the interface between oxidized tailings and unweathered tailings. At the Joutel site, hardpan is observable throughout the northern zone and in parts of the southern zone (Figure 8B). In the southern zone, hardpan appears in the eastern portion only and varies in thickness between 1 cm and 15 cm. In the north zone, the hardpan occurrence was observed at all the sampling stations and its thickness was between 1 cm and 10 cm. The occurrence of hardpan appears to be associated with elevation and, more specifically, the water table level. Higher topographic levels lead to deeper water table levels and more unsaturated conditions at the surface of the tailings. This results in increased sulfide oxidation and secondary phase precipitation [58]. Consequently, the western portion of the southern zone, which is characterized by lower elevations and nearly saturated conditions, shows less hardpan formation.
The oxidized layer thickness ranged from a few centimeters to more than 25 cm (Figure 8C). The maximum observed oxidized layer thickness occurred in western portions of the northern zone. In general, the oxidation layer thickness was higher in the northern zone than it was in the southern zone. This could potentially be explained by two factors: (i) The age of the tailings deposition, and (ii) the thickness of the unsaturated zone, which is influenced by the site’s topography. The northern zone is older than the southern zone and is characterized by higher elevations (Figure 7A), which favor unsaturated conditions and sulfide oxidation. The transition zone, which corresponds to the unsaturated zone, is the layer between oxidized and unweathered tailings. The transition zone thickness ranged between 2 and more than 26 cm (Figure 8D). Generally, the transition layer was thicker in the northern zone than in the southern zone.
4.1.4. S-Sulfide, C-Carbonates, NNP, and NPR
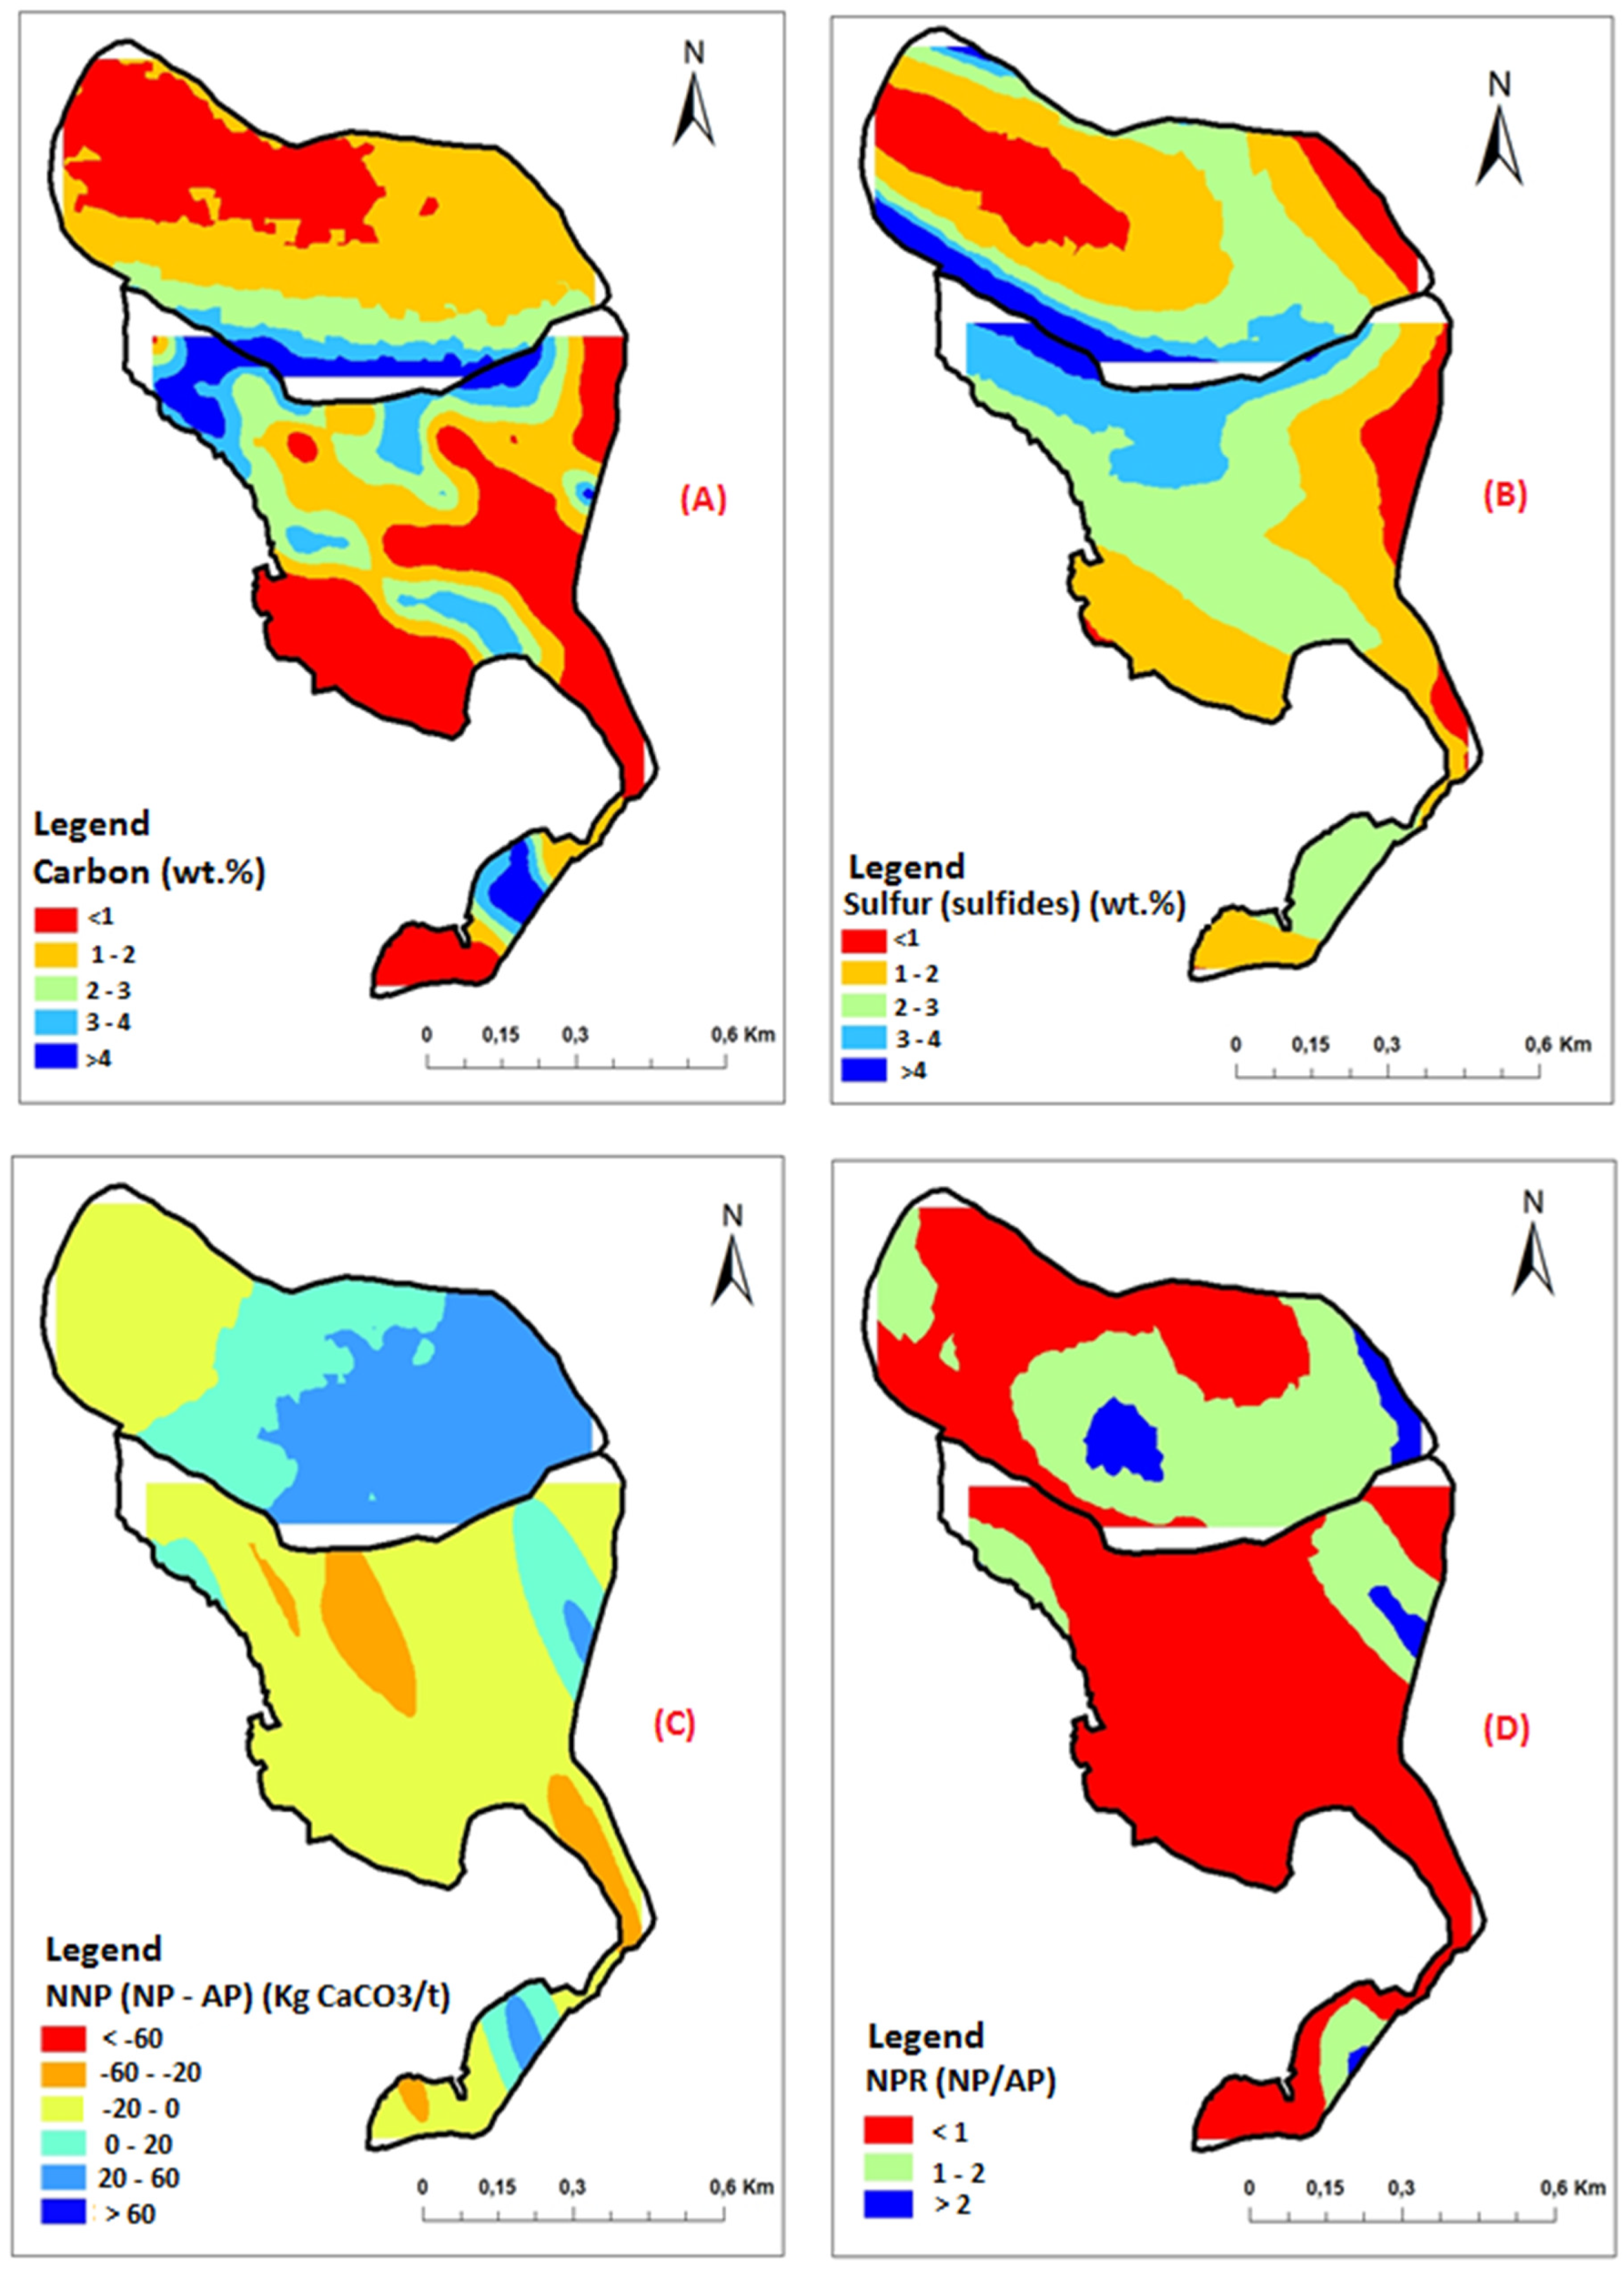
Maps of the total Cinorganic and Ssulfide analyses are presented in Figure 9A,B, respectively. The distribution patterns of Cinorganic and Ssulfide contents agree with the observations of the oxidized layer thickness. Carbon occurs primarily in carbonates, which were nearly depleted in the eastern portion of the southern zone and the western portion of the northern zone, where the carbon content was less than 1 wt.%. Carbon content in the northern zone decreased from north to south. This spatial distribution was not the same in the southern zone; carbon content decreased from south-east to north-west. Carbonate depletion appears to also be associated with the topography of the TSF (Figure 7A). Carbon content ranged between ≤0.09 wt.% and more than 4 wt.%.
The Ssulfide distribution, which corresponds to the residual acid potential of oxidized tailings, is illustrated in Figure 9B. This distribution can be compared to that of the total Cinorganic. The eastern portion of the southern zone and the western portion of the northern zone are characterized by high sulfide depletion (<1 wt.%). In other locations, the Ssulfide content (mainly pyrite) is higher than 2 wt.%. In the southern zone, the Ssulfide content increases from south-east to north-west, while in the northern zone, it increases from north to south. In general, sulfide oxidation seems to be faster and more complete within the eastern portion of the southern zone and the extreme western portion of the northern zone. This could possibly be attributed to the tailings’ degree of saturation, which is affected by the irregular topography of the TSF, as well as the heterogeneous particle size distributions of tailings across the site (Figure 7). It is recognized that the particle size influences the reactivity of mine wastes [34,35,59].
The NNP and NPR were used to classify the acid-generation potential of the oxidized Joutel tailings. The mapping of the NNP is illustrated in Figure 9C. In the southern zone, almost all samples displayed NNP values ranging between −20 and 0 kg CaCO3/t, with the exception of a few locations that had positive values. Using this criterion, samples from the southern zone were uncertain samples; only a few locations could be classified as acid generating (NNP lower than −25 kg CaCO3/t). The northern zone showed higher NNP values; this zone could be divided into three parts from east to the west. The first part, at the far east, is characterized by positive NNP values ranging between 20 and 60 kg CaCO3/t; the second part, in the center, is characterized by NNP values ranging between 0 and 20 kg CaCO3/t; and the third part, at the far west, is characterized by NNP values ranging between −20 and 0 kg CaCO3/t.
A map of the NPR values is shown in Figure 9D. The southern zone showed NPR values <1 except in a few locations. In general, tailings in the southern zone could be classified as acid-generating. The northern zone is characterized by a higher extent of zones with NPR values ranging between 1 and 2. Acid-generating tailings in the northern zone are mostly located in the east.
4.1.5. Oxygen Consumption Tests
Oxygen consumption tests allow for the in situ evaluation of sulfide reactivity [26]. Calculation of oxygen fluxes consisted of oxygen consumption tests [60]. Decreases in oxygen concentrations in a sealed chamber were converted to oxygen fluxes using the fundamental gas diffusion law, or Fick’s law [26,46,47,60]. The relationship between the decrease in oxygen concentration and oxygen flux is expressed as:
where Kr is the first order reaction rate coefficient, De is the effective diffusion coefficient, and C0 is the initial oxygen concentration at t = 0 [60]. Solving this equation is expressed as followed:
where A and V are the area and volume of the cylinder headspace, respectively.
The slope of the plot of Ln (C/C0) versus time is . The interpretation procedure, as described in Mbonimpa et al. (2003) [47], requires relatively short-duration tests (~180 min). The results of the oxygen flux calculations are shown in Table 2. Oxygen fluxes in oxidized tailings from the southern zone varied from 83 to 162 mol/m2/year, while fluxes in oxidized tailings from the northern zone varied between 13 and 71 mol/m2/year. Oxygen fluxes in hardpan from the southern and northern zones were 63 and 42 mol/m2/year, respectively. Oxygen fluxes at the six locations were low compared to observations of other similar sulfidic tailings [61,62,63]. This was expected due to the low sulfide content within the oxidized tailings. In contrast, the hardpan locations also presented low oxygen fluxes despite their high sulfide contents. This is likely due to their microstructure (low porosity) and texture [19]. Sulfides within the hardpan are almost entirely coated by ferric oxyhydroxides, which protects them by limiting oxygen diffusion to their unreacted cores. Hardpans are also characterized by low porosities and cementitious textures [58].
4.1.6. Multivariate Analysis
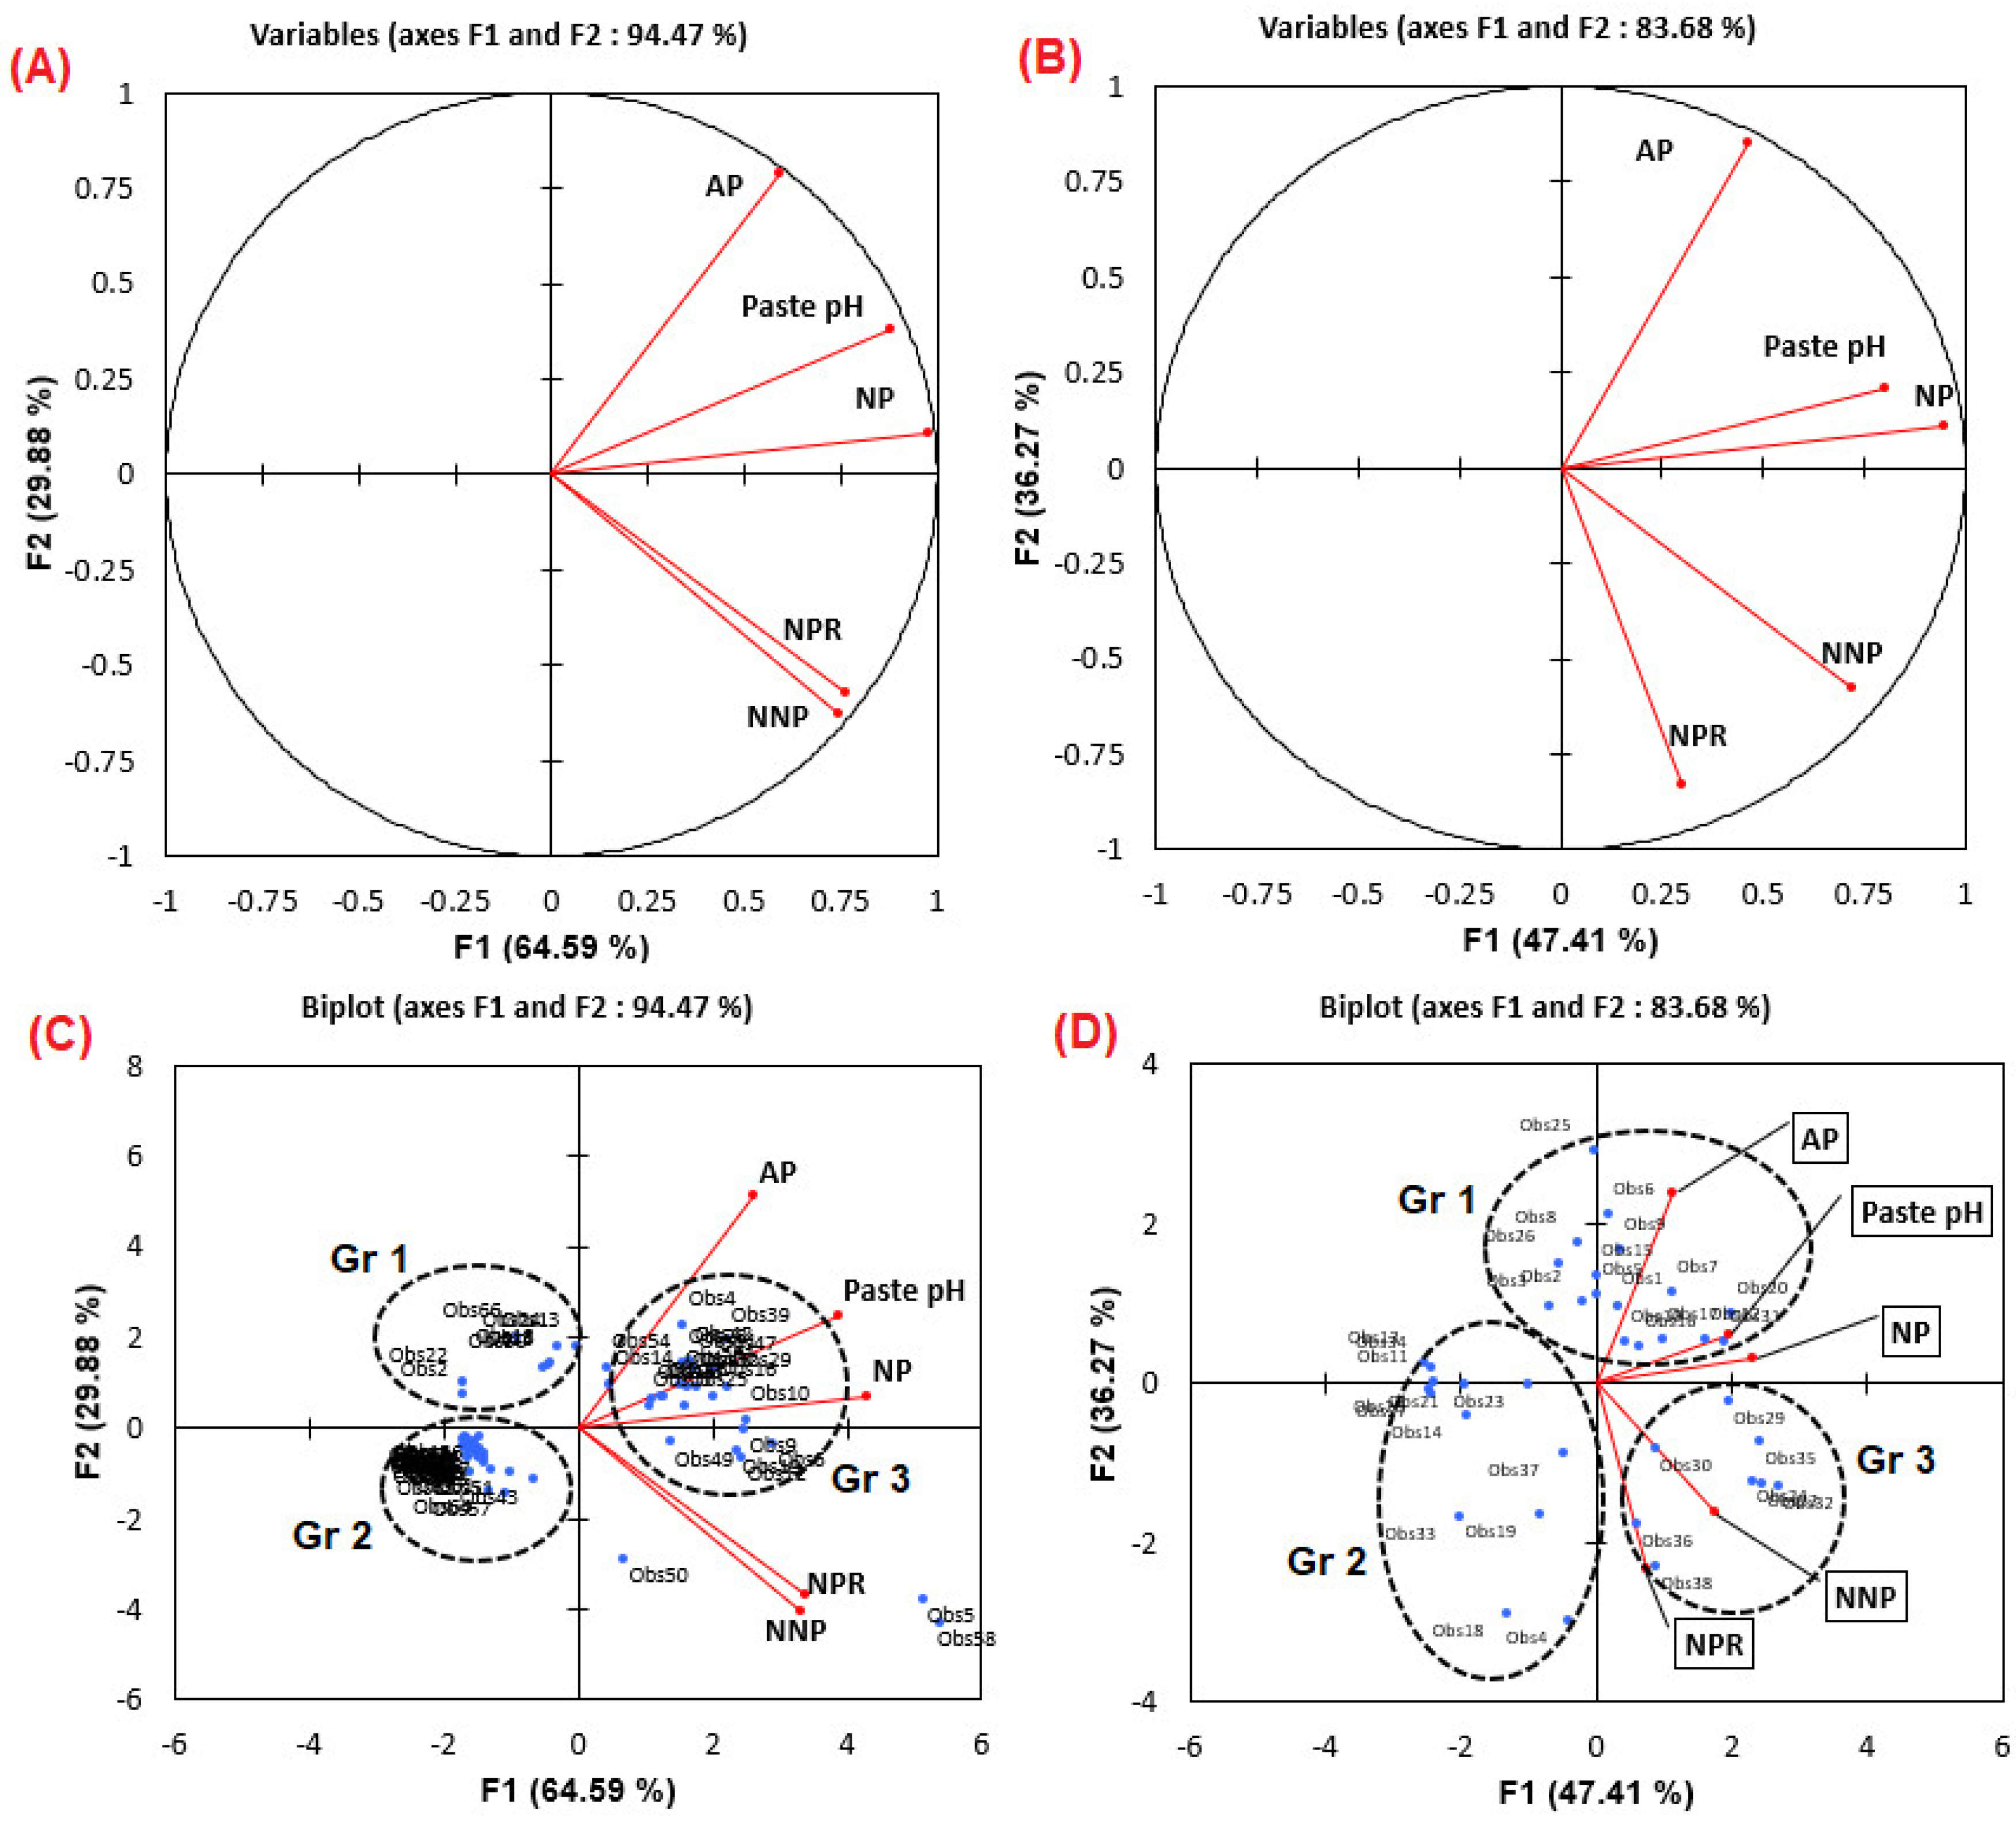
In this study, paste pH in this study was used as a criterion to indicate the acidity of the upper oxidized tailings. To determine the key parameters that affect paste pH and the relationships among these different geochemical parameters, PCA was performed using four other parameters: AP, NP, NNP, and NPR. Correlation matrices for the northern and southern zones are shown in Table 3. Paste pH positively correlated with both AP and NP; the highest correlation was with NP. Linear correlation values between NP and paste pH were 0.86 and 0.62 for the southern and the northern zones, respectively. Despite the calculations for NNP and NPR being based on NP and AP values, their correlations with paste pH were lower (maximum of 0.45). Using only the two first factors (F1 and F2), the cumulative variability was approximately 94.50% and 83.70% for the southern and northern zones, respectively. Factor F1 explained 64.60% and 47.40% of the total variance in the paste pH in the southern and northern zones, respectively. Similarly, factor F2 explained 29.90% and 36.30% of the total variance in the paste pH in the southern and northern zones. The results of the correlation values were more significant within PCA (Figure 10A,B). Paste pH, NP, and AP are in the same quadrant of the circle of PCA. There are high values of paste pH and NP in F1 and significant loading of AP, NNP, and NPR in F1 within the data of the two zones, which is confirmed by the correlation matrix between the factors and variables (Table 4). Concerning F2, there is a high value of AP in this component within the two zones and negative values of NNP and NPR in this component (Table 4). The high value of the paste pH and NP in the F1 indicates as excepted that they are interdependent. High values of the paste pH involve high values of NP and vice versa; acidic paste pH values are due to sulfide oxidation and subsequent carbonate dissolution. Consequently, the principal component, F1, could be interpreted as the NP. The high loading of AP in the F2 and the negative loading of the NNP and NPR indicates that these parameters are negatively correlated. This is explained by the initial calculation of NNP (NP-AP) and NPR (NP/AP). Consequently, the second principal component, F2, could be interpreted as the AP.
The biplots in Figure 10C,D show all tailings samples on a plot of F1 versus F2. Samples were split into three groups for each zone. The differences between samples are due to variations in their NP (F1) and AP (F2). Some samples in the northern and southern zones do not fit into the identified groups and could be considered outliers. Group 1 (Gr1) is comprised of samples with AP values greater than 80 kg CaCO3/t, NPR values lower than 0.5, NNP values lower than −65 kg CaCO3/t, and acidic paste pH values. Group 2 (Gr2) is comprised of samples with AP values lower than 30 kg CaCO3/t, NPR values lower than 0.45, NNP values lower than −30 kg CaCO3/t, and paste pH values lower than 3.30. Group 3 is comprised of samples with paste pH values greater than 6, AP values greater than 90 kg CaCO3/t, NNP values ranging between −40 and 3 kg CaCO3/t, and an average NPR of 1. The group 1 is located at the eastern and northern part of south and north zone of the TSF, respectively. The group 2 is located at the central part of the south zone and the north zone. The group 3 is located at western zone and the south part of the south and the north zone, respectively.
4.2. Discussion
The sampling strategy used in this study consisted of systematic sampling with a sample spacing of about 100 m. This allowed the mapping of the spatial variability of the geochemical properties of the oxidized tailings at a resolution of 100 × 100 m. However, depending on the objective of the study and sampling costs, adjustments could be made to the spatial resolution of the sampling without compromising the mapping resolution. This methodology allowed delimiting the problematic zones, which are characterized by an acidic paste pH. Furthermore, corresponding to the conceptual model discussed in Elghali et al. (2019b) [19], which stated that the geochemistry of Joutel’s tailings is mainly controlled by the reactivity of the oxidized tailings (Figure S2), mapping the oxidized tailings’ depth could be helpful to calculate the volume of the acidic tailings to be treated.
Joutel’s oxidized tailings showed high spatial variability regarding their chemical and mineralogical properties. The TSF displayed zones with completely depleted sulfur-sulfide and carbon-carbonates and other zones with moderate carbon-carbonates and sulfur-sulfide (≥2 wt.%). The analyzed samples using QEMSCAN showed a variable mineralogical composition regarding their sulfide and carbonate contents, which explains the chemical variability of these samples. Furthermore, sulfides within Joutel tailings are not completely liberated (Figure 6). The sulfide and carbonate associations with non-sulfide gangue minerals reduce their reactive amount [34,35]. An average of 11% and 16% of Ca-Mg carbonates and pyrite are less than 50% liberated, respectively. During sulfide oxidation and carbonate dissolution, iron oxy-hydroxides may precipitate at the surface of sulfides and carbonates, which considerably reduces their liberation degree. This phenomenon of sulfide and carbonate coating is widely observed within reactive and oxidized tailings [10,18].
The chemical and mineralogical variability could be explained based on two parameters, which are: (i) The heterogeneity of tailings’ physical characteristics (particle size distribution and specific surface area) caused by tailings segregation during their deposition [64], and (ii) the initial heterogeneity of the mineralogical characteristics of the ore body. Moreover, oxidized tailings and hardpans samples showed a relatively similar mineralogical composition regarding secondary minerals contents, but a different texture. As stated in Elghali et al. (2019) [19], the hardpan is a cementitious layer, with low saturated hydraulic conductivity values, formed at the interface of oxidized and unweathered tailings.
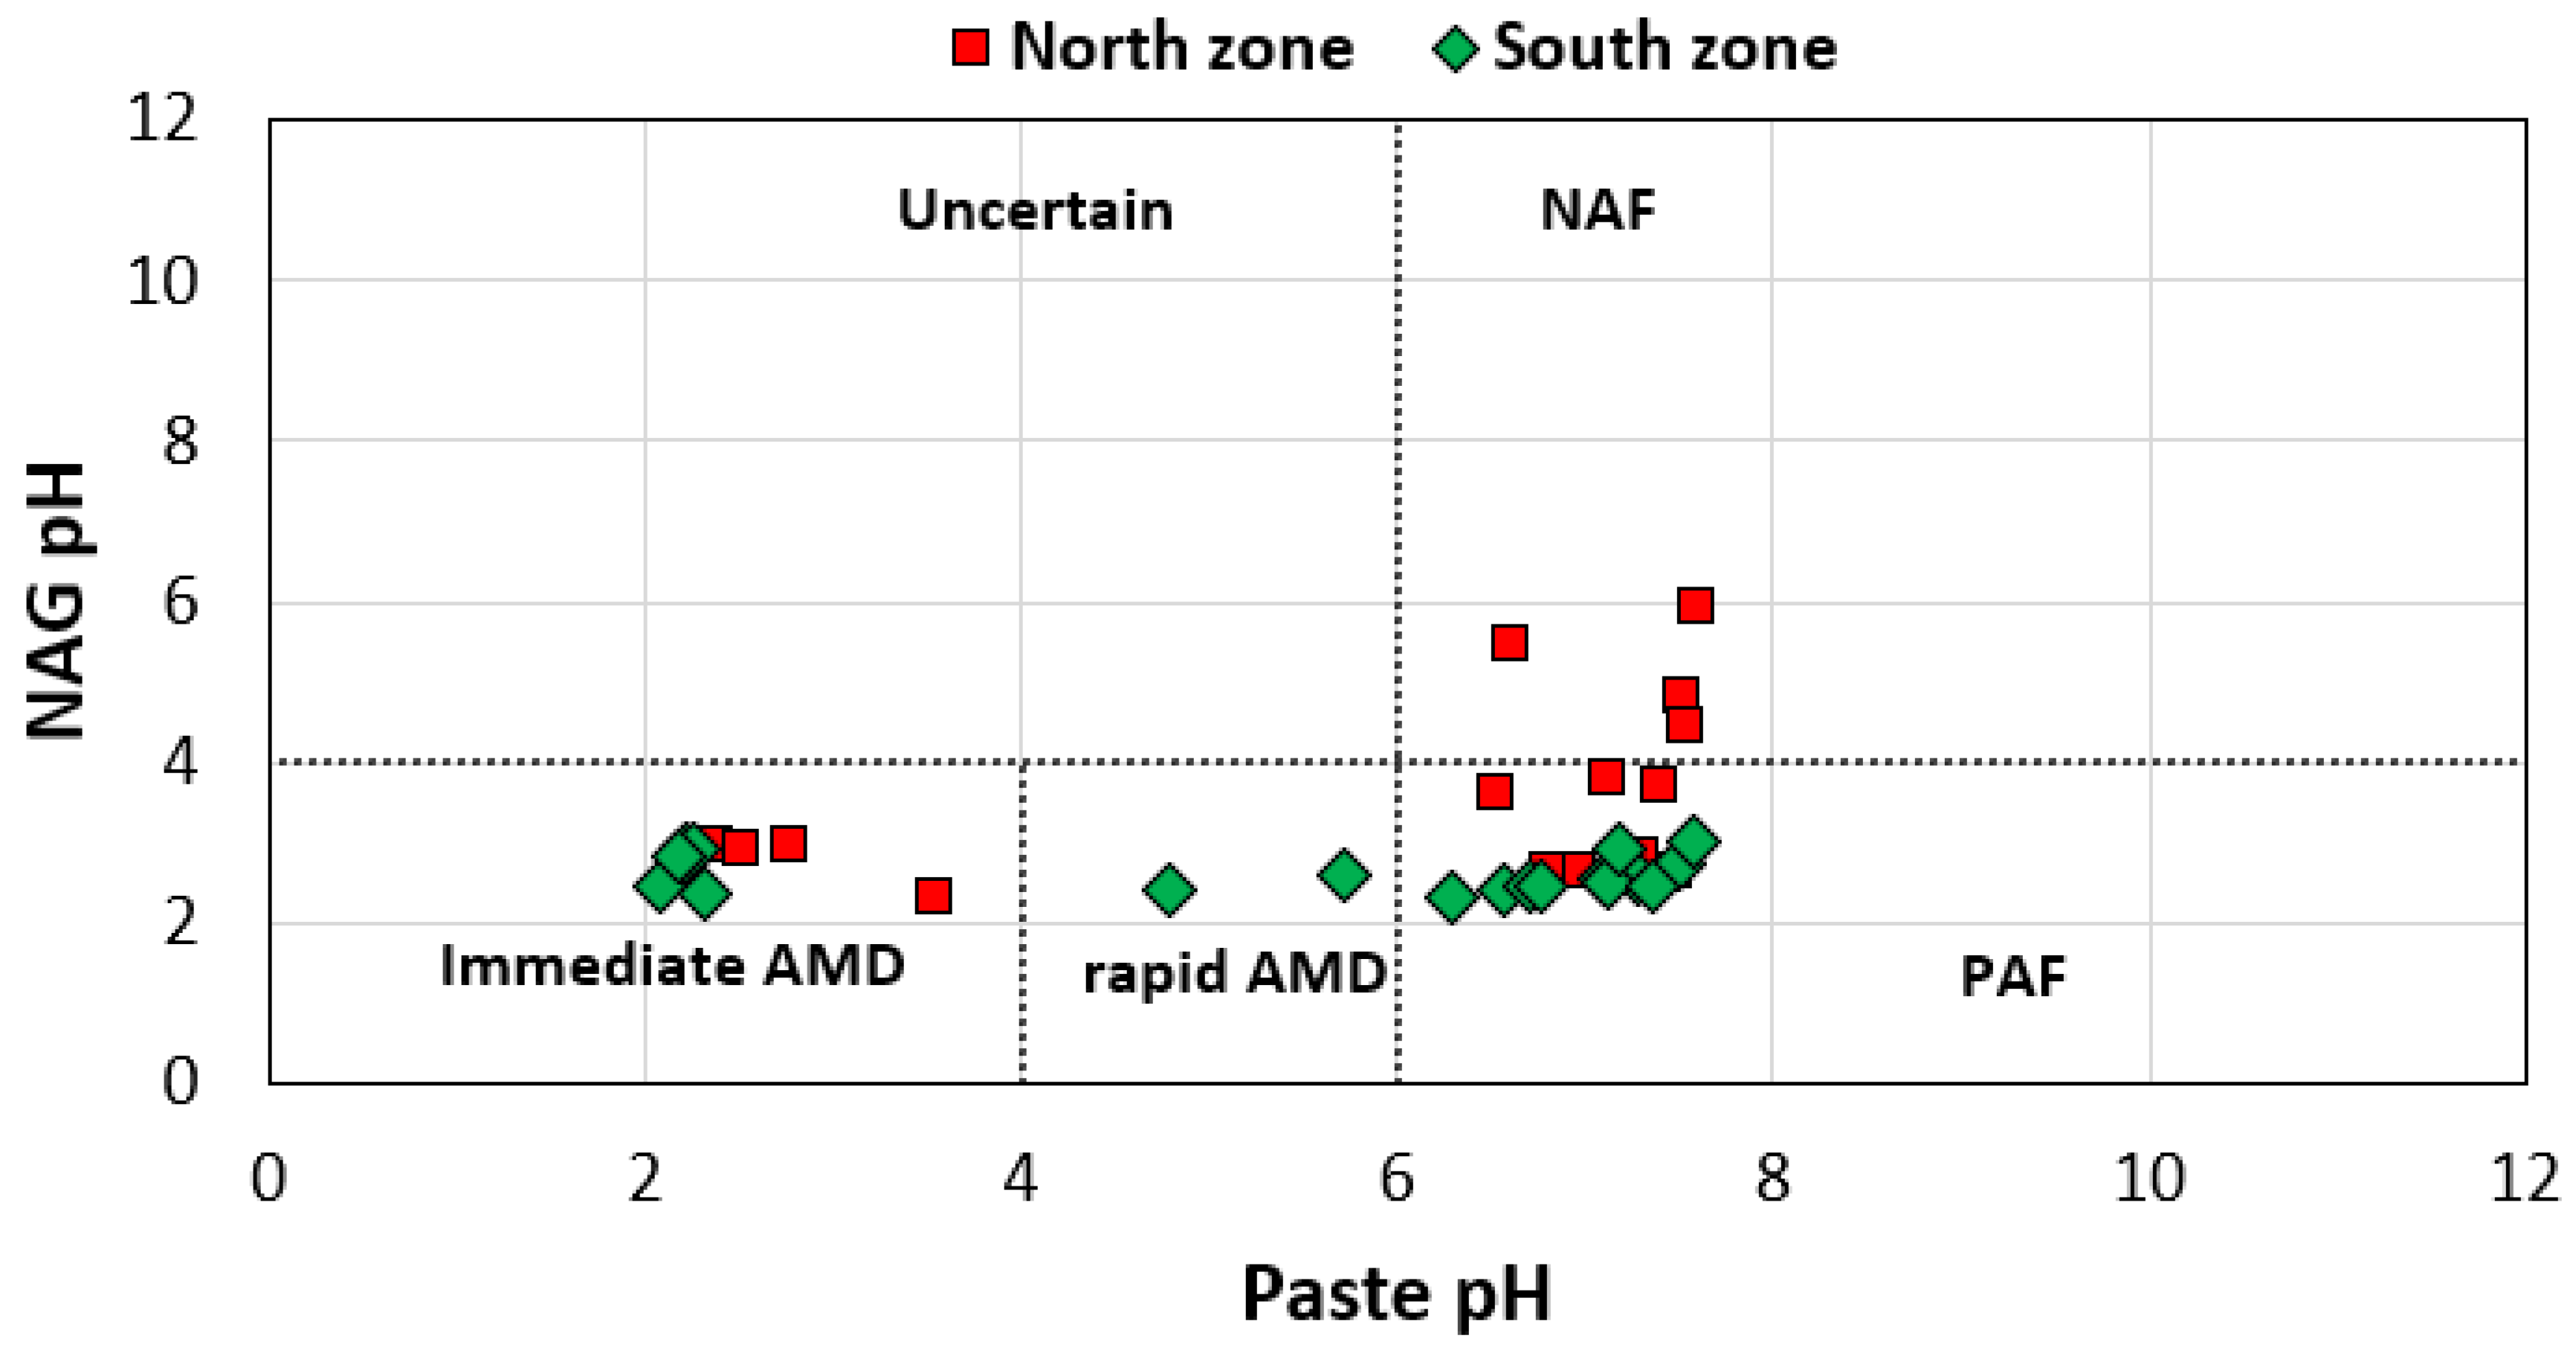
Paste pH is generally considered to be a static test and used to assess the instantaneous acid-base balance. These tests do not provide any information about reaction kinetics for unweathered tailings [65]. To better understand the long-term behavior of oxidized samples, NAG tests were performed on several randomly selected samples. The combination of paste pH and NAG pH could indicate the long-term behavior of these samples [65,66]. Samples with extremely acidic paste pH values (lower than 4) were classified as immediately acid-generating. In contrast, several samples with neutral paste pH values, but acidic NAG pH values were classified as potentially acid-generating, meaning that they will generate acidity after a lag time (Figure 11). This lag time corresponds to the period during which the Fe and Mn released by carbonate dissolution becomes oxidized. Based on these tests, Joutel’s TSF can be considered potentially acid-generating in the long-term.
In general, the eastern side of the south zone is characterized with acidic paste pH and almost depleted sulfide and carbonate content. This could be explained by the tailing’s deposition history. The input locations for the tailings were located at the eastern part of this zone. Consequently, heavy minerals, such as sulfides and coarse fractions, will preferentially settle next to the deposition points. Furthermore, the eastern zone will be a reactive one compared to the other locations in the south zone.
The implementation of georeferenced databases can: (i) Improve the understanding of the geochemical processes within TSFs, and (ii) help in the design of site-wide reclamation strategies. Based on the mapping of paste pH values, the Joutel TSF was divided into two zones: An acidic zone with paste pH values lower than 6.5, and a neutral zone with paste pH values with greater than 6.5. The acidic zones correspond to areas where carbonates are almost completely depleted; this was confirmed by the high coefficient of correlation between paste pH values and Cinorganic contents. The neutral zones are characterized by non-negligible carbonate and sulfide contents. This means that not all the tailings on the Joutel site are acid-generating and only a few locations are presently acidic.
5. Conclusions
This study highlights an innovative approach for the spatially referenced geochemical characterization of inactive tailings storage facilities using geographical information systems. The multi-technique characterization was undertaken using a systematic sampling approach. This allowed for the production of georeferenced databases that were used to advance two main objectives: (i) To integrate and correlate the geochemical properties of the oxidized tailings at the Joutel mine site, and (ii) to identify the most appropriate reclamation scenario of the TSF by taking into account the spatial variabilities of the site’s geochemical properties.
The GIS-based approach adds a spatial component to traditional geochemical analyses, which is not usually incorporated when laboratory-based tests are performed alone, and allows for a better understanding of in situ conditions. For example, on-site observations of the hardpan thickness revealed variations from a few millimetres to more than 20 cm across the entire site. This spatial variability means that the water balance within the oxidized material will change depending on the location on the site. Additionally, acidic areas of the site were found to occur in the eastern portion of the southern zone and in the western portion of the northern zone. These areas appear to be limited to a few locations where the carbonates are almost completely depleted as confirmed by correlations between the spatial maps generated for paste pH and carbonates content.
Supplementary Materials
The following are available online at https://www.mdpi.com/2075-163X/9/3/180/s1. Figure S1: Graph comparing the NP calculated based on carbonate contents and NP analyzed using the Sobek method (1978) [36] as modified by Lawrence et Wang (1996) [67]. Figure S2: conceptual model illustrating the geochemical evolution of the Joutel tailings (Reproduced with permission from Elghali et al (2019) [19]; Table S1: Sampling depth of the collected samples.
Author Contributions
Conceptualization, A.E., M.B., B.B., T.G.; formal analysis and investigation, AE., T.G.; writing—original draft preparation, A.E., M.B.; writing review and editing, A.E., M.B., B.B., T.G.; writing—review and editing, A.B., M.B.; project administration, M.B., B.B.
Funding
Funding for this study was provided by Mitacs (https://www.mitacs.ca/fr) and the NSERC-UQAT Industrial Research Chair on Mine Site Reclamation and its partners.
Acknowledgments
The authors thank Chris Kennedy, Josée Noel, and Jean Cayouette for their assistance with this manuscript. The authors also thank the URSTM staff for their support with laboratory and field work.
Conflicts of Interest
The authors declare no conflict of interest.
References
- Bussière, B. Hydro-geotechnical properties of hard rock tailing from metal mines and emerging geo-environmental disposal approaches. Can. Geotech. J. 2007, 44, 1019–1052. [Google Scholar] [CrossRef]
- Blowes, D.; Ptacek, C.; Jambor, J.; Weisener, C.; Paktunc, D.; Gould, W.; Johnson, D. The Geochemistry of Acid Mine Drainage; Elsevier: Amsterdam, The Netherlands, 2014. [Google Scholar]
- Benzaazoua, M.; Belem, T.; Bussière, B. Chemical factors that influence the performance of mine sulphidic paste backfill. Cem. Concr. Res. 2002, 32, 1133–1144. [Google Scholar] [CrossRef]
- Benzaazoua, M.; Bussière, B.; Demers, I.; Aubertin, M.; Fried, É.; Blier, A. Integrated mine tailings management by combining environmental desulphurization and cemented paste backfill: Application to mine Doyon, Quebec, Canada. Miner. Eng. 2008, 21, 330–340. [Google Scholar] [CrossRef]
- Belem, T.; Benzaazoua, M.; Bussière, B. Mechanical behaviour of cemented paste backfill. In Proceedings of the 53rd Candadian Geotechnical Conference, Montreal, QC, Canada, 15–18 October 2000; pp. 373–380. [Google Scholar]
- Nicholson, R.V.; Gillham, R.W.; Reardon, E.J. Pyrite oxidation in carbonate-buffered solution: 1. Experimental kinetics. Geochim. Cosmochim. Acta 1988, 52, 1077–1085. [Google Scholar] [CrossRef]
- Plante, B.; Bussière, B.; Benzaazoua, M. Static tests response on 5 Canadian hard rock mine tailings with low net acid-generating potentials. J. Geochem. Explor. 2012, 114, 57–69. [Google Scholar] [CrossRef]
- Jamieson, H.E.; Walker, S.R.; Parsons, M.B. Mineralogical characterization of mine waste. Appl. Geochem. 2015, 57, 85–105. [Google Scholar] [CrossRef]
- Moncur, M.C.; Ptacek, C.J.; Blowes, D.W.; Jambor, J.L. Release, transport and attenuation of metals from an old tailings impoundment. Appl. Geochem. 2005, 20, 639–659. [Google Scholar] [CrossRef]
- McGregor, R.; Blowes, D.; Jambor, J.; Robertson, W. Mobilization and attenuation of heavy metals within a nickel mine tailings impoundment near Sudbury, Ontario, Canada. Environ. Geol. 1998, 36, 305–319. [Google Scholar] [CrossRef]
- Benzaazoua, M.; Bussière, B.; Dagenais, A.-M.; Archambault, M. Kinetic tests comparison and interpretation for prediction of the Joutel tailings acid generation potential. Environ. Geol. 2004, 46, 1086–1101. [Google Scholar] [CrossRef]
- Plante, B.; Benzaazoua, M.; Bussière, B. Predicting geochemical behaviour of waste rock with low acid generating potential using laboratory kinetic tests. Mine Water Environ. 2011, 30, 2–21. [Google Scholar] [CrossRef]
- Bussière, B.; Aubertin, M.; Benzaazoua, M.; Gagnon, D. Modèle d’estimation des coûts de restauration de sites miniers générateurs de DMA. In Séminaire Mines écologiques présentés dans le cadre du congrès APGGQ; Les sciences de la terre: Rouyn-Noranda, QC, Canada, 1999. [Google Scholar]
- Cornell, R.M.; Schwertmann, U. Environmental Significance. In The Iron Oxide; Wiley-VCH Verlag GmbH & Co. KGaA: Weinheim, Germany, 2004; pp. 541–551. [Google Scholar] [CrossRef]
- Cravotta, C.A., III. Dissolved metals and associated constituents in abandoned coal-mine discharges, Pennsylvania, USA. Part 1: Constituent quantities and correlations. Appl. Geochem. 2008, 23, 166–202. [Google Scholar] [CrossRef]
- Cravotta, C.A., III. Dissolved metals and associated constituents in abandoned coal-mine discharges, Pennsylvania, USA. Part 2: Geochemical controls on constituent concentrations. Appl. Geochem. 2008, 23, 203–226. [Google Scholar] [CrossRef]
- Dold, B. Acid rock drainage prediction: A critical review. J. Geochem. Explor. 2017, 172, 120–132. [Google Scholar] [CrossRef]
- Blowes, D.W.; Reardon, E.J.; Jambor, J.L.; Cherry, J.A. The formation and potential importance of cemented layers in inactive sulfide mine tailings. Geochim.Cosmochim. Acta 1991, 55, 965–978. [Google Scholar] [CrossRef]
- Elghali, A.; Benzaazoua, M.; Bussière, B.; Kennedy, C.; Parwani, R.; Graham, S. The role of hardpan formation on the reactivity of sulfidic mine tailings: A case study at Joutel mine (Québec). Sci. Total Environ. 2019, 654, 118–128. [Google Scholar] [CrossRef] [PubMed]
- Chermak, J.A.; Runnells, D.D. Self-sealing hardpan barriers to minimize infiltration of water into sulfide-bearing overburden, ore, and tailings piles. Proceedings of Tailings and mine waste, Fort Collins, CO, USA, 16–19 January 1996; pp. 265–273. [Google Scholar]
- Holmström, H.; Öhlander, B. Layers rich in Fe- and Mn-oxyhydroxides formed at the tailings-pond water interface, a possible trap for trace metals in flooded mine tailings. J. Geochem. Explor. 2001, 74, 189–203. [Google Scholar] [CrossRef]
- Kohfahl, C.; Graupner, T.; Fetzer, C.; Holzbecher, E.; Pekdeger, A. The impact of hardpans and cemented layers on oxygen diffusivity in mining waste heaps: Diffusion experiments and modelling studies. Sci. Total Environ. 2011, 409, 3197–3205. [Google Scholar] [CrossRef]
- McGregor, R.; Blowes, D. The physical, chemical and mineralogical properties of three cemented layers within sulfide-bearing mine tailings. J. Geochem. Explor. 2002, 76, 195–207. [Google Scholar] [CrossRef]
- Blowes, D.W.; Jambor, J.L.; Hanton-Fong, C.J.; Lortie, L.; Gould, W.D. Geochemical, mineralogical and microbiological characterization of a sulphide-bearing carbonate-rich gold-mine tailings impoundment, Joutel, Québec. Appl. Geochem. 1998, 13, 687–705. [Google Scholar] [CrossRef]
- Barnett, E.; Hutchinson, R.; Adamcik, A.; Barnett, R. Geology of the Agnico-Eagle gold deposit, Quebec. Precambrian Sulphide Depos. Geol. Assoc. Can. Spec. Pap. 1982, 25, 403–426. [Google Scholar]
- Bussière, B.; Benzaazoua, M.; Aubertin, M.; Mbonimpa, M. A laboratory study of covers made of low-sulphide tailings to prevent acid mine drainage. Environ. Geol. 2004, 45, 609–622. [Google Scholar] [CrossRef]
- Chopard, A.; Benzaazoua, M.; Plante, B.; Bouzahzah, H.; Marion, P. Kinetic tests to evaluate the relative oxidation rates of various sulfides and sulfosalts. In Proceedings of the 10th International Conference on Acid Rock Drainage and IMWA Annual Conference, Santiago, Chile, 21–24 April 2015. [Google Scholar]
- Allen, T. Powder Sampling and Particle Size Determination; Elsevier: Amsterdam, The Netherlands, 2003. [Google Scholar]
- Atkinson, P.M.; Lloyd, C.D. Mapping precipitation in Switzerland with ordinary and indicator kriging. Special issue: Spatial Interpolation Comparison 97. J. Geogr. Inf. Decis. Anal. 1998, 2, 72–86. [Google Scholar]
- Carter, M.R. Soil Sampling and Methods of Analysis; CRC Press: Boca Raton, FL, USA, 1993. [Google Scholar]
- Poduri, S.; Rao, R. Sampling Methodology with Applications; Chapman and Hall: New York, NY, USA, 2000. [Google Scholar]
- Popek, E.P. Sampling and Analysis of Environmental Chemical Pollutants: A Complete Guide; Academic Press: Cambridge, MA, USA, 2003. [Google Scholar]
- Sampath, S. Sampling Theory and Methods; CRC press: Boca Raton, FL, USA, 2001. [Google Scholar]
- Elghali, A.; Benzaazoua, M.; Bouzahzah, H.; Bussière, B.; Villarraga-Gómez, H. Determination of the available acid-generating potential of waste rock, part I: Mineralogical approach. Appl. Geochem. 2018, 99, 31–41. [Google Scholar] [CrossRef]
- Elghali, A.; Benzaazoua, M.; Bussière, B.; Bouzahzah, H. Determination of the available acid-generating potential of waste rock, part II: Waste management involvement. Appl. Geochem. 2019, 100, 316–325. [Google Scholar] [CrossRef]
- Sobek, A.A.; Schuller, W.; Freeman, J.; Smith, R. Field and Laboratory Methods Applicable to Overburdens and Minesoils, 1978; US Environmental Protection Agency: Cincinnati, OH, USA, 1978; Volume 45268, pp. 47–50.
- Bouzahzah, H.; Benzaazoua, M.; Plante, B.; Bussiere, B. A quantitative approach for the estimation of the “fizz rating” parameter in the acid-base accounting tests: A new adaptations of the Sobek test. J. Geochem. Explor. 2015, 153, 53–65. [Google Scholar] [CrossRef]
- Adam, K.; Kourtis, A.; Gazea, B.; Kontopoulos, A. Evaluation of static tests used to predict the potential for acid drainage generation at sulphide mine sites. Min. Tech. 1997, 16, A1–A8. [Google Scholar]
- Chotpantarat, S. A review of static tests and recent studies. Am. J. Appl. Sci. 2011, 8, 400. [Google Scholar] [CrossRef]
- Jambor, J.; Dutrizac, J.; Groat, L.; Raudsepp, M. Static tests of neutralization potentials of silicate and aluminosilicate minerals. Environ. Geol. 2002, 43, 1–17. [Google Scholar]
- Paktunc, A.; Leaver, M.; Salley, J.; Wilson, J. A new standard material for acid base accounting tests. In Proceedings of the Securing the Future, International Conference on Mining and the Environment, Skelleftea, Sweden, 25 June–1 July 2001; pp. 644–652. [Google Scholar]
- Price, W.A. Prediction manual for drainage chemistry from sulphidic geologic materials. MEND Rep. 2009, 1, 579. [Google Scholar]
- Sapsford, D.; Bowell, R.; Dey, M.; Williams, C.; Williams, K. A Comparison of Kinetic NAG Tests with Static and Humidity Cell Tests for the Prediction of ARD; Mine Water and the Environment: Ostrava, Czech Republic, 2008; pp. 325–328. [Google Scholar]
- Miller, S.; Robertson, A.; Donahue, T. Advances in acid drainage prediction using the net acid generation (NAG) test. In Proceedings of the 4th International Conference on Acid Rock Drainage, Vancouver, BC, Canada, 31 May–6 June 1997; pp. 0533–0549. [Google Scholar]
- Smart, R.; Skinner, W.; Levay, G.; Gerson, A.; Thomas, J.; Sobieraj, H.; Schumann, R.; Weisener, C.; Weber, P.; Miller, S. ARD Test Handbook: Project P387A, Prediction and Kinetic Control of Acid Mine Drainage; AMIRA International Ltd.: Melbourne, Australia, 2002. [Google Scholar]
- Elberling, B.; Nicholson, R.V. Field determination of sulphide oxidation rates in mine tailings. Water Resour. Res. 1996, 32, 1773–1784. [Google Scholar] [CrossRef]
- Mbonimpa, M.; Aubertin, M.; Aachib, M.; Bussière, B. Diffusion and consumption of oxygen in unsaturated cover materials. Can. Geotech. J. 2003, 40, 916–932. [Google Scholar] [CrossRef]
- Mbonimpa, M.; Aubertin, M.; Bussière, B. Oxygen consumption test to evaluate the diffusive flux into reactive tailings: Interpretation and numerical assessment. Can. Geotech. J. 2011, 48, 878–890. [Google Scholar] [CrossRef]
- Cressie, N. Spatial prediction and ordinary kriging. Math. Geol. 1988, 20, 405–421. [Google Scholar] [CrossRef]
- Gratton, Y. Le krigeage: La méthode optimale d’interpolation spatiale. Les articles de l’Institut d’Analyse Géographique 2002, 1, 4. [Google Scholar]
- Oliver, M.A.; Webster, R. Kriging: A method of interpolation for geographical information systems. Int. J. Geogr. Inf. Syst. 1990, 4, 313–332. [Google Scholar] [CrossRef]
- Singh, C.K.; Kumar, A.; Shashtri, S.; Kumar, A.; Kumar, P.; Mallick, J. Multivariate statistical analysis and geochemical modeling for geochemical assessment of groundwater of Delhi, India. J. Geochem. Explor. 2017, 175, 59–71. [Google Scholar] [CrossRef]
- Paktunc, A.; Davé, N. Mineralogy of pyritic waste rock leached by column experiments and prediction of acid mine drainage. In Applied Mineralogy in Research, Economy, Technology, Ecology and Culture, Proceedings of the 6th International Congress on Applied Mineralogy; Balkema: Avereest, The Netherlands, 2000; pp. 621–623. [Google Scholar]
- Lawrence, R.W.; Wang, Y. Determination of neutralization potential in the prediction of acid rock drainage. In Proceedings of the Fourth International Conference on Acid Rock Drainage, Vancouver, BC, Canada, 31 May–6 June 1997; pp. 451–464. [Google Scholar]
- Jambor, J.; Dutrizac, J.; Raudsepp, M.; Groat, L. Effect of peroxide on neutralization-potential values of siderite and other carbonate minerals. J. Environ. Qual. 2003, 32, 2373–2378. [Google Scholar] [CrossRef]
- Weber, P.A.; Thomas, J.E.; Skinner, W.M.; Smart, R.S.C. Improved acid neutralisation capacity assessment of iron carbonates by titration and theoretical calculation. Appl. Geochem. 2004, 19, 687–694. [Google Scholar] [CrossRef]
- Paktunc, A.D. Characterization of Mine Wastes for Prediction of Acid Mine Drainage. In Environmental Impacts of Mining Activities: Emphasis on Mitigation and Remedial Measures; Azcue, J.M., Ed.; Springer: Berlin/Heidelberg, Germany, 1999; pp. 19–40. [Google Scholar] [CrossRef]
- Elghali, A.; Benzaazoua, M.; Bussière, B.; Schaumann, D.; Graham, S.; Genty, T.; Noel, J.; Kenedy, C.; Cayouette, J. Investigation of the role of hardpans on the geochemical behavior of the Joutel mine tailings. In Proceedings of the Twenty-First International Conference on Tailings and Mine Waste (TMW’17), Banff, AB, Canada, 5–8 November 2017; pp. 193–202. [Google Scholar]
- Lapakko, K.A.; Engstrom, J.N.; Antonson, D.A. Effects of particle size on drainage quality from three lithologies. In Proceedings of the 7th International Conference on Acid Rock Drainage (ICARD), St. Louis, MI, USA, 26–30 March 2006; pp. 1026–1050. [Google Scholar]
- Elberling, B.; Nicholson, R.; Reardon, E.; Tibble, R. Evaluation of sulphide oxidation rates: A laboratory study comparing oxygen fluxes and rates of oxidation product release. Can. Geotech. J. 1994, 31, 375–383. [Google Scholar] [CrossRef]
- Tibble, P.; Nicholson, R. Oxygen consumption on sulphide tailings and tailings covers: Measured rates and applications. In Proceedings of the 4th International Conference on Acid Rock Drainage (ICARD), Vancouver, BC, Canada, 31 May–6 June 1997; pp. 647–661. [Google Scholar]
- Coulombe, V. Performance de recouvrements isolants partiels pour contrôler l’oxydation de résidus miniers sulfureux. Master’s Thesis, Université du Québec en Abitibi-Témiscamingue, Rouyn-Noranda, QC, Canada, 2012. [Google Scholar]
- Pabst, T.; Aubertin, M.; Bussière, B.; Molson, J. Analysis of monolayer covers for the reclamation of acidgenerating tailings–Column testing and interpretation. In Proceedings of the 63rd Canadian Geotechnical Conference and 1st Joint CGS/CNC-IPA Permafrost Specialty Conference, Calgary, AB, Canada, 12–16 September 2010; pp. 1119–1127. [Google Scholar]
- Talmon, A.M.; van Kesteren, W.G.; Sittoni, L.; Hedblom, E.P. Shear cell tests for quantification of tailings segregation. Can. J. Chem. Eng. 2014, 92, 362–373. [Google Scholar] [CrossRef]
- Weber, P.A.; Hughes, J.B.; Conner, L.B.; Lindsay, P.; Smart, R. Short-Term Acid Rock Drainage Characteristics Determined by Paste pH and Kinetic NAG Testing: Cypress, Prospect, New Zealand. In Proceedings of the 7th International Conference on Acid Rock Drainage (ICARD), St. Louis, MO, USA, 26–30 March 2006. [Google Scholar]
- Parbhakar-Fox, A.; Fox, N.; Hill, R.; Ferguson, T.; Maynard, B. Improved mine waste characterisation through static blended test work. Miner. Eng. 2018, 116, 132–142. [Google Scholar] [CrossRef]
- Lawrence, R.; Wang, Y. Determinations of neutralization potential for acid rock drainage prediction. MEND Proj. 1996, 1, 38. [Google Scholar]
Figure 1.
Schematic illustration of the methodological approaches used in this study.

Figure 2.
Map showing the sampling grid at the Joutel mine site. N1, N2, S1, and S2 refer to oxygen consumption test locations done on tailings, hardpan (north) and hardpan (south) correspond to oxygen consumption tests done on hardpan, and the green tiles correspond to samples analyzed using QEMSCAN. Red polygon corresponds to the TSF dam and blue circles correspond to the input locations of tailings.

Figure 3.
Images showing design of oxygen consumption tests. (A) schematic illustration of oxygen consumption tests of tailings and hardpan, (B) datalogger and oxygen sensor, (C) drill used to the cylinder in the hardpan.
Figure 3.
Images showing design of oxygen consumption tests. (A) schematic illustration of oxygen consumption tests of tailings and hardpan, (B) datalogger and oxygen sensor, (C) drill used to the cylinder in the hardpan.

Figure 4.
Results of kriging validation: measured paste pH vs predicted paste pH by kriging.

Figure 5.
Mineralogical composition of the different stations’ horizons.

Figure 6.
Mineral liberation of pyrite (A), pyrrhotite (B), calcite-dolomite (C), and ankerite-siderite (D).
Figure 6.
Mineral liberation of pyrite (A), pyrrhotite (B), calcite-dolomite (C), and ankerite-siderite (D).

Figure 7.
(A) Digital elevation model and (B) slope map within the Joutel TSF.

Figure 8.
Mapping of: (A) paste pH, (B) hardpan thickness, (C) oxidized zone, and (D) transition zone.
Figure 8.
Mapping of: (A) paste pH, (B) hardpan thickness, (C) oxidized zone, and (D) transition zone.

Figure 9.
Results of the mapping of: (A) Cinorganic, (B) Ssulfide, (C) NNP, and (D) NPR.

Figure 10.
PCA plots for: (A) the southern zone and (B) the northern zone. Clustering of samples for: (C) the southern zone and (D) the northern zone.
Figure 10.
PCA plots for: (A) the southern zone and (B) the northern zone. Clustering of samples for: (C) the southern zone and (D) the northern zone.

Figure 11.
Paste pH vs NAG pH values for selected samples from the southern and northern zones (NAF = Non-acid forming, PAF = Potentially acid forming).
Figure 11.
Paste pH vs NAG pH values for selected samples from the southern and northern zones (NAF = Non-acid forming, PAF = Potentially acid forming).


Table 1.
Description of the samples collected for the mineralogical characterization using QEMSCAN.
| Tailings Storage Facility | Station | X | Y | Horizon | Depth (cm) | Description |
|---|---|---|---|---|---|---|
| North zone | A | 689,948 | 5,485,450 | A-Oxy | 0–12 | Oxidized tailings |
| A-hard | 12–27 | Hardpan | ||||
| A-Unw1 | 27–47 | Unweathered tailings | ||||
| A-Unw2 | 47–100 | Unweathered tailings | ||||
| B | 690,078 | 5,485,806 | B-Oxy | 0–18 | Oxidized tailings | |
| B-hard | 18–33 | Hardpan | ||||
| B-Unw1 | 33–65 | Unweathered tailings | ||||
| B-Unw2 | 65–110 | Unweathered tailings | ||||
| South zone | C | 689,993 | 5,485,014 | C-Oxy1 | 0–10 | Oxidized tailings |
| C-Oxy2 | 10–20 | Oxidized tailings | ||||
| C-hard | 20–40 | Hardpan | ||||
| C-Unw | 40–55 | Unweathered tailings | ||||
| D | 690,402 | 5,484,841 | D-Oxy | 0–15 | Oxidized tailings | |
| D-hard | 15–30 | Hardpan | ||||
| D-Unw | 30–45 | Unweathered tailings | ||||
| E | 690,320 | 5,484,967 | E-Oxy | 0–15 | Oxidized tailings | |
| E-hard | 15–30 | Hardpan | ||||
| E-Unw | 30–45 | Unweathered tailings |
Table 2.
Results of in situ oxygen consumption tests on oxidized and hardpan samples.
| Slope | R² | A (m²) | V (m3) | (Kr × De)0.5 | Fl (mol/m2/year) | |
|---|---|---|---|---|---|---|
| S1 | −8.00 × 10⁻⁵ | 0.99 | 2.19 × 10⁻² | 4.89 × 10⁻² | 3.58 × 10⁻⁵ | 162 |
| S2 | −7.00 × 10⁻⁵ | 0.95 | 2.19 × 10⁻² | 8.28 × 10⁻² | 1.85 × 10⁻⁵ | 83 |
| N1 | −1.00 × 10⁻⁵ | 0.96 | 2.19 × 10⁻² | 7.64 × 10⁻² | 2.87 × 10⁻⁶ | 13 |
| N2 | −5.00 × 10⁻⁵ | 1.00 | 2.19 × 10⁻² | 6.99 × 10⁻² | 1.57 × 10⁻⁵ | 71 |
| Hardpan (South) | −6.00 × 10⁻⁵ | 0.99 | 2.19 × 10⁻² | 9.37 × 10⁻² | 1.40 × 10⁻⁵ | 63 |
| Hardpan (North) | −4.00 × 10⁻⁵ | 0.95 | 2.19 × 10⁻² | 9.37 × 10⁻² | 9.35 × 10⁻⁶ | 42 |
Table 3.
Correlation matrices relating paste pH with AP, NPR, NNP, and NP for the southern and northern zones (p < 0.05).
Table 3.
Correlation matrices relating paste pH with AP, NPR, NNP, and NP for the southern and northern zones (p < 0.05).
| Southern Zone (n = 66) | |||||
| Paste pH (-) | AP (kg CaCO3/t) | NPR (-) | NNP (kg CaCO3/t) | NP (kg CaCO3/t) | |
| Paste pH (-) | 1 | ||||
| AP (kg CaCO3/t) | 0.777 | 1 | |||
| NPR (-) | 0.457 | 0.025 | 1 | ||
| NNP (kg CaCO3/t) | 0.408 | −0.056 | 0.868 | 1 | |
| NP (kg CaCO3/t) | 0.861 | 0.681 | 0.655 | 0.693 | 1 |
| Northern Zone (n = 56) | |||||
| Paste pH (-) | AP (kg CaCO3/t) | NPR (-) | NNP (kg CaCO3/t) | NP (kg CaCO3/t) | |
| Paste pH (-) | 1 | ||||
| AP (kg CaCO3/t) | 0.517 | 1 | |||
| NPR (-) | 0.200 | −0.495 | 1 | ||
| NNP (kg CaCO3/t) | 0.297 | −0.200 | 0.531 | 1 | |
| NP (kg CaCO3/t) | 0.623 | 0.539 | 0.105 | 0.717 | 1 |
Table 4.
Correlations between variables and factors for the southern and northern zones (p < 0.05).
| Southern Zone (n = 66) | ||||
| F1 | F2 | F3 | F4 | |
| Paste pH (-) | 0.879 | 0.379 | 0.128 | 0.259 |
| AP (kg CaCO3/t) | 0.595 | 0.787 | −0.011 | −0.163 |
| NPR (-) | 0.765 | −0.571 | 0.268 | −0.131 |
| NNP (kg CaCO3/t) | 0.748 | −0.628 | −0.207 | 0.058 |
| NP (kg CaCO3/t) | 0.978 | 0.107 | −0.160 | −0.075 |
| Northern Zone (n = 56) | ||||
| F1 | F2 | F3 | F4 | |
| Paste pH (-) | 0.805 | 0.211 | 0.499 | −0.242 |
| AP (kg CaCO3/t) | 0.463 | 0.854 | 0.042 | 0.233 |
| NPR (-) | 0.302 | −0.832 | 0.389 | 0.256 |
| NNP (kg CaCO3/t) | 0.720 | −0.580 | −0.369 | −0.096 |
| NP (kg CaCO3/t) | 0.948 | 0.109 | −0.288 | 0.083 |
© 2019 by the authors. Licensee MDPI, Basel, Switzerland. This article is an open access article distributed under the terms and conditions of the Creative Commons Attribution (CC BY) license (http://creativecommons.org/licenses/by/4.0/).
Share and Cite
MDPI and ACS Style
Elghali, A.; Benzaazoua, M.; Bussière, B.; Genty, T. Spatial Mapping of Acidity and Geochemical Properties of Oxidized Tailings within the Former Eagle/Telbel Mine Site. Minerals 2019, 9, 180. https://doi.org/10.3390/min9030180
AMA Style
Elghali A, Benzaazoua M, Bussière B, Genty T. Spatial Mapping of Acidity and Geochemical Properties of Oxidized Tailings within the Former Eagle/Telbel Mine Site. Minerals. 2019; 9(3):180. https://doi.org/10.3390/min9030180
Chicago/Turabian StyleElghali, Abdellatif, Mostafa Benzaazoua, Bruno Bussière, and Thomas Genty. 2019. "Spatial Mapping of Acidity and Geochemical Properties of Oxidized Tailings within the Former Eagle/Telbel Mine Site" Minerals 9, no. 3: 180. https://doi.org/10.3390/min9030180
Note that from the first issue of 2016, this journal uses article numbers instead of page numbers. See further details here.