Evolution of Clays in Cretaceous Marly Series (Álava Block, Basque Cantabrian Basin, Spain): Diagenesis and Detrital Input Control


1
Departamento de Mineralogía y Petrología, Facultad de Ciencia y Tecnología, Universidad del País Vasco/EHU, Apdo. 644, 48080 Bilbao, Spain
2
CAI de Técnicas Geológicas, Universidad Complutense de Madrid, C/ José Antonio Novais no. 2, 28040 Madrid, Spain
3
Departamento de Mineralogía y Petrología, IACT, Universidad de Granada-CSIC, Av. Fuentenueva s/n, 18002 Granada, Spain
4
IUCA-Facultad de Ciencias, Universidad de Zaragoza, Pedro Cerbuna 12, 50009 Zaragoza, Spain
*
Author to whom correspondence should be addressed.
Minerals 2019, 9(1), 40; https://doi.org/10.3390/min9010040
Submission received: 10 October 2018
/
Revised: 26 December 2018
/
Accepted: 4 January 2019
/
Published: 12 January 2019
(This article belongs to the Special Issue From Diagenesis to Low-Grade Metamorphism)
Abstract
:Two stratigraphic sections of carbonate sediments with significant thickness differences and without appreciable tectonic deformation were studied near the trough and on a threshold zone at the Álava Trough. Such characteristics make them appropriate to analyze the influence of a slow progression of the diagenesis over the original clay suite. X Ray Diffraction (XRD), Transmission Electron Microscopy (TEM) and Analytical Electron Microscopy (AEM) techniques were applied in natural and alkylammonium-treated samples. Diagenesis slightly modified the clay mineralogy, the disappearance of smectite, and the variation in the content and ordering of the I/S mixed layer, with burial being the most noteworthy process. The total charge in the 2:1 expandable layers of smectite and I/S shows a slight increase, preferentially located on tetrahedral sheets, with depth. The data suggest a moderate diagenesis grade for the studied materials. The combination of techniques allowed identification of several types of detrital micaceous phases, as well-crystallized K-rich micas, Na-K micas, mica-chlorite stacks, and illites, with an expandable behaviour after the alkylammonium treatment. The total charge of illites did not change with diagenesis, suggesting their detrital origin. This research shows that the detrital assemblage masks the diagenetic evolution in the basin, which indicates the importance of the combination of different techniques to infer correctly the diagenetic grade in a sedimentary basin.
1. Introduction
Smectite illitization is the most common mineral diagenetic process that occurs in the burial of pelitic rocks. The process comprises a series of chemical reactions and structural changes that give rise to coherent domains intermediate between smectite and illite. These are the so-called illite/smectite (I/S) mixed-layer minerals, which consist of different stacking sequences of two kinds of TOT (tetrahedral-octahedral-tetrahedral) layers, illitic (I) and smectitic (S), whose main difference is the layer charge, due to different compositions [1,2,3]. As diagenesis advances, the proportion of illite layers in the mixed layers increases, together with the order of the stacking sequences between I and S. A progressive evolution of phases: From R0 ordering (less than 50% illitic layers, stacked in a random way) towards an ordered stacking of R1 ordering, in which the (I/S) sequence predominates, although the illite content tends to be higher than 50% and up to 80%. In a stage of advanced diagenetic evolution, the layer stacking is defined by sequences with the R > 1 type, in which the amount of illite in the coherent domains is >80% and S layers are always separated by at less two illitic layers. In the final stage of diagenetic evolution, the illite (mica) is the stable phase.
Most studies aiming to determine the degree of diagenesis in sedimentary basins support their approach on the distribution of the aforementioned phases. In pelitic materials, the different stages of prograde diagenesis are associated with the presence or absence of certain phases of mixed-layer minerals identified by conventional X-ray diffraction techniques. These methods are useful for many basins as they clearly reveal differences in diffraction profiles from samples with a progressively higher grade of diagenesis [4,5]. However, the correspondence between the interpretation of these phases as determined by XRD and their physical reality is often a topic for disagreement among researchers [2,3,6,7,8]. This leads to difficulties in reaching a consensus on the illitization mechanism during diagenesis, and an accurate structural characterization of the involved phases in this process is required. The smectite to illite transformation reaction produces, in general terms, an increase in the TOT layer charge and the subsequent K fixation in the interlayer space [9,10]. Therefore, structural adjustments are needed and they affect not only the magnitude of the charge of the 2:1 expandable layers, but also their localization in the octahedral or tetrahedral layers [11,12]. Characterization of the charge of the 2:1 expandable layers (magnitude, homogeneity, and distribution) can therefore be seen to provide significant information to clarify the illitization mechanism.
XRD analysis of the 2:1 expandable layers intercalated with n-alkylammonium ions [13] shows great resolution for calculation of the charge and its distribution between the tetrahedral and octahedral layers as well as to determine the homogeneity of the 2:1 layers at the crystallite scale. However, there are still few studies on the evolution of the layer charge (comparing different methods) in diagenetic settings despite the fact that the n-alkylammonium ion method and subsequent modifications have been used for several decades [13,14,15,16]. Probably, the reason is the painstaking analytical protocol required and the difficulty involved in interpreting the resulting diffraction patterns, especially in polymineral clay samples, which are common in diagenetic series [17,18].
In the Basque-Cantabrian basin, the general distribution of the diagenetic grade has been determined by various authors based on clay mineralogy and illite crystallinity [5,19,20,21,22]. The Álava Block domain (Figure 1) crops out almost continuously in this basin. It comprises a thick mainly carbonate series without significant tectonic alterations. Recently, the authors of [23] performed a comparative study (XRD-TEM-AEM) on a series of samples from this domain of the Basque-Cantabrian basin, in which the charge of the 2:1 layers was determined with the alkylammonium ion-exchange method. High Resolution Transmission Electron Microscopy (HRTEM) showed that the phases determined by XRD have physical reality, and that the charge values obtained from the alkylammonium method agree with those yielded by the structural formula method determined by analytical electron microscopy (AEM).
Given the geological characteristics of the Álava Block in the Basque-Cantabrian basin, and the current state of knowledge, this domain is an ideal scenario to analyse the effect of progressive diagenesis on the structural characteristics of the 2:1 expandable layers. Taking into account the geological context of the basin and its sedimentary characteristics, the original mineralogy is complex ([5] and references therein). Therefore, it is fundamental to characterize correctly the diverse phyllosilicates regarding their textural and genetic relationships and with other minerals. Transmission electron microscopy (TEM) is a valuable tool when the necessary scale of observation is micro- and nanometric [24]. To this particular end, the original texture of the samples needs to be preserved by ion-mill preparation from thin sections. Additionally, the smectite layers must be kept from collapsing under the vacuum and electron beam of the microscope in order to differentiate smectite and illite individual layers and recognize each kind of I/S in situ. Therefore, a new TEM study on samples prepared using LR white resin was carried out to correlate the layer-charge properties determined by the n-alkylammonium method [23] with the clay mineralogy and micro/nano textural relationships.
Consequently, the goals of this work were, first, to analyze the evolution in the 2:1 expandable layer charge and their layer distribution during smectite illitization in burial diagenesis of a carbonate sequence. A second objective was to determine its correspondence with the evolution of other parameters of clay mineralogy, such as the presence or absence of certain phases and the nature and proportions of expandable layers in I/S mixed layers. A third objective was to analyse the effect of detrital materials on the apparent determined grade. To achieve these aims, XRD, TEM, and AEM techniques were applied to characterize the clay mineralogy of the studied sequence and these data were combined and compared with those of the previous methodological study [23].
Geological Context and Background
The study area is located in the Álava Block domain of the Basque Cantabrian Basin (Figure 1). The geological history of this basin is related to the opening and closing of the Bay of Biscay, which is closely connected with the geodynamic evolution of the North Atlantic Ocean. Its depositional history (Permo-Triassic to present day) shows significant lateral differences in sedimentation and subsidence rates controlled mainly by block tilting due to the operation of deep basement faults (NW-SE), which resulted in a sharp compartmentalization of the basin.
The Álava Block is composed of Cretaceous and Cenozoic sediments along a stratigraphic section of more than 12,000 m. Outcrops of Lower Cretaceous materials (very scarce in the region) consist of detrital sediments (fluvial-deltaic sandstones and shales) with intercalated carbonate episodes (Urgonian facies). Upper Cretaceous materials are mainly carbonates (limestones and marls) deposited on a marine platform, which is progressively deeper northwards. Sedimentation during the Late Cretaceous shows great cyclicity due to eustatic events. Paleogene sediments are only present in the central sector of the Álava Block and consist of a pre-orogenic sequence of shallow marine carbonate facies on which a postorogenic sequence of fluvio-lacustrine detrital sediments was deposited. During the Late Cretaceous in the Álava Block domain, a deep, subsiding trough (the Álava Trough) formed, and elongated NW-SE [25]. The presence of deep diapiric upwellings led to a series of subsidiary paleogeographic troughs and swells that determined the depositional history of the study area. For most of the Late Cretaceous and up to the middle Campanian, the study area resided in the sedimentary setting of a circalittoral marine platform. The differential subsidence then ended, and sedimentation became homogeneous throughout the Álava Trough, initiating the start of a regressive cycle.
This study focuses exclusively on Upper Cretaceous materials (upper Cenomanian to Campanian) as this is the interval with a transition between the R0 and R1 diagenetic stages. The lithological homogeneity of this series, and especially of this interval, rules out the possibility of lithological changes influencing the mineralogical differences recorded during diagenesis in the study sections. Furthermore, the study zone is structurally located along a wide, gentle, and thick monoclinal belt, generally dipping S; it shows no signs of intense tectonic deformation at any time during its entire post-depositional history. Two parallel sections were studied in the Álava Trough area; the outcrops are nearly continuous and are therefore easily correlated lithostratigraphically. Despite their proximity to each other (just 25 km apart), they have a significant difference in the accumulated thickness (around 50%; Figure 1). The cause can be found in the differential subsidence in the two sections linked to the diapiric upwellings. Therefore, while the western CS section was located near the trough depocentre for most of the Late Cretaceous, the eastern KG section was a threshold zone with hiatuses in sedimentation.
On the basis of the geochemical data, thickness distribution, and paleocurrent directions, the studied sediments come from a common source area (the Hesperian Massif) and deposition might have taken place in a stable continental margin or a pull-apart basin [20]. The clay mineralogy of the complete Late Cretaceous series was determined in prior works in which a great number of cuttings from old oil boreholes were analysed by XRD [5,21]. The origin of the clay minerals identified was extensively discussed in those works. Thermal and burial models for some of these boreholes revealed an evident downward-increasing diagenetic evolution and maximum temperatures of 160 °C for the R0 to R1 transition in the smectite illitization [5]. Each of these stages was recognized throughout burial intervals from 1640 m to 2060 m, respectively, which implies a slow advance in the illitization process.
2. Materials and Methods
Nearly 5000 m of outcrop were sampled from the Upper Cretaceous marly series (upper Cenomanian to upper Campanian); this is the interval in which [5] determined the diagenetic transition between the R0 and R1 stages via XRD. In total, 36 marly samples were collected (Figure 1) and their clay mineralogy was confirmed by conventional XRD methods [26] and compared to that determined on the cuttings analysed in the above mentioned work. After this XRD screening, eight samples from different burial depths and representative of the R0 and R1 stages were selected for the alkylammonium ion-exchange method study [23] using the complete series of 6 to 18 carbon atoms in the alkylammonium chain (nc). The magnitude of the 2:1 layer charge was determined [13,27,28] as well as its distribution between the octahedral and tetrahedral layers [15]. All the layer charge values were finally associated with the type of I/S mixed layers in each sample and correlated with the burial depth.
2.1. Sample Preparation
2.1.1. XRD Analysis
Outcrop samples were gently crushed with a laboratory jaw-crusher. A solution of 0.2 M HCl was added to a suspension of crushed rock and continuously agitated for 20 min to eliminate carbonates. The <2 µm and <0.5 µm fractions were separated by centrifugation and then smeared onto glass slides. Samples were also saturated with K, Li, and Mg for specific determinations, using 1 M KCl or LiCl, or 0.1 M MgCl and washed free of cation salts. After Li treatment, samples were smeared on opaque fused silica slides, heated to 300 °C, and glycolated for 24 h. XRD was performed using CuKα radiation with a Philips PW1710 diffractometer (Philips, Amsterdam, The Netherlands). The step size was 0.02°2θ with a counting time of 0.5 s per step.
The clay minerals were identified in accordance with the position of the (00l) series of basal peaks on the XRD profiles of air-dried specimens, solvated with ethylenglycol, dimethyl sulfoxide, and heated (at 550 °C for 1.5 h) [26]. The mixed-layer smectite-rich R0 (<50%I) and illite-rich R1 (60–80%I) clay minerals were identified by routine methods [26,29]. Routine semi-quantitative estimates were made on the XRD patterns selected peak and the corresponding reference intensity ratios (RIRs).
2.1.2. Transmission Electron Microscopy
TEM investigation of I/S mixed-layer minerals is hindered by the collapse of expandable interlayers under high vacuum. This collapse makes the distinction between smectite and illite layers very difficult to impossible. The samples were treated with L.R. White resin, following the procedure of the authors of [30], to facilitate the differentiation of illite and smectite interlayers in TEM images. During preparation, samples were kept away from water to prevent smectite expansion and resultant sample damage. Sticky wax-backed thin-sections were prepared with surfaces perpendicular to bedding and examined by optical microscopy. Typical areas were removed using attached Cu washers for TEM observation, thinned in an ion mill, and carbon coated. TEM investigations of the expandable illites were also done in samples treated with alkylammonium ions prepared as [23].
TEM observations were carried out with a Philips CM20 (Philips, Amsterdam, The Netherlands) equipped with an EDAX solid-state detector (AMETEK, Berwyn, PA, USA) operating at 200 kV, with a LaB6 filament (Scientific Instruments Centre, Granada University). Lattice-fringe images were acquired according to the procedures recommended by [31]. The mineral nature of each area was qualitatively identified by selected-area electron diffraction (SAED) and EDX analysis. The chemical composition of, illites, micas, C/S, and chlorites were also determined by AEM. AEM compositions of smectite (Sm) and I/S and details of the methodology can be found in [23].
3. Results
3.1. Bulk Mineralogy
The two sections are quite similar lithologically, mostly carbonates (marls and clayey limestones generally), with, consequently, a very similar total mineralogy with few variations throughout each section. Calcite is the major mineral at over 50% in most samples. The terrigenous fraction is higher at the base of each section (upper Cenomanian–lower Turonian) and at the top of both series (middle–upper Campanian). It comprises quartz and phyllosilicates in similar proportions, together with minor feldspars that are rarely in proportions of over 10%. Worth noting is the abundance of dolomite throughout the upper Campanian of section CS; that chronostratigraphic interval is lacking in section KG.
3.2. Clay Mineralogy
The distribution of the <2 µm clay minerals can be seen in Figure 1. Clay mineralogy of the two sections is qualitatively very similar. Smectite (including R0 I/S) and illite are the major minerals, together comprising over 75% of the composition. I/S mixed layers (R1) are also present throughout both sections, with proportions increasing with burial depth at the cost of smectite. In the CS section, I/S mixed layers reaches proportions of around 30%, whereas in the KG section, they only occurred in the two deepest samples, with proportions attaining a maximum of 20%. Kaolinite also appears in most samples, but is more abundant at the top of both sections and in the lowermost part of the KG section. Chlorite occurs in almost all samples in low proportions (generally less than 10%) and without significant variations. Chlorite/smectite (C/S) mixed layers are also found in very small amounts in the lower part of the CS section and in the bottom of the KG section.
Based on the distribution of the type of I/S mixed layers in each of the sections, related to burial depth, two mineralogical intervals are distinguishable, according to the stages of diagenetic evolution. The upper one (called R0) has abundant smectite, but in the lower one (R1), smectite is completely absent and R1 I/S mixed layers notably increase (Figure 1). Diffractograms typical of both intervals are shown in Figure 2. The decomposition of the XRD profiles in the 5 to 10°2θ region provides very accurate fits in the R0 interval when the presence of a small proportion of I/S (R1) is considered to co-exist with the smectite (Figure 2). Likewise, in the R1 interval, the presence of an ordered C/S mixed layer co-existing with R1 I/S also provides a good fit in the profile decomposition.
The absence of smectite at the depth mentioned above occurs gradually in the CS section logged in the central trough while I/S (R > 0) mixed layers and illite increase (Figure 1). This distribution occurs even though the facies’ type and bulk mineralogy do not reflect significant changes in detrital processes or the series lithology. However, in the KG section (logged in a less subsident area of the trough), the smectite (R0), I/S mixed layers, and illite show no systematic variations except in the deepest samples. In these, smectite sharply decreases and then disappears, with a subsequent increase in the type R1 I/S mixed layers, illite, and, especially, kaolinite. In contrast to the CS section, this change is very closely associated with increased detrital processes in the series, represented by alternating marls and lutites from the upper Cenomanian–lower Turonian. Also remarkable is the presence of C/S mixed layers in the lower half of the CS series and sporadically in the KG series (in the interval where the smectite decrease is more evident).
3.3. Charge of 2:1 Expandable Layers
In the samples of this area of the Álava Block, the authors of [23] recently demonstrated the presence of different types of 2:1 expandable layers co-existing in the same sample (Figure 3) by intercalating the complete series of n-alkylammonium ions. Packets of smectites and of illites with differently charged layers were identified. Details on their identification can be found in the above-referenced work.
The charge of the 2:1 expandable layers does not show overall significant differences between the R0 and R1 stages of diagenetic evolution (Figure 4a). However, within each section, there is a slight tendency for the charge to increase with depth, both for the two different smectites identified in the R0 interval (Sm1 major and Sm2 minor) and for the 2:1 expandable layers in the R1, although in the latter interval, this trend is less marked. In contrast to the total charge, the distribution of the 2:1 layer charge [15] reveals a decrease in the octahedral charge that is compensated for by a slight increase in the tetrahedral charge such that, in the R1 stage, the total charge of the 2:1 layers is basically the charge of the tetrahedral layer (Figure 4b).
The treatment with n-alkylammonium ions has revealed the presence of a complex population of micaceous material, which was collectively included in the reflection at 10 Å in conventional XRD. In addition to the typical mica with a rational series of peaks based on (001) at 10 Å, which remains as a non-expandable remnant after the n-alkylammonium treatment, two populations of expandable micaceous phases were revealed in response to the long-chain alkylammonium ions (nc > 10) intercalation, which produces a continuous expansion [23] (Figure 2), thus discarding a vermiculite nature of such layers. These two populations were differentiated on the basis of their (00l) and (002) spacing, corresponding, respectively, to 28.5 Å/14.4 Å for the first population and 26.1 Å/13.0 Å for the second population, when they are treated with the alkylammonium nc = 14 (Figure 3). The calculate charges [32] show a gap between both populations of approximately 0.1 eq/O10 (OH)2, with mean values of 0.87 ± 0.02 and 0.97 ± 0.02. The charge values confirm that these minerals are illites and micas, respectively (Figure 4c). The Hofmann-Klemen treatment indicates that the total charge of the two almost exclusively resides in the tetrahedral layer, without any noticeable differences between the fractions analyzed. Also, the values are very similar across the two study sections, with no appreciable variations regarding the burial depth or the R0 and R1 diagenetic stages (Figure 4c).
3.4. TEM Study
TEM images were acquired of samples 1CS6 and 2KG6 (representative of interval R0) and samples 3CS3 and 3CS6 (representative of interval R1), as differentiated in terms of the clay mineralogy determined by XRD.
3.4.1. General Texture
Figure 5a corresponding to sample 1CS6 is representative of the characteristic texture of the top marls in the CS section (R0 stage). Large quartz and calcite grains form the sample’s skeleton and create abundant microporosity. Among them, there is a clayey matrix comprising unoriented and relatively loose smectite packets. Low-magnification TEM images of sample 3CS6 (representative of the R1 stage) are similar to those described for the R0 stage, although their microtextures are more compact and the interparticle contacts are more angular, creating notably lower microporosity (Figure 5b). The I/S packets are more continuous and less wavy than in the R0 stage sample.
3.4.2. Smectite and Illite/Smectite
High-resolution images (Figure 5c) of sample 1CS6 show anastomosing packets of two to 10 layers (R0 stage). They have typical smectite features, such as wavy layers and variable spacing of 10–14 Å. These differences in spacing are attributable to the distinct degree of collapse due to the electron beam, at least in part due to the different interlayer populations [19] and the extent of resin access to the different layers. These domains are continuous, without intercalations of illite layers. The corresponding SAED pattern shows a completely turbostratic arrangement typical of disordered polytypes. In this sample, there are I1-type mixed layers, according to Bauluz’s nomenclature [3] with spacings of 20–24 Å co-existing with smectite, in agreement with the XRD results and the HRTEM study of samples treated with n-alkylammonium [23].
In the R1 stage, the disordered smectite matrix typical of the R0 stage disappeared. However, some I/S mixed-layer packets have an anastomosing microstructure reminiscent of the R0 stage smectite. The lattice-fringe images (Figure 5d) show ordered I/S mixed-layer packets with spacings of 23–24 Å, resulting from a 1:1 sequence of an illite layer (10 Å) and a smectite layer (13–14 Å) corresponding to type I1. Co-existing with these packets are common mixed layers of excess illite layers in illite-smectite sequences of type I2 (34 Å) 1:2 and type I3 (44 Å) 1:3.
3.4.3. Micaceous Phases
The observation of the samples treated with L.R. White resin analysed for both stages revealed three types of micaceous phases with similar characteristics in all samples.
- The first type includes illites that have slightly wavy and individualized packets of five to 20 layers and constant periodicity of 10 Å, as noted in images, with orientations subparallel to each other (Figure 6a). They have frayed edges and common dislocations and a loss of layer continuity. SAED images show a lack of general spots of a disordered 1 Md polytype.
- The second type comprises micas with abundant coherent domains (>1000 Å) (Figure 6b), high K contents, and defect-free lattice-fringe images at 10 Å. SAED images show a lack of general spots or characteristics typical of a disordered 1 Md polytype.
- The third type comprises micas with a similar texture to those of the second type, but with much higher Na contents (determined by AEM) than is usual in a muscovite. The composition of the third type lies completely within the compositional gap between muscovite and paragonite. Figure 6c is a TEM image showing the bending of a Na-rich grain around a quartz grain, presumably caused by compaction of the original sediment. The SAED image corresponds to the 2 M polytype (identifiable by the general spots at 20 Å), with a small variation in the crystallographic orientation between two domains, reflecting the reciprocal space of the grain’s curve.
In lattice fringe images of samples treated with alkylammonium ions (nc = 14), according to the methodological protocols described in [23], micaceous material is observed, in which, in addition to broad and non-expandable domains, coherent domains with 3–7 expandable layers are also identified (Figure 3). The detailed lattice fringe measurement allowed the identification of two populations, with layer thicknesses between 21–22 Å and between 24–26 Å (see histogram in Figure 3), compatible with the two expandable micaceous phases distinguished by XRD (Figure 3). The differences in layer thickness determined from both methods, which is always lower in TEM, could be a consequence of the damage produced by the electron beam on the alkylammonium ions intercalated in the interlayer space [33]. The images show different relationships between “expandable phases” and non-expandable domains: (1) Coherent domains are more or less individualized and without any apparent relationship with non-expandable domains (Figure 3) and (2) expandable sequences intergrowths with or towards the edge of other non-expandable domains, showing sporadically lateral transitions between both types of layers.
3.4.4. Chlorites and Chlorite/Smectite
Chlorite is also observed in samples from both intervals. The chlorite noted in the R0 section is limited to large packets of individual chlorite crystals or of chlorite intergrown with mica, with evident signs of alteration. However, the R1 samples contain, in addition to similar chlorite and intergrowths (Figure 5b), a second type, with smaller crystals forming subparallel c packets with low-angle boundaries (Figure 7). Both types commonly have layers of different contrast and sometimes slight differences in spacing. These layers are often opened in fissures as a result of the electron beam. Therefore, zones of continuous layers at 14 Å are rare.
3.5. AEM Study
Based on the XRD results, eight samples were selected as representative of the R0 and R1 diagenetic evolution stages. More than 100 particles were analysed by AEM.
3.5.1. Smectitic (Sm and R0 I/S) and Micaceous Phases (R ≥ 1 I/S, Illite, Mica ss)
The structural formulas of smectite and I/S are given in [23] and those of micaceous phases: Layer charge >0.70 atoms per formula unit (apfu) in Table 1. These data are supplemented by additional analyses from [23]. The individual assignment of each particle to one phase or another (R0, R1, or mica—including illite) is complex since their morphology on grid does not allow definitive, objective differentiation. The R0 evolution stage is particularly complicated as all the aforementioned phases co-exist and the grain composition is extremely variable. These phases were differentiated based on the fact that, in the R1 stage, smectite (or R0 I/S) was not detected by XRD (Figure 2) or by HRTEM. Therefore, it can be assumed that all the analyses corresponding to this stage agree to interstratified I/S of order R1 or higher, which defines the lower limit for the composition of the R1-type I/S (dashed line in Figure 8a).
This limit can be seen to be defined by a layer charge of over ~0.5 atoms per formula unit (apfu) and/or Si < 3.60 ± 0.05 apfu. This compositional range was applied to the R0 stage samples to differentiate the R1-type I/S in that stage from the R0-type I/S. Thus, the particles with the lowest charges of all the R1 I/S mark the upper charge limit for R0 (dashed line in Figure 8a). The figure shows there is no compositional gap from smectite (R0-type I/S) to muscovite ss, which are located around the extreme upper end of the illitization trend (interlayer charge ≈ 1 apfu) and Si < 3.1–3.2 apfu. This compositional continuity arises from the presence of mixed-layer phases of R > 1 and illites of different nature (described by XRD and HRTEM) and it precludes the delimitation of clear compositional limits between R ≥ 1, illite, and muscovite. The decrease in Si from smectite to muscovite is associated with an increase in the interlayer charge, which could indicate a fundamentally tetrahedral nature for the charge increase in the 2:1 phases.
When plotted on a “Velde” diagram [34], the chemical composition of both the smectites (R0) and the micaceous phases reveals a very marked dioctahedral nature (Figure 8b). The compositional plot reflects a trend from the smectite phases (Sm + R0) to the micaceous phases (R ≥ 1 + I + M) without differences with regard to the diagenetic stage of the samples. There is also a slight influence of the vector (2R3+ − 3R2+) that implies a minor displacement towards a more marked dioctahedral nature for the R1 stage phases as compared to the equivalent ones in the R0 stage. Furthermore, the smectite phases show no evident defined beidellite or montmorillonite nature. There is a majority of points whose average layer charge distribution corresponds to the beidellite end member, but most of the particles also have a significant montmorillonite component (Figure 8c). This may be due in part to the presence of illite layers between the smectite domains (R0 I/S). The octahedral positions are primarily occupied by A1 in all phases.
The type and proportion of interlayer cations is somewhat more variable in the smectite phases than in the micaceous phases, with the interlayer cation K generally dominating in both types (Figure 8d). Nevertheless, the smectite phases generally contain a larger and more constant proportion of Ca than the micaceous phases, although the latest have more constant Ca contents. However, these phases show greater compositional variability regarding the K-Na poles.
3.5.2. Chloritic Minerals
In this sub-section, we have grouped all grain analyses with an octahedral occupation of >4 on a base of O10(OH)8 (Table 2).
This therefore includes chlorites and chlorite mixed layers with 2:1 layers. XRD confirms the presence of small concentrations of chlorite in most of the samples in addition to a phase compatible with corrensite or with a chlorite/smectite or chlorite/corrensite mixed layer [35] in the R1 stage of diagenetic evolution (Figure 2). Since the a priori differentiation of the two phases is impossible texturally in AEM on grid, all the structural formulas were normalized to 14 oxygens. The compositional plot in the ternary diagram of Si − (Fe + Mg)VI − AlVI (Figure 9) shows an almost continuous distribution of analyses between two chloritic poles, one tri-tri octahedral of chamosite (average Fe/Mg = 2.04) or corrensite, and another sudoite or tosudite, di-trioctahedral pole. Both end members can be discerned based on the occupation of R2+ − R3+, which, in our analyses, lies between 4.6 and 5.6 apfu (Table 2).
All the analyses reveal excess AlVI compared to AlIV. These characteristics suggest the presence of a dioctahedral component in all the samples, which is evident in the point distribution in the plot (Figure 9). Regarding the stage of diagenetic evolution corresponding to each analysis, the two from the R0 stage are superimposed on those from the R1 stage, albeit in the range of chlorite end members (Figure 9). However, the rest of the points are displaced towards the Si pole as the composition approaches the di, trioctahedral end member so that the more Si-rich poles have the most excess AlVI, with a tendency to be located in an intermediate range between the corrensite-tosudite poles. Some of these positions are very close to the range corresponding to the C/S mixed layers, and are likely compatible with chlorite/corrensite-tosudite mixed layers.
Furthermore, the analysis shows no correlation between the Fe/(Fe + Mg)/AlVI − AlIV ratio (not shown) and all have a high number of interlayer cations: 0.12–0.58 (Table 2). In some cases, the number of interlayer cations is even higher than expected for a C/S mixed layer [36]. One might attribute this to the contribution of extra smectite layers in the crystallites. Nevertheless, this lack of correlation is probably a consequence of significant compositional variability in the sheets intercalated in the chlorite structure. In contrast, different proportions of smectite or vermiculite layers (with approximately constant compositions) in a chlorite structure or even chlorite-layers and chlorite/smectite interstratifications would provide good correlations. Alternatively, the presence of incomplete interlayered sheets of hydroxyl-ion polymers (HIM) in some chlorite layers could also explain the high proportions of AlVI, the abundance of interlayer cations, and the lack of a correlation between Fe/(Fe + Mg) and AlVI − AlIV. The alteration and loss (at least in part) of the Fe2+ in the hydroxide sheet of some chlorite layers could have given rise to the appearance of empty zones in the chlorite layers, which could have been occupied by hydrated cations (Ca2+, K+, Na+). A process of this type would displace the tri, trioctahedral end member towards the HIM end member (Figure 9). Any one of these possibilities presupposes that the calculation of the structural formula of the chlorite phases (Table 2) on the basis of a theoretical O10(OH)8 affects the obtained Si proportion, the balance of AlVI − AlIV, and produces a relative decrease in the total octahedral cations. This suggests that in some cases, there is not a direct relation between the analyses and their corresponding structural formulas, thereby giving rise to a false dioctahedral nature in the chlorite edifices [35].
It appears that the analysed chloritic phases correspond to chlorites, with a more or less intense alteration due to the presence of 2:1 layers or HIM layers, and to the chlorite/corrensite or tosudite mixed layer, but only in the R1 diagenetic stage and compositionally indistinguishable from the aforementioned chlorite phases. Nonetheless, this possibility is purely speculative for the moment since the low contents of these types of phases in the samples preclude more detailed observations.
4. Discussion
4.1. Origin of Clay Minerals: Detrital Versus Diagenetic Minerals
In the studied sediments, the most noteworthy variation in the clay mineralogy is the disappearance of smectite and variations in the contents and type of ordering of I/S mixed layers regarding the burial depth. In both sections, smectite derives from soils in the source area, the Hesperian Massif (Iberian Variscan Chain), and probably the northwestern zone of the Ebro Massif [5,37], under the general greenhouse conditions prevailing throughout most of the Late Cretaceous [38]. However, its distribution through the two stratigraphic sections differs regarding both the burial depth and sediment age. Since the geothermal gradient must have been similar for the two series, a different burial temperature cannot account for these differences. If we take as a reference the lower section of the Coniacian in both series, we observe that the type of facies is practically identical, which implies the same paleogeographic position during that interval. However, the presence of smectite is only registered in the KG series (Figure 1). Consequently, this different mineralogy cannot be attributed to the contribution of different source areas or to a possible differential settling. Probably, the cause lies in the different illitization kinetics in the two sections.
In the CS, smectite (as a discrete mineral) disappears at a burial depth of around 3200 m in the Coniacian marls without any appreciable lithological change linked to the event. Furthermore, in this section, smectite disappearance is gradual and accompanied by an increase in the proportions of I/S mixed layers, which can be related to smectite transformation towards illite through intermediate phases.
However, in the KG section, which is notably condensed compared to the CS section (Figure 1), smectite is present through most of the section. It then abruptly disappears at 2300 m, coinciding with an increase in detrital clay, represented by lutitic-marly lithologies from the upper Cenomanian to lower Turonian. The absence of smectite below this limit cannot be attributed to the lack of smectite inputs because its presence was noted in some upper Albian-Cenomanian sections farther south that were less deeply buried [21]. In other words, both the depth and the style of smectite disappearance are different in the two sections. Therefore, characteristics of the lithological setting (such as greater permeability and K availability) likely promoted smectite disappearance at shallower depths (and presumably lower temperatures) in the KG section. In contrast, the lack of such characteristics in the CS section are most likely responsible for its persistence at comparatively higher depths. This deeper disappearance of smectite in an unfavourable lithological setting for the progress of illitization, due mainly to the scarcity of K+ and access routes to reactive grains, as a result of low permeability, has already been reported for the Álava Trough in a study on hydrocarbon exploration wells [5]. Other clay minerals, apparently unaffected by this diagenesis, such as kaolinite and illite, do not show notable differences between the two sections (Figure 1). The fluctuations for kaolinite and illite throughout the sections can be explained considering the existence of wetter periods within the predominantly dry warm climate during the late Cretaceous. This would enhance kaolinite-rich soil formation and higher erosion rates, both compatible with the regional paleoclimate setting [39]. The top of both sections (with notable amounts of kaolinite and illite) reflects the homogenization of the basin floor, coinciding with the end of subsidence and the start of a major regressive cycle, which culminated with the main Alpine orogeny in the earlymost Eocene.
According to this study and all the previous clay-mineral studies of the region ([5] and references therein), the grade of the Upper Cretaceous material in the basin never exceeded moderate diagenesis, compatible with R1 I-S with less than 80% illite layers. The progressive character of the evolution from smectite (or R0 smectite-rich I-S) to the maximum-grade diagenetic materials is well represented in all the sequences studied in the basin [5,23] and in agreement with the data presented in this study (Figure 1 and Figure 2).
4.1.1. Micaceous Phases
The combination of XRD and TEM in this study, using original and alkylammonium-treated samples, shows the coexistence in the studied samples of several types of micaceous phases, such as micas, illites, and I/S, with low smectite-layer content (R > 1). All these phases produce 10 Å reflection on the XRD patterns obtained by conventional techniques, and they may be associated with both diagenetic and detrital origins. It worth considering that in the Upper Cretaceous series studied, as it has been indicated before, diagenesis is not well advanced, as evidenced by the generalized presence of R0 I/S (smectite-like) and R1 I/S.
HRTEM and AEM results indicate the presence of well crystallized and ordered micas with a high interlayer content and with variable Na contents and in occasions higher than the usual in muscovites. These micas are widely present in the studied sediments (Figure 10) and their texture (Figure 6c) can be explained as the result of a deformation after the deposition of the sediment; that is, they should have arrived at the basin as detrital material. These micas that have an Na-K intermediate composition, in the compositional gap between muscovite and paragonite, have been considered as indicative of deep diagenetic to low anchizone grades [40,41]; this would be a previous stage to the segregation into separate packets of paragonite and muscovite at higher grades [42]. The intergrowth packets (stacks) of mica-chlorite (Figure 5b) may be typical of late diagenetic, anchizone, and low epizone rocks [43,44,45,46], and as the Na-K micas, they would be detrital phases. The proposed source area of these detrital phases is the Hesperian Massif (Iberian Variscan Chain) that has abundant material corresponding to the anchizone and low metamorphic grade [47,48], and together with the soils developed in that zone, could account for the micaceous background detected in all the samples.
Furthermore, defect-free micas with high K contents, packets larger than 100 nm, and lattice-fringe images at 10 Å were observed by TEM; they form domains of continuous subparallel packets without intergrowths with smectite domains (Figure 6b) in both R1 and R0 stage samples. We infer that these micas are those that have a non-expandable behaviour with the n-alkylamoninum treatment. The features of these micas are compatible with metamorphic rocks [49] or igneous rocks and are therefore incompatible with the moderate diagenetic grade determined for the basin.
On the other hand, other types of micaceous phases (illites and I/S illite-rich phases) coexist with the above mentioned detrital micas and the differentiation of their detrital or diagenetic origin is a difficult issue to clarify.
On the basis of the alkylammonium study, three populations of micaceous phases were detected: The non-expandable micas, already mentioned, and two populations of expandable phases with interlayer charges of 0.87 ± 0.02 corresponding to illites and 0.97 ± 0.02 corresponding to micas. We infer that these expandable illites are those we observed on TEM images from LR White resin-impregnated samples, forming slightly wavy packets of five to 20 layers and constant periodicity of 10 Å (Figure 6a), and they also have frayed edges, common dislocations, and a loss of layer continuity.
The progressive diagenesis related to the depth in the studied basin also affected the layer charge of the expandable layers in I/S throughout the sequence (Figure 4a,b). In contrast, the layer charge of the expandable micas and illites detected by the alkylammonium study is constant and completely independent of depth and diagenesis (Figure 4c). The lack of changes in the total charge of these expandable phases suggests that they are not products of the diagenetic evolution, but they were probably formed in other higher-grade condition environments than those reached in the basin analysed in this study; for this reason, the diagenetic evolution of the basin did not affect their charge. Therefore, the expandable illites distinguished by the alkylammonium treatment are not the final stage of a smectite to illite reaction during diagenesis.
There are some lattice-fringe TEM images (Figure 5d) corresponding to the R1 stage that show ordered I/S mixed-layer packets (I1 units) coexisting with rich-illite I/S mixed layers (I2 and I3 units). Taking into account that R > 1 I/S have been not detected by XRD, the occurrence of I2 and I3 has to be very scarce. Probably, these I2 and I3 domains are included in the R1 described by XRD, since R1 can contain 60% to 80% illite [26,29]. These I2 and I3 units might be the starting of the R1 illitization, but in any case, it would be a very incipient process.
Composition (AEM) of Micaceous Phases
The compositional field found for all the dioctahedral micaceous phases ranges from typical smectite to mature mica compositions (Figure 8a,b) Their poles are represented by smectite ± R0 (Figure 5c) and mica, showing all the chemical, crystallographic, and textural characteristics of mature detrital mica (Figure 6b). As indicated above, the existence of different materials in the source area, as sedimentary input, is expected in this basin. Nevertheless, no compositional gap can be identified (Figure 8a,b). That is, all the intermediate phases from Sm (and R0 I/S) to R1 I/S to mica, are present in the studied sediments. Alternatively, AEM analyses might suggest a complete illitization process with the formation of all the intermediate steps (smectite-I/S-illite-mica), however, the techniques used in this study of both XRD and HRTEM permit discarding of this hypothesis. This large compositional variation is at least partially due to the complex intergrowths identified by HRTEM images (Figure 5d and Figure 6a).
The defect-free and non-expandable micas, the expandable micas, and the expandable illites (Figure 6a), presumably together with the most illite-rich I-S, are also responsible for the compositional continuity found in Figure 8a,b from R1 I/S to mature mica fields. Their presence in the samples makes it impossible to objectively differentiate the different smectite to mica compositional fields based only on compositional criteria.
Expansible and Non-Expansible Micaceous Phases
The alkylammonium ion intercalation method allows differentiation of the complex association of micaceous phases [23] in the Upper Cretaceous Series of the Álava Trough, constituted by two populations of expandable micaceous phases by long-chain alkylammoniums (nc ≥ 10) and a non-expandable remnant (Figure 3). These phases were always observed in different areas than the I/S (Figure 6a), in the two fractions <2 μm and <0.5 μm and along the entire stratigraphic column, whose depth is greater than 3000 m. The charge distribution of each of these two expandable populations shows several remarkable aspects (Figure 4c): (i) The separation of both populations is evident, (ii) the values of the determined charge present high homogeneity within each population, and (iii) the charge shows no variation with respect to the burial depth. Such observations suggest that the two populations of expandable phases are detrital in origin since the value of their charge is independent of the progress of burial diagenesis. The high value of the charge calculated for the mica population with the highest charge, which is around 0.97 ± 0.02/(Si, Al)4O10, is striking. The expansion of the 2:1 layers by intercalation of the high nc alkylammonium ions is an exchange mechanism in which the K+ ions are displaced by organic cations [13]. Since the charge of the layers is high (~1/(Si, Al)4O10), K+ is strongly linked to the confining tetrahedral layers of the interlayer space, and this is the reason the muscovite normally does not expand. However, if the treatment is long enough, the penetration of the high nc alkylammonium ions, being highly flexible [50], could advance laterally from the edges through a “wedge” type effect, partially or totally expanding the original layer of the muscovite and progressively displacing the K+ from its interlayer positions. The exchange reaction of the alkylammonium ions in the 2:1 micaceous minerals seems to be more influenced by microstructural characteristics than by the layer charge and its K content [51,52]. If the reaction time is sufficient, the lack of homogeneity in the type and distribution of cations in the interlayer can facilitate the aforementioned reaction [17].
The high compositional heterogeneity in the interlayer space observed in the micaceous phases of the studied series could explain their differences in expansibility. In this study, such an aspect can be found in the plot corresponding to the micaceous material (Figure 10), considering the set of particles whose layer charge is >0.75/O10(OH)2, the lower limit of illite charge proposed by [18]. Also, the influence of the differences in grain size cannot be discarded, with smaller grains being more accessible to the intercalation of alkylammonium.
4.1.2. Chlorite Phases
This assemblage of chlorite phases (including both chlorite and different types of mixed-layer minerals related to it) is a very minor component of the phyllosilicate assemblage in both studied sections (Figure 1), with two distinct textures noted that, at first glance, suggest different origins. The first texture is intergrown with mica in large grains nestled with quartz and calcite grains and showing abundant signs of alteration (Figure 5b), aspects indicating a detrital origin. Its provenance is probably found in the low-grade metamorphic rocks present in the Hesperian Massif Palaeozoic [21]. The second texture, noted only occasionally, appears in smaller, slightly disordered packets with no evident signs of alteration (Figure 7). It was observed in sample 3CS3, which corresponds to the R1 stage of diagenetic evolution. Its microfabric comprises packets lacking alterations or layers and with a different microstructure, suggesting a neoformed origin. Nevertheless, these textural differences between the two chlorites could not be related to the composition of the AEM-analysed grains since the analyses that reveal compositions closer to the typical chlorite range correspond to both the R0 and the R1 diagenetic stages (Figure 9). As mentioned, all the analyses reveal an excess of AlVI and high proportions of interlayer cations, a circumstance also observed by other authors [35]. Multiple causes may account for these compositions, including the presence of smectite layers or C/S mixed-layer minerals interlayered with chlorite. In these cases, assuming a homogeneous composition of both the interstratified layers (whether smectite or corrensite) and the chlorite, there should be a correlation between the Fe/(Fe + Mg) and AlVI − AlIV as their proportions vary in the ‘chlorite’ edifice. The absence of such a correlation therefore seems to indicate the existence of significant compositional variability in the interstratifed layers and/or in the chlorite and could be accounted for by the presence of layers of hydroxy interlayered minerals (HIMs) (Figure 9). They usually have high compositional variability due to the different degree of polymerization of the AlVI in the interlayer sheet [53]. This variability is present in all analyses, due to which none of them can be specifically related to the chlorite phases observed under XRD or even under TEM (Figure 7).
The compositional plot (Figure 9) reveals two poles in the analyses, one chlorite and the other corresponding to more heterogeneous phases that include chlorite/tosudite mixed-layer minerals that are most probably the phase detected by XRD (Figure 2) and are only present in the R1 stage. The high rate of AlVI − AlIV and of the Fe/Mg ratio is unlikely compatible to an authigenic origin in the marine sedimentary medium of the Álava Trough. Therefore, the analysed chlorite phases probably correspond initially to chlorites or chlorite mixed-layer minerals altered by HIM layers to a greater or lesser extent, which comprised part of the detrital background in most of the samples. During the R1 stage of more advanced diagenesis, part of the layers must have evolved in micro-settings (on the scale of the grains themselves) with very specific compositions towards chlorites and mixed-layer minerals. The result is the co-existence of compositionally different phases in the same sample, which is a reflection of chemical disequilibrium in the diagenetic setting.
In summary, we conclude that the abundance of clays in Álava Block in the Basque-Cantabrian basin is inherited from the rocks and soils in the source area. The erosion, transportation, and sedimentation are the predominant processes in these settings and cause few changes in clay minerals except for a possible influence on their distribution due to their original size and perhaps some exchange reactions of interlayer cations. Clay-mineral assemblages in such settings can therefore be interpreted based on the factors controlling erosion and soil formation in the source area. Usually, as diagenesis progresses, some inherited minerals may undergo transformations that, to a large extent, can completely obliterate any detrital signal. However, in the studied series, the transformations of the detrital clays are limited, smectite being the most reactive as it transforms into illite through I/S mixed layers during the first stages of burial diagenesis.
4.2. Evolution of the Layer Charge during Diagenesis
Smectite illitization requires the entrance of K into the interlayer spaces, which only occurs if the layer charge is high enough for the interlayer K+ to dehydrate, thereby giving rise to an irreversible collapse of the layer [54]. This increase in the layer charge is due, in the end, to the substitution of part of the Si4+ in the tetrahedral layer with AlIV, a process known as beidellitization. The charge of the expandable 2:1 layers is therefore a key parameter in the illitization process of smectite [1]. Nevertheless, the insertion of K+ into the interlayer spaces depends on the availability of this ion in the setting [10]. That is, the increase in the layer charge is a necessary condition, but it is not enough for illitization. The fact that progressive illitization during diagenesis is found in sedimentary series suggests, therefore, that both requirements, beidellitization and K+ access to the interlayer, have been met and its lack indicates the nonexistence of one of them. This fact has been confirmed in many prograde series showing a Sm-I/S-I phase distribution, with fewer and fewer 2:1 swelling layers. The authors of [55] observed a continual increase in the tetrahedral charge of smectite prior to its illitization during diagenesis in Tertiary sandstones and lutites in the Nakanomata and Yachi rivers in Niigata, Japan.
Nevertheless, the absolute value of the layer charge (and especially its distribution) is difficult to determine, with wildly varying results in the literature depending on the method used [56]. This accounts for the scarcity of studies analysing this question. The intercalation of alkylammonium ions [27,28] and their calculation based on the structural formula are the methods providing the best results. However, although the values from the two methods tend to differ in percentage (sometimes significantly) for various reasons, the alkylammonium ion-exchange method provides an adjusted value for the true layer charge [23].
As seen in the two series studied, the total layer charge shows an increasing trend with depth, somewhat more evident in the R0 stage of diagenetic evolution (Figure 4a). In addition, the tetrahedral charge is always greater than the octahedral charge in both stages. In the R1 stage, the octahedral charge is slightly lower than in the R0 stage, whereas the tetrahedral charge shows the opposite trend (Figure 4b). Therefore, with progressive burial, the charge increases and tends to preferentially locate itself in the tetrahedral layer, slowly increasing.
The evolution of the layer charge from the Upper Cretaceous in the Álava Trough therefore shows that the advance of illitization of smectite is linked to a progressive beidellitization of the smectite. With increasing depth, the beidellite layers are preferentially consumed to form illite in the R1 stage. However, this transformation occurs earlier in the KG series than in the CS series since the former reaches greater permeability and therefore K+ (availability) at shallower depths. In the CS series, however, the setting is less reactive, and the illitization of the beidellite layers occurs at a higher temperature, which is reached at a greater depth (Figure 1). The remnant of smectite layers in the R1 mixed layer has a lower total charge (Figure 4a) since the smectites with a higher charge were consumed in the previous illitization process. With increasing depth, the remnant R1 smectite layers transform to beidellite and undergo a slight increase in layer charge (Figure 4b). Illitization is therefore a reset process in which, during burial, R1 mixed layers progressively substitutes smectite as the dominant phase. The charge of the smectite layers varies within a similar range in both stages: 0.32–0.41 for R0 and slightly lower for R1 at 0.33–0.38. The increased charge at depth occurs in each of the two stages in a similar range of values, although it can develop more slowly in R1 (Figure 4a). The heterogeneity of the original smectite [23] would determine a faster process in R0, whereas the heterogeneity would be lower in the R1 stage due to the prior smectite transformation to R1. In addition, the results (Figure 4a) indicate that the smectite layer charge increases up to an approximate mean value of 0.40/O10(OH)2, which is similar to the maximum charge values obtained for the I/S smectite layers by other authors using different methods [55,57,58].
This trend seems to indicate that the chemical and structural changes involved in smectite illitization as a result of diagenesis probably occur in a relatively closed system on a scale similar to that of the original smectite packets. The cause is related to both an almost total lack of K+ availability outside of the packets and to the absence of effective pathways in, given the medium’s low permeability. These characteristics are found in both lithostratigraphic series studied.
In the Upper Cretaceous series from the Álava Trough, we found two expandable micaceous phases whose charges are nearly constant throughout the stratigraphic column, which suggests the existence of at least two populations of a different nature, prior to their burial, both therefore of a detrital origin, but probably linked to different materials of the source area. The expandability of micaceous phases has been observed even following very low and low grade of metamorphism by some authors [59,60], which also found a decrease in the expandable component with increasing metamorphic grade. The diagenetic grade reached by the Álava Trough series has not exceeded the R1 evolution stage, and the maximum temperature data calculated for these same series in deep wells is under 180 °C [5,59], which is insufficient for the complete disappearance of all the illite swelling layers [59].
5. Conclusions
In the Upper Cretaceous series from the Álava Trough smectite distribution varies in relation to burial depth in the two studied stratigraphic sections, due to the distinct illitization kinetics. The diagenetic grade evolves from the R0 to the R1 stages. Smectite absence occurs at shallower depths in the more condensed section (KG) than in the thicker one (CS), due to greater permeability and availability of K. In the latter, the smectite absence is related to increasing burial depth and geothermal gradient. Several types of micaceous phases and I/S mixed layers with diagenetic or detrital origins were differentiated. Defect-free micas with high K content, ubiquitous in the two series, intergrowth packets of mica-chlorite, and well crystallized and ordered micas with high interlayer content and variable—but high—Na contents, are ascribed to detrital origin. The compositional variability, high range of AlVI − AlIV, and Fe/Mg ratio of the chloritic phases is compatible with the presence of HIM layers to a greater or lesser extent within the chloritic building, which suggests a detrital origin.
With progressive depth, the disappearance of smectite (R0), presence of R1 I/S mixed layers, increase in the charge of the smectitic layers, and their progressive beidellitization, together with the presence of a more oriented fabric are the most obvious mineralogical processes attributable to diagenesis in the Álava Trough. The presence of phases of diagenetic origin is scarce and obliterated by the abundance of detrital phases. The ordered R1 I/S mixed layers are mostly the diagenetic phases, without ruling out some very limited proportion of R > 1 I/S mixed layers. In addition, a small proportion of chloritic phases could have evolved towards C/S mixed layers and chlorites, through the R1 diagenetic stage. With progressive burial, the layer charge of smectitic layers increases and tends to be preferentially located in the tetrahedral layer. In the Álava Trough, the illitization is a reset process in which, during burial, R1 mixed layers progressively substitutes smectite as the dominant phase.
Soils and rocks of advanced diagenesis and very-low or low metamorphic grade of the Hesperian Massif (Iberian Variscan Chain) are the source of sedimentary material. Therefore, deep diagenetic or very low-grade rocks have acted as a source material, making it impossible to mark a neat separation between the detrital and diagenetic materials. Therefore, the interpretation of the true diagenetic grade of a region should always take into account such a possibility and careful consideration of the possible source rocks and analysis of the textural relationships among the identified mineral phases is highly recommended.
Author Contributions
X.A and J.A. carried out the fieldwork and sediment sampling; X.A. performed the experiments and analyzed the data; J.A. wrote the paper and prepared the figures with significant contributions from F.N.; J.A., F.N. and B.B. supervise the laboratory works. All the co-authors performed a critical revision of the intellectual content of the paper.
Funding
This research was funded by the Spanish Government FEDER project CGL 2015-65404-R/BTE, CGL2016-75679-P, by the Basque Government project IT930-16, Research Group RNM-179 of the Junta de Andalucía and the Aragon Government project E18_17R.
Acknowledgments
We are grateful to Christine Laurin for his English corrections. The manuscript benefited from thoughtful reviews by three anonymous reviewers.
Conflicts of Interest
The authors declare no conflict of interest.
References
- Altaner, S.R.; Ylagan, R.E. Comparison of structural models of mixed-layer illite/smectite and reaction mechanisms of smectite illitization. Clays Clay Miner. 1997, 45, 517–533. [Google Scholar] [CrossRef]
- Dong, H.; Peacor, D.R.; Freed, R.L. Phase relations among smectite, R1 illite-smectite, and illite. Am. Mineral. 1997, 82, 379–391. [Google Scholar] [CrossRef]
- Bauluz, B.; Peacor, D.R.; González-López, J.M. Transmission electron microscopy study of illitization in pelites from the Iberian Range, Spain: Layer-by-Layer Replacement. Clays Clay Min. 2000, 48, 374–384. [Google Scholar] [CrossRef]
- Hower, J.; Eslinger, E.; Hower, M.; Perry, E. Mechanism of burial metamorphism of argillaceous sediments: 1. Mineralogical and chemical evidence. Geol. Soc. Am. Bull. 1976, 87, 725–737. [Google Scholar] [CrossRef]
- Arostegui, J.; Sanguesa, F.J.; Nieto, F.; Uriarte, J.A. Thermal models and clay diagenesis in the Tertiary-Cretaceous sediments of the Álava block (Basque-Cantabrian basin, Spain). Clay Miner. 2006, 41, 791–809. [Google Scholar] [CrossRef]
- Nadeau, P.H.; Wilson, M.J.; McHardy, W.J.; Tait, J.M. Interstratified clays as fundamental particles. Science 1984, 225, 923–925. [Google Scholar] [CrossRef] [PubMed]
- Ahn, J.H.; Peacor, D.R. Transmission and analytical electron microscopy of the smectite-to-illite transition. Clays Clay Miner. 1986, 34, 165–179. [Google Scholar]
- Vali, H.; Hesse, R.; Martin, R.F. A TEM-based definition of 2:1 layer silicates and their interstratified constituents. Am. Mineral. 1994, 79, 644–653. [Google Scholar]
- Howard, J.J.; Roy, D.M. Development of layer charge and kinetics of experimental smectite alteration. Clays Clay Miner. 1985, 33, 81–88. [Google Scholar] [CrossRef]
- Cuadros, J. Modeling of smectite illitization in burial diagenesis environments. Geochim. Cosmochim. Acta 2006, 70, 4181–4195. [Google Scholar] [CrossRef]
- Van Olphen, H. An Introduction of Clay Colloid Chemistry; Interscience Publishers, Div. of John Wiley & Sons: New York, NY, USA, 1966; pp. 239–243. ISBN 9780471014638. [Google Scholar]
- Robert, M. The experimental transformation of mica towards smectite: Relative importance of total charge and tetrahedral substitution. Clays Clay Miner. 1973, 21, 167–174. [Google Scholar] [CrossRef]
- Lagaly, G.; Weiss, A. Determination of layer charge in mica-type layer silicates. In Proceedings of the International Clay Conference, Tokyo, Japan, 5–10 September 1969; Heller, L., Ed.; pp. 61–80. [Google Scholar]
- Lagaly, G. Characterization of clays by organic-compounds. Clay Miner. 1981, 16, 1–21. [Google Scholar] [CrossRef]
- Malla, P.B.; Douglas, L.A. Problems in identification of montmorillonite and beidellite. Clays Clay Miner. 1987, 35, 232–236. [Google Scholar] [CrossRef]
- Ghabru, S.K.; Mermut, A.R.; St. Arnaud, R.J. Layer-charge and cation-exchange characteristics of vermiculite (weathered biotite) isolated from a Gray Luvisol in northeastern Saskatchewan. Clays Clay Miner. 1989, 37, 164–172. [Google Scholar] [CrossRef]
- Sears, S.K.; Hesse, R.; Vali, H. Significance of n-alkylammonium exchange in the study of 2:1 clay mineral diagenesis, Mackenzie Delta Beaufort Sea region, Arctic Canada. Can. Mineral. 1998, 36, 1485–1506. [Google Scholar]
- Meunier, A.; Velde, B.; Zalba, P. Illite K-Ar dating and crystal growth processes in diagenetic environments: A critical review. Terra Nova 2004, 16, 296–304. [Google Scholar] [CrossRef]
- Nieto, F.; Ortega-Huertas, M.; Peacor, D.; Arostegui, J. Evolution of illite/smectite from early diagenesis through incipient metamorphism in sediments of the Basque-Cantabrian Basin. Clays Clay Miner. 1996, 44, 304–323. [Google Scholar] [CrossRef]
- Sangüesa, F.J. La diagénesis en el Bloque Alavés de la Cuenca Vasco-Cantábrica: Distribución, Modelización y Aplicaciones. Ph.D. Thesis, Basque Country University, Leioa, Spain, May 1998. [Google Scholar]
- Sangüesa, F.J.; Arostegui, J.; Suarez-Ruiz, I. Distribution and origin of clay minerals in the Lower Cretaceous of the Álava Block (Basque-Cantabrian Basin, Spain). Clay Miner. 2000, 35, 393–410. [Google Scholar] [CrossRef]
- Arostegui, J. Distribución de la diagénesis en la Cuenca Vasco-Cantábrica. In Geología de la Cuenca vasco-Cantábrica; Bodego, A., Mendia, M., Aranburu, A., Apraiz, A., Eds.; Servicio Editorial de la Universidad del País Vasco: Bilbao, Spain, 2014; pp. 119–127. ISBN 978-84-9860-991-2. [Google Scholar]
- Nieto, F.; Arroyo, X.; Arostegui, J. XRD-TEM-AEM comparative study of n-alkylammonium smectites and interstratified minerals in shallow-diagenetic carbonate sediments of the Basque-Cantabrian Basin. Am. Mineral. 2016, 101, 385–398. [Google Scholar] [CrossRef]
- Bauluz, B. Clays in low-temperature environments. In Minerals at the Nanoscale; Nieto, F., Livi, F.T., Eds.; EMU notes in Mineralogy: London, UK, 2013; Volume 14, pp. 181–209. ISBN 978-0903056-34-2. [Google Scholar]
- Ramírez del Pozo, J. Bioestratigrafía y microfacies del Jurásico y Cretácico del Norte de España (Región Cantábrica). Mem. Inst. Geol. Min. Esp. 1971, 78, 357. [Google Scholar]
- Moore, D.M.; Reynolds, R.C., Jr. X-ray Diffraction and the Identification and Analysis of Clay Minerals, 2nd ed.; Oxford University Press: New York, NY, USA, 1997; p. 378. ISBN 0-19-508713-5. [Google Scholar]
- Lagaly, G. Layer charge determination by alkylammonium ions. In Layer Charge Characteristics of Clays; Mermut, A.R., Ed.; The Clay Minerals Society: Boulder, CO, USA, 1994; Volume 6, pp. 1–46. ISBN 9781881208075. [Google Scholar]
- Mermut, A.R.; Lagaly, G. Baseline studies of The Clay Minerals Society Source Clays: Layer-charge determination and characteristics of those minerals containing 2:1 layers. Clays Clay Miner. 2001, 49, 393–397. [Google Scholar] [CrossRef]
- Srodon, J.; Eberl, D.D. Illite. In Micas; Bailey, S.W., Ed.; Mineralogical Society of America: Washington, DC, USA, 1984; Volume 13, pp. 495–544. ISBN 978-0-939950-17-1. [Google Scholar]
- Kim, J.M.; Peacor, D.R.; Tessier, D.; Elsass, E. A technique for maintaining texture and permanent expansion of smectite interlayer spacings for TEM observations. Clays Clay Miner. 1995, 43, 51–57. [Google Scholar] [CrossRef]
- Buseck, P.; Cowley, J.; Eyring, L. High Resolution Transmission Electron Microscopy and Associated Techniques; Oxford University Press: New York, NY, USA, 1989; p. 670. ISBN 9780195042757. [Google Scholar]
- Mermut, A.R.; St. Arnaud, R.J. Layer charge determination of high charge phyllosilicates by alkyl-ammonium technique. In Proceedings of the 27th Annual Meeting of the Clay Minerals Society, Columbia, MO, USA, 6–11 October 1990; p. 86. [Google Scholar]
- Vali, H.; Hesse, R. Alkylammonium ion treatment of clay-minerals in ultrathin section—A new method for HRTEM examination of expandable layers. Am. Mineral. 1990, 75, 1443–1446. [Google Scholar]
- Velde, B. Clay Minerals: A Physico-Chemical Explanation oftheir Occurrence; Elsevier: Amsterdam, The Netherlands, 1985; Volume 40, p. 443. ISBN 9780444553607. [Google Scholar]
- Shau, Y.-H.; Peacor, D.R.; Essene, E.J. Corrensite and mixed-layer chlorite/corrensite in metabasalt from northern Taiwan: TEM/AEM, EMPA, XRD, and optical studies. Contrib. Mineral. Petrol. 1990, 105, 123–142. [Google Scholar] [CrossRef]
- Newman, A.C.D.; Brown, G. The Chemical Constitution of Clays. In Chemistry of Clays and Clay Minerals; Mineralogical Society Monograph No. 6; Newman, A.C.D., Ed.; Longman Scientific & Technical: Harlow, UK, 1987; pp. 2–116. ISBN 978-0582301146. [Google Scholar]
- Floquet, M. Vue sur le Crétacé Basco-Cantabrique et Nord-Iberique. In Mémoires Géologiques de l’Université de Dijon; Institute des Sciences de la Terre: Orléans, France, 1983; Volume 9, pp. 141–168. [Google Scholar]
- Huber, B.; Norris, R.; MacLeod, K. Deep-sea paleotemperature record of extreme warmth during the Cretaceous. Geology 2002, 30, 123–126. [Google Scholar] [CrossRef]
- Chamley, H. North-Atlantic clay sedimentation and palaeoenvironment since the Late Jurassic. In Deep Drilling results in the Atlantic Ocean: Continental Margins and Paleoenvironment; Maurice Ewing Series; Talwani, M., Hay, W., Ryan, W.B.F., Eds.; American Geophysical Union: Washington, DC, USA, 2013; Volume 3, pp. 342–361. ISBN 9780875904023. [Google Scholar]
- Frey, M. A mixed-layer paragonite/phengite of low grade metamorphic origin. Contrib. Mineral. Petrol. 1969, 24, 63–65. [Google Scholar] [CrossRef]
- Jiang, W.-T.; Peacor, D.R. Formation and modification of metastable intermediate sodium potassium mica, paragonite and muscovite in hydrothermally altered metabasites from northern Wales. Am. Mineral. 1993, 78, 782–793. [Google Scholar]
- Livi, K.J.T.; Christidis, G.; Árkai, P.; Veblen, D.R. White mica domain formation: A model for paragonite, margarite, and muscovite formation during prograde metamorphism. Am. Mineral. 2008, 92, 1288–1302. [Google Scholar] [CrossRef]
- Li, G.; Peacor, D.; Merriman, R.J.; Roberts, B.; Van Der Pluijm, B.A. TEM and AEM constraints on the origin and significance of chlorite-mica stacks: An example from Central Wales, U.K. J. Struc. Geol. 1994, 16, 1139–1157. [Google Scholar] [CrossRef]
- Giorgetti, G.; Memmi, I.; Nieto, F. Microstructures of intergrown phyllosilicate grains from Verrucano metasediments (northern Apennines, Italy). Contrib. Mineral. Petrol. 1997, 128, 127–138. [Google Scholar] [CrossRef]
- Abad, I.; Mata, M.P.; Nieto, F.; Velilla, N. The phyllosilicates in diagenetic-metamorphic rocks of the South Portuguese zone, southwestern Portugal. Can. Mineral. 2001, 39, 1571–1589. [Google Scholar] [CrossRef]
- Merriman, R.J. Clay minerals and sedimentary basin history. Eur. J. Mineral. 2005, 17, 7–20. [Google Scholar] [CrossRef] [Green Version]
- Yenes, M.; Alvarez, F.; Nieto, F. Analisis estructural y metamorfico de la deformación hercínica del borde meridional de la Sierra de la Demanda. Estud. Geol. 1990, 46, 223–236. [Google Scholar] [CrossRef]
- Abad, I.; Nieto, F.; Peacor, D.R.; Velilla, N. Prograde and retrograde diagenetic and metamorphic evolution in metapelitic rocks of Sierra Espuña (Spain). Clay Miner. 2003, 38, 1–23. [Google Scholar] [CrossRef] [Green Version]
- Merriman, R.J.; Peacor, D.R. Very Low-Grade Metapelites: Mineralogy, Microfabrics and Measuring Reaction Progress. In Low-Grade Metamorphism; Frey, M., Robinson, D., Eds.; Blackwell Sciences Ltd.: Oxford, UK, 2009; pp. 10–60. ISBN 9780632047567. [Google Scholar]
- Teppen, B.J.; Yu, C.-H.; Miller, D.M.; Schäfer, L. Molecular dynamics simulations of the sorption of organic compounds at the clay mineral/aqueous solution interface. J. Comp. Chem. 1998, 19, 144–153. [Google Scholar] [CrossRef]
- Beneke, K.; Lagaly, G. The brittle mica-like KNiAsO4 and its organic derivatives. Clay Miner. 1982, 17, 177–185. [Google Scholar] [CrossRef]
- Vali, H.; Hesse, R.; Kodama, H. Arrangement of n-alkylammonium ions in phlogopite and vermiculite: An XRD- and TEM-study. Clays Clay Miner. 1992, 40, 240–245. [Google Scholar] [CrossRef]
- Barnhisel, R.I.; Bertsch, P.M. Chlorites and hydroxy interlayered vermiculite and smectite. In Minerals in Soil Environments, 2nd ed.; Dixon, J.B., Weed, S.B., Eds.; Soil Science Society of America, Inc.: Madison, OH, USA, 1989; Volume 1, pp. 729–788. ISBN 9780891188605. [Google Scholar]
- Eberl, D.; Hower, J. The hydrothermal transformation of sodium and potassium smectite into mixed-layer clay. Clays Clay Miner. 1977, 25, 215–227. [Google Scholar] [CrossRef]
- Sato, T.; Murakami, T.; Watanabe, T. Change in layer charge of smectites and smectite layers in illite/smectite during diagenetic alteration. Clays Clay Miner. 1996, 44, 460–469. [Google Scholar] [CrossRef]
- Kaufhold, S.; Dohrmann, R.; Stucki, J.W.; Anastacio, A.S. Layer charge density of smectites—Closing the gap between the structural formula method and the alkyl ammonium method. Clays Clay Miner. 2011, 59, 200–211. [Google Scholar] [CrossRef]
- Srodon, J.; Elsass, E.; McHardy, W.J.; Morgan, D.J. Chemistry of illite-smectite inferred from TEM measurements of fundamental particles. Clay Miner. 1992, 27, 137–158. [Google Scholar] [CrossRef]
- Cetin, K.; Huff, W.D. Layer charge of the expandable component of illite/smectite in K-bentonite as determined by alkylammonium ion-exchange. Clays Clay Miner. 1995, 43, 150–158. [Google Scholar] [CrossRef]
- Kisch, H.J. Mineralogy and Petrology of Burial Diagenesis (Burial Metamorphism) and Incipient Metamorphism in Clastic Rocks. In Diagenesis of Sediments and Sedimentary Rocks; Larsen, G., Chilingar, G.V., Eds.; Elsevier: Amsterdam, The Netherlands, 1983; Volume 25, pp. 289–493. ISBN 978-0-444-42013-8. [Google Scholar]
- Shata, S.; Hesse, R.; Martin, R.F.; Vali, H. Expandability of anchizonal illite and chlorite: Significance for crystallinity development in the transition from diagenesis to metamorphism. Am. Mineral. 2003, 88, 748–762. [Google Scholar] [CrossRef]
Figure 1.
Stratigraphic correlation of the studied series and variations in the clay mineralogy with burial depth. The geologic map of the Basque-Cantabrian basin showing the location of the studied area is modified of Arostegui et al. [22].
Figure 1.
Stratigraphic correlation of the studied series and variations in the clay mineralogy with burial depth. The geologic map of the Basque-Cantabrian basin showing the location of the studied area is modified of Arostegui et al. [22].
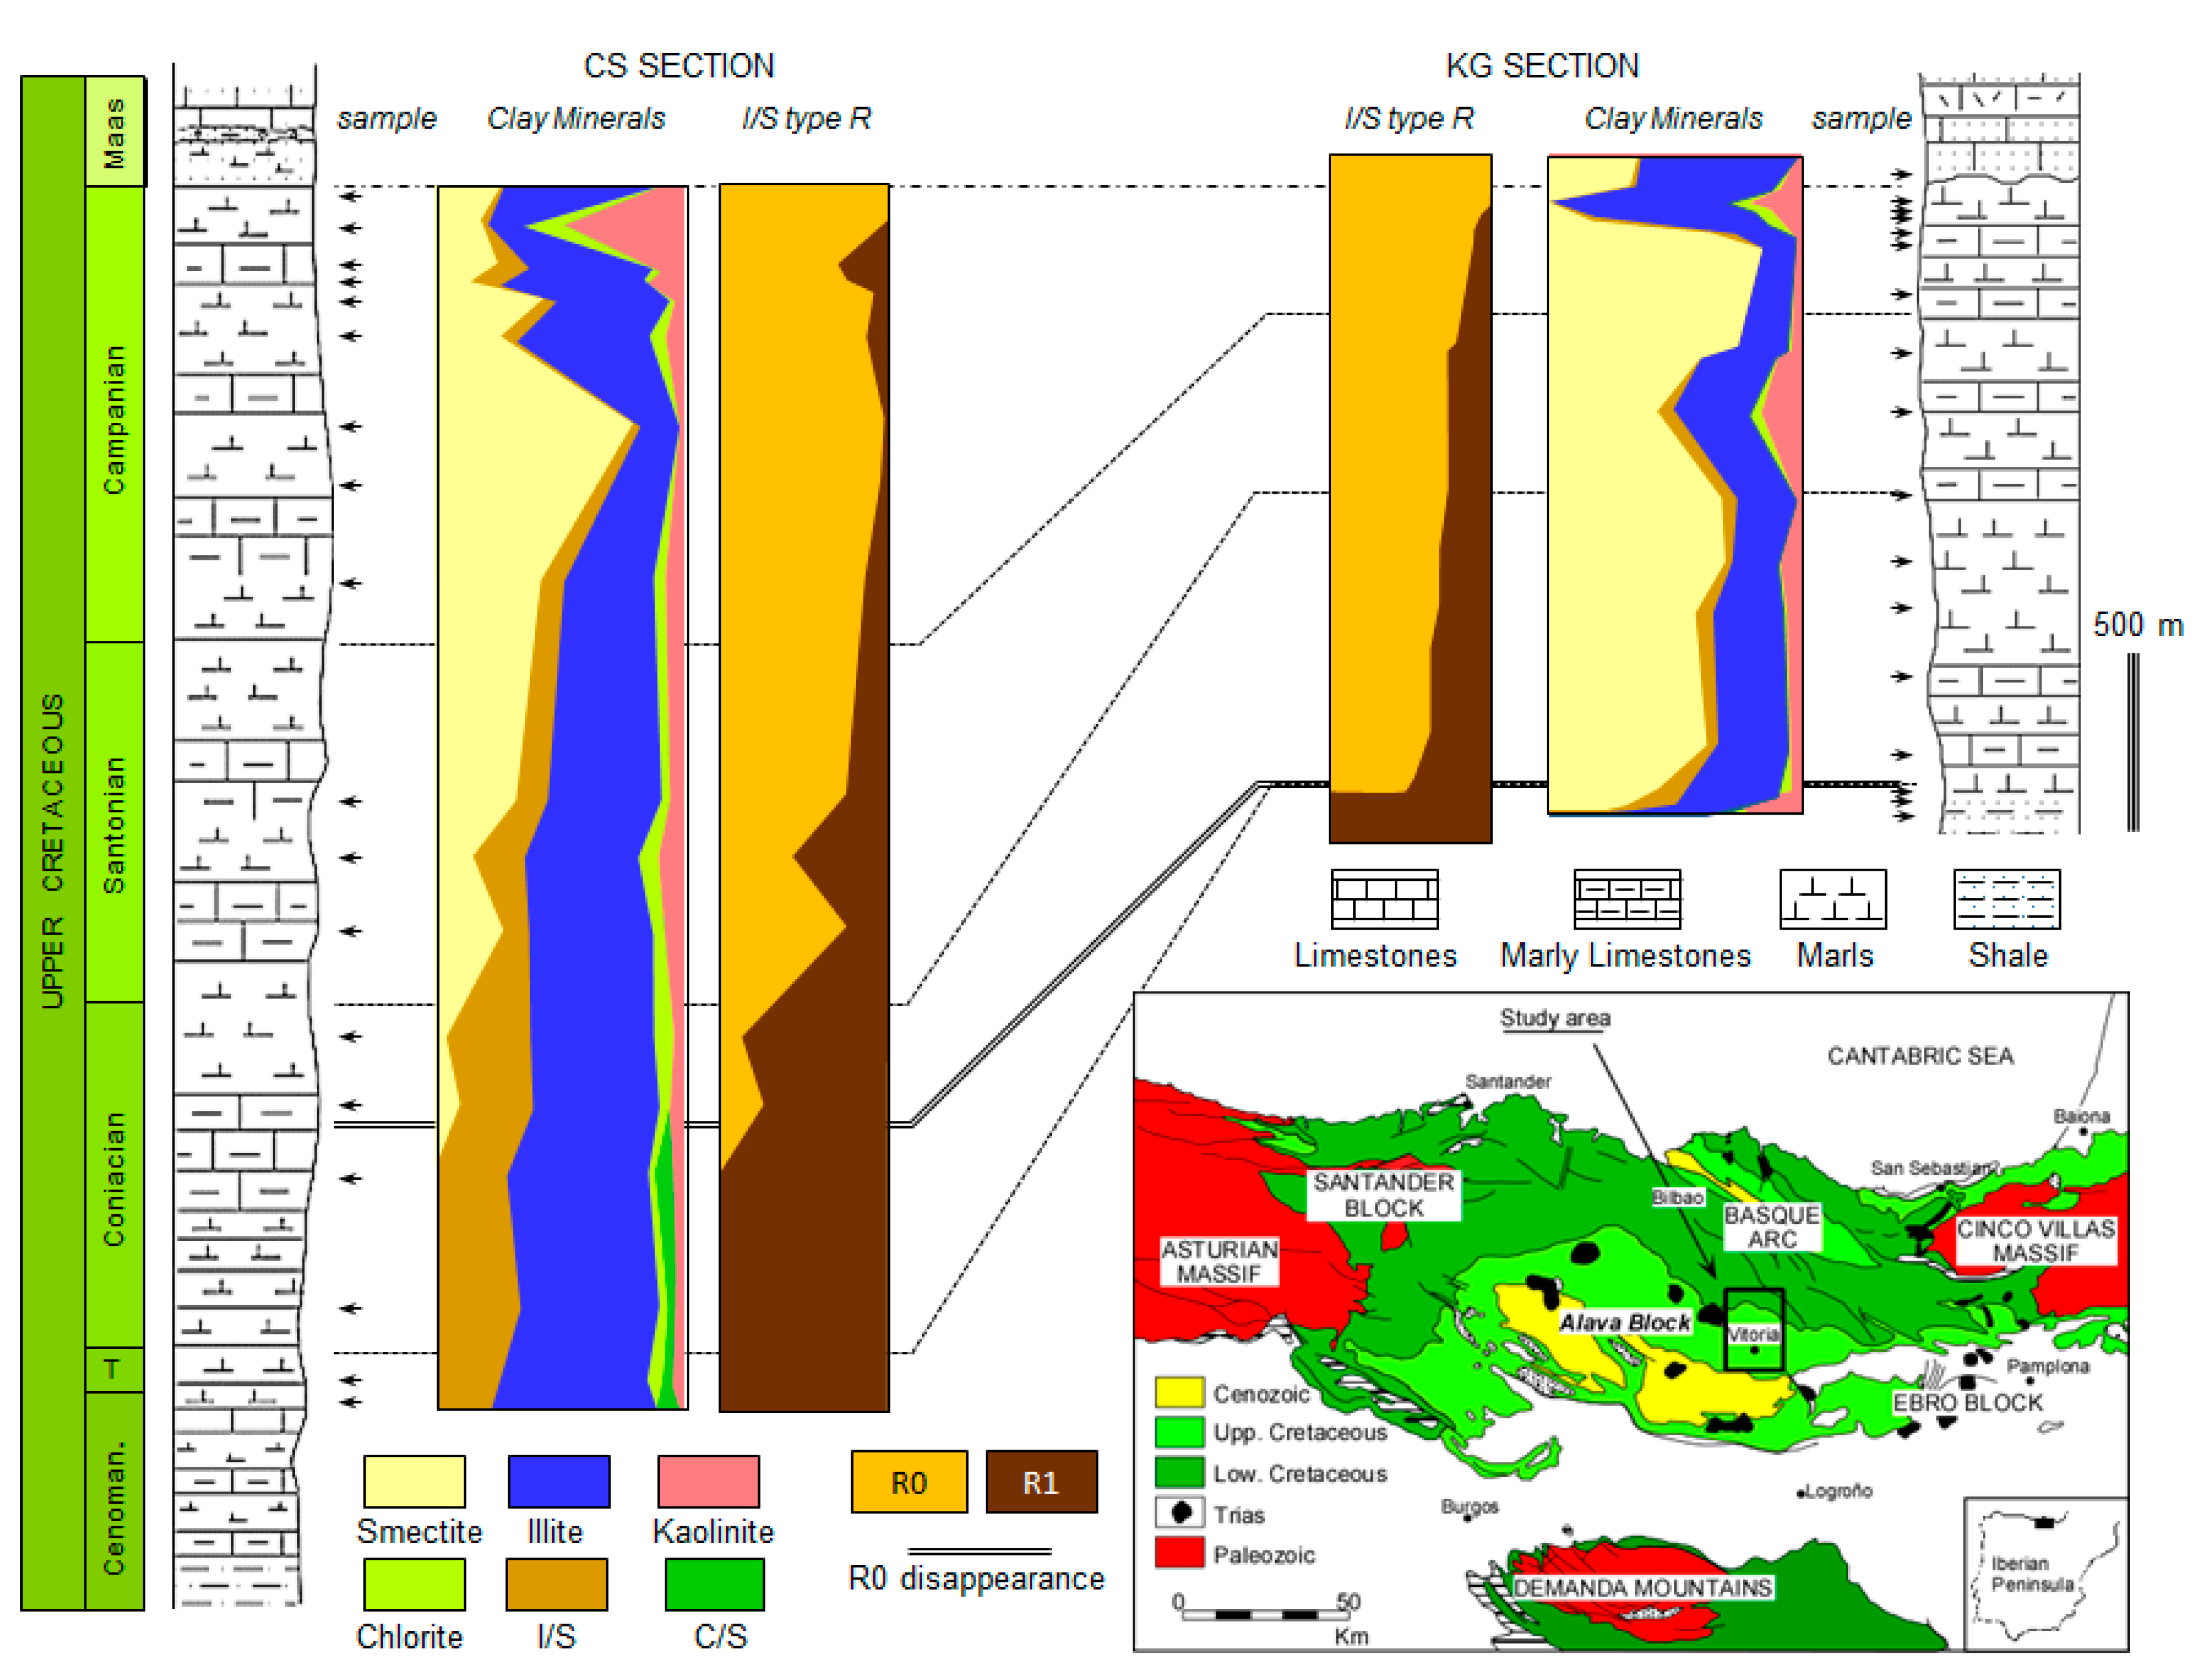
Figure 2.
XRD profiles corresponding to <2 μm oriented fraction representative of stages, R0 and R1, (a) air dried an glycolated; (b) decomposed profiles.
Figure 2.
XRD profiles corresponding to <2 μm oriented fraction representative of stages, R0 and R1, (a) air dried an glycolated; (b) decomposed profiles.
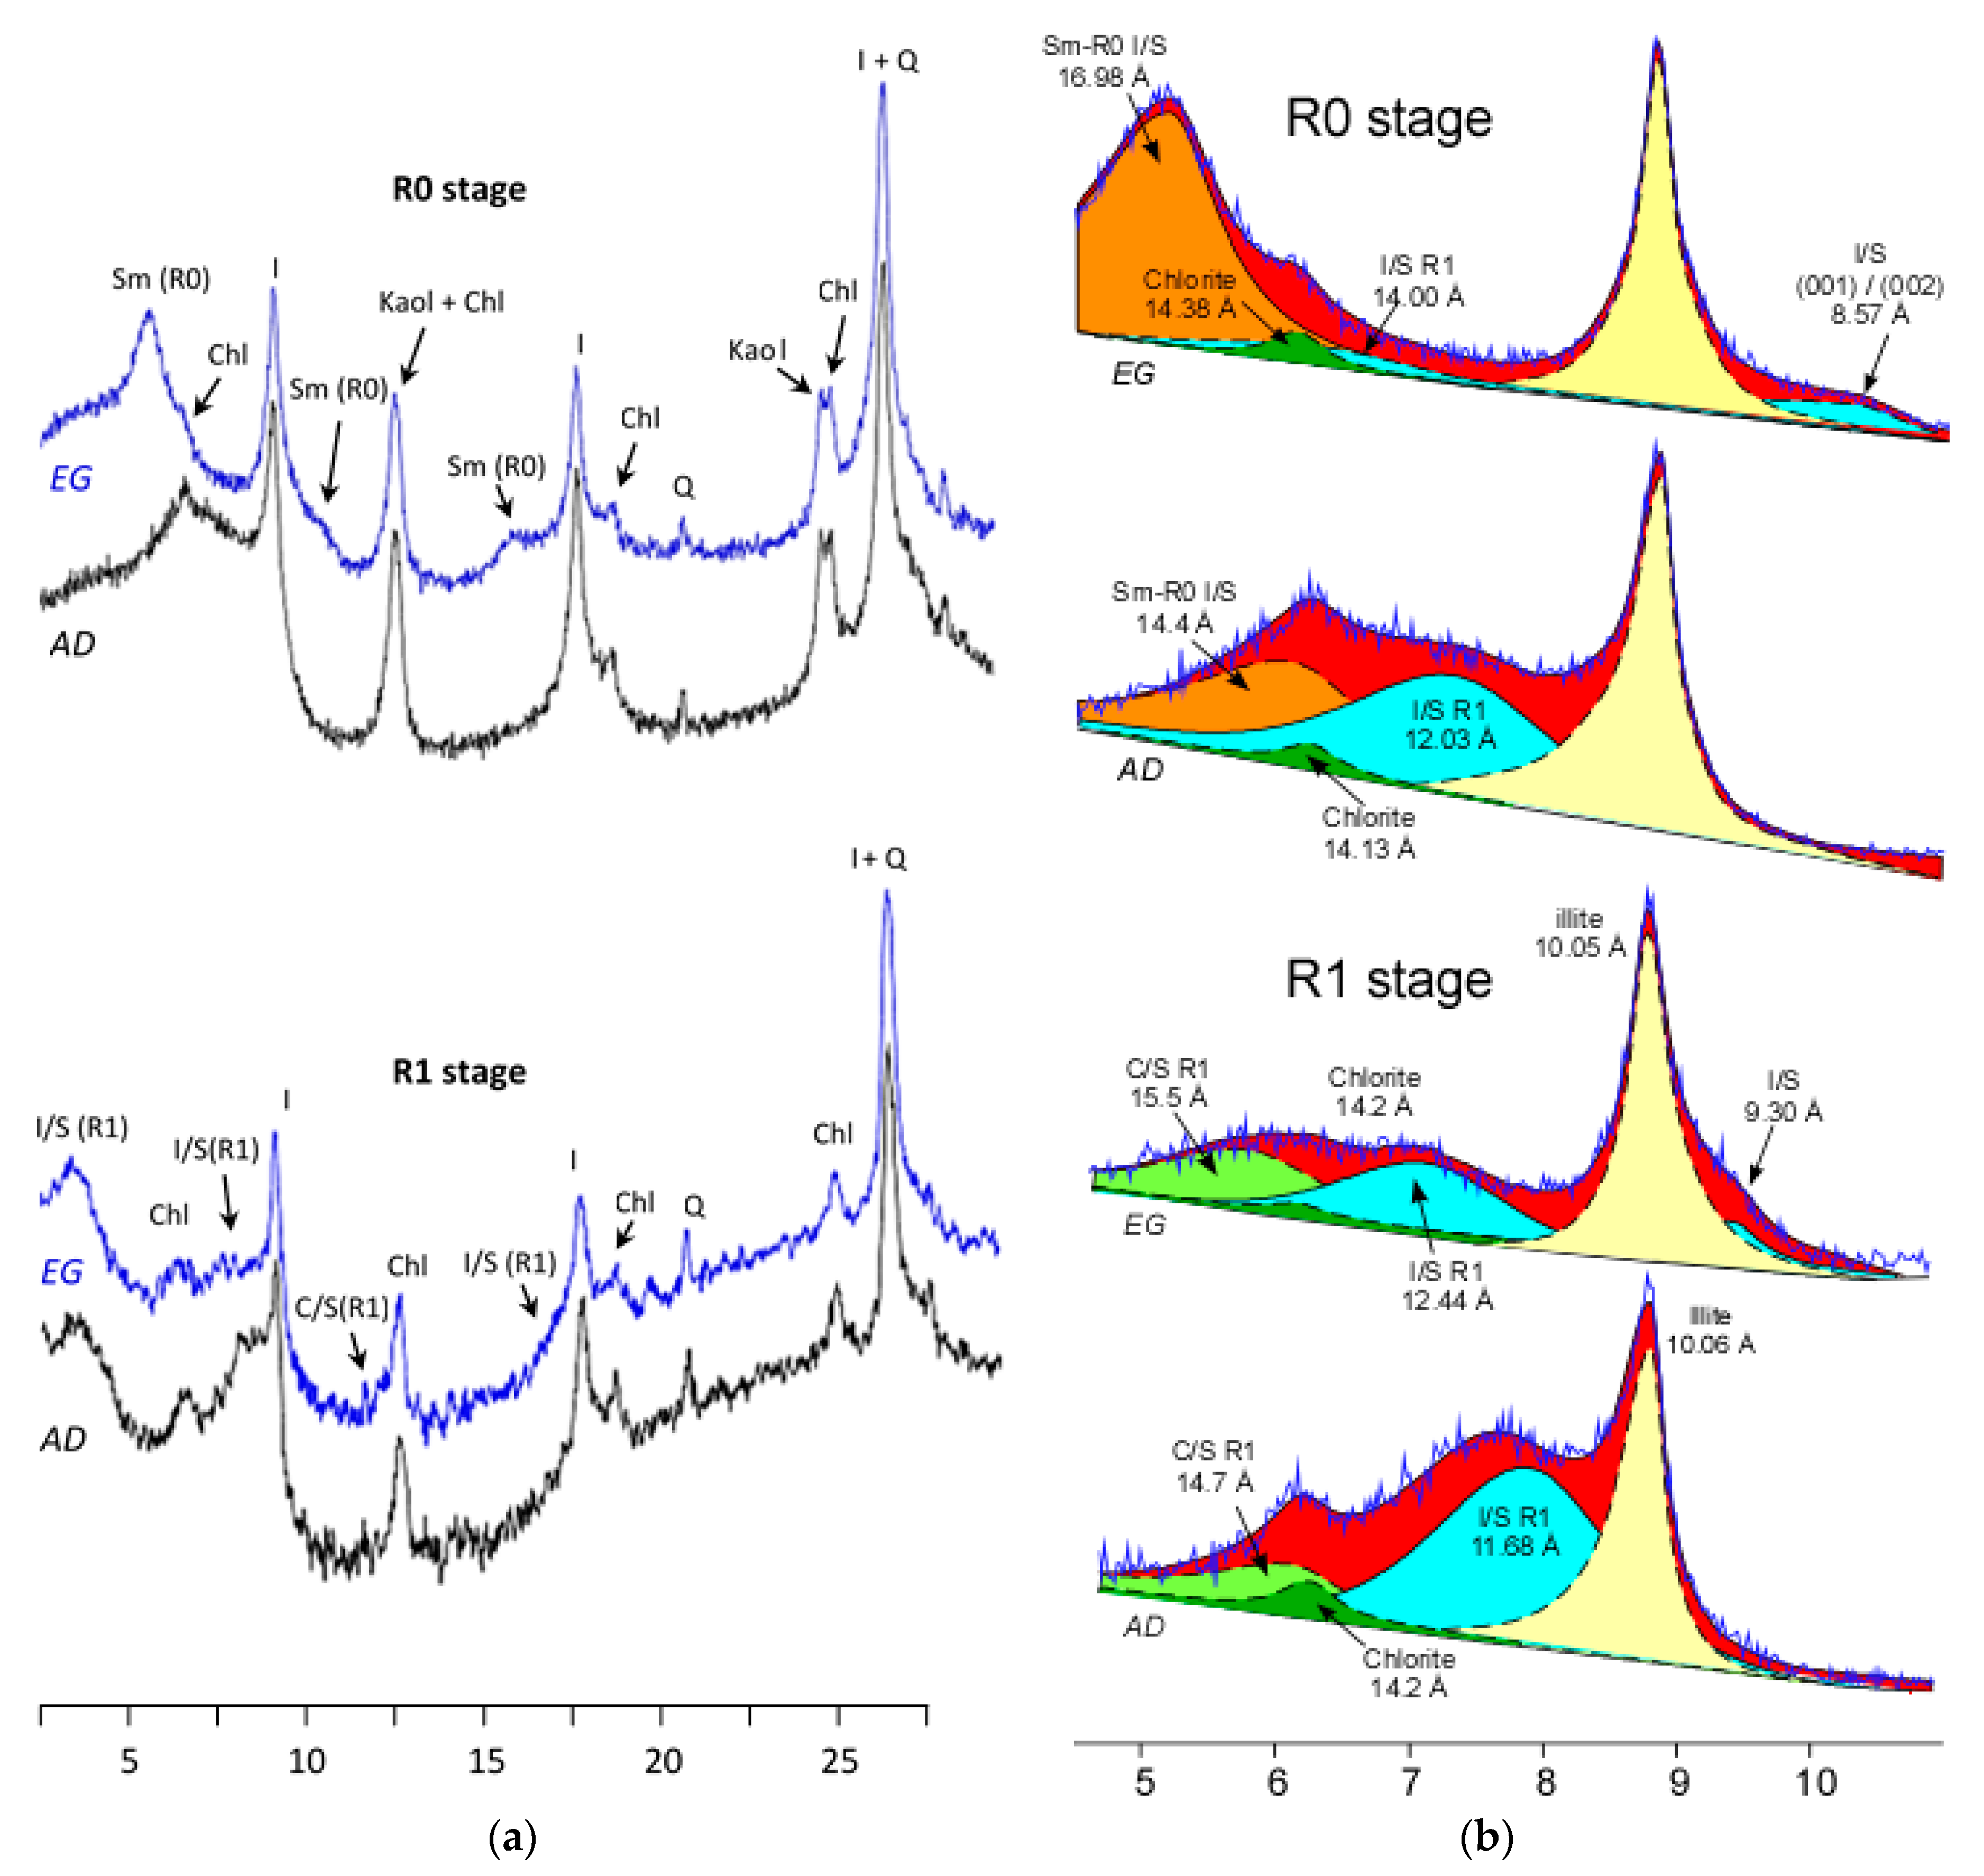
Figure 3.
(a) XRD profiles of <2 μm representative of the R0 diagenesis stage, treated with nc:10 and nc:14 alkylammonium ions. (b) HRTEM image of micaceous packets with coherent sequences of interlayers expanded with 14-alkylammonium with spacings of 24–25 Å; long chain alkylammonium treatment in HRTEM shows two expandable micaceous phase populations (see histogram).

Figure 4.
Variations in the charge of the 2:1 expandable layers with depth through R0 and R1 mineralogical intervals of the Álava Trough sections: (a) Total layer charge; (b) tetrahedral and octahedral charges; (c) layer charge of expandable micaceous phases treated with n-alkylammioum.
Figure 4.
Variations in the charge of the 2:1 expandable layers with depth through R0 and R1 mineralogical intervals of the Álava Trough sections: (a) Total layer charge; (b) tetrahedral and octahedral charges; (c) layer charge of expandable micaceous phases treated with n-alkylammioum.
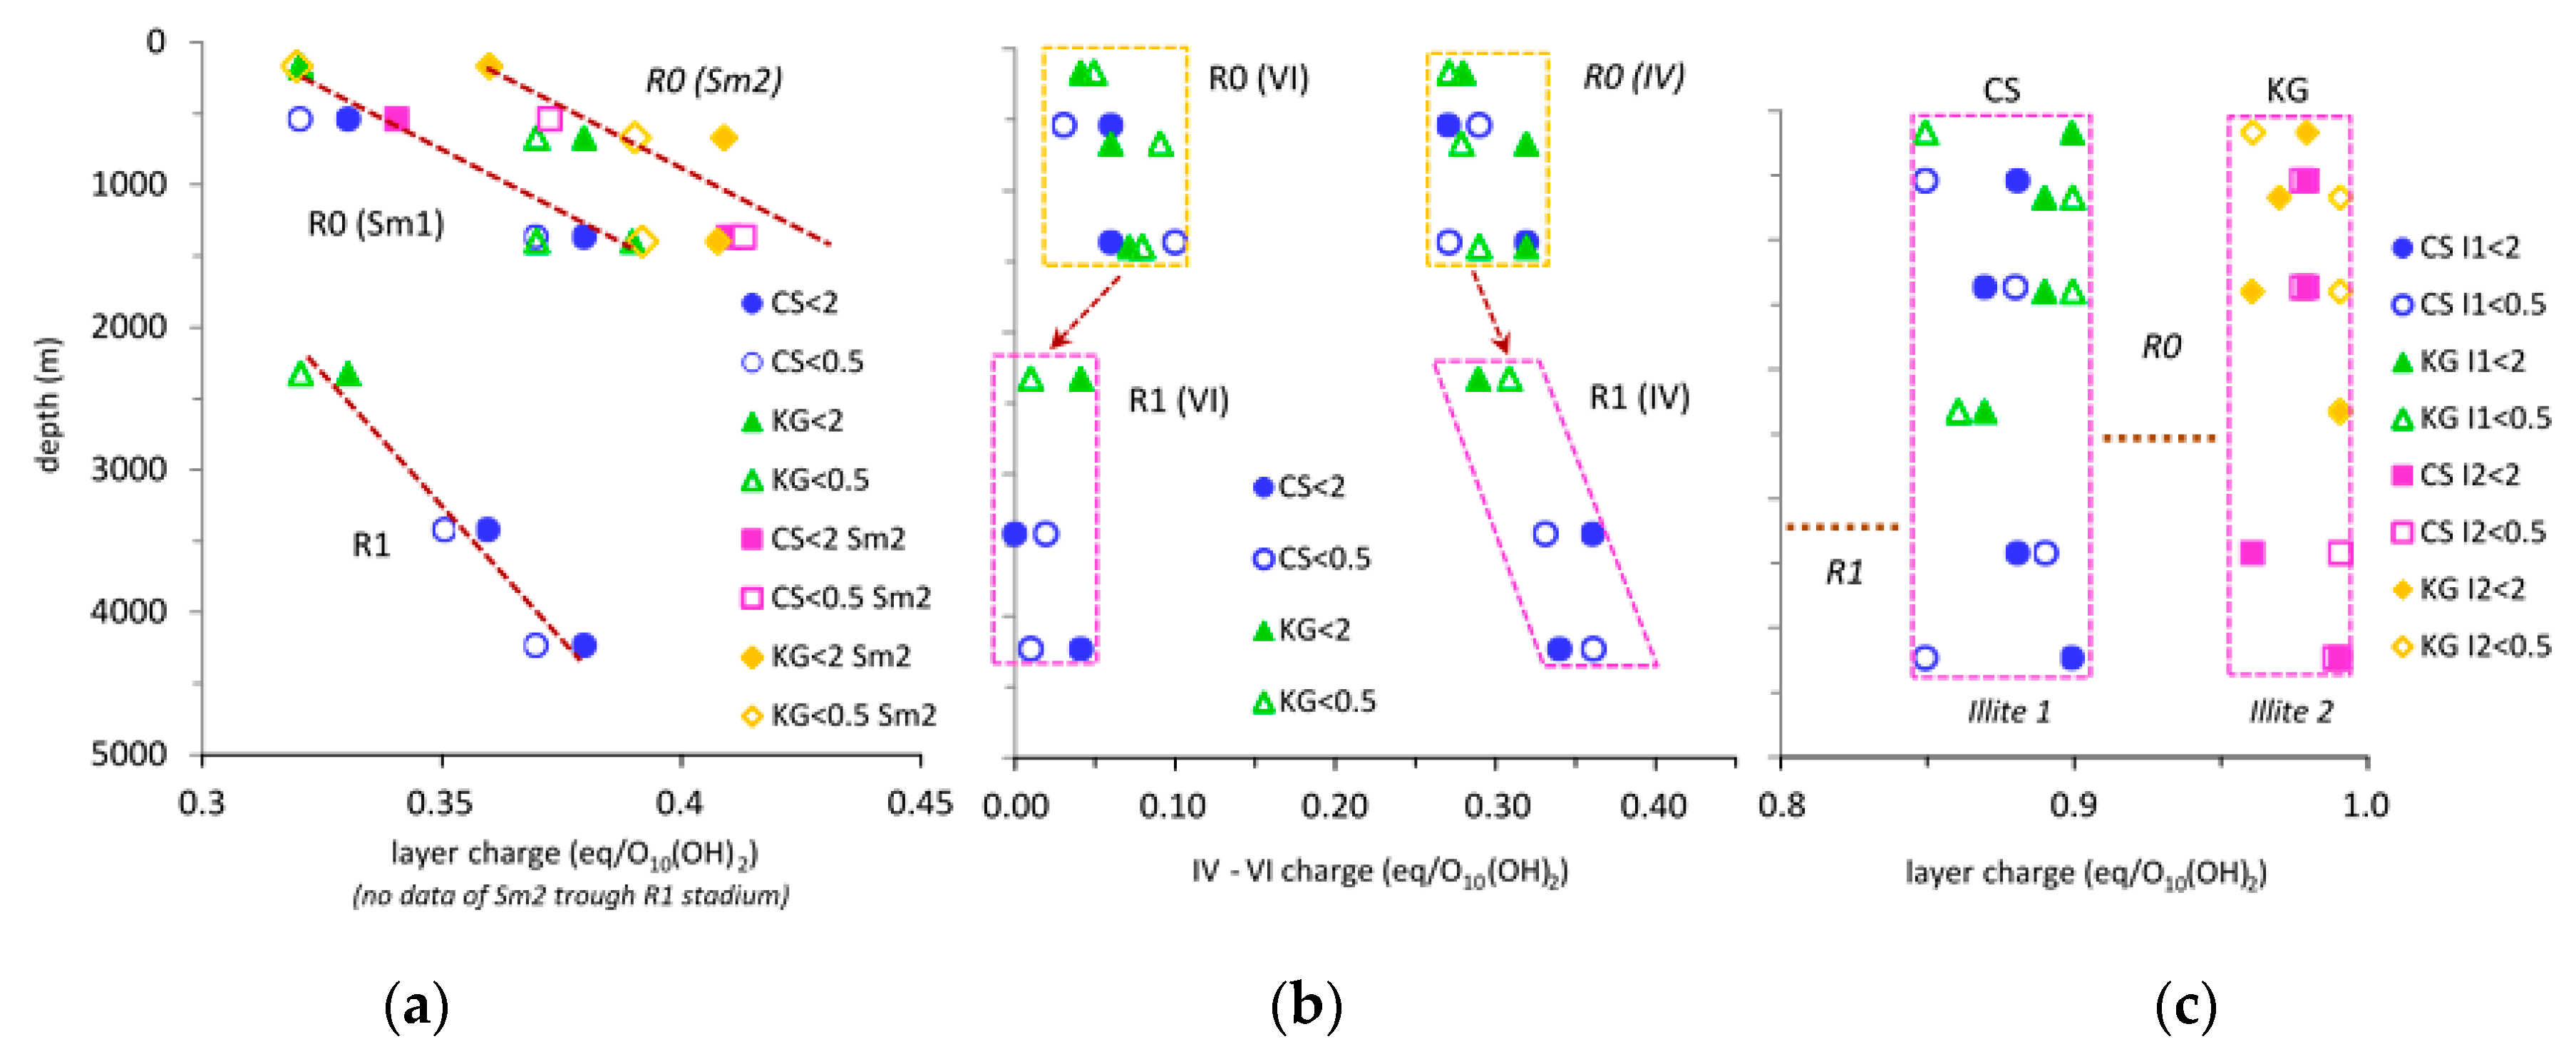
Figure 5.
Low-magnification TEM images: (a) Sample from the top of section R0 (1CS6); (b) sample from section R1 (3CS6). The central grain shows an intergrowth of mica and chlorite. On the left is a package of lens-shaped I/S mixed layers. Note the lower microporosity of this R1 sample compared to the R0 sample; (c) HRTEM image of 1CS6 with anastomosing packets of smectite. The Selected Area Electron Diffraction (SAED) image reveals disordered polytype in a turbostratic arrangement; (d) lattice image of 3CS6 (bottom of section R1) with ordered I/S mixed layers, some with excess illite layers (I2 and I3).
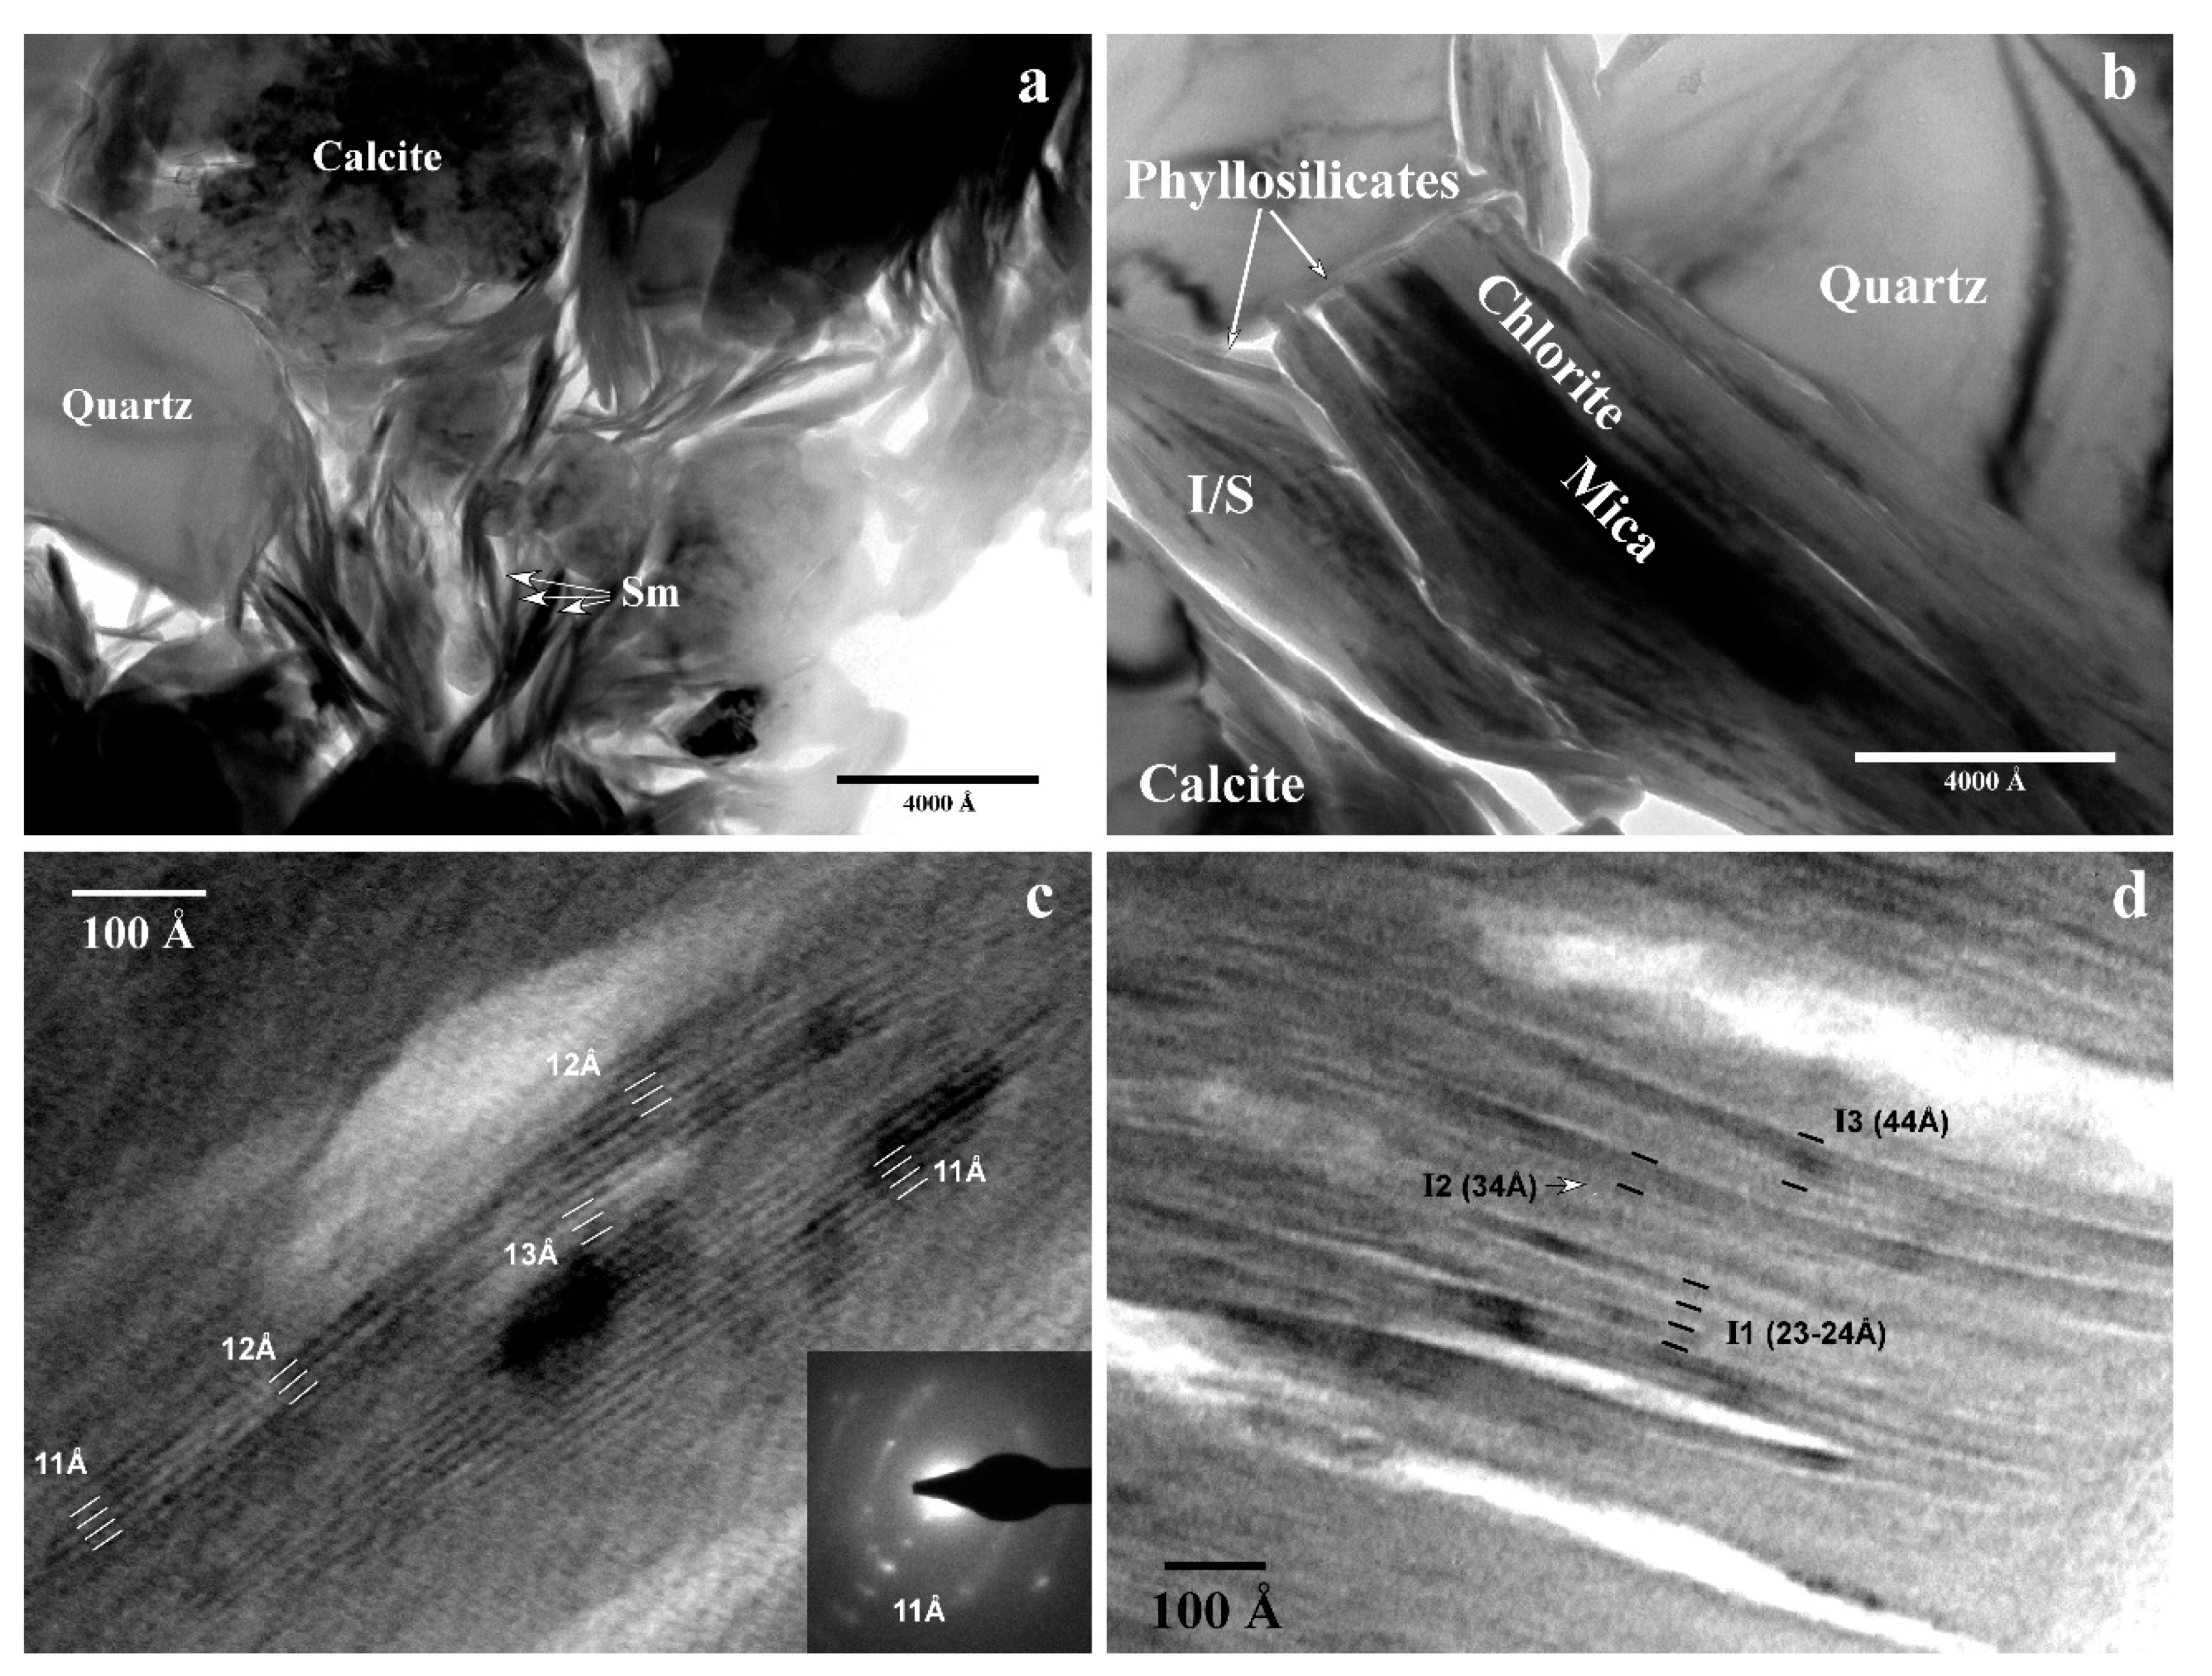
Figure 6.
HRTEM and TEM images of micaceous phases of the Álava Trough sections: (a) Isolated, subparallel packets with 5–15 10 Å layers; (b) TEM and HRTEM images of a grain of detrital mica corresponding to a sample from the bottom of section R1. HRTEM reveals the typical mottled texture and very regular 10 Å spacing. The SAED image is characteristic of a 2 M polytype; (c) TEM image of an Na-rich detrital mica. The HRTEM image in the lower right hand corner shows 20 Å spacings caused by dynamic effects. The SAED image is of a 2 M polytype with a small variation in the crystallographic orientation between domains, related to the grain’s curvature.

Figure 7.
HRTEM image of a sample from interval R1 with subparallel small packets of neoformed chlorite with a 14 Å sequence.
Figure 7.
HRTEM image of a sample from interval R1 with subparallel small packets of neoformed chlorite with a 14 Å sequence.

Figure 8.
Plots of AEM analyses of dioctahedral clays: Smectite and R0 I/S mixed layers and R ≥ 1 + illite + mica phases of the R0 and R1 stages of diagenesis: (a) Si vs interlayer charge; (b) MR3 - 2R3 - 3R2 ternary diagram of Velde (1985); (c) smectite (R0) layer charge based on the structural formula obtained by AEM (X: individual particle analysis; other symbols: average values for each sample); (d) ternary diagram showing the content in interlayer cations.

Figure 9.
Compositional plot of the chlorite phases in the ternary diagram of Si - R2+ - R3+. The arrows denote possible vectors accounting for the compositional ranges determined by AEM.
Figure 9.
Compositional plot of the chlorite phases in the ternary diagram of Si - R2+ - R3+. The arrows denote possible vectors accounting for the compositional ranges determined by AEM.

Figure 10.
Triangular plot showing the cation composition of the interlayer of the illitic-micaceous clays (analyses with layer charge >0.75 per half unit cell in Figure 8).
Figure 10.
Triangular plot showing the cation composition of the interlayer of the illitic-micaceous clays (analyses with layer charge >0.75 per half unit cell in Figure 8).
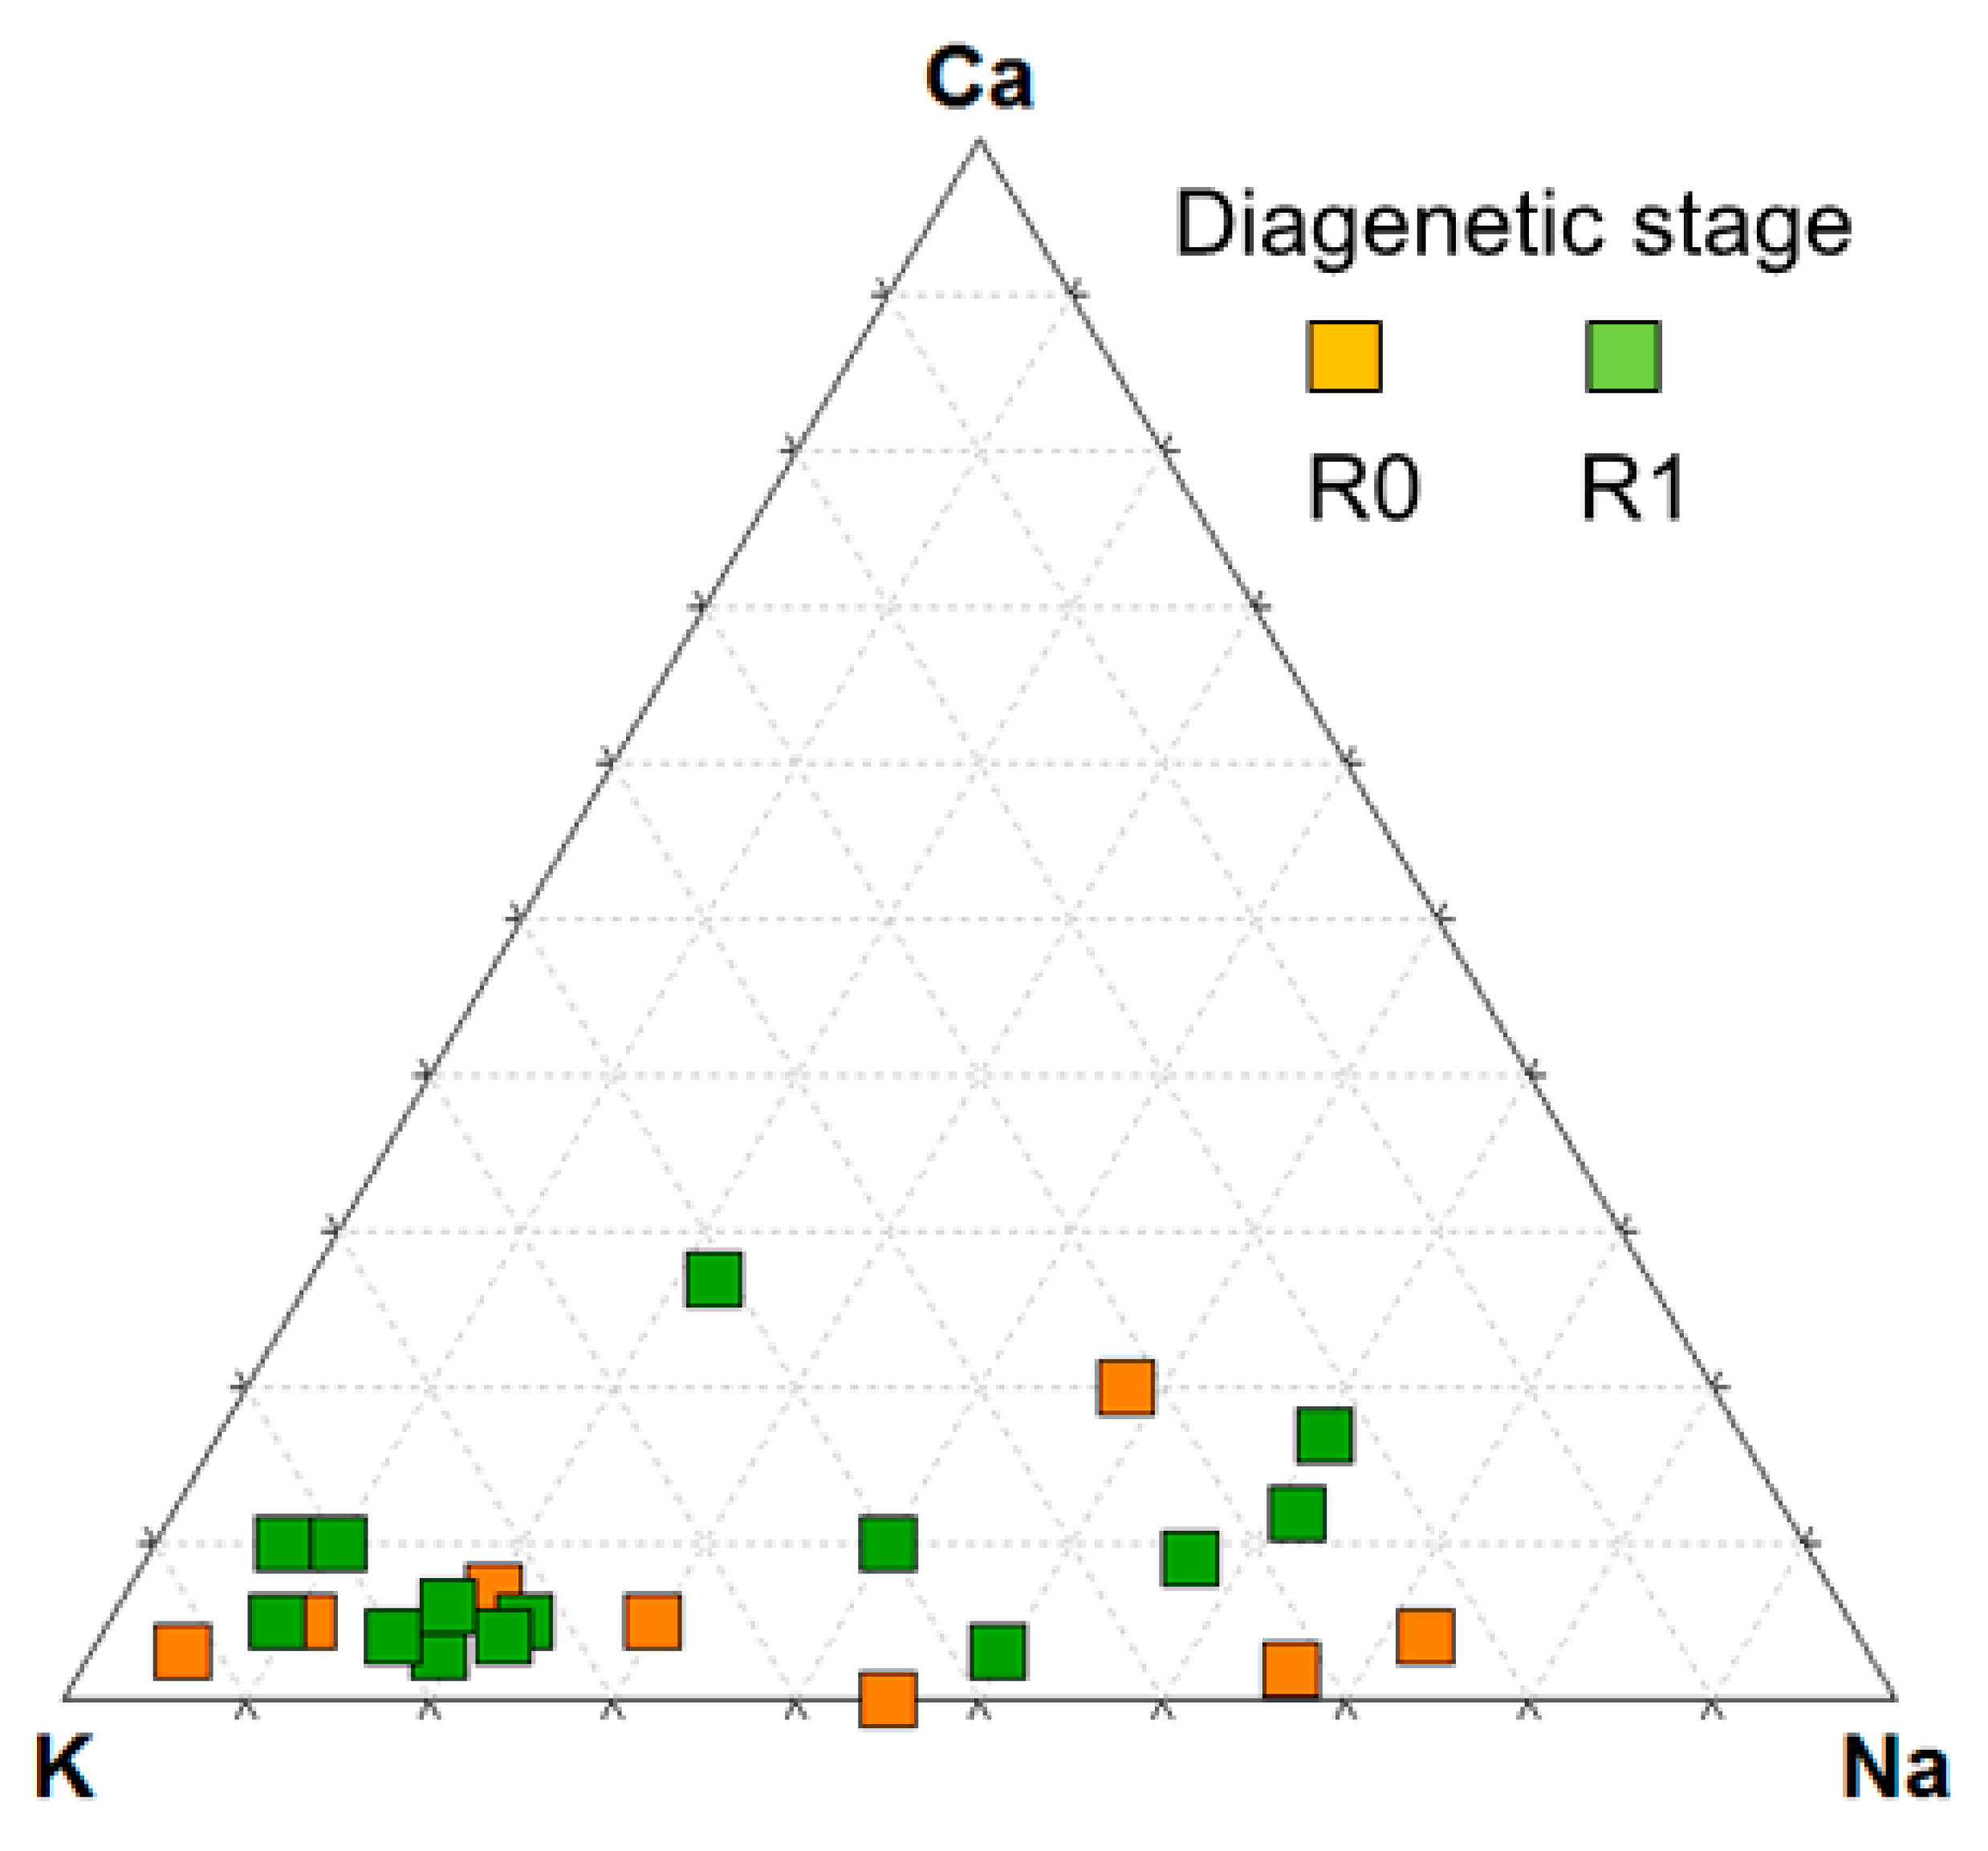

Table 1.
Chemical composition of micaceous phases determined by AEM.
| Sample | Si | AlIV | AlVI | Fe a | Mg | Ti | Σoct | K | Na | Ca | Σ Int. |
|---|---|---|---|---|---|---|---|---|---|---|---|
| Illitic-Micaceous phases (R0 stadium) | |||||||||||
| 1CS6-6-7 | 3.21 | 0.79 | 1.84 | 0.09 | 0.12 | 0 | 2.06 | 0.42 | 0.35 | 0 | 0.77 |
| 1CS6-13-13 | 3.29 | 0.71 | 1.78 | 0.11 | 0.16 | 0 | 2.05 | 0.51 | 0.14 | 0.05 | 0.75 |
| 1CS9-7-11 | 3.33 | 0.67 | 1.77 | 0.07 | 0.23 | 0 | 2.07 | 0.48 | 0.12 | 0.05 | 0.7 |
| 1KG5-2-5 | 3.31 | 0.69 | 1.61 | 0.19 | 0.24 | 0 | 2.05 | 0.19 | 0.58 | 0.03 | 0.83 |
| 1KG5-4-7 | 3.17 | 0.83 | 1.29 | 0.46 | 0.37 | 0 | 2.12 | 0.26 | 0.39 | 0.16 | 0.97 |
| 1KG5-5-8 | 3.33 | 0.67 | 1.55 | 0.21 | 0.27 | 0 | 2.04 | 0.72 | 0.09 | 0.04 | 0.89 |
| 1KG5-6-9 | 3.16 | 0.84 | 1.78 | 0.11 | 0.14 | 0 | 2.03 | 0.29 | 0.59 | 0.02 | 0.92 |
| 1KG5-11-14 | 3.22 | 0.78 | 1.78 | 0.11 | 0.12 | 0 | 2.01 | 0.57 | 0.26 | 0.04 | 0.91 |
| 1KG5-15-4 | 3.45 | 0.55 | 1.48 | 0.25 | 0.3 | 0 | 2.04 | 0.73 | 0.04 | 0.02 | 0.81 |
| Illitic-Micaceous phases (R1 stadium) | |||||||||||
| 3CS3-1-16 | 3.41 | 0.59 | 1.81 | 0.07 | 0.12 | 0 | 2 | 0.44 | 0.14 | 0.07 | 0.72 |
| 3CS3-2-17 | 3.43 | 0.57 | 1.72 | 0.05 | 0.27 | 0 | 2.04 | 0.44 | 0.16 | 0.07 | 0.74 |
| 3CS3-3-18 | 3.21 | 0.79 | 1.82 | 0.03 | 0.12 | 0 | 1.98 | 0.45 | 0.47 | 0.03 | 0.98 |
| 3CS3-10-25 | 3.12 | 0.88 | 1.78 | 0.05 | 0.18 | 0 | 2.01 | 0.79 | 0.16 | 0.04 | 1.03 |
| 3CS6-1-4 | 3.22 | 0.78 | 1.76 | 0.07 | 0.14 | 0 | 1.98 | 0.81 | 0.09 | 0.05 | 1 |
| 3CS6-2-5 | 3.3 | 0.7 | 1.88 | 0.02 | 0.14 | 0 | 2.04 | 0.23 | 0.25 | 0.12 | 0.72 |
| 3CS6-6-9 | 3.23 | 0.77 | 1.84 | 0.05 | 0.14 | 0 | 2.03 | 0.26 | 0.44 | 0.07 | 0.84 |
| 3CS6-7-10 | 3.51 | 0.49 | 1.72 | 0.11 | 0.14 | 0 | 1.97 | 0.57 | 0.05 | 0.07 | 0.76 |
| 3CS6-9-12 | 3.25 | 0.75 | 1.79 | 0.07 | 0.25 | 0 | 2.1 | 0.14 | 0.32 | 0.12 | 0.7 |
| 3CS6-11-14 | 3.51 | 0.49 | 1.77 | 0.05 | 0.12 | 0 | 1.95 | 0.56 | 0.07 | 0.07 | 0.77 |
| 3CS6-12-15 | 3.18 | 0.82 | 1.82 | 0.02 | 0.14 | 0 | 1.98 | 0.25 | 0.58 | 0.11 | 1.05 |
| 3CS6-13-16 | 3.18 | 0.82 | 1.8 | 0.05 | 0.18 | 0 | 2.03 | 0.37 | 0.16 | 0.2 | 0.93 |
| 3CS6-15-18 | 3.28 | 0.72 | 1.75 | 0.05 | 0.18 | 0.04 | 2.02 | 0.58 | 0.18 | 0.04 | 0.84 |
| 3KG5-1-20 | 3.25 | 0.75 | 1.75 | 0.09 | 0.14 | 0 | 1.98 | 0.44 | 0.35 | 0.09 | 0.97 |
| 3KG5-3 | 3.13 | 0.87 | 1.73 | 0.05 | 0.16 | 0.05 | 2 | 0.71 | 0.21 | 0.04 | 1 |
| 3KG5-4 | 3.28 | 0.72 | 1.65 | 0.2 | 0.25 | 0 | 2.09 | 0.57 | 0.14 | 0.02 | 0.75 |
| 3KG5-5 | 3.38 | 0.62 | 1.64 | 0.16 | 0.26 | 0 | 2.06 | 0.55 | 0.13 | 0.04 | 0.76 |
| 3KG5-8-27 | 3.14 | 0.86 | 1.85 | 0.07 | 0.14 | 0 | 2.06 | 0.16 | 0.43 | 0.12 | 0.83 |
Composition normalized to O10(OH)2. Σoct = Sum of octahedral cations. Σint = Sum of interlayer charge. a All Fe considered as Fe3+.
Table 2.
Chemical composition of chloritic phases determined by AEM.
| Sample | Si | AlIV | AlVI | Fe a | Mg | Ti | Σoct | K | Na | Ca | Σ Int. |
|---|---|---|---|---|---|---|---|---|---|---|---|
| Chlorite (R0 stadium) | |||||||||||
| 1CS6-2-2 | 3.24 | 0.76 | 2.07 | 2.16 | 1.03 | 0.00 | 5.26 | 0.07 | 0.00 | 0.05 | 0.12 |
| 1CS6-21-21 | 3.06 | 0.94 | 1.69 | 2.42 | 1.35 | 0.02 | 5.48 | 0.00 | 0.21 | 0.02 | 0.23 |
| Chlorite (R1 stadium) | |||||||||||
| 3CS3-3 | 2.81 | 1.19 | 1.67 | 2.31 | 1.60 | 0.00 | 5.58 | 0.02 | 0.10 | 0.12 | 0.24 |
| 3CS3-5-9 | 3.68 | 0.32 | 2.20 | 1.58 | 1.08 | 0.00 | 4.86 | 0.10 | 0.15 | 0.07 | 0.31 |
| 3CS3-21b | 3.80 | 0.20 | 2.26 | 1.70 | 0.74 | 0.00 | 4.70 | 0.12 | 0.14 | 0.14 | 0.40 |
| 3CS3-22b | 3.54 | 0.46 | 2.09 | 1.94 | 0.95 | 0.00 | 4.98 | 0.10 | 0.12 | 0.10 | 0.31 |
| 3CS3-24b | 3.33 | 0.67 | 2.11 | 1.89 | 1.21 | 0.00 | 5.21 | 0.05 | 0.05 | 0.02 | 0.12 |
| 3CS6-14-17 | 3.18 | 0.82 | 2.19 | 1.85 | 1.19 | 0.00 | 5.23 | 0.00 | 0.07 | 0.05 | 0.12 |
| 3CS6-14-14 | 3.06 | 0.94 | 1.60 | 2.68 | 1.23 | 0.00 | 5.52 | 0.02 | 0.12 | 0.07 | 0.21 |
| 3CS6-16-19 | 3.50 | 0.50 | 2.58 | 1.36 | 0.73 | 0.00 | 4.67 | 0.32 | 0.16 | 0.04 | 0.53 |
| 3CS6-25b | 3.79 | 0.21 | 2.73 | 1.09 | 0.77 | 0.00 | 4.59 | 0.07 | 0.14 | 0.04 | 0.25 |
| 3CS6-26b | 3.40 | 0.60 | 2.47 | 1.76 | 0.67 | 0.00 | 4.90 | 0.02 | 0.12 | 0.10 | 0.24 |
| 3KG5-3-22 | 3.68 | 0.32 | 2.55 | 1.37 | 0.69 | 0.00 | 4.61 | 0.04 | 0.28 | 0.11 | 0.44 |
| 3KG5-5-24 | 3.35 | 0.65 | 1.75 | 2.62 | 0.97 | 0.00 | 5.33 | 0.02 | 0.16 | 0.02 | 0.20 |
| 3KG5-14-33 | 3.38 | 0.62 | 2.22 | 1.90 | 0.72 | 0.00 | 4.84 | 0.07 | 0.38 | 0.14 | 0.58 |
| 3KG5-29b | 3.19 | 0.81 | 1.85 | 2.60 | 0.90 | 0.00 | 5.35 | 0.00 | 0.12 | 0.07 | 0.19 |
| 3KG5-35b | 3.39 | 0.61 | 2.45 | 1.66 | 0.81 | 0.00 | 4.92 | 0.16 | 0.07 | 0.04 | 0.27 |
Composition normalized to O10(OH)8. Σoct = Sum of octahedral cations. Σint = Sum of interlayer cations. a All Fe considered as Fe2+.
© 2019 by the authors. Licensee MDPI, Basel, Switzerland. This article is an open access article distributed under the terms and conditions of the Creative Commons Attribution (CC BY) license (http://creativecommons.org/licenses/by/4.0/).
Share and Cite
MDPI and ACS Style
Arostegui, J.; Arroyo, X.; Nieto, F.; Bauluz, B. Evolution of Clays in Cretaceous Marly Series (Álava Block, Basque Cantabrian Basin, Spain): Diagenesis and Detrital Input Control. Minerals 2019, 9, 40. https://doi.org/10.3390/min9010040
AMA Style
Arostegui J, Arroyo X, Nieto F, Bauluz B. Evolution of Clays in Cretaceous Marly Series (Álava Block, Basque Cantabrian Basin, Spain): Diagenesis and Detrital Input Control. Minerals. 2019; 9(1):40. https://doi.org/10.3390/min9010040
Chicago/Turabian StyleArostegui, Javier, Xabier Arroyo, Fernando Nieto, and Blanca Bauluz. 2019. "Evolution of Clays in Cretaceous Marly Series (Álava Block, Basque Cantabrian Basin, Spain): Diagenesis and Detrital Input Control" Minerals 9, no. 1: 40. https://doi.org/10.3390/min9010040
Note that from the first issue of 2016, this journal uses article numbers instead of page numbers. See further details here.