Flotation Behavior of Diatomite and Albite Using Dodecylamine as a Collector

1
College of Chemistry, Chemical Engineering and Environmental Engineering, Liaoning Shihua University, Fushun 113001, Liaoning, China
2
School of Resources and Civil Engineering, Northeastern University, Shenyang 110819, Liaoning, China
*
Author to whom correspondence should be addressed.
Minerals 2018, 8(9), 371; https://doi.org/10.3390/min8090371
Submission received: 11 July 2018
/
Revised: 22 August 2018
/
Accepted: 23 August 2018
/
Published: 27 August 2018
(This article belongs to the Special Issue Applications of Atomic Force Microscopy in Mineral Flotation)
Abstract
:The flotation behaviors of diatomite and albite using dodecylamine (DDA) as a collector were investigated and compared. The pure mineral flotation results indicate that the flotability difference between albite and diatomite is above 87% at pH 5.5 to 10.5. The recovery of albite improves with increasing DDA dosage at pH 5.5 to 10.5. In the same pH range, diatomite has weaker flotability than albite, particularly in alkaline pH pulp. Zeta potential measurements indicate that diatomite has a higher negative surface charge than albite at pH 7 to 12, DDA interacts strongly with albite and weakly with diatomite. Thus, DDA preferentially absorbs on albite surface rather than diatomite under alkaline conditions. Fourier transform infrared spectra (FTIR) indicate that the amount of DDA adsorbed to albite is greater than that adsorbed to diatomite, under the same conditions. The adsorption of DDA on the surface of diatomite is investigated by using atomic force microscopy (AFM) for the first time. The adsorption of the collector DDA on the surface of albite per unit area is greater than that on diatomite. This accounts for the lower recovery of diatomite than that of albite.
1. Introduction
Diatomite is a sedimentary rock primarily composed of the skeletons of microscopic single-celled aquatic plants called diatoms. Diatomite has a chemical formula of SiO2·nH2O (i.e., amorphous silica) [1,2]. The genesis of diatomite provides it with useful characteristics such as high porosity, large pore volume, high adsorption capacity, and low weight [3]. These characteristics make it useful in filtration materials, catalyst carriers, insulation materials, functional fillers, and cement mixtures [4,5,6]. Local resources and economic development differ between countries, so their consumption and application of diatomite also differ. However, the diatomite is now widely applied as a carrier, adsorbent, and filter aid with high added value.
China ranks second in the world in diatomite reserves with nearly 2 billion tons of total reserves [7]. However, most of these reserves are low-grade [8]. Compared with high-grade diatomite, low-grade diatomite must first be purified through physical or chemical methods. The diatom content can be increased by removing gangue minerals (i.e., albite, quartz, clay, etc.) [9]. Current purification methods [10,11,12,13,14,15,16,17,18] include scrubbing, roasting, acid leaching, gravity dressing, classification, ultrasonic treatment, classification and various combined processes [19,20,21]. These methods are limited by their high water and acid consumption, long production cycles, and environmental pollution. Flotation is an effective method for fine mineral separation, but limited information is available about diatomite purification by flotation. Shi et al. [22] demonstrated the feasibility of using scrubbing-flotation to purify diatomite. However, the effects of the reagents and conditions on the purification of diatomite have not been reported in detail, and the flotation mechanism of diatomite remains unknown.
The current study investigates the flotation [23,24] behavior of pure diatomite and albite that are often present in low-grade diatomite. The differences in flotability between diatomite and albite are analyzed. The mechanisms of the interactions of these mineral surfaces with dodecylamine (DDA) are analyzed using FTIR, zeta potential measurements, and AFM. These findings lay a foundation for further studies of the flotation of low-grade diatomite.
2. Materials and Methods
2.1. Samples and Reagents
Diatomite used in this study was obtained from Linjiang, Jilin Province, China. Pure albite was obtained from Hengyang, Hunan Province, China. The chemical analyses of these two samples were as follows: diatomite: 97.01% SiO2, 0.05% Al2O3, 0.09% Fe2O3, 0.13% CaO, 0.03% K2O, 0.06% MgO, 2.63% L.O.I; albite: 69.28% SiO2, 19.46% Al2O3, 10.74% Na2O, 0.23% Fe2O3, 0.21% K2O, 0.08% MgO. The minus 0.023 mm fractions of diatomite and albite were used for flotation tests. DDA was used as the collector. NaOH and H2SO4 were used as pH regulators. All reagents used were of analytical grade. Distilled water was used in all experiments.
2.2. Micro-Flotation Tests
Single mineral flotation tests were conducted in a hitch groove flotation cell. A prepared 4 g pure mineral sample was transferred into a plastic cell, to which 30 mL of distilled water was added. The pulp was stirred (1000 r/min) for 3 min before adding NaOH or H2SO4 solution to adjust the pH to the desired value of 1.8, 2.15, 2.5, 3.5, 4, 4.5, 5.5, 6.5, 7.5, 8.5, 9.5, 10.5, or 11.5. The reagents were added to the pulp every 3 min, in the order of DDA then frother 2# oil. The suspension was stirred for 3 min after adding the desired amounts of reagents, and flotation was then conducted for 3 min. Finally, the froth products and tailings were each weighed after drying at 100 °C for 10 h. The flotation recovery was calculated by:
in which A is the weight of foam product, and B is the weight of the product in the flotation cell.
2.3. Measurements
Zeta potentials were measured using a Zeta potential analyzer (Malvern Zetasizer Nano ZS90, Partech, St Austell, UK). An agate mortar was used to grind ore samples to obtain 2-μm particle size fractions. 10 mg of mineral sample was added to 100 mL of ultra-pure water, and the resulting slurry was stirred by a magnetic stirrer for 3 min. The pH of the solution was automatically adjusted using HCl or NaOH in the pH range of 1.8–11.5. The collector, 2.38 × 10⁻⁴ mol/L DDA, was then added, and the pulp was stirred for a further 3 min. The uncertainty in the zeta potential as obtained from a minimum of 3 measurements was ±2 mV.
A Nicolet 380-FTIR spectrometer (Nicolet, Waltham, MA, USA) was used to record FTIR spectra of minerals before and after their surface interaction with DDA. Spectra were collected in the range from 400 cm−1 to 4000 cm−1. Mineral (2 g) was added to 15 mL of deionized water, and the resulting slurry was stirred for 3 min. The pH was then adjusted to 5.5, and the collector, 2.38 × 10⁻⁴ mol/L DDA, was added to the slurry. Finally, the sample was vacuum filtered and dried at room temperature, before being subjected to FTIR characterization.
The morphologies of DDA adsorbed on the surfaces of diatomite and albite were scanned by AFM (Bruker Multimode 8, Bruck, Karlsruhe, Germany) [25,26]. The above-prepared samples used for FTIR characterization were fixed onto glass slides. AFM images were collected in ScanAsyst mode, using an Au reflex coated probe at a 1 Hz scan rate and 512 lines per sample.
2.4. Assay of Diatom Content
The flotation concentrate of the artificially mixed ore was roasted for 30 min at 700 °C. According to SiO2 + 2NaOH → Na2O·SiO2 + H2O, a certain quantity of diatomite was placed in NaOH solution, and the mixture was stirred for 2 h at 98 °C, and then allowed to cool to ambient temperature. The content of SiO2 in the slag was analyzed after drying at 100 °C for 30 min. The percentage of diatomite was calculated according to:
in which m1 is the mass of SiO2 in the calcined diatomite without NaOH treatment, m2 is the mass of SiO2 in the filtrate residue that was dissolved in NaOH, and M is the mass of the sample before alkali dissolution.
3. Results and Discussion
3.1. Flotation
The flotation results of diatomite and albite as a function of pH using DDA as a collector are shown in Figure 1. The flotation recovery of diatomite increases as the pH is increased from 1.8 to 4, then decreases sharply as the pH is further increased from 4 to 5.5, and then plateaus as the pH is further increased from 5.5 to 11.5. The maximum recovery of diatomite is 42%. The flotation recovery of albite at pH 1.8 is low. After a pH regulator is added, the recovery of albite markedly increases as the pH is increased to 2.5. Minimal further increase in albite recovery occurs as the pH is increased from 3.5 to 10.5. The albite recovery decreases dramatically when the pH is increased above 10.5. Figure 1 shows that the most efficient separation of albite from diatomite is achieved in the pH range from 5.5 to 10.5.
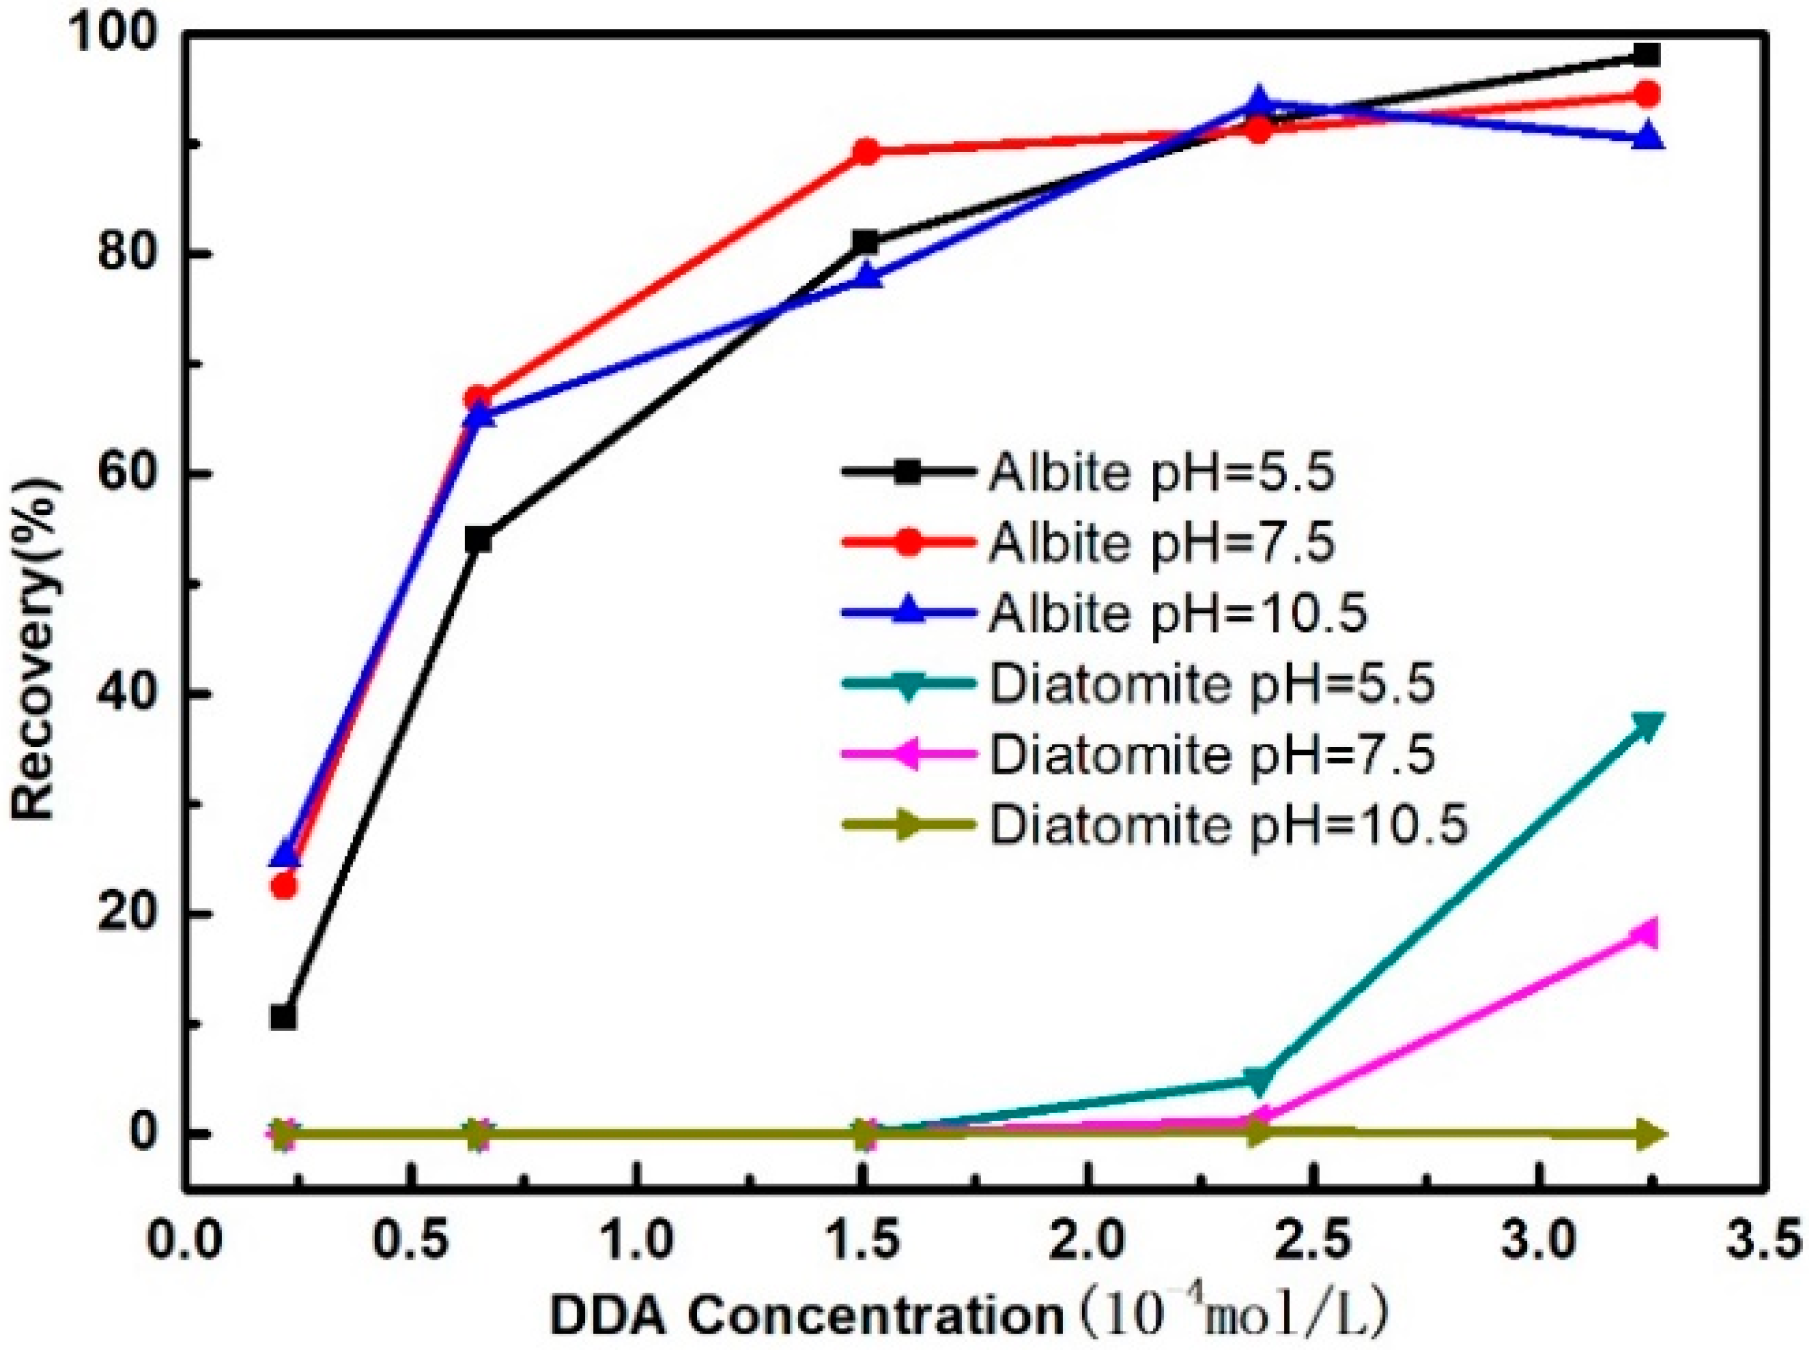
The effect of DDA concentration on the flotability of diatomite and albite at pH 5.5, 7.5, and 10.5 is shown in Figure 2. The recovery of albite significantly increases after adding DDA. This recovery increase continues until the DDA concentration reaches 2.38 × 10⁻⁴ mol/L, after which the recovery of albite changes little. When the DDA concentration is above 1.51 × 10⁻⁴ mol/L, the recovery of diatomite slowly increases with increasing DDA concentration at pH 5.5 and 7.5. The recovery of diatomite at pH 7.5 is lower than that at pH 5.5. DDA addition has minimal influence on the diatomite flotation at pH 10.5. At a DDA concentration of 2.38 × 10⁻⁴ mol/L, the difference in recovery between diatomite and albite ranges from 87% to 94%.
The pure mineral flotation results indicate that DDA has strong collection properties towards albite and weak collection properties towards diatomite. To reduce the albite content in low-grade diatomite, reverse flotation separation experiments of artificially mixed ore (diatomite/albite = 4/1) were conducted using 9.52 × 10⁻⁴ mol/L DDA as a collector at pH 5.5. The mixed ore, flotation concentrates, and tailings were characterized by XRD as shown in Figure 3.
The XRD patterns of the artificially mixed minerals in Figure 3 show that the samples are composed of amorphous and crystalline materials. The amorphous material is diatom and the crystalline material is albite. There is a diffuse peak in the XRD pattern of the flotation concentrate, indicating that is mainly composed of amorphous material. The weaker XRD peak of albite indicates a small amount of albite in the flotation concentrate. The XRD pattern of the flotation tailings shows a strong characteristic peak of albite, indicating that it is the main component of the tailings. A broad peak at 2θ of 20–27° indicates a small amount of diatomite in the tailings. The results of the flotation experiments of the artificially mixed samples show that DDA is an effective collector for separating albite from diatomite.
Diatom is amorphous so exhibits a broad diffuse XRD pattern. Thus, the content of diatom cannot be calculated directly by XRD. To quantify the diatom content, the high temperature alkali solution was used to analyze the concentrate. The content of diatom in the concentrate was about 93%. This demonstrates that reverse flotation can be used to separate diatomite and albite with a DDA collector at pH 5.5.
3.2. Mechanism Analyses
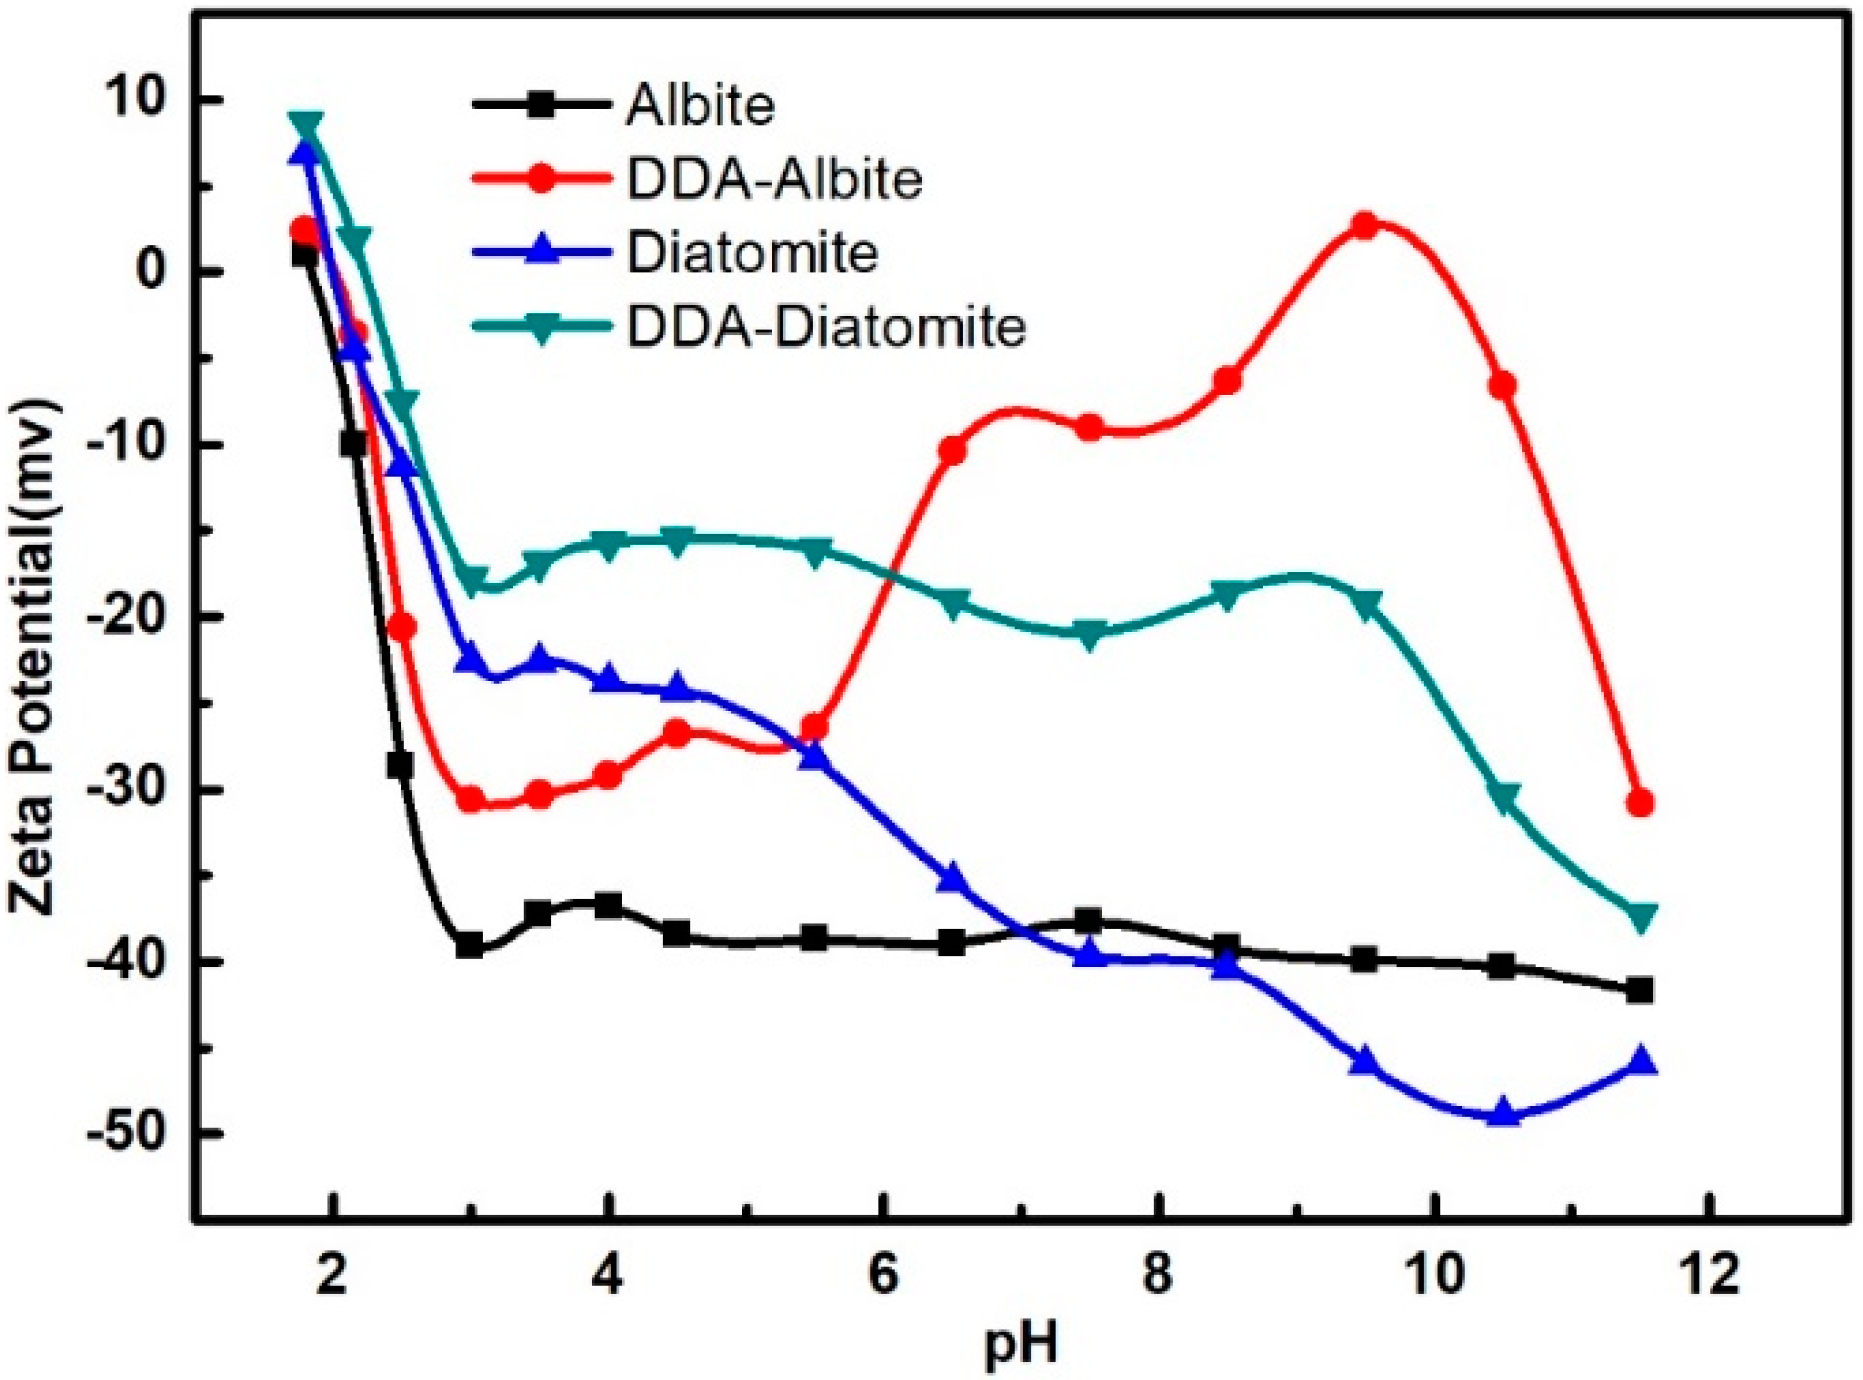
Zeta potential tests of diatomite and albite were measured at different pH values, as shown in Figure 4. The isoelectric point (IEP) of diatomite and albite occur at pH 2.0 and 1.8, respectively. The surface of diatomite and albite are negatively charged when the pH is above the IEP. At pH 4.5 to 10.5, the zeta potential of diatomite becomes progressively more negative with increasing pH, whereas minimal change occurs in the zeta potential of albite.
When DDA is introduced into the pulp in the pH range of 1.8 to 10.5, RNH3+ of DDA may be electrostatically attracted to the diatomite and albite surfaces, thereby increasing the zeta potentials of diatomite and albite [27]. However, Figure 4 shows that the zeta potential of albite increases more than that of diatomite. At pH higher than 4.2, DDA molecules begin to form. Under these conditions, the dimer in solution has higher activity than the monomer. The dimer can readily adsorb to the surface of albite, so the Zeta potential increases significantly with increasing pH [28]. However, the adsorption of DDA on diatomite is relatively weak. It is speculated that the adsorption of DDA on the two minerals differs because of their different surface structures. DDA mainly exists in the form of a neutral molecule at pH higher than 10.5 (Figure 5). Thus, no electrostatic forces exist between DDA molecules and the diatomite or albite surfaces [29]. This results in the rapidly decreasing zeta potentials of DDA-diatomite and DDA-albite with increasing pH above 10.5. The zeta potentials show that the intensity of interaction between diatomite and DDA is lower than that between albite and DDA, which explains why the recovery of diatomite is lower than that of albite.
FTIR spectra of diatomite and albite treated with 2.38 × 10⁻⁴ mol/L DDA at pH 5.5 are shown in Figure 6. The bands at 2919 cm−1 and 2852 cm−1 are characteristic of the stretching vibrations of -CH2- and -CH3 in diatomite, respectively. The corresponding bands in the albite spectrum occur at 2918 cm−1 and 2852 cm−1, respectively. The bands of the -NH2 flexural vibration are observed at 1628 cm−1, 1518 cm−1 and 1471 cm−1 in the spectrum of diatomite. The corresponding bands in the spectrum of albite occur at 1599 cm−1, 1520 cm−1 and 1506 cm−1, respectively. When DDA is adsorbed, the intensities of the -CH2- and -CH3 stretching vibrations of albite increase more sharply than those of diatomite. The adsorption of DDA on the surface of diatomite is weaker than that on albite, because of the higher number of active sites on the albite surface. Thus, the FTIR bands of the -CH2- and -CH3 stretching vibrations differ on the two mineral surfaces [30]. Figure 6 shows that the adsorption of DDA on albite and diatomite differ significantly at pH 5.5.
The zeta potential and FTIR spectroscopy results indicate that the amount of DDA adsorbed on the surface of diatomite is less than that adsorbed on the surface of albite. The pore structure of diatomite is formed by defects, so abundant bonding sites exist on the edges of pores on the surface. It is speculated that DDA preferentially adsorbs at bonding sites on the edges of the pores, and that DDA does not readily adsorb on the diatomite surface at pore edges. In contrast, albite has more active sites that can adsorb a large amount of DDA, thus endowing it with good flotation behavior. AFM was used to characterize the adsorbed state of DDA on the surfaces of diatomite and albite.
Figure 7 shows 2D and 3D AFM images of the morphology of the fractured albite surface. The images show that the fracture surface of albite is relatively flat, and that no impurities or other reagents exist.
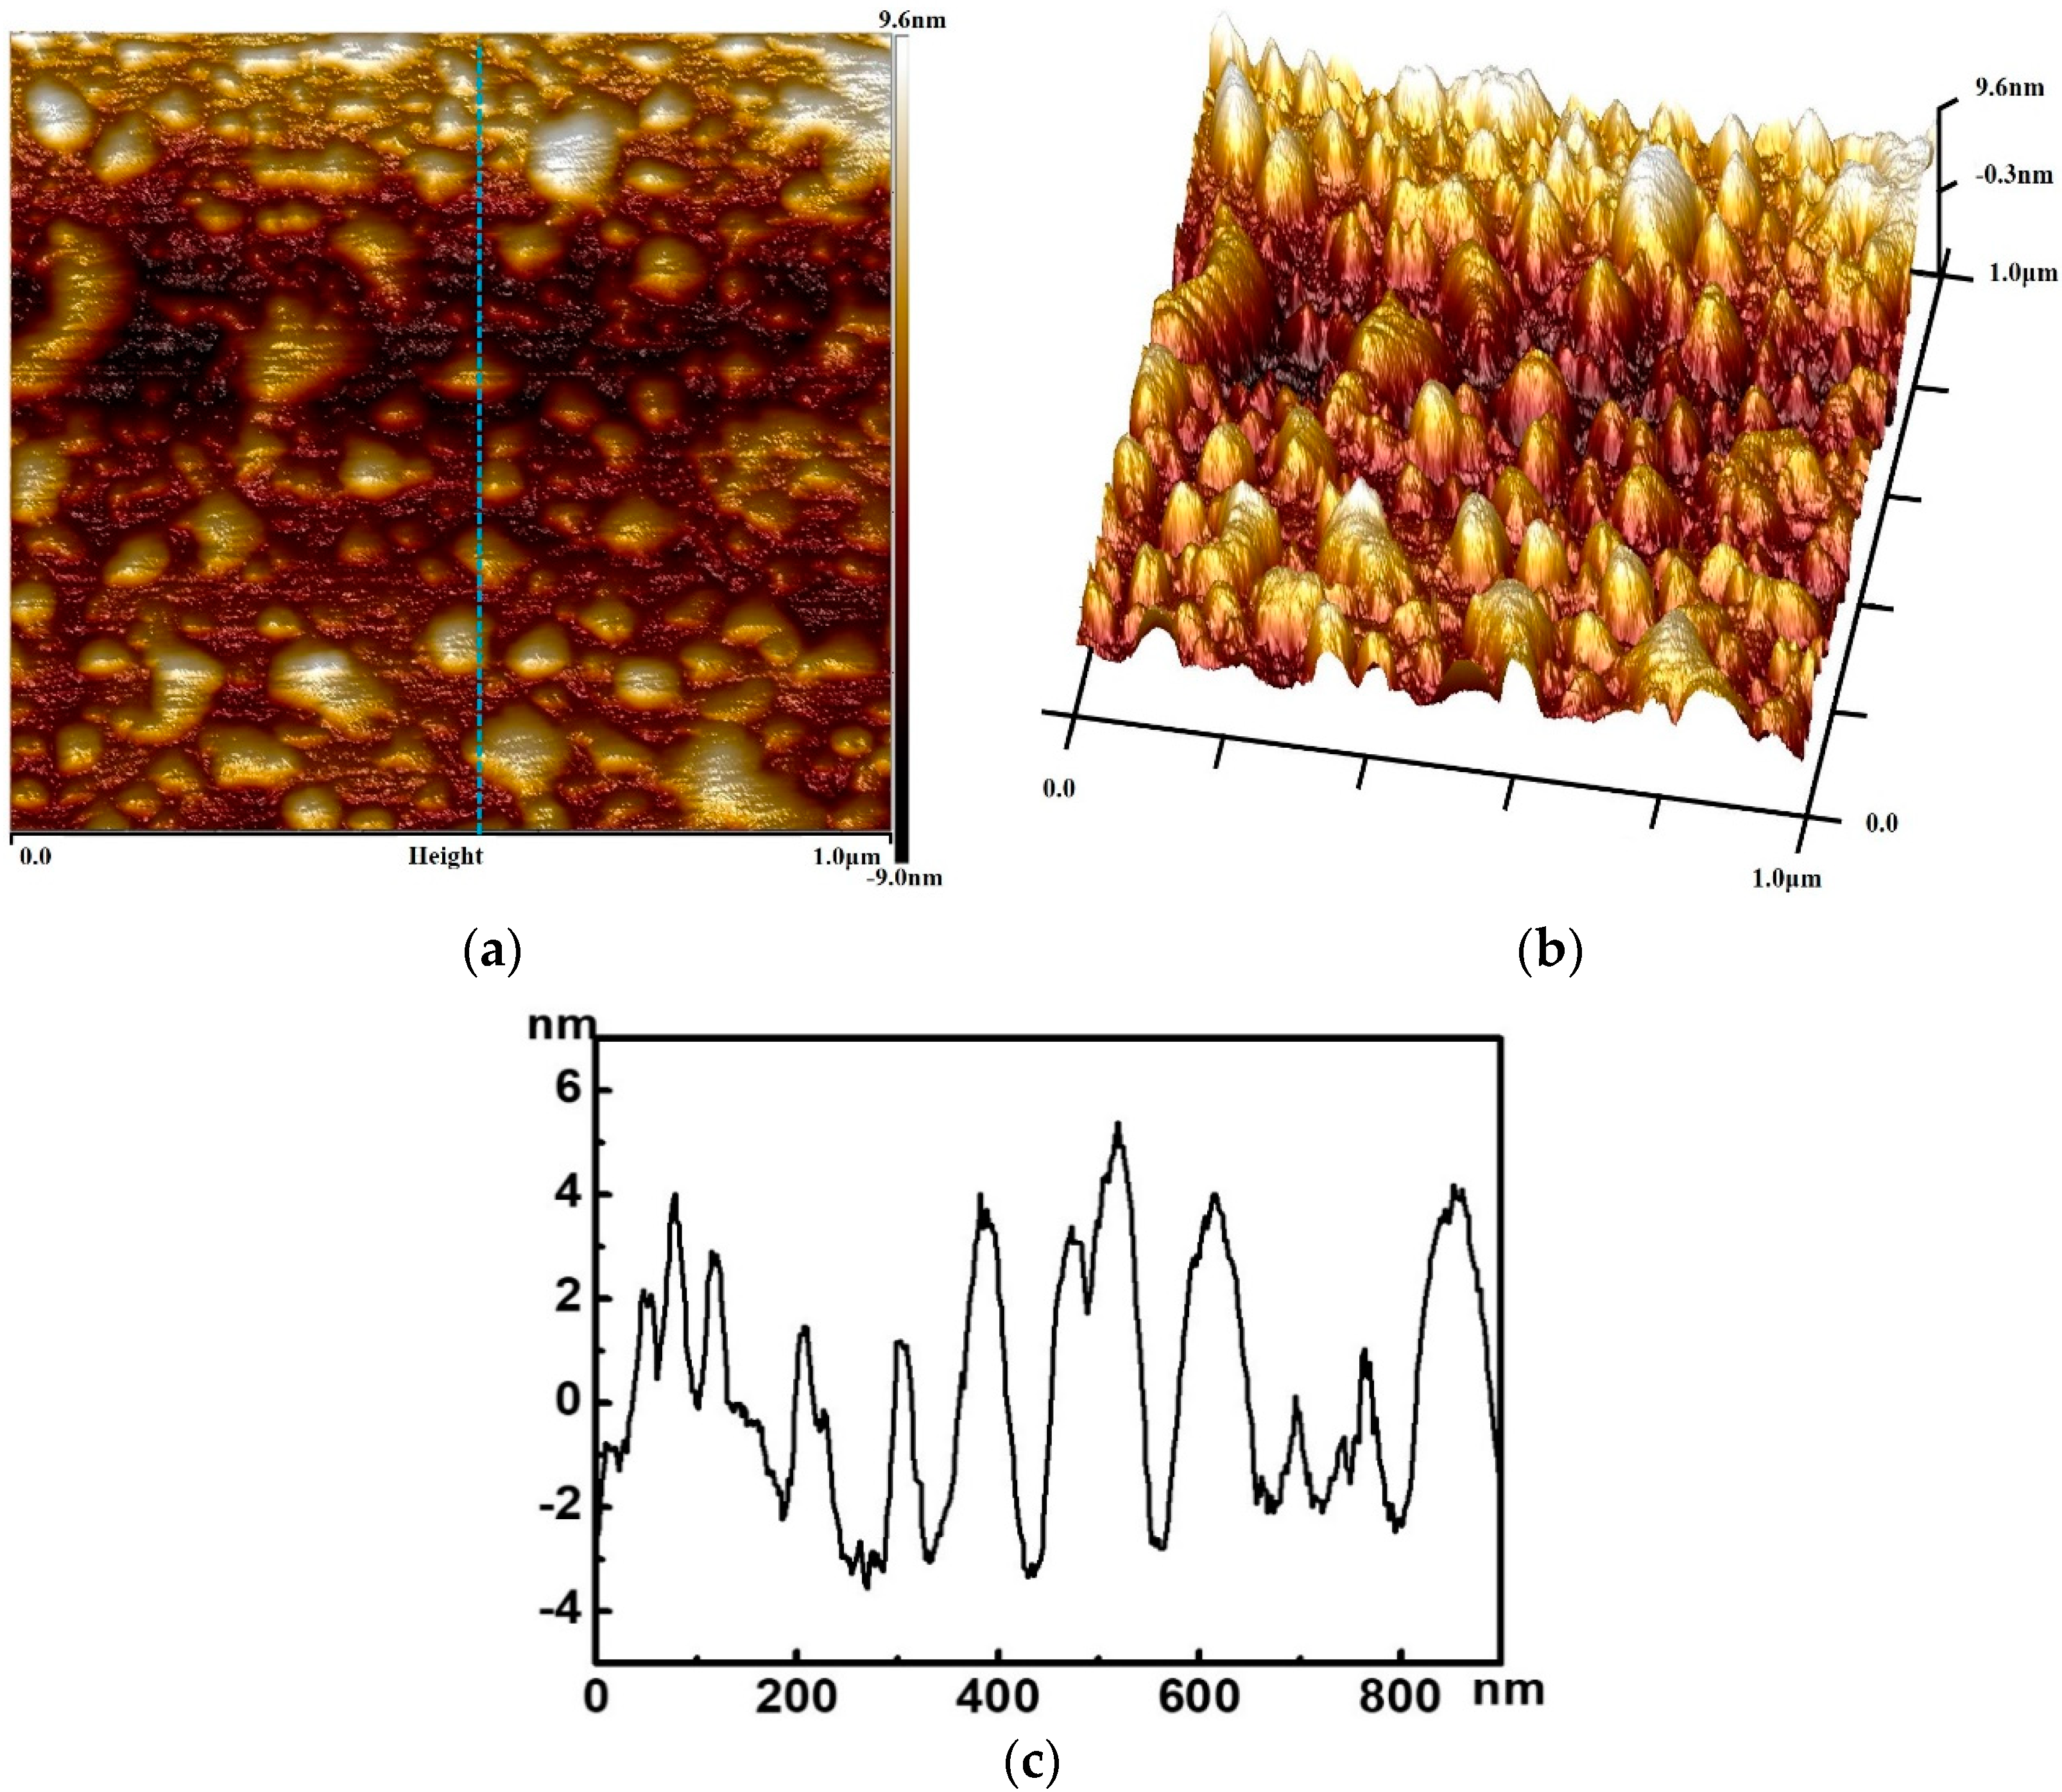
AFM images of albite treated with 2.38 × 10⁻⁴ mol/L DDA at pH 5.5 are shown in Figure 8. A large amount of DDA is adsorbed on the surface of albite, mostly by agglomeration. This is due to the dissolution of sodium ions from albite into solution, generating a large number of positive holes on the surface, to which DDA adsorbs well [31]. Figure 8c indicates that the thickness of the adsorbed DDA layer on the albite surface is 2–4 nm. The length of the DDA molecule is about 1.78 nm. It can thus be inferred that DDA exists as both a bilayer and monolayer on the albite surface.
2D and 3D AFM images of diatomite are shown in Figure 9a,b, respectively. There are many pores on the surface of diatom. The edges of the diatom pores are smooth, and no impurities are observed on the surface.
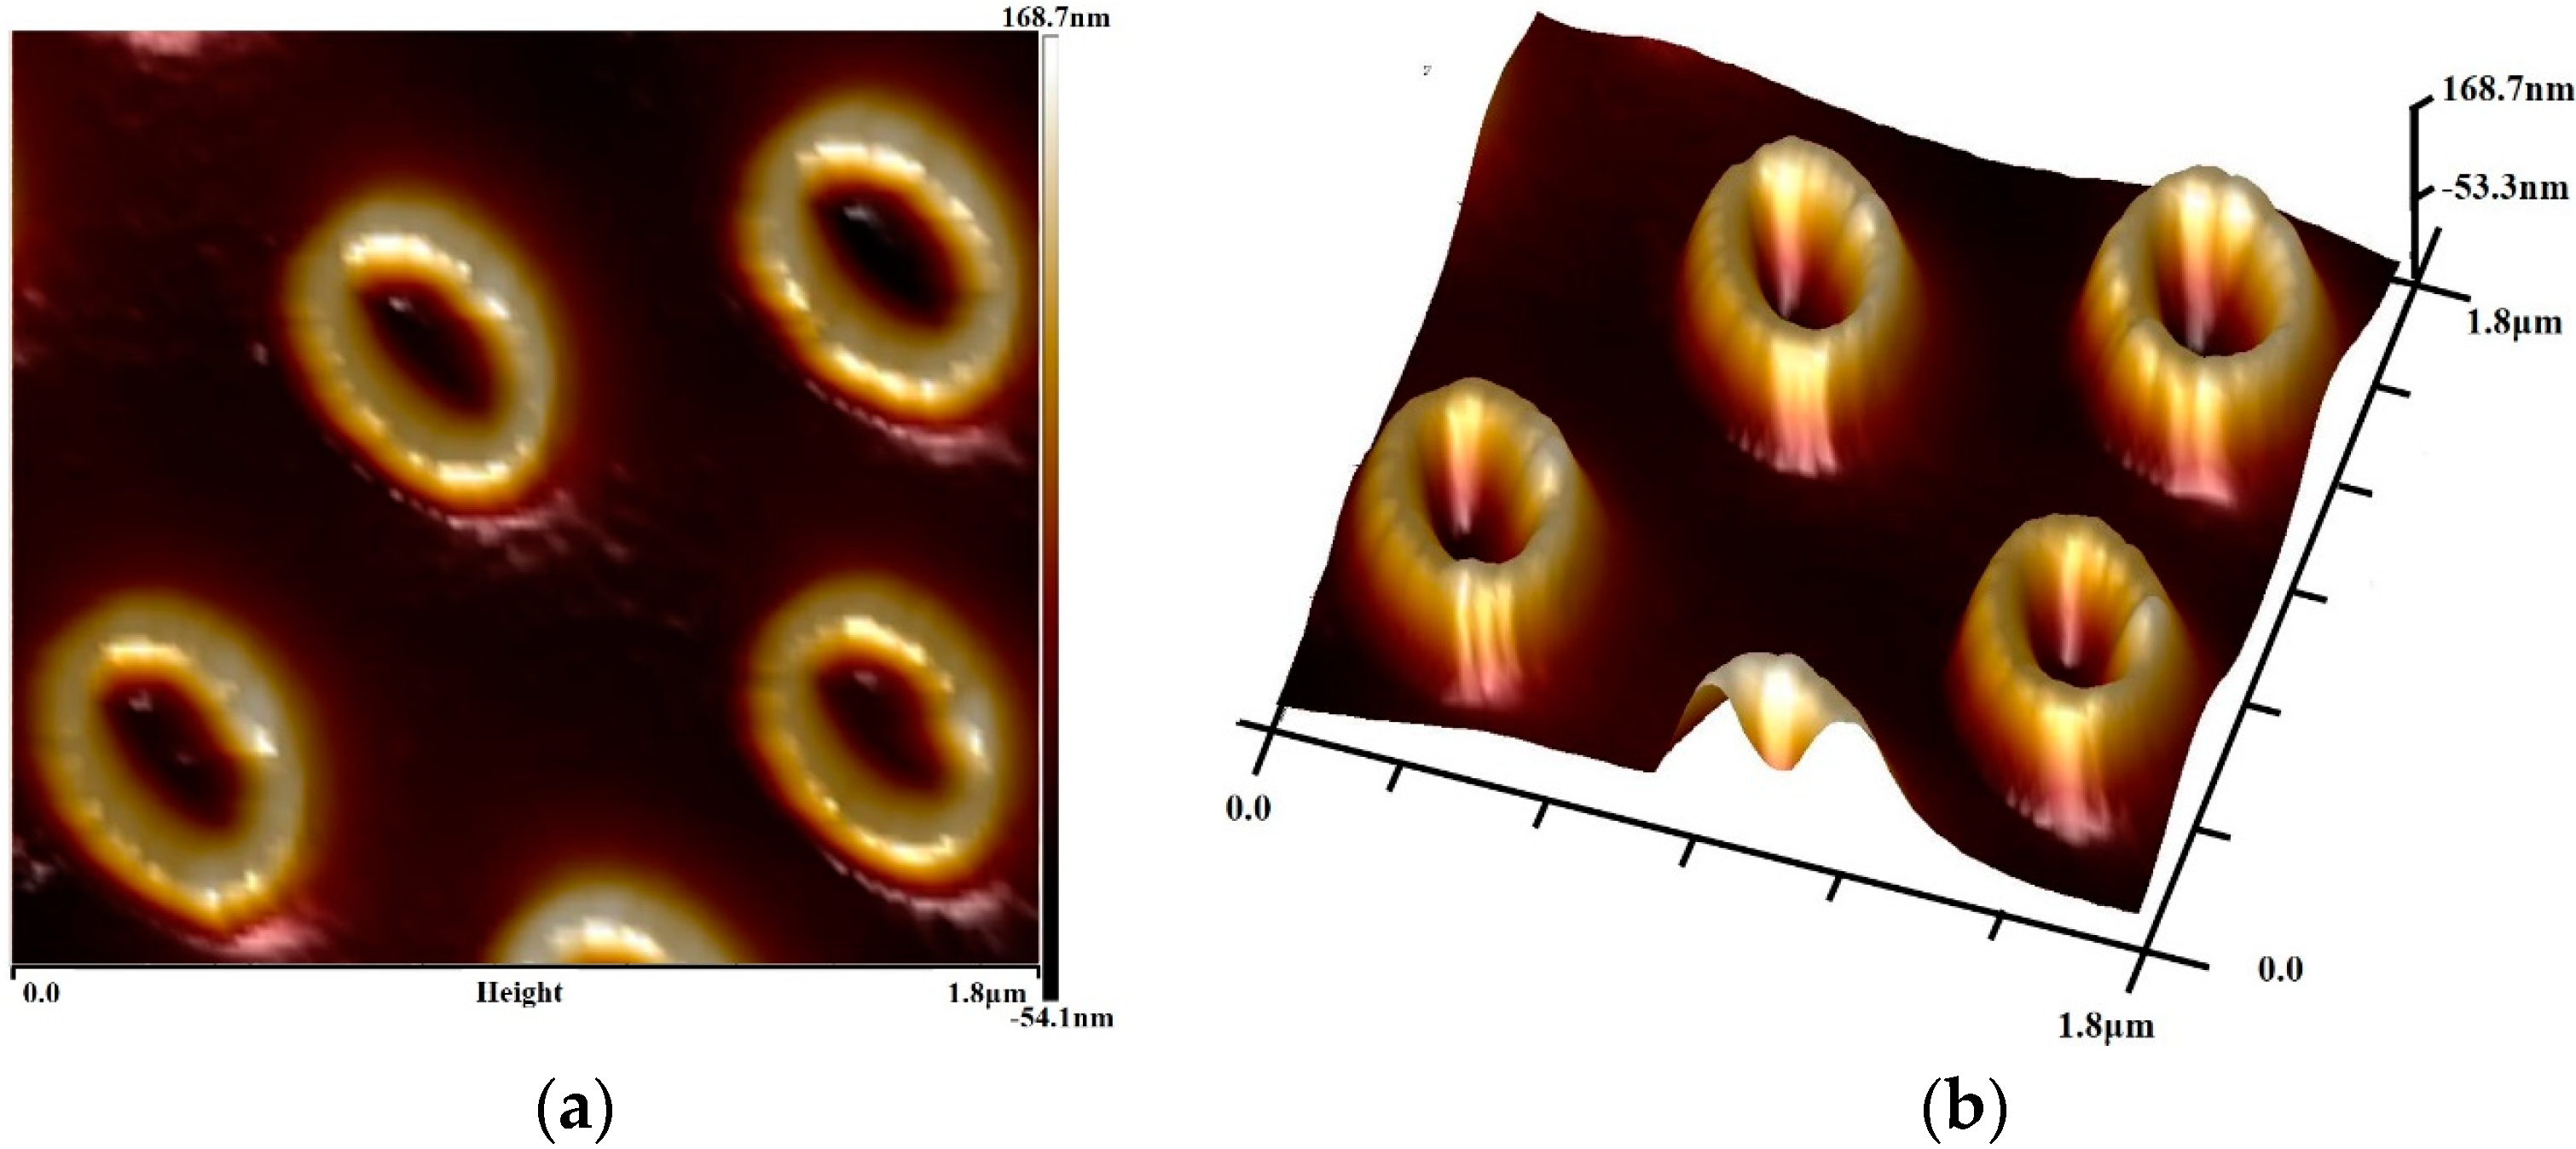
AFM was also used to characterize diatomite treated with 2.38 × 10⁻⁴ mol/L DDA at pH 5.5. Figure 10a,b shows that DDA is adsorbed on the edges of diatomite pores, and is not observed on the other surfaces of diatomite. Diatomite is known to contain many hydroxyl groups on the edges of diatom pores, thus providing a large number of active sites [31]. DDA therefore adsorbs well to the pore edges. Figure 10c shows that the adsorbed DDA layer on the pore edges is non-uniform, and far thicker than the length of the DDA molecule. Therefore, the adsorption of DDA on the edges of the diatomite pores is considered to be multi-layer adsorption.
The AFM images of albite and diatomite indicate that DDA only adsorbs on the edges of pores on the diatomite surface, while the surface of albite adsorbs a large amount of DDA. This is consistent with predictions. The results show that the adsorption capacity of DDA on per unit area of diatomite is less than that on albite. This results in the flotability of diatomite being inferior to that of albite.
4. Conclusions
This study investigated the different flotation performances of albite and diatomite using DDA as a collector. The adsorption and morphology of DDA on the albite and diatomite surfaces were also investigated. The results show different flotation recoveries in the pulp at pH 5.5 to 10.5, and that the flotability difference between albite and diatomite is more than 87%. The recovery of albite increases with increasing DDA dosage at pH 5.5 to 10.5. In the same pH range, diatomite exhibits weaker flotability than albite, particularly in alkaline pulp. Zeta potential measurements and FTIR spectra indicate that the adsorption of DDA on diatomite is weaker than that on albite. AFM images show that DDA adsorbs on the whole surface of albite, but only of the edges of diatomite pores. This results in diatomite and albite exhibiting differing flotabilities.
Author Contributions
Conceptualization, Y.H.; Data curation, Y.G. and Y.H.; Investigation, Y.G.; Software, Y.G.; Writing-original draft, Y.G.; Writing-review & editing, Y.G., Y.H. and W.L.
Funding
This creative research work was supported by the National Natural Science Foundation of China (Grant No. 51604064), the Fundamental Research Funds for the Central Universities (Grant No. 150103003) and the Doctoral Scientific Research Foundation of Liaoning Province (201601027), for which the authors express their appreciation.
Conflicts of Interest
The authors declare no conflict of interest.
References
- AI, X.S.; He, M.Z.; Han, Y.X. Study on purifying Chifeng diatomite. Non-Ferrous Min. Metall. 2002, 18, 14–16, 20. [Google Scholar]
- Yılmaz, B.; Ediz, N. The use of raw and calcined diatomite in cement production. Cem. Concr. Compos. 2008, 30, 202–211. [Google Scholar] [CrossRef]
- Jiang, Y.Z.; Jia, S.Y. Exploitation application existing conditions and evolution of diatomite. Non-Ferrous Min. Metall. 2011, 27, 31–37. [Google Scholar]
- De Namor, A.F.; El Gamouz, A.; Frangie, S.; Martinez, V.; Valiente, L.; Webb, O.A. Turning the volume down on heavy metalsusing tuned diatomite. A review of diatomite and modified diatomite for theextraction of heavy metals from water. J. Hazard. Mater. 2012, 241, 14–31. [Google Scholar] [CrossRef] [PubMed]
- Dantas, T.N.D.; Neto, A.A.D.; Moura, M.C.P. Removal of chromium from aqueoussolutions by diatomite treated with microemulsion. Water Res. 2001, 3, 2219–2224. [Google Scholar] [CrossRef]
- Petra, H.; Karl, E.R.; Kurt, C. Sorption of Nonpolar aromatic contain in ants by chlorosilane surface modified natural minerals. Environ. Sci. Technol. 2001, 35, 4260–4264. [Google Scholar]
- Zhao, H.S.; He, W.; Luo, S.Q.; Jia, X.T.; Feng, Y.J.; Li, Z.M. Progress in studies and applications of diatomite. J. Shandong Inst. Light Ind. 2007, 21, 80–82. [Google Scholar]
- Zhang, F.J. The Processing and Application of Diatomite; Chemical Industry Press: Beijing, China, 2006. [Google Scholar]
- Lu, H. Diatomite resource and its situation of development and utilization. Geol. Zhejiang 2001, 17, 52–59. [Google Scholar]
- Ediz, N.; Bentli, İ.; Tatar, İ. Improvement in filtration characteristics of diatomite by calcinations. Int. J. Miner. Process. 2010, 94, 129–134. [Google Scholar] [CrossRef]
- Şan, O.; Gören, R.; Özgür, C. Purification of diatomite powder by acid leaching for use in fabrication of porous ceramics. Int. J. Miner. Process. 2009, 93, 6–10. [Google Scholar] [CrossRef]
- Şan, O.; İmaretli, A. Preparation and filtration testing of diatomite filtering layer by acid leaching. Ceram. Int. 2011, 37, 73–78. [Google Scholar] [CrossRef]
- Goren, R.; Baykara, T.; Marsoglu, M. A study on the purification of diatomite in hydrochloric acid. Scand. J. Metall. 2002, 31, 115–119. [Google Scholar] [CrossRef]
- Sun, Z.M.; Yang, X.P.; Zhang, G.X.; Zheng, S.; Frost, R.L. A novel method for purification of low grade diatomite powders in centrifugal fields. Int. J. Miner. Process. 2013, 125, 18–26. [Google Scholar] [CrossRef] [Green Version]
- Zhang, G.; Cai, D.; Wang, M. Microstructural modification of diatomite by acid treatment, high-speed shear, and ultrasound. Microporous Mesoporous Mater. 2013, 165, 106–112. [Google Scholar] [CrossRef]
- Goren, R.; Baykara, T.; Marsoglu, M. Effects of purification and heat treatment on pore structure and composition of diatomite. Br. Ceram. Trans. 2002, 101, 177–180. [Google Scholar] [CrossRef]
- Sun, Z.M.; Bai, C.H.; Zheng, S.L.; Yang, X.; Frost, R.L. A comparative study of different porous amorphous silica minerals supported TiO2 catalysts. Appl. Catal. A Gen. 2013, 458, 103–110. [Google Scholar] [CrossRef] [Green Version]
- Yuan, P.; Yang, D.; Lin, Z.Y.; He, H.; Wen, X.; Wang, L.; Deng, F. Influences of pretreatment on the surface silylation of diatomaceous amorphous silica with trimethylchlorosilane. J. Non-Cryst. Solids 2006, 352, 3762–3771. [Google Scholar] [CrossRef]
- Ibrahim, S.S.; Selim, A.Q. Producing a micro-porous diatomite by a simple classification-calcination process. J. Ore Dress. 2010, 2, 25–33. [Google Scholar]
- Ibrahim, S.S.; Selim, A.Q. Heat treatment of natural diatomite. Phys. Chem. Probl. Miner. Process. 2012, 48, 413–424. [Google Scholar]
- Kunwadee, R.; Aphiruk, C. Thermal an acid treatment on natural raw diatomite influencing in synthesis of sodium zeolite. Porous Mater. 2007, 2, 98–106. [Google Scholar]
- Shi, D.M.; Zhang, Z.H. Study on purification of diatomite in Yunnan Xundian. Non-Metall. Mines 1993, 1, 7–10, 63. [Google Scholar]
- Kou, J.; Tao, D.; Xu, G. Fatty acid collectors for phosphate flotation and their adsorption behavior using QCM-D. Int. J. Miner. Process. 2010, 95, 1–9. [Google Scholar] [CrossRef]
- Zhang, W.C.; Honaker, R. Studies on carbon flotation from fly ash. Fuel Process. Technol. 2015, 139, 236–241. [Google Scholar] [CrossRef]
- Xing, Y.; Gui, X.; Pan, L.; Pinchasik, B.E.; Cao, Y.; Liu, J.; Kappl, M.; Butt, H.J. Recent experimental advances for understanding bubble-particle attachment in flotation. Adv. Colloid Interface Sci. 2017, 246, 105–132. [Google Scholar] [CrossRef] [PubMed]
- Xing, Y.; Xu, M.; Gui, X.; Cao, Y.; Babel, B.; Rudolph, M.; Weber, S.; Kappl, M.; Butt, H.J. The application of atomic force microscopy in mineral flotation. Adv. Colloid Interface Sci. 2018, 256, 373–392. [Google Scholar] [CrossRef] [PubMed]
- Vidyadhar, A.; Hanumantha Rao, K.; Forssberg, K.S. Adsorption of N-tallow 1,3-propanediamine–dioleate collector on albite and quartz minerals, and selective flotation of albite from greek stefania feldspar ore. J. Colloid Interface Sci. 2002, 248, 19–29. [Google Scholar] [CrossRef] [PubMed]
- Liu, Y.C.; Gong, H.G. Adsorption mechanism of dodecyl amine-hydrochloride on feldspar and quartz and effect of pH. China Min. Mag. 1992, 2, 89–93. [Google Scholar]
- Liu, C.M.; Hu, Y.H.; Feng, A.S.; Guo, Z.; Cao, X. The behavior of N, N-dipropyl dodecyl amine as a collector in the flotation of kaolinite and diaspora. Miner. Eng. 2011, 24, 737–740. [Google Scholar] [CrossRef]
- Zhang, Z.; Feng, Q.M.; Wang, W.Q. Adsorption of Dodecyl Amine and Sodium Dodecyl Sulfonate on Feldspar and Quartz. Non-Metall. Mines 2012, 35, 8–15. [Google Scholar]
- Zhang, W.C.; Honaker, R. Surface charge of rare earth phosphate (monazite) in aqueous solutions. Powder Technol. 2017, 318, 263–271. [Google Scholar] [CrossRef]
Figure 1.
Recovery of diatomite and albite as a function of pH using 2.38 × 10⁻⁴ mol/L DDA.

Figure 2.
Flotation recovery as a function of DDA collector concentration at varying pH.

Figure 3.
XRD patterns of the mixed ore, flotation concentrate, and tailings.

Figure 4.
Zeta potentials of diatomite and albite.

Figure 5.
Logarithmic concentration diagram of DDA solution components.

Figure 6.
FTIR spectra of untreated diatomite and albite, and FTIR spectra of diatomite and albite treated with 2.38 × 10⁻⁴ mol/L DDA at pH 5.5.
Figure 6.
FTIR spectra of untreated diatomite and albite, and FTIR spectra of diatomite and albite treated with 2.38 × 10⁻⁴ mol/L DDA at pH 5.5.

Figure 7.
AFM (a) 2D and (b) 3D images of untreated albite.

Figure 8.
AFM (a) 2D and (b) 3D images of albite treated with 2.38 × 10⁻⁴ mol/L DDA at pH 5.5, and (c) thickness of adsorbed DDA layer on the surface of albite.
Figure 8.
AFM (a) 2D and (b) 3D images of albite treated with 2.38 × 10⁻⁴ mol/L DDA at pH 5.5, and (c) thickness of adsorbed DDA layer on the surface of albite.

Figure 9.
AFM (a) 2D and (b) 3D images of untreated diatomite.

Figure 10.
AFM (a) 2D and (b) 3D images of diatomite and albite treated with 2.38 × 10⁻⁴ mol/L DDA at pH 5.5, and (c) thickness of adsorbed DDA layer on the surface of diatomite.
Figure 10.
AFM (a) 2D and (b) 3D images of diatomite and albite treated with 2.38 × 10⁻⁴ mol/L DDA at pH 5.5, and (c) thickness of adsorbed DDA layer on the surface of diatomite.

© 2018 by the authors. Licensee MDPI, Basel, Switzerland. This article is an open access article distributed under the terms and conditions of the Creative Commons Attribution (CC BY) license (http://creativecommons.org/licenses/by/4.0/).
Share and Cite
MDPI and ACS Style
Gao, Y.; Han, Y.; Li, W. Flotation Behavior of Diatomite and Albite Using Dodecylamine as a Collector. Minerals 2018, 8, 371. https://doi.org/10.3390/min8090371
AMA Style
Gao Y, Han Y, Li W. Flotation Behavior of Diatomite and Albite Using Dodecylamine as a Collector. Minerals. 2018; 8(9):371. https://doi.org/10.3390/min8090371
Chicago/Turabian StyleGao, Ying, Yuexin Han, and Wenbo Li. 2018. "Flotation Behavior of Diatomite and Albite Using Dodecylamine as a Collector" Minerals 8, no. 9: 371. https://doi.org/10.3390/min8090371
Note that from the first issue of 2016, this journal uses article numbers instead of page numbers. See further details here.