Cathodoluminescence (CL) Characteristics of Quartz from Different Metamorphic Rocks within the Kaoko Belt (Namibia)

Institute of Mineralogy, TU Bergakademie Freiberg, Brennhausgasse 14, 09599 Freiberg, Germany
*
Author to whom correspondence should be addressed.
Minerals 2018, 8(5), 190; https://doi.org/10.3390/min8050190
Submission received: 11 November 2017
/
Revised: 24 March 2018
/
Accepted: 28 March 2018
/
Published: 1 May 2018
(This article belongs to the Special Issue Mineralogy of Quartz and Silica Minerals)
Abstract
:Quartz of metamorphic rocks from the Kaoko belt (Namibia) representing metamorphic zones from greenshist to granulite facies were investigated by cathodoluminescence (CL) microscopy and spectroscopy to characterize their CL properties. The samples cover P-T conditions from the garnet zone (500 ± 30 °C, 9 ± 1 kbar) up to the garnet-cordierite-sillimanite-K-feldspar zone (750 ± 30 °C, 4.0–5.5 kbar). Quartz from 10 different localities and metamorphic environments exclusively exhibits blue CL. The observed CL colors and spectra seem to be more or less independent of the metamorphic grade of the host rocks, but are determined by the regional geological conditions. Quartz from different localities of the garnet-cordierite-sillimanite-K-feldspar zone shows a dominant 450 nm emission band similar to quartz from igneous rocks, which might be related to recrystallization processes. In contrast, quartz from different metamorphic zones in the western part of the central Kaoko zone (garnet, staurolite, kyanite, and kyanite-sillimanite-muscovite zone) is characterized by a heterogeneous blue-green CL and a dominant 500 nm emission band that strongly decreases in intensity under electron irradiation. Such CL characteristics are typical for quartz of pegmatitic and/or hydrothermal origin and indicate the participation of fluids during neoformation of quartz during metamorphism.
1. Introduction
Quartz (trigonal alpha-quartz) is one of the most important constituents of the Earth’s crust and the most frequent silica mineral. It occurs in magmatic, metamorphic, and sedimentary rocks and thus its properties are used as an indicator for specific conditions of formation and for the reconstruction of geological processes [1,2]. In particular, cathodoluminescence (CL) properties are useful, since numerous studies of the luminescence behavior of quartz have shown highly variable characteristics depending on the specific P,T,X conditions during quartz formation [3,4,5].
Investigations of natural and synthetic quartz specimens showed various luminescence emission bands, which cause the visible luminescence colors under the electron beam [6,7,8,9,10,11]. The visible CL of natural quartz mainly consists of two broad emission bands centered at ~450 nm (blue emission) and 620–650 nm (red emission). The blue band is usually very broad and consists of up to four overlapping component bands centered at 390, 420, 450, and 500 nm [12]. The most frequent 450 nm emission is due to the recombination of self-trapped excitons, which involves an irradiation-induced oxygen Frenkel pair consisting of an oxygen vacancy and a peroxy linkage (≡Si–O–O–Si≡) [6]. The orange to red emission band at about 620–650 nm has been detected in almost all synthetic and natural quartz types. This emission is attributed to the recombination of electrons in the non-bridging oxygen band-gap state with holes in the valence band [13].
Zinkernagel [3] established one of the first classification schemes of quartz based on its CL colors, which he used for the provenance analysis of detrital quartz in sandstones. Over the past decades a considerable number of such methodological provenance studies have been published based both on CL colors and the spectral characteristics of quartz [13,14,15,16,17,18,19,20,21]. The recent state of a general classification of quartz from different environments based on investigations of a wide spectrum of quartz-bearing rocks showed that quartz of igneous, volcanic, hydrothermal, pegmatitic, and sedimentary origin can mostly be recognized due to their specific CL colors, spectra, and textures, e.g., [4,14,16,17,21,22]. In contrast, the knowledge about the CL of metamorphic quartz, in particular the development and possible transformation of CL characteristics during ongoing metamorphic processes, is still incomplete.
Zinkernagel [3] distinguished brown luminescent quartz (major peak around 620 nm and minor peak near 450 nm) of low-grade metamorphic rocks or slowly cooled high-grade metamorphic rocks from violet or blue luminescent quartz (major peaks at 450 and 620 nm) of high-grade metamorphic rocks, which have undergone relatively fast cooling. Similar observations were made by Sprunt et al. [23], who found a relationship between CL color of quartz and metamorphic grade of naturally deformed quartzite. The originally different CL colors in the undeformed parent rock material change toward a uniform brownish-red color through high-grade levels of metamorphism. Owen [24] suggested that quartz CL turns to a uniform reddish-brown color above the garnet zone during high-grade metamorphism. Augustsson and Reker [21] indicated that the change from quartz with brown/dark blue CL to brighter blue CL takes place at ca. 500–600 °C in amphibolite facies. So, metamorphic quartz that recrystallizes at high temperatures (e.g., granulite) reverts to a blue CL color comparable to that of plutonic quartz [4,5,21]. In addition, diffusion during metamorphic processes as well as fluid-controlled recovery seems to influence the CL characteristics of quartz in high-grade metamorphic rocks. For instance, heterogeneous internal textures in quartz and a correlation of the blue CL with the Ti content have been observed [25,26].
The literature data show that CL of quartz in metamorphic rocks is relatively complex and not all factors influencing the CL behaviour are known. The present study aimed to enhance knowledge about the CL characteristics of quartz in different metamorphic rocks and possible variations’ dependence on the metamorphic conditions. The precondition for the detection of changes in CL properties of metamorphic quartz is the systematic investigation of a metamorphic profile covering distinct metamorphic grades in a defined geological frame. Therefore, the study was based on samples from a profile along the Gomatum and Hoarusib valleys within the Kaoko belt (Namibia), made up of rocks of greenshist to granulite facies. The mineralogical composition and thermobarometric development of these rocks are well known [27], so the CL data can be discussed in the established petrogenetic context. Combined analyses by polarizing microscopy and CL microscopy and spectroscopy provided new data concerning the CL characteristics of quartz in different grades of metamorphic rocks and revealed possible changes in the development of the CL properties through ongoing metamorphism.
2. Geological Background and Sample Material
The Kaoko belt is located in northwestern Namibia and represents a Neoproterozoic orogen, which was generated during the Pan-African-Brasiliano orogenic cycle in West Gondwana [28]. Simultaneously to this orogenesis, a collision between the Kongo, Kalahari, Rio-de-la-Plata, and São-Francisco cratons took place, forming these belt systems with the Kaoko, Damara and Gariep belt on the African side and the Dom Feliciano and Ribeira belts on the South American side [29].
The Kaoko belt has been subdivided by Miller [30] into three tectono-stratigraphic zones, Eastern, Central and Western. The NNW to SSE trending Sesfontein-Thrust and the NNW to SSE trending Puros Mylonite Zone represent the boundaries between these tectono-stratigraphic zones (Figure 1). The Eastern Kaoko Zone is characterized by low-grade metamorphic to unmetamorphosed sedimentary and carbonate rocks of the Otavi and Mulden groups. The Central Kaoko Zone includes Archean to Palaeoproterozoic orthogneiss and metasedimentary rocks. The metamorphic grade in the Central Zone increases from greenschist facies in the east to amphibolite facies in the west [27]. Mesoproterozoic migmatite and Palaeoproterozoic gneiss are dominant in the eastern part of the Western Kaoko Zone, whereas the western part is mostly composed of Neoproterozoic Pan-African granitoid and metagranitoid [31]. The metamorphic grade of the Western Kaoko Zone is characterized by a high-temperature/low-pressure Buchan-type metamorphism [27].
The selected samples are mainly gneiss and mica schist of 500–750 °C metamorphic temperatures from a profile along the Gomatum and the Hoarusib valleys in the Central and Western Kaoko Zone (Figure 1). Different metamorphic zones with specific mineral associations can be described along this profile with increasing temperatures from east to west (Figure 2):
- Garnet zone: 500 ± 30 °C, 9 ± 1 kbar
- Staurolite zone: 580 ± 30 °C, 7–8 kbar
- Kyanite zone: 590 ± 30 °C, 6.5–8 kbar
- Kyanite-sillimanite-muscovite zone (ky-sill-mu zone): 650 ± 20 °C, 9 ± 1.5 kbar
- Sillimanite-K-feldspar zone (sill-ksp zone): 690 ± 40 °C, 4.5 ± 1 kbar
- Garnet-cordierite-sillimanite-K-feldspar zone (grt-cd-sill-ksp zone): 750 ± 30 °C, 4.0–5.5 kbar
The garnet, staurolite, kyanite, and kyanite-sillimanite-muscovite zones are located in the Central Kaoko Zone along the Gomatum Valley (Table 1, Figure 2). The samples from these metamorphic zones are mostly composed of biotite, muscovite, plagioclase, quartz, and some characteristic minerals from those specific zones such as garnet, staurolite, kyanite, and sillimanite.
3. Analytical Methods
Polished thin sections were prepared for microscopic and cathodoluminescence (CL) investigations from all samples listed in Table 1. Polarizing microscopy was carried out using a Zeiss Axio Imager A1m (ZEISS Microscopy, Jena, Germany) to document the mineral composition and micro-texture of the different rock types. Micrographs were obtained with a digital camera (MRc5) coupled with Axiovision software (ZEISS Microscopy, Jena, Germany).
CL microscopy and spectroscopy were performed on carbon-coated thin sections using a hot-cathode CL microscope HC1-LM (LUMIC, Bochum, Germany) [33]. The system was operated at 14 kV and 0.2 mA (current density ca. 10 µA/mm2) with a defocused electron beam. Luminescence images were captured during CL operations using a peltier cooled digital video-camera (OLYMPUS DP72, OLYMPUS Deutschland GmbH, Hamburg, Germany). CL spectra in the wavelength range 370 to 920 nm were recorded with an Acton Research SP-2356 digital triple-grating spectrograph with a Princeton Spec-10 CCD detector (OLYMPUS Deutschland GmbH, Hamburg, Germany) that was attached to the CL microscope by a silica-glass fiber guide. CL spectra were measured under standardized conditions (wavelength calibration by an Hg-halogen lamp, spot width 30 µm, measuring time 5 s). Irradiation experiments were performed to document the behaviour of the quartz crystals under electron bombardment. Samples were irradiated 5 min under constant conditions (14 kV, 0.2 mA) and spectra were measured initially and after every 1 min. The evaluation of time-dependent spectral CL measurements provided further information about the stable or transient behavior under the electron beam and was indispensable for the identification of luminescence-active defect centres.
4. Results
4.1. Garnet Zone
Sample GK-97-124, from the garnet zone in the eastern Gomatum Valley, is composed of quartz (10 vol % of the groundmass), biotite, muscovite, plagioclase, and distributed idiomorphic garnet porphyroblasts. Quartz is commonly xenomorphic, sometimes arranged in more or less monomineralic layers parallel to the foliation and frequently displays an undulatory extinction (Figure 3a,b). It has weak blue luminescence stable under the electron beam (Figure 3c) and the CL spectrum predominantly shows a weak emission band with a maximum around 450 nm and another band at about 650 nm (Figure 3d).
Sample GK 96-82, also from the garnet zone (in the western Gomatum Valley), which corresponds to the kyanite-sillimanite-muscovite zone (in the western part of the Central Kaoko Zone; Figure 2), is dominantly composed of quartz (40 vol %; Figure 3e), with similar properties to those of quartz described in GK 97-124. This quartz shows an intense short-lived blue-green luminescence, which is often heterogeneously distributed within the quartz crystals (Figure 3f) and decreases under electron irradiation turning into a weak purple CL (Figure 3g,h). The spectrum shows a broad emission band with a maximum around 490 nm and another weak emission band around 620–650 nm (Figure 3f).
4.2. Staurolite Zone
GK 96-67 from the staurolite zone is composed of staurolite and garnet prophyroblasts in a quartz, biotite, plagioclase and muscovite groundmass. Quartz (up to 15 vol % of the rock) also forms layers parallel to the foliation direction and usually shows undulatory extinction. Its properties are similar to that of quartz characterized in GK 96-82, with an intense short-lived blue-green luminescence, a dominating 490 nm and a weak 620–650 nm emission band in the CL spectrum.
4.3. Kyanite Zone
Quartz is up to 15 vol % in rock samples from the kyanite zone (GK 97-47 and GK 97-48) and forms the groundmass together with biotite, muscovite and plagioclase. It appears in almost all monomineralic layers across the samples and shows undulatory extinction (Figure 4a). The is characterised by a strong short-lived blue-green luminescence, similar to that of sample GK 96-82 and GK 96-67 (Figure 4c,d). The CL spectrum shows a strong emission band around 490 nm and the additional weak 620–650 nm emission (Figure 4b), also similar to quartz in sample GK 96-82 (garnet zone) and GK 96-67 (staurolite zone).
4.4. Kyanite-Sillimanite-Muscovite Zone
The kyanite-sillimanite-muscovite zone (GK 97-127) is dominantly made up of quartz (30 vol %) together with kyanite, sillimanite, muscovite, biotite, and plagioclase. Quartz is anhedral with common undulatory extinction, and CL properties (an intense short-lived blue-green luminescence and emission band at ca. 490 nm) are similar to those of samples from the Central Kaoko zone.
The slight shoulder around 700–710 nm appearing in the CL spectra of GK 97-127 is probably not related to quartz but due to a CL signal from plagioclase, which is intimately intergrown with quartz (see bright areas in Figure 4c,d).
4.5. Garnet-Cordierite-Sillimanite-K-Feldspar Zone
Samples GK 97-06B, GK 97-14, GK 96-116 and GK 96-110 from the garnet-cordierite-sillimanite-K-feldspar zone show more or less similar mineralogical and spectroscopic properties. Rocks from this zone are made up of cordierite, sillimanite, K-feldspar, and garnet in the foliated matrix of biotite, plagioclase and quartz. Quartz (25 vol % of each sample) is mostly xenomorphic with undulatory extinction (Figure 4e). Its CL properties are characterized by an intense blue luminescence (Figure 4g,h). The spectrum shows an intense 450 nm emission band that slightly decreases during electron irradiation, whereas the intensity of the 650 nm emission increases (Figure 4f).
4.6. Summary of Results
The measured CL images for all studied quartz show exclusively bluish luminescence colors. Differences were detected in the intensity and homogeneity of the CL between different quartz grains and also within the same quartz crystals. In many samples, portions with short-lived bluish-green CL were observed, the intensity of which strongly decreased under the electron beam. The initial emission spectra of all studied quartz obtained by spectral measurements are made up of three main emission bands: a strong blue band at 450 nm, a second band at ca. 490 nm (a component band of a strong 500 nm emission overlapping with a weak 450 nm emission), and an emission band in the orange-red region at 620–650 nm. The presence or absence and relative intensities of these bands cause the visible CL colors.
5. Discussion
5.1. CL Colors and Emission Bands
The 450 nm emission is strongly polarized along the c-axis and is due to the recombination of the self-trapped exciton [6]. The polarization effect might influence the CL intensity due to varying crystallographic orientations of quartz grains in the cutting plane of the thin section. The self-trapped exciton involves an irradiation-induced oxygen Frenkel pair consisting of an oxygen vacancy and a peroxy linkage (≡Si–O–O–Si≡). The transient defect centre has a lifetime in the order of 1 ms. Stevens-Kalceff and Phillips [6] observed an increasing intensity of the ~2.7 eV CL emission with irradiation exposure due to the migration of competing radiative and non-radiative centres out of the interaction volume under the influence of the beam-induced electric field. In contrast, Luff and Townsend [35] reported a slight decrease of this emission band during CL experiments at room temperature, which is in accordance with the results of this study.
The bluish-green ca. 500 nm emission can be related to cation-compensated trace-element centres in the quartz structure [7,36]. Combined measurements on pegmatite quartz using electron paramagnetic resonance (EPR), CL and trace element analyses showed a complete lack of intrinsic lattice defects associated with O or Si vacancies, whereas some trace elements (Al, Ti, Ge, Li) were enriched and form paramagnetic centres [37]. The strong decrease of this blue-green luminescence during electron irradiation can be related to ionization enhanced diffusion of luminescence centres as it was shown by Ramseyer and Mullis [36] by electro-diffusion experiments. The sensibility of this luminescence emission is caused by the presence of charge-balancing cations (e.g., Li+, Na+, H+) and their interaction with the electron beam.
The orange to red emission band at about 620–650 nm has been detected in almost all synthetic and natural quartz crystals. This emission is attributed to the recombination of electrons in the non-bridging oxygen band-gap state with holes in the valence band edge [13]. A number of different precursors of this non-bridging oxygen hole centre (NBOHC) have been proposed, such as hydrogen or sodium impurities (≡Si–O–H, ≡Si–O–Na), peroxy linkages (oxygen-rich samples), or strained silicon-oxygen bonds [6]. Upon irradiation, precursor centres can be transformed into the NBOHC resulting in an initial increase of the CL emission at 1.9 eV during electron bombardment and subsequent stabilization.
5.2. CL Characteristics of the Metamorphic Quartz
Comparison of all investigated quartz samples revealed different groups concerning their observed luminescence characteristics (Table 2). Group 1 comprises quartz from the garnet-cordierite-sillimanite-K-feldspar zone from the Eastern part of the Western Kaoko zone. The samples come from a restricted area with similar geological history. Quartz shows a dominant 450 nm emission band with only slightly varying initial intensities (Figure 5). During electron irradiation the intensity of the 450 nm band decreases, whereas the intensity of the 650 nm emission increases. The CL colors and spectra are similar to those of quartz from igneous rocks (e.g., granite). The dominating blue CL with the characteristic emission band at 450 nm indicates recrystallization of quartz during metamorphism. The increase of the 650 nm band during electron irradiation can be related to the conversion of precursor defects into the NBOHC. Strained silicon-oxygen bonds that originate from the stress during metamorphic processes could be assumed to be one such preferred precursor.
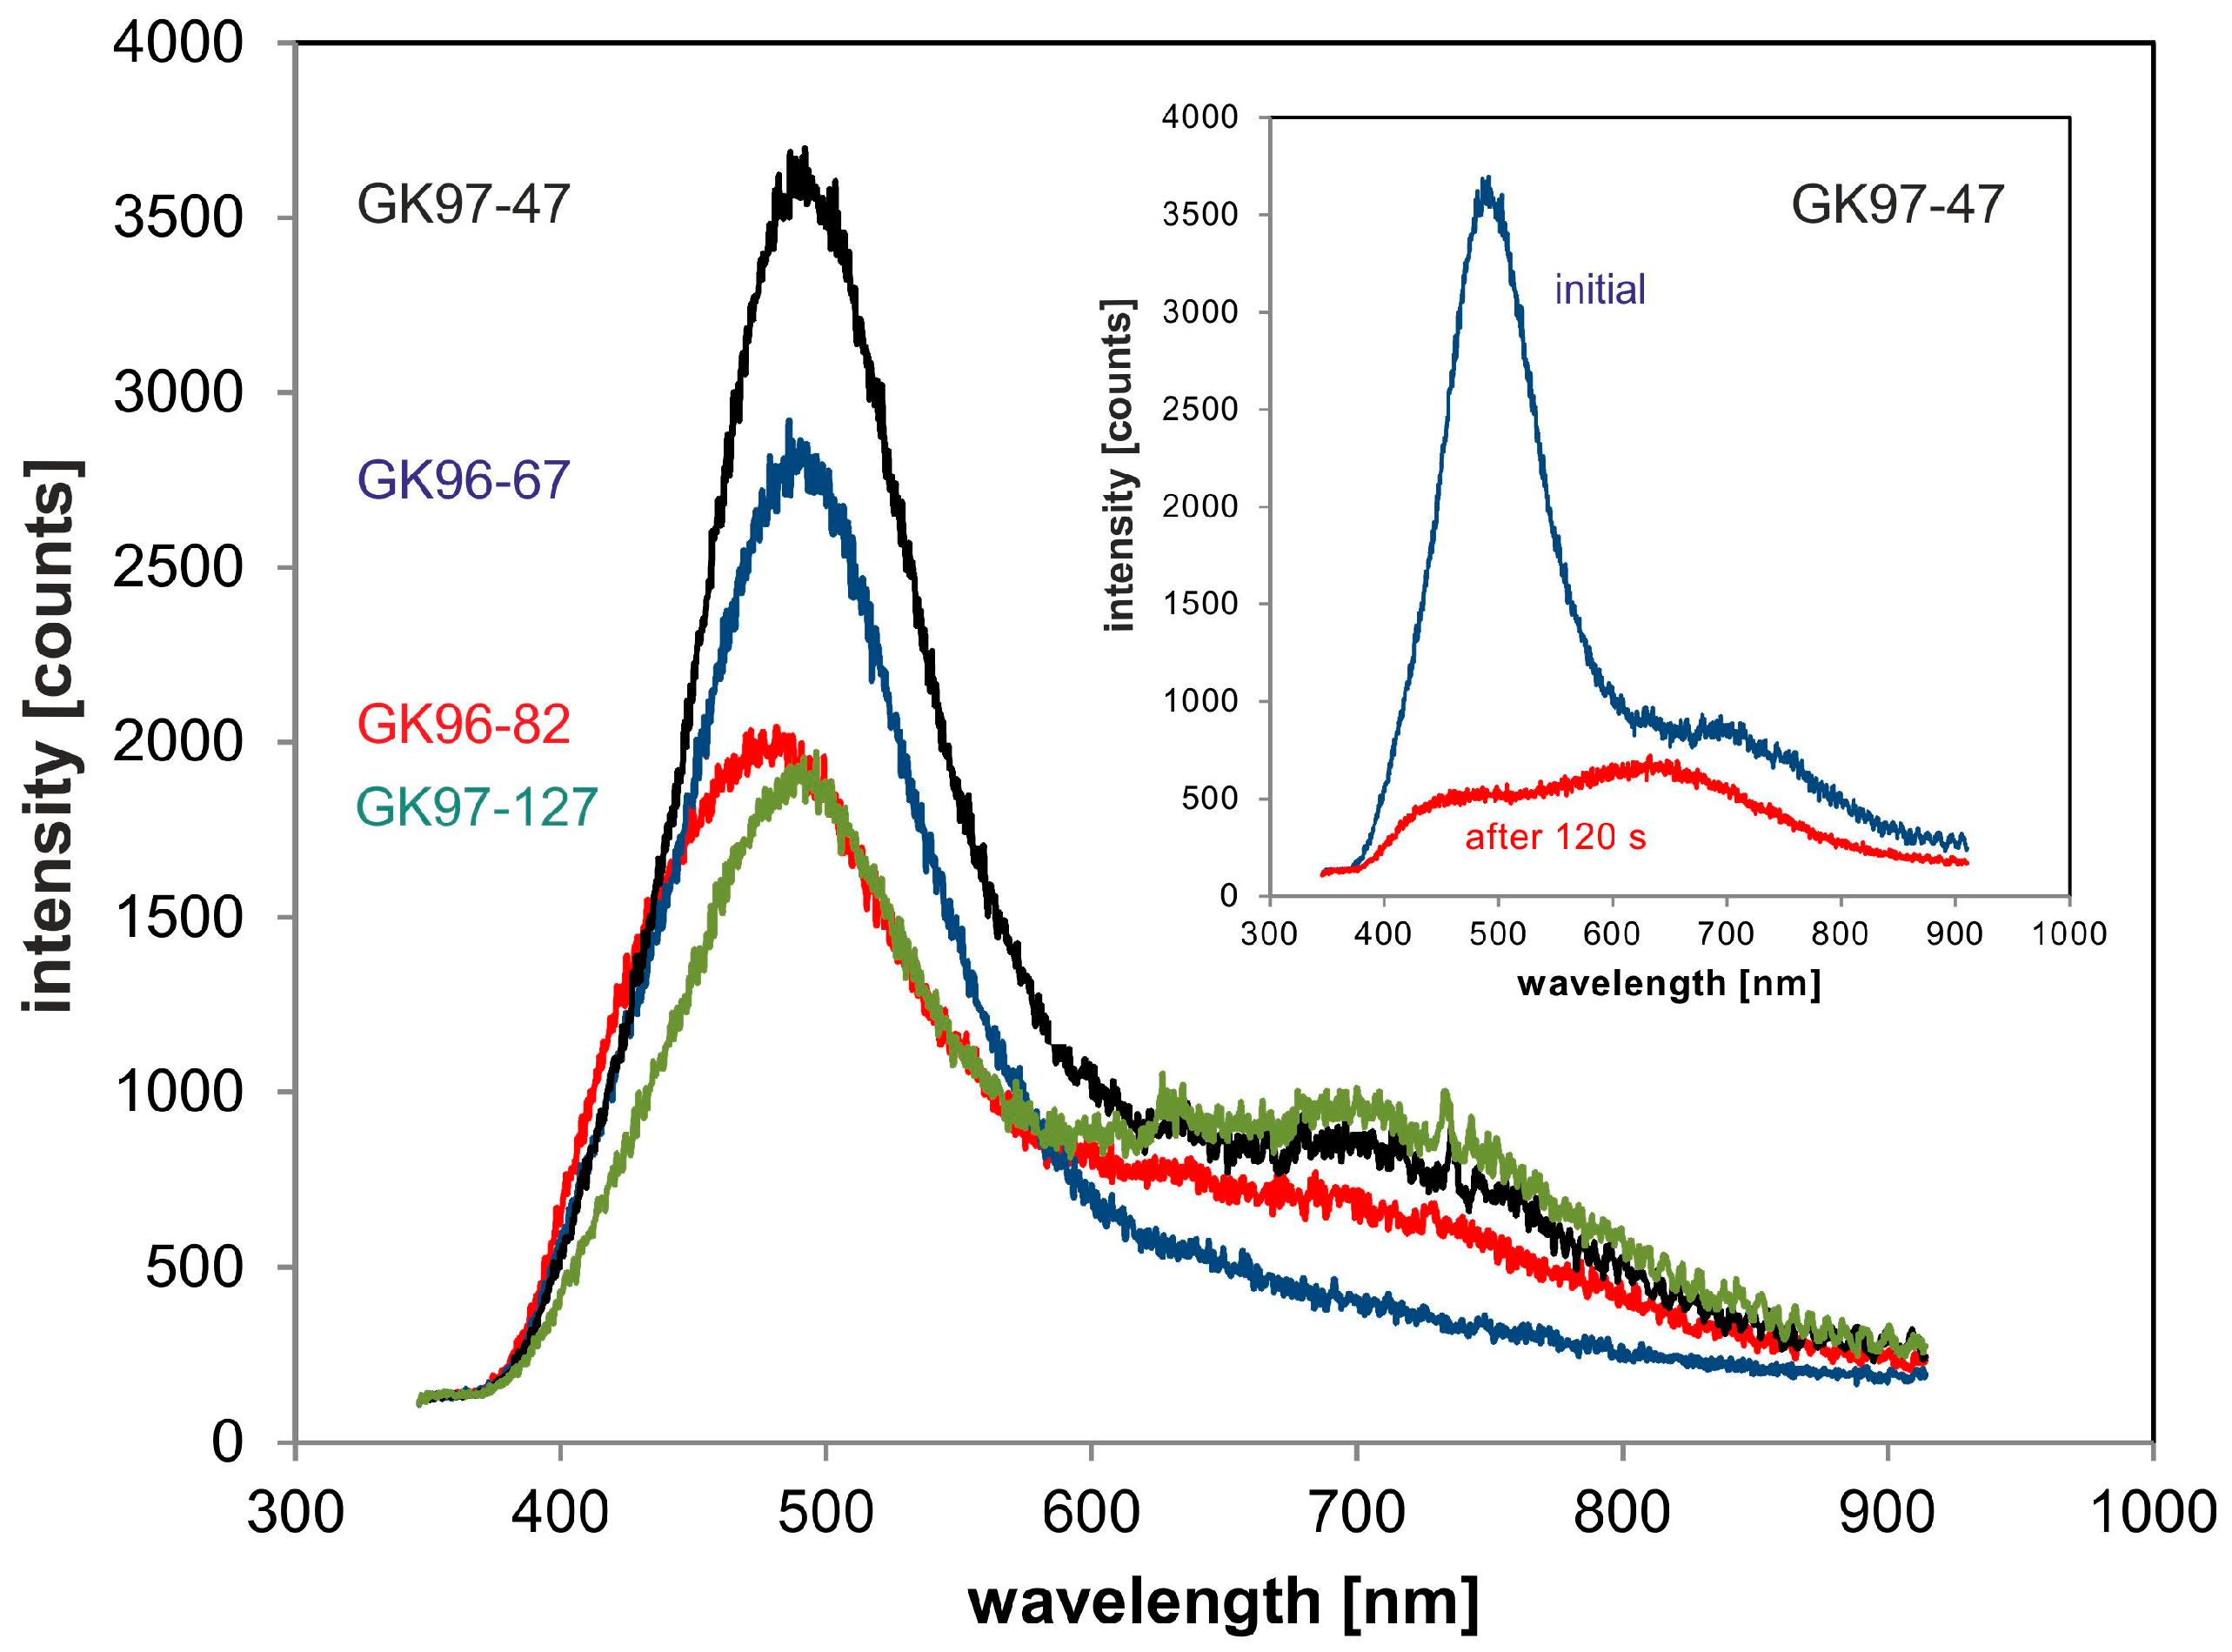
Group 2 comprises samples of different metamorphic levels in the western part of the central zone. The material represents quartz from the garnet zone (GK 96-82), staurolite zone (GK 96-67), kyanite zone (GK 97-47) and kyanite-sillimanite-muscovite zone (GK 97-127), all situated east of the Puros mylonite zone. The CL of this quartz is characterized by a visible blue-green color that disappears under electron irradiation (Figure 6). The changes of the CL spectra during electron irradiation show that the broad emission band centered at 490 nm is composed of a transient 500 nm emission and a weak 450 nm emission band that is clearly visible after electron bombardment. The short-lived blue-green CL often shows a patchy texture indicating a heterogeneous distribution of relevant luminescence centers. Assuming cation-compensated trace-element centers as responsible for the transient 500 nm emission, the observed features point to the heterogeneous incorporation of trace elements into the quartz structure. It can be assumed that the trace elements responsible for the CL variation were incorporated during recrystallization/neoformation of quartz and point to the participation of fluids in these metamorphic processes. Such metamorphogenic mobilisates would explain why quartz from these samples shows features that previously especially have been observed in quartz from pegmatites and of hydrothermal origin [4,5,7,21]. However, the relationship between trace elements and CL behavior in these samples should be analyzed in order to complete the interpretation of the present work.
In GK 97-124 sampled from the garnet zone far away from the other sampling points, quartz is irregularly distributed along the foliation between muscovite and plagioclase and exhibits a weak blue CL. The spectrum shows two emission bands at 450 and 650 nm (Figure 3d). The intensity of the blue band at 450 nm slightly decreases during electron irradiation. The CL characteristics indicate that mineral recrystallization and fluid mobilization seem to have no remarkable influence on the quartz as it was shown for the samples of the first two groups. Neither a brownish CL, characterizing quartz in low-grade metamorphic rocks [3,21], nor CL behavior was observed for quartz in high-T metamorphic rocks [21,23].
In general, compared features for quartz from all studied samples show that the position of host rocks and the local geologic settings have more influence on quartz CL properties than the metamorphic grade. Recrystallization processes cause visible blue CL similar to that of quartz in magmatic rocks with a dominant 450 nm emission band [3,4,5]. The intensity of the 450 nm band probably increases from east to west. Mobilization of mineralizing fluids connected with the formation of quartz seems to result in quartz with short-lived blue-green CL mostly visible in samples from the central part of the metamorphic belt. A typical brown CL that is assumed as characteristic feature of low-T metamorphic rocks [3,4,21] was not observed in any of the investigated quartz since the metamorphic profile provided no indications for such conditions. Most of the samples derive from metamorphic conditions with temperatures above 500 °C, which was reported by Augustsson and Reker [21] to be the temperature range of quartz with blue CL.
6. Conclusions
The CL properties of quartz in metamorphic rocks from Kaoko belt (Namibia) are variable and mainly depend on the regional geological conditions than the metamorphic grade. Quartz deriving from rocks covering P-T conditions from the garnet zone (500 ± 30 °C, 9 ± 1 kbar) up to the garnet-cordierite-sillimanite-K-feldspar zone (750 ± 30 °C, 4.0–5.5 kbar) exclusively exhibits visible blue CL. However, CL spectra reveal differences in the luminescence characteristics, which enable to distinguish different quartz types.
Mineral recrystallization, fluid mobility and incorporation of trace elements during quartz neoformation resulted in CL properties similar to those of quartz from igneous rocks (dominant blue band at 450 nm) and from hydrothermal/pegmatitic origin (short-lived bluish-green CL emission at 500 nm). Often these quartz grains show heterogeneous internal textures, sometimes with patchy bluish-green CL indicating a heterogeneous distribution of related luminescence centres.
The presented results have also a significant relevance for the use and interpretation of quartz CL for provenance studies in sedimentary petrology. Up to now, in particular the occurrence of quartz with brown CL (low-T) and blue CL (high-T) was used as indicator for metamorphic source rocks of detrital quartz in sediments. Because of the fact that bright blue quartz commonly indicates a plutonic origin, only in the case that little plutonic material is expected in the potential source areas, blue quartz can be assumed to be derived from high-T metamorphic rocks. In addition, the detection of transient bluish-green CL in high-T metamorphic quartz similar to that of hydrothermal/pegmatitic quartz limits its application in provenance studies of quartz-rich sediments.
One limitation of the present investigation is that the sample material represents exclusively polymineralic rock samples. Therefore, the data have to be proved by further investigations of monomineralic metamorphic rocks consisting only of quartz.
Author Contributions
Jonathan Sittner and Jens Götze performed the experiments, analyzed the data, and wrote the paper.
Acknowledgments
We are grateful to Birgit Gruner for providing us with sample material for the present study. The reviews of Carita Augustsson and two anonymous reviewers improved the quality of the paper significantly.
Conflicts of Interest
The authors declare no conflict of interest.
References
- Götze, J. Chemistry, textures and physical properties of quartz—geological interpretation and technical application. Miner. Mag. 2009, 73, 645–671. [Google Scholar] [CrossRef]
- Götze, J.; Möckel, R. Quartz: Deposits, Mineralogy and Analytics; Springer Geology: Heidelberg, Germany; New York, NY, USA; Dordrecht, The Netherlands; London, UK, 2012; p. 360. ISBN 978-3-642-22160-6. [Google Scholar]
- Zinkernagel, U. Cathodoluminescence of quartz and its application to sandstone petrology. Contrib. Sedimentol. 1978, 8, 1–69. [Google Scholar]
- Ramseyer, K.; Baumann, J.; Matter, A.; Mullis, J. Cathodoluminescence colours of alpha-quartz. Miner. Mag. 1988, 52, 669–677. [Google Scholar] [CrossRef]
- Götze, J.; Plötze, M.; Habermann, D. Cathodoluminescence (CL) of quartz: Origin, spectral characteristics and practical applications. Miner. Petrol. 2001, 71, 225–250. [Google Scholar] [CrossRef]
- Stevens-Kalceff, M.; Phillips, M.R. Cathodoluminescence microcharacterization of the defect structure of quartz. Phys. Rev. B 1995, 52, 3122–3134. [Google Scholar] [CrossRef]
- Götze, J.; Plötze, M.; Trautmann, T. Structure and luminescence characteristics of quartz from pegmatites. Am. Miner. 2005, 90, 13–21. [Google Scholar] [CrossRef]
- Stevens-Kalceff, M.A. Cathodoluminescence microcharacterization of point defects in α-quartz. Miner. Mag. 2009, 73, 585–606. [Google Scholar] [CrossRef]
- Götze, J. Application of cathodoluminescence (CL) microscopy and spectroscopy in geosciences. Microsc. Microanal. 2012, 18, 1270–1284. [Google Scholar] [CrossRef] [PubMed]
- Götte, T.; Ramseyer, K. Trace element characteristics, luminescence properties and real structure of quartz. In Quartz: Deposits, Mineralogy and Analytics; Götze, J., Möckel, R., Eds.; Springer Geology: Heidelberg, Germany; New York, NY, USA; Dordrecht, The Netherlands; London, UK, 2012; pp. 265–285. ISBN 978-3-642-22160-6. [Google Scholar]
- Götze, J.; Pan, Y.; Stevens-Kalceff, M.; Kempe, U.; Müller, A. Origin and significance of the yellow cathodoluminescence (CL) of quartz. Am. Miner. 2015, 100, 1469–1482. [Google Scholar] [CrossRef]
- Gorton, N.T.; Walker, G.; Burley, S.D. Experimental analysis of the composite blue cathodoluminescence emission in quartz. J. Lumin. 1997, 72–74, 669–671. [Google Scholar] [CrossRef]
- Siegel, G.H.; Marrone, M.J. Photoluminescence in as-drawn and irradiated silica optical fibers: An assessment of the role of nonbridging oxygen defect centers. J. Non Cryst. Solids 1981, 45, 235–247. [Google Scholar] [CrossRef]
- Matter, A.; Ramseyer, K. Cathodoluminescence microscopy as a tool for provenance studies of sandstones. In Provenance of Arenites; Zuffa, G.G.D., Ed.; Reidel Publishing Company: Dordrecht, The Netherlands, 1985; pp. 191–211. [Google Scholar]
- Owen, M.R. Application of cathodoluminescence to sandstone provenance. In Luminescence Microscopy: Quantitative and Qualitative Aspects; Barker, C.E., Kopp, O.C., Eds.; SEPM: Dallas, TX, USA, 1991; pp. 67–76. [Google Scholar]
- Seyedolali, A.; Krinsley, D.H.; Boggs, S.; O’Hara, P.F.; Dypvik, H.; Goles, G.G. Provenance interpretation of quartz by scanning electron microscope-cathodoluminescence fabric analysis. Geology 1997, 25, 787–790. [Google Scholar] [CrossRef]
- Götze, J.; Zimmerle, W. Quartz and silica as guide to provenance in sediments and sedimentary rocks. Contrib. Sediment. Petrol. 2000, 21, 1–91. [Google Scholar]
- Boggs, S., Jr.; Kwon, Y.I.; Goles, G.G.; Rusk, B.G.; Krinsley, D.; Seyedolali, A. Is quartz cathodoluminescence color a reliable provenance tool? A quantitative examination. J. Sediment. Res. 2002, 72, 408–415. [Google Scholar] [CrossRef]
- Richter, D.K.; Götte, T.; Götze, J.; Neuser, R.D. Progress in application of cathodoluminescence (CL) in sedimentary geology. Miner. Petrol. 2003, 79, 127–166. [Google Scholar] [CrossRef]
- Götte, T.; Richter, D.K. Cathodoluminescence characterization of quartz particles in mature arenites. Sedimentology 2006, 53, 1347–1359. [Google Scholar] [CrossRef]
- Augustsson, C.; Reker, A. Cathodolumenescence Spectra of Quartz as Provenance Indicators Revisited. J. Sediment. Res. SEPM 2012, 82, 559–570. [Google Scholar] [CrossRef]
- Götze, J. Classification, mineralogy and industrial potential of SiO2 minerals and rocks. In Quartz: Deposits, Mineralogy and Analytics; Götze, J., Möckel, R., Eds.; Springer Geology: Heidelberg, Germany; New York, NY, USA; Dordrecht, The Netherlands; London, UK, 2012; pp. 1–27. ISBN 978-3-642-22160-6. [Google Scholar]
- Sprunt, E.S.; Dengler, L.A.; Sloan, D. Effects of metamorphism on quartz cathodoluminescence. Geology 1978, 6, 305–308. [Google Scholar] [CrossRef]
- Owen, M.R. Sedimentary petrology and provenance of the upper Jackford sandstone (Morrowan), Ouachita Mountains, Arkansas. Ph.D. Thesis, University of Illinois, Urbana, St. Louis, MO, USA, 1984. [Google Scholar]
- Van den Kerkhof, A.M.; Kronz, A.; Simon, K.; Scherer, T. Fluid-controlled recovery in granulite as revealed by cathodoluminescence and trace element analysis (Bamble sector, Norway). Contrib. Miner. Petrol. 2004, 146, 637–652. [Google Scholar]
- Spear, F.S.; Wark, D.A. Cathodoluminescence imaging and titanium thermometry in metamorphic quartz. J. Metamorph. Geol. 2009, 27, 187–205. [Google Scholar] [CrossRef]
- Gruner, B. Metamorphoseentwicklung im Kaokogürtel, NW-Namibia: Phasenpetrologische und geothermobarometrische Untersuchungen panafrikanischer Metapelite. Ph.D. Thesis, University Würzburg, Würzburg, Germany, 2000. [Google Scholar]
- Porada, H. The Damara-Ribeira Orogen of the Pan-African-Brasiliano cycle in Namibia (South West Africa) and Brazil as interpreted in terms of continental collision. Tectonophysics 1979, 57, 237–265. [Google Scholar] [CrossRef]
- Frimmel, H.E.; Klötzli, U.S.; Siegfried, P.R. New Pb-Pb single zircon age constraints on the timing of Neoproterozoic glaciation and continental break-up in Namibia. J. Geol. 1996, 104, 459–469. [Google Scholar] [CrossRef]
- Miller, R.M. The Pan-African Damara Orogen of South West Africa/Namibia. In Evolution of the Damara Orogen; Special Publications of the Geological Society of South Africa: Johannesburg, South Africa, 1983; pp. 31–515. [Google Scholar]
- Kröner, S.; Konopásek, J.; Kröner, A.; Poller, U.; Wingate, M.W.D.; Passchier, C.W.; Hofmann, K.H. U-Pb and Pb-Pb zircon ages for metamorphic rocks in the Kaoko Belt of NW Namibia: A Palaeo- to Mesoproterozoic basement reworked during the Pan-African orogeny. S. Afr. J. Geol. 2004, 107, 455–476. [Google Scholar] [CrossRef]
- Goscombe, B. and Gray, D.R. The coastal terrane of the Kaoko Belt, Namibia: Outboard arc-terrane and tectonic significance. Precambrian Res. 2007, 155, 139–158. [Google Scholar] [CrossRef]
- Neuser, R.D.; Bruhn, F.; Götze, J.; Habermann, D.; Richter, D.K. Kathodolumineszenz: Methodik und Anwendung. Zent. Geol. Paläontologie Teil I 1995, H 1, 287–306. [Google Scholar]
- Kröner, S.; Jung, S.; Kröner, A. A ~700 Ma Sm Nd garnet whole rock age from the granulite facies Central Kaoko Zone (Namibia): Evidence for a cryptic high-grade polymetamorphic history? Lithos 2007, 97, 247–270. [Google Scholar]
- Luff, B.J.; Townsend, P.D. Cathodoluminescence of synthetic quartz. J. Phys. Condens. Matter 1990, 2, 8089–8097. [Google Scholar] [CrossRef]
- Ramseyer, K.; Mullis, J. Factors influencing short-lived cathodoluminescence of alpha-quartz. Am. Miner. 1990, 75, 791–800. [Google Scholar]
- Götze, J.; Plötze, M.; Graupner, T.; Hallbauer, D.K.; Bray, C. Trace element incorporation into quartz: A combined study by ICP-MS, electron spin resonance, cathodoluminescence, capillary ion analysis and gas chromatography. Geochim. Cosmochim. Acta 2004, 68, 3741–3759. [Google Scholar] [CrossRef]
Figure 1.
Geological and structural map of the Kaoko belt (modified after [32]) showing traces of the dominant foliation (fine lines) WKZ: Western Kaoko Zone, CKZ: Central Kaoko Zone, EKZ: Eastern Kaoko Zone, TPMZ: Three Palms Mylonite Zone, PMZ: Puros Mylonite Zone, HMZ: Hartmann Mylonite Zone, VMZ: Village Mylonite Zone, KMZ: Khumib Mylonite Zone, AMZ: Ahub Mylonite Zone, ST: Sesfontein Thrust.
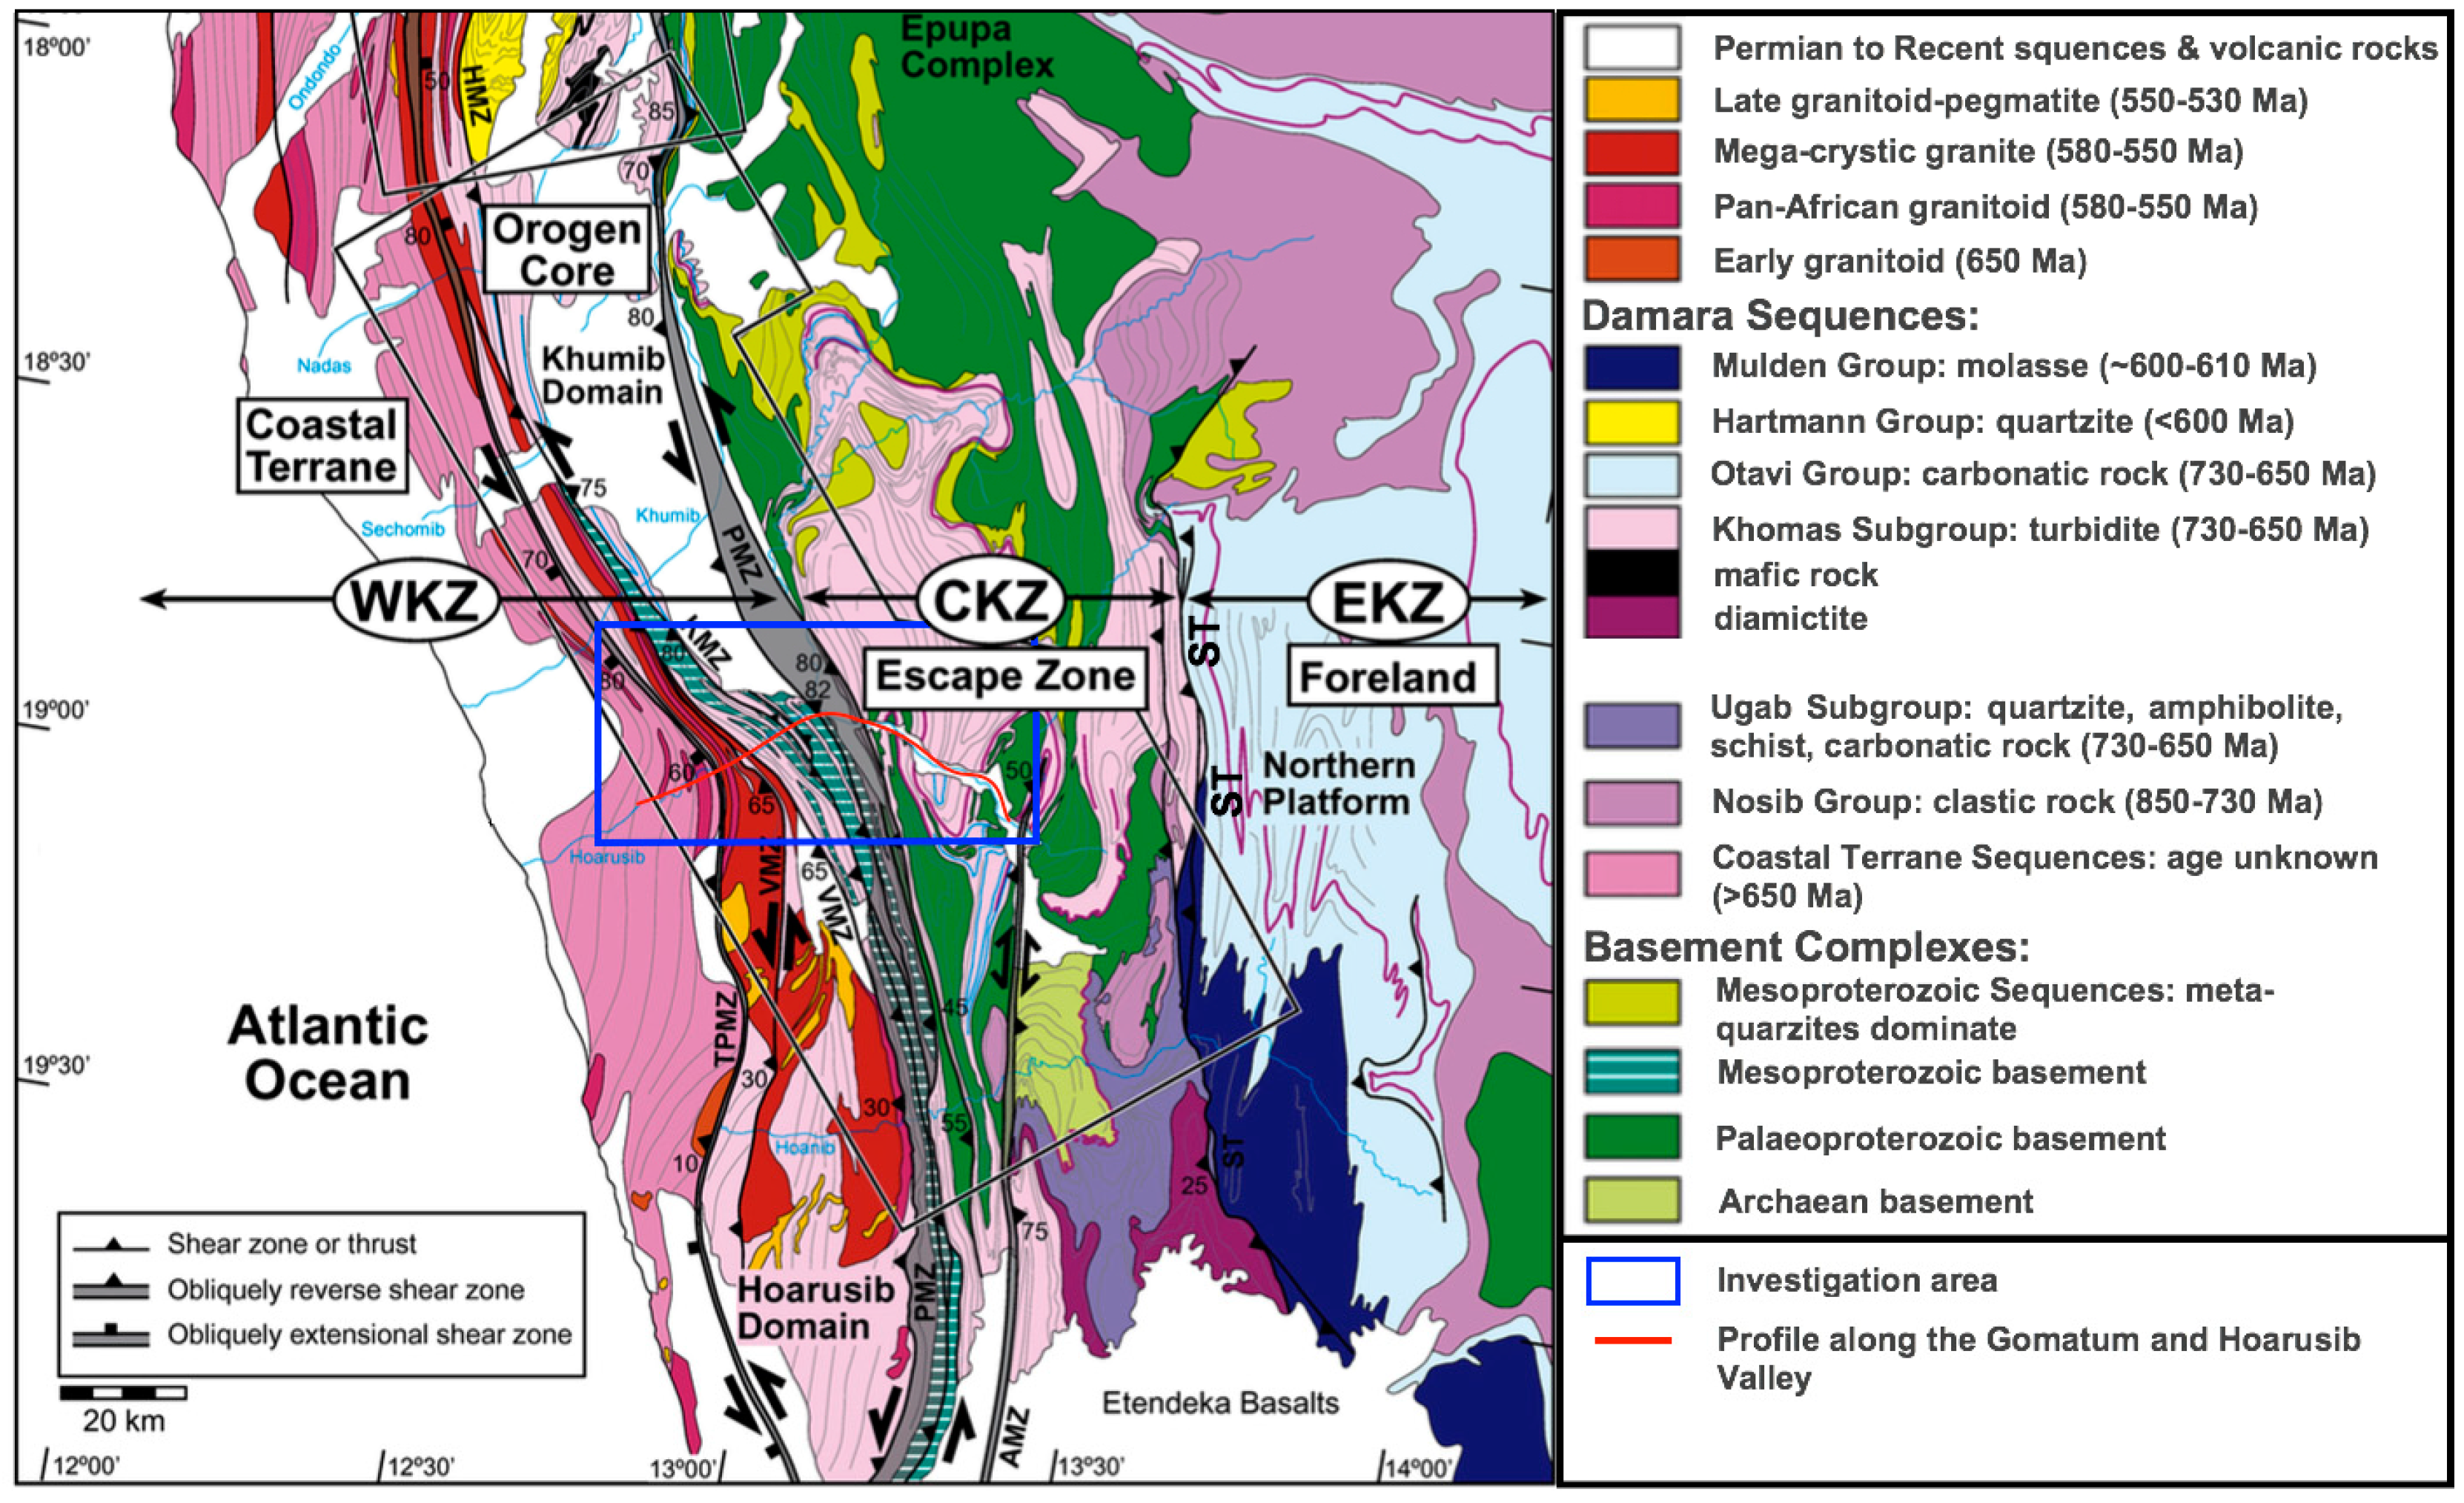
Figure 2.
Schematic map of the metamorphic zones along the Gomatum and Hoarusib valleys with sample locations (modified after [34]); grt: garnet zone, st: staurolite zone, ky: kyanite zone, ky-sil-ms: kyanite-sillimanite-muscovite zone, sil-ms: sillimanite-muscovite zone, sil-Kfs: sillimanite-K-feldspar zone, grt-crd-sil-Kfs: garnet-cordierite-sillimanite-K-feldspar zone, WKZ: Western Kaoko Zone; CKZ: Central Kaoko Zone, VMZ: Village Mylonite Zone, PSZ: Puros Shear Zone.
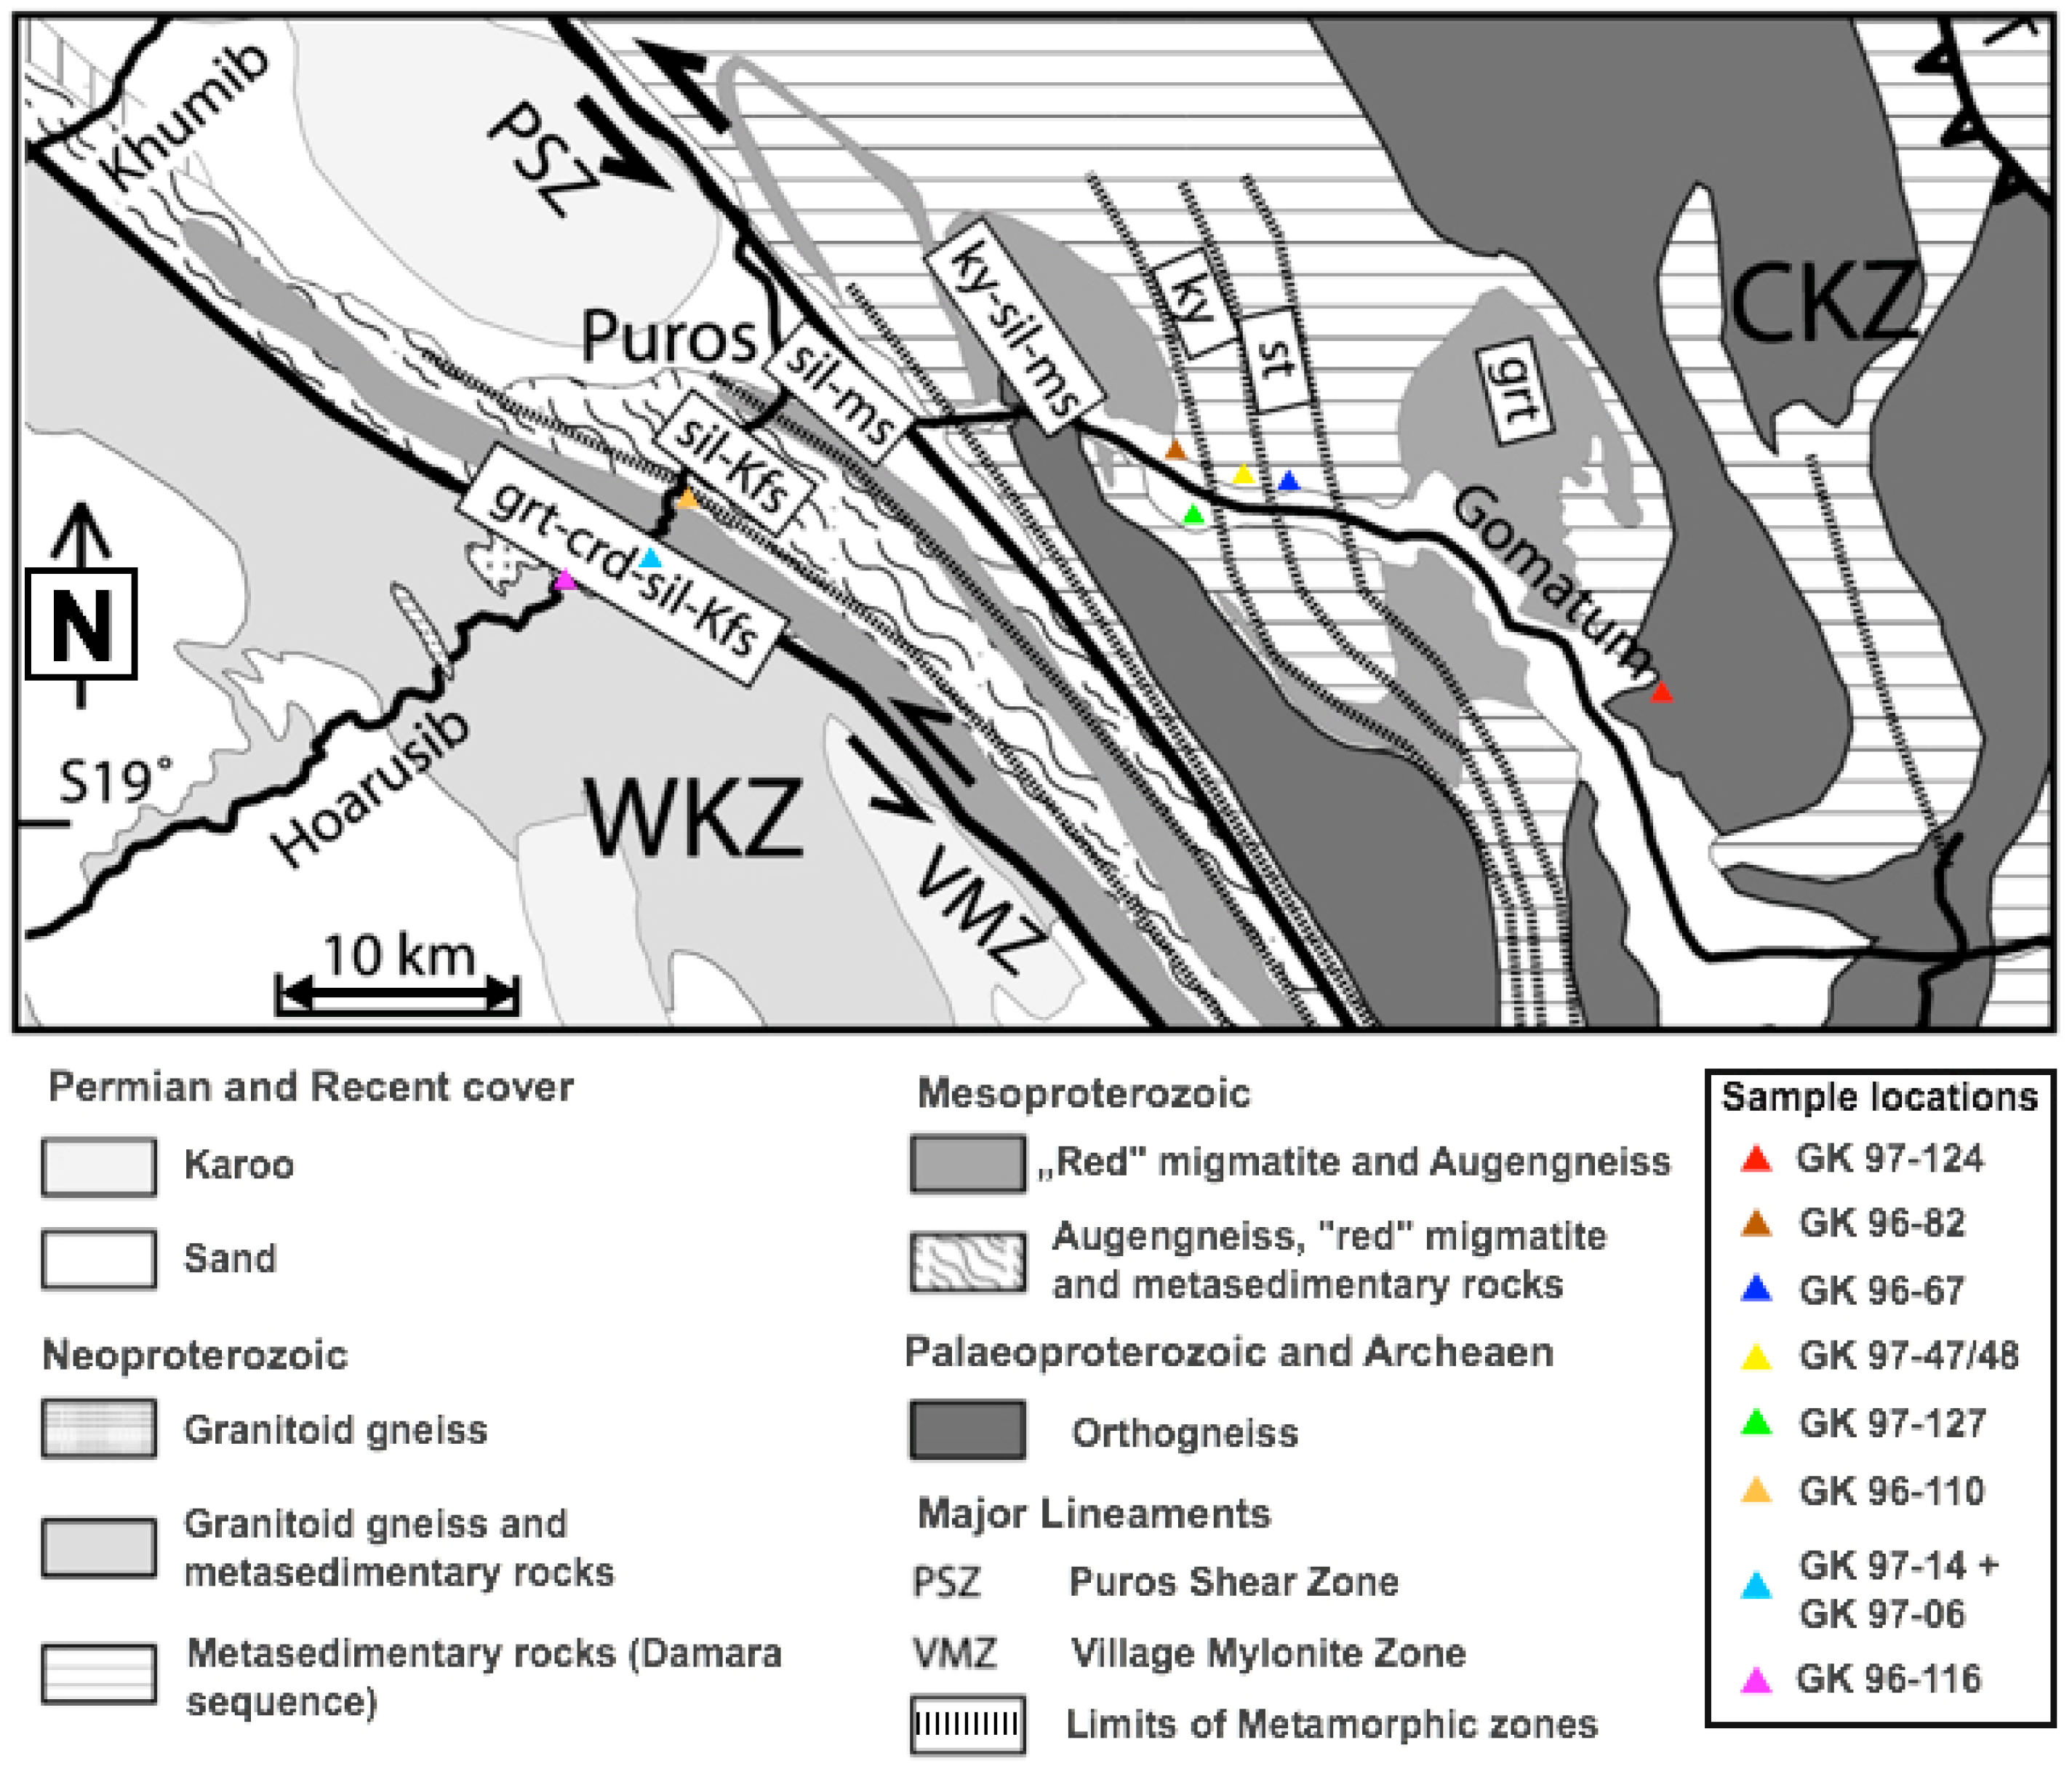
Figure 3.
Polarized light and CL micrographs of two investigated metamorphic rocks from the garnet zone showing different luminescence characteristics; (a,b) transmitted light and polarized light micrographs of sample GK 97-124; (c) CL image of the same sample area showing dark blue CL of quartz (q) and bright CL of plagioclase (plag), mica is non-luminescent; the circle marks the spot for CL spectroscopy; (d) related CL emission spectra of sample GK 97-124; (e) micrograph in polarized light of a quartz-rich area in sample GK 96-82; (f) CL emission spectra of quartz in sample GK 96-82 showing a dominant initial emission band at ca. 490 nm and the spectrum after 120 s of electron irradiation; (g,h) CL images of sample GK 96-82 initially and after 120 s of electron irradiation; the short-lived blue-green CL of quartz (q) disappears and turns to a weak violet CL.
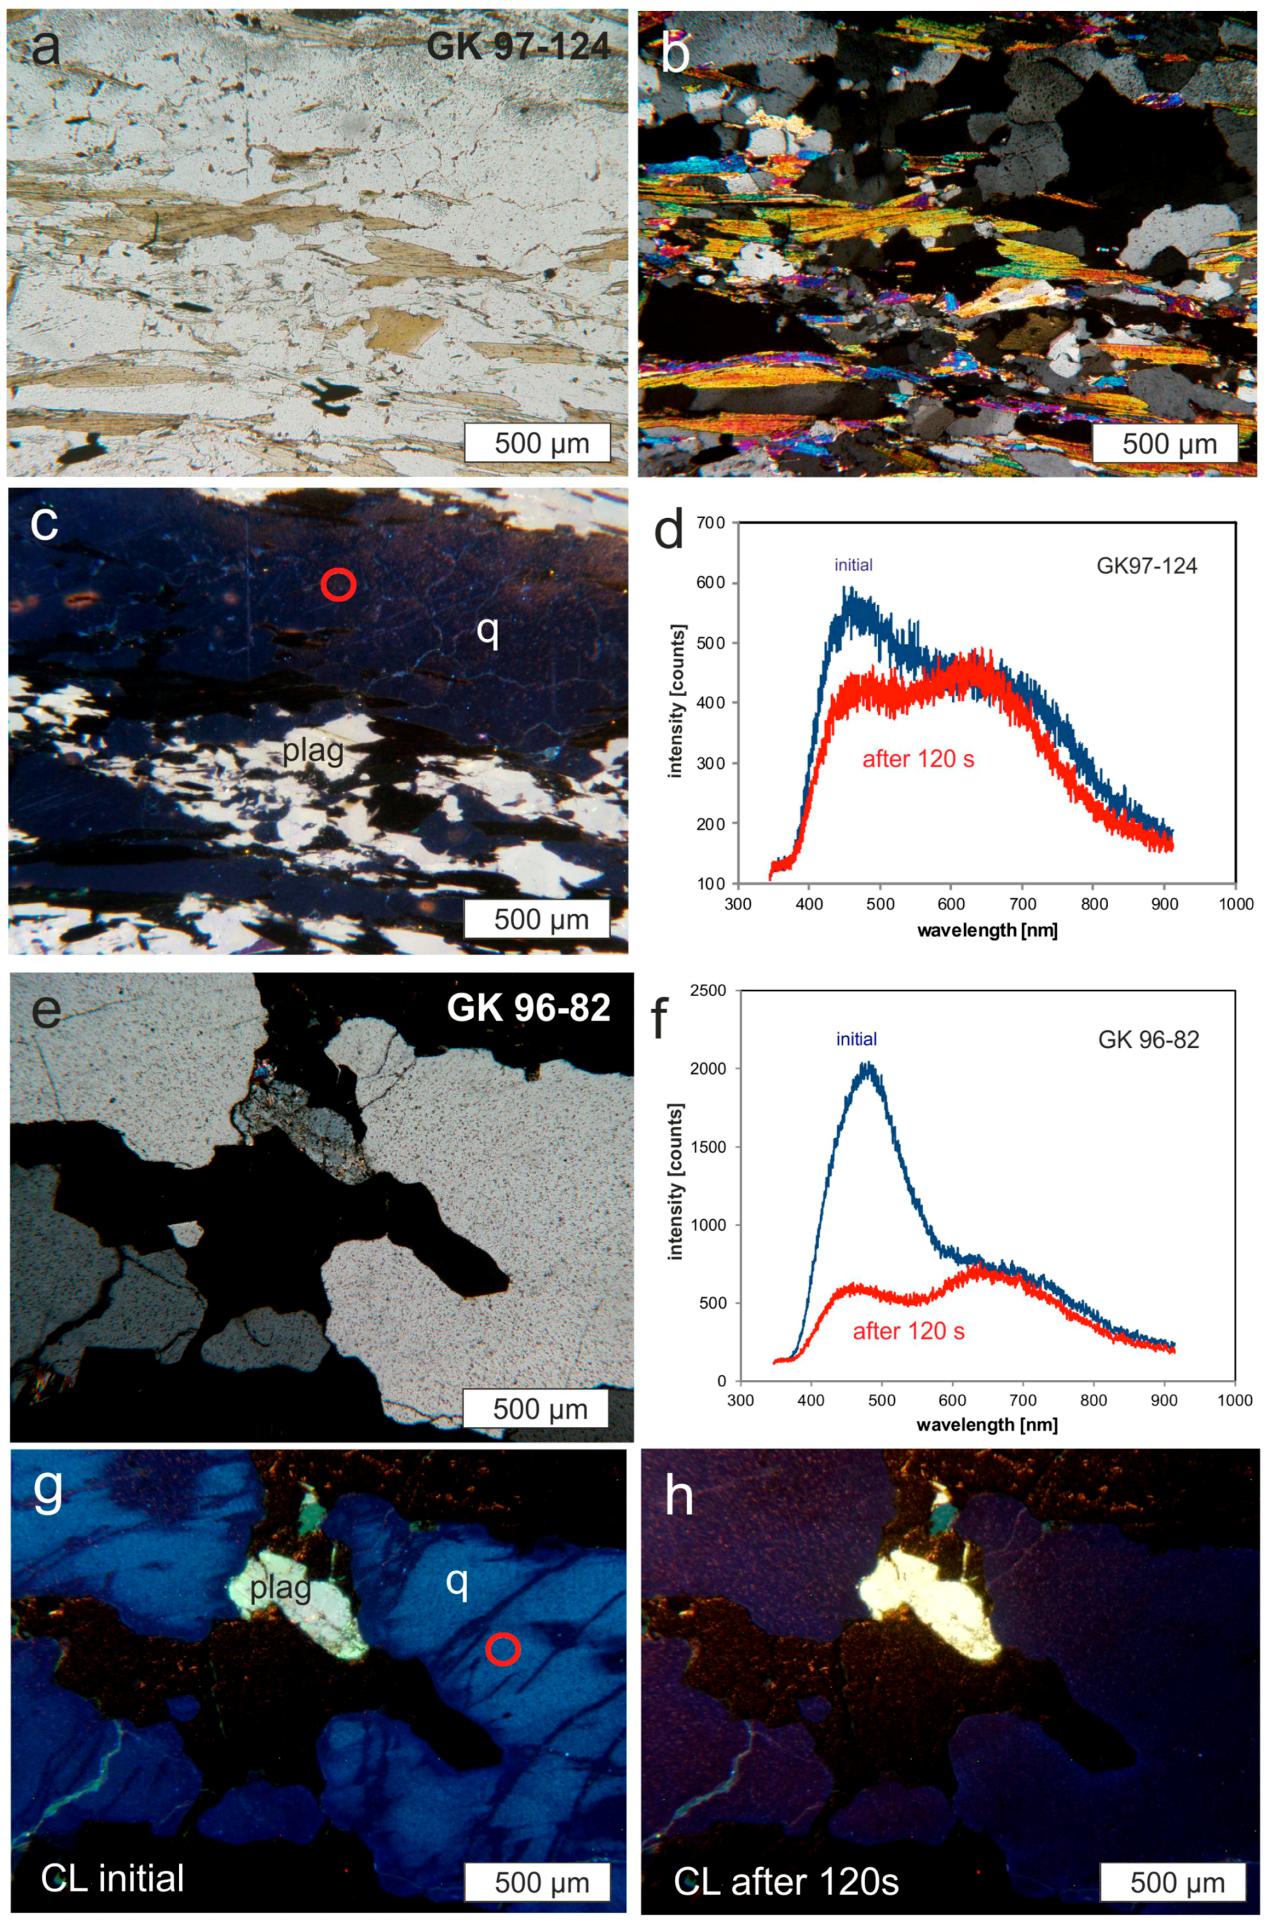
Figure 4.
Polarized light and CL micrographs of two metamorphic rocks from the kyanite-sillimanite-muscovite zone (GK 97-127) and the garnet-cordierite-sillimanite-K-feldspar zone (GK 97-06B) showing different luminescence characteristics; (a) polarized light micrograph of sample GK 97-127; (b) CL emission spectra of quartz in sample GK 97-127 showing a dominant initial emission band at ca. 490 nm and the spectrum after 120 s of electron irradiation; (c,d) CL images of sample GK 96-82 initially and after 120 s of electron irradiation; the short-lived blue-green CL of quartz disappeared; (e) micrograph in polarized light of a quartz-rich area in sample GK 97-06B; (f) CL emission spectra of quartz in sample GK 97-06B showing a dominant initial emission band at ca. 450 nm and the spectrum after120 s of electron irradiation (g,h) CL images of sample GK 97-06B showing blue CL of quartz (q) and radiation halos around micro-inclusions (arrow); the circle marks the spot for CL spectroscopy.
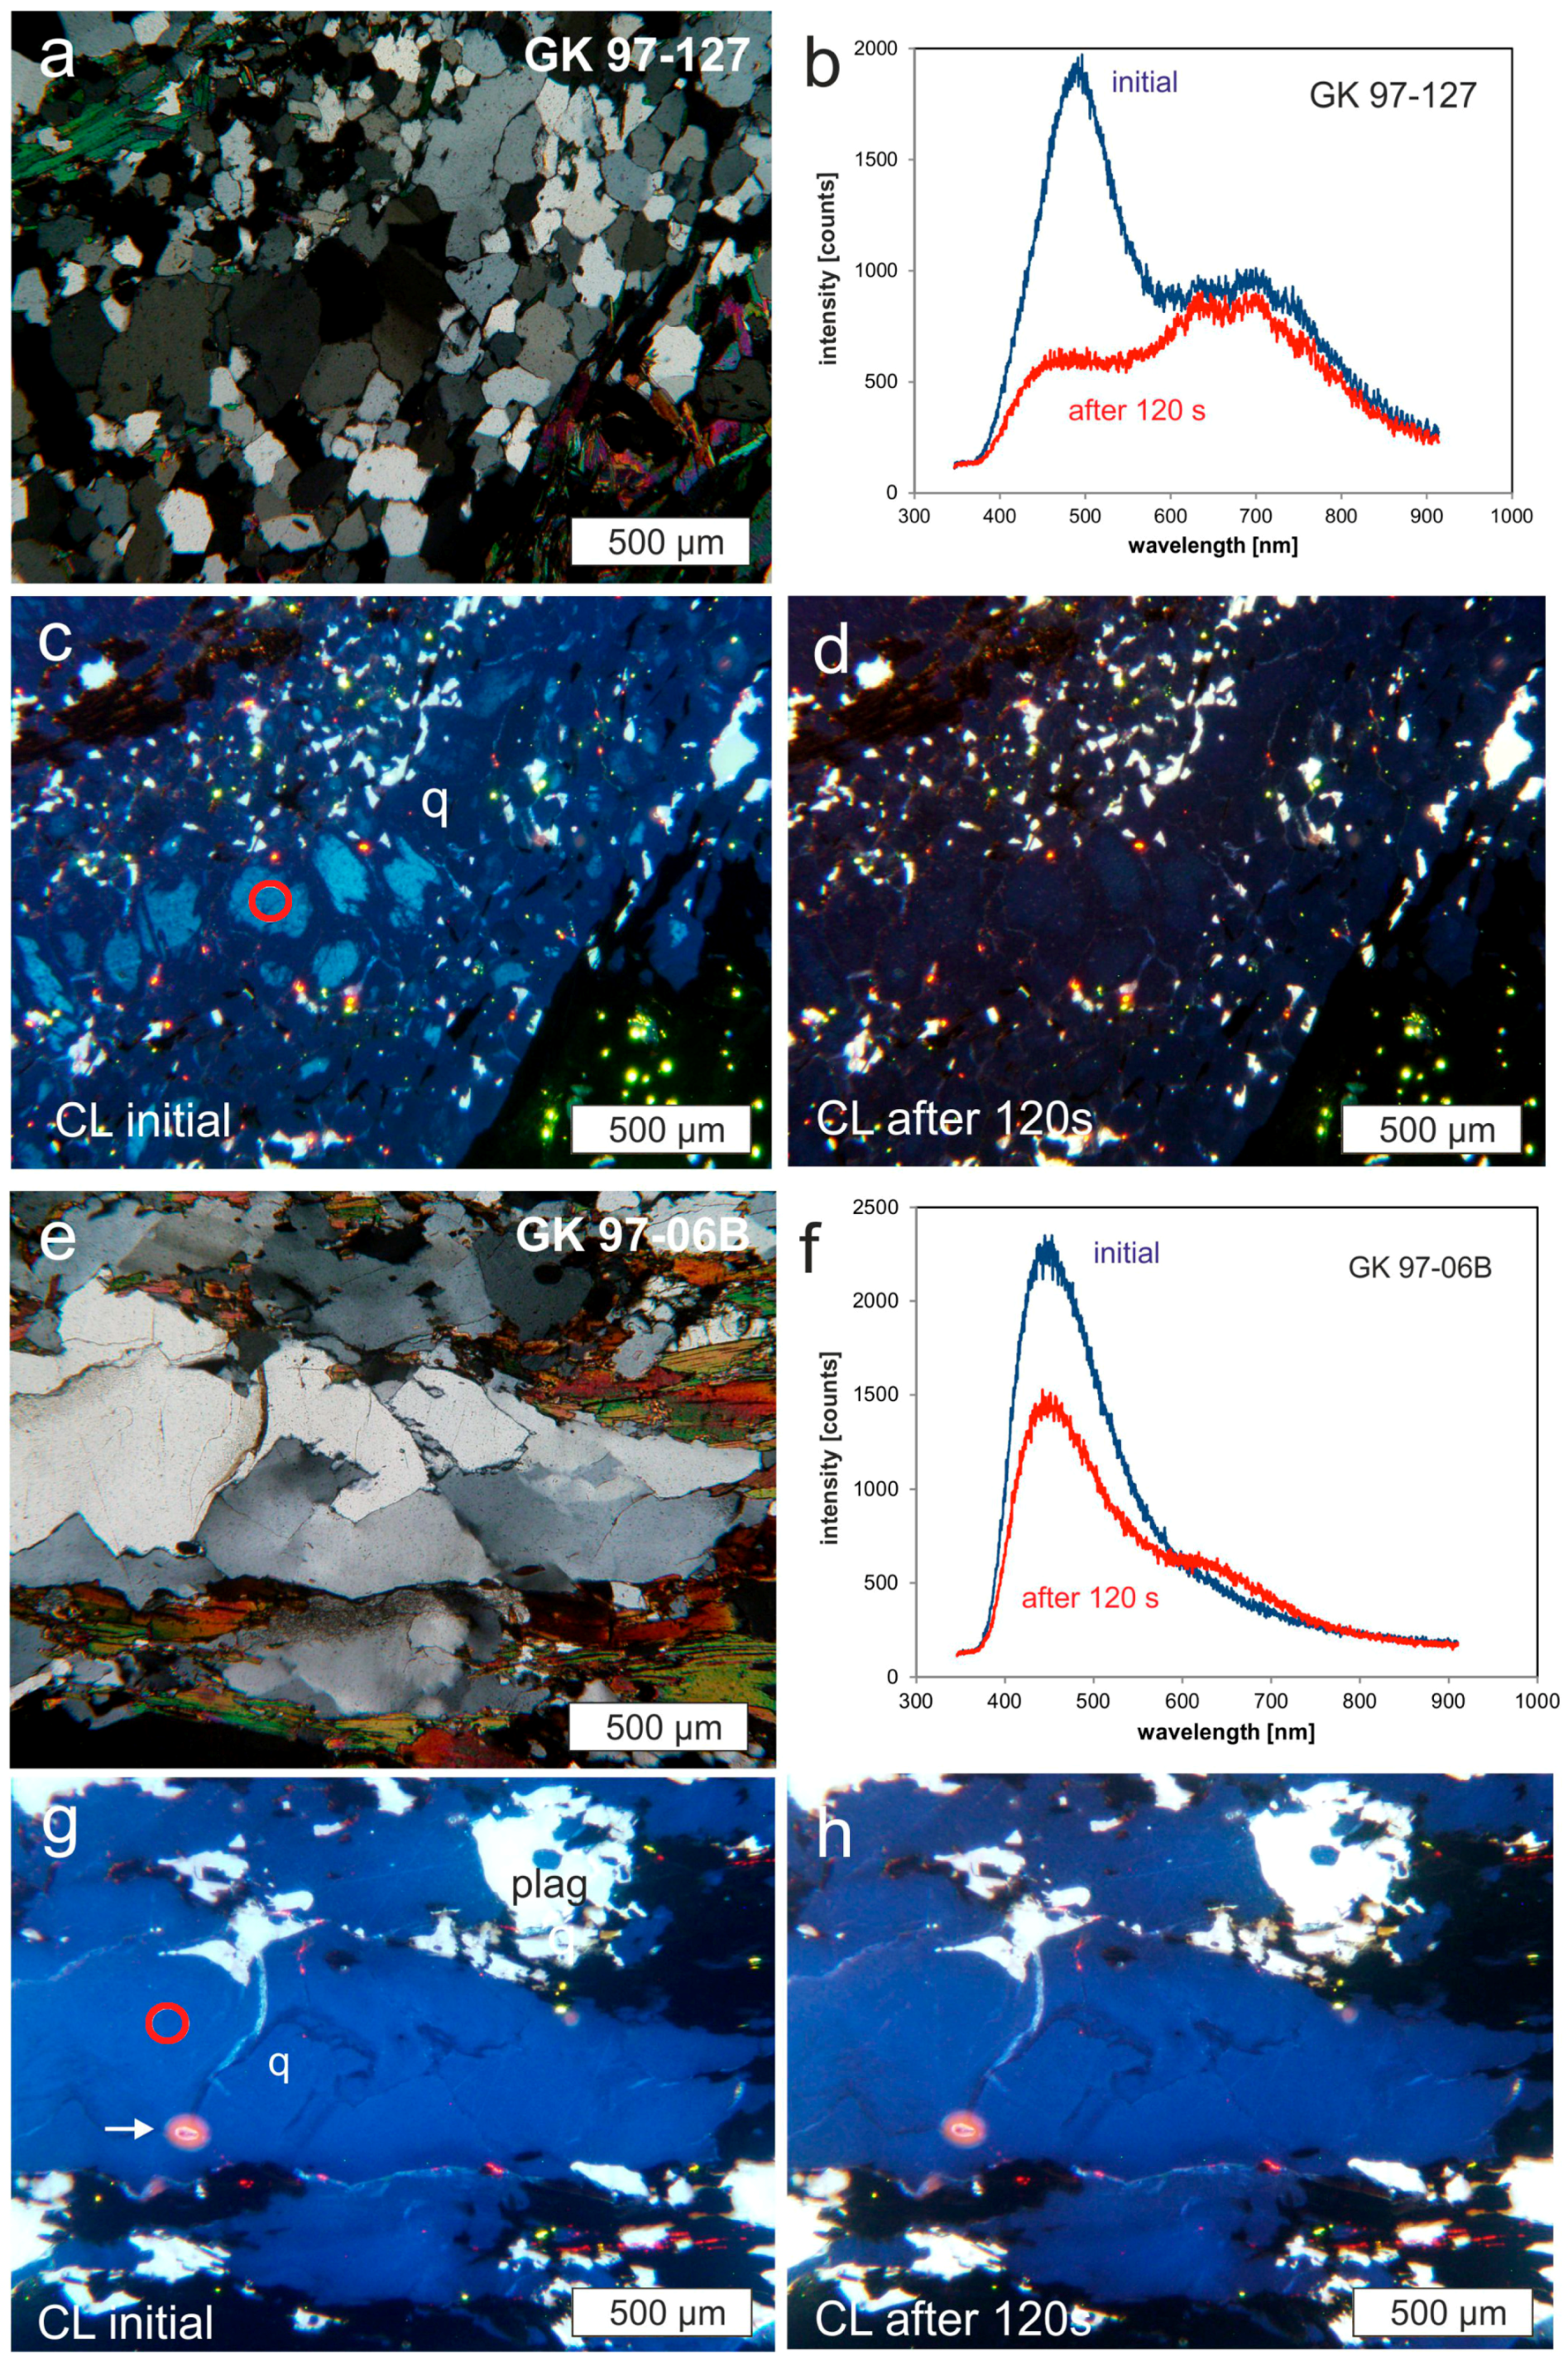
Figure 5.
Initial CL emission spectra of quartz from the garnet-cordierite-sillimanite-K-feldspar zone; the dominating 450 nm band decreases during electron irradiation, whereas the 650 nm band intensity increases (see inset—the irradiation time of the electron beam was set to 300 s to see the changes of the spectra more clearly).

Figure 6.
Initial CL emission spectra of quartz from the garnet zone (GK 96-82), staurolite zone (GK 96-67), kyanite zone (GK 97-47), and kyanite-sillimanite-muscovite zone (GK 97-127); the dominating 490 nm band strongly decreases during electron irradiation revealing the slight 450 nm band; the 650 nm emission intensity is more or less constant (see inset).


Table 1.
Analyzed samples with the respective metamorphic rock type and P-T conditions (data from [27]). WKZ: Western Kaoko Zone; CKZ: Central Kaoko Zone; Ky-sill-mu zone: Kyanite-sillimanite-muscovite zone; Grt-cd-sill-ksp zone: Garnet-cordierite-sillimanite-K-feldspar zone.
Table 1.
Analyzed samples with the respective metamorphic rock type and P-T conditions (data from [27]). WKZ: Western Kaoko Zone; CKZ: Central Kaoko Zone; Ky-sill-mu zone: Kyanite-sillimanite-muscovite zone; Grt-cd-sill-ksp zone: Garnet-cordierite-sillimanite-K-feldspar zone.
| Sample | Metamorphic Zone | Rock Type | Temperature and Pressure Zone | Coordinates | Tectono-Stratigraphic Zone |
|---|---|---|---|---|---|
| GK 97-124 | Garnet zone | Garnet mica schist | 500 ± 30 °C, 9 ± 1 kbar | 18°55,24 S 13°20,07 E | CKZ |
| GK 96-82 | Garnet zone | Garnet mica schist | 500 ± 30 °C, 9 ± 1 kbar | 18°46,78 S 13°04,78 E | CKZ |
| GK 96-67 | Staurolite zone | Garnet-staurolite mica schist | 580 ± 30 °C, 7–8 kbar | 18°48,17 S 13°07,48 E | CKZ |
| GK 97-47 | Kyanite zone | Kyanite-staurolite mica schist | 590 ± 30 °C, 6.5–8 kbar | 18°48,06 S 13°07,35 E | CKZ |
| GK 97-48 | Kyanite zone | Kyanite-staurolite mica schist | 590 ± 30 °C, 6.5–8 kbar | 18°48,06 S 13°07,35 E | CKZ |
| GK 97-127 | Ky-sill-mu zone | Kyanite-sillimanite mica schist | 650 ± 20 °C, 9 ± 1.5 kbar | 18°47,88 S 13°04,94 E | CKZ |
| GK 97-06B | Grt-crd-sil-Kfs zone | Gneiss with garnet, cordierite and sillimanite | 750 ± 30 °C, 4.0–5.5 kbar | 18°52,76 S 12°51,14 E | WKZ |
| GK 97-14 | Grt-crd-sil-Kfs zone | Migmatitic gneiss with garnet, cordierite and sillimanite | 750 ± 30 °C, 4.0–5.5 kbar | 18°52,76 S 12°51,14 E | WKZ |
| GK 96-116 | Grt-crd-sil-Kfs zone | Migmatitic gneiss with garnet, cordierite and sillimanite | 750 ± 30 °C, 4.0–5.5 kbar | 18°52,77 S 12°50,63 E | WKZ |
| GK 96-110 | Grt-crd-sil-Kfs zone | Garnet-sillimanite gneiss | 750 ± 30 °C, 4.0–5.5 kbar | 18°49,07 S 12°54,75 E | WKZ |
Table 2.
Different CL groups with metamorphic zone, p-T conditions (data from [27]), initial CL bands and CL colors. Grt: garnet zone, St: staurolite zone, Ky: kyanite zone, Ky-sil-ms: kyanite-sillimanite-muscovite zone; Grt-cd-sill-ksp: Garnet-cordierite-sillimanite-K-feldspar zone.
Table 2.
Different CL groups with metamorphic zone, p-T conditions (data from [27]), initial CL bands and CL colors. Grt: garnet zone, St: staurolite zone, Ky: kyanite zone, Ky-sil-ms: kyanite-sillimanite-muscovite zone; Grt-cd-sill-ksp: Garnet-cordierite-sillimanite-K-feldspar zone.
| Group/Sample | Metamorphic Zone | Temperature Zone | Pressure Zone | Initial CL Color | Initial CL Bands |
|---|---|---|---|---|---|
| Group 1 | Grt-crd-sil-Kfs | 750 ± 30 °C | 4.0–5.5 kbar | Intense blue | 450 nm |
| Group 2 | Grt, St, Ky, Ky-sil-ms | 500 ± 30 to 650 ± 20 °C | 9 ± 1.5 kbar | Short-lived Blue-green | 450 nm, 500 nm, 650 nm |
| GK 97-124 | Grt | 500 ± 30 °C | 9 ± 1 kbar | Weak blue | 450 nm, 650 nm |
© 2018 by the authors. Licensee MDPI, Basel, Switzerland. This article is an open access article distributed under the terms and conditions of the Creative Commons Attribution (CC BY) license (http://creativecommons.org/licenses/by/4.0/).
Share and Cite
MDPI and ACS Style
Sittner, J.; Götze, J. Cathodoluminescence (CL) Characteristics of Quartz from Different Metamorphic Rocks within the Kaoko Belt (Namibia). Minerals 2018, 8, 190. https://doi.org/10.3390/min8050190
AMA Style
Sittner J, Götze J. Cathodoluminescence (CL) Characteristics of Quartz from Different Metamorphic Rocks within the Kaoko Belt (Namibia). Minerals. 2018; 8(5):190. https://doi.org/10.3390/min8050190
Chicago/Turabian StyleSittner, Jonathan, and Jens Götze. 2018. "Cathodoluminescence (CL) Characteristics of Quartz from Different Metamorphic Rocks within the Kaoko Belt (Namibia)" Minerals 8, no. 5: 190. https://doi.org/10.3390/min8050190
Note that from the first issue of 2016, this journal uses article numbers instead of page numbers. See further details here.