The Hydrothermal Breccia of Berglia-Glassberget, Trøndelag, Norway: Snapshot of a Triassic Earthquake
by
Axel Müller
1,2,*, 
Morgan Ganerød
3,
Michael Wiedenbeck
4,
Skule Olaus Svendsen Spjelkavik
5 and
Rune Selbekk
† 1
Natural History Museum, P.O. Box 1172 Blindern, 0318 Oslo, Norway
2
Natural History Museum of London, Cromwell Road, London SW7 5BD, UK
3
Geological Survey of Norway, P.O. Box 6315 Torgard, 7491 Trondheim, Norway
4
German Research Center for Geosciences (GFZ), Telegrafenberg, 14473 Potsdam, Germany
5
Department of Archaeology and Cultural History, NTNU University Museum, NO-7491 Trondheim, Norway
*
Author to whom correspondence should be addressed.
†
Deceased 4 December 2017.
Minerals 2018, 8(5), 175; https://doi.org/10.3390/min8050175
Submission received: 26 February 2018
/
Revised: 16 April 2018
/
Accepted: 17 April 2018
/
Published: 23 April 2018
(This article belongs to the Special Issue Mineralogy of Quartz and Silica Minerals)
Abstract
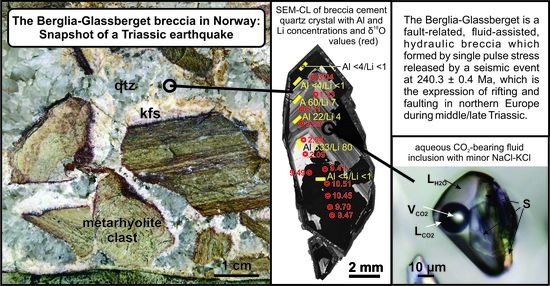
:The quartz-K-feldspar-cemented breccia of Berglia-Glassberget in the Lierne municipality in central Norway forms an ellipsoid structure 250 m × 500 m in size. The hydrothermal breccia is barren in terms of economic commodities but famous among mineral collectors for being a large and rich site of crystal quartz of various colours and habits. Despite being a famous collector site, the mineralization is rather unique in respect to its geological setting. It occurs within Late Palaeoproterozoic metarhyolites of the Lower Allochthon of the Norwegian Caledonides regionally isolated from any other contemporaneous hydrothermal or magmatic event. In order to understand better the formation of the Berglia-Glassberget breccia, the chemistry, fluid inclusion petrography and age of the breccia cement were determined. Structural features indicate that the Berglia-Glassberget is a fault-related, fluid-assisted, hydraulic breccia which formed by single pulse stress released by a seismic event. 40Ar-39Ar dating of K-feldspar cement revealed a middle Triassic age (240.3 ± 0.4 Ma) for this event. The influx into the fault zone of an aqueous CO2-bearing fluid triggered the sudden fault movement. The high percentage of open space in the breccia fractures with cavities up 3 m × 3 m × 4 m in size, fluid inclusion microthermometry, and trace element chemistry of quartz suggests that the breccia was formed at depths between 4 and 0.5 km (1.1 to 0.1 kbar). The origin of the breccia-cementing, CO2-bearing Na-HCO3-SO4 fluid may have been predominantly of metamorphic origin due to decarbonation reactions (T > 200 °C) of limestones of the underlying Olden Nappe. The decarbonation reactions were initiated by deeply derived, hot fluids channelled to sub-surface levels by a major fault zone, implying that the breccia is situated on a deep-seated structure. Regionally, the Berglia-Glassberget occurs at a supposed triple junction of long-lived fault zones belonging to the Møre-Trøndelag, Lærdal-Gjende and the Kollstraumen fault complexes. These fault systems and the associated Berglia-Glassberget earthquake are the expression of rifting and faulting in northern Europe during the middle/late Triassic.
1. Introduction
Breccias are fragmented rocks which are commonly found in the highest, most fluid-saturated part of the crust, where brittle deformation is dominant e.g., [1,2]. They occur across a wide range of settings: sedimentary breccia, impact breccia, fault breccia (gouge, cataclasite, pseudotachylite), hydrothermal breccia, hydrothermal-magmatic breccia, and purely magmatic breccia. The study of mineralized hydrothermal and hydrothermal-magmatic breccias have been of major interest for ore deposit research due to their potential of hosting economic mineralization, e.g., [3,4,5,6] whereas studies of non-mineralized breccias are more scarce. However, understanding the nature and genesis of breccias is important not only economically but also in the context of regional tectonics and earthquake prediction. Brecciated fault zones, for example, preserve a rich historical record of seismic faulting; a record that is yet to be fully studied and understood e.g., [2,7,8,9,10,11].
Breccia bodies exhibit diverse features and are general characterized by: (1) the chemistry, mineralogy and texture of the breccia cement; (2) the nature (lithology, frequency, size, habit, etc.) of the fragments; and (3) the geometry and dimension of the breccia bodies. Genetic aspects like the degree of involvement of magmatic processes and the depth of formation may provide additional information to define hydrothermal and hydrothermal-magmatic breccias, in particular. Classifications of these breccia types commonly include both partly genetic and purely descriptive nomenclature, as discussed by [3,12,13].
In this contribution, the hydrothermal breccia of Berglia-Glassberget in Trøndelag, Norway, is studied. The Berglia-Glassberget breccia is barren in terms of economic commodities but famous among mineral collectors for being a large and rich site of high-quality crystal quartz of various colours and habits found in open cavities [14,15,16]. The mineralization is rather unique in respect to its geological setting: it occurs within Late Palaeoproterozoic rocks of the Lower Allochthon of the Norwegian Caledonides, regionally isolated from any other contemporaneous hydrothermal or magmatic activities. The breccia formation post-dates the Caledonian deformation and a hydrothermal mineralization of such young age (<390 Ma) has not been described from central Norway. The aims of this study are to better understand the formation of the Berglia-Glassberget breccia in terms of pressure-temperature-composition (P-T-X) conditions, the origin of breccia-cementing fluids, the age of breccia, and the circumstances which have led to the breccia formation. Finally, the results are discussed and evaluated to place the breccia-forming event in a regional context.
2. Regional Geology and Characteristics of the Berglia-Glassberget Breccia
Geographically the quartz-K-feldspar cemented breccia of Berglia-Glassberget is situated in the Lierne municipality in the Trøndelag county of central east Norway (Figure 1). The breccia is hosted by Late Paleoproterozoic mylonitic (very fine-grained), greyish to pinkish metarhyolite of the Formofoss Nappe Complex. The upper greenschist facies Formofoss Nappe Complex represents the upper unit of the Lower Allochthon of the Norwegian Caledonides which overlies the lower greenschist facies Olden Nappe [17,18]. Both nappes form the Grong-Olden Culmination [19] where the Berglia-Glassberget breccia is situated at its eastern edge. The breccia is in the hanging wall of a gentle SE plunging anticline formed by rocks of the Olden Nappe, a few meters above the thrust fault which separates the Olden Nappe and the overlying Formofoss Nappe (Figure 2).
The metarhyolite at Berglia-Glassberget is affiliated to the Transscandinavian Igneous Belt (TIB) [18,21,22,23,24], which comprises a giant elongated array of batholiths extending c. 1400 km along the Scandinavian Peninsula from southeasternmost Sweden to Troms in north-western Norway [25,26]. The TIB documents more or less continuous and voluminous magmatic activity between 1850 to 1630 Ma, which developed between the Svecofennian (1920–1790 Ma) [27] and Gothian orogenesis (1640-1520 Ma) [28]. The TIB-related Blåfjellhatten granite constituting the major part of the Olden Nappe west of the Berglia-Glassberget breccia has an emplacement age of 1633.2 ± 2.9 Ma [24] (Figure 1).
The breccia forms a c. 250 × 500 m large, ellipsoid structure (Figure 2) comprising a dense network of randomly orientated, breccia-filled, mainly quartz-cemented and subordinate K-feldspar-cemented fractures (3 cm to 4 m wide). The breccia structure crops out at altitudes ranging from 550 m above sea level (a.s.l.) in the SW to 600 m a.s.l. in the NE. Most of the area is covered with post-glacial soil, woods and swamps. The upper part of the deposit is close to the tree line. The area of most intense brecciation is found in the SW of the structure which is named breccia center in the following. In the center the fragmented metarhyolite is strongly silicified and dark grey to black in colour instead of pinkish grey. The borders of the breccia structure are transitional: the fractures getting thinner and less common with increasing distance from the breccia center.
The randomly orientated fractures hosting hydrothermal breccias are mainly matrix-supported except parts of the breccia center, with 0 to 75 vol % clasts, 25 to 100 vol % matrix, and 0 to 80 vol % open space (cavities). The lithology of the breccia fragments is exclusively metarhyolitic (monomictic) corresponding to the closest wall rock (Figure 3A,B). The size of clasts is highly variable ranging from millimeter-scale to meter-scale. Most clasts are angular, often platy-shaped due to preferentially rock-splitting along foliation planes.
Most of the larger cavities (>0.1 m3) collapsed shortly after formation and are filled with clay. The cavities contain quartz crystals of varying quality, mostly milky quartz with common crystal sizes of 0.5 to 5 cm. The deposit produced high quantities of collector quality crystal quartz specimen of different colour and habit over a period of about 100 years [14,15,16,29,30,31,32,33,34,35]. The northeastern part of the mineralization has been known by local mineral collectors since its discovery. In the 1980s and 90s collectors as Inge Rolvsen, Egil Skaret and Harald Kvarsvik started to take out quartz crystals for the mineral collector market. In the late 1990s Lars Jørgensen leased the area for systematic collection of specimens. In 2005 large cavities (up to 3 m × 3 m × 4 m in size) with smoky quartz were discovered in the southwestern part of the breccia structure (Figure 3C,D and Figure 4A). Since than there has been a lot of collection activity by amateurs. It is still possible to find good quartz specimens in the area. Before sampling, one of the land owners, Arne Jostein Devik ([email protected]), has to be contacted. Despite the intense collection activities there is unfortunately very little documentation and literature about the mineralization [16].
The volume proportion of flesh-coloured K-feldspar cement (var. adularia) in the breccia veins increases from the breccia center from 5 vol % to up to 100 vol % towards NE and SE of the mineralized area. K-feldspar crystallized prior to quartz and covers the fracture and cavity walls and breccia fragments (Figure 3A,B). In open cavities K-feldspar may form euhedral crystals up to 1 cm in size (Figure 4B).
Most of the cavities contain clear whitish to greyish crystal quartz. Smoky quartz of different shades occurs in the central part of the mineralization (Figure 4C). The largest smoky quartz crystals which have been found were about 30 cm × 10 cm in size and the largest clear quartz crystals are up to 10 cm × 2 cm in size. The largest quartz crystal cluster on a metarhyolite fragment recovered from the large cavity in 2005 weights 1.8 ton and is now part of the collection of the Natural History Museum of Oslo (NHM collection nr. KNR 43853). Scepter quartz and one Japanese twin crystal (Figure 4D) have been found as well as smaller pockets filled with double-termed moron crystals. Calcites of different shapes and colours have been found in some cavities. In addition, albite, galena, rutile, and laumontite have been recorded. Albite is one of last phases crystallized (up to 3 mm in size) and forms crystal lawns on quartz crystal faces. A single find of galena grown on smoky quartz has been described.
According to the exposed textures the process responsible for the formation of the Berglia-Glassberget breccia can be described as a fluid-assisted hydraulic brecciation initiated by a single pulse stress e.g., [36]. The Berglia-Glassberget breccia has not been affected by Caledonian deformation and, thus, post-dates the Caledonian orogenesis. Of particular interest is the fact that there is no other known tectonic, hydrothermal or magmatic activity in the area which can be related to the breccia formation.
3. Sampling and Methods
3.1. Sampling
The sampling was performed in 2012 and covered the entire brecciated area (Figure 2). The samples include breccia-related quartz crystals and K-feldspar, bulk rock samples of the host rock, and samples exhibiting representative breccia textures. The quartz samples were prepared as: (1) double-polished wafers (c. 250 µm) for fluid inclusion microthermometry; and (2) as polished thick sections (c. 300 µm thick) clued on standard glass slides 2.8 cm × 4.8 cm for laser ablation inductively plasma mass spectrometry (LA-ICP-MS) analysis. The bulk compositions of host rocks and K-feldspar were determined at ACME laboratories in Vancouver, Canada [37].
3.2. Scanning Electron Microscope Cathodoluminescence
The quartz crystals were studied with scanning electron microscope cathodoluminescence (SEM-CL) to visualize intra-granular growth zoning and alteration structures and to choose areas for LA-ICP-MS analysis. SEM-CL imaging reveals micro-scale (1 µm to 1 mm) growth zoning, alteration structures and different quartz generations which are not visible with other methods. Grey-scale contrasts visualized by SEM-CL are caused by the heterogeneous distribution of lattice defects (e.g., oxygen and silicon vacancies, broken bonds) and lattice-bound trace elements e.g., [38]. Although the physical background of the quartz CL is not fully understood, the structures revealed by CL give information about crystallisation, deformation and fluid-driven overprint. The used CL detector was a Centaurus BS bialkali-type attached to a LEO 1450VP analytical SEM based at the Geological Survey of Norway in Trondheim, Norway. The applied acceleration voltage and current at the sample surface were 20 kV and 2 nA, respectively. The SEM-CL images were collected from one scan of 43 s photo speed and a processing resolution of 1024 × 768 pixels and 256 grey levels. The brightness and contrast of the collected CL images were improved with PhotoShop software.
3.3. Fluid Inclusion Microthermometry
Fluid inclusion wafers were prepared from 2–3 cm long, euhedral quartz crystals originating from different cavities across the deposit. Microthermometric measurements of 23 fluid inclusions were performed on a calibrated Linkam MDSG 600 heating/freezing stage at NTNU Trondheim, Norway, using the software Linksys 32. All inclusions were rapidly cooled to −196 °C and held for one minute, then heated at a rate of 30 °C/min and held for one minute to ensure sufficient undercooling. A stepwise heating procedure was performed, during which the temperature was held for one minute at −50.0 °C and heated at 1 °C/min until ice melting was imminent. The inclusion was then cooled a few degrees to recrystallize the ice in order to observe the final melting temperature more accurately. In cases where Tmice was lower than the holding temperature, the inclusion was frozen again and holding temperature was adjusted.
3.4. Laser Ablation Inductively Coupled Plasma Mass Spectrometry
Concentrations of Li, Be, B, Mn, Ge, Rb, Sr, Na, Al, P, K, Ca, Ti, and Fe were determined by LA-ICP-MS at the Geological Survey of Norway in Trondheim. Five quartz crystals (1 to 3 cm in length) were cut central, parallel to the c-axis and prepared as surface-polished, 300-μm-thick sections mounted on standard glass slides or embedded in Epoxy in 25.4 mm diameter sample mounts. The analyses were undertaken on a double-focusing sector field inductively coupled plasma mass spectrometer, high resolution sector field ICP-MS, model ELEMENT XR from Thermo Scientific at the Geological Survey of Norway in Trondheim, Norway. The instrument is linked to a New Wave Excimer UP193FX ESI laser probe. The 193 nm laser had a repetition rate of 15 Hz, a spot size of 75 μm, and energy fluence about 5 to 6 J/cm2 on the sample surface. A continuous raster ablation on an area of approximately 150 µm × 300 µm was applied. The approximate depth of ablation was between 10 and 50 μm. An Hitachi CCD video camera, type KP-D20BU, attached to the laser system, was used to observe the laser ablation process and to avoid micro mineral and fluid inclusions. The carrier gas for transport of the ablated material to the ICP-MS was He mixed with Ar. The isotope 29Si was used as the internal standard applying the stoichiometric concentration of Si in SiO2. External multistandard calibration was performed using three silicate glass reference materials produced by the National Institute of Standards and Technology, USA (NIST SRM 610, 612, 614, and 616). In addition, the applied standards included the NIST SRM 1830 soda-lime float glass (0.1% m/m Al2O3), the certified reference material BAM No. 1 amorphous SiO2 glass from the Federal Institute for Material Research and Testing in Germany, and the Qz-Tu synthetic pure quartz monocrystal provided by Andreas Kronz from the Geowissenschaftliches Zentrum Göttingen (GZG), Germany. Certified, recommended, and proposed values for these reference materials were taken from Jochum et al. [39] and from the certificates of analysis where available. For the calculation of P concentrations, the procedure of Müller et al. [40] was applied. Each measurement comprised 15 scans of each isotope, with the measurement time varying from 0.15 s/scan for K in medium mass resolution mode to 0.024 s/scan of, for example, Li in low mass resolution mode. An Ar blank was run before each reference material and sample measurement to determine the background signal. The background was subtracted from the instrumental response of the reference material/sample before normalization against the internal standard in order to avoid effects of instrumental drift. This was carried out to avoid memory effects between samples. A weighted least squares regression model, including several measurements of the six reference materials, was used to define the calibration curve for each element. Ten sequential measurements on the BAM No.1 SiO2 quartz glass were used to estimate the limits of detection (LOD) which were based on 3 × standard deviation (3sd) of the 10 measurements.
3.5. 40Ar/39Ar Dating of K-Feldspar
The K-feldspar sample (12071216; for origin see Figure 2) was crushed, grounded and subsequently sieved to obtain 180–250 μm fraction. The fraction was washed in acetone and deionized water several times and finally handpicked under a stereomicroscope. Mineral grains with coatings or inclusions were avoided. The sample was packed in aluminum capsules together with the Taylor Creek Rhyolite (TCR) flux monitor standard along with pure (zero age) K2SO4 and CaF2 salts. The sample was irradiated at IFE (Institutt for Energiteknikk, Kjeller, Norway) for c. 140 h with a nominal neutron flux of 1.3 × 10¹³ n × (cm−2 × s−1). The correction factors for the production of isotopes from Ca were determined to be (39Ar/37Ar)Ca = (3.07195 ± 0.00784) × 10−3, (36Ar/37Ar)Ca = (2.9603 ± 0.026) × 10−4 and (40Ar/39Ar)K = (1.3943045 ± 0.0059335) × 10−1 for the production of K (errors quoted at 1sd). The sample was put in a 3.5 mm pit size aluminum sample disk and step heated using a defocused 3.5 mm laser beam with a uniform energy spectrum (Photon Machines Fusions 10.6 at the Geological Survey of Norway, Trondheim). The extracted gases from the sample cell were expanded into a two stage low volume extraction line (c. 300 cm3), both stages equipped with SAES GP-50 (st101 alloy) getters, the first running hot (c. 350 °C) and the second running cold. They were analyzed with an automated Mass Analyzer Products Limited (MAP) 215–50 mass spectrometer in static mode, installed at the Geological Survey of Norway. The peaks and baseline (AMU = 36.2) were determined during peak hopping for 10 cycles (15 integrations per cycle, 30 integrations on mass 36Ar) on the different masses (41–35Ar) on a Balzers electron multiplier (SEV 217, analogue mode) and regressed back to zero inlet time. Blanks were analyzed every third measurement. After blank correction, a correction for mass fractionation, 37Ar and 39Ar decay and neutron-induced interference reactions produced in the reactor was applied using in-house software AgeMonster, written by M. Ganerød. It implements the equations of McDougall and Harrison [41] and the newly proposed decay constant for 40K after Renne et al. [42]. A 40Ar/36Ar ratio of 298.56 ± 0.31 from Lee et al. [43], was used for the atmospheric argon correction and mass discrimination calculation using a power law distribution. We calculated J-values relative to an age of 28.619 ± 0.036 Ma for the TCR sanidine flux monitor [42]. We define a plateau according to the following requirements: at least three consecutive steps overlapping at the 95% confidence level (1.96σ) using the strict test:
≥50% cumulative 39Ar released, and mean square of weighted deviates (MSWD) less than the two tailed student T critical test statistics for n − 1. Weighted mean ages were calculated by weighting on the inverse of the analytical variance.
3.6. Secondary Ion Mass Spectrometry
We conducted δ18O profiles on the tree quartz crystals 12071206, 12071215 and 1207127; each crystal was embedded in Epoxy in its own individual 25.4 mm diameter sample mount and the given crystal was sectioned by polishing. Surface quality was judged using an optical microscope at high magnification and the total roughness of the sample surfaces were judged to be no more than a couple of micrometers. Thus, along with a separate sample block for calibration materials, there were four such mounts employed for our oxygen isotope determinations. Prior to conducting the δ18O analyses each crystal was imaged in monochromatic cathode luminescence after which the sample mount was ultrasonically cleaned in high-purity ethanol, was coated with a 35 nm thick, high-purity gold film and was place in a low magnetic susceptibility sample holder and held in place using brass tension springs.
Our Secondary Ion Mass Spectrometry (SIMS) analyses were conducted using the Cameca 1280-HR) instrument in Potsdam using a ~2 nA Gaussian 133Cs+ primary beam that was focused to an ~5 µm diameter on the sample’s surface. Each analysis was preceded by a 70 s preburn using a 20 µm raster. Low energy electron flooding was used for charge compensation, with the total electron current <1 µA. During data acquisition our primary beam was rastered over a 10 µm × 10 µm area in order to reduce isotopic drift during the analysis; this rastering was compensated using the dynamic transfer capability of the 1280-HR’s extraction optics. Our mass spectrometer was operated in static multi-collection mode with a mass resolution of M/ΔM ≈ 1900 at 10% peak height, which is adequate to remove all significant isobaric interferences. The 16O− count rate was measured using our L2’ Faraday cup in conjunction with an e+10 Ω resistor, whereas the 18O− count rate was measured using our H2’ Faraday cup in conjunction with an e+11 Ω resistor. An analysis consisted of 20 integrations each lasting 4 seconds; hence a single δ18O analysis, including preburn and automated centring routines, took nearly 3 min. Total sampling mass consumed during data collection was ~260 pg as determined by volume estimates based on white light profilometry. In Figure 5 the 3D surface topographic map of a sputtering crater is shown. All data were collected during a single session lasting 6.3 h, during which we acquired 37 determinations on our quartz samples in addition to 47 calibration runs.
We used the quartz sand reference material NBS28 in order to calibrate our absolute δ18O values; this material has a published value of δ18OVSMOW = 9.57 ± 0.10‰ (1sd) [44]. We have used an absolute value for the zero-point on the Vienna Standard Mean Ocean Water (VSMOW) delta-scale set at 18O/16O = 0.00200520 [45], which we have directly transferred to the zero-point value for the VSMOW scale. A total of 31 determinations were made on NBS28. We also checked for the presence of analytical drift by analysing a piece of NIST SRM 610 silicate glass a total of 16 times; this glass is believed to be homogeneous in its δ18O composition at the sub-nanogram scale. The piece of polished NIST SRM 610 was embedded in epoxy alongside the NBS28 quartz reference material. No analytical drift could be detected during the course of our run, reflected by an analytical repeatability for the determined 18O−/16O− ratio of ±0.095‰ (1sd) on the glass. Our analytical series consisted of multiple analyses on the reference sample mount, followed by a full profile on the 12071206 quartz, followed by multiple analyses again on the reference mount and so on, until all three quartz crystals had been analyzed.
Within run uncertainties based on the standard error from the 20, four second integrations were typically around ±0.05‰, whereas the analytical repeatability on the NIST SRM 610 glass was ±0.095‰. An additional source of uncertainty in the δ-values obtained on our three quartz crystals is the assigned uncertainty of ±0.10‰ (1sd) given on the NBS28 reference sheet (IAEA, 2007). Combining all of these uncertainty sources, we estimate that the total analytical uncertainty on our individual δ18O determinations to be circa ± 0.14‰ (1sd). The repeatability on the N = 31 determinations of the NBS28 quartz sand was ± 0.32‰ (1sd), which is consistent with the level of heterogeneity reported previously for this material when evaluated at the sub-nanogram sampling scale [46].
4. Results
4.1. Chemistry of the Breccia Host Rock
The pinkish grey, very fine-grained metarhyolite, which hosts the breccia, shows a strong mylonitic foliation. Macroscopically feldspars, quartz and biotite are identified. Recrystallized biotite is strongly elongated and stretched parallel to the foliation plane. Five samples of the metarhyolite were selected for major and trace element analysis, which were performed at ACMELabs [37] (Table 1). On the total alkali oxide vs. silica (TAS) diagram (Figure 6A), the unaltered metarhyolites fall in the rhyolite field, but from sampling over a larger area some of the felsic rocks were found to fall in the trachyte field [23]. Compositions overlap with the undeformed Blåfjellhatten granite exposed in the adjacent (2 km to the west) Olden Nappe [24]. Two metarhyolite samples (12071212, 12071213) have very high SiO2 (>93 wt %) due to intense silicification caused by infiltration of breccia-cementing fluids. The occurrence of silicified metarhyolite is limited to the breccia center (Figure 2). On the molar ratio Al2O3/(CaO + Na2O + K2O) (A/CNK) versus Al2O3/(Na2O + K2O) (A/NK) diagram, the unaltered samples are classified as weakly peraluminous I-type granitoids, as in the case of the spatially related Blåfjellhatten granite [24] and the associated felsic volcanic rocks [23] (Figure 6B). The high-K, alkali Berglia-Glassberget metarhyolite has an A-type composition according to Whalen et al. [47] (Figure 6C).
The Nb-Y and Rb-(Y + Nb) diagrams (not shown) of Pearce et al. [48] both show that the Berglia-Glassberget metarhyolite plots in the field for within-plate granites. Within-plate granites are equivalent to the A-type, that is, anorogenic granites e.g., [47]. The relatively high large ion lithophile and high field strength element abundances in the metarhyolite analyses do confirm the A-type characteristics. For further chemical subdivision of the anorogenic granitoids, the diagrams devised by Eby [49] are useful in pointing to the likely source of the magmas. The Rb/Nb vs. Y/Nb plot (not shown), for example, classifies the Berglia-Glassberget metarhyolite in the field (A2) for magmas derived by partial melting of a continental crust that had probably been through a cycle of subduction-zone magmatism [49].
In the Upper continental crust-normalized diagram of selected incompatible elements (Figure 6D) K, Ba and Rb in the silicified samples are extremely depleted together with Th, Nb and Ta, indicating that mainly K-feldspar was leached out by the breccia-forming fluid. These elements are enriched in the unaltered samples compared to average upper crust composition. The adjacent Blåfjellhatten granite has a similar incompatible element signature suggesting a genetic relationship. The Berglia-Glassberget metarhyolite possibly represents the volcanic expression of the Blåfjellhatten granite. In summary, the geochemical data show that the Berglia-Glassberget metarhyolite magma derived from a fairly, but not markedly evolved, crustal source in a continental, extensional and probably anorogenic setting which is typically for TIB granites.
4.2. Chemistry and Age of the K-Feldspar Cement
The average composition of the K-feldspar cement of the Berglia-Glassberget breccia is given in Table 2. The K-feldspar has relative pure orthoclase composition An1.6Ab0.7Or97.7 with high Rb (792 µg/g), Ba (1937 µg/g) and Th (77 µg/g) and relative low Sr (70 µg/g). The trace element concentrations are generally higher compared to the chemistry of low-temperature K-feldspar from other hydrothermal vein deposits [52,53]. The composition is, however, similar to K-feldspar found in moderately evolved granitic rocks e.g., [54].
The main results of the 40Ar/39Ar dating of the K-feldspar cement and the age spectrum and inverse isochron plots are displayed in Table 3 and Figure 7. The raw degassing experiments, corrected for blanks, can be found in the Supplementary Materials Table S1. The degas pattern shows climbing apparent ages in the first part of the heating experiment and stabilize into a plateau from steps 19–25 (Figure 7A). From those steps an inverse weighted mean plateau age (WMPA) of 240.3 ± 0.4 Ma (MSWD = 0.589, P = 0.739) is calculated. The same steps yield an inverse isochron age (Figure 7B) of 240.2 ± 3.9 (MSWD = 0.765, P = 0.575) with a trapped 40Ar/36Ar ratio of modern atmospheric value [43], thus, an excess 40Ar component in the spectrum can be ruled out. Given the similarities between the apparent ages from the WMPA and the inverse isochron determinations, we interpret the WMPA as the best age estimate of these K-Feldspars.
4.3. SEM-CL and Chemistry of the Quartz Cement
Applying SEM-CL imaging quartz crystals of the breccia cement show complex intra-granular growth structures (Figure 8). All investigated crystals have a relative homogeneous, bright luminescent core, with only a few oscillatory zones of low contrast. Oscillatory growth zones with less intense CL become more and more prominent towards the grain margin. The outermost growth zones are almost non-luminescent and appear black in SEM-CL images. Sector zoning is typically developed (Figure 8E). Sector zoning refers to a compositional difference between coeval growth sectors in a crystal and results from differences in fluid-crystal element partitioning between nonequivalent faces of the crystal. The growth and sector zoning, generally considered as primary structures, are superimposed by dull to non-luminescent healed microfractures associating patchy domains of recrystallized quartz. The patchy domains are abundant in sample 12071217 occupying about 1/3 of the crystal volume (Figure 8D). These superimposing textures are considered as secondary quartz and formed after quartz crystallization.
Trace elements of five quartz crystals (1 to 3 cm in length) originating from five different cavities were analyzed by LA-ICP-MS. Six analyses were performed on each crystal (Table 4, Figure 8). Sample 12071215 (smoky quartz) originates from a cavity in the center of the brecciated area, samples 12071217 and -18 from the SE and samples 12071204 and -06 from NE of the breccia structure (Figure 2). Concentrations of Be, B, Ge, Rb, Na, P, K, Ca, Ti, and Fe are mostly below the LOD and are not provided (LOD: Be = 0.5, B = 1.4, Ge = 0.07, Rb = 0.1, Na = 7.9, P = 5.0, K = 20.4, Ca = 6.3, Ti = 0.5, Fe = 0.5). Aluminium, Li, Mn, and Sr are the only elements which have concentrations consistently higher than the LODs (Table 4).
Aluminium concentrations show an extreme data spread ranging from <4 to 2471 µg/g. The data spread within one crystal can be similar as the concentration range of the entire data set (sample 12071218). Aluminium concentrations >1000 µg/g have been described previously from hydrothermal quartz but seem not so common considering published data [55,56,57,58,59]. In addition to Al the studied quartz is strongly enriched in Li. Concentrations vary from <1 µg/g to 319 µg/g; highest Li is observed in sample 12071218. The Li enrichment is stronger than, for example, in quartz of Li-enriched granites of the Land’s End pluton in Cornwall, UK [60] and Li-rich pegmatites of the Tres Arroyos granite-pegmatite suite, Spain [61] (Figure 9A). In the Al versus Li plot of Figure 9A the data show a weak positive correlation due to the substitution Si4+↔Al3+ + Li+, where Al replaces Si in the tetrahedral site and Li+ enter interstitial lattice position e.g., [62]. Higher Li values plot close to the 2:1 Al:Li atomic ratio line indicating that about half of the Al3+ defects are charged compensated by Li+; alternative charge compensator are H+, Na+, or K+. Non-luminescent, secondary quartz, which is most prominent in sample 12071217, is strongly depleted in both Al and Li, whereas growth zones with bright CL have high concentrations of both elements. The correlation of high Al and Li with bright CL has been described previously from hydrothermal quartz by Ramseyer and Mullis [63] and Jourdan et al. [59].
Manganese concentrations vary between <0.2 to 0.6 µg/g and do not show correlations with Al or Li. Strontium concentrations range from <0.03 to 0.18 µg/g. Germanium is mostly below the LOD of <0.07 µg/g except for sample 12071215 where Ge values rise up to 15 µg/g.
Titanium concentrations are consistently below the LOD of 0.5 µg/g. For illustration, Ti concentrations (≤0.5 µg/g; hatched area in Figure 9B) plotted in the logarithmic Ti and Al diagram according to Rusk [58] for comparison with data of c. 30 porphyry-type, orogenic Au, and epithermal deposits (colour-shaded fields in Figure 9B). The diagram is used to fingerprint the type of ore deposit based on the trace element composition of quartz. Data from Berglia-Glassberget overlap with epithermal deposits which confirm the hydrothermal nature of the Berglia-Glassberget breccia.
4.4. Petrography and Microthermometry of Fluid Inclusions
About 150 inclusions in quartz crystals from 5 different cavities of the Berglia-Glassberget breccia were examined. Microthermometric measurements were performed on representative 23 fluid inclusions based on the observation that only three genetically related types of pseudosecondary fluid inclusion were identified (Table 5; secondary inclusions are not considered):
Type I: Inclusions occur in small three-dimensional clusters or in short trails preferentially in the core of euhedral crystals. For these inclusions a pseudosecondary origin is suggested [64]. The aqueous fluid of the inclusions contains two-phase bubbles (liquid and gaseous CO2) occupying 25–40 vol % of the inclusion at room temperature (Figure 10A). The presence of CO2 was confirmed by Raman spectrometry performed at German Research Center of Geosciences in Potsdam (GFZ), Germany (Rainer Thomas, personal communication). Type I inclusions contain several types of relative large solids (5–25 µm) most of them have been identified as nahcolite and alkali sulphates by Raman spectroscopy. The group shows a narrow range of ice melting temperatures, from −0.4 to −0.6 °C, and liquid homogenization, from 242 to 248 °C. First melting was observed at −24 to −22 °C, implying some K+ in addition to Na+ [65]. Salinities are low, 0.7 to 1.0 NaCl wt % equivalent. Assuming a pressure during breccia formation of 1.1 to 0.1 kbar the trapping temperature of these fluid inclusions would be between 247 and 329 °C (utilizing the HokieFlincs_H2O-NaCl spreadsheet by Steele-MacInnis et al. [66]).
Type II: Inclusions occur in short trails or in lineations ending at intra-granular growth zones. For these inclusions an early pseudosecondary origin is suggested [64]. These inclusions contain smaller bubbles than type I inclusions and one or two solids at room temperature (Figure 10B). The solids were identified with Raman spectrometry as nahcolite and sulphates (Rainer Thomas, personal communication). Th and Tmice vary between 203 to 214 °C and −29 to −24 °C, respectively. The ice melt temperatures range from −4.6 to −0.4 °C and calculated salinities (according to Steele-MacInnis et al. [66]) vary from 0.4 to 7.3 NaCl wt % equivalent. One inclusion displayed clathrate formation with a melting temperature of 2.2 °C.
Type III: Inclusions contain aqueous liquid and vapor, and occasionally needle-like solids identified as nahcolite (Figure 10C). They occur in short trails ending at intra-crystal growth zones. These inclusions are also interpreted to be pseudosecondary [64]. Type III has Th from 136 to 189 °C. Tmice shows a wide range from −8.9 and 19.2 °C due to clathrate formation in some inclusions. The ice melt temperatures for non-clathrate-forming inclusions range from −8.9 to −0.2 °C and those for clathrate-forming inclusions 2.2 to 19.2 °C. Salinities of non-clathrate-forming inclusion vary from 0.4 to 12.7 NaCl wt % equivalent. Two Tm of clathrates exceed the maximum temperature of 10 °C in the H2O-CO2 system, and these may reflect clathrate metastability or the presence of other gases e.g., CH4 [67].
Summarizing, the breccia was cemented by K-feldspar and quartz which crystallized from an aqueous CO2-bearing Na-HCO3-SO4 fluid with very minor Cl. However, primary fluid inclusion could not be identified. The crystallization temperature consistently decreases, whereas the salinity consistently increases from type I to type III inclusions.
4.5. Oxygen Isotope Geochemistry of Quartz
The results of SIMS oxygen isotope measurements are provided in Table 6, and the full SIMS data set including the results of the calibration runs is given in the electronic Supplementary Materials Table S1. Profiles of δ18O values across three selected quartz crystals (12071206, 12071215, 12071217) are plotted in Figure 11A–C and the locations of measurement spots are indicated in Figure 8. Figure 11D–F illustrate the δ18O variation in form of histograms.
The measured δ18O values display a large variation from 0.9 to 12.2‰ δ18O. Highest δ18O values are observed across the entire 12071215 crystal from the breccia center (mean 10.8 ± 1.1‰; n = 12) and in the late secondary, non-luminescent quartz, overprinting crystal 12071217 (mean 9.8 ± 0.5‰; n = 6). Average isotope ratios of crystals form the breccia margin are much lower: 3.8 ± 2.4‰ δ18O for crystal 12071206 and 2.4 ± 0.7‰ δ18O for 12071217 (excluding δ18O values of secondary formed quartz). Thus, the δ18O values in quartz decrease considerably from the center towards the margin of the breccia. In contrast to the relative consistent isotope ratios of primary precipitated quartz of crystals 12071215 and 12071217 (not considering secondary quartz in crystal 12071217), the δ18O values in 12071206 display two composition steps (Figure 11C). The first step (in growth direction) from 5.6 ± 0.4‰ to 1.3 ± 0.7‰ corresponds to the transition from the homogeneous crystal core to the crystal margin rich in oscillatory growth zoning as documented in the CL images (Figure 8B). The second step is marked by the outermost, non-luminescent growth zone in which the isotope ratio increases abruptly to 6.6 ± 0.3‰.
In addition to the documented large-scale δ18O variations controlled by the quartz-forming fluid, there is a subordinate systematic difference between different, adjacent crystal growth faces. Different growth faces are visualized in CL in the form of sector zoning (Figure 8). Examples of this variation are displayed in the bottom of crystal 12071215 (Figure 8C), where δ18O values in one zone are 10.5 ± 0.5‰ (n = 3) and in the adjacent zone 11.9 ± 0.1‰ δ18O (n = 2), and in the top of crystal 12071217 (Figure 8D), where one sector zone has 1.3‰ and the neighboring zone 2.6 ± 0.7‰ δ18O (n = 2). The observed δ18O differences in adjacent crystal faces are between 0.6 to 2.1‰, which are in the same range as δ18O differences described by Onasch and Vennemann [68] and Jourdan et al. [59] from hydrothermal quartz. No correlation was found between δ18O values and quartz trace element contents in the three quartz crystals that sere analyzed.
5. Discussion
5.1. Processes Responsible for the Formation of the Berglia-Glassberget Breccia
The structural characteristics described above classify the Berglia-Glassberget mineralization genetically as fault-related, fluid-assisted hydraulic breccia formed by a single pulse stress typically for upper crust levels e.g., [1,36]. Such fault rocks represent implosion breccias, formed by the ‘sudden creation of void space and fluid pressure differentials at dilational fault jogs during earthquake rupture propagation’ [2]. This implosion forms commonly fitted-fabric to chaotic fault breccias, cemented by hydrothermal fluids e.g., [36,69,70,71,72,73,74]. The implosion hypothesis envisages that faulting-induced voids are transient and filled coseismically by a dilated mass of rock fragments. The dilation breccias probably formed during the seismic event of strike-slip displacement on an irregular fault.
The influx of fluids into fault zones can trigger short-term weakening mechanism that facilitate fault movement and earthquake nucleation by reducing the shear stress or frictional resistance to slip e.g., [75]. Crustal fluids can be trapped by low-permeability sealed fault zones or stratigraphic barriers. The development of fluid overpressures at the base of the fault zone can help to facilitate fault slip, which was likely the cause for the Berglia-Glassberget breccia formation. Once the barrier is ruptured by an earthquake, permeability increases and fluids are redistributed from high to low pressure areas. In this model, a fault is considered to act as a valve [76,77].
The seismic energy released by brittle failure lead to rapid, seconds-long, fragmentation and dilation of at least 30 million m3 of metarhyolitic rock at Berglia-Glassberget. Hydraulic fracturing was mainly responsible for the rock fragmentation. The breccia was resealed soon after the seismic event by quartz and K-feldspar cement. The very high Al and Li concentrations in the quartz cement suggest disequilibrium growth, meaning that the quartz crystallized very fast, maybe in hours or days, so that impurities were incorporated as in large quantities as defect clusters during rapid crystal growth. The resealing strengthened the fractured rock, so that rebrecciation of the same volume is uncommon, except where repeated dilational strains are focused at fault bends or jogs [11,78]. The Berglia-Glassberget does not show evidence for rebrecciation or persistent refracturing and has been formed by a single seismic event. The single event of brecciation is evident from the occurrence of only one quartz cement generation as documented by similar trace element chemistry, CL structures and fluid inclusion assemblage. However, the nature of the regional fault structure remains unclear because of the overburden covering large areas of the studied locality (see also discussion below).
The proportion of open space (cavities) in brecciated fractures is up to 80 vol % in the breccia center. This high percentage of open space indicates that the hydrostatic pressure was much greater than the lithostatic pressure. In fact, the lithostatic pressure was so low that large cavities up to 3 m × 3 m × 4 m in size remained stable after the seismic event. The characteristics described above suggest that the brecciation took place at a maximum depth of about 4 km [1]. However, the post-late-Triassic erosion in the study area did not exceed 2 km as indicated by regional fission track analyses e.g., [79]; thus the formation depth of the Berglia-Glassberget breccia was presumably much less than 4 km.
5.2. Characteristics and Origin of Breccia-Forming Fluids
The observed fluid inclusion assemblage characterizes the breccia-forming fluid as aqueous CO2-bearing Na-HCO3-SO4 fluid with very minor Cl. The minimum temperature of the breccia-cementing fluid was in the range of 247 and 329 °C considering type I inclusions as being representative for the fluid pumped by the seismic event into the brecciation level and assuming a formation depth of 0.5 to 4 km (0.01 to 0.11 GPa). The crystallization of paragenetic, almost Na-free, low-temperature K-feldspar (var. adularia) and low Ti concentrations (<0.5 µg/g) in the quartz indicate formation temperatures of circa 350 °C or less [80,81,82]. Type II and type III inclusions record gradually decreasing crystallization temperatures and increasing salinity of a single-source fluid during progressing cement crystallization. The fluid leached K, Ba, Rb, Th, Nb and Ta from the metarhyolite in the SW part of shattered area (breccia center). The dissolved K, Ba, Rb and Th were preferentially transported to the periphery of the breccia structure where they precipitated mainly as breccia-cementing adularia. The element transport is recorded by the increasing K-feldspar/quartz cement ratio in the breccia faults towards the margin of the breccia structure. Such a leaching explains the composition of the K-feldspar cement; its composition is inherited from the leached, rock-forming K-feldspar of the metarhyolite.
The oxygen isotope ratios of breccia-cementing quartz display a large variation (0.9 to 12.2‰ δ18O) which can generally result from: (1) variations in temperature; (2) variations in the δ18O of the parent fluid; (3) disequilibrium effects; and (4) a combination of those three. Disequilibrium partitioning of oxygen isotopes (cause 3) causes δ18O variation in the range of 0.6 to 2.1‰ and, thus, has only a subordinate effect considering the overall variation of about 12‰. The high and relative consistent δ18O values of crystal 12071215 from the breccia center (10.8 ± 1.1‰) presumably reflect the initial oxygen isotope ratio of the breccia-cementing fluid. Such high δ18O values could be caused by any of these reservoirs: granitic rocks, metamorphic rocks or sedimentary rocks e.g., [83]. In any case, meteoric water can be excluded as the primary source of this oxygen. The average δ18O values in quartz decrease from the center towards the margin of the breccia, which is interpreted as dilution of the breccia-cementing fluid in heavy 18O during progressing fluid migration and accompanied quartz precipitation. A minor decrease in fluid temperature might also have contributed to the δ18O decrease. The sudden drop in δ18O in the overgrowth of crystal 12071206 is explained by the influx of “local” meteoric water during final quartz growth. However, this seems to be a special feature of this particular cavity because similar drops are not developed in the other two investigated crystals. The authors have no plausible explanation of the high δ18O values (9.8 ± 0.5‰) observed in the secondary quartz replacing primary quartz of crystal 12071217 and in the outermost growth zone of crystal 12071206 (6.6 ± 0.3‰).
In general, the origin of CO2 recorded in fluid inclusions of hydrothermal mineralization is still a matter of debate. Fluid inclusion and breccia characteristics indicate a deep-seated source for CO2 that could be of mantle, magmatic or metamorphic in origin. The source of CO2 in hydrothermal mineralization in metamorphic terranes has usually been considered as a relic of mantle and/or lower crustal (magmatic and/or metamorphic) fluids e.g., [69,84,85] that might have been channelled along through-going faults toward Earth’s surface [86] and/or transported to higher levels in the crust by magmas [87,88]. Devolatilisation of supracrustal sequences during prograde metamorphism is the widely accepted hypothesis for the origin of CO2 for a range of hydrothermal deposit types [69,89]. Alternatively, CO2-dominated fluids may exsolve from felsic magmas formed at depths greater than 5 km in the crust; they are a typical feature of intrusion-related deposits [88]. Furthermore, these fluids can also be associated with granulite facies metamorphism and with charnockitic magmatism [90,91].
In the case of the Berglia-Glassberget breccia the CO2 has most likely a metamorphic origin due to decarbonation reactions (T > 200 °C) of limestones in a thin autochthonous succession, the Bjørndalen Formation, lying unconformably upon the granitic and felsic volcanic rocks of the Olden Nappe. The Berglia-Glassberget breccia is situated immediately above a thrust fold anticline formed by the limestone-bearing autochthonous sequence (Figure 2). Thus, decarbonation reactions of this limestone might be the possible source of the CO2. This implies that low-grade metamorphism or hydrothermal activity initiated thermo-metamorphic reactions, involving silicate and carbonate rocks, took place in the middle Triassic. However, there was definitely no low-grade metamorphism in the area in the middle Triassic. The most plausible explanation is that CO2 was produced from limestone of the Bjørndalen Formation by hydrothermal reactions initiated by deeply derived, hot fluids channelled to sub-surface levels by a major fault zone. The high SO4 content probably relates to oxidation of sulfides of wall rocks through which the fluids was channelled.
5.3. The Formation of the Berglia-Glassberget Breccia in the Regional Context
Tectonic, hydrothermal or magmatic activities of Middle Triassic age have not been recorded in the vicinity of the Berglia-Glassberget mineralization which could be directly related to the breccia formation. In respect to Caledonian structures, the Berglia-Glassberget breccia is at the eastern edge of the Grong-Olden Culmination, which is a Caledonian nappe structure [19]. The breccia is situated in the hanging wall, above the fold axis of a gently SW plunging anticline of the Olden Nappe, a few meters above the thrust fault (Figure 2). This the thrust fault separates the Olden Nappe from the overlying Formofoss Nappe Complex. The close position of the breccia above the thrust fault may have had an effect on the location of breccia formation. However, these flat-dipping Caledonian structures are not known to have been reactivated during Triassic time. The eastern limb of the thrust fold and the foliation of the metarhyolite dip 30 to 35° NE but the breccia structures are discordant (generally sub-vertical) and transect these Caledonian structures.
On a global scale, the middle/late Triassic boundary (230 ± 5 Ma) marks the incipient dispersal of Pangea by the onset of continental rifting [92]. In NW Europe including southern Norway the Triassic was a period of major rifting and faulting [93,94,95,96,97,98], involving many long-lived fault zones, such as the Great Glen Fault [99] and the Møre Trøndelag Fault Complex (MTFC) [79,100,101,102,103,104,105] (Figure 12). The MTFC is the northernmost of several important regional structures identified in southern Norway and is widely agreed to have played an important role in the development of the Norwegian margin e.g., [106,107]. The MTFC is a large-scale SW-NE-striking tectonic zone which extends onshore for about 350 km from Ålesund in the SW to Snåsa and further towards the NE. It is a long-lived tectonic feature possibly with Precambrian roots [103,108,109] and principally comprised by the Hitra-Snåsa and Verran faults (Figure 12). The faults became multiply reactivated during the late Paleozoic, Mesozoic and late Cretaceous [79,104]. Fission-track dating of apatite, zircon and titanite by Grønlie et al. [79] along the NE part of the Verran fault revealed several Triassic reactivations overlapping in time with the formation of the Berglia-Glassberget breccia. According to Redfield et al. [104,105] the major Verran fault peters out about 30 km W of the breccia. However, a dense network of SW-NE striking structures transecting the Grong-Olden Culmination [19,20] document MTFC-related faults in the E and NE extension of the major Verran fault, immediately adjacent to the Berglia-Glassberget breccia.
Considering the regional context of these long-lived fault zones, the Berglia-Glassberget breccia is situated at the NE end of the Verran fault, probably forming a triple junction with the N-S striking faults related to the northern end of the Lærdal-Gjende fault system (coming from S, e.g., [110]) and the SE end of the Kollstraumen detachment (coming from NW; e.g., [111]) (Figure 12). Based in this geotectonic positon, the Berglia-Glassberget breccia can be considered as a seismic expression related to the Triassic reactivation of the MTFC. However, the specific nature of the major fault along which the seismic rupture occurred cannot be defined due to the heavy overburden, but might be a solved by future studies.
6. Summary
The results of the study can be summarized as follows:
- The Berglia-Glassberget mineralization is a fluid-assisted, hydraulic breccia (250 m × 500 m in lateral dimension) which formed by single-pulse stress released by a seismic event during middle Triassic (240.3 ± 0.4 Ma).
- The influx of aqueous CO2-bearing Na-HCO3-SO4 fluids into the fault zone triggered a short-lived weakening mechanism that facilitated fault movement by reducing the shear stress.
- The intruding fluid, pumped by the seismic event to higher levels, leached K, Ba, Rb, Th, Nb and Ta metarhyolitic host rock and simultaneously silicified the host rock and its breccia fragments in the SW part of the shattered area (breccia “center”). The dissolved K, Ba, Rb and Th were precipitated mainly as breccia-cementing, low-temperature K-feldspar (var. adularia) followed by quartz.
- A high percentage of open space in the breccia fractures up to 80 vol % with cavities up 3 m × 3 m × 4 m in size, fluid inclusion microthermometry, and trace element chemistry of quartz suggest that the breccia was formed at depths between 4 and 0.5 km (1.1 to 0.1 kbar). The minimum temperature of the breccia cementing fluid was probably in the range of 247 and 329 °C. However, truly primary fluid inclusions could not be identified. The open space within the breccia body enabled the crystallization of large quantities of quartz crystals, which makes the locality attractive for mineral collectors.
- The origin of the CO2-bearing, breccia-cementing fluids may be of predominantly metamorphic origin due to decarbonation reactions (T > 200 °C) of limestones in an autochthonous sequence above felsic magmatic rocks of the underlying Olden Nappe. The decarbonation reactions were possibly initiated by deeply derived, hot fluids channelled to sub-surface levels by a major fault zone.
- In the regional context, the Berglia-Glassberget breccia is interpreted to be situated at a triple junction of long-lived fault zones belonging to the Møre-Trøndelag, Lærdal-Gjende and the Kollstraumen fault complexes. These fault systems are the expression of major rifting and faulting in northern Europe during middle/late Triassic. By this means the Berglia-Glassberget breccia contributes to a better understanding of the extensional tectonics of the Norwegian mainland during that period.
Supplementary Materials
The complete SIMS data set including the results of the calibration runs is available online at https://www.mdpi.com/2075-163X/8/5/175/s1.
Acknowledgments
We are very grateful to Arne Solli and David Roberts for fruitful discussions, Øyvind Thorensen who took photographs of mineral specimen, and Arne Jostein Devik who provided information and material about mineral collection activities at Berglia-Glassberget. Rainer Thomas is thanked for performing Raman spectroscopy on fluid inclusions. Frédéric Couffignal conducted the SIMS analyses. We are very thankful to the constructive reviews by two anonymous reviewers.
Author Contributions
Axel Müller conceived and designed the experiments; Morgan Ganerød, Michael Wiedenbeck, Axel Müller, and Skule Olaus Svendsen Spjelkavik performed the experiments; Rune Selbekk provided the sample material and existing data and information about the Berglia-Glassberget breccia; Axel Müller, Morgan Ganerød and Michael Wiedenbeck analysed the data; Axel Müller, Morgan Ganerød and Michael Wiedenbeck wrote the paper.
Conflicts of Interest
The authors declare no conflict of interest.
References
- Sibson, R.H. Fault rocks and fault mechanisms. J. Geol. Soc. 1977, 133, 191–213. [Google Scholar] [CrossRef]
- Sibson, R.H. Brecciation processes in fault zones: Inferences from earthquake rupturing. Pure Appl. Geophys. 1986, 124, 159–174. [Google Scholar] [CrossRef]
- Sillitoe, R.H. Ore-related breccias in volcanoplutonic arcs. Econ. Geol. 1985, 80, 1467–1514. [Google Scholar] [CrossRef]
- Taylor, R.G.; Pollard, P.J. Mineralized Breccia Systems. Method of Recognition and Interpretation; Contributions of the Economic Geology Research Unit; Economic Geology Research Unit (EGRU): Townsville, Australia, 1993; Volume 46, p. 31. [Google Scholar]
- Fournier, R.O. Hydrothermal processes related to movement of fluid from plastic into brittle rock in the magmatic-epithermal environment. Econ. Geol. 1999, 94, 1193–1211. [Google Scholar] [CrossRef]
- Landtwing, M.R.; Dillenbeck, E.D.; Leake, M.H.; Heinrich, C.A. Evolution of the breccia-hosted porphyry Cu-Mo-Au deposit at Agua Rica, Argentina: Progressive unroofing of a magmatic hydrothermal system. Econ. Geol. 2002, 97, 1273–1292. [Google Scholar] [CrossRef]
- Sibson, R.H. Earthquake faulting as a structural process. J. Struct. Geol. 1989, 11, 1–14. [Google Scholar] [CrossRef]
- Roberts, G.P. Displacement localization and palaeo-seismicity of the Rencurel Thrust Zone, French Sub-Alpine Chains. J. Struct. Geol. 1994, 16, 633–646. [Google Scholar] [CrossRef]
- Cowan, D.S. Do faults preserve a record of seismic slip? A field geologist’s opinion. J. Struct. Geol. 1999, 21, 995–1001. [Google Scholar] [CrossRef]
- Micklethwaite, S.; Cox, S.F. Fault-segment rupture, aftershock-zone fluid flow, and mineralization. Geology 2004, 32, 813–816. [Google Scholar] [CrossRef]
- Woodcock, N.H.; Dickson, J.A.D.; Tarasewicz, J.P.T. Transient fracture permeability and reseal hardening in fault zones: Evidence from dilation breccia textures. In Fractured Reservoirs; Lonergan, L., Jolly, R.J.H., Rawnsley, K., Sanderson, D.J., Eds.; Special Publications; Geological Society: London, UK, 2007; Volume 270, pp. 43–53. [Google Scholar]
- Baker, E.M.; Kirwin, D.J.; Taylor, R.G. Hydrothermal Breccia Pipes; Contributions of the Economic Geology Research Unit; Geology Department, James Cook University: Townsville, Australia, 1986; Volume 12, p. 45. [Google Scholar]
- Lawless, J.V.; White, P.J. Ore-related breccias: A revised genetic classification, with particular reference to epithermal deposits. In Proceedings of the 12th New Zealand Geothermal Workshop; Harvey, C.C., Browne, P.R.L., Freestone, D.H., Scott, G.L., Eds.; Geothermal Institute, University of Auckland: Auckland, New Zealand, 1990; pp. 197–202. [Google Scholar]
- Ewensson, T. Jakten på den Svarte Krystallen. Stein 2000, 27, 17–18. (In Norwegian) [Google Scholar]
- Nordrum, F.S. Mineralogische Neuigkeiten aus Norwegen. Miner. Welt 2002, 13, 56–59. (In German) [Google Scholar]
- Jørgensen, L. Berglia-Glassberget kvartsforekomst, Sørli i Lierne. Nor. Bergverksmus. Skr. 2003, 25, 39–40. (In Norwegian) [Google Scholar]
- Asklund, B. Hauptzüge der Tektonik und Stratigraphie der Mittleren Kaledoniden in Schweden; C-417; Sveriges Geologiska Undersökning: Uppsala, Sweden, 1938; pp. 1–99. (In German) [Google Scholar]
- Johansson, L. Basement and Cover Relationships in the Vestranden-Grong-Olden Region, Central Scandinavian Caledonides: Petrology, Age Relationships, Structures and Regional Corrrelations. Ph.D. Thesis, Lund University, Lund, Sweden, 1986. [Google Scholar]
- Roberts, D. Tectonostratigraphy within the area of 1:50,000 map-sheet ‘Grong’, Nord-Trøndelag, Central Norway. Geol. Fören. Stockh. Förh. 1989, 111, 404–407. [Google Scholar] [CrossRef]
- Fossen, H.; Nissen, A.L.; Roberts, D. Bergrunnskart Blåfjellhatten 1923 III, M 1:50,000; Norges Geologiske Undersøkelse: Trondheim, Norway, 2013. [Google Scholar]
- Klingspor, I.; Tröeng, B. Rb-Sr and K-Ar age determinations of the Proterozoic Olden granite, Central Caledonides, Jämtland, Sweden. Geol. Fören. Stockh. Förh. 1980, 102, 515–522. [Google Scholar] [CrossRef]
- Roberts, D. Geologisk kart over Norge. Berggrunnsgeologisk kart Grong, M 1:250,000; Norges Geologiske Undersøkelse: Trondheim, Norway, 1997. [Google Scholar]
- Roberts, D. Geochemistry of Paleoproterozoic porphyritic felsic volcanites from the Olden and Tømmerås windows, Central Norway. Geol. Fören. Stockh. Förh. 1997, 119, 141–148. [Google Scholar]
- Roberts, D.; Nissen, A.L.; Walker, N. U-Pb zircon age and geochemistry of the Blåfjellhatten granite, Grong-Olden Culmination, Central Norway. Nor. Geol. Tidsskr. 1999, 79, 161–168. [Google Scholar] [CrossRef]
- Gorbatschev, R. Precambrian basement of the Caledonides. In The Caledonide Orogen—Scandinavia and Related Areas; Gee, D.G., Sturt, B.A., Eds.; John Wiley & Sons: Chichester, UK, 1985; pp. 197–212. [Google Scholar]
- Högdahl, K.; Andersson, U.B.; Eklund, O. The Transscandinavian Igneous Belt (TIB) in Sweden: A Review of Its Character and Evolution; Special Paper; Geological Survey of Finland: Espoo, 2004; Volume 37, p. 125. [Google Scholar]
- Lahtinen, R.; Garde, A.A.; Melezhik, V.A. Paleoproterozoic evolution of Fennoscandia and Greenland. Episodes 2008, 31, 20–28. [Google Scholar]
- Bingen, B.; Andersson, J.; Söderlun, U.; Möller, C. The Mesoproterozoic in the Nordic countries. Episodes 2008, 31, 29–34. [Google Scholar]
- Nordrum, F.S. Noen funn av mineraler i Norge 2000–2001, part II. Stein 2001, 28, 16–24. (In Norwegian) [Google Scholar]
- Nordrum, F.S. Nyfunn av mineraler i Norge 2001–2002. Stein 2002, 29, 4–10. (In Norwegian) [Google Scholar]
- Nordrum, F.S. Nyfunn av mineraler i Norge 2002–2003. Nor. Bergverksmus. Skr. 2003, 25, 82–89. [Google Scholar]
- Nordrum, F.S. Nyfunn av mineraler i Norge 2002–2003. Stein 2003, 30, 4–10. (In Norwegian) [Google Scholar]
- Nordrum, F.S. Nyfunn av mineraler i Norge 2004–2005. Nor. Bergverksmus. Skr. 2005, 30, 117–124. (In Norwegian) [Google Scholar]
- Nordrum, F.S. Nyfunn av mineraler i Norge 2006–2007. Stein 2007, 34, 14–26. (In Norwegian) [Google Scholar]
- Nordrum, F.S. Nyfunn av mineraler i Norge 2007–2008. Stein 2008, 35, 8–20. (In Norwegian) [Google Scholar]
- Jébrak, M. Hydrothermal breccias in vein-type ore deposits: A review of mechanisms, morphology and size distribution. Ore Geol. Rev. 1997, 12, 111–134. [Google Scholar] [CrossRef]
- ACMELabs, 2017. Bureau Veritas Mineral Laboratories. Available online: http://acmelab.com/ (accessed on 27 July 2017).
- Götze, J.; Plötze, M.; Habermann, D. Origin, spectral characteristics and practical applications of the cathodoluminescence (CL) of quartz—A review. Mineral. Petrol. 2001, 71, 225–250. [Google Scholar] [CrossRef]
- Jochum, K.P.; Weis, U.; Stoll, B.; Kuzmin, D.; Yang, Q.; Raczek, I.; Jacob, D.E.; Stracke, A.; Birbaum, K.; Frick, D.A.; et al. Determination of reference values for NIST SRM 610-617 glasses following ISO guidelines. Geostand. Geoanal. Res. 2011, 35, 397–429. [Google Scholar] [CrossRef]
- Müller, A.; Wiedenbeck, M.; Flem, B.; Schiellerup, H. Refinement of phosphorus determination in quartz by LA-ICP-MS through defining new reference material values. Geostand. Geoanal. Res. 2008, 32, 361–376. [Google Scholar] [CrossRef]
- McDougall, I.; Harrison, T.M. Geochronology and Thermochronology by the 40Ar/39Ar Method; Oxford University Press: New York, NY, USA, 1999; p. 269. [Google Scholar]
- Renne, P.R.; Mundil, R.; Balco, G.; Min, K.W.; Ludwig, K.R. Joint determination of K-40 decay constants and 40Ar/40K for the Fish Canyon sanidine standard, and improved accuracy for 40Ar/39Ar geochronology. Geochim. Cosmochim. Acta 2010, 74, 5349–5367. [Google Scholar] [CrossRef]
- Lee, J.Y.; Marti, K.; Severinghaus, J.P.; Kawamura, K.; Yoo, H.S.; Lee, J.B.; Kim, J.S. A redetermination of the isotopic abundances of atmospheric Ar. Geochim. Cosmochim. Acta 2006, 70, 4507–4512. [Google Scholar] [CrossRef]
- International Atomic Energy Agency. Reference Sheet for Reference Materials NBS 28 and NBS 30. 2007. Available online: https://nucleus.iaea.org/rpst/Documents/NBS28_NBS30.pdf (accessed on 20 February 2018).
- Baertschi, P. Absolute 18O content of standard mean ocean water. Earth Planet. Sci. Lett. 1976, 31, 341–344. [Google Scholar] [CrossRef]
- Ramsey, M.H.; Wiedenbeck, M. Quantifying isotopic heterogeneity of candidate Reference Materials at the picogram sampling scale. Geostand. Geoanal. Res. 2018, 42, 5–24. [Google Scholar] [CrossRef]
- Whalen, J.B.; Currie, K.L.; Chappell, B.W. A-type granites: Geochemical characteristics, discrimination and petrogenesis. Contrib. Mineral. Petrol. 1987, 95, 407–419. [Google Scholar] [CrossRef]
- Pearce, J.A.; Harris, N.B.W.; Tindle, A.G. Trace element discrimination diagrams for the tectonic interpretation of granitic rocks. J. Petrol. 1984, 25, 956–983. [Google Scholar] [CrossRef]
- Eby, G.N. Chemical subdivision of the A-type granitoids: Petrogenic and tectonic implications. Geology 1992, 20, 641–644. [Google Scholar] [CrossRef]
- Shand, S.J. Eruptive Rocks. Their Genesis, Composition, Classification, and Their Relation to Ore-Deposits with a Chapter on Meteorite; John Wiley & Sons: New York, NY, USA, 1943; p. 350. [Google Scholar]
- Rudnick, R.L.; Gao, S. Composition of the continental crust. In Treatise on Geochemistry; Holland, H.D., Turekian, K.K., Eds.; Elsevier: Amsterdam, The Netherlands, 2004; Volume 3, pp. 1–64. [Google Scholar]
- Teertstra, D.K.; Hawthorne, F.C.; Čerńy, P. Identification of normal and anomalous compositions of minerals by electron-microprobe analysis; K-rich feldspar as a case study. Can. Mineral. 1998, 36, 87–95. [Google Scholar]
- Correcher, V.; García-Guinea, J. On the luminescence properties of adularia feldspar. J. Lumin. 2001, 93, 303–312. [Google Scholar] [CrossRef]
- Sanchez-Munoz, L.; Müller, A.; Andrés, S.L.; Martin, R.F.; Modreski, P.J.; De Moura, O.J.M. The P-Fe diagram for K-feldspars: A preliminary approach in the discrimination of pegmatites. Lithos 2017, 272–273, 116–127. [Google Scholar] [CrossRef]
- Perny, B.; Eberhardt, P.; Ramseyer, K.; Mullis, J.; Pankrath, R. Microdistribution of Al, Li and Na in alpha quartz: Possible causes and correlation with short-lived cathodoluminescence. Am. Mineral. 1992, 77, 534–544. [Google Scholar]
- Rusk, B.G.; Reed, M.H.; Dilles, J.H.; Kent, A.J.R. Intensity of quartz cathodoluminescence and trace-element content in quartz from the porphyry copper deposit at Butte, Montana. Am. Mineral. 2006, 91, 1300–1312. [Google Scholar] [CrossRef]
- Rusk, B.G.; Lowers, H.; Reed, M.H. Trace elements in hydrothermal quartz; relationships to cathodoluminescent textures and insights into hydrothermal processes. Geology 2008, 36, 547–550. [Google Scholar] [CrossRef]
- Rusk, B. Cathodoluminescent textures and trace elements in hydrothermal quartz. In Quartz: Deposits, Mineralogy and Analytics; Götze, J., Möckel, R., Eds.; Springer: Heidelberg, Germany; New York, NY, USA, 2012; pp. 307–329. [Google Scholar]
- Jourdan, A.-L.; Vennemann, T.W.; Mullis, J.; Ramseyer, K.; Spiers, C.J. Evidence of growth and sector zoning in hydrothermal quartz from Alpine veins. Eur. J. Mineral. 2009, 21, 219–231. [Google Scholar] [CrossRef]
- Drivenes, K.; Larsen, B.R.; Müller, A.; Sørensen, B.E. Crystallization and uplift path of late-Variscan granites evidenced by quartz chemistry and fluid inclusions: An example from the Land’s End granite, SW England. Lithos 2016, 252–253, 57–75. [Google Scholar] [CrossRef]
- Garate-Olave, I.; Müller, A.; Roda-Robles, E.; Gil-Crespo, P.P.; Pesquera, A. Extreme fractionation in a granite-pegmatite system documented by quartz chemistry: The case study of Tres Arroyos (Central Iberian Zone, Spain). Lithos 2017, 286–287, 162–174. [Google Scholar] [CrossRef]
- Dennen, W.H. Stoichiometric substitution in natural quartz. Geochim. Cosmochim. Acta 1966, 30, 1235–1241. [Google Scholar] [CrossRef]
- Ramseyer, K.; Mullis, J. Factors influencing short-lived blue cathodoluminescence of a-quartz. Am. Mineral. 1990, 75, 791–800. [Google Scholar]
- Roedder, E. Fluid Inclusions; Reviews in Mineralogy; Mineralogical Society of America, Book Crafters, Inc.: Chelsea, MI, USA, 1984; Volume 12, p. 644. [Google Scholar]
- Bakker, R.J. Package FLUIDS. Part 4: Thermodynamic modelling and purely empirical equations for H2O–NaCl–KCl solutions. Mineral. Petrol. 2012, 105, 1–29. [Google Scholar] [CrossRef]
- Steele-MacInnis, M.; Lecumberri-Sanchez, P.; Bodnar, R.J. HokieFlincs_H2O–NaCl: A Microsoft Excel spreadsheet for interpreting microthermometric data from fluid inclusions based on the PVTX properties of H2O–NaCl. Comput. Geosci. 2012, 49, 334–337. [Google Scholar] [CrossRef]
- Diamond, L.W. Introduction to gas-bearing aqueous fluid inclusions. Short Course Ser. Mineral. Assoc. Can. 2003, 32, 101–158. [Google Scholar]
- Onasch, C.M.; Vennemann, T.W. Disequilibrium partitioning of oxygen isotopes associated with sector zoning in quartz. Geology 1995, 23, 1103–1106. [Google Scholar] [CrossRef]
- Phillips, G.N.; Powell, R. Link between gold provinces. Econ. Geol. 1993, 88, 1084–1098. [Google Scholar] [CrossRef]
- Sibson, R.H. Earthquake rupturing as a mineralizing agent in hydrothermal systems. Geology 1987, 15, 701–704. [Google Scholar] [CrossRef]
- Pavlis, T.L.; Serpa, L.F.; Keener, C. Role of seismogenic processes in fault-rock development: An example from Death Valley, California. Geology 1993, 21, 267–270. [Google Scholar] [CrossRef]
- Williams, C.L.; Thompson, T.B.; Powell, J.L.; Dunbar, W.W. Goldbearing breccias of the Rain Mine, Carlin trend, Nevada. Econ. Geol. 2000, 95, 391–404. [Google Scholar] [CrossRef]
- Clark, C.; James, P. Hydrothermal brecciation due to fluid pressure fluctuations: Examples from the Olary Domain, South Australia. Tectonophysics 2003, 366, 187–206. [Google Scholar] [CrossRef]
- Labaume, P.; Carrio-Schaffhauser, E.; Gamond, J.-F.; Renard, F. Deformation mechanisms and fluid-driven mass transfers in the recent fault zones of the Corinth Rift (Greece). C. R. Geosci. 2004, 336, 375–383. [Google Scholar] [CrossRef]
- Collettini, C.; Cardellini, C.; Chiodini, G.; De Paola, N.; Holdsworth, R.E.; Smith, S.A.F. Fault weakening due to CO2 degassing in the Northern Apennines: Short- and long-term processes. Geol. Soc. Lond. Spec. Publ. 2008, 299, 175–194. [Google Scholar] [CrossRef]
- Sibson, R.H. Fluid flow accompanying faulting: Field evidence and models. In Earthquake Prediction: An International Review; Simpson, D.W., Richards, P.G., Eds.; Maurice Ewing Series 4; American Geophysical Union: Washington, DC, USA, 1981; pp. 593–603. [Google Scholar]
- Sibson, R.H. Implications of fault-valve behavior for rupture nucleation and recurrence. Tectonophysics 1992, 211, 283–293. [Google Scholar] [CrossRef]
- Tarasewicz, J.P.T.; Woodcock, N.H.; Dickson, J.A.D. Carbonate dilation breccias: Examples from the damage zone to the Dent Fault, northwest England. Geol. Soc. Am. Bull. 2005, 117, 736–745. [Google Scholar] [CrossRef]
- Grønlie, A.; Naeser, C.W.; Naeser, N.D.; Mitchell, J.G.; Sturt, B.A.; Ineson, P. Fission track and K/Ar dating of tectonic activity in a transect across the Møre Trøndelag Fault Zone, Central Norway. Nor. Geol. Tidsskr. 1994, 74, 24–34. [Google Scholar]
- Henley, R.W.; Ellis, A.J. Geothermal systems ancient and modern: A geochemical review. Earth Sci. Rev. 1983, 19, 1–50. [Google Scholar] [CrossRef]
- Henley, R.W. Epithermal gold deposits in volcanic terranes. In Gold Metallogeny and Exploration; Foster, R.P., Ed.; Springer: Boston, MA, USA, 1991; pp. 133–164. [Google Scholar]
- Huang, R.; Audétat, A. The titanium-in-quartz (TitaniQ) thermobarometer: A critical examination and re-calibration. Geochim. Cosmochim. Acta 2012, 84, 75–89. [Google Scholar] [CrossRef]
- Hoefs, J. Stable Isotope Geochemistry; Springer: Berlin/Heidelberg, Germany; New York, NY, USA, 1997. [Google Scholar]
- Klemd, R.; Hirdes, W. Origin of an unusual fluid composition in Early Proterozoic Palaeoplacer and lode-gold deposits in Birimian greenstone terranes of West Africa. S. Afr. J. Geol. 1997, 100, 405–414. [Google Scholar]
- Schmidt-Mumm, A.; Oberthür, T.; Vetter, U.; Blenkinsop, T.G. High CO2 content of fluid inclusions in gold mineralisations in the Ashanti Belt, Ghana: A new category of ore forming fluids? Miner. Depos. 1997, 32, 107–118. [Google Scholar] [CrossRef]
- Sibson, R.H. A brittle failure mode plot defining conditions for high-flux flow. Econ. Geol. 2000, 95, 41–48. [Google Scholar] [CrossRef]
- Lowenstern, B. Carbon dioxide in magmas and implications for hydrothermal systems. Miner. Depos. 2001, 36, 490–502. [Google Scholar] [CrossRef]
- Baker, T. Emplacement depth and carbon dioxide-rich fluid inclusions in intrusion-related gold deposits. Econ. Geol. 2002, 97, 1111–1117. [Google Scholar] [CrossRef]
- Kerrick, D.M.; Caldera, K. Metamorphic CO2 degassing from orogenic belts. Chem. Geol. 1998, 145, 213–232. [Google Scholar] [CrossRef]
- Santosh, M.; Jackson, D.H.; Harris, N.B.W.; Mattey, D.P. Carbonic fluid inclusions in South Indian granulites: Evidence for entrapment during charnockite formation. Contrib. Mineral. Petrol. 1991, 108, 318–330. [Google Scholar] [CrossRef]
- Wilmart, E.; Clocchiatti, R.; Duchesne, J.C.; Touret, J.L.R. Fluid inclusions in charnockites from the Bjerkreim–Sokndal massif (Rogaland, southwestern Norway): Fluid origin and in situ evolution. Contrib. Mineral. Petrol. 1991, 108, 453–462. [Google Scholar]
- Veevers, J.J. Middle/Late Triassic (230 ± 5 Ma) singularity in the stratigraphic and magmatic history of the Pangean heat anomaly. Geology 1989, 17, 784–787. [Google Scholar] [CrossRef]
- Ziegler, P.A. Evolution of sedimentary basins in North-West Europe. In Petroleum Geology of the Continental Shelf of North-West Europe; Institute of Petroleum: London, UK, 1981; pp. 3–39. [Google Scholar]
- Roberts, A.M.; Yielding, G.; Kusznir, N.J.; Walker, I.M.; Dorn-Lopez, D. Mesozoic extension in the North Sea: Constraints from flexural backstripping, forward modelling and fault populations. In Petroleum Geology of Northern Europe; Parker, J.R., Ed.; Geological Society: London, UK, 1993; pp. 1123–1136. [Google Scholar]
- Roberts, A.M.; Yielding, G.; Kusznir, N.J.; Walker, I.M.; Dorn-Lopez, D. Quantitative analysis of Triassic extension in the northern Viking Graben. J. Geol. Soc. 1995, 152, 15–26. [Google Scholar] [CrossRef]
- Færseth, R.B. Interaction of Permo-Triassic and Jurassic extensional fault-blocks during the development of the northern North Sea. J. Geol. Soc. 1996, 153, 931–944. [Google Scholar] [CrossRef]
- Eide, E.; Torsvik, T.H.; Andersen, T.B. Absolute dating of brittle fault movements: Late Permian and late Jurassic extensional fault breccias in western Norway. Terra Nova 1997, 9, 135–139. [Google Scholar] [CrossRef]
- Torsvik, T.H.; Andersen, T.B.; Eide, E.A.; Walderhaug, H.J. The age and tectonic significance of dolerite dykes in western Norway. J. Geol. Soc. 1997, 154, 961–973. [Google Scholar] [CrossRef]
- Frostick, L.; Reid, I.; Jarvis, J.; Eardley, H. Triassic sediments of the inner Moray Firth, Scotland: Early rift deposits. J. Geol. Soc. 1988, 145, 235–248. [Google Scholar] [CrossRef]
- Gabrielsen, R.H.; Ramberg, B. Fracture patterns in Norway from LandSAT imagery: results and potential use. In Proceedings of the Norwegian Sea Symposium Tromsø; NSS/23; Norwegian Petroleum Society: Stavanger, Norway, 1979; pp. 1–28. [Google Scholar]
- Doré, A.G.; Gage, M.S. Crustal alignments and sedimentary domains in the evolution of the North Sea, North East Atlantic Margin and Barents Shelf. In Petroleum Geology of North West Europe; Brooks, K., Glennie, K., Eds.; Graham and Trotman: London, UK, 1987; pp. 1131–1148. [Google Scholar]
- Grønlie, A.; Torsvik, T. On the origin and age of hydrothermal thorium enriched carbonate veins and breccias in the Møre Trøndelag Fault Zone, central Norway. Nor. Geol. Tidsskr. 1989, 69, 1–19. [Google Scholar]
- Grønlie, A.; Roberts, D. Resurgent strike-slip duplex development along the Hitra-Snåsa and Verran faults, Møre-Trøndelag Fault Zone, Central Norway. J. Struct. Geol. 1989, 11, 295–305. [Google Scholar] [CrossRef]
- Redfield, T.F.; Torsvik, T.H.; Andriessen, P.A.M.; Gabrielsen, R.H. Mesozoic and Cenozoic tectonics of the Møre Trøndelag Fault Complex, central Norway: Constraints from new apatite fission track data. Phys. Chem. Earth 2004, 29, 673–682. [Google Scholar] [CrossRef]
- Redfield, T.F.; Braathen, A.; Gabrielsen, R.H.; Osmundsen, P.T.; Torsvik, T.H.; Andriessen, P.A.M. Late Mesozoic to Early Cenozoic components of vertical separation across the Møre-Trøndelag Fault Complex, Norway. Tectonophysics 2005, 395, 233–249. [Google Scholar] [CrossRef]
- Gabrielsen, R.H.; Odinsen, T.; Grunnaleite, I. Structuring of the Northern Viking Graben and the Møre Basin; the influence of basement structural grain and the particular role of the Møre Trøndelag Fault Complex. Mar. Petrol. Geol. 1999, 16, 443–465. [Google Scholar] [CrossRef]
- Braathen, A. Kinematics of post-Caledonian polyphase brittle faulting in the Sunnfjord region, western Norway. Tectonophysics 1999, 302, 99–121. [Google Scholar] [CrossRef]
- Aanstad, K.; Gabrielsen, R.H.; Hagevang, T.; Ramberg, I.B.; Torvanger, O. Correlation of offshore and onshore structural features between 62N and 68N, Norway. In Proceedings of the Norwegian Symposium on Exploration; NSE/11; Norwegian Petroleum Society: Stavanger, Norway, 1981; pp. 1–25. [Google Scholar]
- Seranne, M. Late Paleozoic kinematics of the Møre Trøndelag Fault Zone and adjacent areas, central Norway. Nor. Geol. Tidskr. 1992, 72, 141–158. [Google Scholar]
- Andersen, T.B.; Torsvik, T.H.; Eide, E.; Osmundsen, P.T.; Faleide, J. Permian and Mesozoic extensional faulting within the Caledonides of Central South Norway. J. Geol. Soc. 1999, 156, 1073–1080. [Google Scholar] [CrossRef]
- Nordgulen, Ø.; Braathen, A.; Corfu, F.; Osmundsen, P.T.; Husmo, T. Polyphase kinematics and geochronology of the Kollstraumen detachment. Nor. J. Geol. 2002, 82, 299–316. [Google Scholar]
- Faleide, J.I.; Tsikalas, F.; Breivik, A.J.; Mjelde, R.; Ritzmann, O.; Engen, Ø.; Wilson, J.; Eldholm, O. Structure and evolution of the continental margin off Norway and the Barents Sea. Episodes 2008, 31, 82–91. [Google Scholar]
- Faleide, J.I.; Bjørlukke, K.; Gabrielsen, R.H.O. Geology of the Norwegian Continental Shelf. In Petroleum Geoscience: From Sedimentary Environments to Rock Physics; Bjørlukke, K., Ed.; Springer: Berlin/Heidelberg, Germany, 2010; Chapter 22; pp. 467–499. [Google Scholar]
Figure 1.
(A) Simplified regional geological map according to Fossen et al. [20] with the location of the Berglia-Glassberget breccia. The used coordinate system is Universal Transverse Mercator (UTM) zone 33W. (B) Inset showing the Berglia-Glassberget locality in Scandinavia.
Figure 1.
(A) Simplified regional geological map according to Fossen et al. [20] with the location of the Berglia-Glassberget breccia. The used coordinate system is Universal Transverse Mercator (UTM) zone 33W. (B) Inset showing the Berglia-Glassberget locality in Scandinavia.
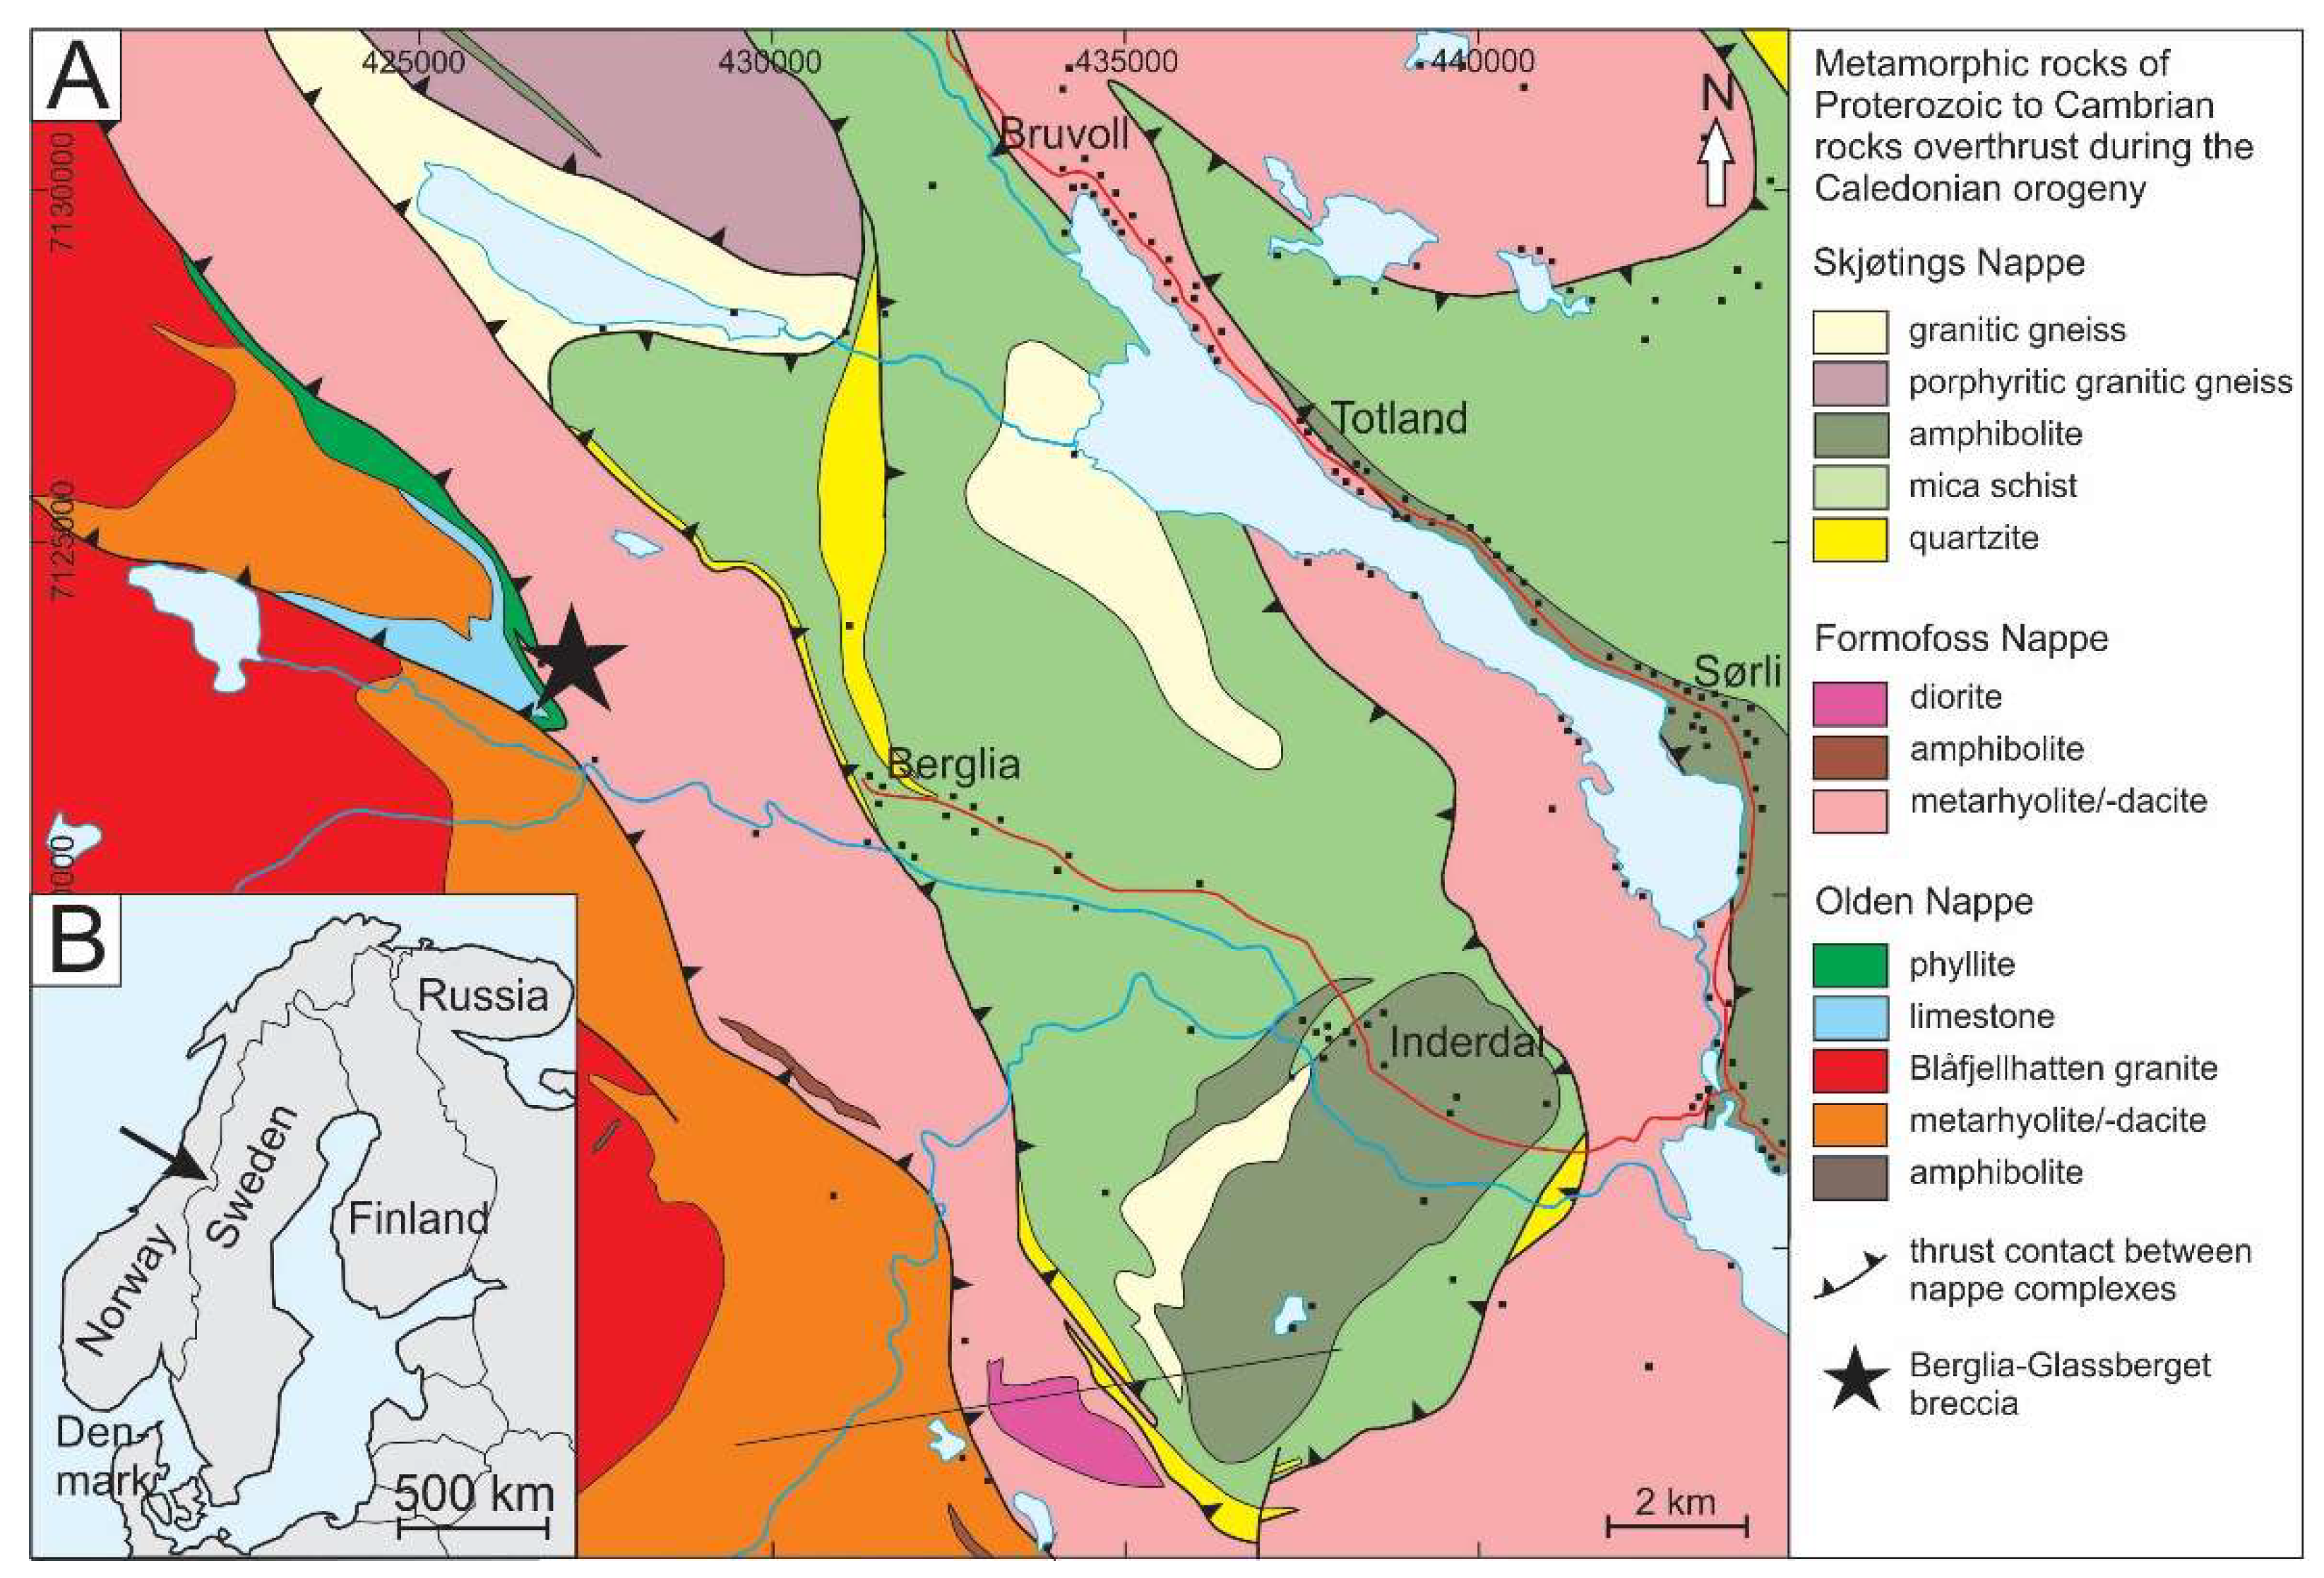
Figure 2.
Local geological map of Berglia-Glassberget area according to Fossen et al. [20] with breccia extension and sample locations.
Figure 2.
Local geological map of Berglia-Glassberget area according to Fossen et al. [20] with breccia extension and sample locations.

Figure 3.
Photographs of the Berglia-Glassberget breccia. (A) Outcrop in the center of the Berglia-Glassberget breccia. (B) Hand specimen exhibiting typical texture of the Berglia-Glassberget breccia. The white mineral enveloping the metarhyolite clasts is K-feldspar (kfs), which crystallized prior to quartz (qtz). (C) Recovering of a large cluster of smoky quartz crystals from the 3 m × 3 m × 4 m cavity discovered in 2005. (D) Cleaned crystal clusters from the cavity shown in (C). Photograph by Arne Jostein Devik.

Figure 4.
Photographs of minerals related to the Berglia-Glassberget breccia. (A) Cluster of smoky quartz crystals. The length of the specimen, which was donated by Arne Jostein Devik to the Natural History Museum of Oslo, is 30 cm (NHM collection nr. 41919). Photograph by Øivind Thorensen. (B) Small cavity with flesh-coloured adularia crystals overgrown by quartz crystals. Length of specimen 10 cm. (C) 14 cm long, smoky quartz crystal donated by Arne Jostein Devik to the Natural History Museum of Oslo (NHM collection nr. 41918). Photograph by Øivind Thorensen. (D) Cluster of clear quartz crystals with a Japanese twin in the center donated by Egil Hollund to the Natural History Museum of Oslo (NHM collection nr. 42418). Length of specimen 12 cm. Photograph by Øivind Thorensen.
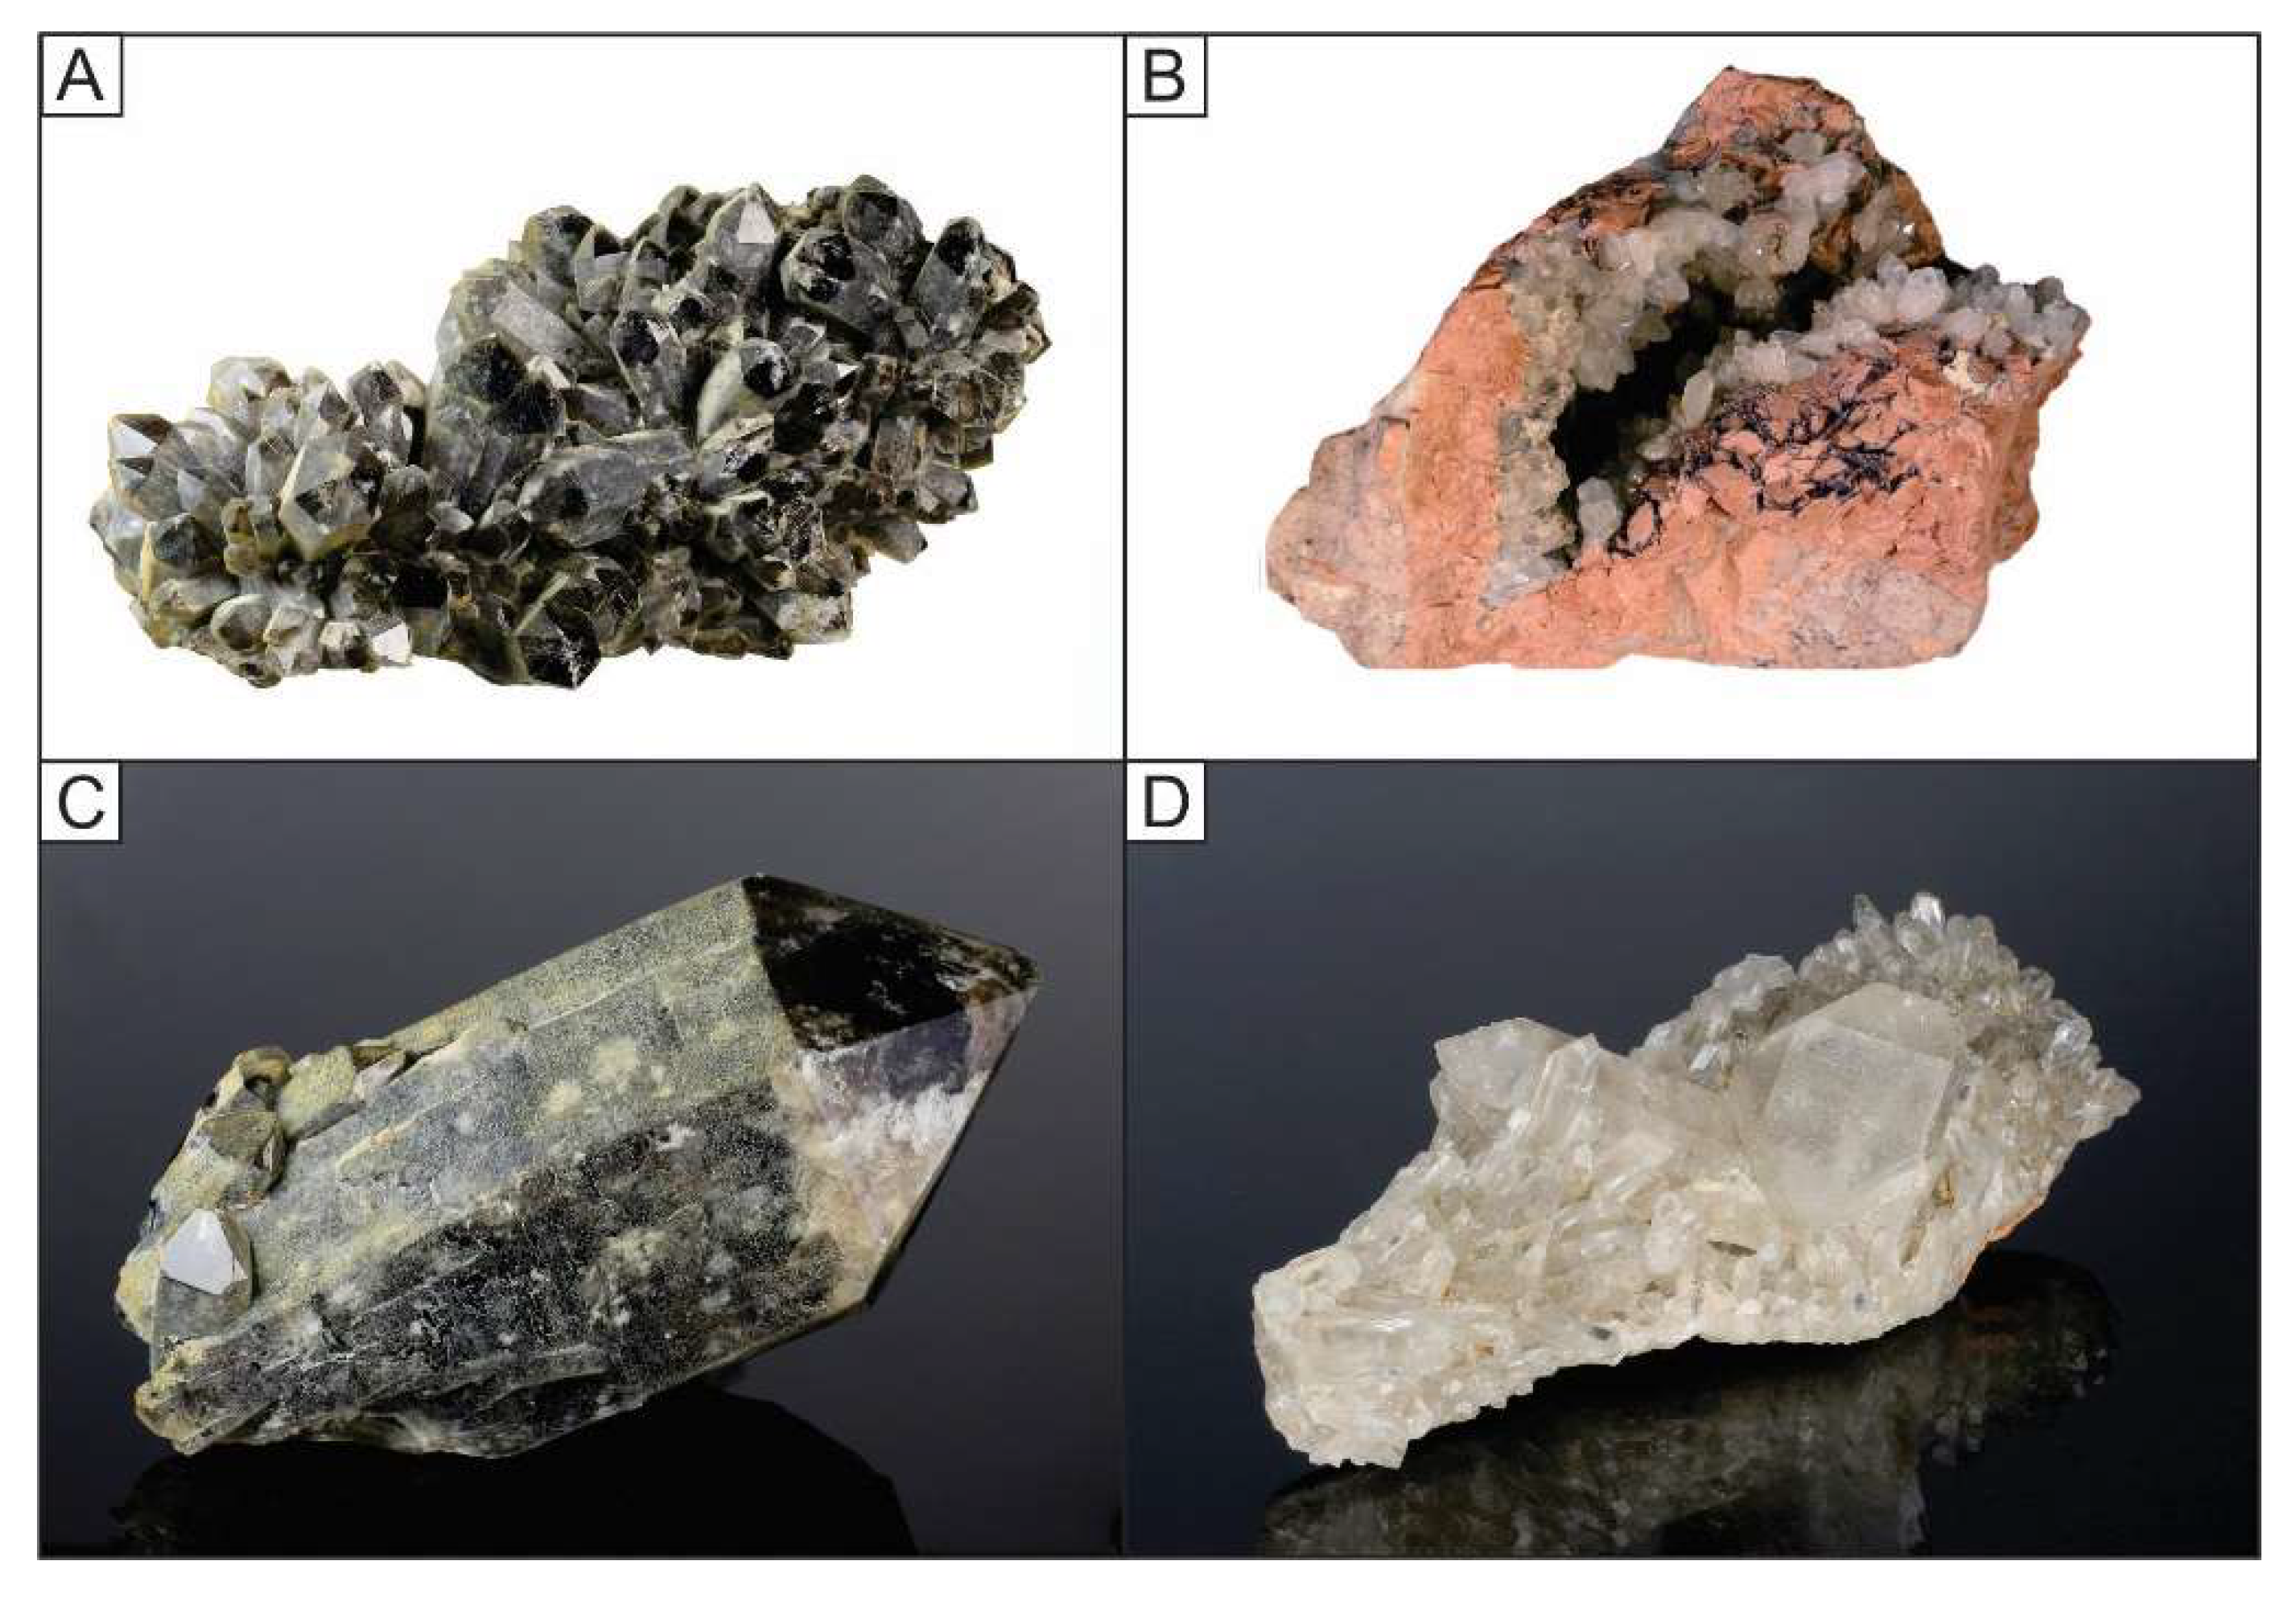
Figure 5.
3D surface topographic map of a sputtering crater created by the described Secondary Ion Mass Spectrometry (SIMS) experiment conditions in hydrothermal quartz of the Berglia-Glassberget breccia.
Figure 5.
3D surface topographic map of a sputtering crater created by the described Secondary Ion Mass Spectrometry (SIMS) experiment conditions in hydrothermal quartz of the Berglia-Glassberget breccia.

Figure 6.
Whole rock chemistry of breccia host rocks. (A) Total alkali oxide vs. silica (TAS) classification diagram for volcanic rocks. (B) A/CNK versus A/NK (A/NK = molar ratio of Al2O3/(Na2O + K2O); A/CNK = molar ratio of Al2O3/(CaO + Na2O + K2O) discrimination plot according to Shand [50]. (C) discrimination plot of A-type and other granites according to Whalen et al. [47]. (D) Upper continental crust (UCC)-normalized diagram of selected incompatible elements. UCC values are from Rudnick and Gao [51].
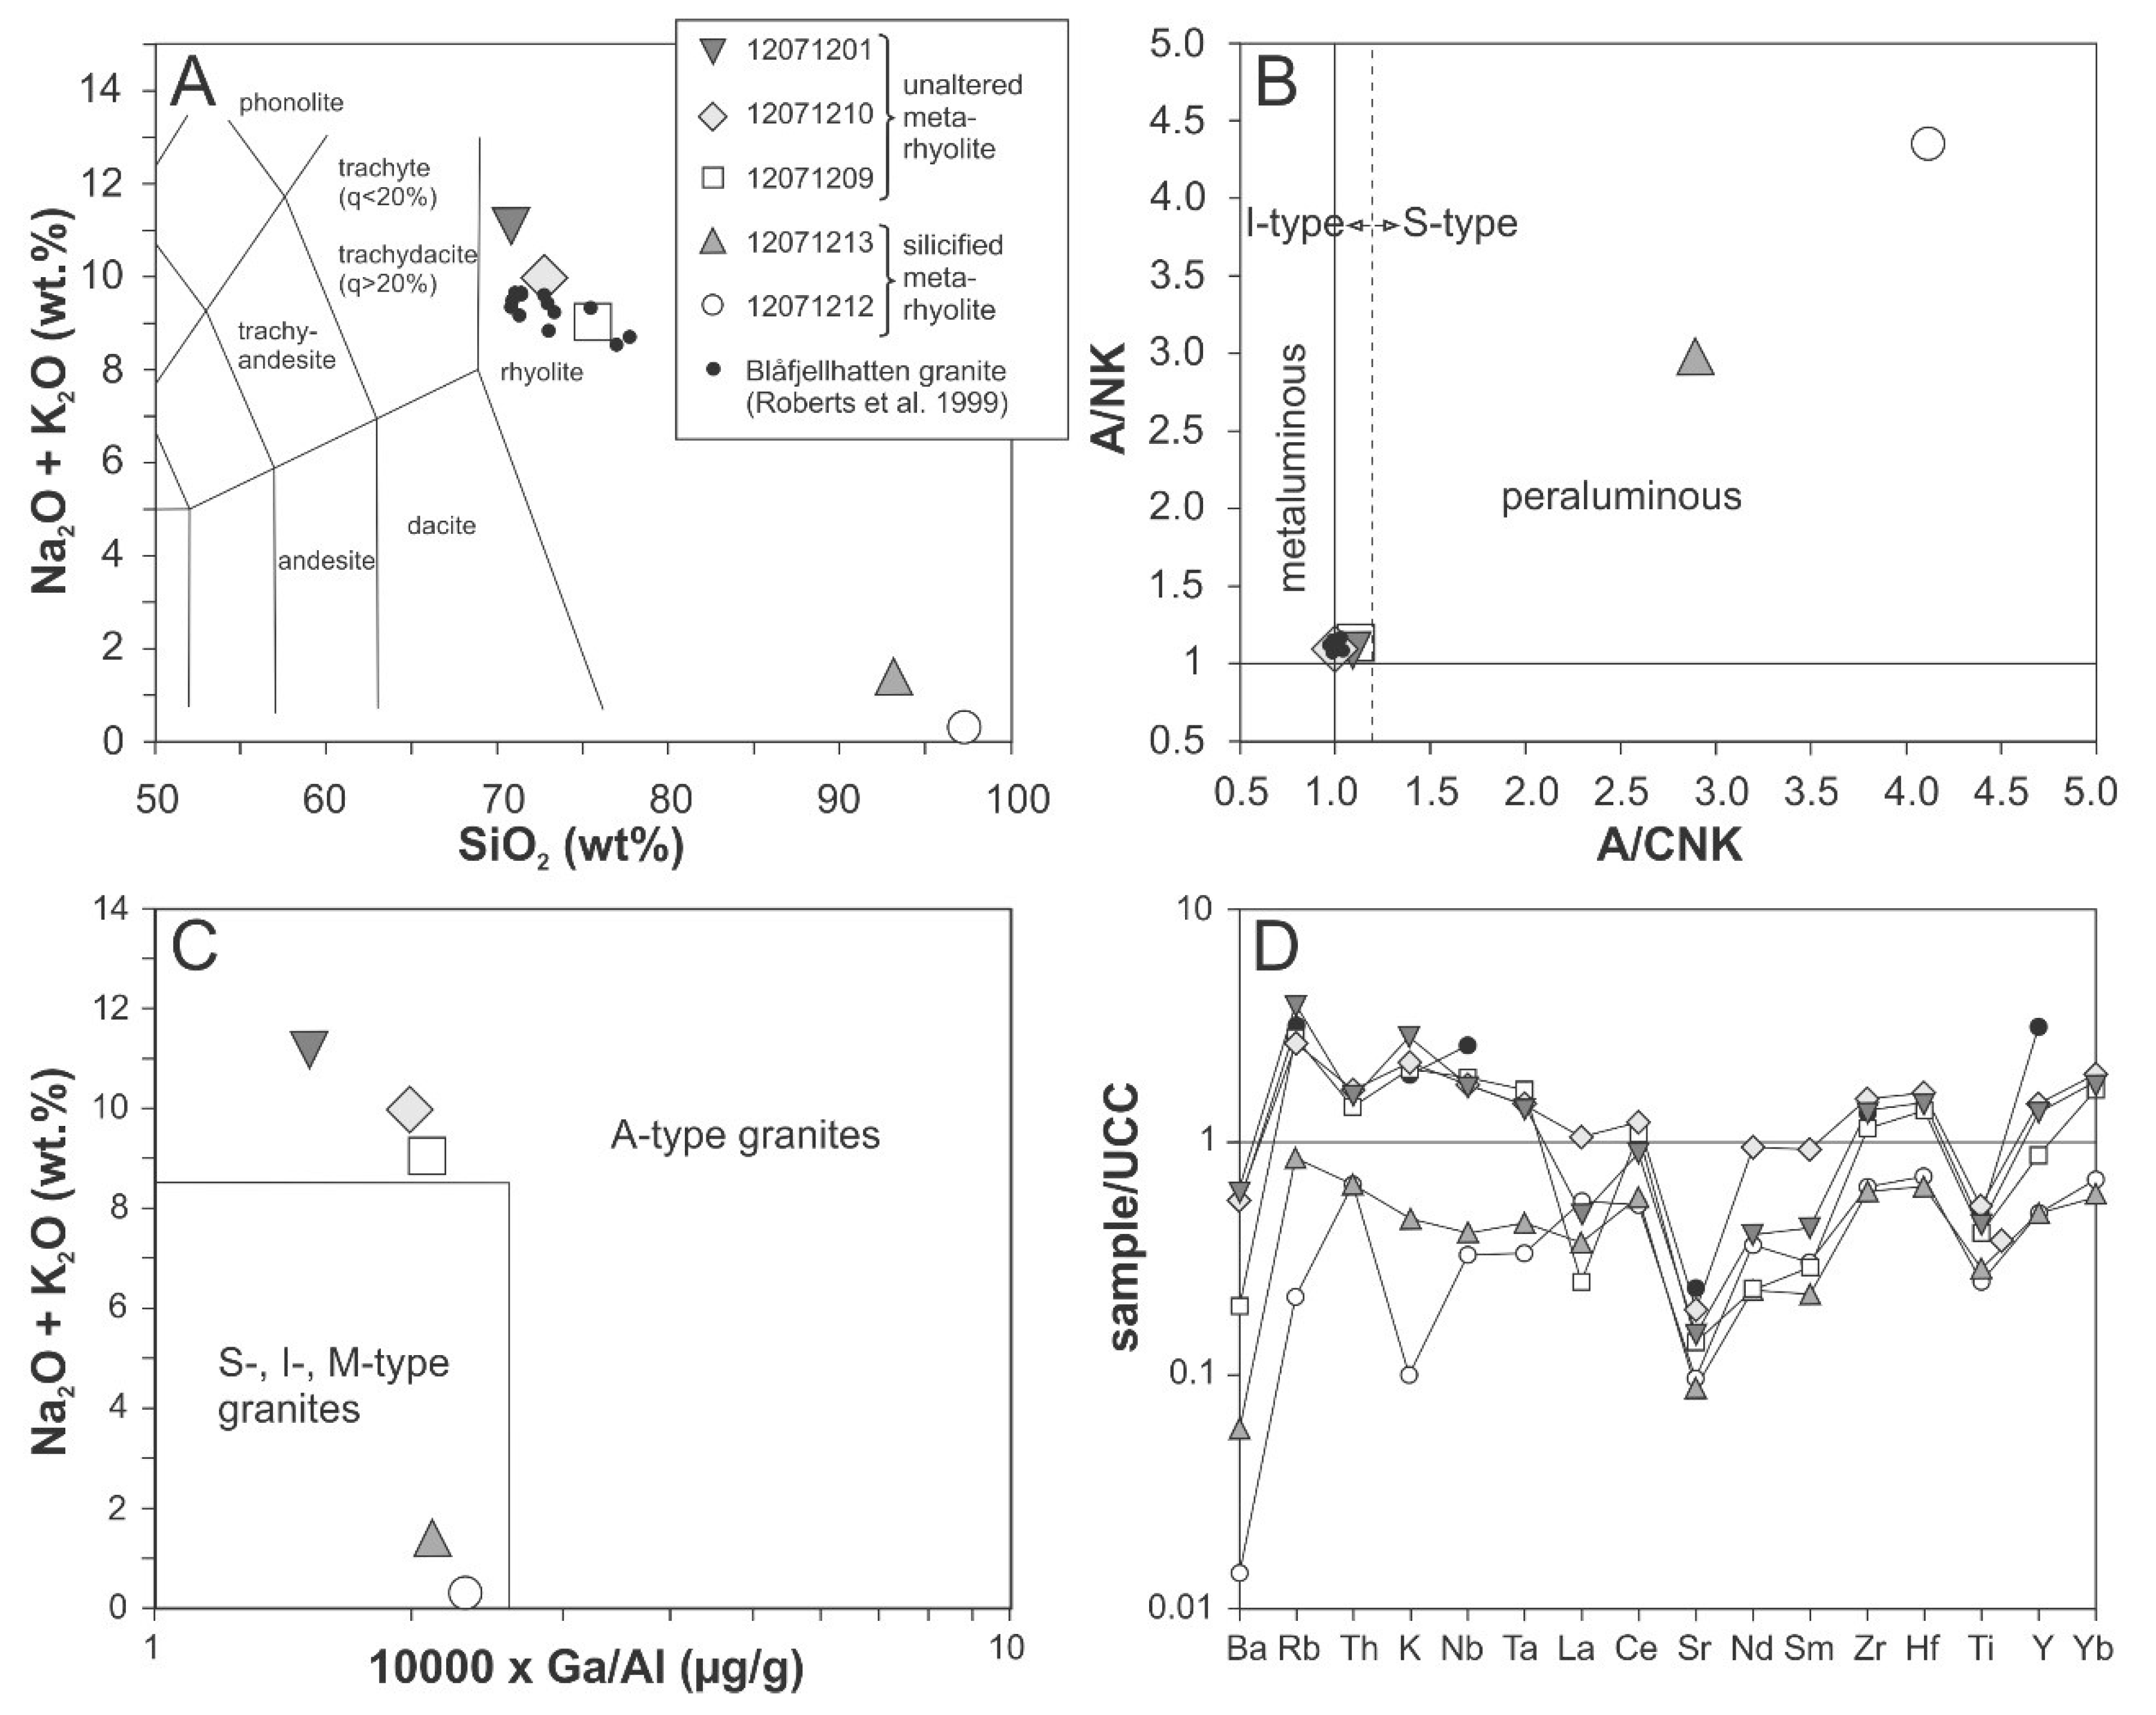
Figure 7.
40Ar/39Ar degassing spectra and inverse isochron results. See text for denotations. Uncertainties are reported at the 1.96sd level (95% confidence).
Figure 7.
40Ar/39Ar degassing spectra and inverse isochron results. See text for denotations. Uncertainties are reported at the 1.96sd level (95% confidence).
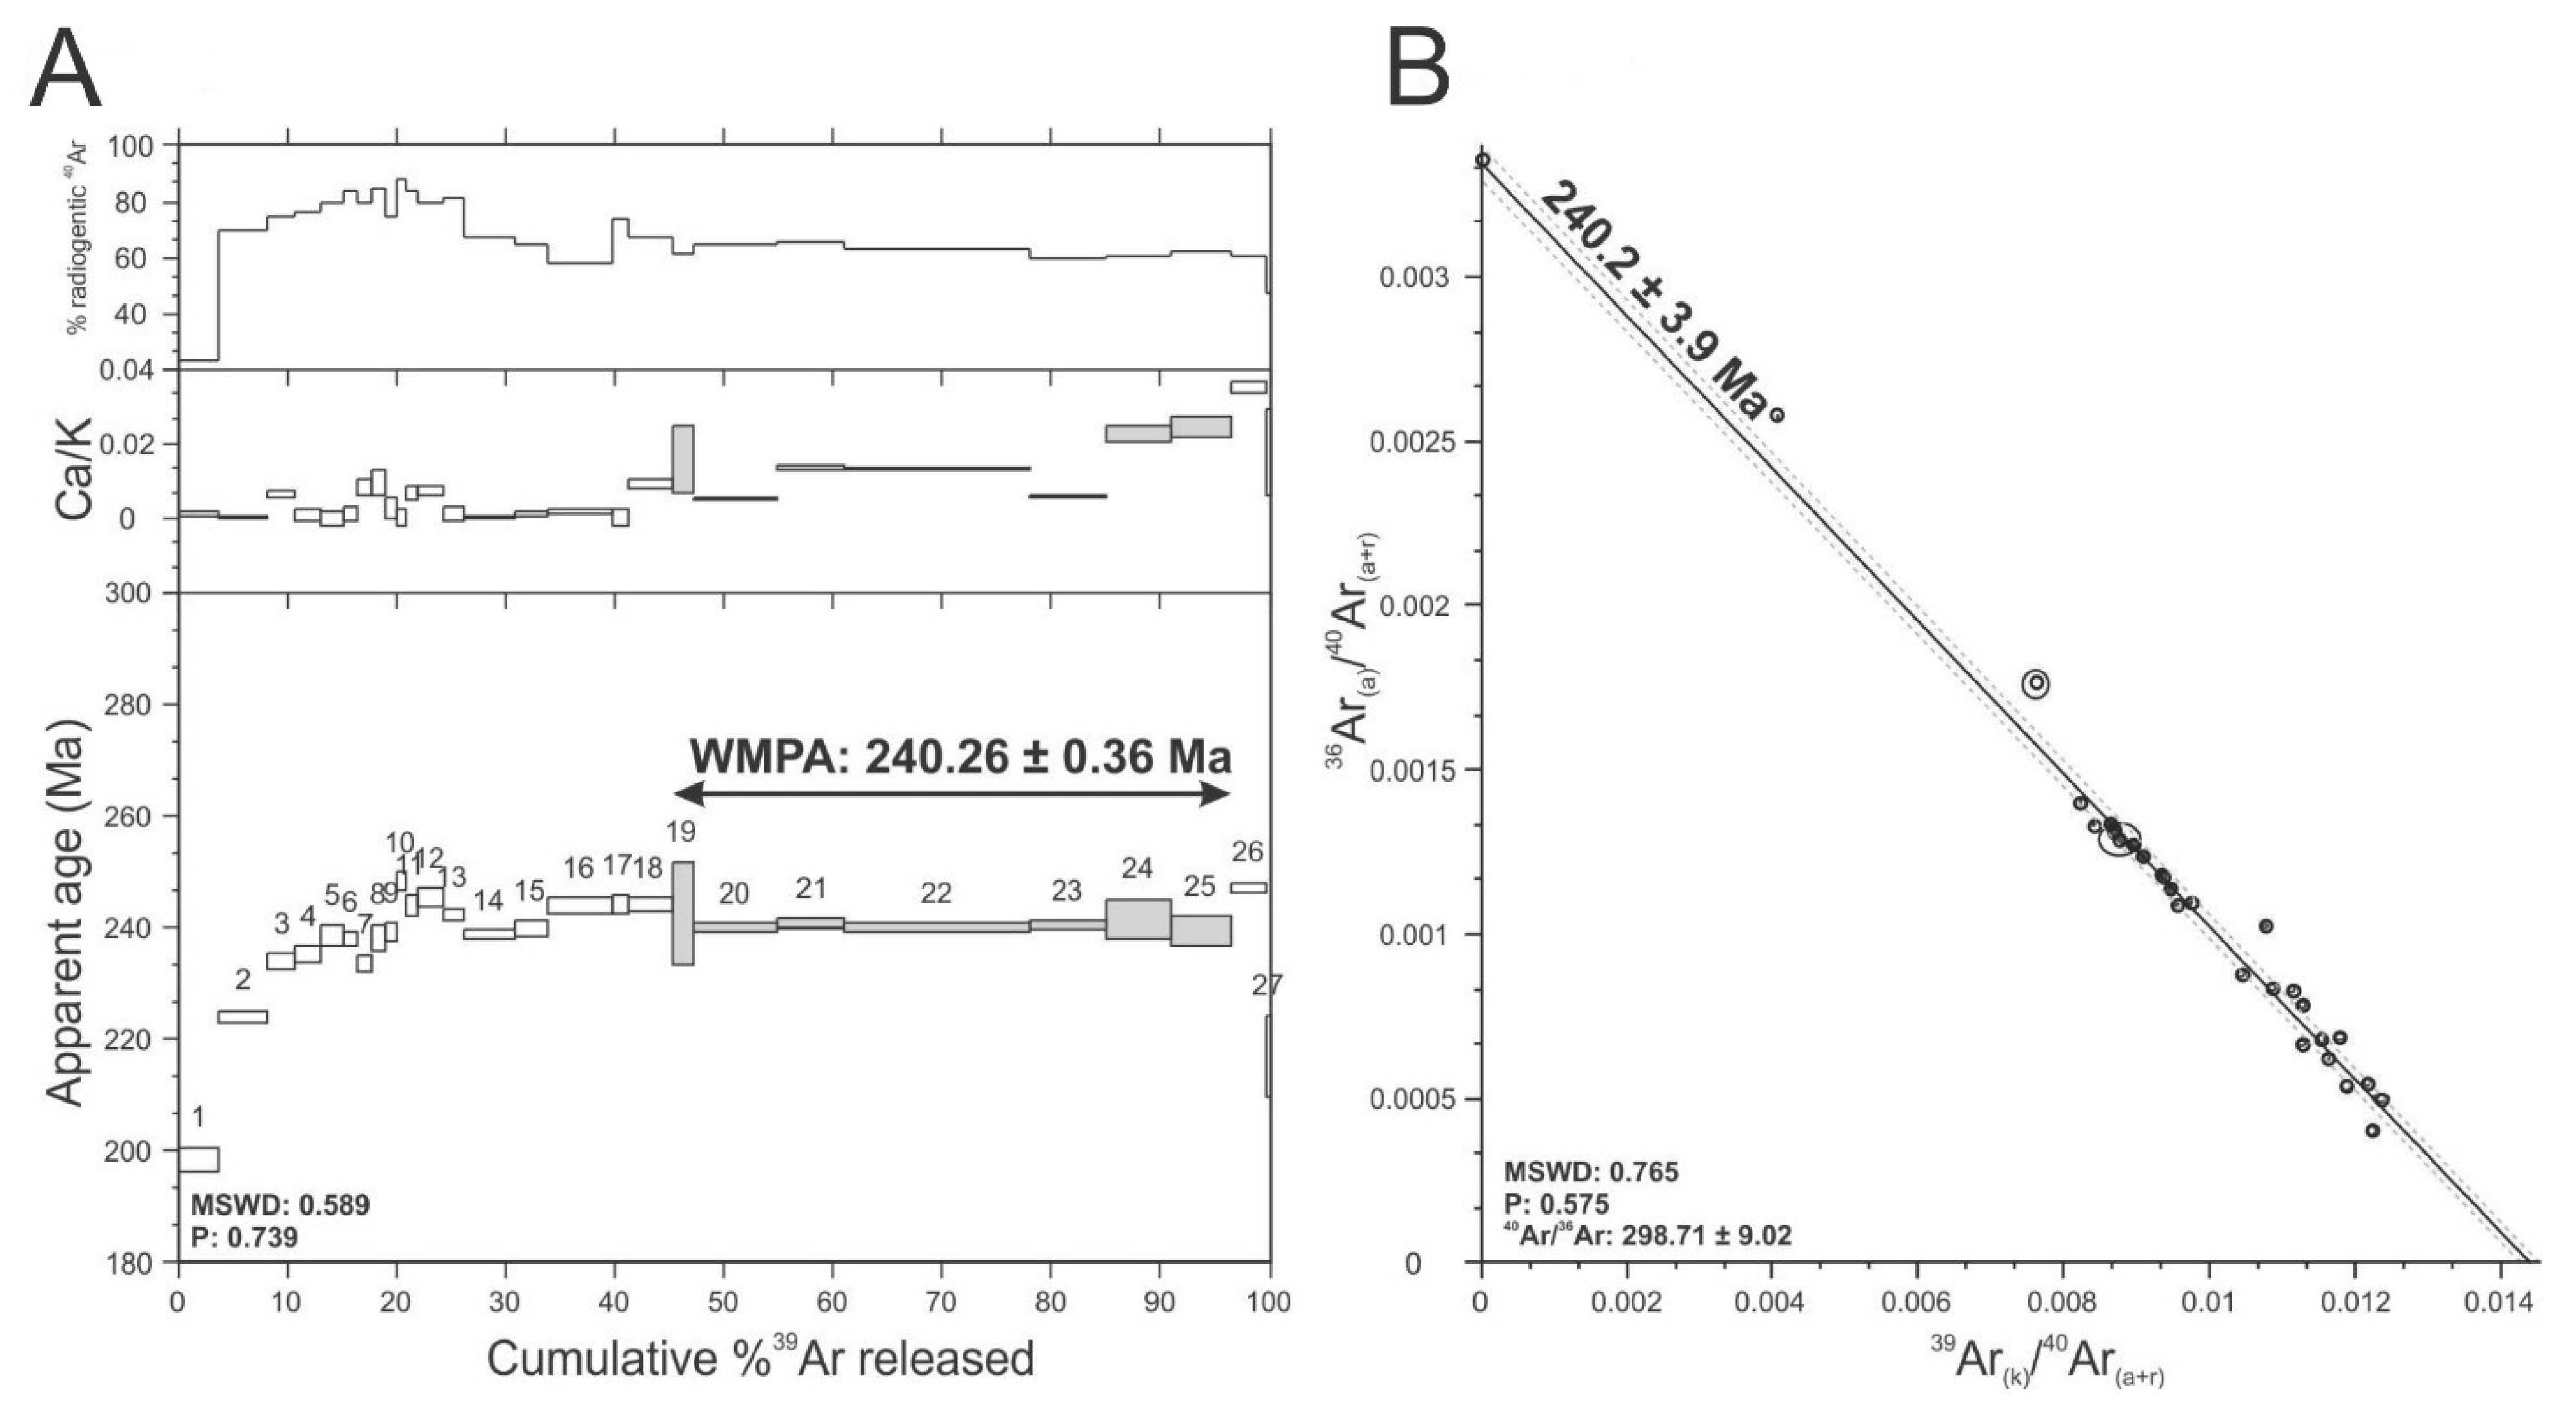
Figure 8.
SEM-CL images of quartz crystals of the Berglia-Glassberget mineralization. The white and black bars indicate the location of ICP-MS ablation rasters with the corresponding Al/Li concentrations. The red circles mark the location of SIMS measurements with corresponding δ18OVSMOW values in ‰ (in red). (A) Sample 12071204, (B) Sample 12071206, (C) Sample 12071215, (D) Sample 12071217, (E) Sample 12071218. Sqtz—secondary quartz.

Figure 9.
Trace element concentrations of quartz crystals forming the matrix of the Berglia-Glassberget. Concentrations were determined with LA-ICP-MS. (A) Al versus Li plot. Arrows indicate atomic ratios 1:1 and 2:1. The orange-shaded area corresponds to values of quartz from the Li-rich Tres Arroyos granite-pegmatite suite (Spain) [61] and the blue-shaded area those from the Li-bearing Land’s End pluton in Cornwall (UK) [60]. (B) Logarithmic Ti versus Al plot of quartz of the Berglia-Glassberget breccia compared with data from Rusk [58] including c. 30 porphyry-type (Cu-Mo-Au) deposits, orogenic Au deposits, and epithermal deposits. The hatched field corresponds to the Berglia-Glassberget dataset because the Ti contents are below the detection limit of 0.5 µg/g. For symbol explanation see Figure 9A.

Figure 10.
Representative fluid inclusions in quartz crystals of the breccia of Berglia-Glassberget. (A) Aqueous Type I inclusion containing a CO2 bubble and several large solids including nahcolite and a sulphate, (B) Aqueous Type II inclusion with a CO2 bubble and two solids, nahcolite and a sulphate, (C) Aqueous Type III inclusion with a CO2 bubble and a nahcolite crystal. L—liquid phase, V—volatile phase, S—Solid.

Figure 11.
(A–C) Variation profiles of δ18O values across three quartz crystals (see also Figure 8 for location of the SIMS measurements within the crystals). (D–F) Histograms of measured δ18O values shown in the profiles (A–C). Grey bars are δ18O values related to major quartz crystal growth (primary quartz). Black bars represent quartz δ18O values affected by late- to post-crystallization processes.

Figure 12.
Geotectonic setting and relationship to the Møre Trøndelag Fault Complex (MTFC) comprising the Hitra-Snåsa and Verran faults. Main post-Caledonian structural elements of southern Norway, the Norwegian continental shelf and adjacent areas related to different rift phases affecting the NE Atlantic region (from Faleide et al. [112,113] updated with onshore elements from Redfield et al. [104,105]).


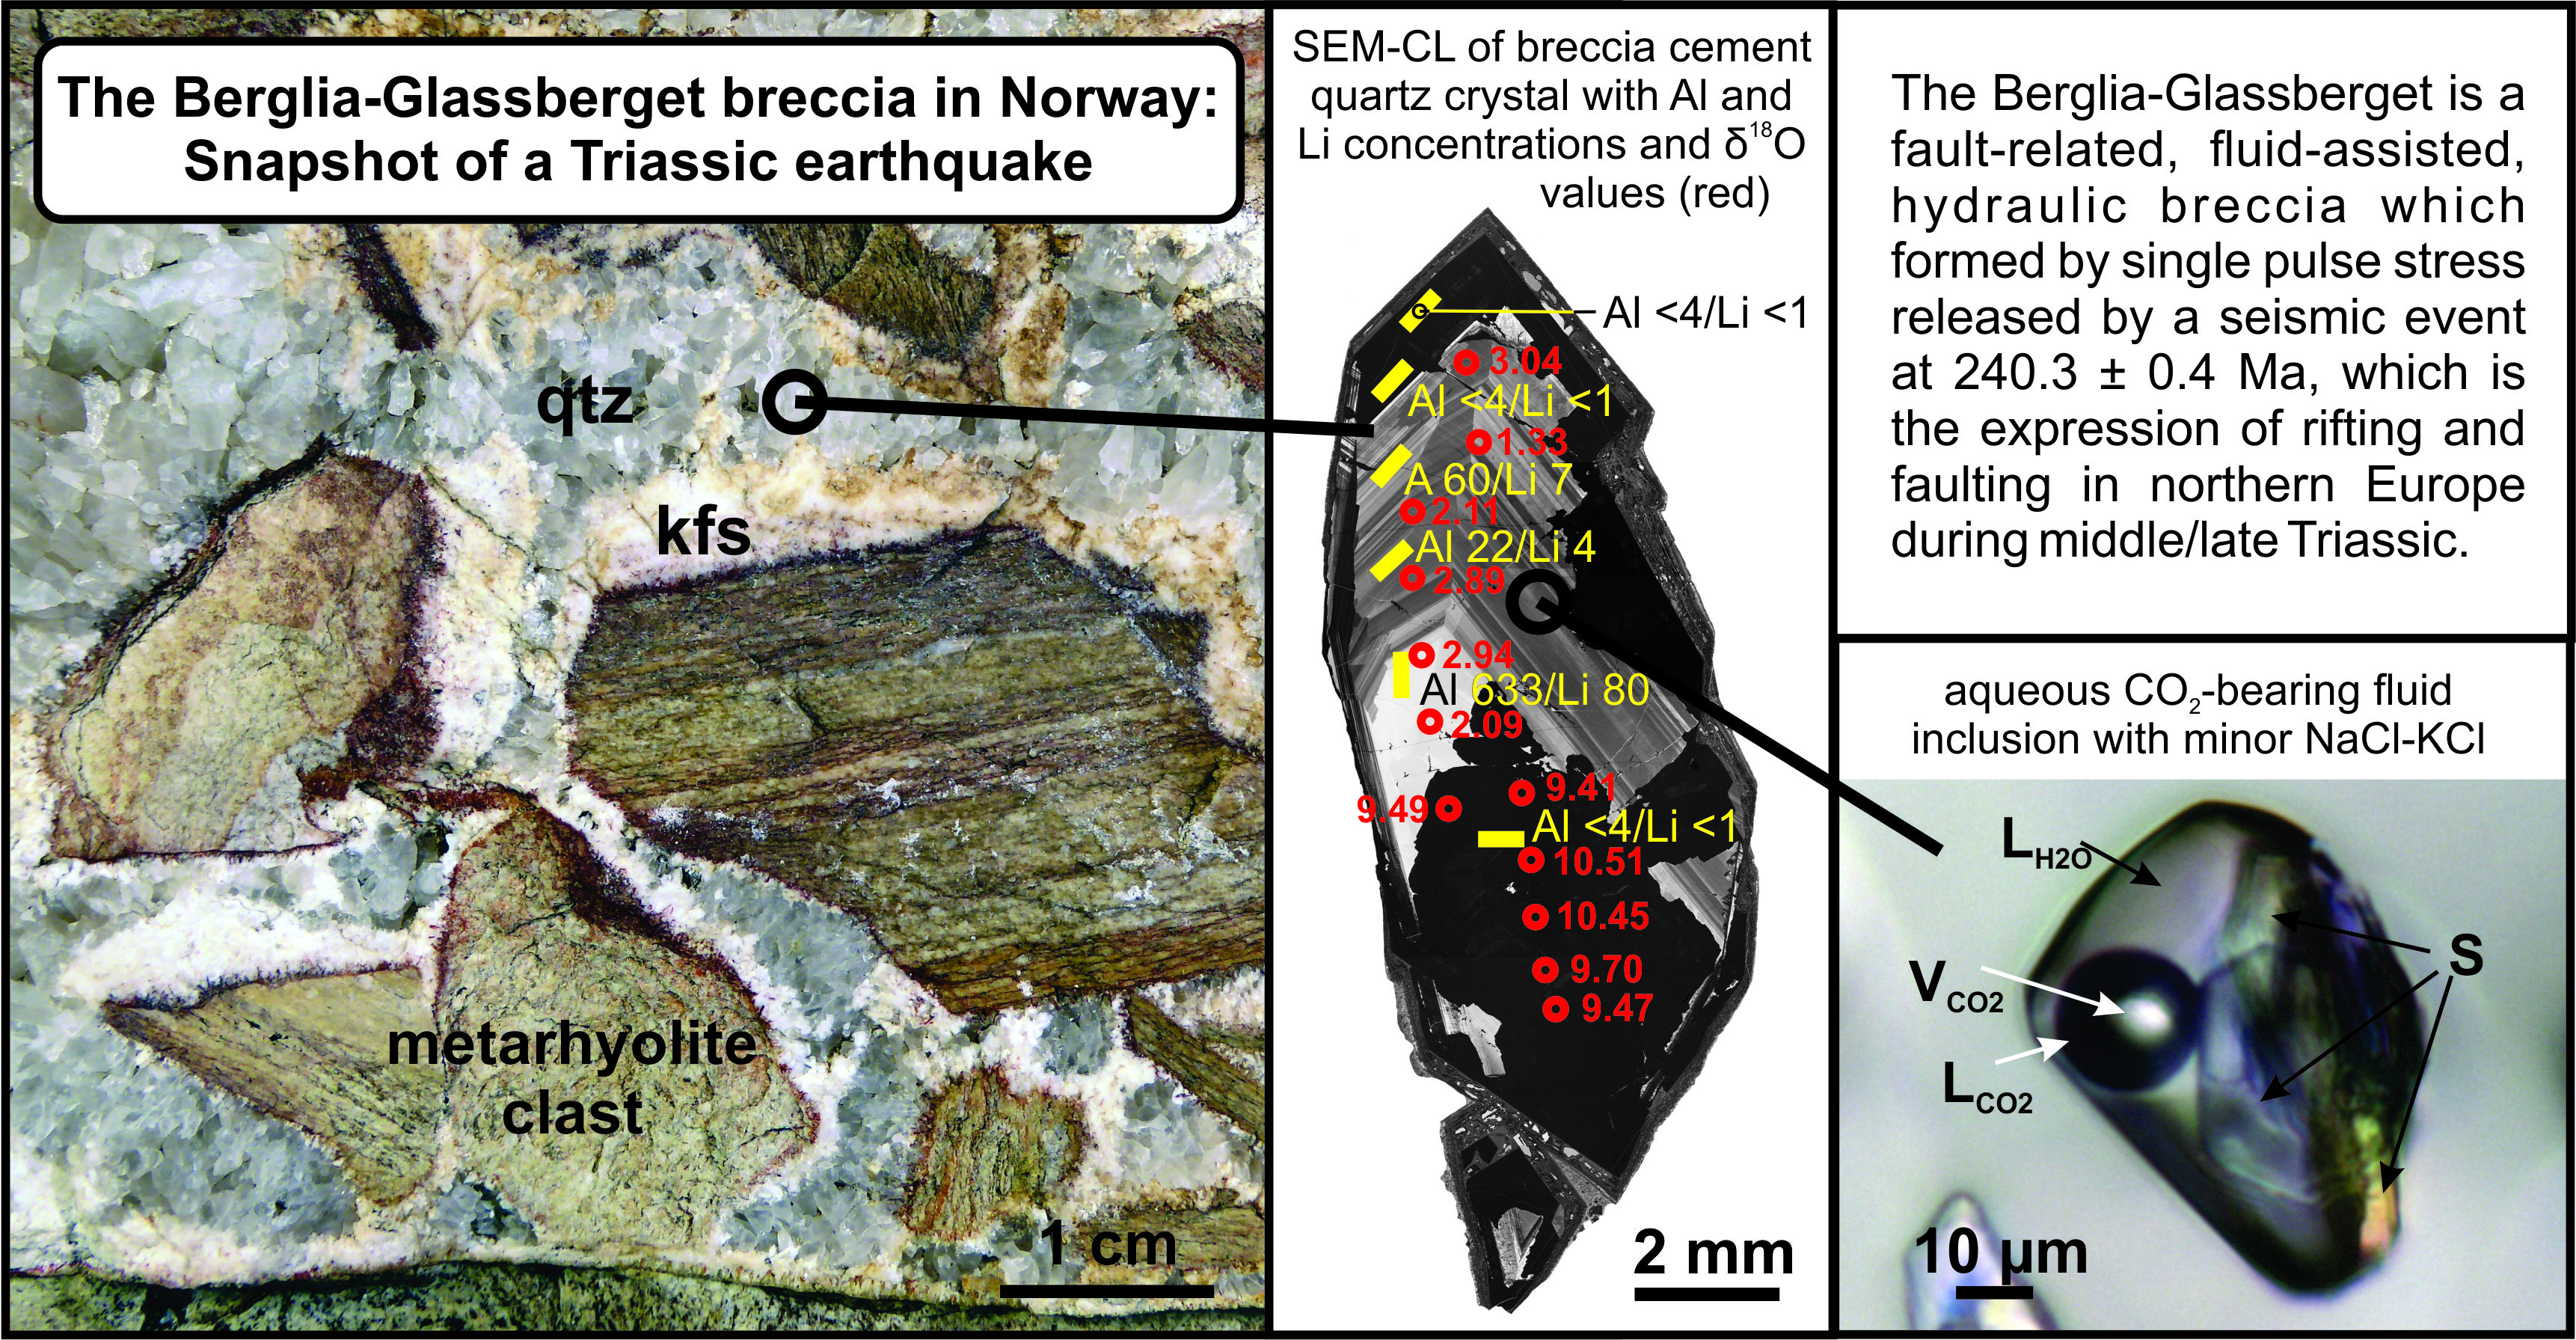
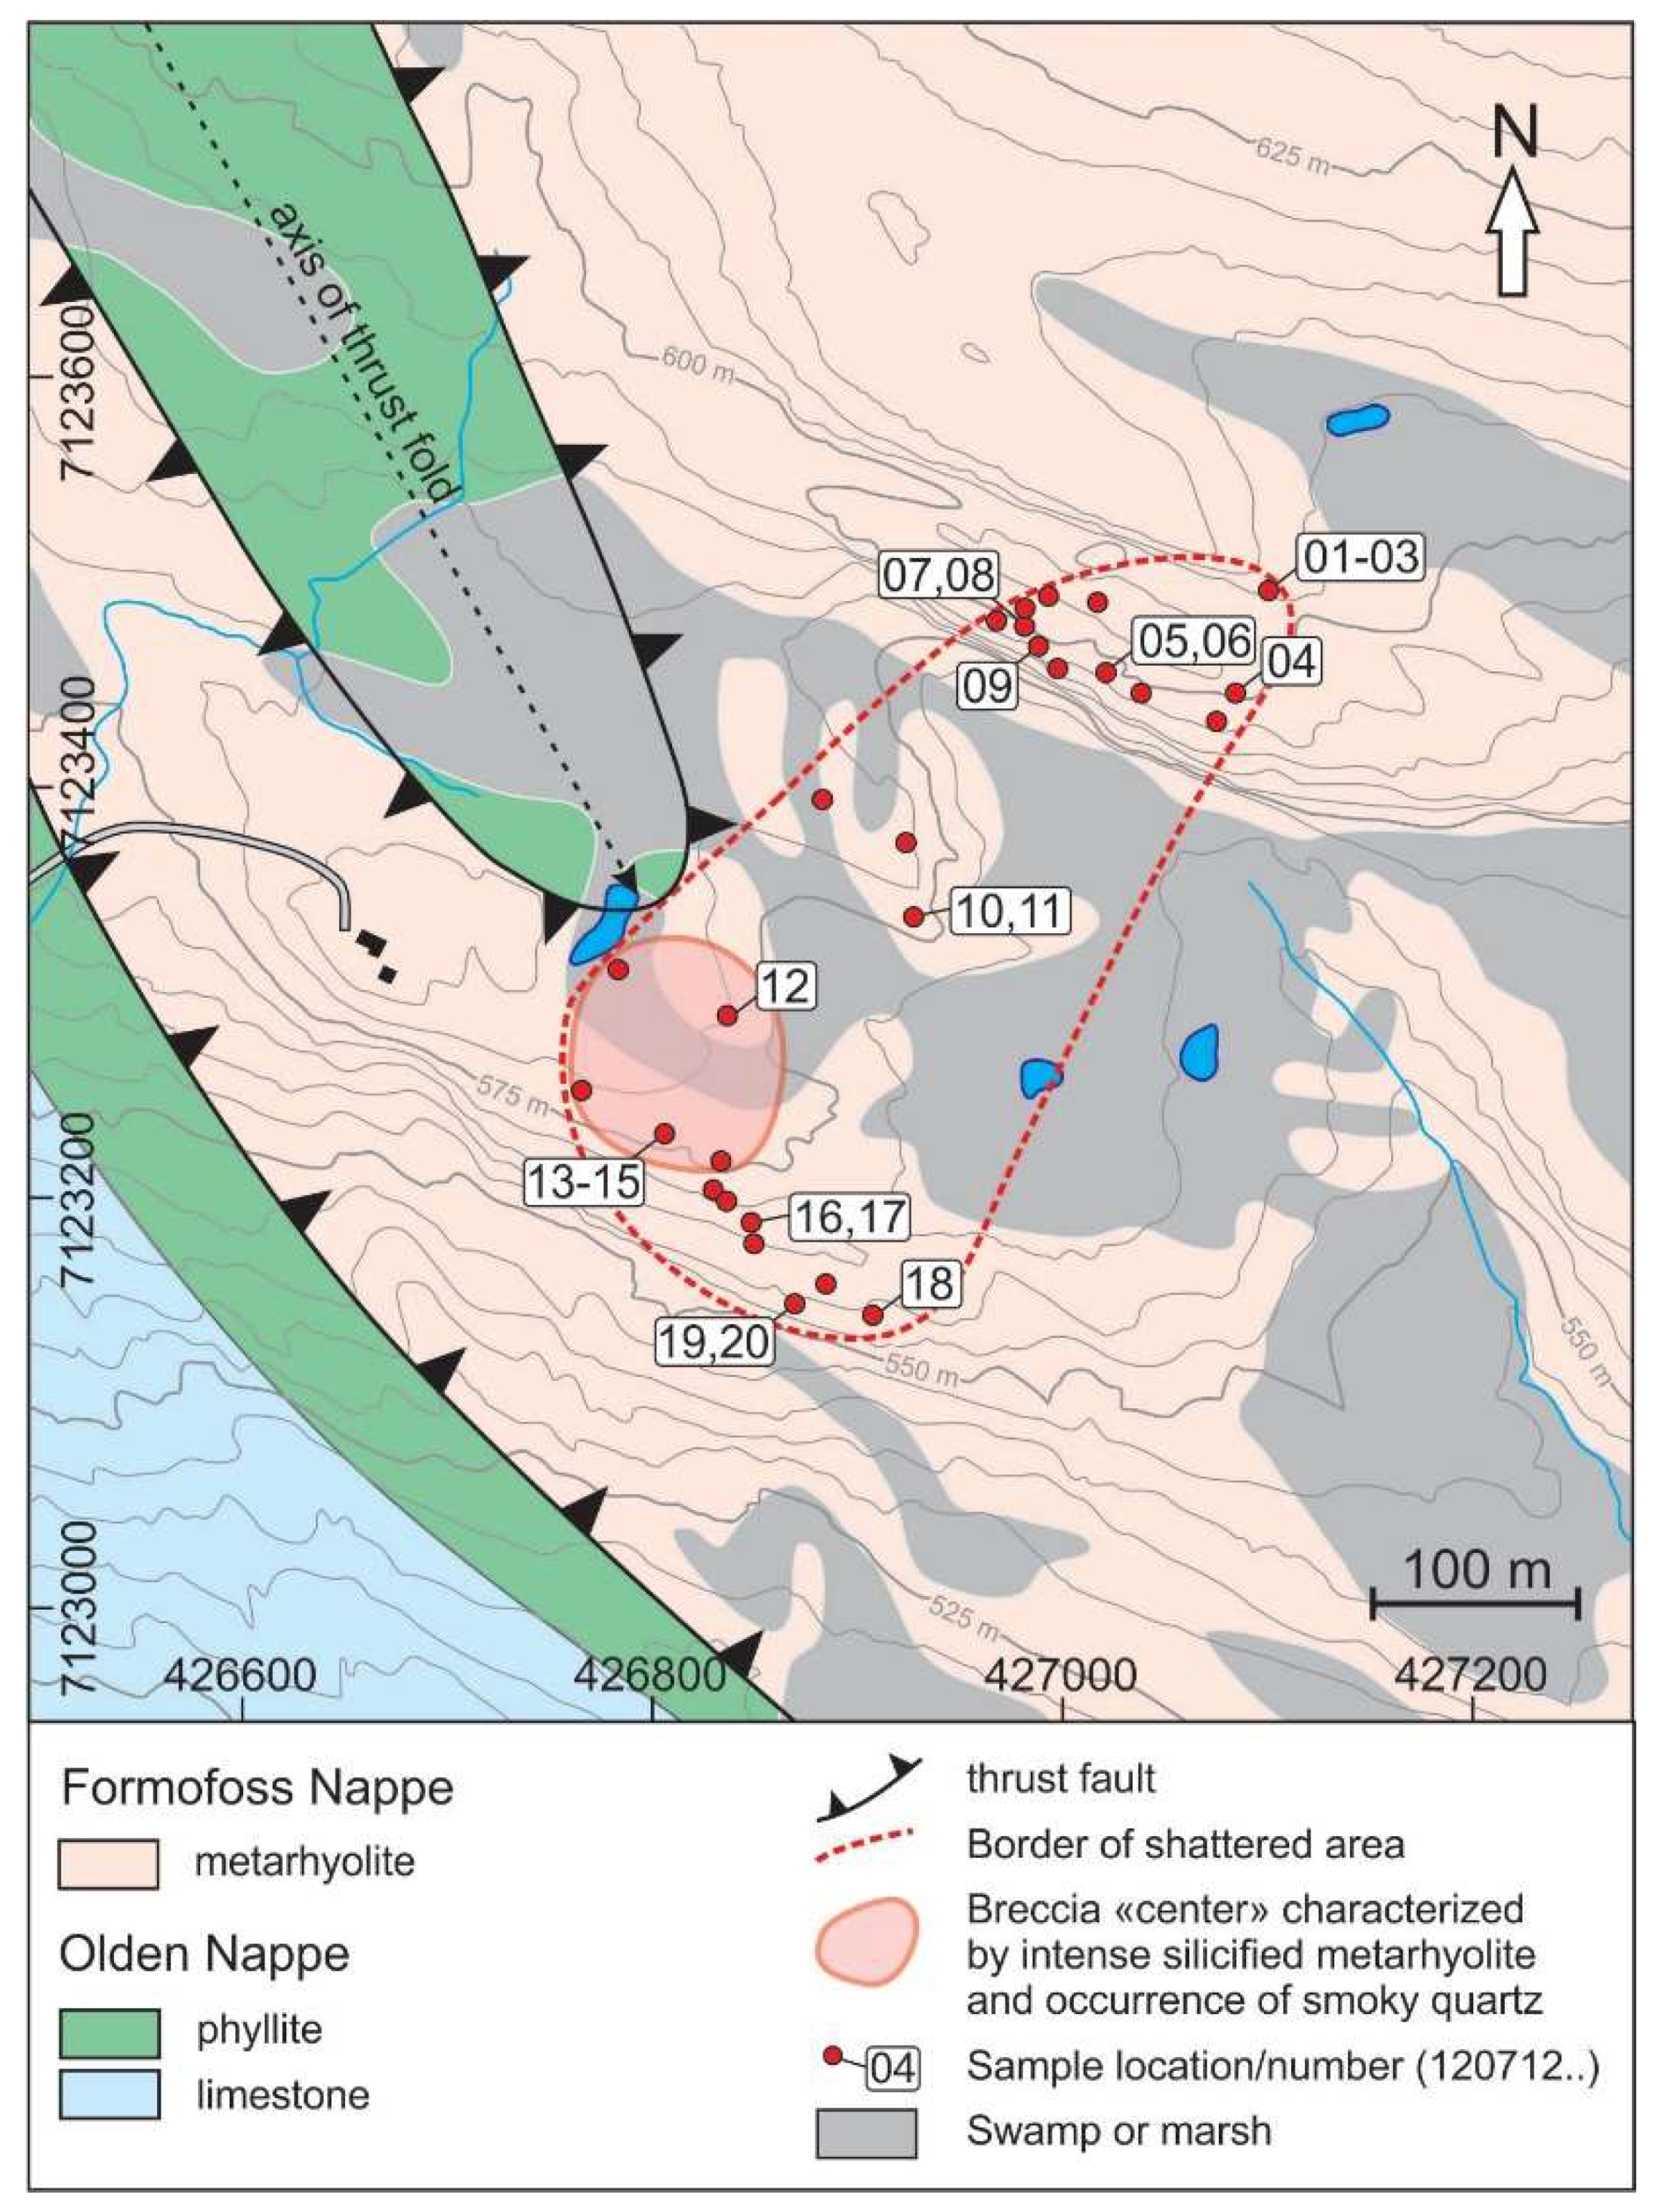
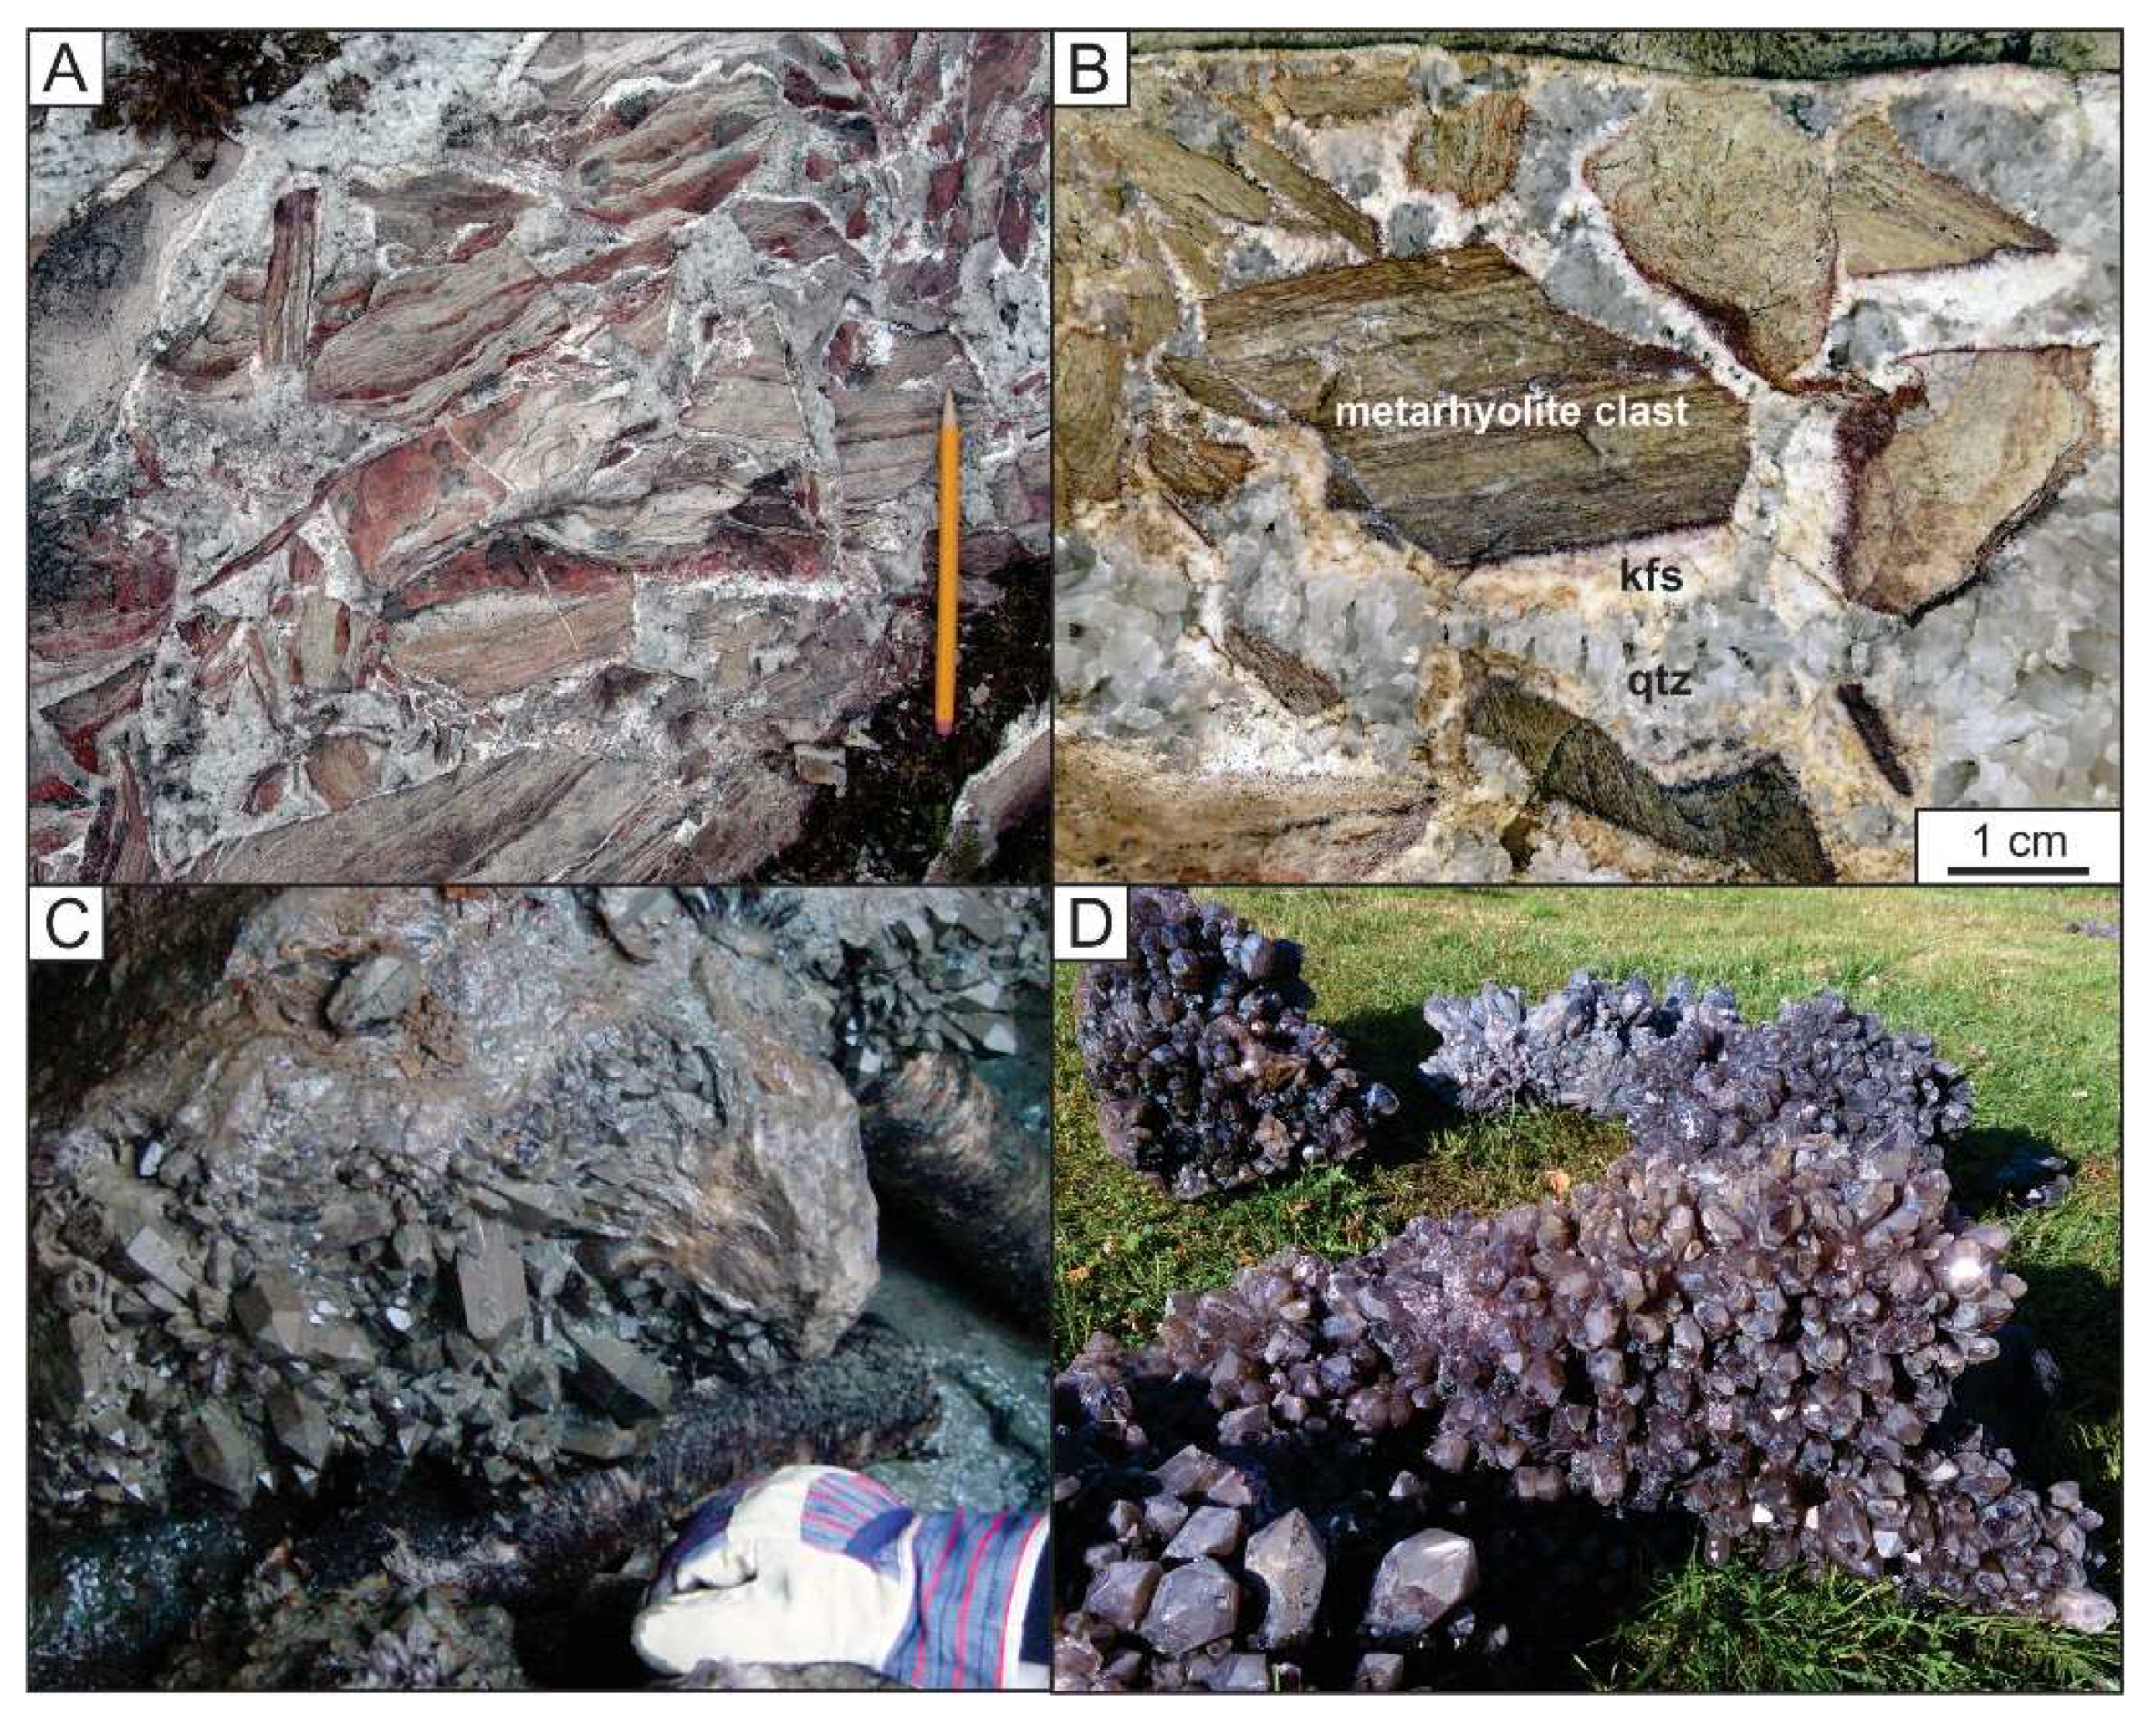
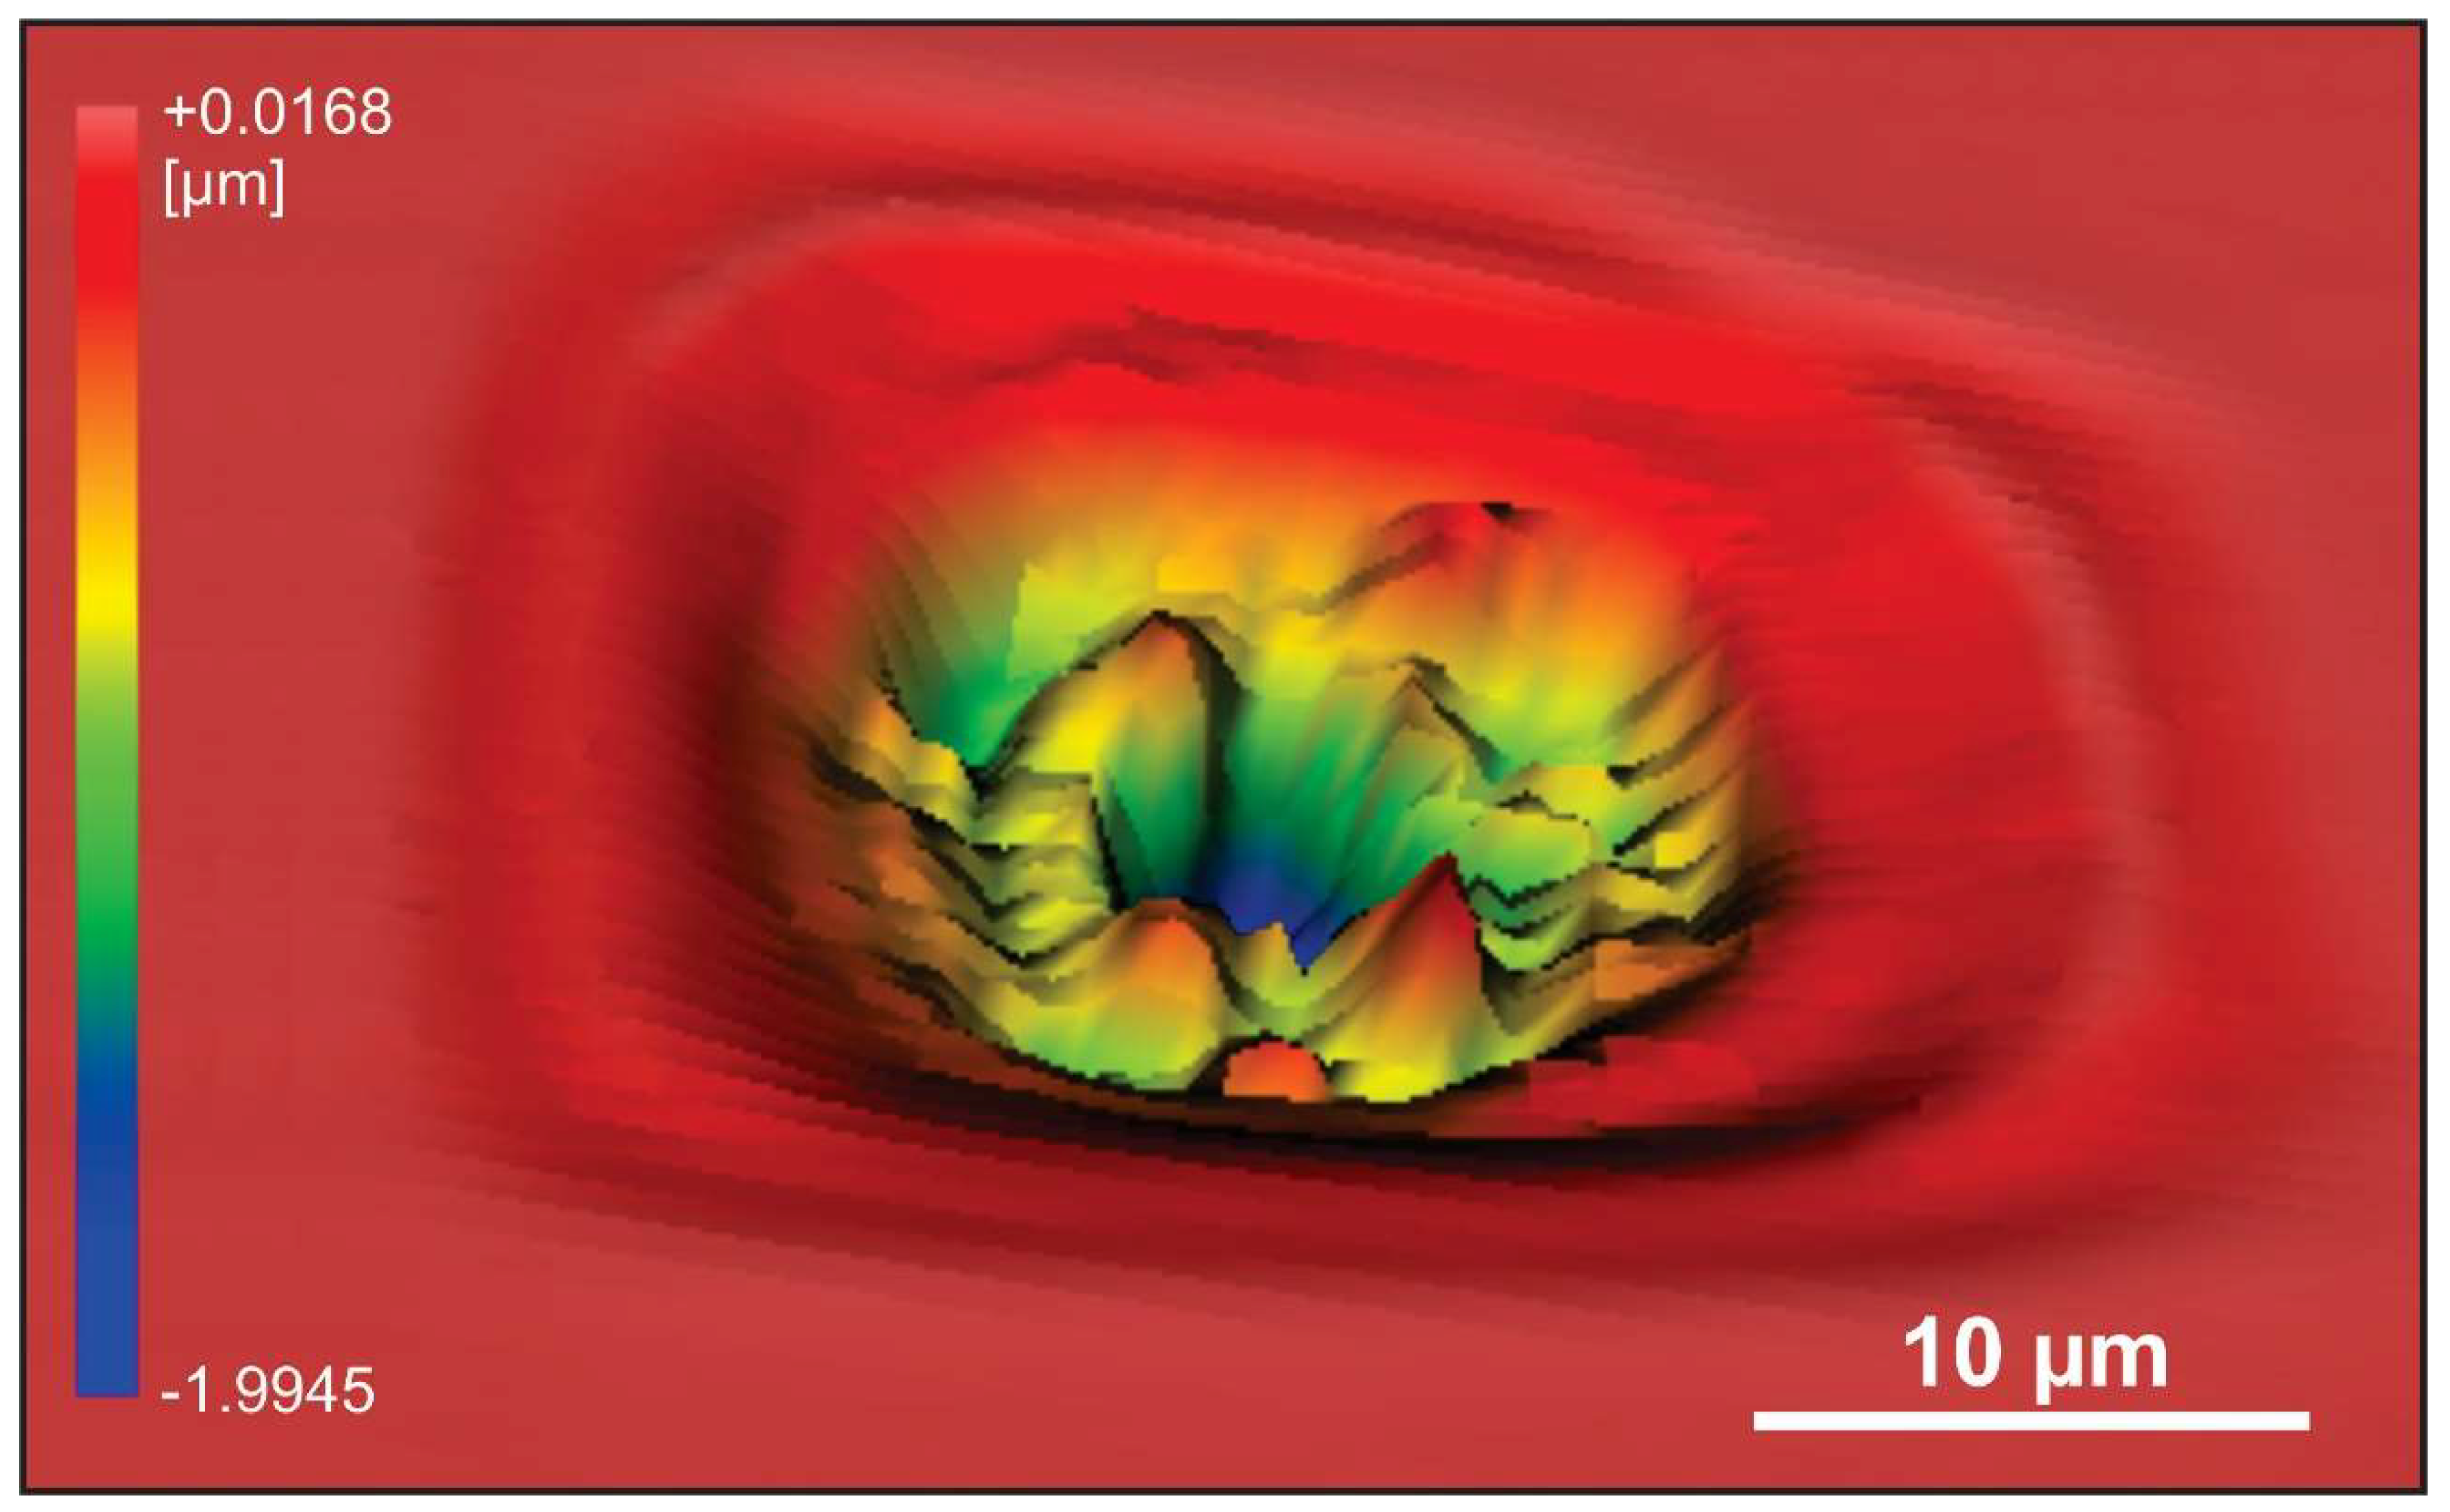
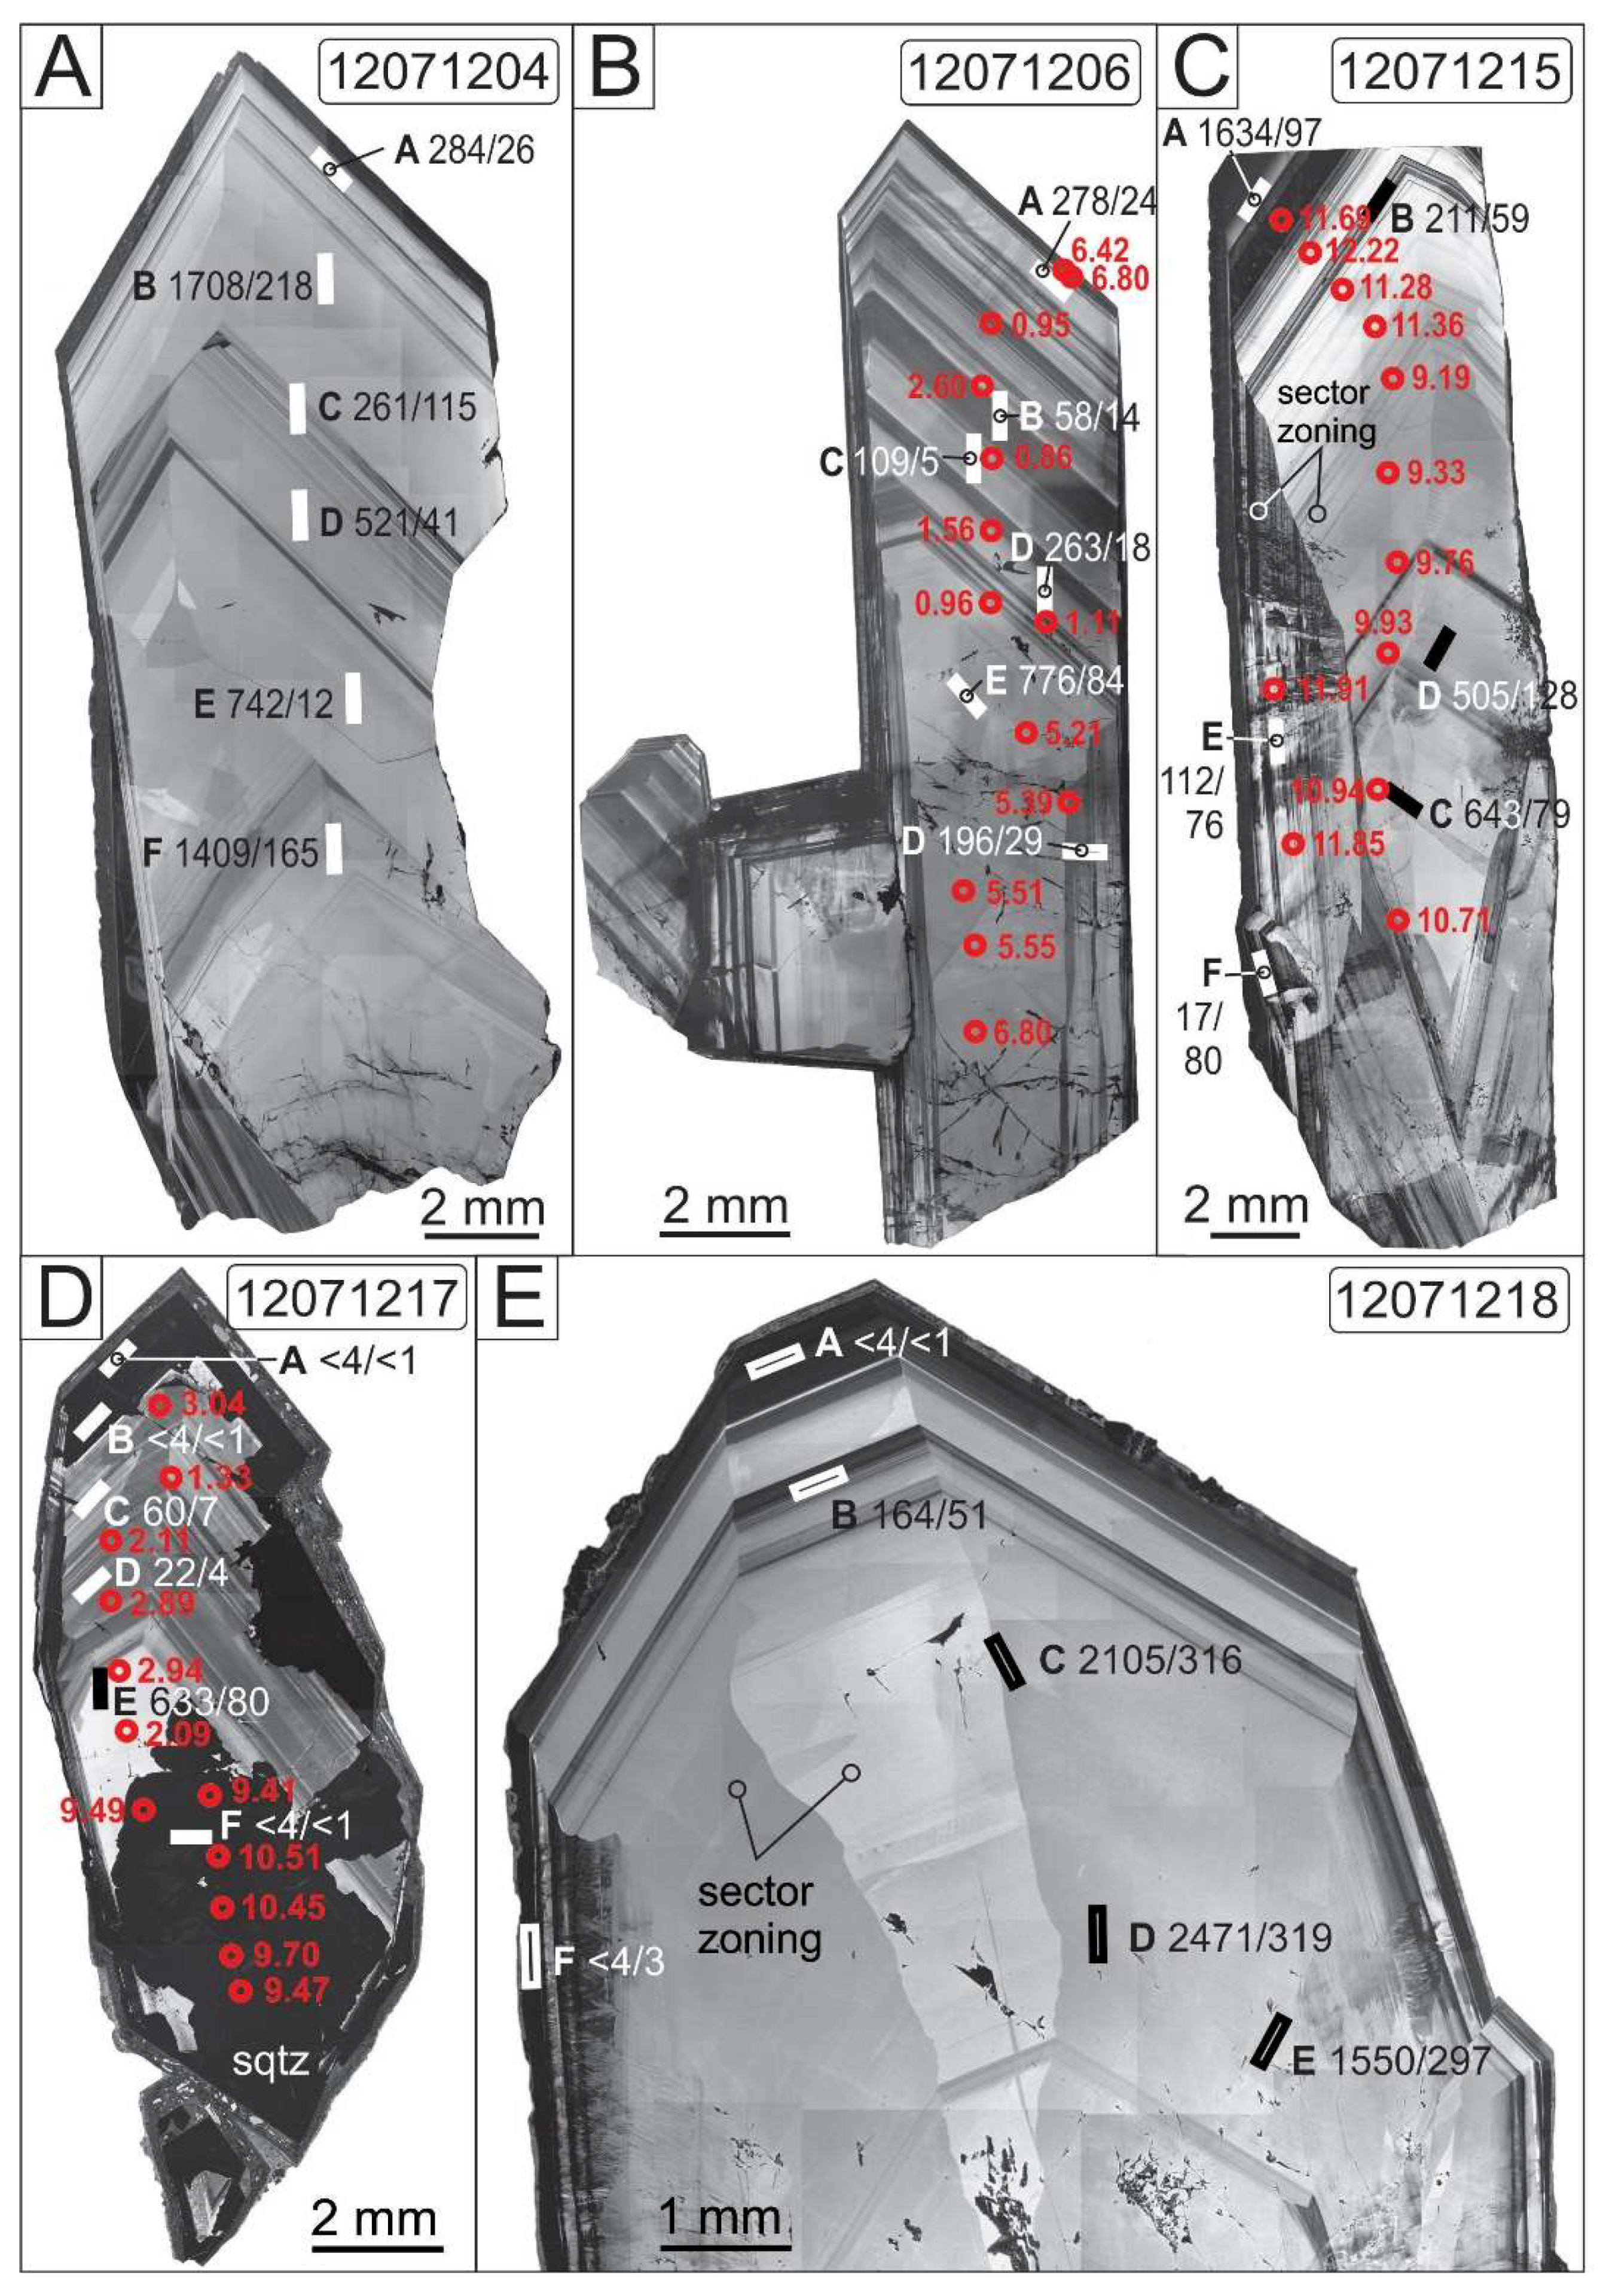
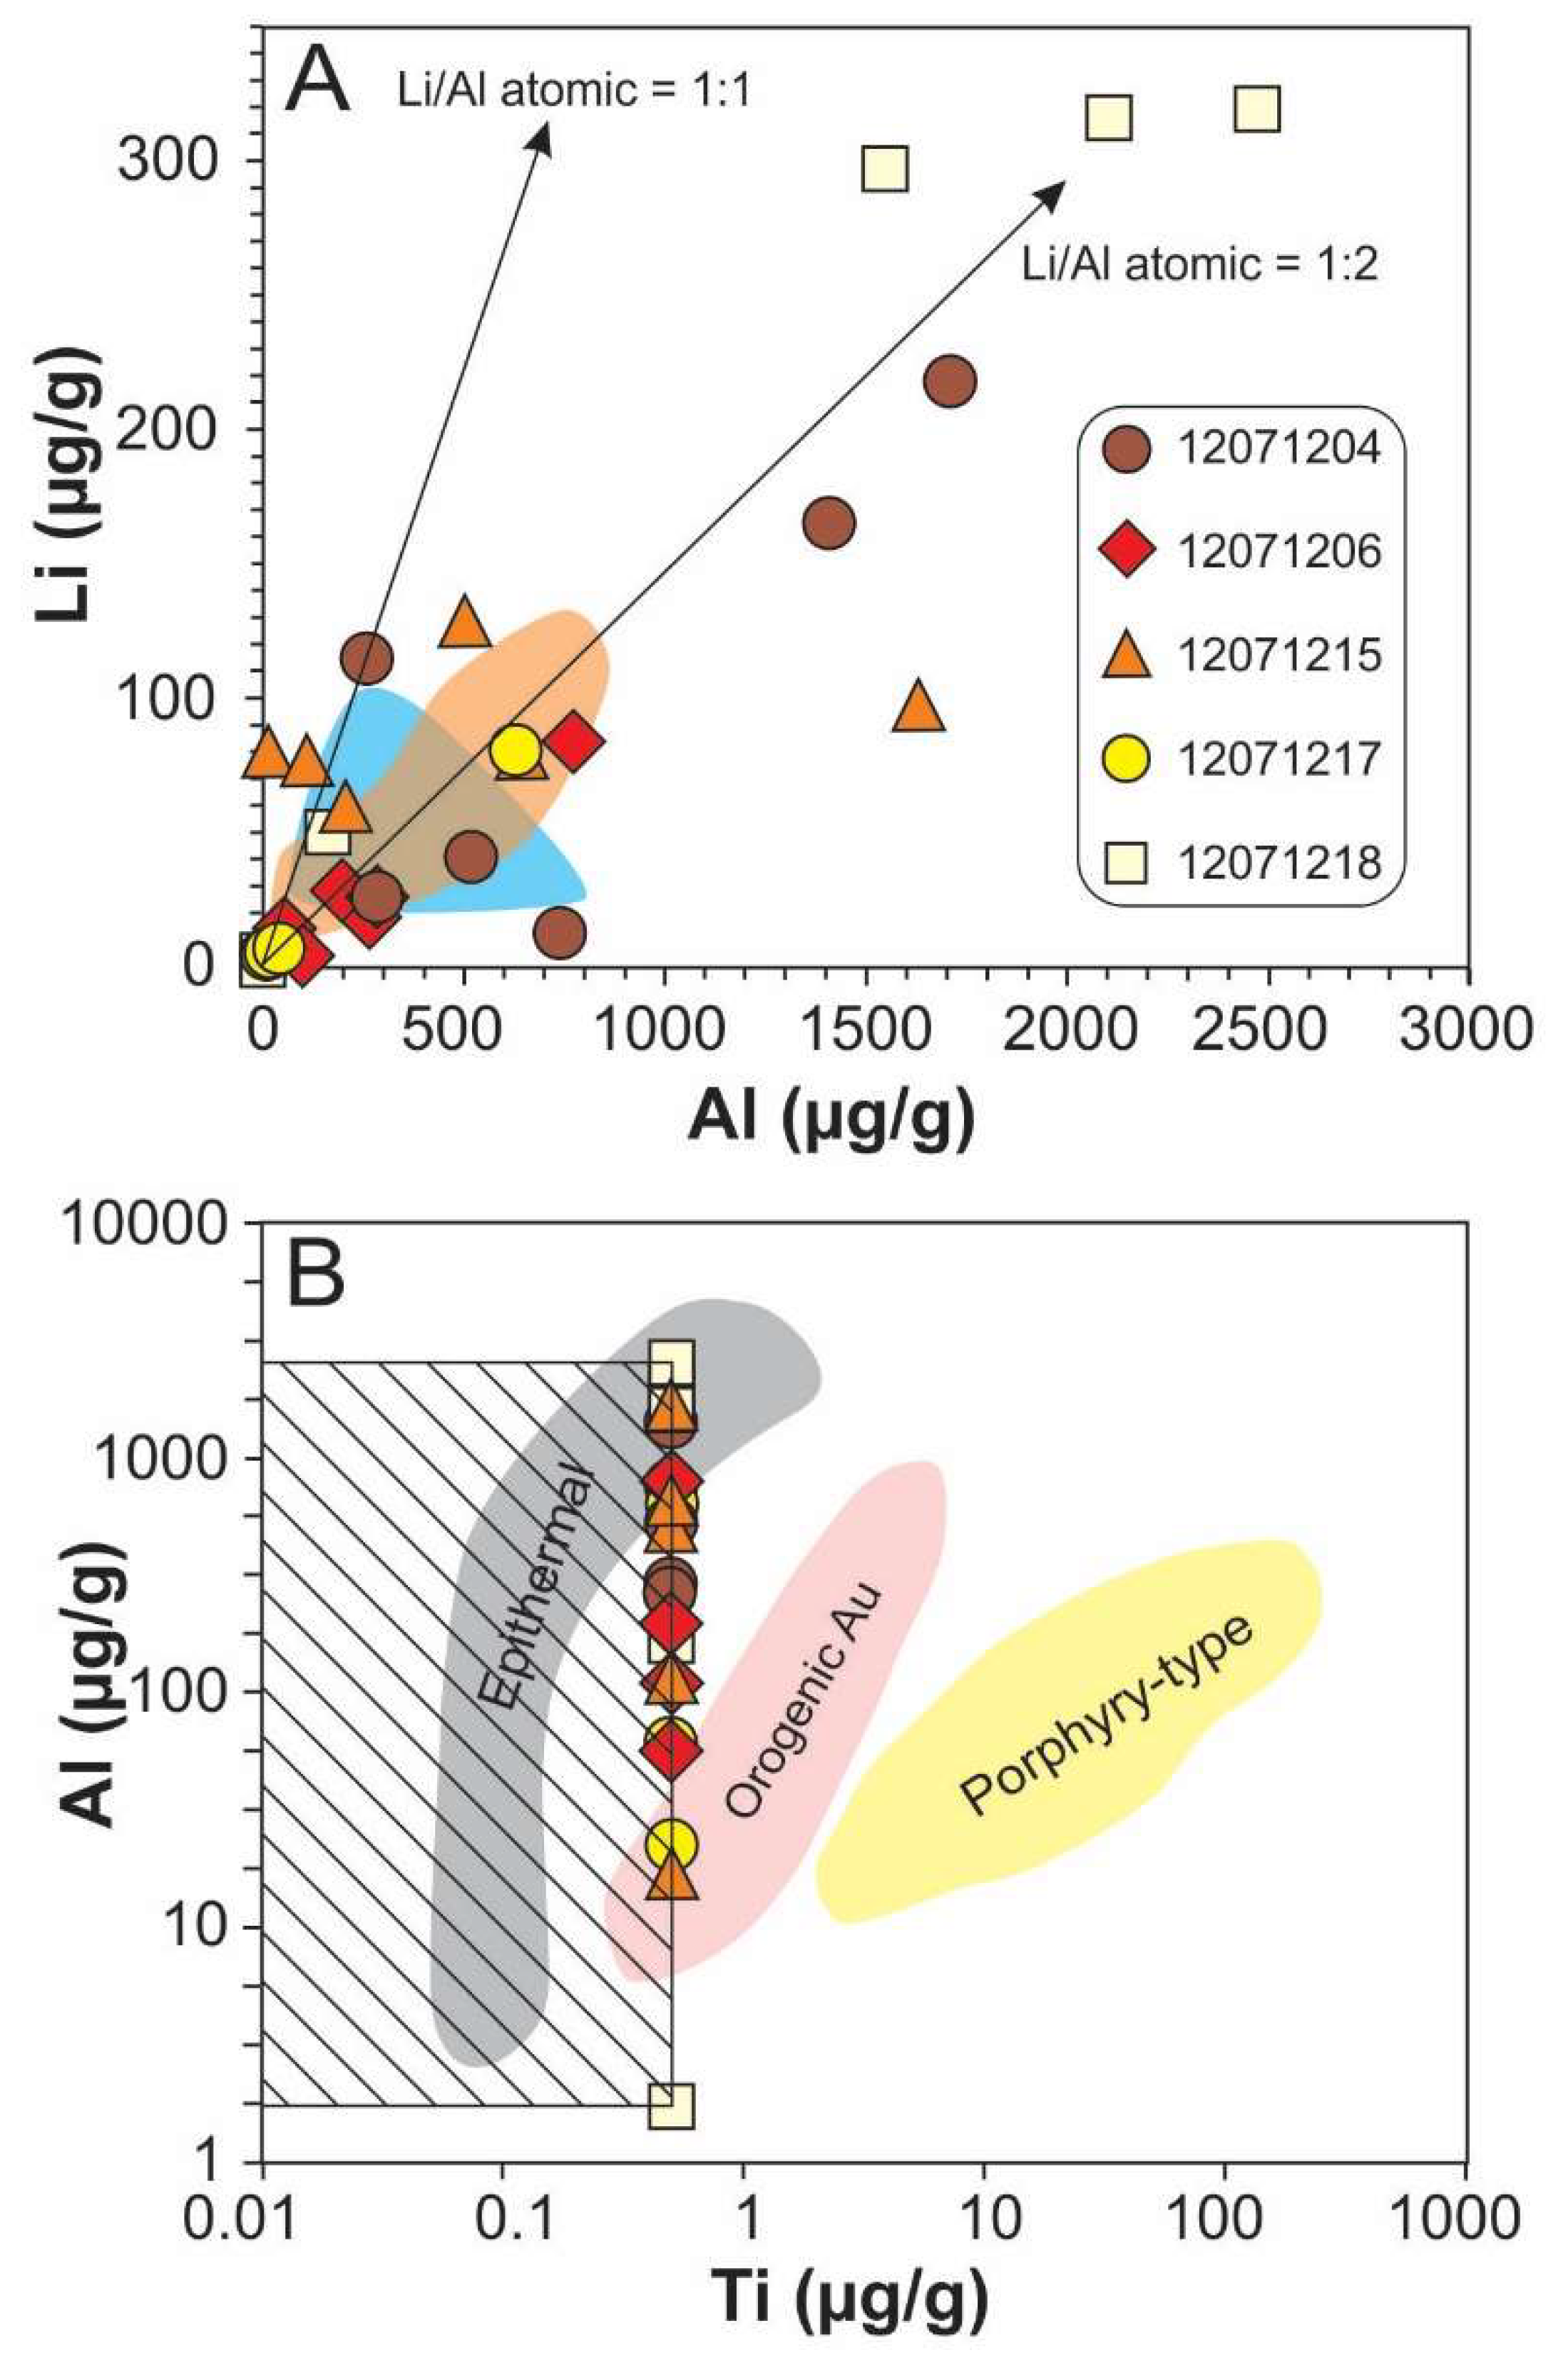
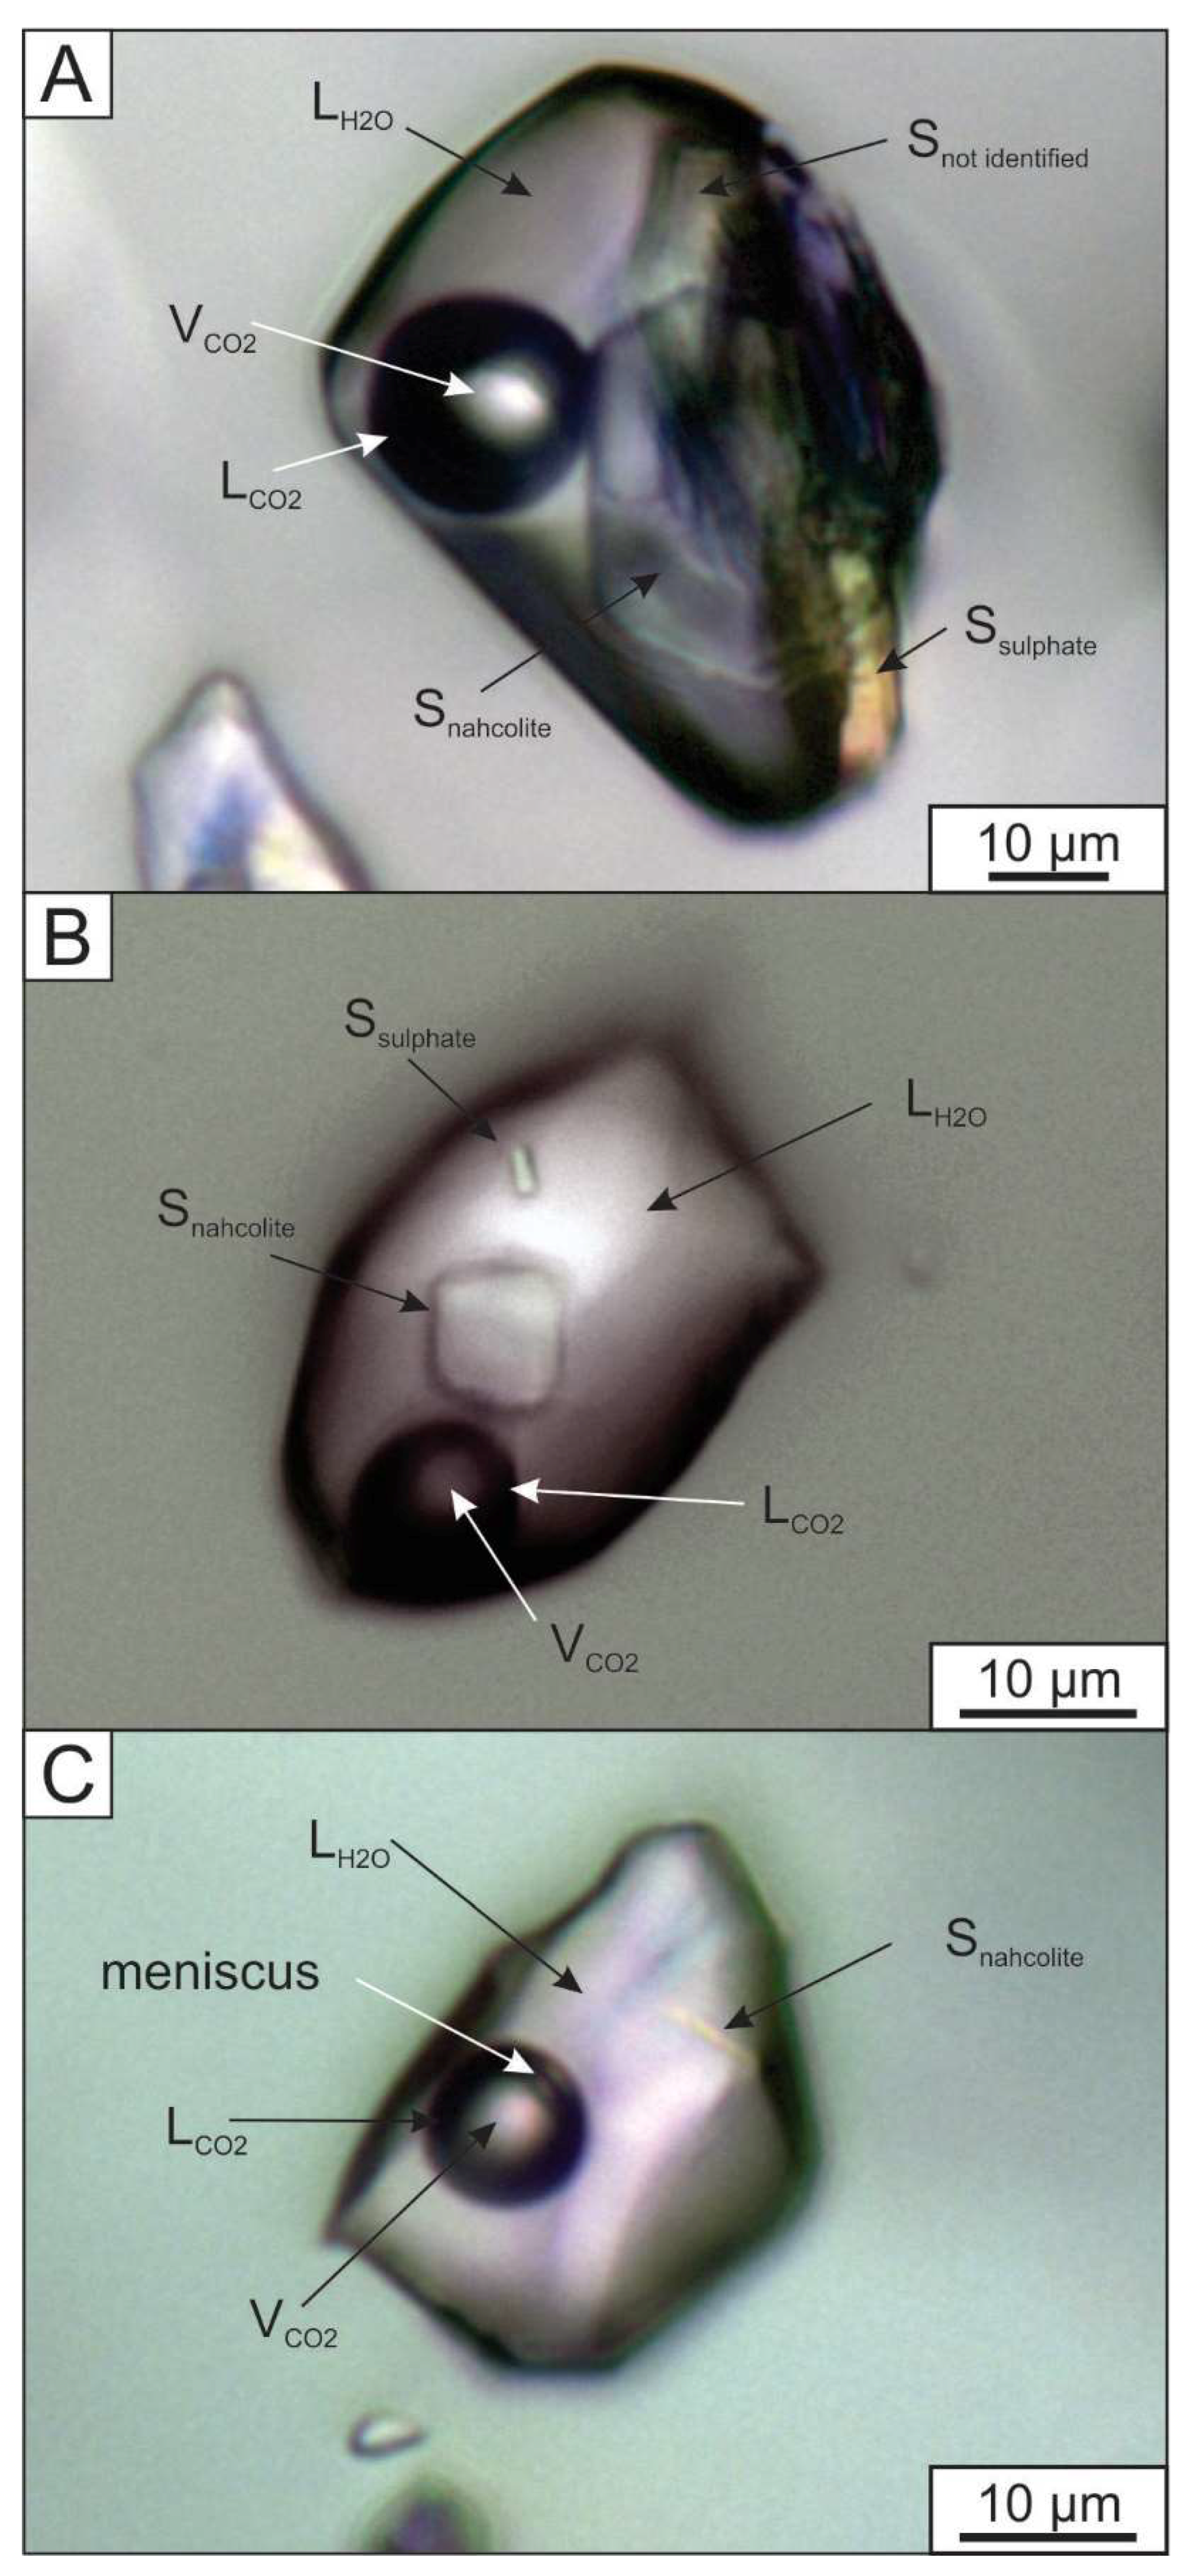
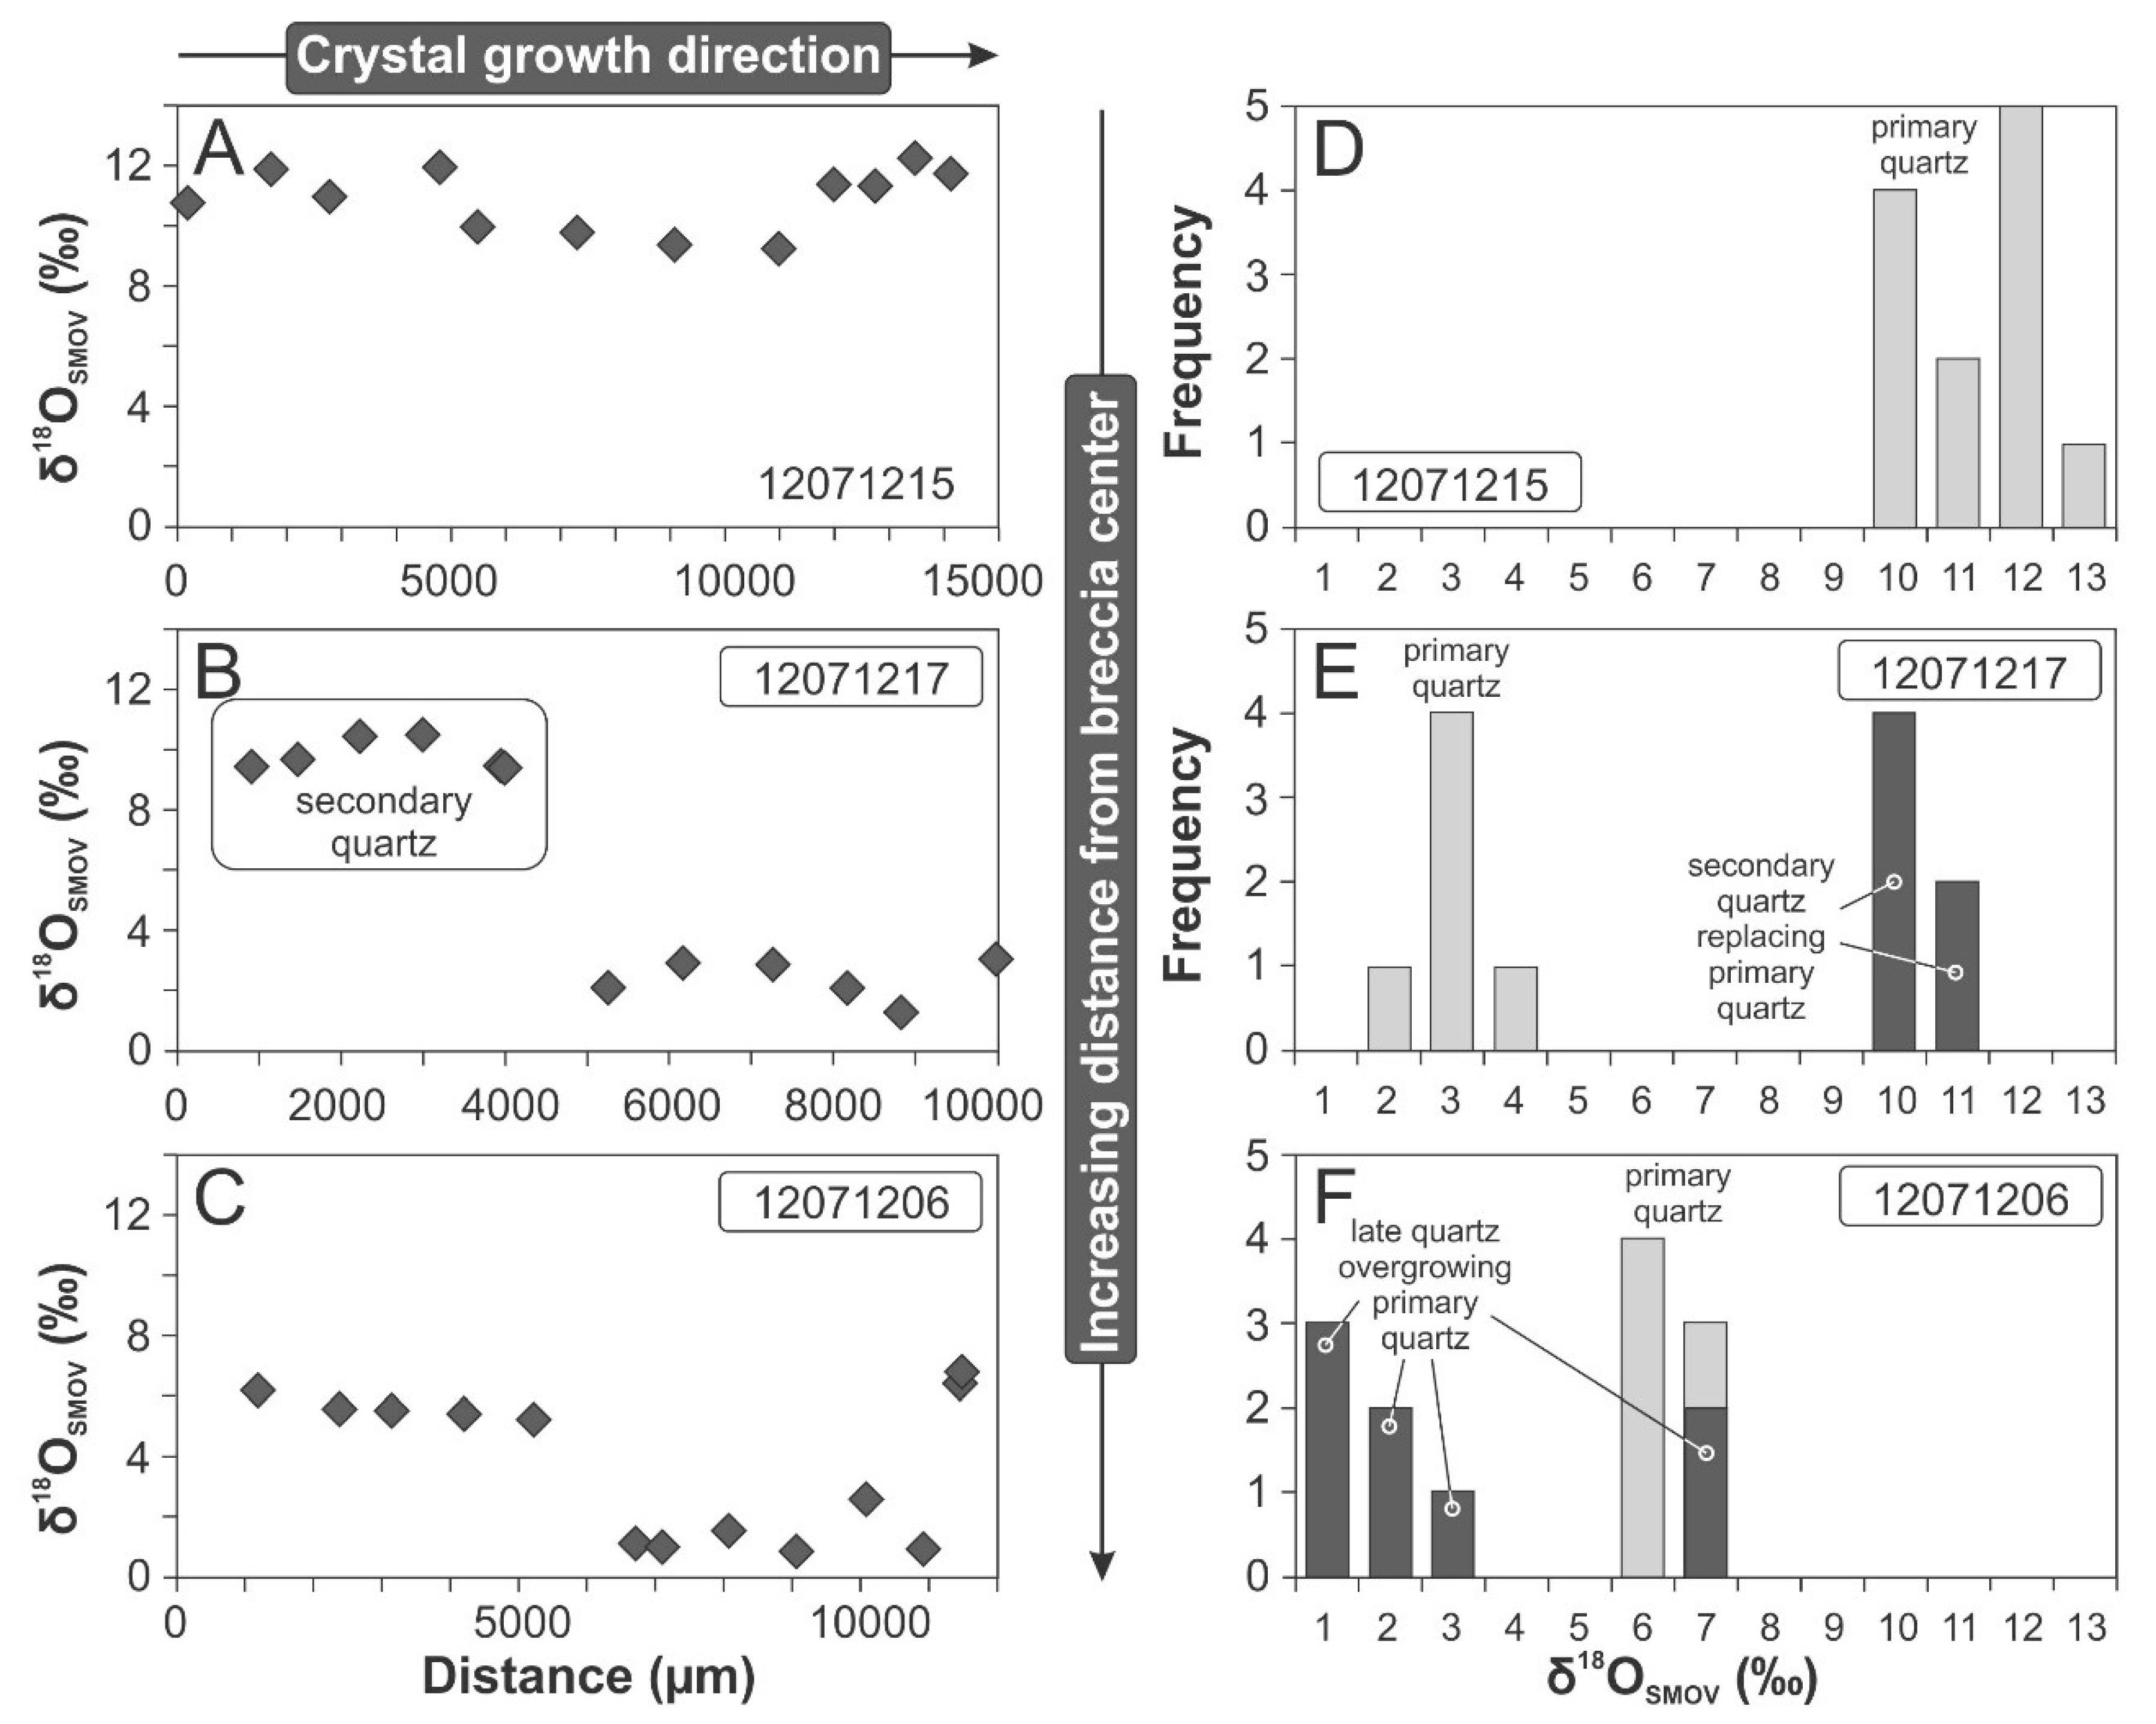
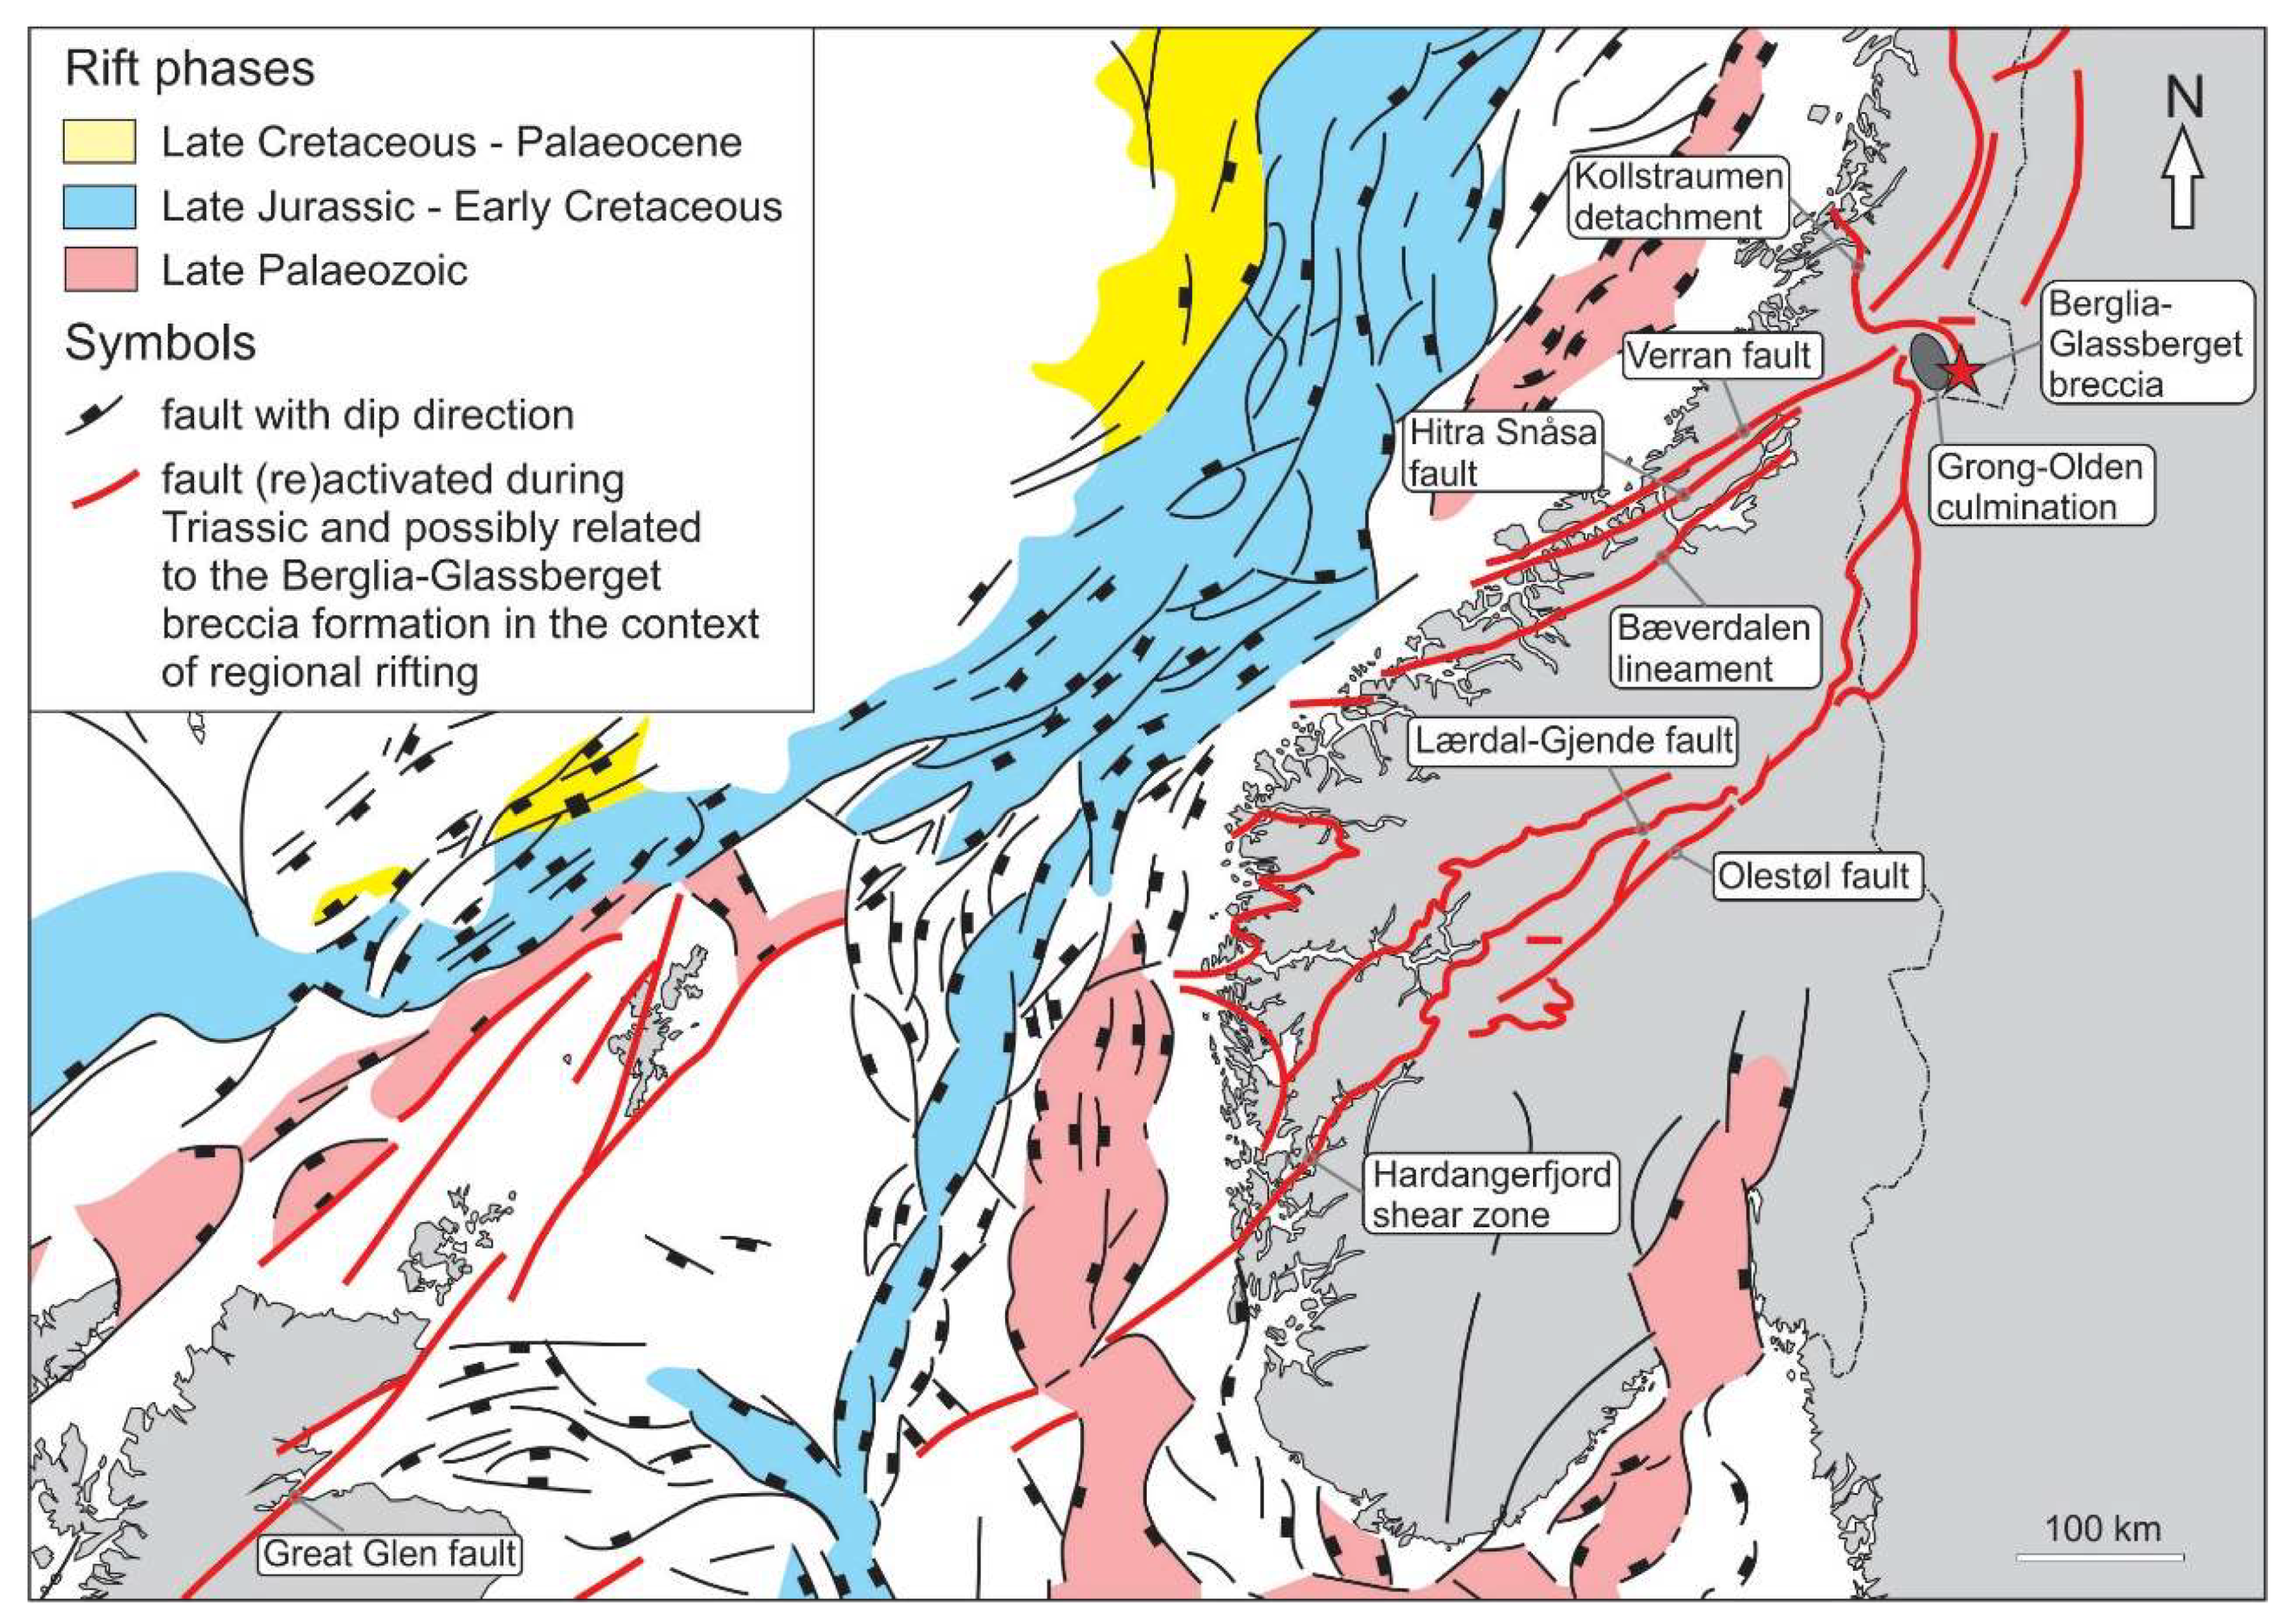
Table 1.
Bulk analyses of metarhyolite, the host rock of the Berglia-Glassberget breccia. Analyses were performed at ACMELabs [37].
Table 1.
Bulk analyses of metarhyolite, the host rock of the Berglia-Glassberget breccia. Analyses were performed at ACMELabs [37].
| Sample nr. | 12071201 | 12071210 | 12071209 | 12071213 | 12071212 |
|---|---|---|---|---|---|
| Rock type | metarhyolite | metarhyolite | metarhyolite | silicified metarhyolite | silicified metarhyolite |
| Major elements (wt %) | |||||
| SiO2 | 70.78 | 72.75 | 75.63 | 93.1 | 97.29 |
| Al2O3 | 15.42 | 13.95 | 13.07 | 4.29 | 1.39 |
| Fe2O3 | 1.13 | 1.38 | 1.1 | 0.23 | 0.08 |
| MgO | 0.18 | 0.22 | 0.22 | 0.08 | 0.03 |
| CaO | 0.08 | 0.49 | 0.13 | 0.02 | 0.01 |
| Na2O | 3.27 | 3.84 | 3.22 | 0.03 | <0.01 |
| K2O | 7.92 | 6.13 | 5.83 | 1.29 | 0.28 |
| TiO2 | 0.28 | 0.34 | 0.26 | 0.18 | 0.16 |
| P2O5 | 0.04 | 0.04 | 0.02 | 0.03 | 0.02 |
| MnO | 0.01 | 0.04 | 0.02 | <0.01 | <0.01 |
| LOI | 0.8 | 0.7 | 0.4 | 0.7 | 0.7 |
| Sum | 99.88 | 99.88 | 99.93 | 99.97 | 99.98 |
| Trace elements (µg/g) | |||||
| Ba | 395 | 353 | 124 | 37 | 9 |
| Be | 1 | 3 | 3 | <1 | <1 |
| Cs | 2.9 | 1.8 | 3.1 | 0.7 | 0.1 |
| Ga | 12.4 | 14.7 | 14.4 | 4.8 | 1.7 |
| Hf | 7.9 | 8.6 | 7.2 | 3.4 | 3.8 |
| Mo | <0.1 | 0.2 | <0.1 | <0.1 | <0.1 |
| Pb | 5.2 | 13.3 | 3.3 | 2.9 | 1.1 |
| Nb | 21.1 | 21.1 | 22.6 | 4.9 | 3.9 |
| Rb | 333.4 | 226.9 | 244.7 | 70.6 | 18.3 |
| Sn | 2 | 3 | 2 | <1 | <1 |
| Sr | 48.6 | 61.7 | 44.4 | 28 | 30.1 |
| Ta | 1.3 | 1.3 | 1.5 | 0.4 | 0.3 |
| Th | 16.3 | 17.4 | 14.9 | 6.8 | 6.9 |
| U | 4 | 3.9 | 4 | 1.6 | 0.8 |
| W | 2.4 | 0.9 | 0.9 | 0.9 | 1.7 |
| Zr | 268.7 | 294.2 | 221.4 | 118 | 123.7 |
| Y | 28.6 | 30.6 | 18.4 | 10.2 | 10.2 |
| La | 15.7 | 32.3 | 7.8 | 11.3 | 17.3 |
| Ce | 57.4 | 76.3 | 68.3 | 35.9 | 34.1 |
| Pr | 3.23 | 7.27 | 1.79 | 1.97 | 2.94 |
| Nd | 11.1 | 25.5 | 6.3 | 6.2 | 9.7 |
| Sm | 2.03 | 4.35 | 1.36 | 1.04 | 1.43 |
| Eu | 0.2 | 0.48 | 0.09 | 0.16 | 0.18 |
| Gd | 2.47 | 3.9 | 1.57 | 1.01 | 1.25 |
| Tb | 0.51 | 0.65 | 0.36 | 0.23 | 0.24 |
| Dy | 4.18 | 4.49 | 2.56 | 1.72 | 1.56 |
| Ho | 0.92 | 1.12 | 0.68 | 0.38 | 0.33 |
| Er | 3.31 | 3.27 | 2.49 | 1.19 | 1.1 |
| Tm | 0.54 | 0.55 | 0.43 | 0.2 | 0.19 |
| Yb | 3.54 | 3.81 | 3.3 | 1.15 | 1.34 |
| Lu | 0.6 | 0.61 | 0.55 | 0.19 | 0.22 |
Table 2.
Composition of K-feldspar cement. Analyses were performed at ACMELabs [37].
Table 2.
Composition of K-feldspar cement. Analyses were performed at ACMELabs [37].
| Major Elements (wt %) | Trace Elements (µg/g) | ||||
|---|---|---|---|---|---|
| SiO2 | 62.34 | Ba | 1937 | Y | 34.7 |
| TiO2 | 0.69 | Cs | 0.9 | La | 94.1 |
| Al2O3 | 17.88 | Ga | 11 | Ce | 190.1 |
| Fe2O3 | 0.6 | Hf | 23 | Pr | 18.07 |
| MnO | <0.01 | Nb | 28.1 | Nd | 57.6 |
| MgO | 0.03 | Pb | 25.4 | Sm | 8.68 |
| CaO | 0.31 | Rb | 792 | Eu | 0.95 |
| Na2O | 0.08 | Sr | 70.2 | Gd | 6.24 |
| K2O | 16.11 | Ta | 2.0 | Tb | 0.86 |
| P2O5 | 0.24 | Th | 77 | Dy | 5.39 |
| LOI | 1.3 | U | 7.9 | Ho | 1.08 |
| Sum | 99.58 | V | 46 | Er | 4.01 |
| An | 1.6 | W | 22.1 | Tm | 0.68 |
| Ab | 0.7 | Zn | 13 | Yb | 5.59 |
| Or | 97.7 | Zr | 814.2 | Lu | 0.97 |
Table 3.
Results of 40Ar/39Ar K-feldspar dating.
| UTM 33W | Spectrum | Inverse Isochron | |||||||||||
|---|---|---|---|---|---|---|---|---|---|---|---|---|---|
| Sample nr. | Material | E | N | Steps(n) | %39Ar | Age ± 1.96σ | MSWD(P) | TGA ± 1.96σ | K/Ca ± 1.96σ | Age ± 1.96σ | MSWD (P) | Trapped 40Ar/36Ar | Spread (%) |
| 12071206 | K-Feldspar | 426849 | 7123189 | 19–25(7) | 51.26 | 240.26 ± 0.36 | 0.59(0.74) | 238.38 ± 0.39 | 72.82 ± 2.74 | 240.19 ± 3.87 | 0.76(0.58) | 298.71 ± 9.02 | 5.6 |
Table 4.
Concentrations of trace elements (µg/g) of quartz crystals determined by LA-ICP-MS.
| CL Intensity | Li | Mn | Ge | Sr | Al | P | Ca | |
|---|---|---|---|---|---|---|---|---|
| LOD | 0.8 | 0.2 | 0.07 | 0.03 | 4.2 | 5.0 | 6.3 | |
| 12071204-A | moderate | 26.0 | 0.2 | 2.83 | 0.06 | 284.3 | <5.0 | <6.3 |
| 12071204-B | high | 217.9 | 0.2 | 0.08 | 0.12 | 1707.6 | <5.0 | <6.3 |
| 12071204-C | moderate | 115.3 | 0.6 | 0.07 | 0.14 | 260.6 | <5.0 | 11.5 |
| 12071204-D | high | 41.1 | 0.3 | <0.07 | <0.03 | 521.4 | 5.3 | <6.3 |
| 12071204-E | high | 12.5 | 0.3 | 0.08 | <0.03 | 742.2 | 10.0 | 13.9 |
| 12071204-F | high | 165.2 | 0.3 | 0.07 | <0.03 | 1408.9 | <5.0 | <6.3 |
| 12071206-A | high | 24.3 | <0.2 | <0.07 | 0.09 | 278.1 | 6.7 | <6.3 |
| 12071206-B | moderate | 14.1 | 0.4 | <0.07 | 0.09 | 55.7 | 7.2 | <6.3 |
| 12071206-C | low | 4.8 | 0.3 | <0.07 | 0.05 | 109.0 | 8.2 | <6.3 |
| 12071206-D | moderate | 18.1 | 0.2 | <0.07 | 0.04 | 262.6 | 5.4 | 7.0 |
| 12071206-E | high | 83.9 | 0.4 | 0.08 | <0.03 | 775.5 | 8.1 | 45.4 |
| 12071206-F | moderate | 28.7 | 0.4 | <0.07 | 0.14 | 196.3 | 7.0 | <6.3 |
| 12071215-A | low | 96.8 | <0.2 | 15.03 | 0.15 | 1634.3 | <5.0 | <6.3 |
| 12071215-B | high | 59.3 | 0.3 | 3.45 | 0.07 | 210.6 | <5.0 | <6.3 |
| 12071215-C | high | 79.1 | 0.3 | <0.07 | 0.07 | 643.3 | 5.2 | 13.7 |
| 12071215-D | high | 128.1 | 0.5 | <0.07 | 0.18 | 505.1 | <5.0 | <6.3 |
| 12071215-E | low | 76.5 | 0.3 | 2.29 | 0.10 | 112.1 | <5.0 | 22.6 |
| 12071215-F | low | 80.0 | 0.4 | 2.71 | 0.10 | 16.7 | <5.0 | <6.3 |
| 12071217-A | very low | <0.8 | 0.4 | 0.29 | 0.04 | <4.2 | <5.0 | 21.4 |
| 12071217-B | very low | <0.8 | 0.4 | <0.07 | 0.06 | <4.2 | <5.0 | <6.3 |
| 12071217-C | low | 6.8 | 0.4 | <0.07 | <0.03 | 59.8 | 5.9 | 29.8 |
| 12071217-D | low | 3.7 | 0.4 | <0.07 | 0.05 | 22.4 | <5.0 | <6.3 |
| 12071217-E | high | 80.0 | 0.3 | 0.09 | 0.03 | 633.2 | <5.0 | <6.3 |
| 12071217-F | very low | <0.8 | 0.3 | 0.08 | 0.03 | <4.2 | <5.0 | 11.4 |
| 12071218-A | very low | <0.8 | 0.6 | <0.07 | 0.04 | <4.2 | <5.0 | <6.3 |
| 12071218-B | low | 50.6 | 0.2 | 0.17 | 0.05 | 164.0 | <5.0 | <6.3 |
| 12071218-C | very high | 316.2 | 0.3 | 0.14 | 0.07 | 2104.8 | 7.5 | <6.3 |
| 12071218-D | very high | 319.3 | 0.4 | 0.15 | 0.15 | 2471.3 | <5.0 | <6.3 |
| 12071218-E | very high | 297.2 | 0.4 | 0.11 | 0.11 | 1549.7 | <5.0 | <6.3 |
| 12071218-F | low | 3.2 | 0.4 | <0.07 | 0.03 | <4.2 | <5.0 | <6.3 |
Table 5.
Summary of petrographic and microthermometric data of primary and pseudosecondary fluid inclusions in quartz crystals from the Berglia-Glassberget breccia. Te—temperature of first melting, Tmice—temperature of final ice melting, Th—temperature of homogenization.
Table 5.
Summary of petrographic and microthermometric data of primary and pseudosecondary fluid inclusions in quartz crystals from the Berglia-Glassberget breccia. Te—temperature of first melting, Tmice—temperature of final ice melting, Th—temperature of homogenization.
| Type I | Type II | Type III | |
|---|---|---|---|
| inclusion type | as groups, pseudosecondary | as groups, pseudosecondary | in trails, pseudosecondary |
| inclusion petrography | multi-phase, isometric | multi-phase, isometric | two- and multi-phase, isometric to longish |
| size (µm) | 35 to 60 | 15 to 25 | 25 to 55 |
| degree of fill | 0.60 to 0.75 | 0.80 to 0.95 | 0.70 to 0.95 |
| Te (°C) | −24 to −22 | −29 to −24 | −41 to −21 |
| Tmice (°C) | −0.4 to −0.6 | −4.6 to 2.2 | −8.9 to 19.2 |
| Th (°C) | 242 to 248 | 203 to 214 | 136 to 189 |
| number of analyzed inclusions | 4 | 4 | 15 |
Table 6.
Results of oxygen isotope microanalyses by SIMS on selected hydrothermal quartz crystals (samples 12071206, 12071215, 12071217).
Table 6.
Results of oxygen isotope microanalyses by SIMS on selected hydrothermal quartz crystals (samples 12071206, 12071215, 12071217).
| 12071215—Breccia Center | 12071217—Breccia Margin | 12071206—Breccia Margin | |||
|---|---|---|---|---|---|
| Analysis nr. | δ18O (‰ ± 0.1) | Analysis nr. | δ18O (‰ ± 0.1) | Analysis nr. | δ18O (‰ ± 0.1) |
| 01 | 11.7 | 01 | 3.0 | 01 | 6.4 |
| 02 | 12.2 | 02 | 1.3 | 02 | 6.8 |
| 03 | 11.3 | 03 | 2.1 | 03 | 1.0 |
| 04 | 11.4 | 04 | 2.9 | 04 | 2.6 |
| 05 | 9.2 | 05 | 2.9 | 05 | 0.9 |
| 06 | 9.3 | 06 | 2.1 | 06 | 1.6 |
| 07 | 9.8 | 07 | 9.4 | 07 | 1.0 |
| 08 | 9.9 | 08 | 9.5 | 08 | 1.1 |
| 09 | 11.9 | 09 | 10.5 | 09 | 5.2 |
| 10 | 10.9 | 10 | 10.4 | 10 | 5.4 |
| 11 | 11.8 | 11 | 9.7 | 11 | 5.5 |
| 12 | 10.7 | 12 | 9.5 | 12 | 5.5 |
| 13 | 6.2 | ||||
© 2018 by the authors. Licensee MDPI, Basel, Switzerland. This article is an open access article distributed under the terms and conditions of the Creative Commons Attribution (CC BY) license (http://creativecommons.org/licenses/by/4.0/).
Share and Cite
MDPI and ACS Style
Müller, A.; Ganerød, M.; Wiedenbeck, M.; Svendsen Spjelkavik, S.O.; Selbekk, R. The Hydrothermal Breccia of Berglia-Glassberget, Trøndelag, Norway: Snapshot of a Triassic Earthquake. Minerals 2018, 8, 175. https://doi.org/10.3390/min8050175
AMA Style
Müller A, Ganerød M, Wiedenbeck M, Svendsen Spjelkavik SO, Selbekk R. The Hydrothermal Breccia of Berglia-Glassberget, Trøndelag, Norway: Snapshot of a Triassic Earthquake. Minerals. 2018; 8(5):175. https://doi.org/10.3390/min8050175
Chicago/Turabian StyleMüller, Axel, Morgan Ganerød, Michael Wiedenbeck, Skule Olaus Svendsen Spjelkavik, and Rune Selbekk. 2018. "The Hydrothermal Breccia of Berglia-Glassberget, Trøndelag, Norway: Snapshot of a Triassic Earthquake" Minerals 8, no. 5: 175. https://doi.org/10.3390/min8050175
Note that from the first issue of 2016, this journal uses article numbers instead of page numbers. See further details here.