Article

Predicting Cyanide Consumption in Gold Leaching: A Kinetic and Thermodynamic Modeling Approach

by
Yaser Kianinia
1,
Mohammad Reza Khalesi
1,*,
Mahmoud Abdollahy
1,
Glenn Hefter
2,
Gamini Senanayake
2,
Lubomir Hnedkovsky
2,
Ahmad Khodadadi Darban
1 and
Marjan Shahbazi
3
1
Department of Mining Engineering, Tarbiat Modares University, Tehran 1411713116, Iran
2
Department of Chemical & Metallurgical Engineering & Chemistry, Murdoch University, Murdoch, WA 6150, Australia
3
Department of Mining Engineering, Yazd University, Yazd 8915818411, Iran
*
Author to whom correspondence should be addressed.
Minerals 2018, 8(3), 110; https://doi.org/10.3390/min8030110
Submission received: 18 January 2018 / Revised: 14 February 2018 / Accepted: 5 March 2018 / Published: 8 March 2018

Abstract

:
The consumption of cyanide during processing operations is a major economic cost in the extraction of gold from its ores, while the discharge of cyanide wastes may result in significant environmental pollution. Many factors influence the levels of consumption and discharge of cyanide, including ore mineralogy and lixiviant solution chemistry. This paper proposes a robust methodology to estimate leaching cyanide consumption due to oxidation and reactions with gold, chalcopyrite and pyrite minerals forming various cyanide complexes, cyanate, thiocyanate and hydroxide precipitates of copper and iron. The method involves concurrent modelling of both the oxidation and leaching kinetics of minerals and the chemical speciation of the lixiviant solutions. The model was calibrated by conducting cyanide leaching experiments on pyrite, chalcopyrite, pyrite + chalcopyrite, pyrite + chalcopyrite + gold and pyrite + chalcopyrite + gold + quartz systems and determining the total Cu, Fe, Au and CN concentrations in solution. We show that this model can successfully estimate the formation of cyanide complexes and, hence, the consumption of cyanide.

Graphical Abstract

1. Introduction

Gold is mainly extracted from its ores or concentrates by leaching with oxygenated cyanide solutions [1,2]. Cyanide consumption during leaching, and the discharge of excess cyanide in wastewater, respectively constitute major economic [3,4] and environmental [5] costs in the gold industry. Cyanide losses in the leaching stage mainly occur via the action of “cyanicides”: minerals, such as the sulfides of copper and iron that dissolve via the formation of strong cyanide complexes, or conversion of CN to other species such as cyanate (OCN) and thiocyanate (SCN). On the other hand, cyanide pollution, through wastewater discharge and mine residues, is of major concern due to the acute toxicity of many cyanide compounds towards animal (including human) life [5]. Wastewater streams of gold processing plants typically have to be treated to lower the concentration of cyanide and related species below regulatory limits [6]. While many workable treatments have been developed there is an inevitable cost; a much better strategy is to minimize such discharges in the first place. Various methods have been proposed to minimize cyanide consumption. For example, Deschênes et al. [7] showed that use of lead nitrate and oxygen (200 and 16 mg·L−1, respectively) with high pyrite or chalcopyrite ores lowered cyanide consumption threefold and enhanced the gold leaching rate by 20%. There have also been many experimental investigations of the effects of varying solution chemistry and ore mineralogy on cyanide consumption [8]. On the other hand, there have been rather fewer efforts to develop models for estimating cyanide consumption under real leaching conditions. For example, Adams [9,10] studied the effects of activated carbon on the kinetics of cyanide consumption in gold processing plants and showed it to be first order with respect to cyanide concentration, and that a carbon-catalyzed oxidation reaction was responsible for high cyanide losses. Bellec et al. [11] proposed an empirical model that included ore particle size distribution, and cyanide, copper and sulfur concentrations, while De Andrade Lima and Hodouin [8] developed an empirical model that took into account ore particle size, cyanide concentration and the dissolution of sulfur-bearing minerals. However, these models were purely empirical, contained many parameters and were heavily case-dependent. They mentioned that, with decreasing the particle size, gold liberation in the ore increases but the cyanide consumption also increases because of liberation of Cu and Fe minerals [8]. Adams [12] presented a methodology for determining cyanide deportment in gold plants using thermodynamic constants and solution analyses. He was able to avoid considerations of non-ideality, because of the low concentrations of dissolved species, which allowed the use of concentrations instead of activities. A first-order rate equation was used to estimate HCN losses by volatilization [12]. Lotz et al. [13] investigated gold leaching kinetics and used experimental arsenic and sulfur speciation information; however, no model was developed in their work.
The purpose of the present work is to develop a robust methodology to estimate cyanide consumption during gold leaching over a period of about 30 h with integrated modeling of leaching kinetics and chemical speciation. The amount of cyanicide in the slurry, and solution conditions, such as the concentration of free cyanide (CN) and pH, are included in the model. With such a model, consumption of cyanide can be optimized and lowered by manipulating the key factors. While a slurry containing gold, pyrite and chalcopyrite was investigated in this work, the proposed approach can be easily extended and tested with ores or concentrates of quite different mineralogy.

2. Theory

Gold leaching in cyanide solutions can be described [3] by the electrochemical reactions:
Au(s) + 2CN → Au(CN)2 + e
O2(g) + 2H2O + 4e → 4OH
In aerated cyanide solutions pyrite, FeS2, dissolves forming the complex Fe(CN)64− [14]:
FeS2(s) + 6CN → Fe(CN)64− + S22−
The dissolution of chalcopyrite, CuFeS2, can be described [14] by:
CuFeS2(s) + 10CN → Cu(CN)43− + Fe(CN)64− + 2S2−
However, these reactions are simplifications: various copper and iron cyanide complexes form and their distribution in a cyanide solution depends on the EH and pH of the solution and the cyanide-to-copper mole ratio [15]. Since pyrite and chalcopyrite are leached under oxidizing conditions, any sulfide ions produced may be oxidized in the sequence [14]:
S2− → S22− →S0 → S2O32− →SO32− → SO42−
The reactions of cyanide with reduced sulfur species are briefly described by Luthy and Bruce (1979) [16], while the oxidation of cyanide can be thought of as [9,10]:
CN → (CN)2 → OCN (SCN)
The dissolution kinetics and equilibria of copper, iron and gold species in cyanide solutions are closely related to the concentration of free cyanide, [CN], and pH. At low free cyanide, low cyanide-to-copper ratios, and high pH, the precipitation of copper as Cu(OH)2 [14] can occur [17]:
4Cu(CN)2 + O2 + 4OH + 2H2O → 4Cu(OH)2(s) + 8CN
In an analogous way iron may precipitate as goethite, FeOOH(s) [14].
CuFeS2(s) + 2CN + 3OH → Cu(CN)2 + FeOOH(s) + 2S2−
When the cyanide-to-copper molar ratio drops to 2.5 and a large proportion of copper is present as Cu(CN)2, the gold leaching rate is extremely low [18]. This suggests that Cu(CN)32− can provide sufficient cyanide ions for the leaching of gold or other minerals according to Equation (9) [18].
4Au + 8Cu(CN)32− + O2 + 2H2O → 4Au(CN)2 + 8Cu(CN)2 + 4OH
As the leaching of the ore proceeds, the concentrations of the major species change and so does the ionic strength and, consequently, all the activity coefficients and conditional equilibrium constants [19,20]. To model the chemical speciation during the leaching process, it is necessary to quantify the formation of each significant species. This requires answers to three questions: (a) what species are likely to be present? (b) What are their total concentrations? and (c) how do they interact? These questions can be answered by modeling mineral leaching kinetics concurrently with reliable thermodynamic data covering the range of conditions (ionic strength, temperature, and species) of interest. The kinetic and thermodynamic data can be obtained from various databases attached to speciation programs such as PHREEQC (U.S. Geological Survey, Denver, CO, USA) [21,22,23,24,25] and MINTEQ (KTH, Stockholm, Sweden) [26]. For example, the dissolution of Pb, Cd, As, and Cr from cementitious waste [24] and dissolution of the major elements and heavy metals [23] have been simulated by PHREEQC. Unfortunately, incomplete databases, limited information on the ionic strength of the solution, and lack of flexibility in kinetic modeling, limit the applicability of some programs to the estimation of speciation during the leaching of real systems.

3. Methodology

In this work, modeling the experimental kinetic parameters of iron, copper and gold leaching from pure minerals and mixtures, and determining the predominant chemical species in solution, were employed as a means of determining free cyanide concentrations. As such, this model creates a tool for optimizing the use of cyanide in gold processing plants.

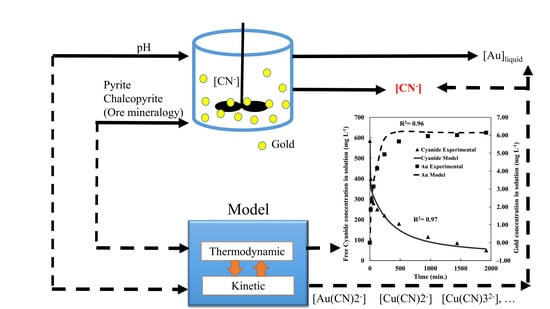
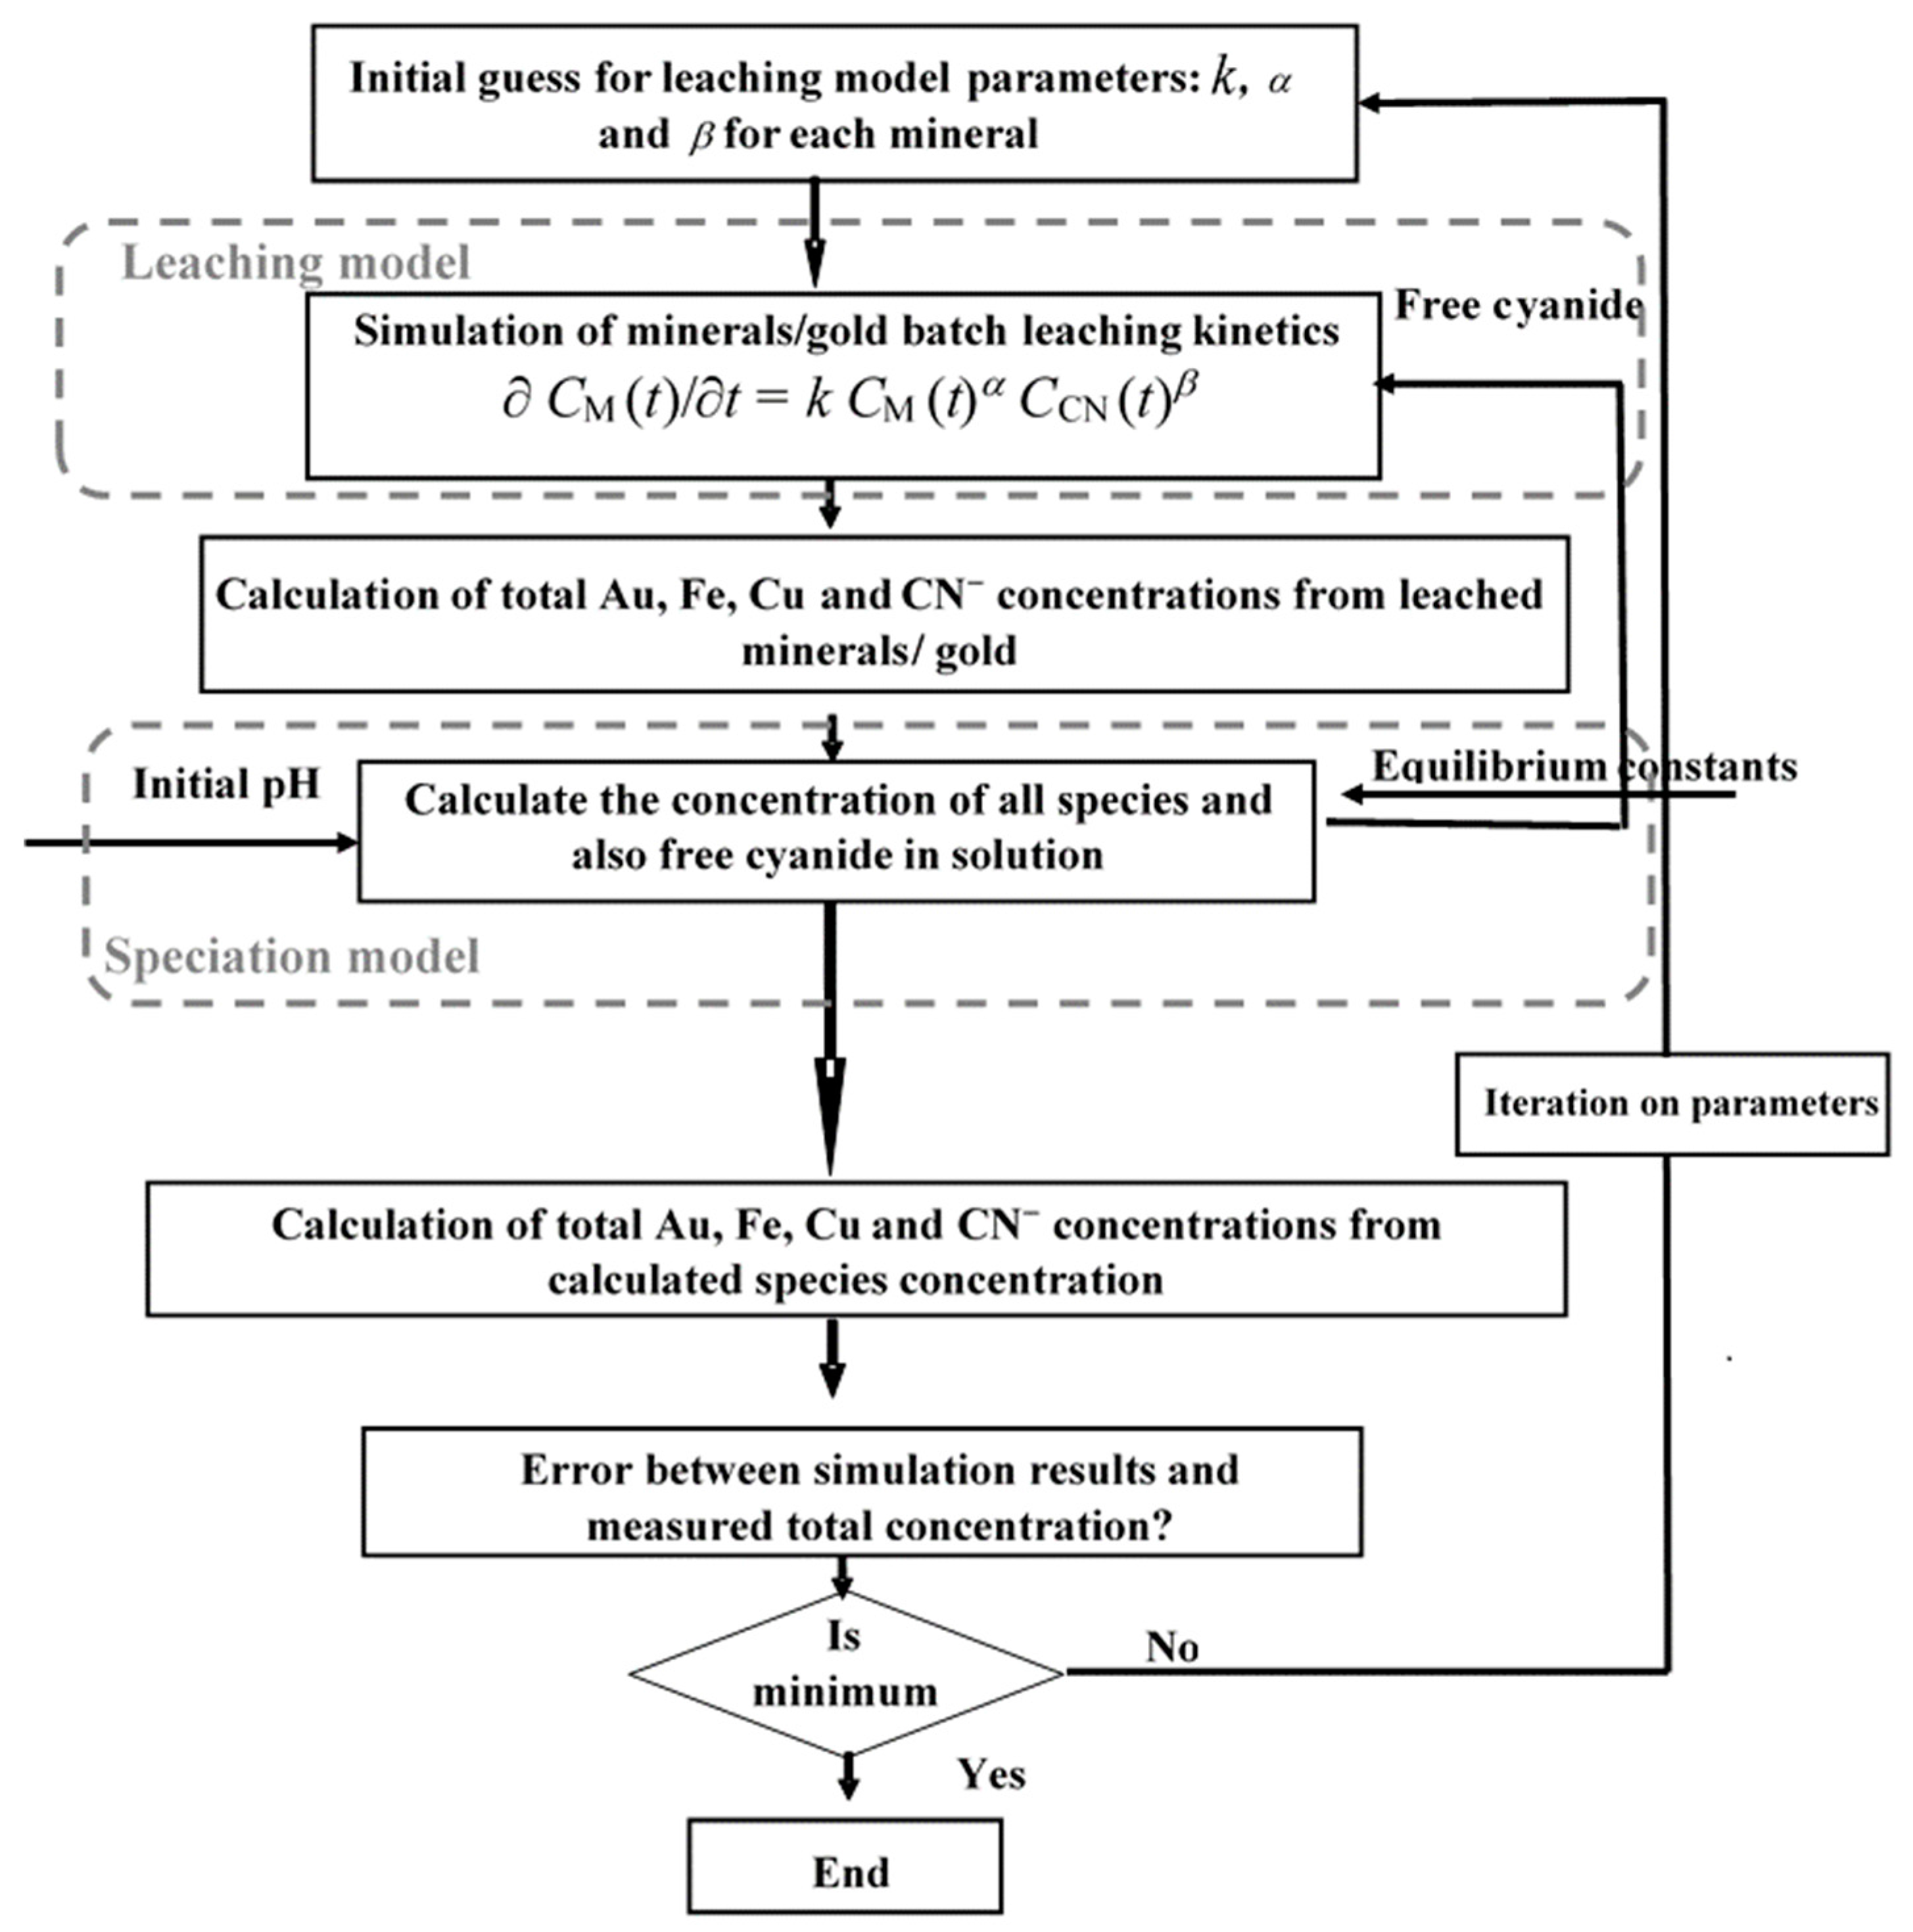
3.1. Leaching Modeling

A kinetic model based on the law of mass action is used to describe the leaching process. For a batch system, this model can be written in the simplified form:
CM(t)/∂t = k CM(t)α CCN(t)β
where, k is the reaction rate constant (mol1 − (α + β) m(α + β) − 1·s−1), CM is the concentration of mineral or gold (mmol·L–1), CCN is the concentration of free cyanide in solution (mol·L–1) and α and β are the reaction order of the model with respect to gold, mineral and cyanide concentrations. It should be noted that the effect of dissolved oxygen concentration was not considered, as in most gold processing plants the concentration of oxygen is kept at the saturation limit. Accordingly, all the test solutions were continuously oxygenated during leaching.

3.2. Speciation Modeling

Based on ion association and complexation reactions in aqueous solution, the equilibrium position of a set of simultaneous reactions in the solution phase, subject to the constraints of mass action and mass balance, was solved using MATLAB software (Mathworks, Natick, MA, USA). For the leaching of each mineral system, possible species were determined from relevant papers and the PHREEQC database [14,19,23]. The most significant of these species and their equilibrium constants are shown in Table 1. Using these data, the stoichiometric coefficients were coded for the Au-Cu-CN-Fe-S-O-H system in MATLAB. The concentration of each element was determined by summing its total value using all relevant equilibria. Total cyanide (CCN,T) was then calculated as:
CCN,T = C(CN) + 2C(Cu(CN)2) + 3C(Cu(CN)32−) + 4C(Cu(CN)43−) + C(HCN) + 6C(Fe(CN)64−)+ …
In view of the moderate ionic concentrations, the Davies Equation (12) was used to calculate the activity (ai) of each dissolved species via the usual definitions:
−lnγi = Azi2 (√I/(1 + √I) − 0.3I)
I = 1/2∑mizi2
ai = γi·mi
where, γi is the activity coefficient, A = 0.5397 (kg·mol−1)0.5 is the Debye–Hückel constant for activity coefficients, zi is the ionic charge number and I (mol·kg−1) is the ionic strength of the electrolyte media and mi is the mollity concentration of ion i (mol·kg−1).
The activity coefficient for non-ionic species, was obtained by the Setschenow relation [30]:
lnγi = bi·I
where, bi is the Setschenow coefficient. A value of bi = 0.1 was used throughout, following [21].

3.3. Integrated Modeling of Leaching Kinetics and Chemical Speciation with MATLAB

Mineral leaching and the formation of all plausible complexes was simulated with two m-files in MATLAB named “Leachingkinetics.m” and “speciationmodel.m” which were linked as shown in Figure 1. The first simulates the kinetics of gold/mineral leaching and estimates the total concentration of each element in solution during the leaching process. These total concentrations (for Cu, S, free cyanide, Fe, and Au) are the inputs for the speciation model, along with temperature and the initial pH, assuming the dissolved ions are in equilibrium. The inputs for the kinetic model are the reaction rate constants α and β for gold, each mineral, (should be estimated by calibration; see Section 3.5), and free cyanide. Outputs of “Leachingkinetics.m” are the total solution concentrations of Cu, Fe, S, and Au. The kinetic model only uses the free cyanide concentration from the speciation model.

3.4. Experimental

Since cyanide consumption mainly depends on the cyanicide (mainly pyrite and chalcopyrite) content in gold ores (Equations (3) and (4)), individual minerals and combination of these minerals were subjected to leaching in the absence or presence of gold. It should also be noted that dissolved oxygen and Cu(II)-species enhance the oxidation of cyanide [18]. Pyrite and chalcopyrite were from the Sarcheshmeh copper complex, southwest of Kerman, Iran, (with grades of 98.85% and 95.6% respectively, Table 2) and gold foils (99.99% Au, thickness 0.2 mm) were used for the experiments. For model validation and parameter estimation, five mineral systems were considered; pyrite, chalcopyrite, pyrite + chalcopyrite, gold + chalcopyrite + pyrite and gold + chalcopyrite + pyrite + quartz. For the pyrite and chalcopyrite, 20 g of each mineral was brought into contact with 1.0 L of 600 mg·L−1 cyanide solution. For chalcopyrite + pyrite and gold + chalcopyrite + pyrite systems, 10 g of pyrite and 10 g of chalcopyrite were used. For the systems containing gold, 0.01 g pure gold was added. For the last system, the % solid was adjusted to 42% with quartz. For all experiments, the pH and the solution concentrations of copper, iron, free cyanide and gold were determined over an appropriate period of time. The initial pH was set to 11 but was controlled at 10.4 during the experiments by addition of sodium hydroxide. The temperature was controlled to 25 ± 0.1 °C and stirring speed was held at 250 rpm. The initial cyanide concentration was 600 mg·L−1 but was allowed to degrade over time. Particle size distribution was −75 + 53 μm (the effects of particle size on leaching are not taken into account in this paper) and the oxygen concentration was 8 mg·L−1. Liquid samples of 30 mL were taken for analysis at specific times (the mass of metals in the samples was considered in the calculations). After sampling, the same amount of water with pH = 10.4 was added to maintain the liquid volume constant. At the end of each experiment, the mass of residual solid was washed, dried and used in establishing the mass balance. Solutions were analyzed by atomic absorption spectrometry (AAS) with a Varian SpectrA A-300 for total Au, Cu and Fe [31]. Cyanide concentration was determined by titrating against silver nitrate, using rhodanine as an indicator and potentiometric end-points [32]. Because of the limited number of analyses, the concentration of free cyanide and the total element concentrations (Fe, Cu, Au) were used for validating the model and for determining the model parameters.

3.5. Model Calibration

For each leaching system, the model parameters (Table 3) were estimated by a non-linear least squares optimization method that minimized the sum of squared differences between the Au, Fe, Cu, and free cyanide concentrations in solution obtained by simulations and experiments. Model parameters of the pyrite + chalcopyrite + gold system were used for validation of the method and are discussed in Section 4.6.

4. Results and Discussion

Table 2 shows the calibrated parameters of the kinetic model (Equation (10)) for the five mineral systems studied.

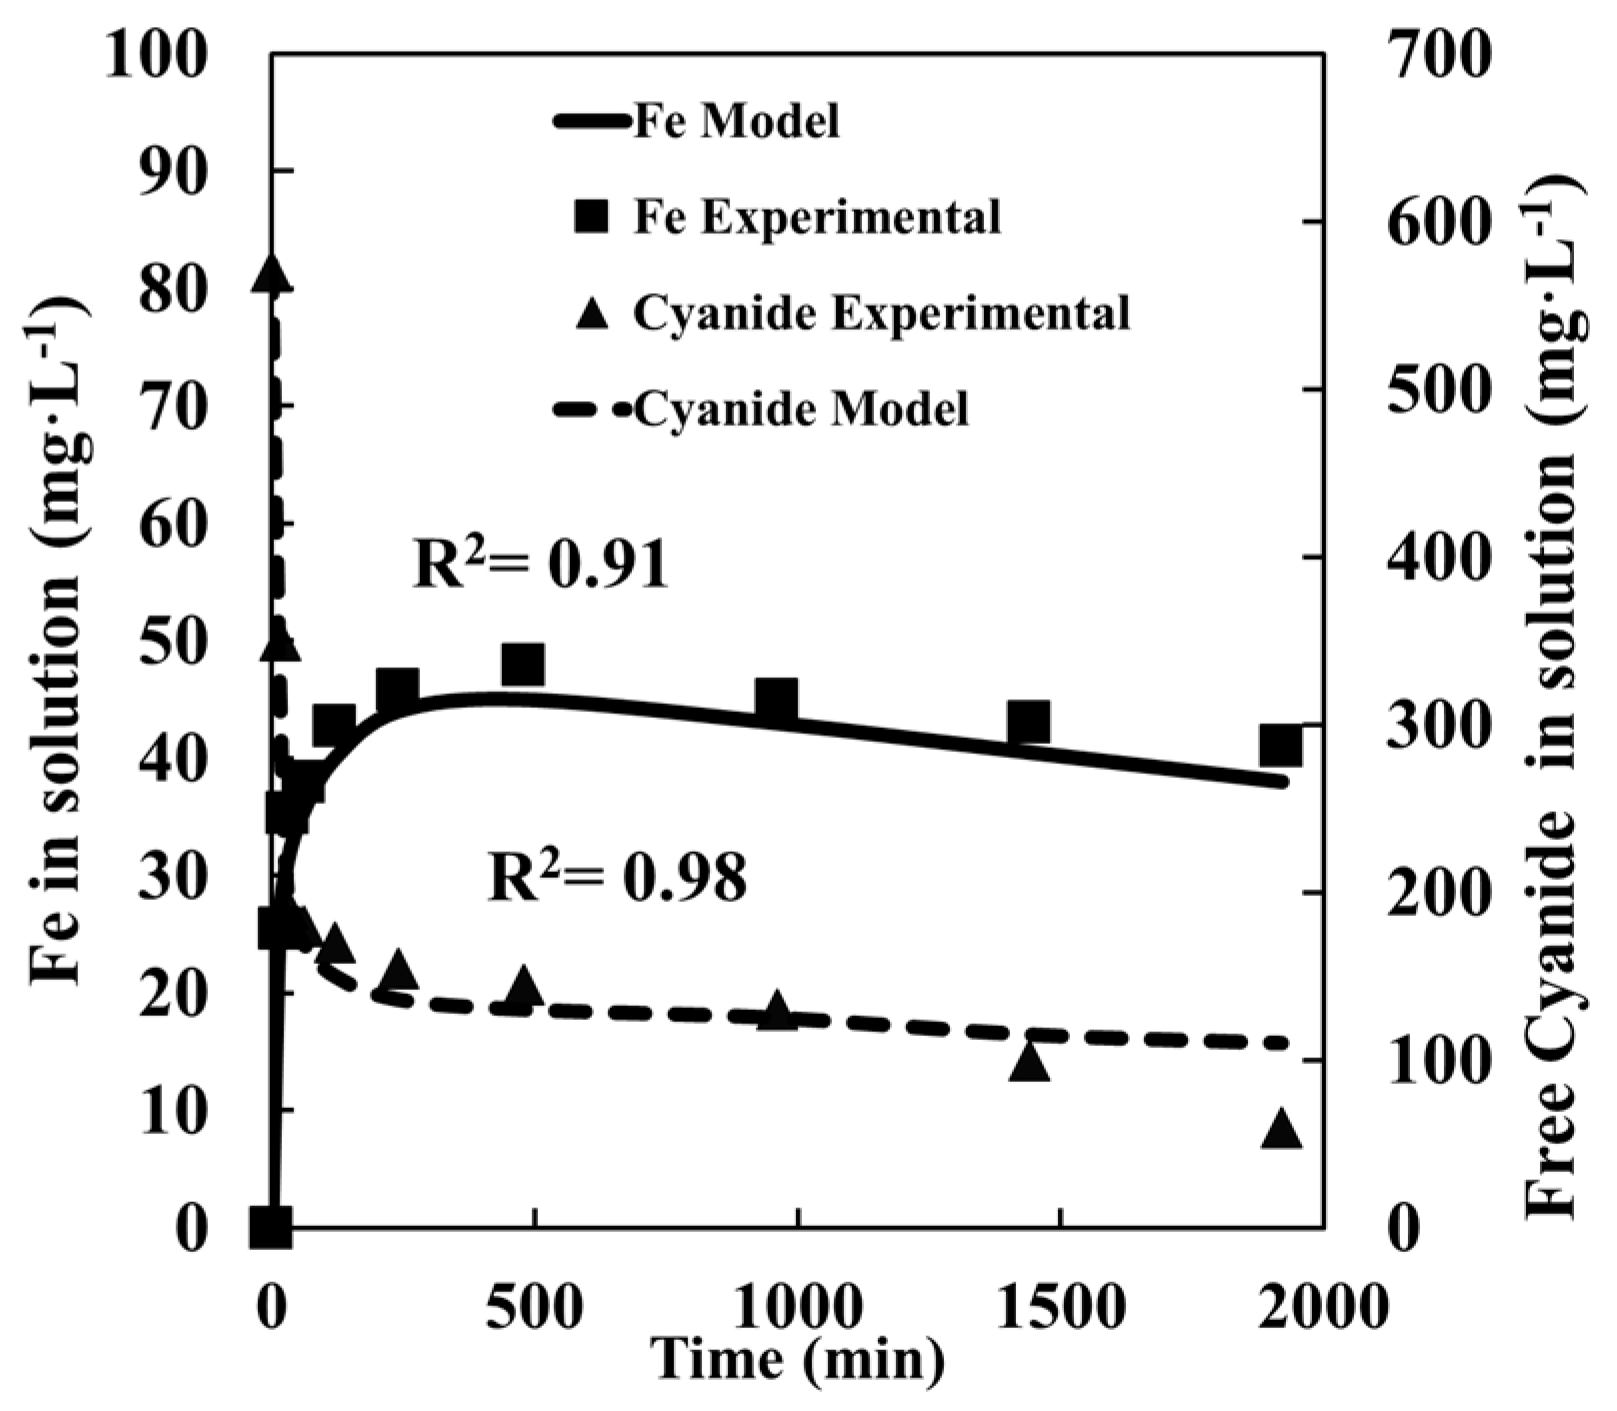
4.1. Pyrite Leaching

The simulation of pyrite leaching in cyanide solution, based on the estimated parameters, is compared with the experimental data in Figure 2. The concentrations of iron and free cyanide in solution are well-predicted by the concurrent model. However, the good fit is not the only merit of the present approach. Another important outcome of the proposed methodology is that the concentration of free cyanide is predicted via calculation of all cyanide complexes formed during the leaching process.
In this particular case, HCN, HFe(CN)63−, H2Fe(CN)62−, Fe(CN)63−, Fe(CN)64−, SCN and OCN are formed and the free cyanide is predicted by subtracting protonated or complexed cyanide from the total cyanide concentration. In this system, the predominant iron species in solution was Fe(CN)64−.

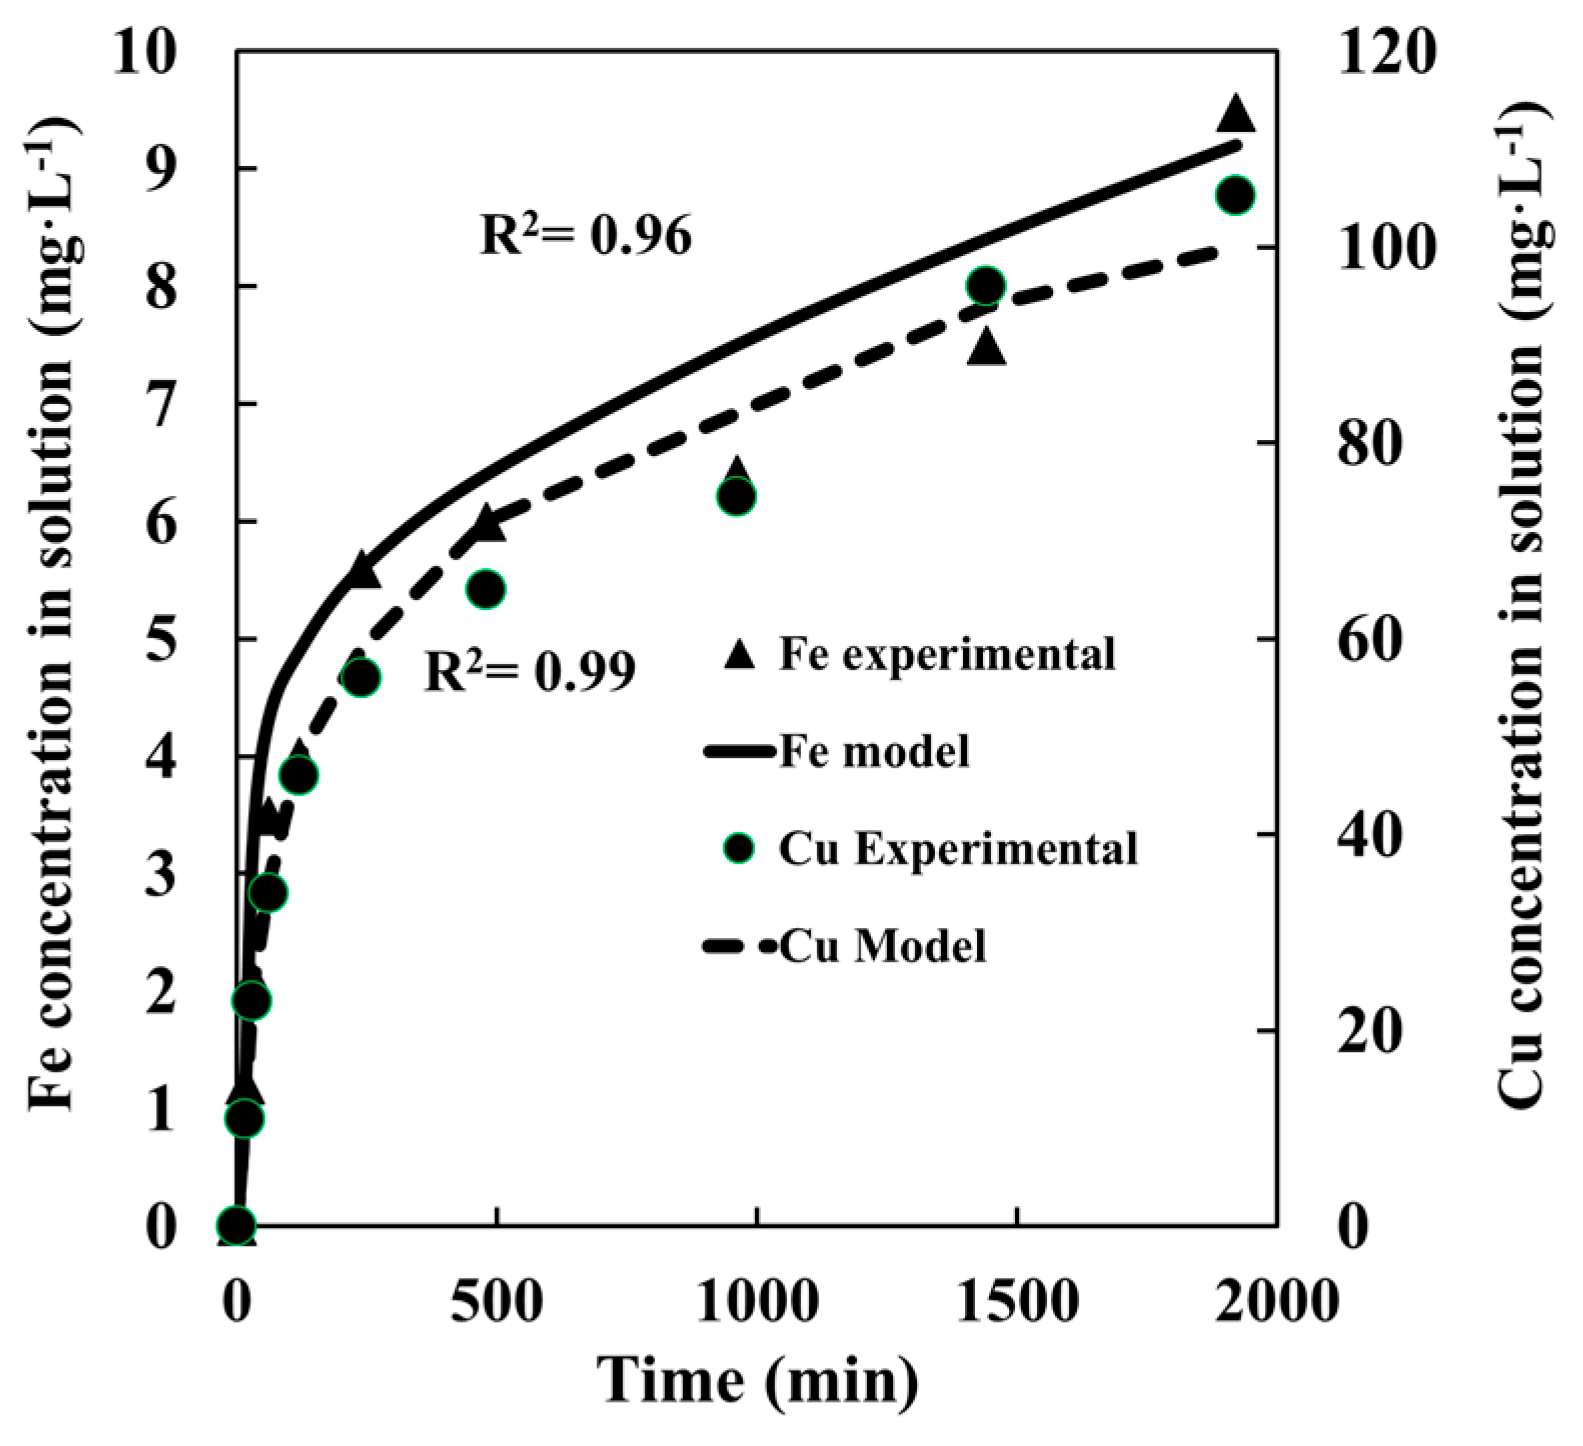
4.2. Chalcopyrite Leaching

Like the pyrite system, equations for sulfide oxidation were considered in the speciation model and the parameters of the leaching kinetics model were estimated from the data in Table 2. The results of the simulations are compared with the experimental data in Figure 3 and Figure 4, where iron, copper and free cyanide concentrations in the liquid phase were measured and predicted. In this system the main complexes formed were Fe(CN)64−, Cu(CN)32− and Cu(CN)43−.

4.3. Pyrite + Chalcopyrite Leaching

Figure 5 and Figure 6 show the results for iron, copper and cyanide. During the first 240 min of leaching, the cyanide rapidly dissolves most of the reactive pyrite and chalcopyrite, forming complexes such as Fe(CN)64−, Cu(CN)43−, Cu(CN)32− and Cu(CN)2. However, during leaching free cyanide decreases and iron, mostly present as Fe(CN)64−, can precipitate as FeOOH(s) [33] thereby decreasing the concentration of iron in solution (Figure 5). It is reported that Fe(CN)63− can also facilitate gold leaching [34,35] but here the concentration of Fe(CN)63− was very low.

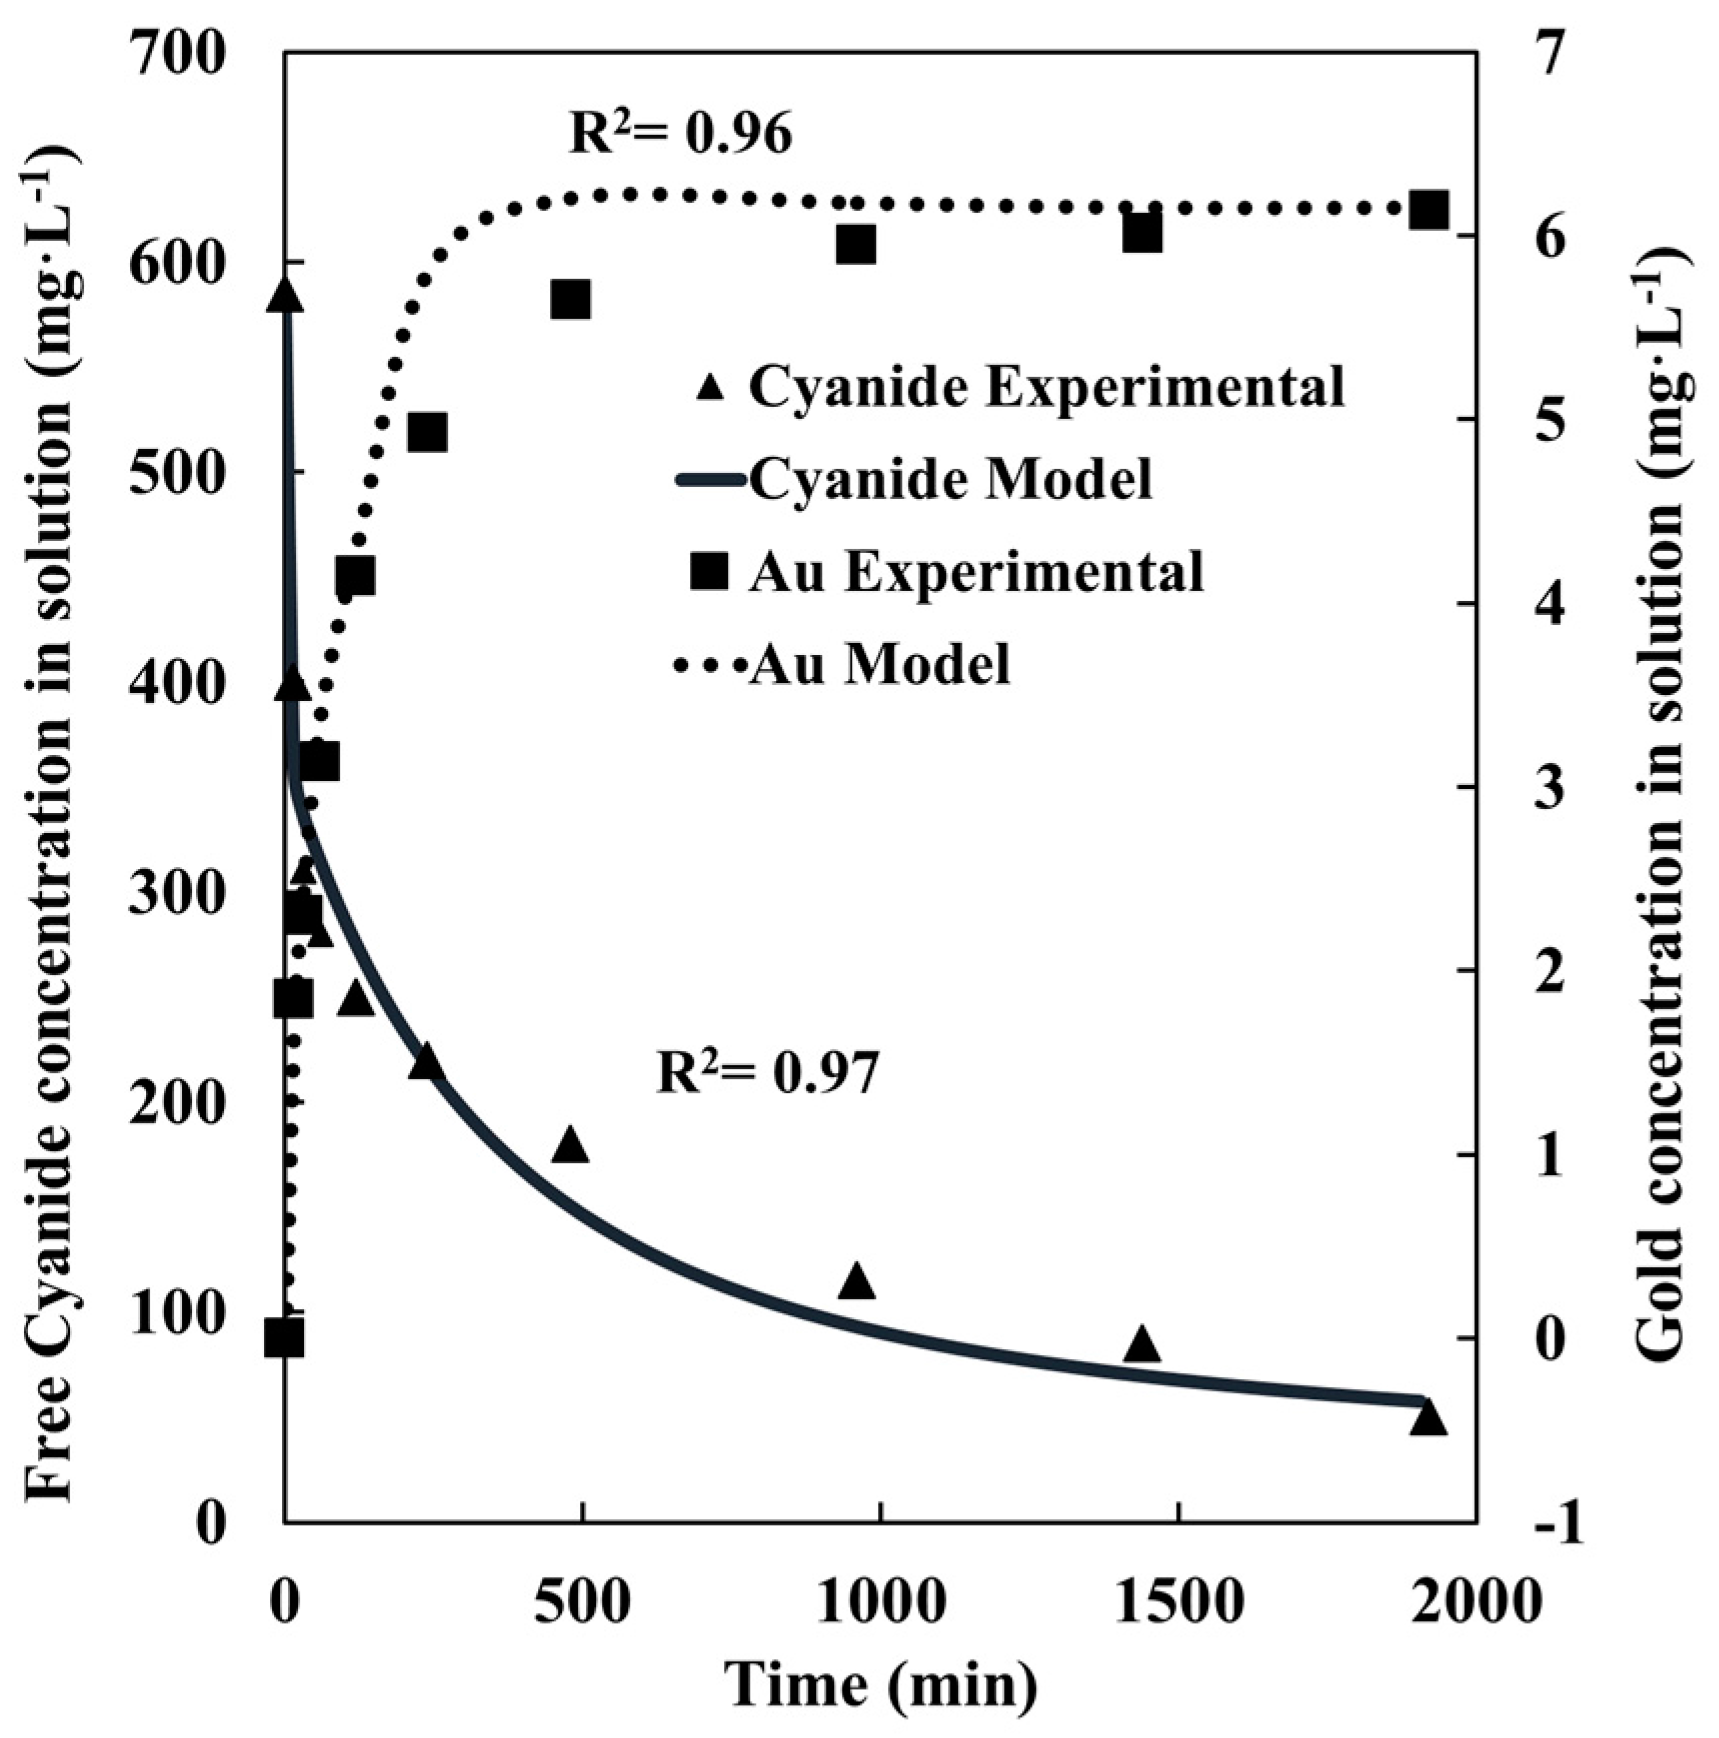
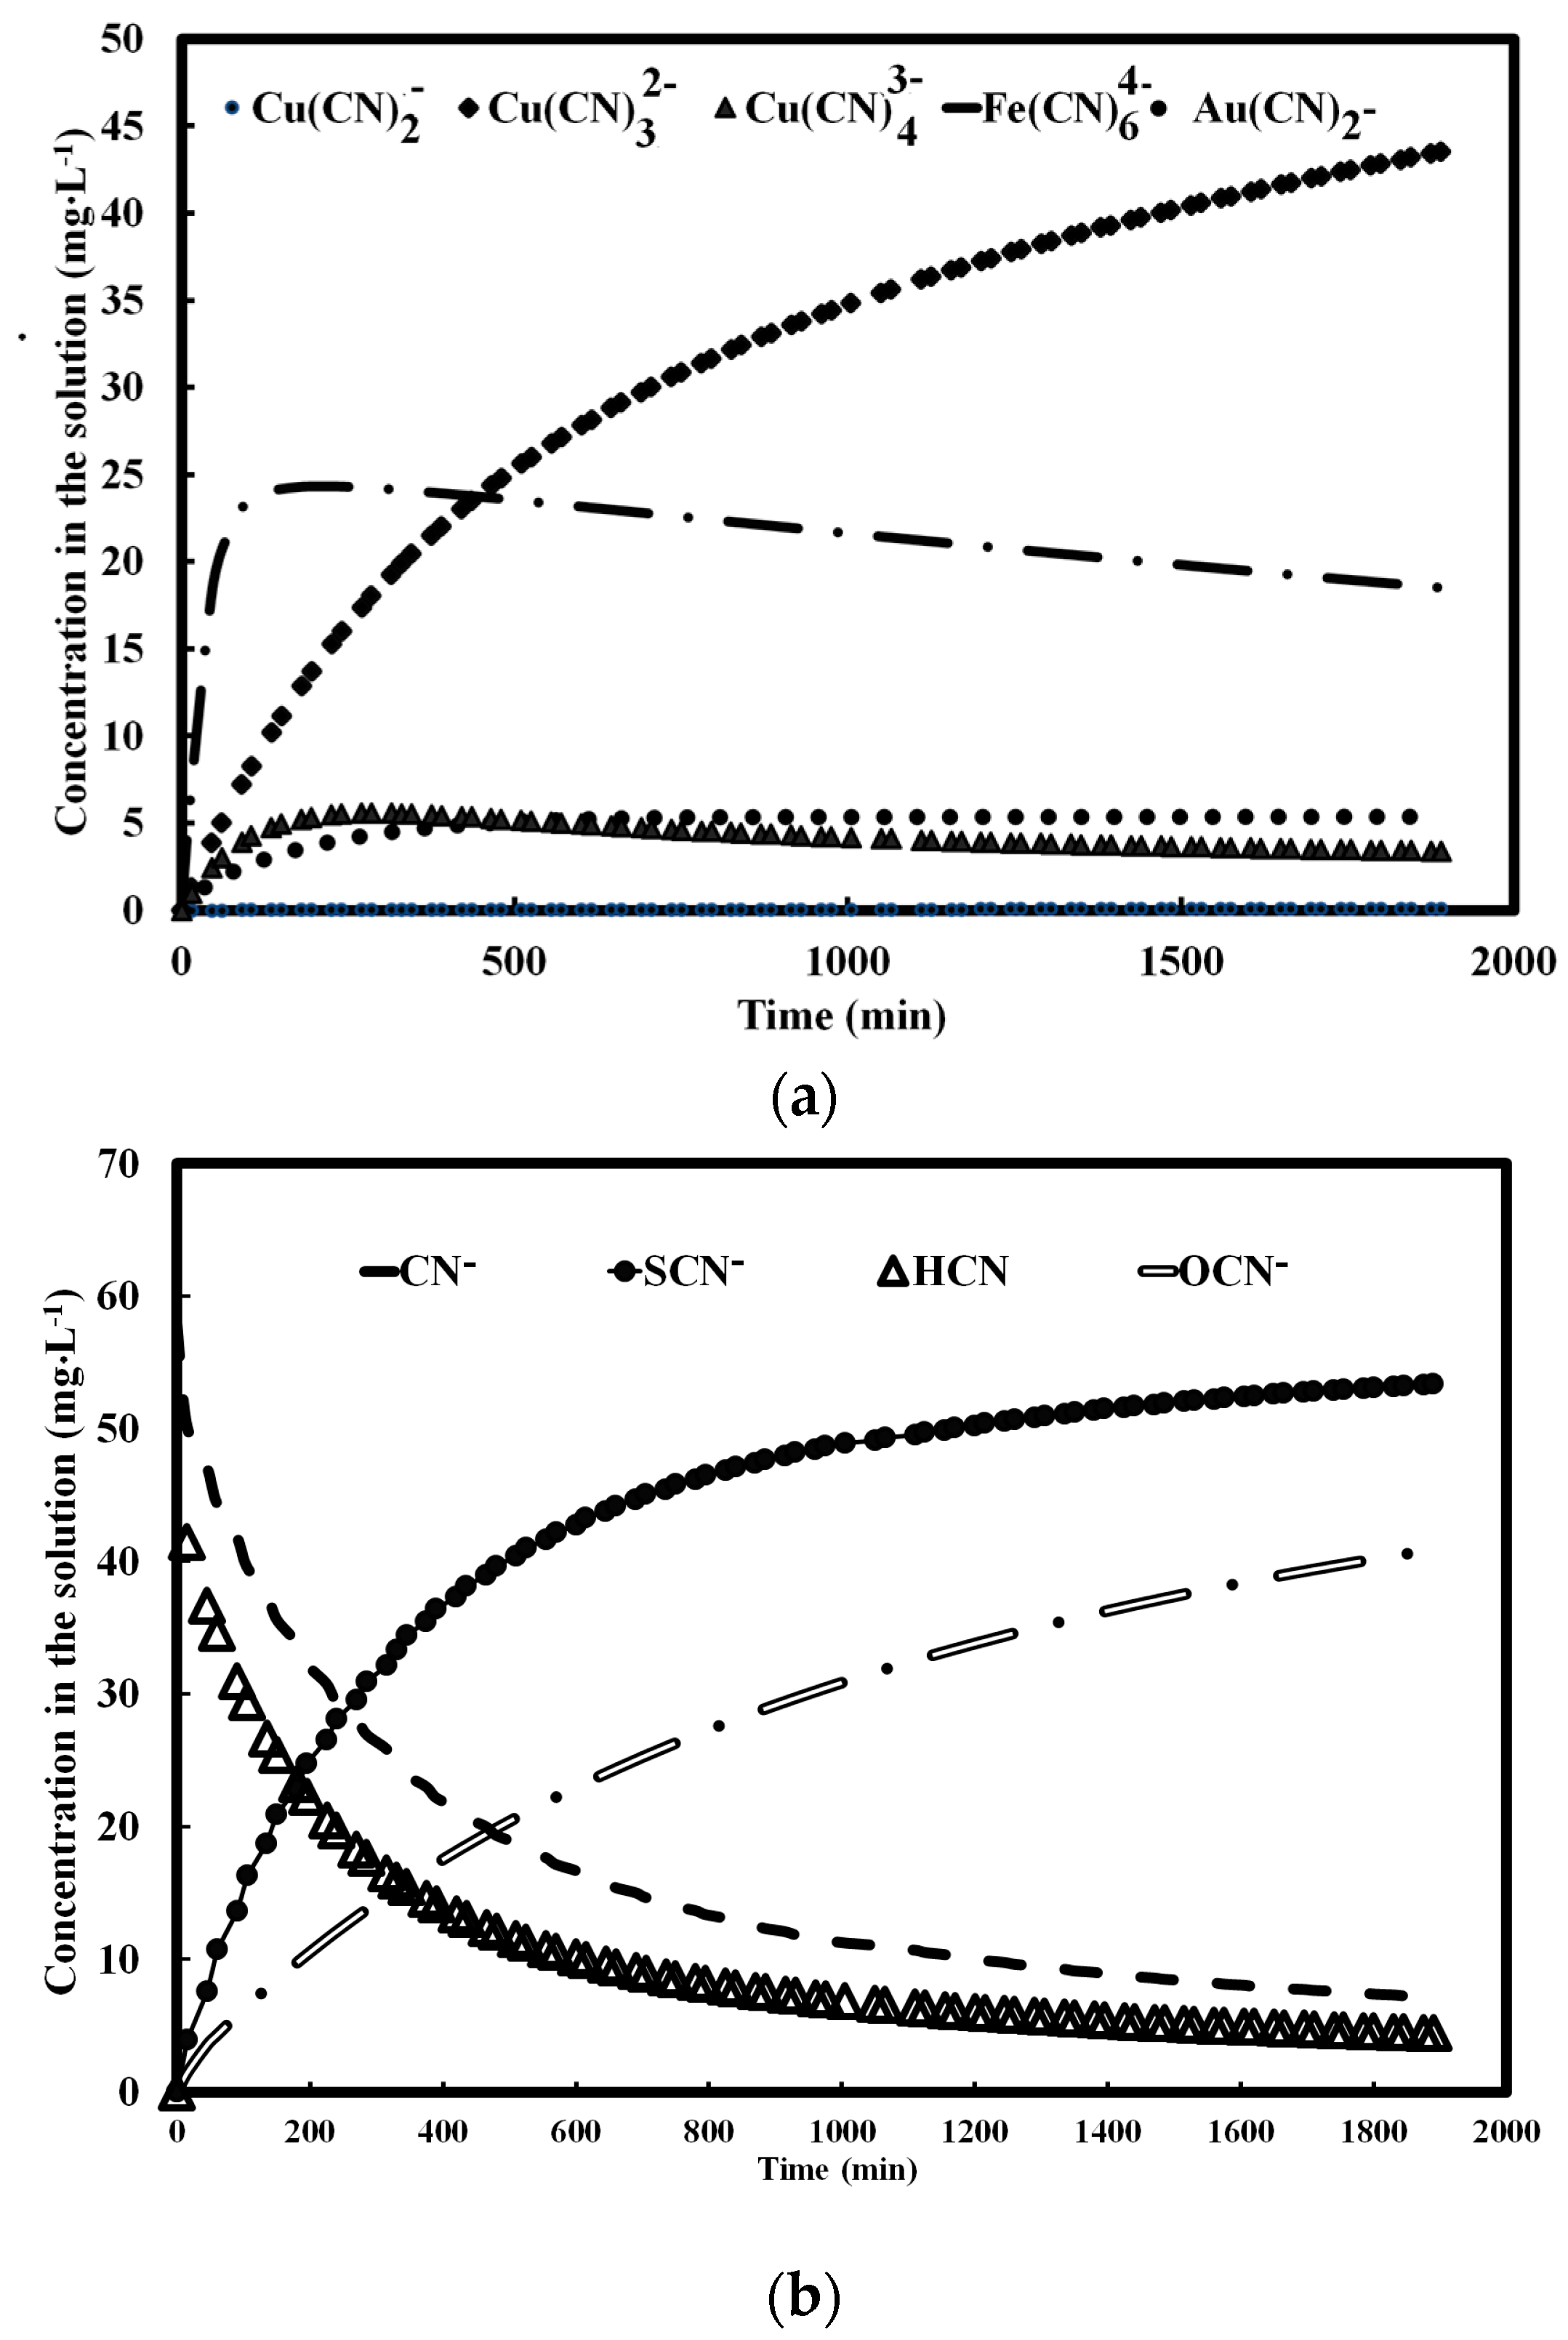
4.4. Gold + Pyrite + Chalcopyrite Leaching

The results for gold, iron and copper leaching and cyanide for this system are shown in Figure 7 and Figure 8.
To calculate the free cyanide in this system during the leaching process (Figure 8), the formation of all plausible complexes was considered. The formation of such complexes changes the ionic strength of the solution and therefore the activities of all species present. Thus, the concentrations must be calculated by a recursive algorithm (Figure 1). In addition, the calculated species concentrations should fit the total element concentrations predicted by the kinetic model. Figure 9 shows the concentrations of the main cyanide complexes formed in solution. For this system, Fe(CN)64−, Cu(CN)32− and Au(CN)2 are predominant (Figure 9a), which agrees with previous studies [15].
With decreasing free cyanide in solution, the concentration of Cu(CN)43− decreases while that of Cu(CN)32− increases. The concentrations of other cyanide-containing species (HCN, CN, CNO and SCN) are shown in Figure 9b. The HCN and CN concentrations show similar behavior.
The predicted concentrations of iron in Figure 5 and Figure 7 show much larger deviations (R2 = 0.89 and 0.81, respectively) from the measured values, compared with other systems. This may be due to the use of a higher precipitation rate of iron as FeOOH(s) in the model. Whilst prediction of the precipitation of iron was not the aim of this project, the absence or presence of gold appears to affect the cyanide consumption in Figure 4 and Figure 6. For example, the residual free cyanide in the absence of gold decreases from 200 mg·L−1 to 100 mg·L−1 over the time period 1000–2000 min in Figure 6. However, in Figure 8, the free cyanide concentration is lowered below 100 mg·L−1 after 1000 min indicating higher cyanide consumption.

4.5. Gold + Pyrite + Chalcopyrite + Quartz Leaching

The presence of gangue minerals such as silicates may inhibit the action of cyanicides, therefore, the liberation of cyanicides from the hosting gangue minerals should be considered [36,37,38]. This phenomenon has been considered for a real gold ore elsewhere [38]. The results, after the addition of quartz to the pyrite + chalcopyrite + gold system to make up a slurry of 42% solids, showed no effect of quartz on cyanide consumption. If metal ions from other minerals capable of forming complexes with cyanide were present in the ore, their equilibrium indices should also be considered in Table 1. However, the modeling methodology would remain the same.

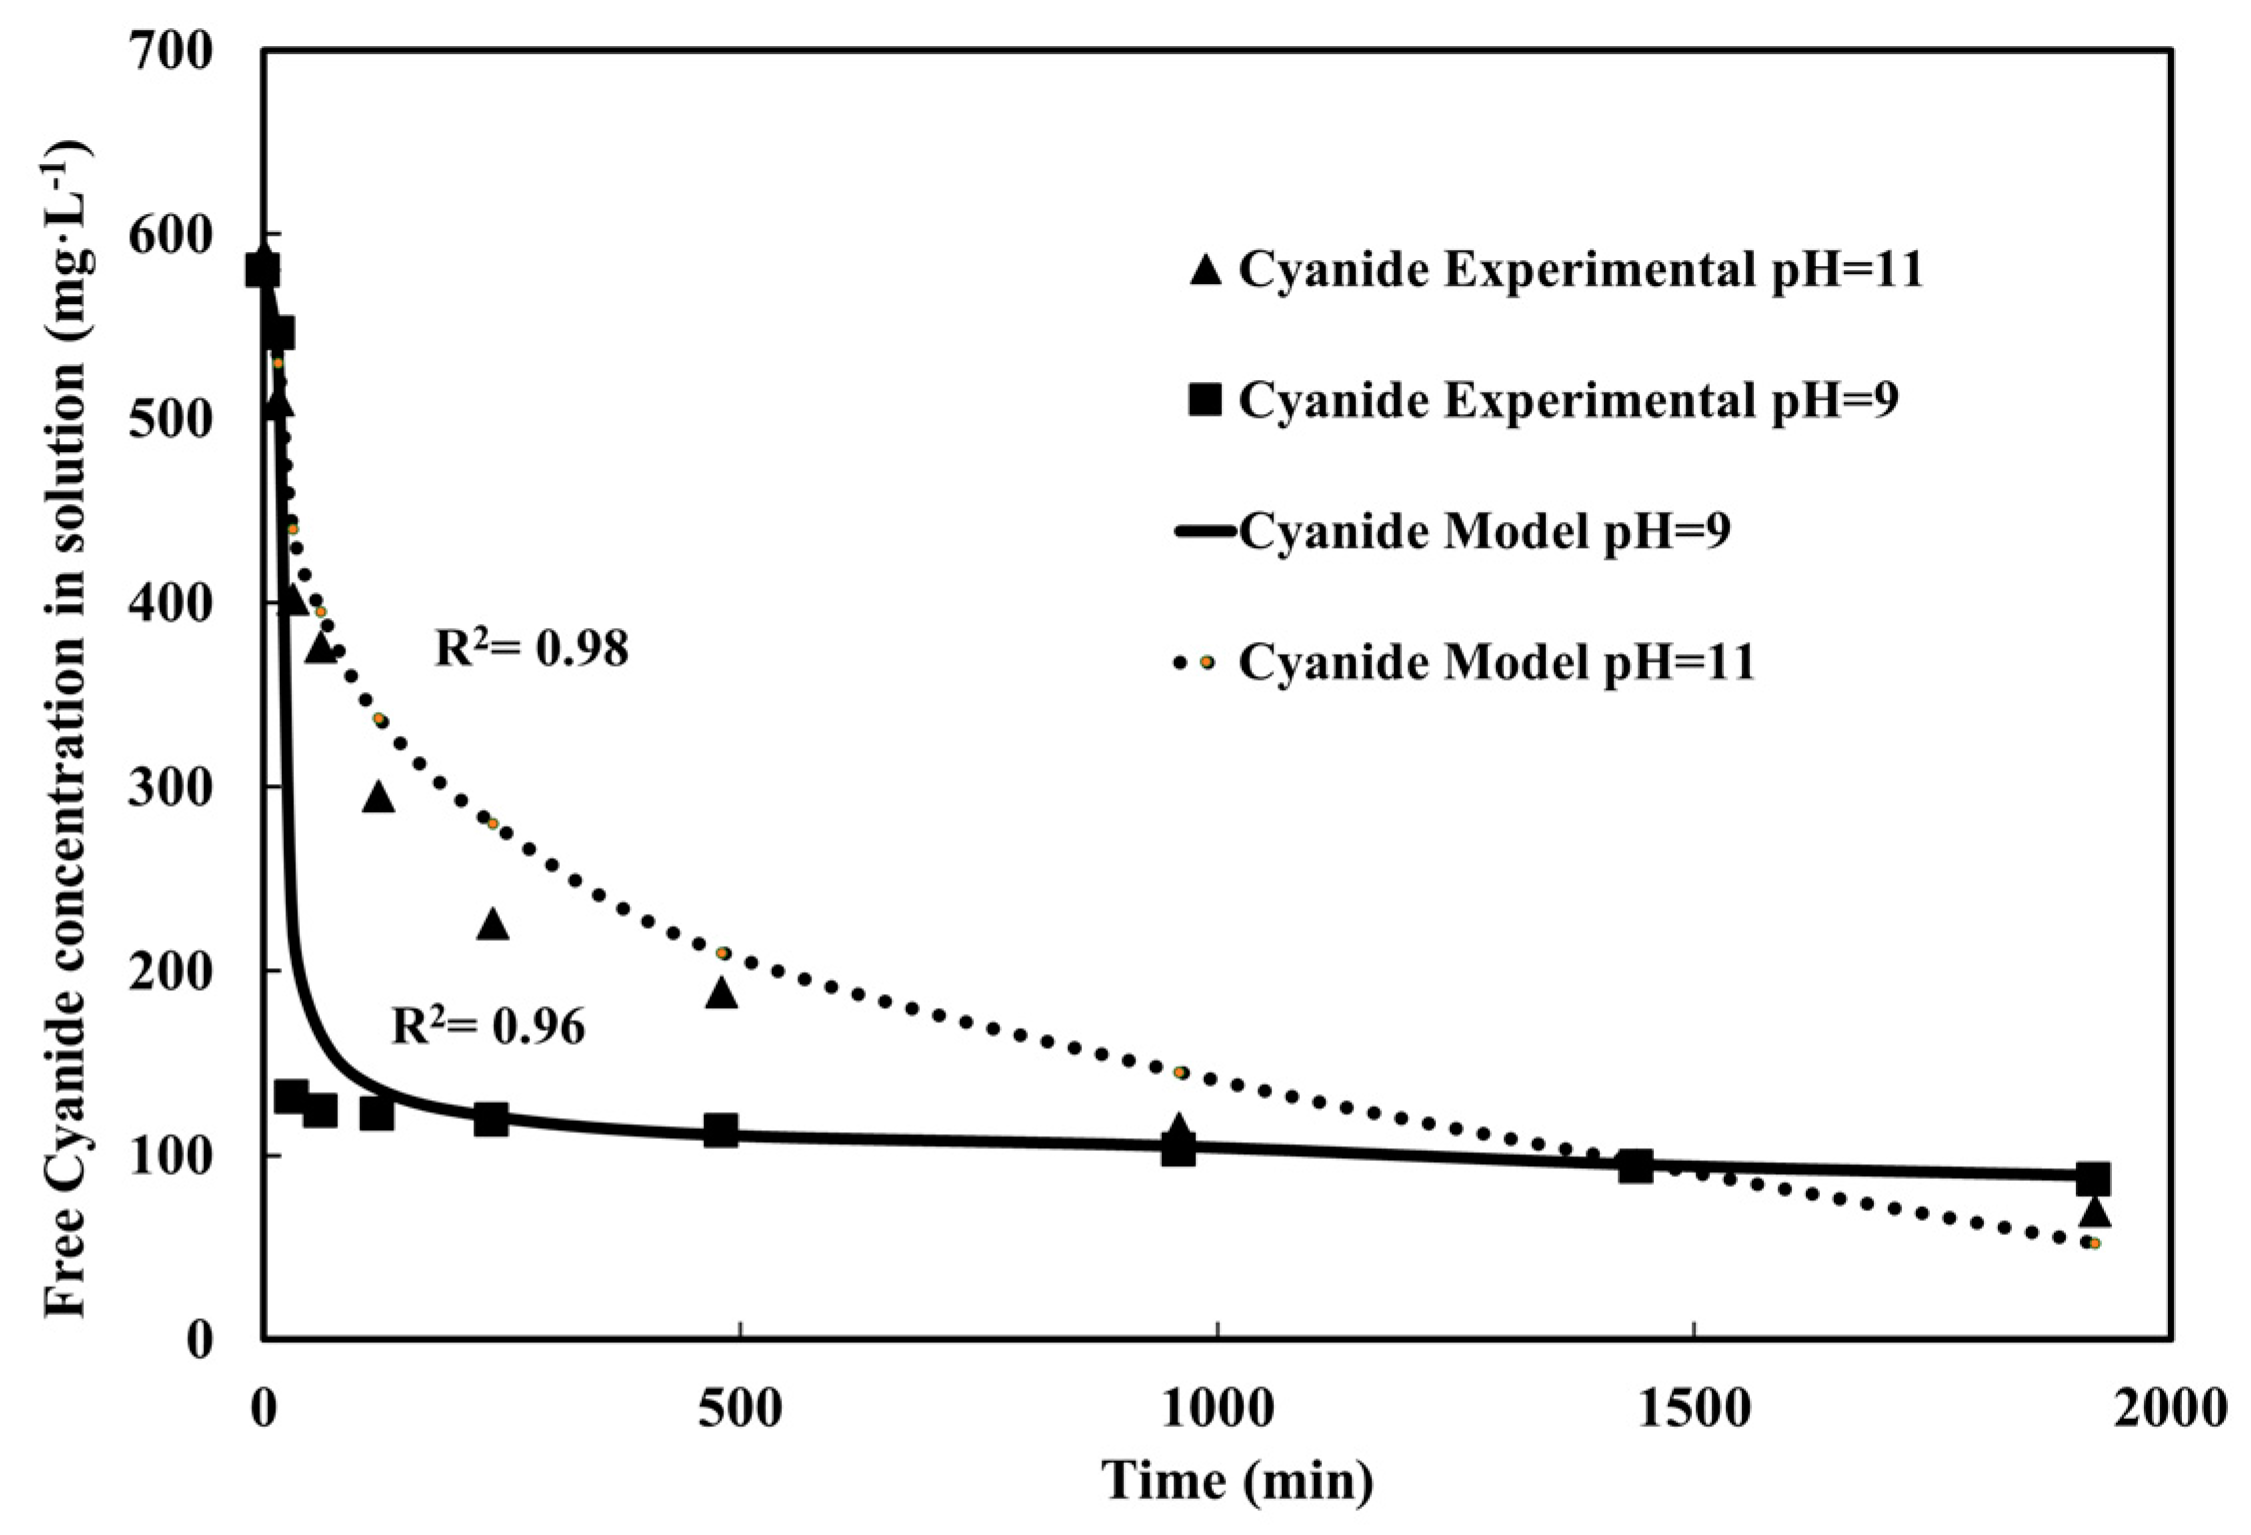
4.6. Cross Validation: Effect of pH

As pH affects HCN formation [29], ferric ion precipitation and pyrite oxidation kinetics [39], its variation was chosen to validate the method. Accordingly, cyanide consumption was predicted using the model developed for the system pyrite + chalcopyrite + gold with the calibrated parameters of Table 2 and initial pH values of 9.5 and 11.5 (controlled to 9 and 11 respectively). Figure 10 compares the results predicted by the model and the measured concentrations of free cyanide. Decreasing the solution pH (from 11 to 9) lowered the concentration of free cyanide because of HCN evolution. Except in the first few minutes of the reaction, there is a good agreement between the model and the experimental data.

5. Conclusions

An integrated kinetics + speciation model for simulation of gold ore leaching and cyanide consumption has been presented here. The code, developed in MATLAB, takes into account the effects of solution pH and ionic strength, along with the type and amount of sulfide minerals present on cyanide consumption as a function of time. Except in the first few minutes of the leaching process, calculated cyanide concentrations and cyanide consumption were in excellent agreement with experiments over ~30 h (Figure 10). Considering the nature of the model and the relatively small number of empirical parameters it requires, it can be concluded that integrated kinetics + speciation models provide a tool for predicting gold ore leaching behavior and cyanide consumption as a function of time with reasonable accuracy. The present results showed that for pyrite leaching Fe(CN)64− was the predominant complex formed. For the chalcopyrite, and pyrite + chalcopyrite systems, Fe(CN)64− and Cu(CN)32− were predominant, while for the gold + pyrite + chalcopyrite and gold + pyrite + chalcopyrite + quartz systems, Fe(CN)64−, Cu(CN)32− and Au(CN)2 were the predominant ions, at least at high CN/Cu molar ratios. The model can be utilized for optimization of cyanide consumption in different mineralogical and solution conditions, resulting in the generation of less hazardous species in discharge liquors.

Acknowledgments

The authors acknowledge Tarbiat Modares University for financing this study.

Author Contributions

Yaser Kianinia and Mohammad Reza Khalesi had the idea and designed the experiments; Yaser Kianinia and Marjan Shahbazi performed the experiments (this paper was based on Yaser Kianinia’s Ph.D. thesis); Mohammad Reza Khalesi directed the Ph.D. thesis, Mahmoud Abdollahy co-directed the Ph.D. thesis, and Ahmad Khodadadi Darban consulted the Ph.D. thesis, Yaser Kianinia and Mohammad Reza Khalesi wrote the first draft of the paper, Glenn Hefter, Gamini Senanayake and Lubomir Hnedkovsky analyzed the results and edited the paper and gave suggestions for improvements which Yaser Kianinia performed and added to the paper.

Conflicts of Interest

The authors declare no conflict of interest.

References

  1. Marsden, J.; House, I. The Chemistry of Gold Extraction, 2nd ed.; SME: Littleton, CO, USA, 2006. [Google Scholar]
  2. Riveros, P.A. Selectivity aspects of the extraction of gold from cyanide solutions with ion exchange resins. Hydrometallurgy 1993, 33, 43–58. [Google Scholar] [CrossRef]
  3. Anderson, C.G. Alkaline sulfide gold leaching kinetics. Miner. Eng. 2016, 92, 248–256. [Google Scholar] [CrossRef]
  4. Muir, D. A review of the selective leaching of gold from oxidised copper-old ores with ammonia-cyanide and new insights for plant control and operation. Miner. Eng. 2011, 24, 576–582. [Google Scholar] [CrossRef]
  5. Khodadadi, A.; Teimoury, P.; Abdollahy, M.; Samiee, A. Detoxification of cyanide in a gold processing plant tailings water using calcium and sodium hypochlorite. Mine Water Environ. 2008, 27, 52–55. [Google Scholar] [CrossRef]
  6. Kuyucak, N.; Akcil, A. Cyanide and removal options from effluents in gold mining and metallurgical processes. Miner. Eng. 2013, 50, 13–29. [Google Scholar] [CrossRef]
  7. Deschenes, G.; Wallingford, G. Effect of oxygen and lead nitrate on the cyanidation of a sulphide bearing gold ore. Miner. Eng. 1995, 8, 923–931. [Google Scholar] [CrossRef]
  8. De Andrade Lima, L.; Hodouin, D. A lumped kinetic model for gold ore cyanidation. Hydrometallurgy 2005, 79, 121–137. [Google Scholar] [CrossRef]
  9. Adams, M. The chemical behaviour of cyanide in the extraction of gold. 1. Kinetics of cyanide loss in the presence and absence of activated carbon. J. S. Afr. Inst. Min. Metall. 1990, 90, 37–44. [Google Scholar]
  10. Adams, M. The chemical behaviour of cyanide in the extraction of gold. 2. Mechanisms of cyanide loss in the carbon-in-pulp process. J. S. Afr. Inst. Min. Metall. 1990, 90, 67–73. [Google Scholar]
  11. Bellec, S.; Hodouin, D.; Bazin, C.; Khalesi, M.; Duchesne, C. Modelling and simulation of gold ore leaching. In Proceedings of the World Gold Conference, Gauteng, South Africa, 26–30 October 2009; pp. 51–60. [Google Scholar]
  12. Adams, M. A methodology for determining the deportment of cyanide losses in gold plants. Miner. Eng. 2001, 14, 383–390. [Google Scholar] [CrossRef]
  13. Lotz, P.; Janse van Rensburg, S.; Swarts, A. Kinetic gold leach monitoring including cyanide speciation. J. S. Afr. Inst. Min. Metall. 2009, 109, 635–639. [Google Scholar]
  14. Zhang, Y.; Fang, Z.; Muhammed, M. On the solution chemistry of cyanidation of gold and silver bearing sulphide ores. A critical evaluation of thermodynamic calculations. Hydrometallurgy 1997, 46, 251–269. [Google Scholar] [CrossRef]
  15. Lu, J.; Dreisinger, D.; Cooper, W. Thermodynamics of the aqueous copper-cyanide system. Hydrometallurgy 2002, 66, 23–36. [Google Scholar] [CrossRef]
  16. Luthy, R.G.; Bruce, S.G., Jr. Kinetics of reaction of cyanide and reduced sulfur species in aqueous solution. Environ. Sci. Technol. 1979, 13, 1481–1487. [Google Scholar] [CrossRef]
  17. Oraby, E.; Eksteen, J. Gold dissolution and copper suppression during leaching of copper-gold gravity concentrates in caustic soda-low free cyanide solutions. Miner. Eng. 2016, 87, 10–17. [Google Scholar] [CrossRef]
  18. Breuer, P.; Dai, X.; Jeffrey, M. Leaching of gold and copper minerals in cyanide deficient copper solutions. Hydrometallurgy 2005, 78, 156–165. [Google Scholar] [CrossRef]
  19. Kyle, J.H.; Hefter, G. A critical review of the thermodynamics of hydrogen cyanide and copper(I)-cyanide complexes in aqueous solution. Hydrometallurgy 2015, 154, 78–87. [Google Scholar] [CrossRef]
  20. Lukey, G.; Van Deventer, J.; Chowdhury, R.; Shallcross, D. The effect of salinity on the capacity and selectivity of ion exchange resins for gold cyanide. Miner. Eng. 1999, 12, 769–785. [Google Scholar] [CrossRef]
  21. Parkhurst, D.L.; Appelo, C. User’s Guide to PHREEQC (Version 2): A Computer Program for Speciation, Batch-Reaction, One-Dimensional Transport, and Inverse Geochemical Calculations; U.S. Geological Survey: Reston, VA, USA, 1999.
  22. Vítková, M.; Ettler, V.; Šebek, O.; Mihaljevič, M.; Grygar, T.; Rohovec, J. The pH-dependent leaching of inorganic contaminants from secondary lead smelter fly ash. J. Hazard. Mater. 2009, 167, 427–433. [Google Scholar] [CrossRef] [PubMed]
  23. Martens, E.; Jacques, D.; Van Gerven, T.; Wang, L.; Mallants, D. PHREEQC modelling of leaching of major elements and heavy metals from cementitious waste forms. In Materials Research Society Symposia Proceedings; Cambridge University Press: Cambridge, UK, 2008; p. 475. [Google Scholar]
  24. Halim, C.E.; Short, S.A.; Scott, J.A.; Amal, R.; Low, G. Modelling the leaching of Pb, Cd, As, and Cr from cementitious waste using PHREEQC. J. Hazard. Mater. 2005, 125, 45–61. [Google Scholar] [CrossRef] [PubMed]
  25. Tiruta-Barna, L. Using PHREEQC for modelling and simulation of dynamic leaching tests and scenarios. J. Hazard. Mater. 2008, 157, 525–533. [Google Scholar] [CrossRef] [PubMed]
  26. Peterson, S.; Hostetler, C.; Deutsch, W.; Cowan, C. MINTEQ User’s Manual; Pacific Northwest Lab.: Richland, WA, USA; Division of Waste Management, Nuclear Regulatory Commission: Washington, DC, USA, 1987.
  27. Smith, R.M.; Martell, A.E. Critical Stability Constants; Plenum Press: New York, NY, USA, 1976; Volume 4. [Google Scholar]
  28. Schweitzer, G.K.; Pesterfield, L.L. The Aqueous Chemistry of the Elements; Oxford University Press: Oxford, UK, 2010. [Google Scholar]
  29. Akilan, C.; Königsberger, E.; Solis, J.S.; May, P.M.; Kyle, J.H.; Hefter, G. Investigation of complexation and solubility equilibria in the copper(I)/cyanide system at 25 °C. Hydrometallurgy 2016, 164, 202–207. [Google Scholar] [CrossRef]
  30. Paz-García, J.M.; Johannesson, B.; Ottosen, L.M.; Ribeiro, A.B.; Rodríguez-Maroto, J.M. Computing multi-species chemical equilibrium with an algorithm based on the reaction extents. Comput. Chem. Eng. 2013, 58, 135–143. [Google Scholar] [CrossRef] [Green Version]
  31. Strong, B.; Murray-Smith, R. Determination of gold in copper-bearing sulphide ores and metallurgical flotation products by atomic-absorption spectrometry. Talanta 1974, 21, 1253–1258. [Google Scholar] [CrossRef]
  32. Breuer, P.; Sutcliffe, C.; Meakin, R. Cyanide measurement by silver nitrate titration: Comparison of rhodanine and potentiometric end-points. Hydrometallurgy 2011, 106, 135–140. [Google Scholar] [CrossRef]
  33. Adams, M. The removal of cyanide from aqueous solution by the use of ferrous sulphate. J. S. Afr. Inst. Min. Metall. 1992, 92, 17–25. [Google Scholar]
  34. Xie, F.; Dreisinger, D.B. Use of ferricyanide for gold and silver cyanidation. Trans. Nonferr. Met. Soc. China 2009, 19, 714–718. [Google Scholar] [CrossRef]
  35. Xie, F.; Dreisinger, D.; Lu, J. The novel application of ferricyanide as an oxidant in the cyanidation of gold and silver. Miner. Eng. 2008, 21, 1109–1114. [Google Scholar] [CrossRef]
  36. Khalesi, M.; Bazin, C.; Hodouin, D.; Bellec, S. Modelling of the gold content within the size intervals of a grinding mill product. In Proceedings of the World Gold Conference, Montreal, QC, Canada, 2–5 October 2011; pp. 437–450. [Google Scholar]
  37. Khalesi, M.; Bazin, C.; Hodouin, D.; Bellec, S. A liberation model for the integrated simulation of grinding and leaching of gold ore. In Proceedings of the World Gold Conference, Gauteng, South Africa, 26–30 October 2009; pp. 61–73. [Google Scholar]
  38. Kianinia, Y.; Khalesi, M.; Abdollahy, M.; Darban, A.K. Modeling the cyanide consumption in leaching of gold ores based on the amount and liberation degree of cyanicides. Can. Metall. Q. 2017, in press. [Google Scholar]
  39. Kondos, P.D.; Deschênes, G.; Morrison, R.M. Process optimization studies in gold cyanidation. Hydrometallurgy 1995, 39, 235–250. [Google Scholar] [CrossRef]
Figure 1. Methodology used for the modeling of mineral leaching, speciation and cyanide consumption.
Minerals 08 00110 g001
Figure 2. Iron and free cyanide concentrations in solution for the pyrite leaching system.
Minerals 08 00110 g002
Figure 3. Iron and copper concentrations in solution for the chalcopyrite leaching system.
Minerals 08 00110 g003
Figure 4. Free cyanide concentrations in solution for the chalcopyrite leaching system.
Minerals 08 00110 g004
Figure 5. Iron and copper concentrations in solution for the pyrite + chalcopyrite leaching system.
Minerals 08 00110 g005
Figure 6. Free cyanide concentrations in solution for the pyrite + chalcopyrite leaching system.
Minerals 08 00110 g006
Figure 7. Iron and copper concentrations in solution for the gold + pyrite + chalcopyrite leaching system.
Minerals 08 00110 g007
Figure 8. Free cyanide and gold concentrations in solution for the gold + pyrite + chalcopyrite system.
Minerals 08 00110 g008
Figure 9. Concentration of the main cyanide complexes formed in solution for the gold + pyrite + chalcopyrite system at pH = 10.4; (a) Fe, Cu or Au (mg/L) as Fe(CN)64−, Cu(CN)32−, Cu(CN)43−, Cu(CN)2 and Au(CN)2; (b) CN (mg·L−1) as HCN, CN, CNO and SCN, 0.1 × CN and 0.1 × SCN concentration are plotted on the same scale.
Minerals 08 00110 g009
Figure 10. Prediction vs. measurement of cyanide concentrations in solution for the gold + pyrite + chalcopyrite system at pH = 9 and 11.
Minerals 08 00110 g010
Table 1. Main equilibria of the Cu-CN-Fe-Au-S-O-H system (25 °C, 1 atm and I = 0).
Equilibriumlog KRef.
CN + H+ = HCN9.21[14,19]
Au+ + 2CN = Au(CN)239.3[2,27]
H2O = H+ + OH−13.98[14]
Au+ + CN = AuCN(s)38.9[14]
Fe2+ + 6CN = Fe(CN)64−35.4[14]
S + CN = SCN0.9[28]
½O2 + CN = OCN3.5[28]
Cu+ + 2CN = Cu(CN)223.7[29]
Cu+ + 3CN = Cu(CN)32−28.5[29]
Cu+ + 4CN = Cu(CN)43−30.6[29]
Cu2+ + 2H2O = Cu(OH)2 + 2H+−16.24[14]
Fe2+ + 3H2O = Fe(OH)3 + 3H+−32[14]
Fe3+ + 2H2O = FeOOH + 3H+−0.5[14]
Cu(CN)2 = CuCN(s) + CN−4.91[14]
Table 2. Composition of chalcopyrite and pyrite.
MineralElemental Composition (wt %)
ZnSiSbSPbFeCuCaAsAl
Chalcopyrite0.262.860.0233.440.0129.2633.180.010.0120.01
Pyrite0.010.190.0252.710.0246.130.020.010.010.19
Table 3. Calibrated parameters of the kinetic model.
System *Mineralk **αβ
Py.Py.6.81.011.1
Ch.Ch.0.580.861.15
Py. + Ch.Py.4.710.311.82
Ch.0.620.611.16
Au + Py. + Ch. (±Qtz.)Py.5.960.282.14
Ch.0.730.711.25
Au14.990.911.13
* Abbreviations: Py. (pyrite), Ch. (chalcopyrite), Au (gold) and Qtz. (quartz), ** unit: mol1 − ( α + β ) m(α + β) − 1·s−1.

