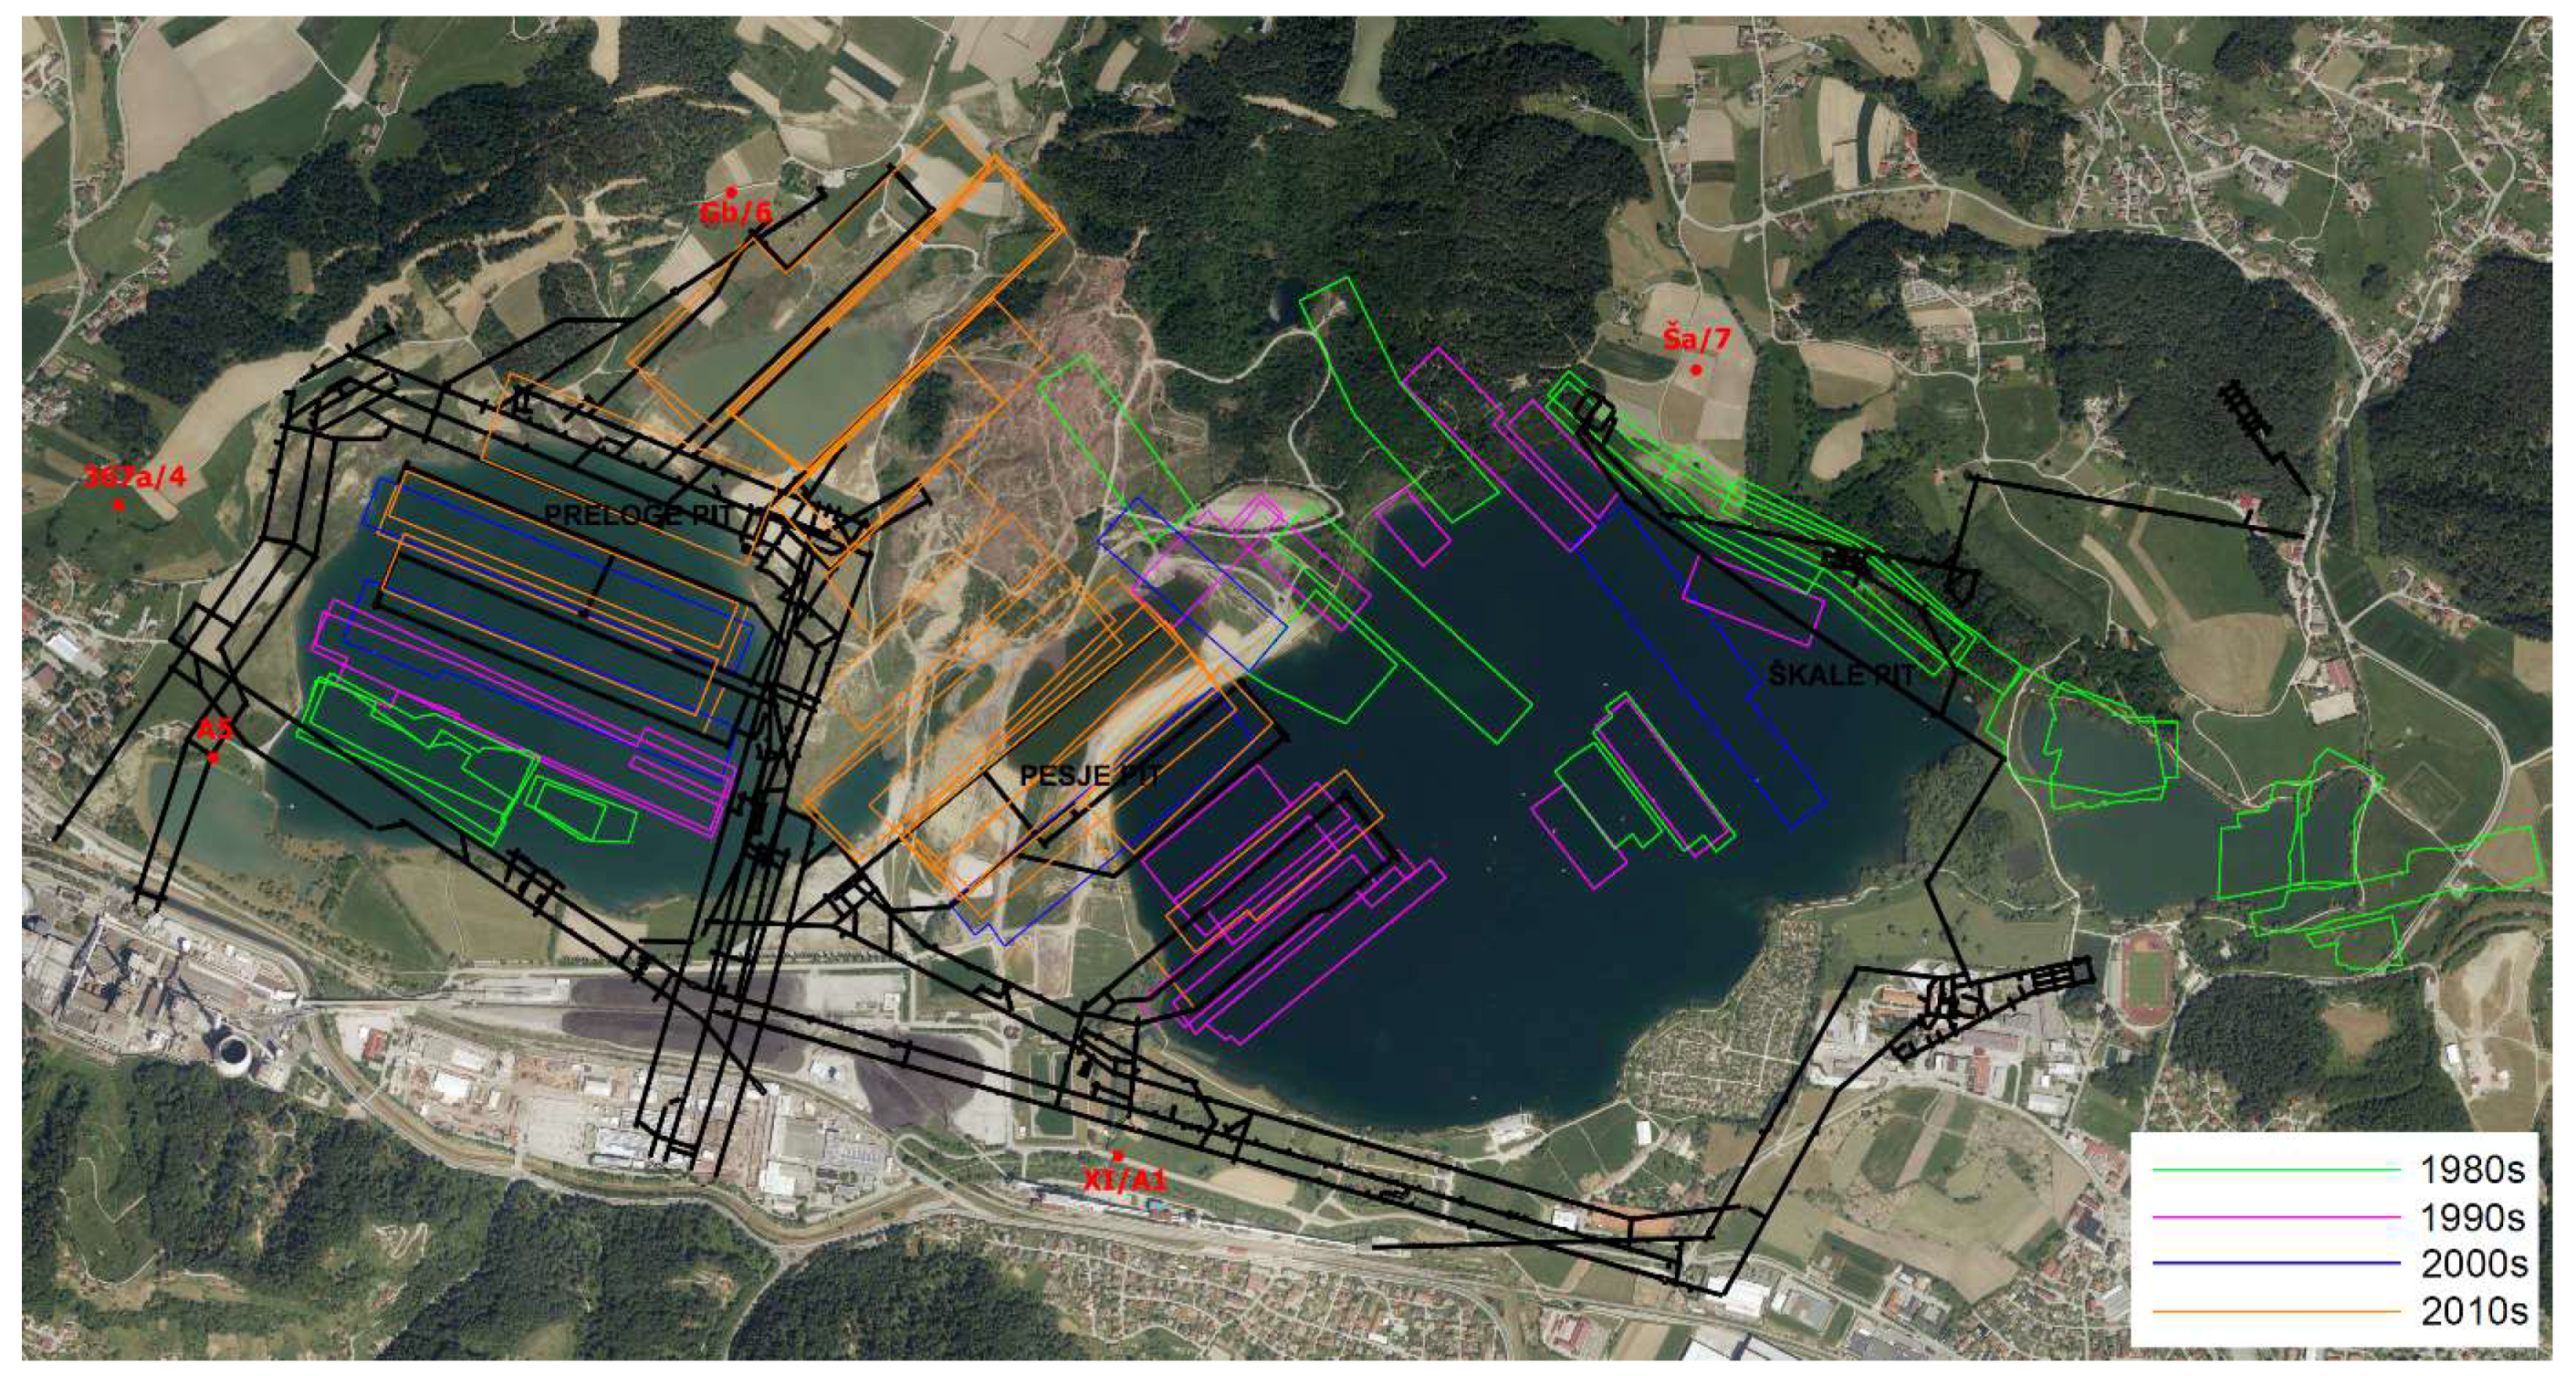
3. Results and Discussion
Based on linearized function fit equations (Equation (1)) the values of the parameters
R,
L,
P,
p and standard deviation for all parameters were calculated. Furthermore, a confidence interval (
τ = 3) for each parameter was defined. The results of the analysis of vertical displacement fitted by a modified sigmoid function for observation points GB/6, A5, 367a/4, Ša7 and X1-A1 are shown in
Table 2,
Table 3,
Table 4,
Table 5 and
Table 6.
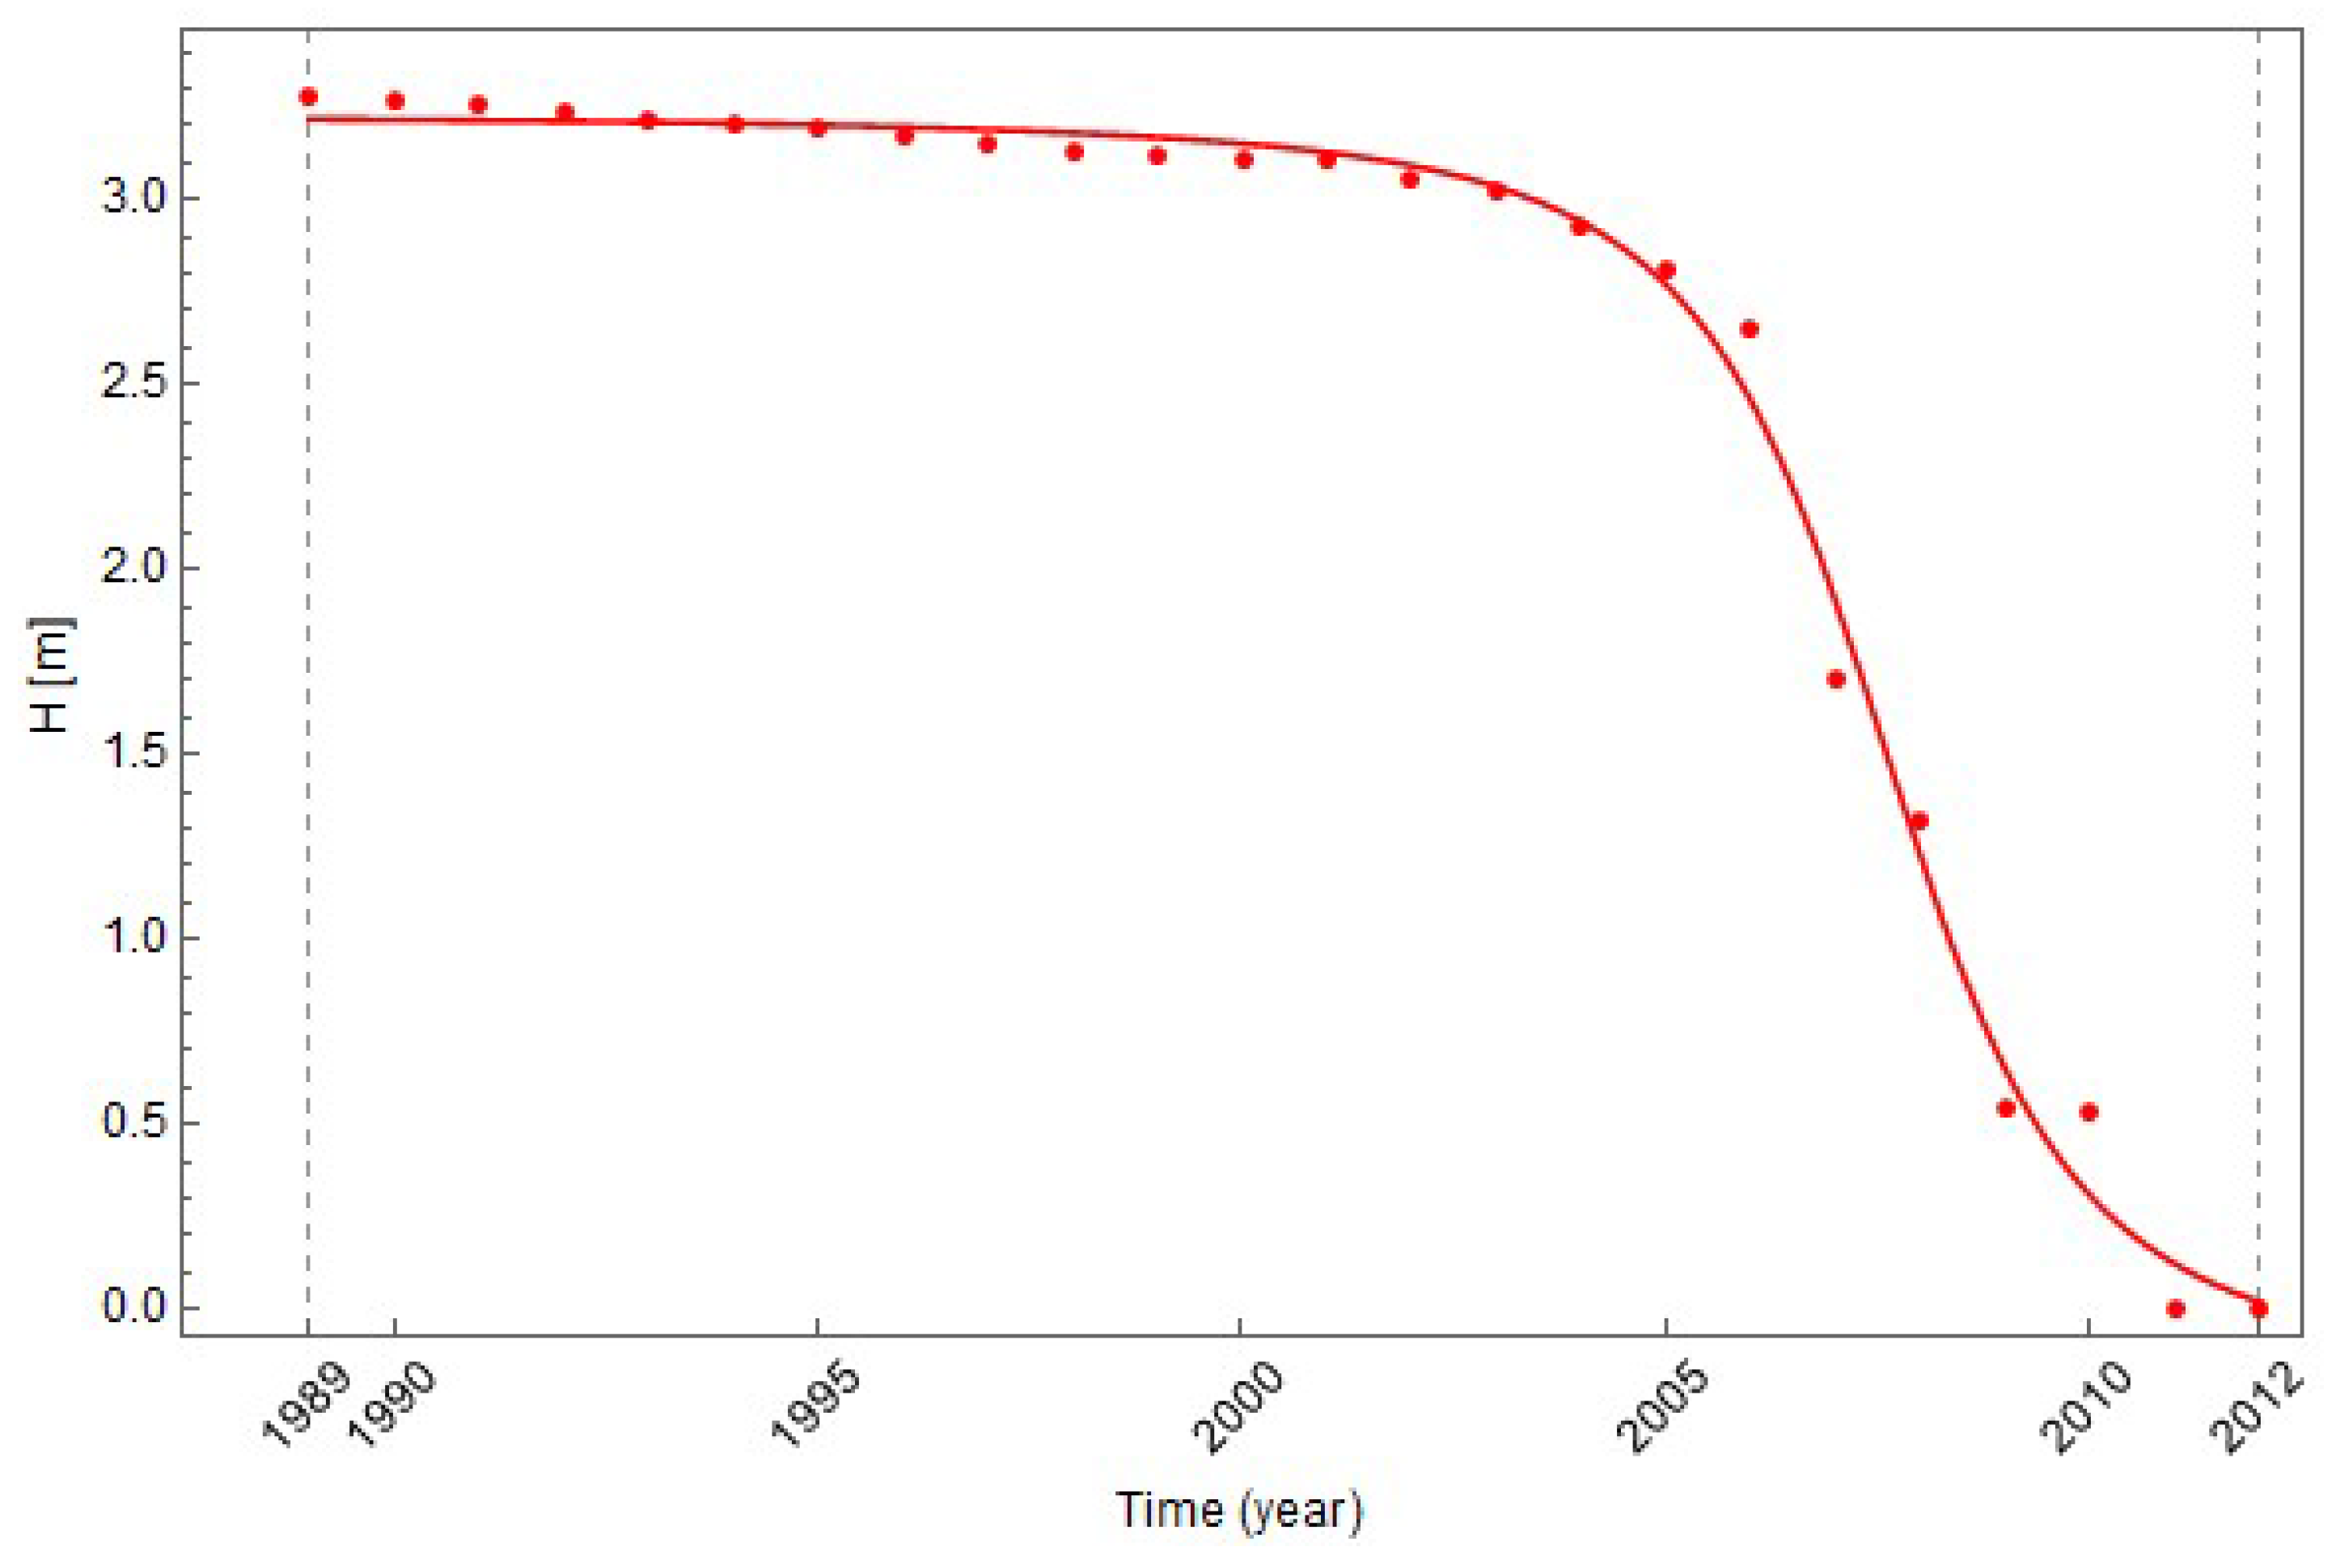
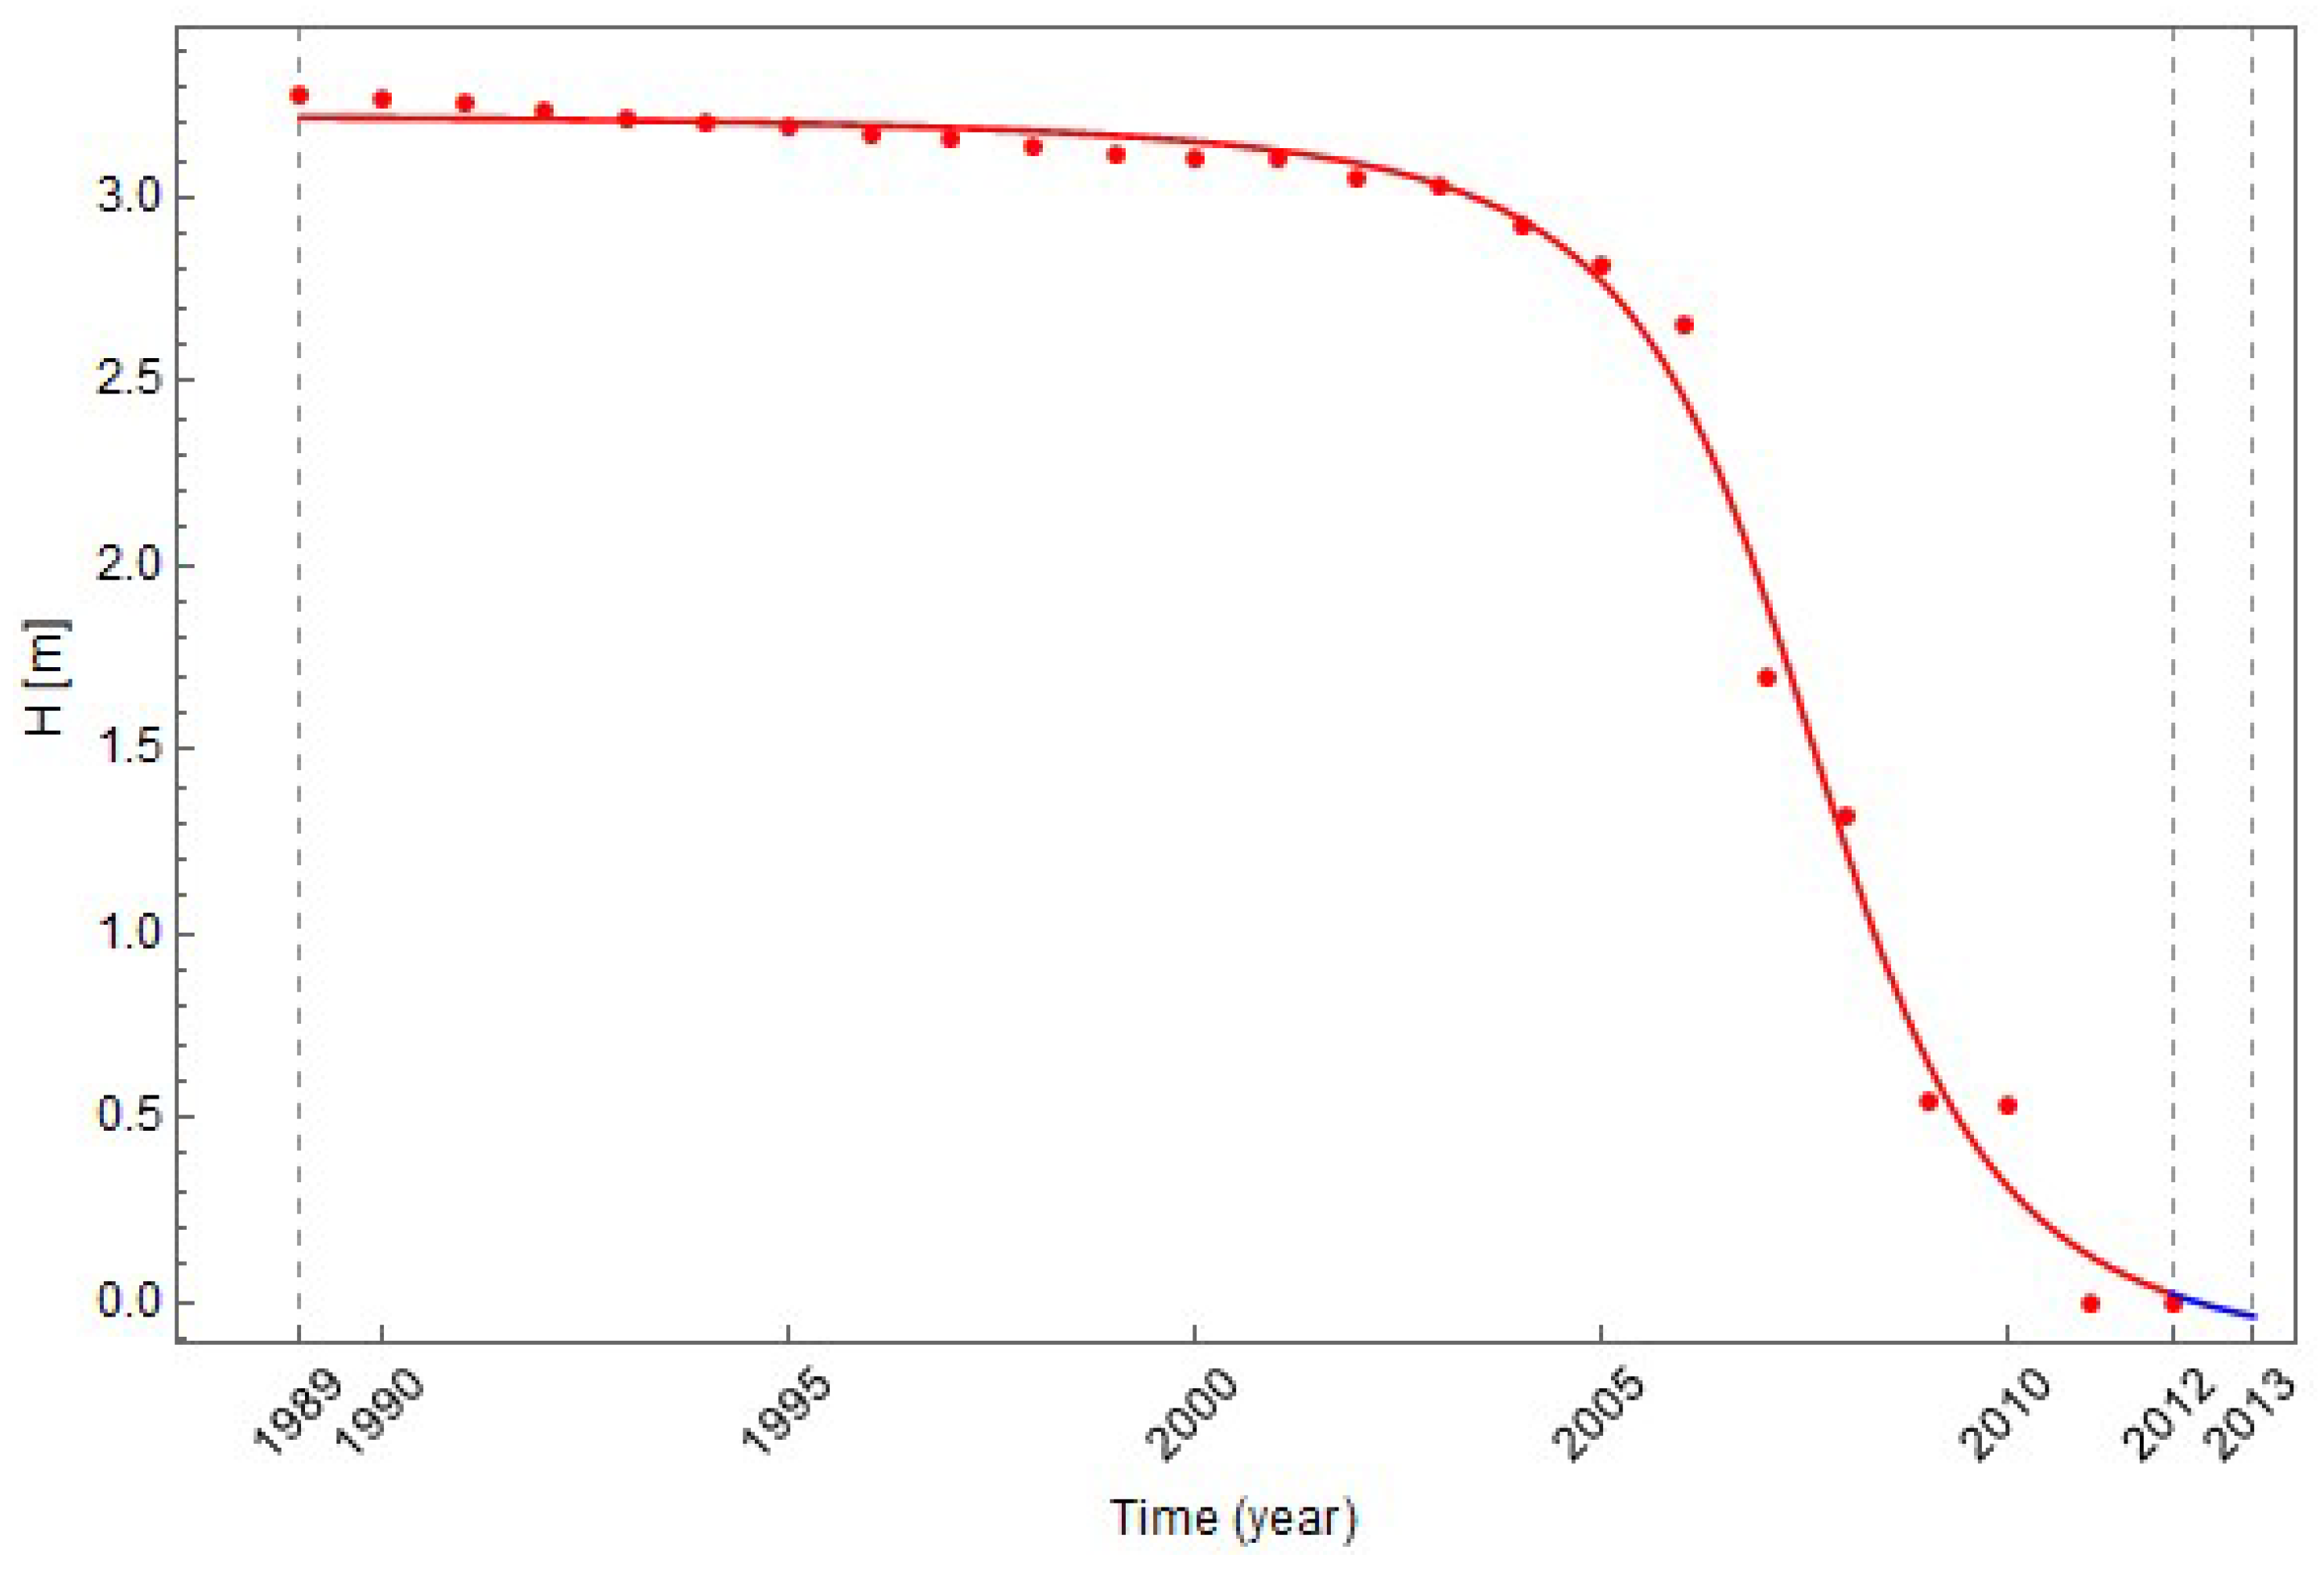
In
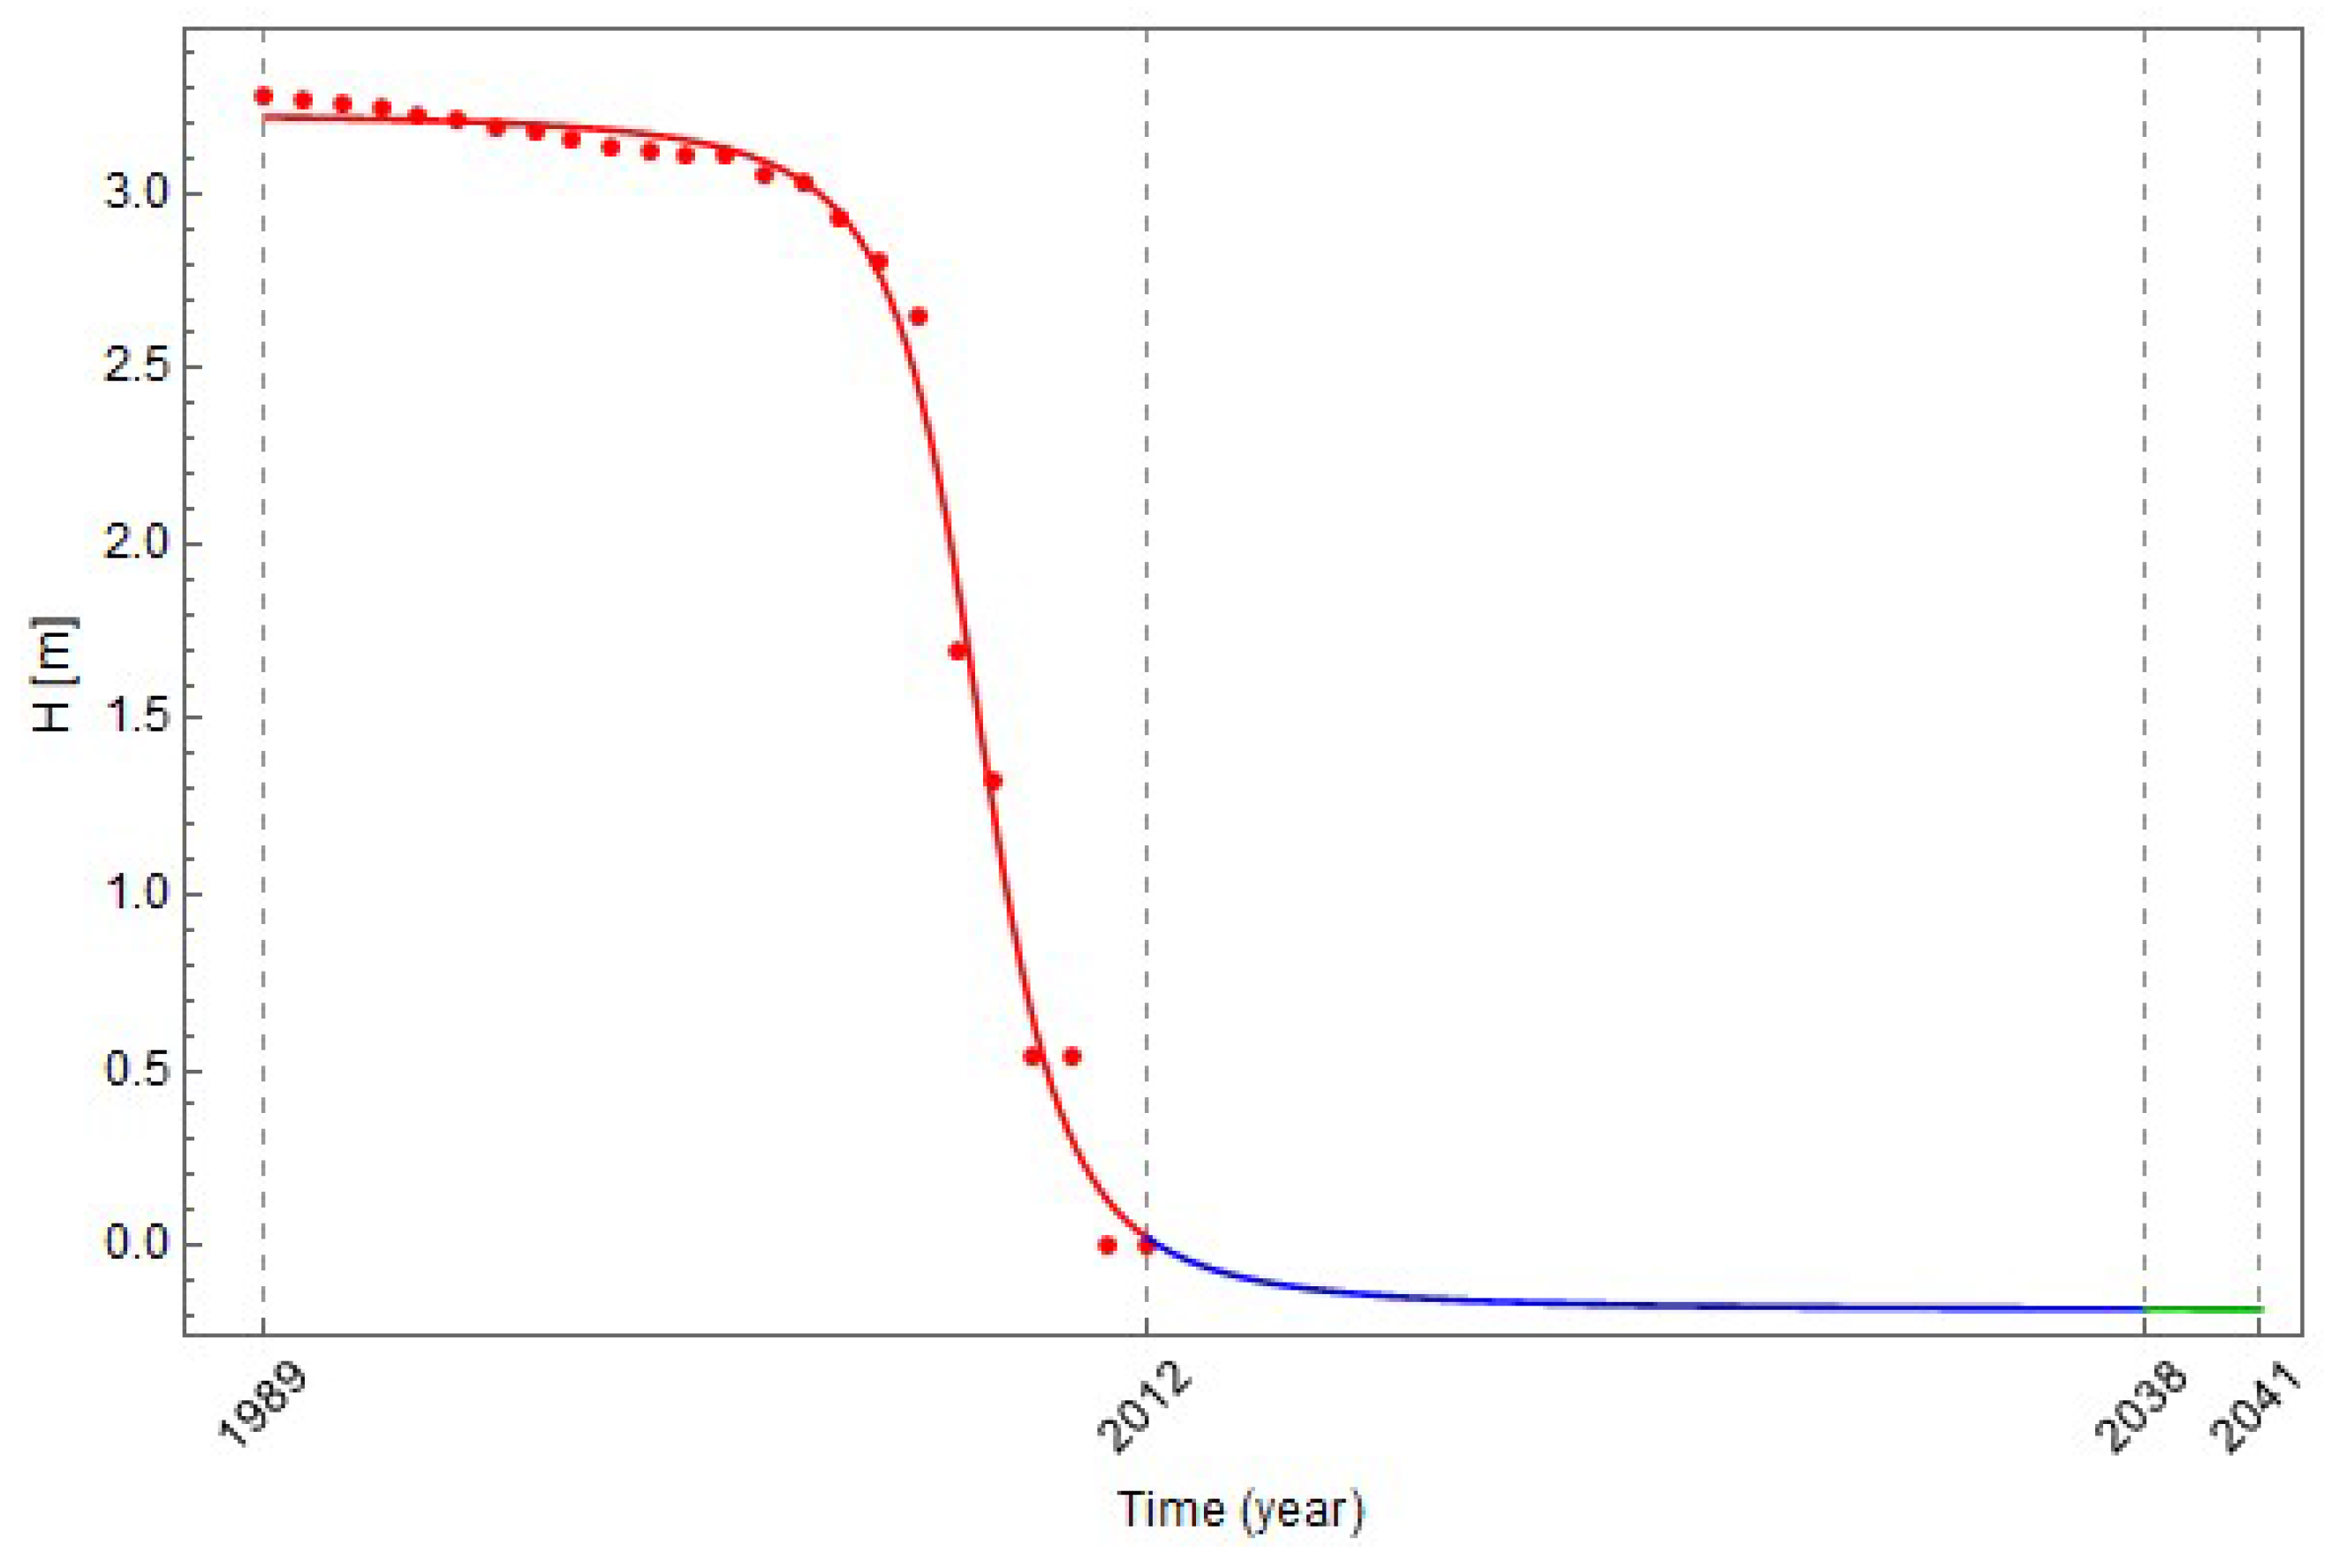
Figure 7, real data of vertical displacement of point GB/6 (red circles) and the best fit theoretical modified sigmoid function (red curve) are shown. Furthermore, the prediction of subsidence and the time of the next and the final observation measurements is determined from Equations (2) and (3). The next observation measurement is, according to the criterion from Equation (2), needed one year after the last observation measurement, i.e., in the year 2013 (
Figure 8). Between 2012 and 2013, subsidence, i.e., vertical displacement, of 0.061 m will develop. Yearly subsidence greater than 0.001 m is predicted till year 2038. This applies to the active state of subsidence of the observed area, so further monitoring is required (
Figure 9—blue curve). In this phase, total subsidence from 2012 to 2038 is 0.2021 m. From 2038 on, subsidence of less than 0.001 m per year will develop. During this period, the subsidence of the area slowly calms down, and the function is consolidated (
Figure 9—green curve), and no further observation measurements will be needed. Thus, the measurements at observation point GB/6 must be carried out once a year until 2038. The final observation measurement will be required 3 years after the last measurement, i.e., in 2041. Predicted total subsidence from 2038 till 2041 is 0.0009 m, i.e., 0.91 mm.
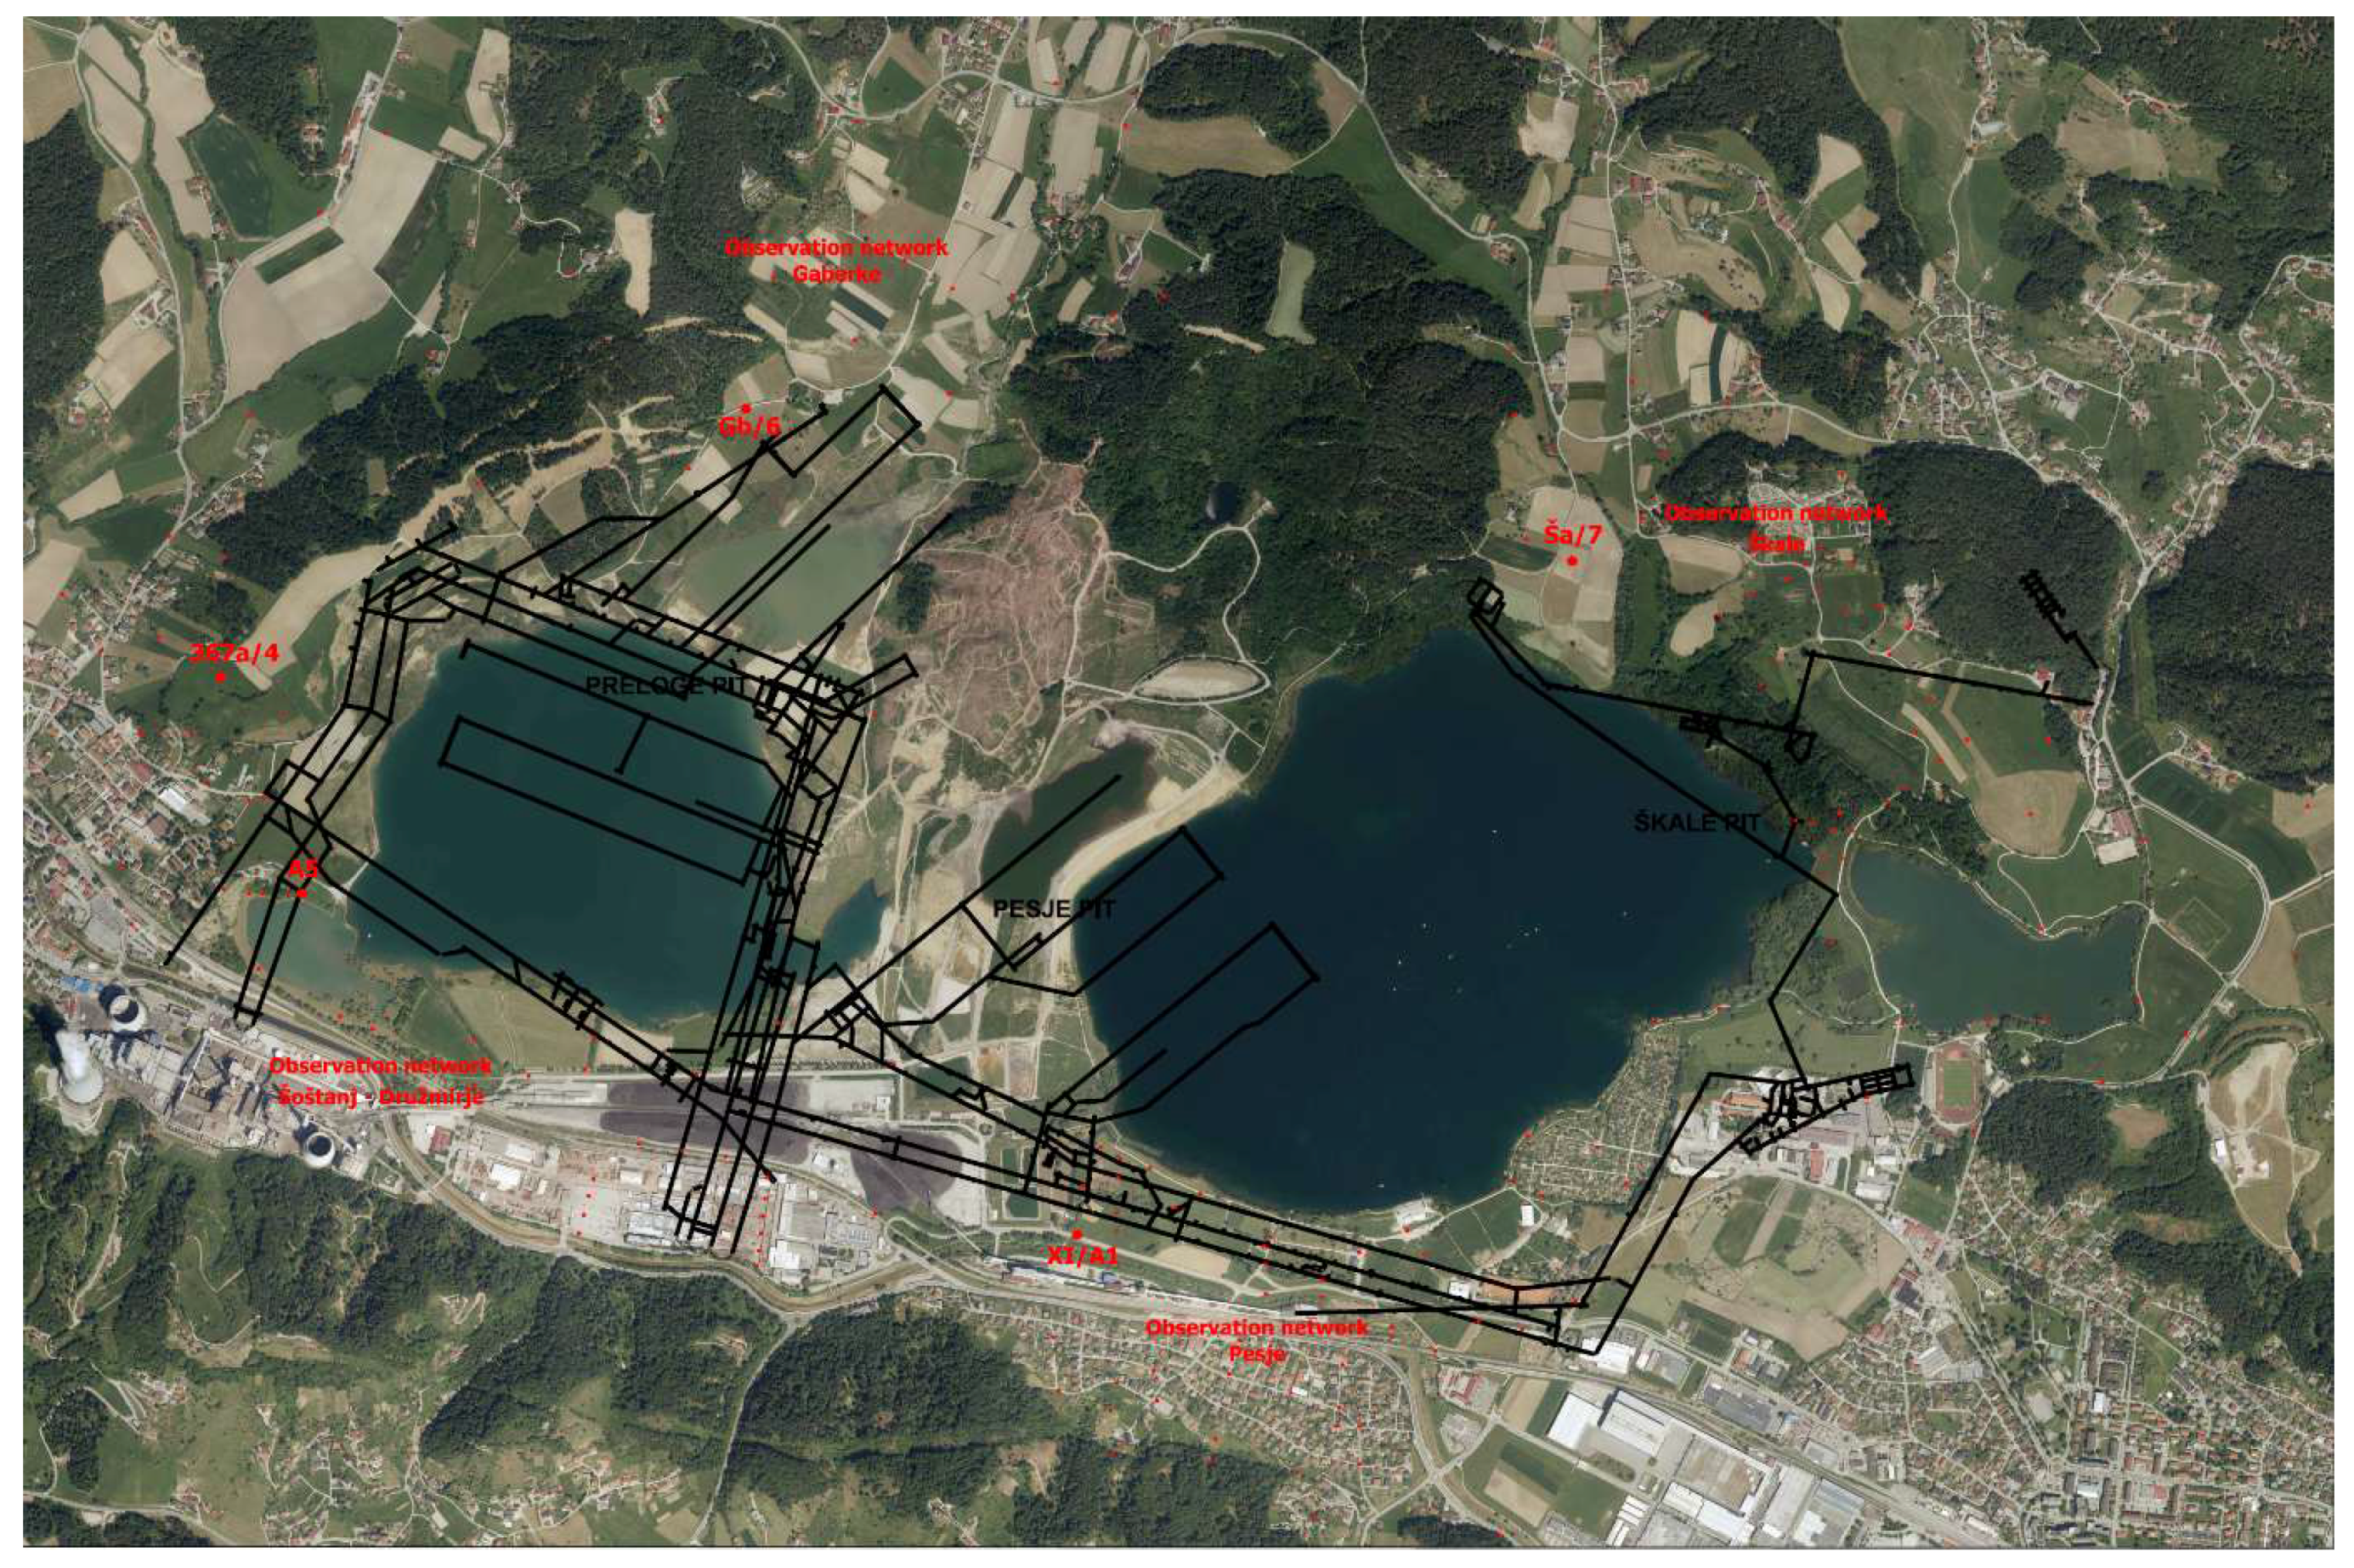
The observation point GB/6 is located in an area where intensive excavation started only after 2010. Due to the proximity of the excavation panels, over 3 m subsidence in only 8 years occurred, and the point was consequently destroyed in 2012. According to the results, subsidence in this area will be active until 2038. However, this is only valid on the assumption that underground mining activities do not take place at this location in the future.
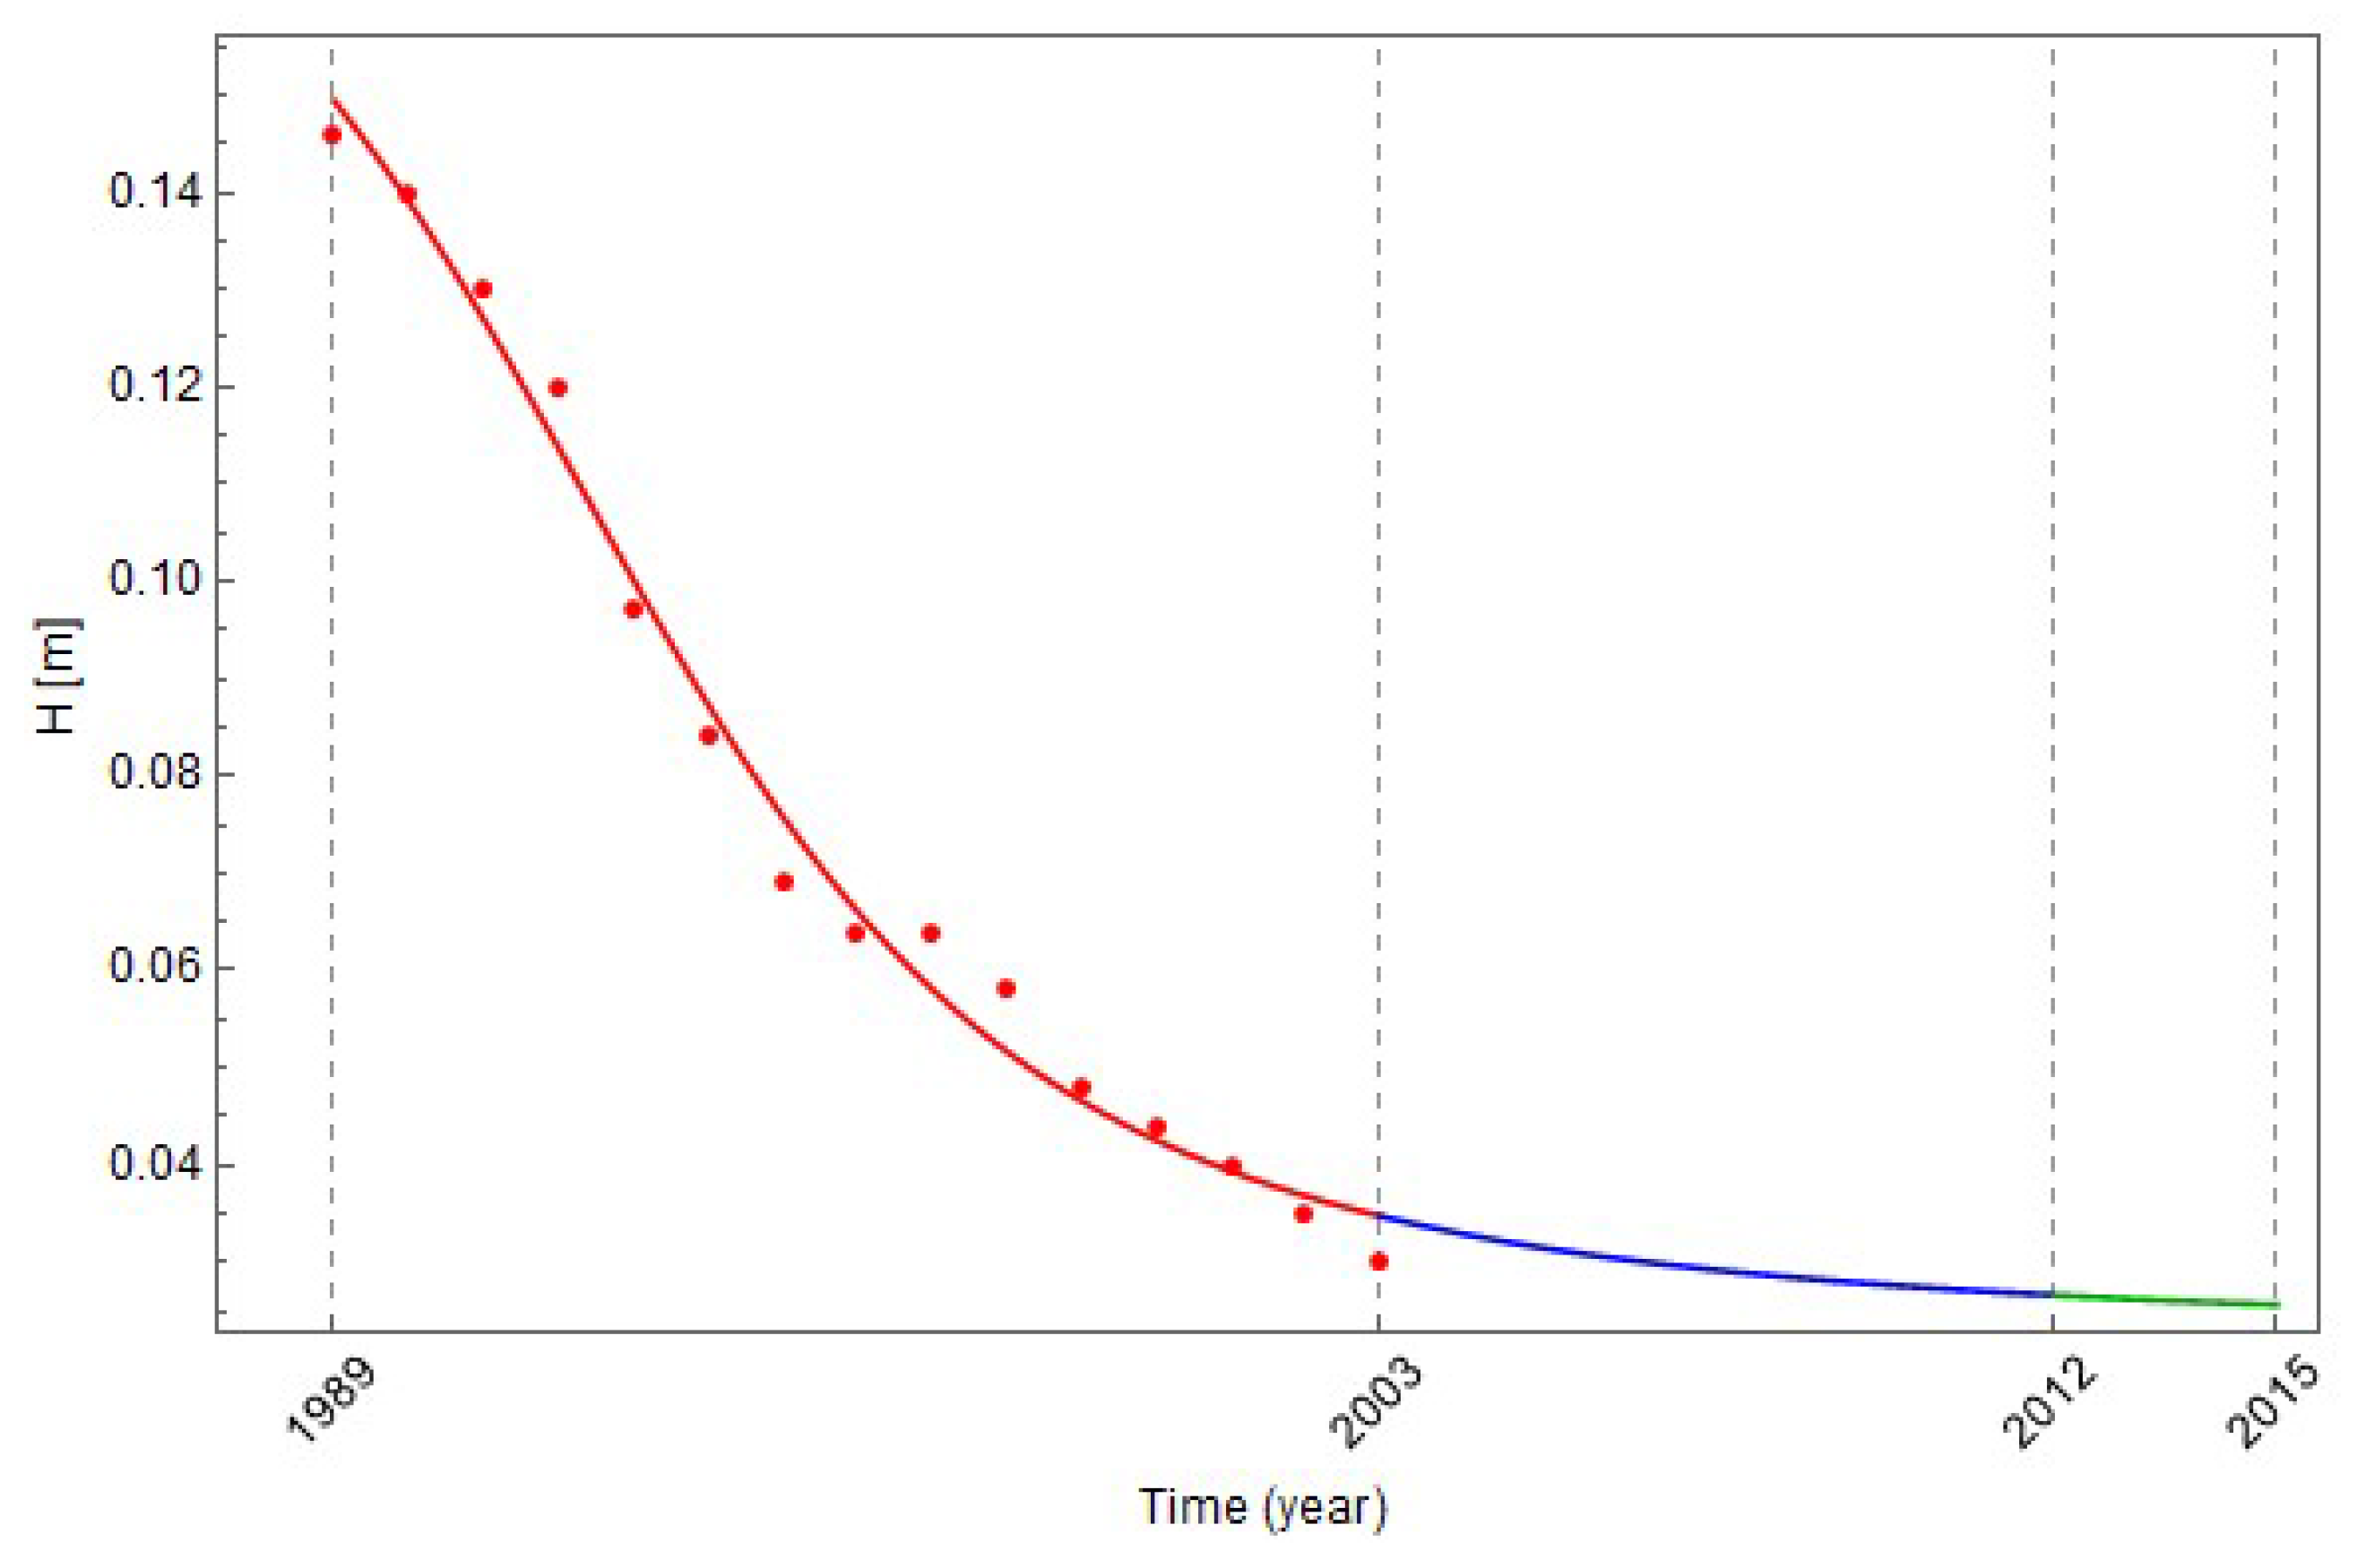
Table 3 shows the results of the analysis of the vertical displacement fitted by a modified sigmoid function for observation point A5. In
Figure 10, real data of the vertical displacement of point A5 for period from 1989 to 2003 (red circles) and the best fit theoretical modified sigmoid function (red curve) are shown. The next observation measurement is needed in year 2004. This applies to the active state of subsidence of the observed area, so further monitoring is required until 2012, when consolidation begins (
Figure 10—blue curve). Total subsidence in time period 2003–2012 is 0.0081 m. Depending on the conditions selected, the final observation measurement will be required in the year 2015.
Point A5 was located on the shore of the lake and was destroyed in 2003 during the remediation work of the shoreline. In the point’s vicinity, the largest excavation activities were in the 80 s, and then the excavations moved towards north. The time prediction of the final measurement according to the conditions from Equation (3) is in the year 2015.
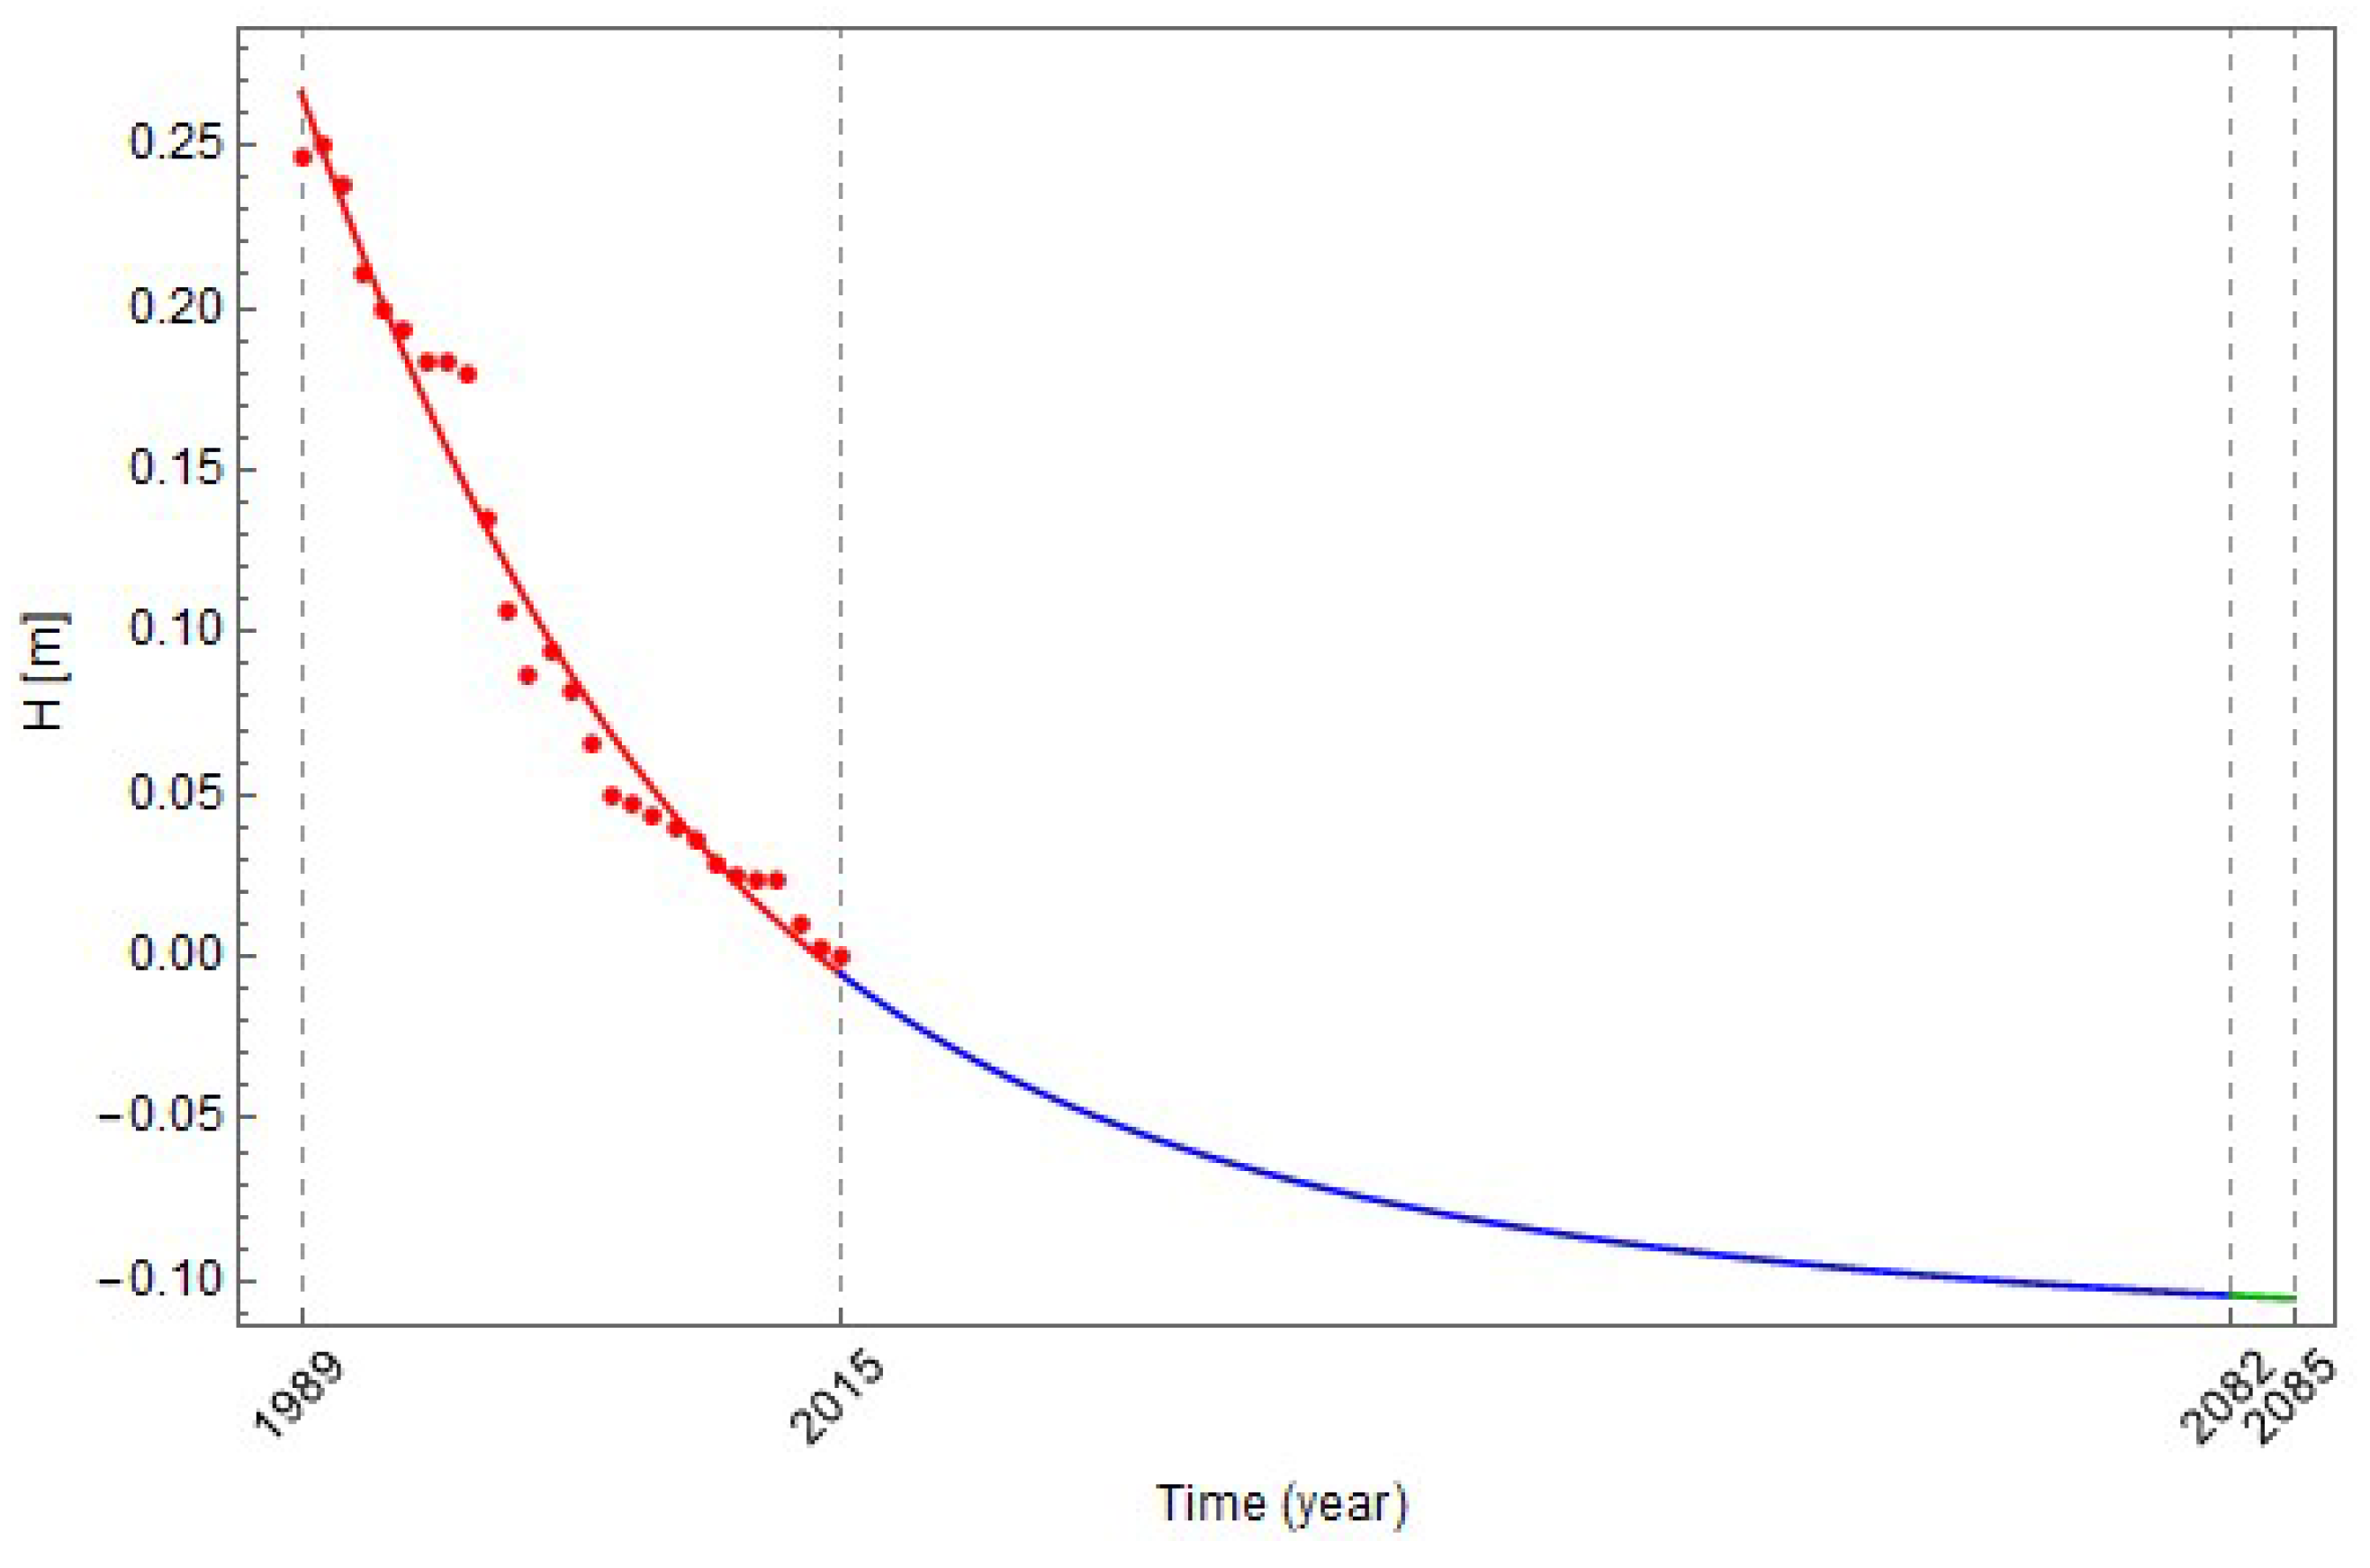
In
Table 4, the results of the analysis of the vertical displacement fitted by a modified sigmoid function for observation point 367a/4 are shown. In
Figure 11, real data of the vertical displacement of point 367a/4 for the period from 1989 till 2015 (red circles) and the best fit theoretical modified sigmoid function (red curve) are shown. The next observation measurement is needed in 2016; the vertical displacement change between that from 2015 and that predicted in 2082 is 0.0991 m. This applies to the active state of subsidence of the observed area, so further monitoring is required (
Figure 11—blue curve). Depending on the conditions selected, the final observation measurement will be required in the year 2085.
Point 367/a4 is located on a slope northwest of point A5 and is affected by the same excavation panels as point A5. Until 2003, both points A5 and 367/a4 subsided for 12 and 18 cm, respectively. On both graphs in
Figure 10 and
Figure 11, a step-like curve due to the excavation of several adjacent panels in certain periods of a few years is noticeable.
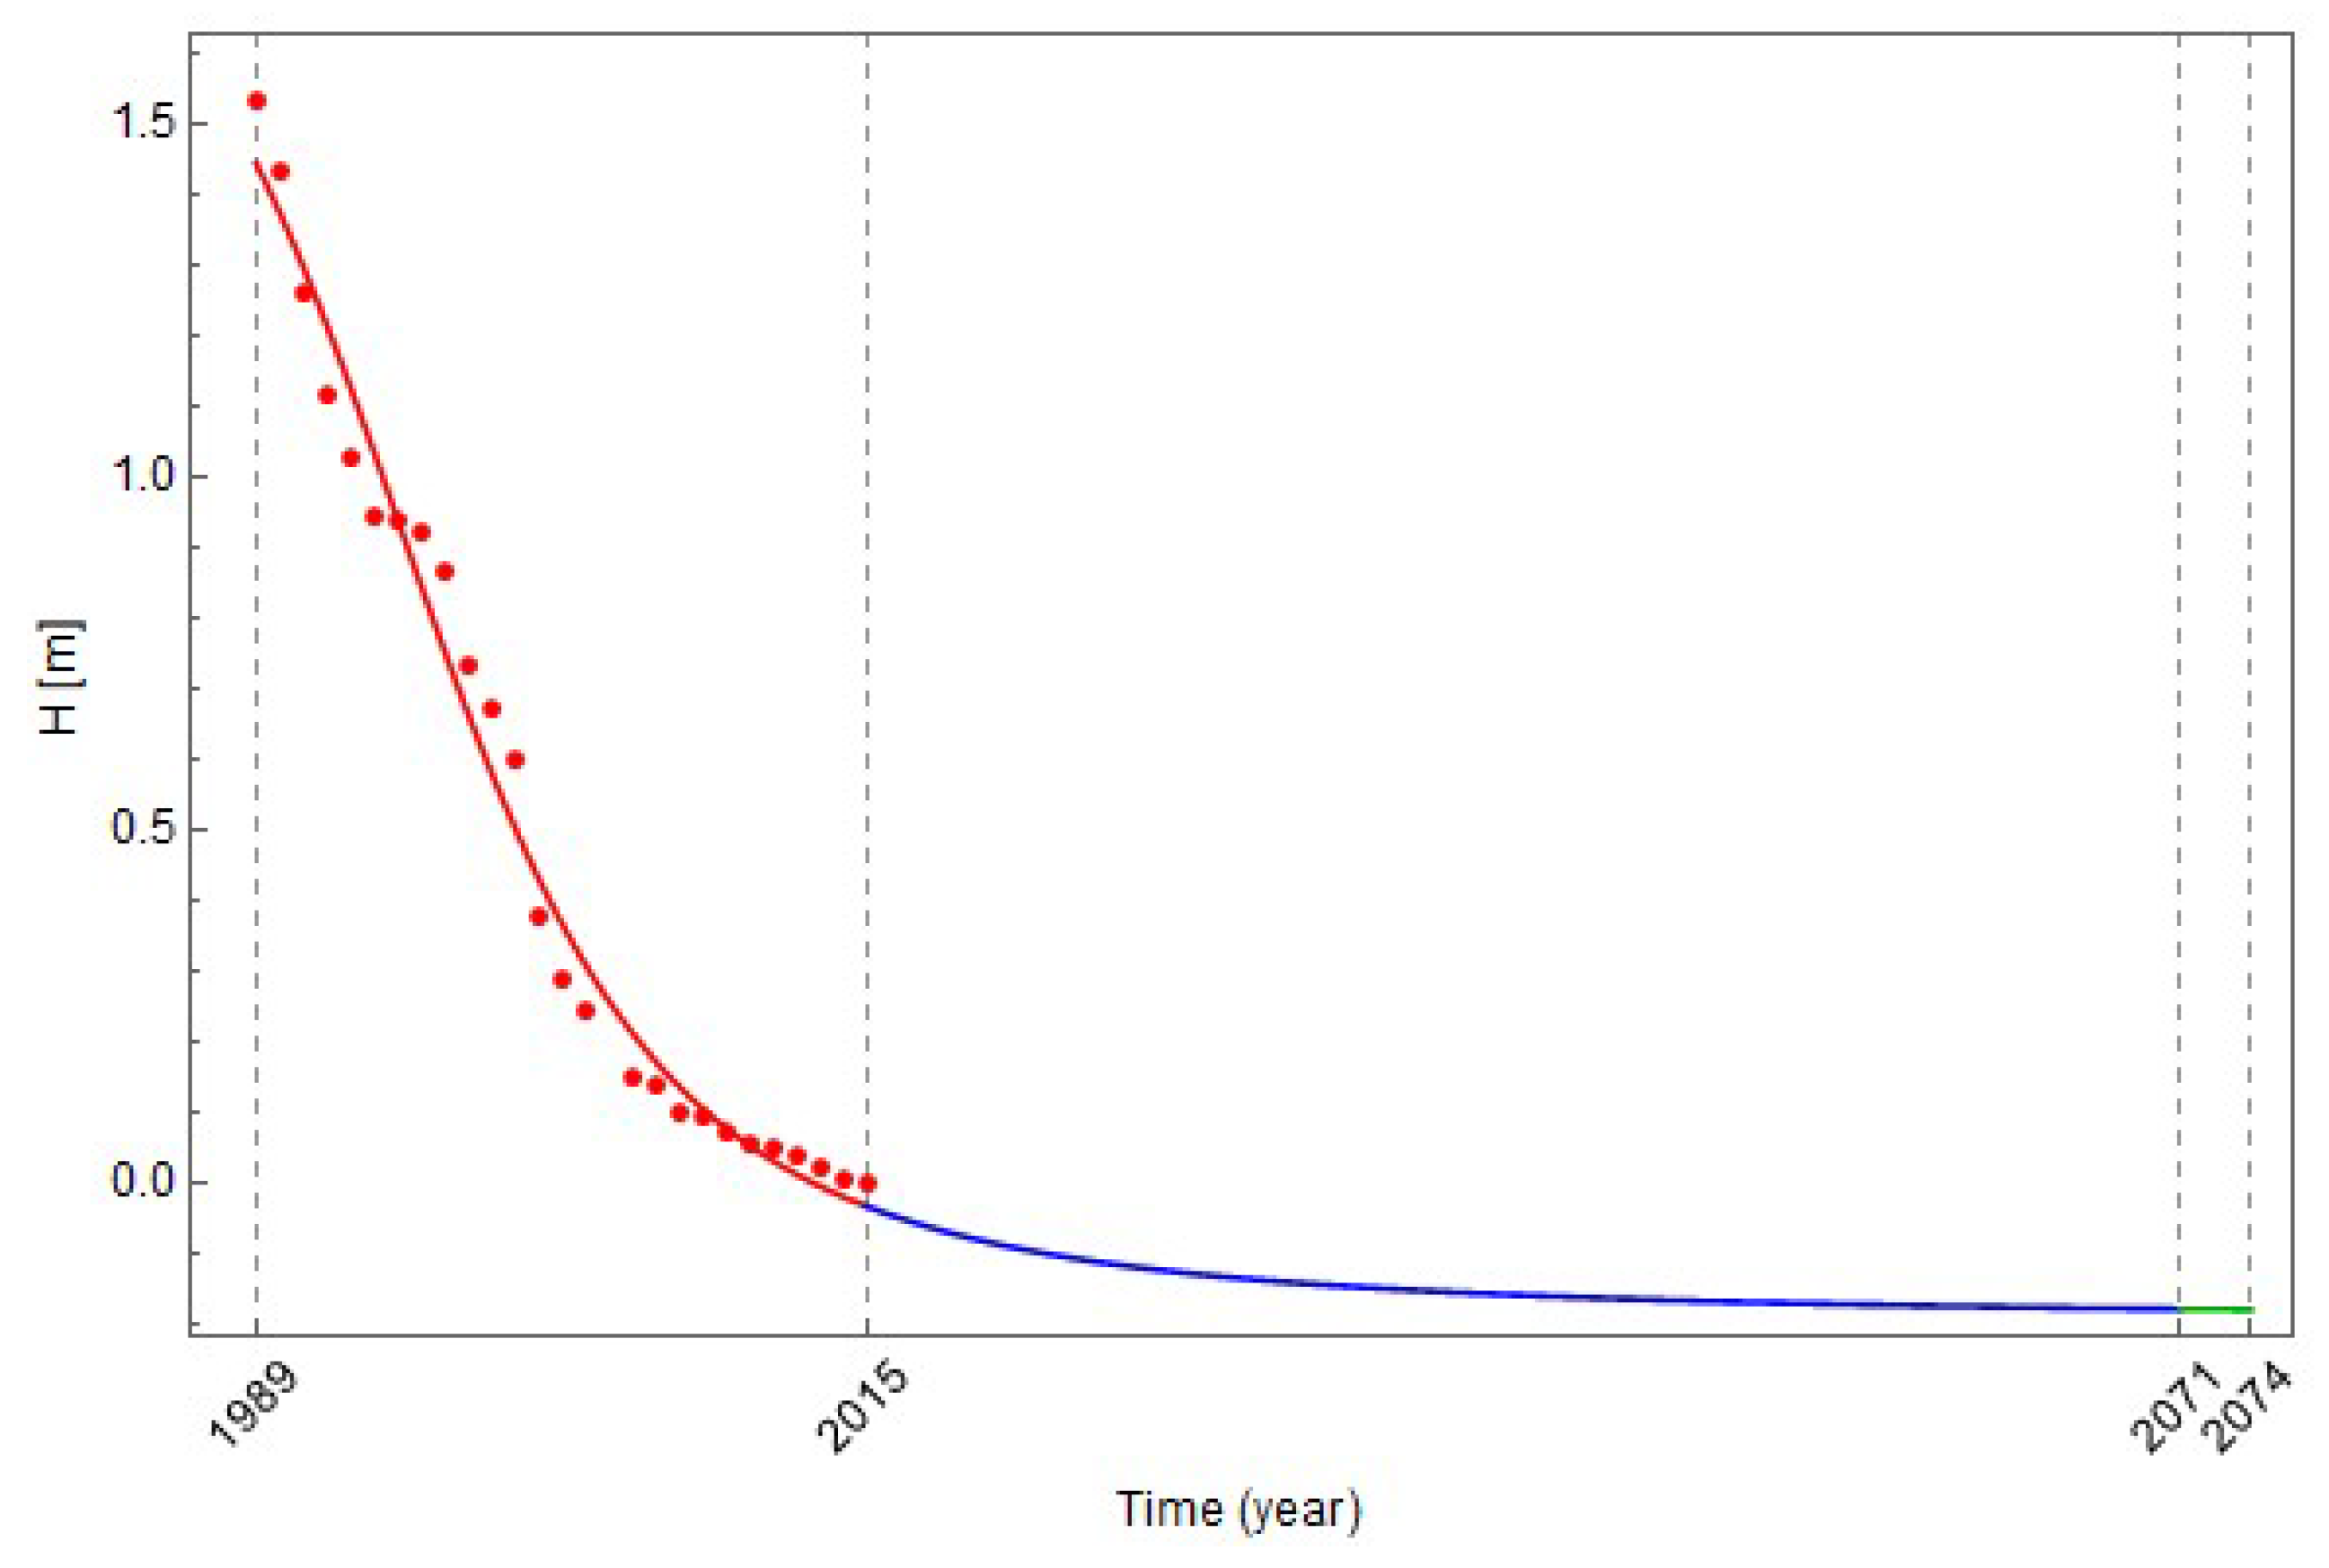
Table 5 shows the results of the analysis of the vertical displacement fitted by a modified sigmoid function for observation point Ša7. In
Figure 12 real data of the vertical displacement of point Ša7 for the period from 1989 to 2015 (red circles) and the best fit theoretical modified sigmoid function (red curve) are shown. The next observation measurement is needed in year 2016. This applies to the active state of subsidence of the observed area, so further monitoring is required until 2071, when consolidation begins (
Figure 12—blue curve). In this phase, total subsidence from 2015 till 2071 is 0.0991 m. From 2071 on, subsidence of less than 0.001 m per year will be developed. The final observation measurement will be required in the year 2074. Predicted total subsidence from 2071 till 2074 is 0.0010 m.
Point Ša7 is located north of the Škale pit, in an area that today is not subject to direct influence of mining activities. From 1989 to 2015, the point Ša7 subsided for 1.5 m. The largest excavation activities date back to the 1980s. In addition, three excavation panels were active in the area in the 1990s, and another one after year 2000. Additionally, a step-like curve due to the excavation of several adjacent panels is noticeable. At this location, no excavation is predicted in the future; therefore, it is a welcome assessment of when the consolidation, according to modelling function, will take place.
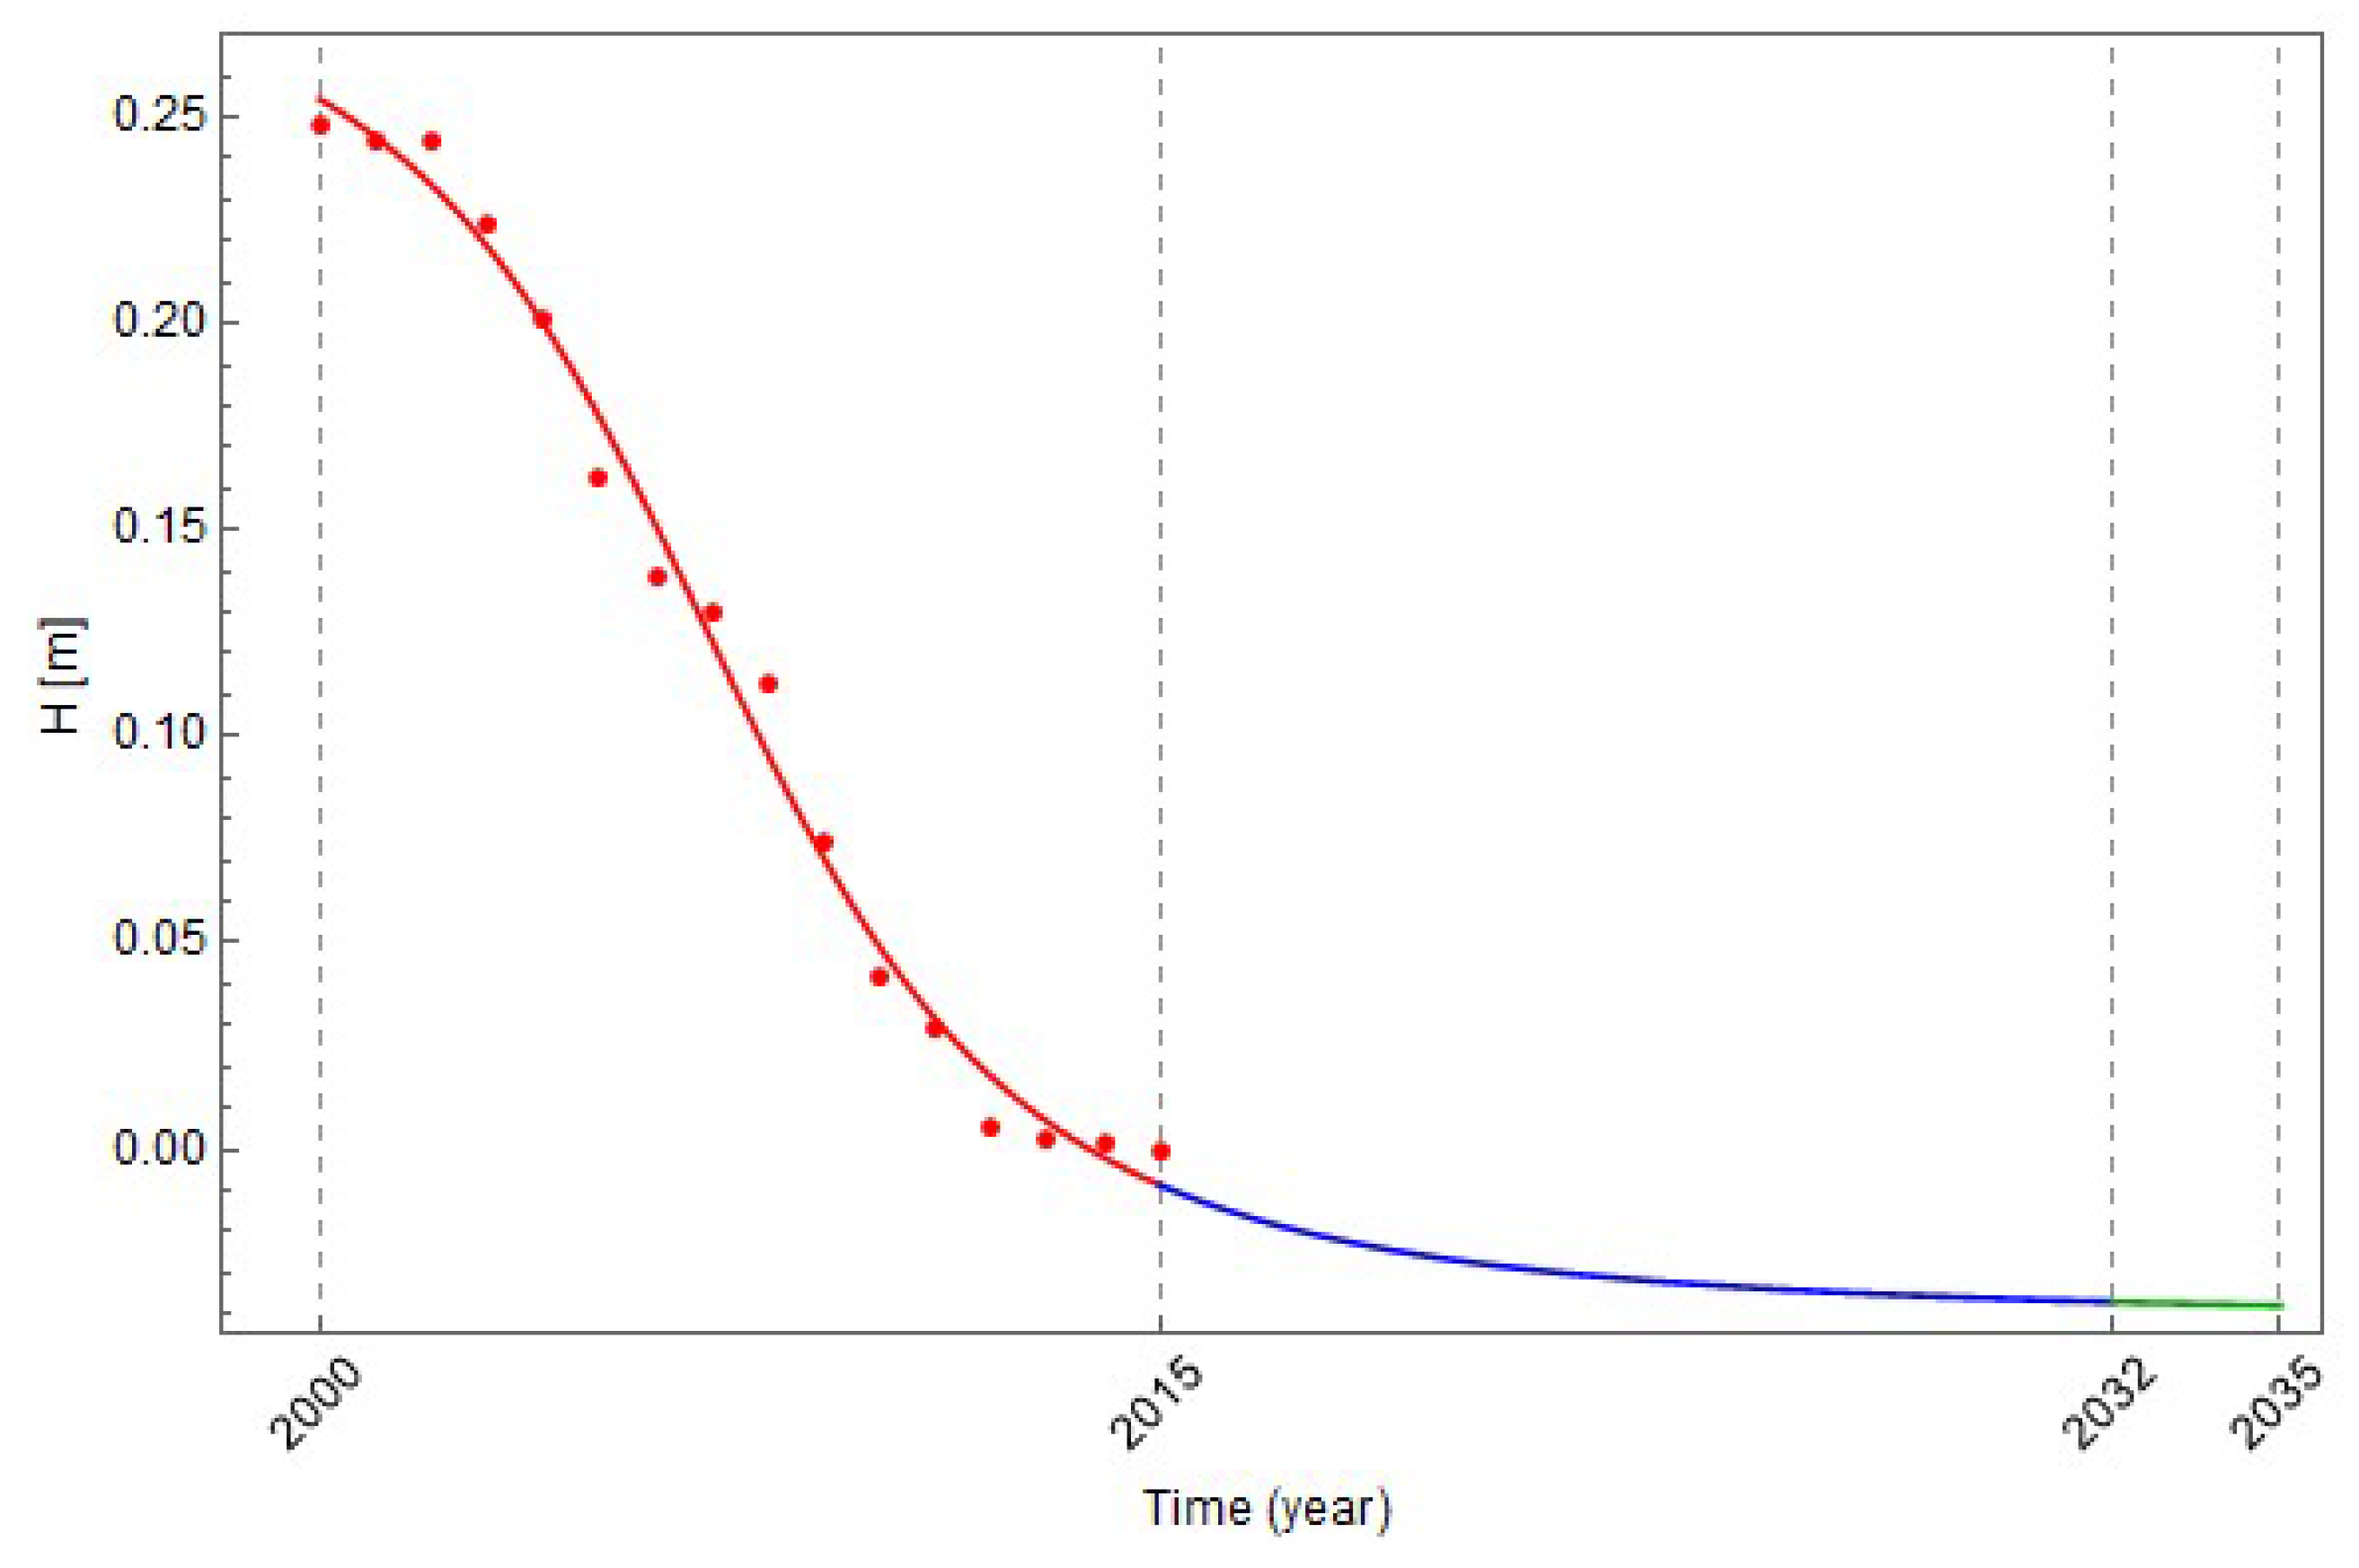
Table 6 shows the results of the analysis of the vertical displacement fitted by a modified sigmoid function for observation point X1-A1. In
Figure 13, real data of the vertical displacement of point X1-A1 for period from 2000 to 2015 (red circles) and the best fit theoretical modified sigmoid function (red curve) are shown. The next observation measurement is needed in year 2016. This applies to the active state of subsidence of the observed area, so further monitoring is required until 2032, when consolidation begins (
Figure 13—blue curve). In this period, total subsidence of 0.0284 m will occur. The final observation measurement will be required in the year 2035. In this final period from 2032 till 2035, i.e., the function’s consolidation state, total subsidence of 0.0009 m is predicted (
Figure 13—green curve).
Observation point X1-A1 was stabilized in 2000 in the area south of the excavation activities. Excavation is not planned in this area. The results show that, depending on the criteria set, the function will be consolidated around 2030.
The presented surface subsidence model contributes to more efficient surface monitoring in the VCM area, enabling the assessment of the surface subsidence development in the future and forecasting the next needed and final observation measurements. An insight into the dynamics of surface subsidence opens a new opportunity for further exploration. While the subsidence at the surface does not occur suddenly, but develops progressively as the coal is extracted within the area of influence of the extracted coal panel, a point on the surface is affected by the extraction of several adjacent panels [
11]. Further development of the model would encompass development of selective splitting of data to illustrate the step-like process of surface subsidence as a result of the VMM through developing a modified higher degree polynomial function.
4. Conclusions
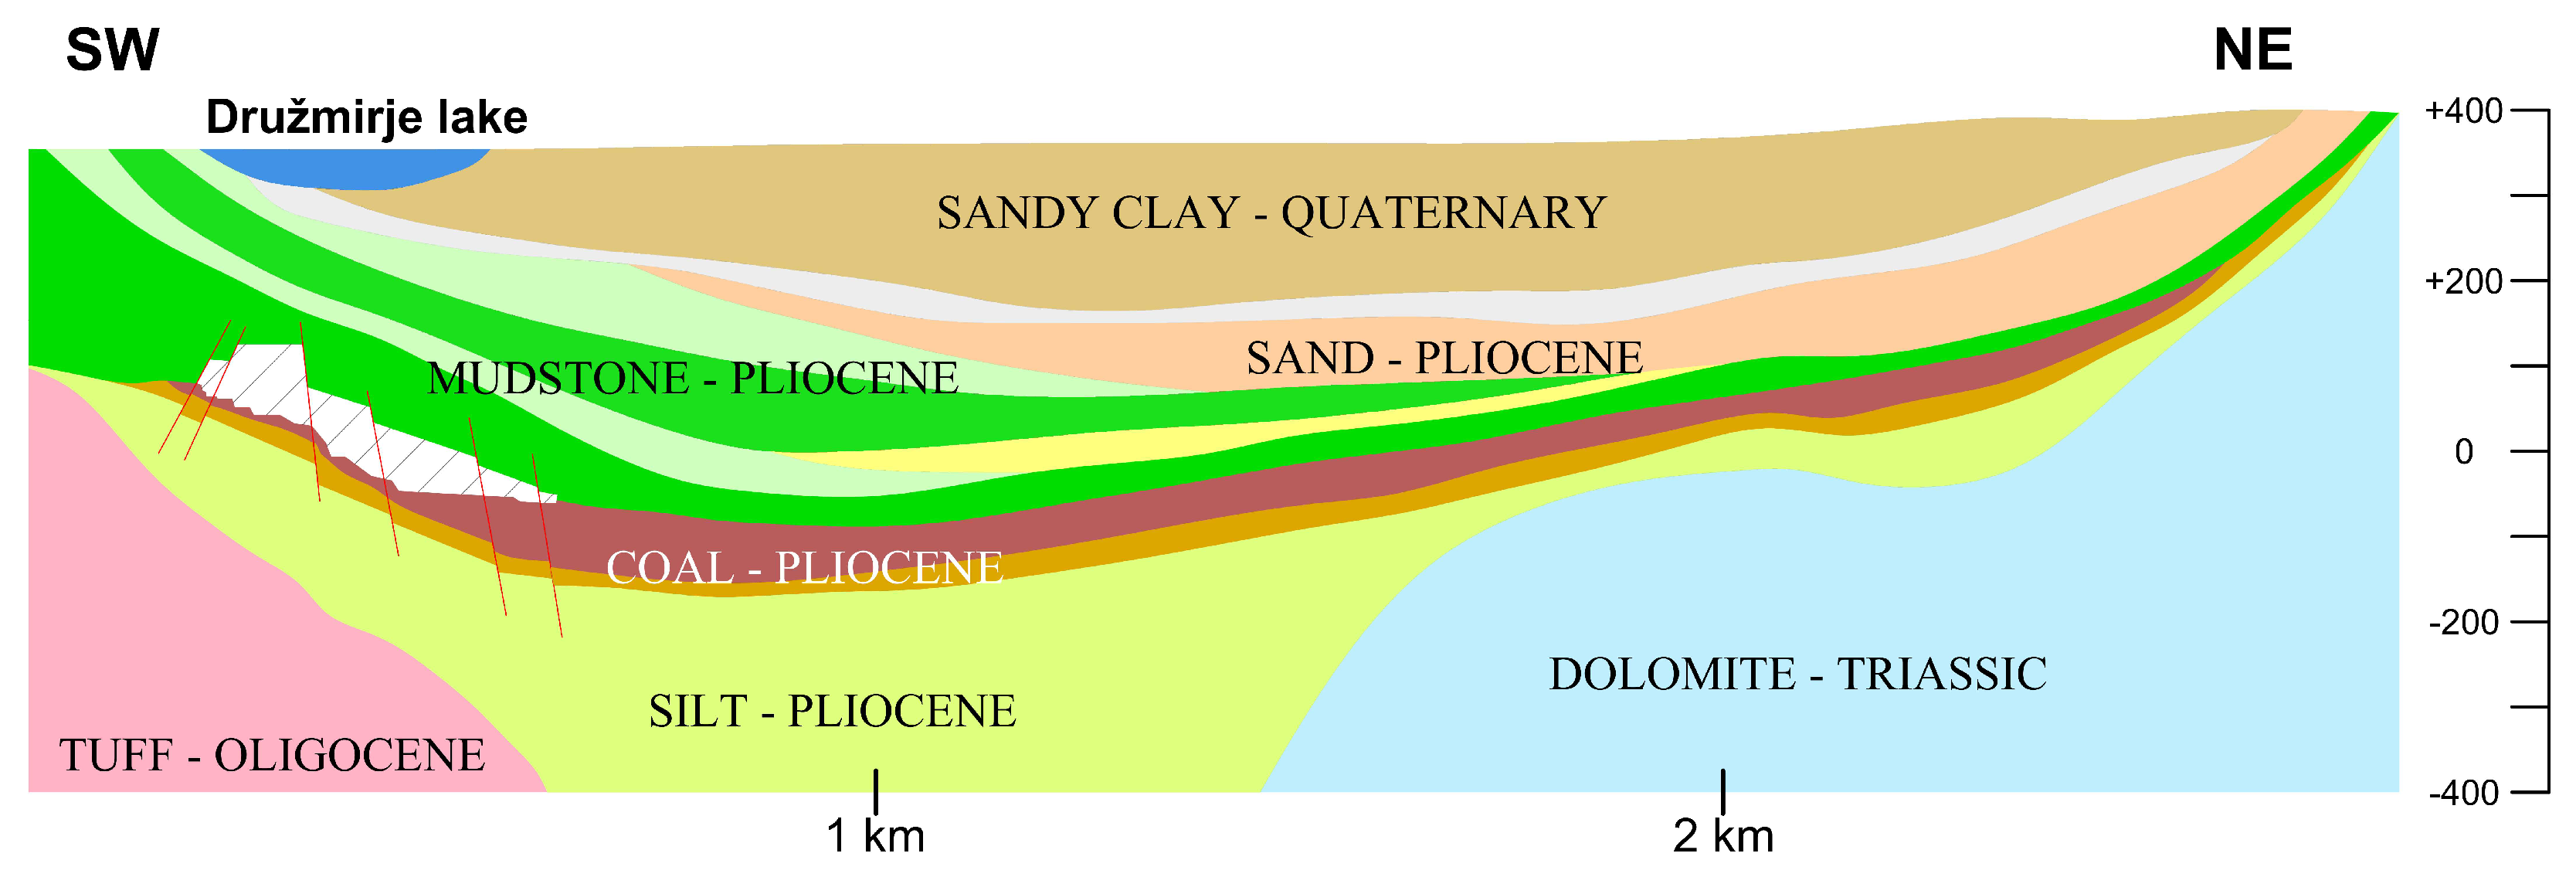
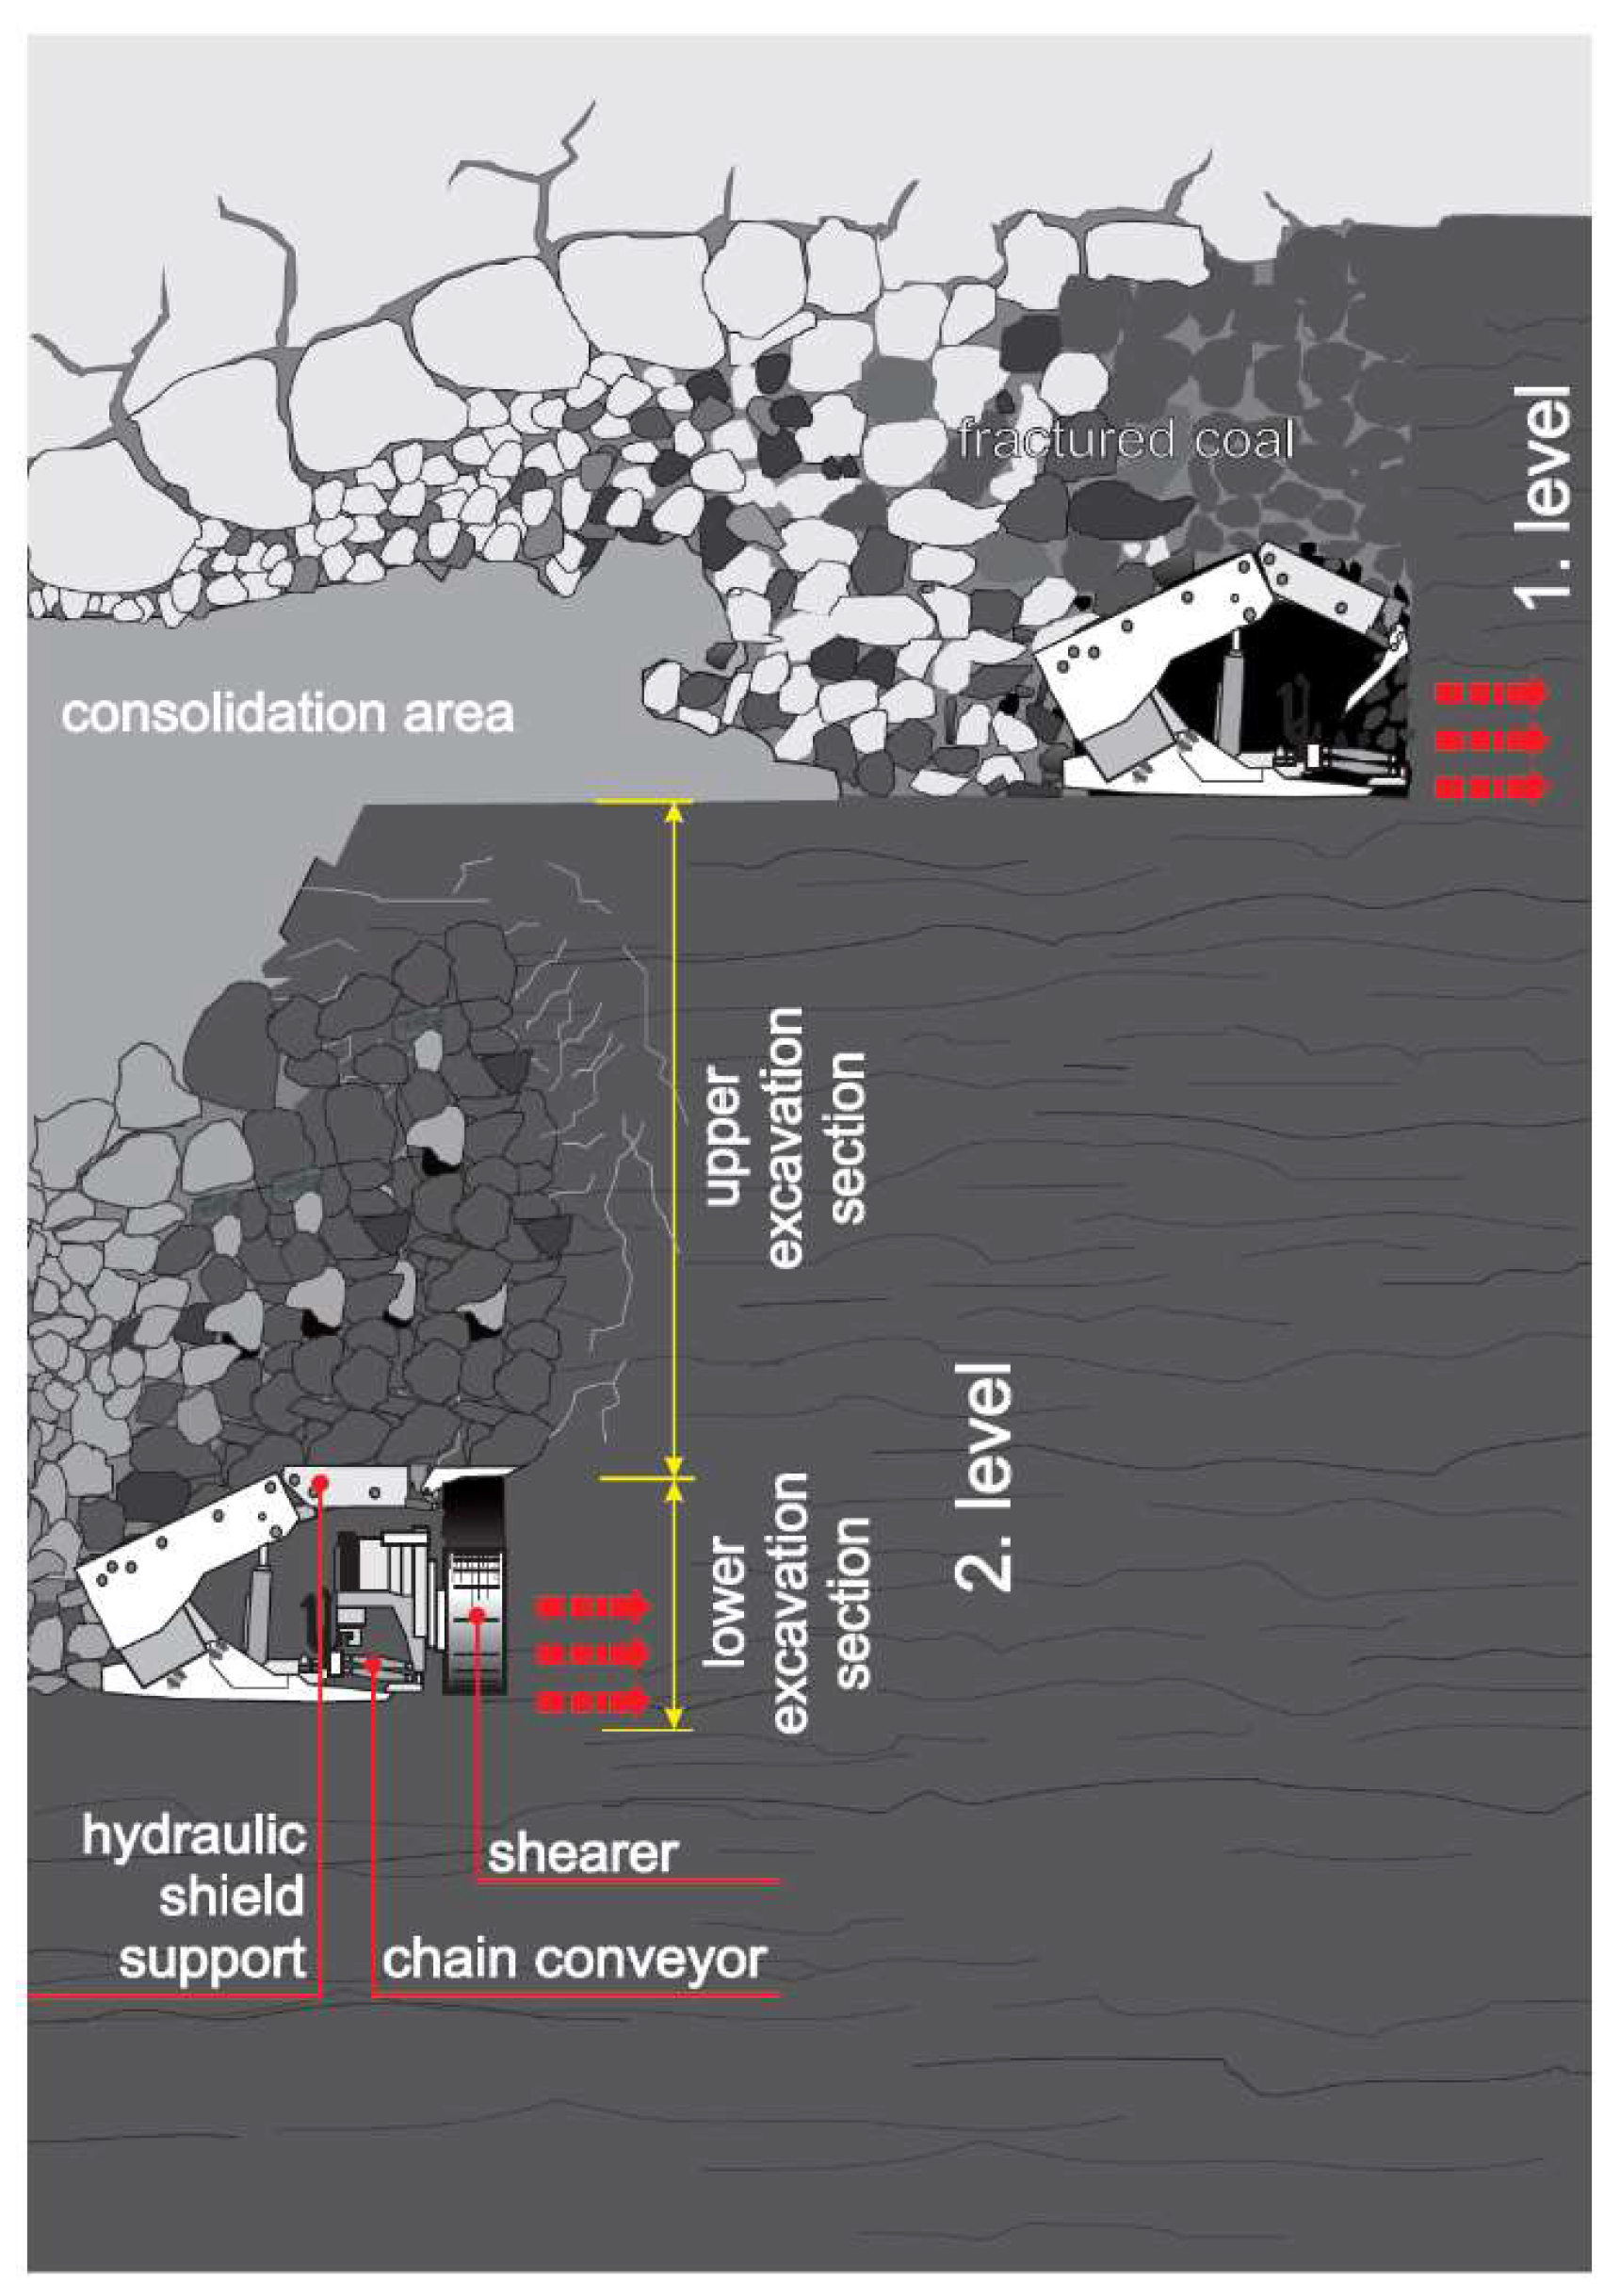
One of the VMM’s characteristics is the excavation of the thick coal seam in several levels, starting from the highest and continuing down to the lowest level. The maximum subsidence occurs over the center of the excavation panel. In the case of longwall mining, the excavated area is quite large, and the area over which subsidence occurs becomes greater. Furthermore, in the VCM, several excavation panels are active in different levels at the same time. This results in a series of overlapping subsidence curves, which correspond to the complex process of surface subsidence. The described method is developed for the Velenje coal seam, which is very thick and spacious. Excavation of coal is carried out without permanent safety pillars and without backfilling in excavated space. Consequently, large subsidence of the overlaying strata and the formation of surface depressions occur. While the geometry, sizes and excavation heights are quite similar between panels, the major influences on surface subsidence are panel location, excavation depth and excavation time sequence. The subsidence process takes a long time, so regular mine surveying measurements are required throughout the period of active subsidence as well as later. Interpretation of the dynamics of surface subsidence can be demonstrated by a simple mathematical model, such as a modified sigmoidal function. Data from the five surface observation points were used. With the described model, it is possible to follow the process of subsidence, to plan and perform measurements of individual observation networks more rationally, which is reflected in more efficient monitoring and control of surface subsidence in the coal mine area and positively affecting cost efficiency.
The following main conclusions can be made based on this study: the presented modified sigmoidal function is suitable for surface subsidence data from the Velenje Coal Mine area due to good analysis results, less sensitive parameters and reduced model complexity. Moreover, the time estimation of the next and final observation measurement, when monitoring is no longer necessary, can be determined. However, all additional measurements are welcome, and will improve understanding of processes related to underground coal excavation, consolidation and their impact on surface subsidence.


