Article

Role of Volcano-Sedimentary Basins in the Formation of Greenstone-Granitoid Belts in the West African Craton: A Numerical Model

1
School of Safety Engineering, China University of Mining and Technology, Xuzhou 221116, China
2
Geosciences Environnement Toulouse, Observatoire Midi Pyrénées, 31400 Toulouse, France
3
Department of Earth Science, University of Ghana, P.O. Box LG 25, Legon, Accra, Ghana
*
Author to whom correspondence should be addressed.
Minerals 2018, 8(2), 73; https://doi.org/10.3390/min8020073
Submission received: 20 December 2017 / Revised: 11 February 2018 / Accepted: 12 February 2018 / Published: 17 February 2018
(This article belongs to the Special Issue Geological Modelling)

Abstract

:
Greenstone belts in the West African Craton (WAC) are separated by several generations of granitoids intruded at ca. 2.18–1.98 Ga. Simultaneous folding and exhumation play an important role in the formation of greenstone-granitoid belts. However, the overall tectonic regime and origin of granitoids remain controversial. In this study, we present the estimates of the mantle potential temperature (Tp) for the WAC, which yields values of about 1500–1600 °C, pressure estimates of initial and final melting yield values of about 3.7–5.2 GPa and 1–1.3 GPa, respectively. Subsequently, 2D thermo-mechanical models have been constructed to explore the width of volcano-sedimentary basin on spatial-temporal evolution of diapirs that emplaced in the lower-middle crust during compression. The models show that the width of the volcano-sediment layer plays an important role in the formation mechanisms of greenstone-granitoid belts. The lower crust beneath sedimentary sequences is deformed into a buckle fold during the first compressional stage, through which relief uplifts slowly. Subsequently, the buckle fold is further deformed into several individual folds. Diapirs made of lower crust rocks ascend and emplace in the middle-upper crust resulting from instability. Benefitting from the mantle temperature, the pressure estimates and the numerical modelling results, a new geodynamic model was constructed. This model indicates that a series of sheet-like granitoids possibly derived from either subducted mélanges, lower crust and/or mantle melting that are accumulated at depths of the subcontinental mantle would channel along diapirs before feeding the upper crust. When the granitoids arrive at the solidified lids of the diapirs, they would favour migrating horizontally and intrude into the upper crust through weakening zones between the diapirs. Our geodynamic model also suggests an asymmetry of structures between the upper and middle-lower crust, with the dome-like granitoids overlying high-grade sedimentary synforms and high-grade diapirs underlying low-grade greenstone belts.

1. Introduction

In the WAC, Precambrian terranes show widespread greenstone belts separated by several generations of granitoids intruded at around 2.18–1.98 Ga [1]. The maximum thickness of greenstone belts within the Paleoproterozoic domain of the WAC was reported by Condie et al. [2,3] and Baratoux et al. [1] to be between 10 and >20 km. However, no other studies have reported the geometrical constraint (width) of volcano-sedimentary basins. This is due to the ongoing debates and uncertainties surrounding the geodynamic evolution, tectonic regime and origin of granitoids during the Eburnean Orogeny [1,3,4]. Ganne et al. [4] explored the exhumation of lower crust under a convergent setting by employing a volcano-sedimentary basin of about 280–290 km in width (evidence from the Siguiri basin which straddles upper Guinea-Southwest Mali). Their model produced two synchronous diapirs made of partially molten lower crustal rocks, 70 km apart. They concluded that this distribution is compatible with the wavelength of the alternation between granitoids and greenstone belts across the Craton.
However, Glazner et al. [5] suggested that, plutons generally grow in small increments as highlighted in many geological terranes. Regarding a diapir derived from lower crustal sources, it would typically become solidified at a depth of 10–15 km due to its slow rise compared to the rate at which magma ascends along a dike [6,7]. Therefore, the upper part of a diapir would undergo solid-state deformational behavior at a depth of 5–10 km. The authors argued that the difference in the rate of rise indicates that a diapir can hardly ascend or exhume through the upper crust under convergent tectonic regimes [4,5,8].
In addition, the current geochronological data available for West Africa (i.e., the Boromo, Houndé belts and neighbouring magmatic terranes) suggests small continuous magmatic episodes in anyone region rather than a single large pulse [1,4]. The small pulses would have much smaller and more heterogeneous impact on the whole system than the single large pulse. This indicates that the emplacement of single large pulse presented by Ganne et al. [4] resulting from compression might not have direct implications for the formation and deformation of greenstone-granitoid belts. Based on these new investigations enumerated above, it is necessary to further explore the role of diapirs in plutonic exhumation and activity of the WAC.
Moreover, the only extensional event in the Craton during the Eburnean Orogeny was reported in NW Ghana by Block et al. [9]. This means that structures in the lower crust remain uncertain compared to the well addressed deformation of the upper crust [10]. In this study, we do not aim to exactly investigate the evolutionary history of deformation in the WAC (as it remains open to discussion), but we rather explore the role of volcano-sedimentary basins width in the geometric evolution of diapirs using 2D thermo-mechanical models. This paper can shed light on the Tp, geodynamic evolution and thickness of the lithosphere in the WAC during the Eburnean Orogeny (ca. 2.2–2.0 Ga). In addition, in terms of gravity instabilities that occurred in the middle crust, this work can also help reveal the structural evolution of greenstone-granitoid belts in the Leo-Man Shield.

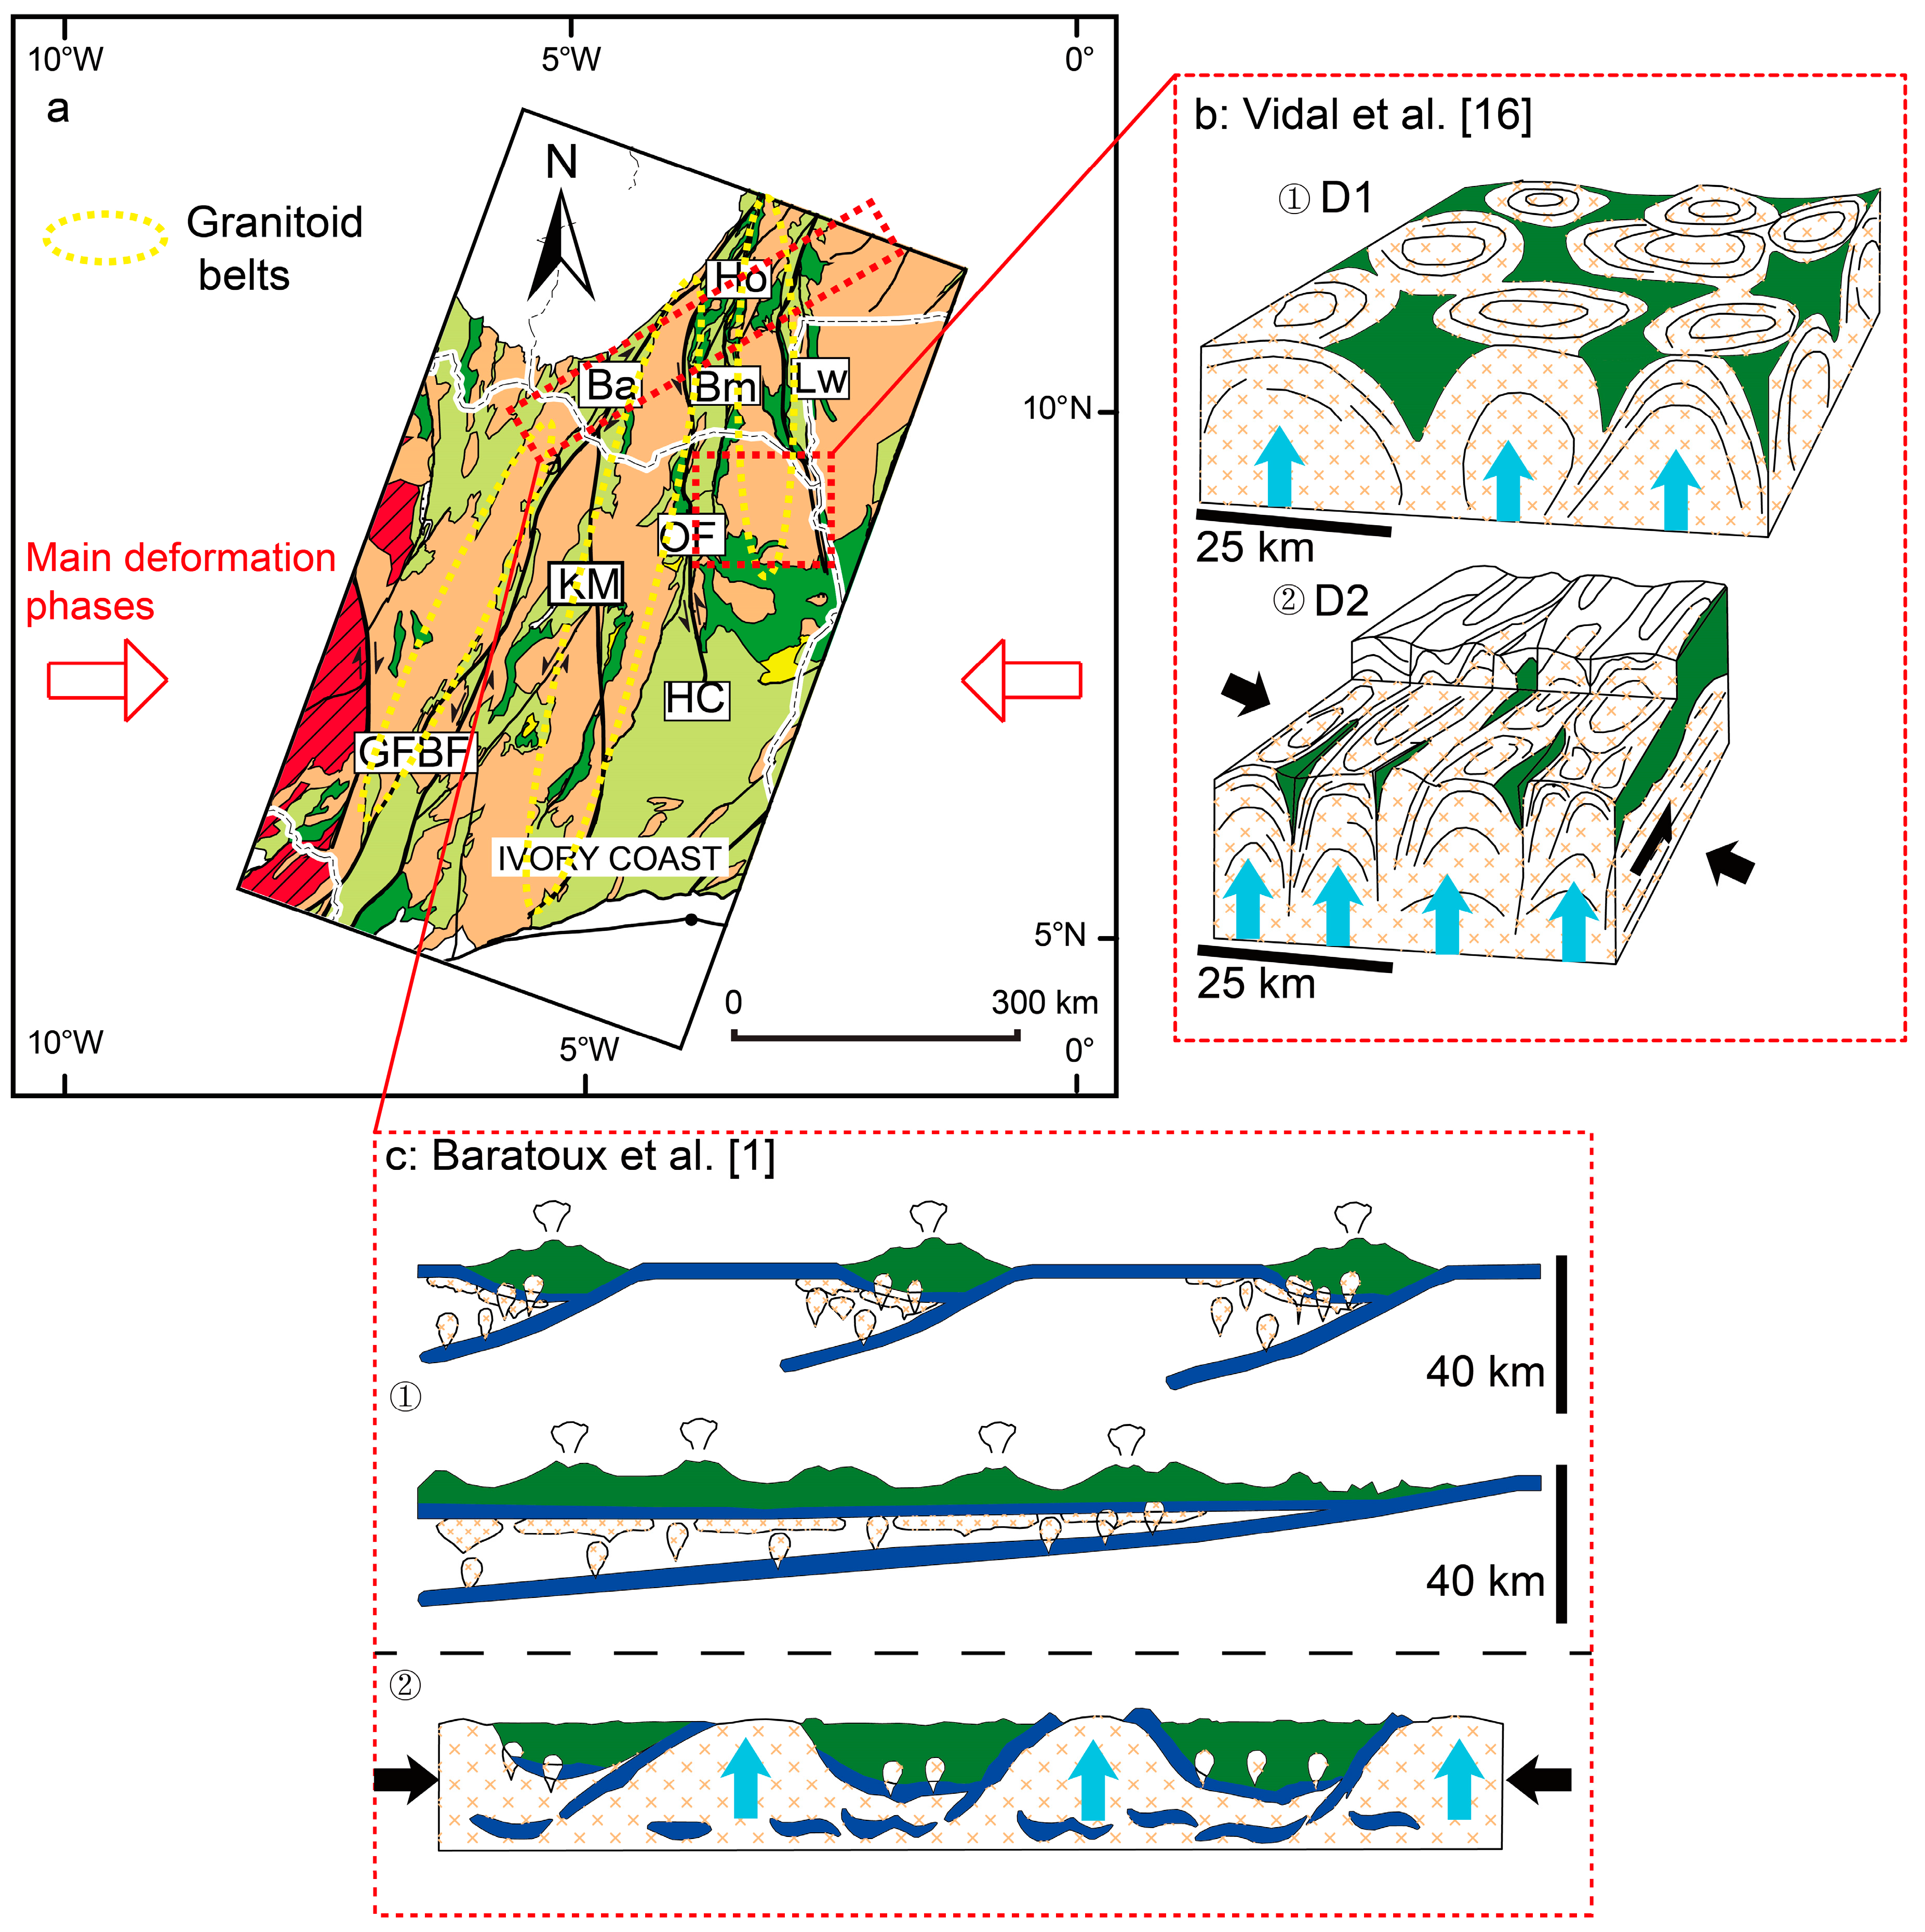
2. Geological Setting

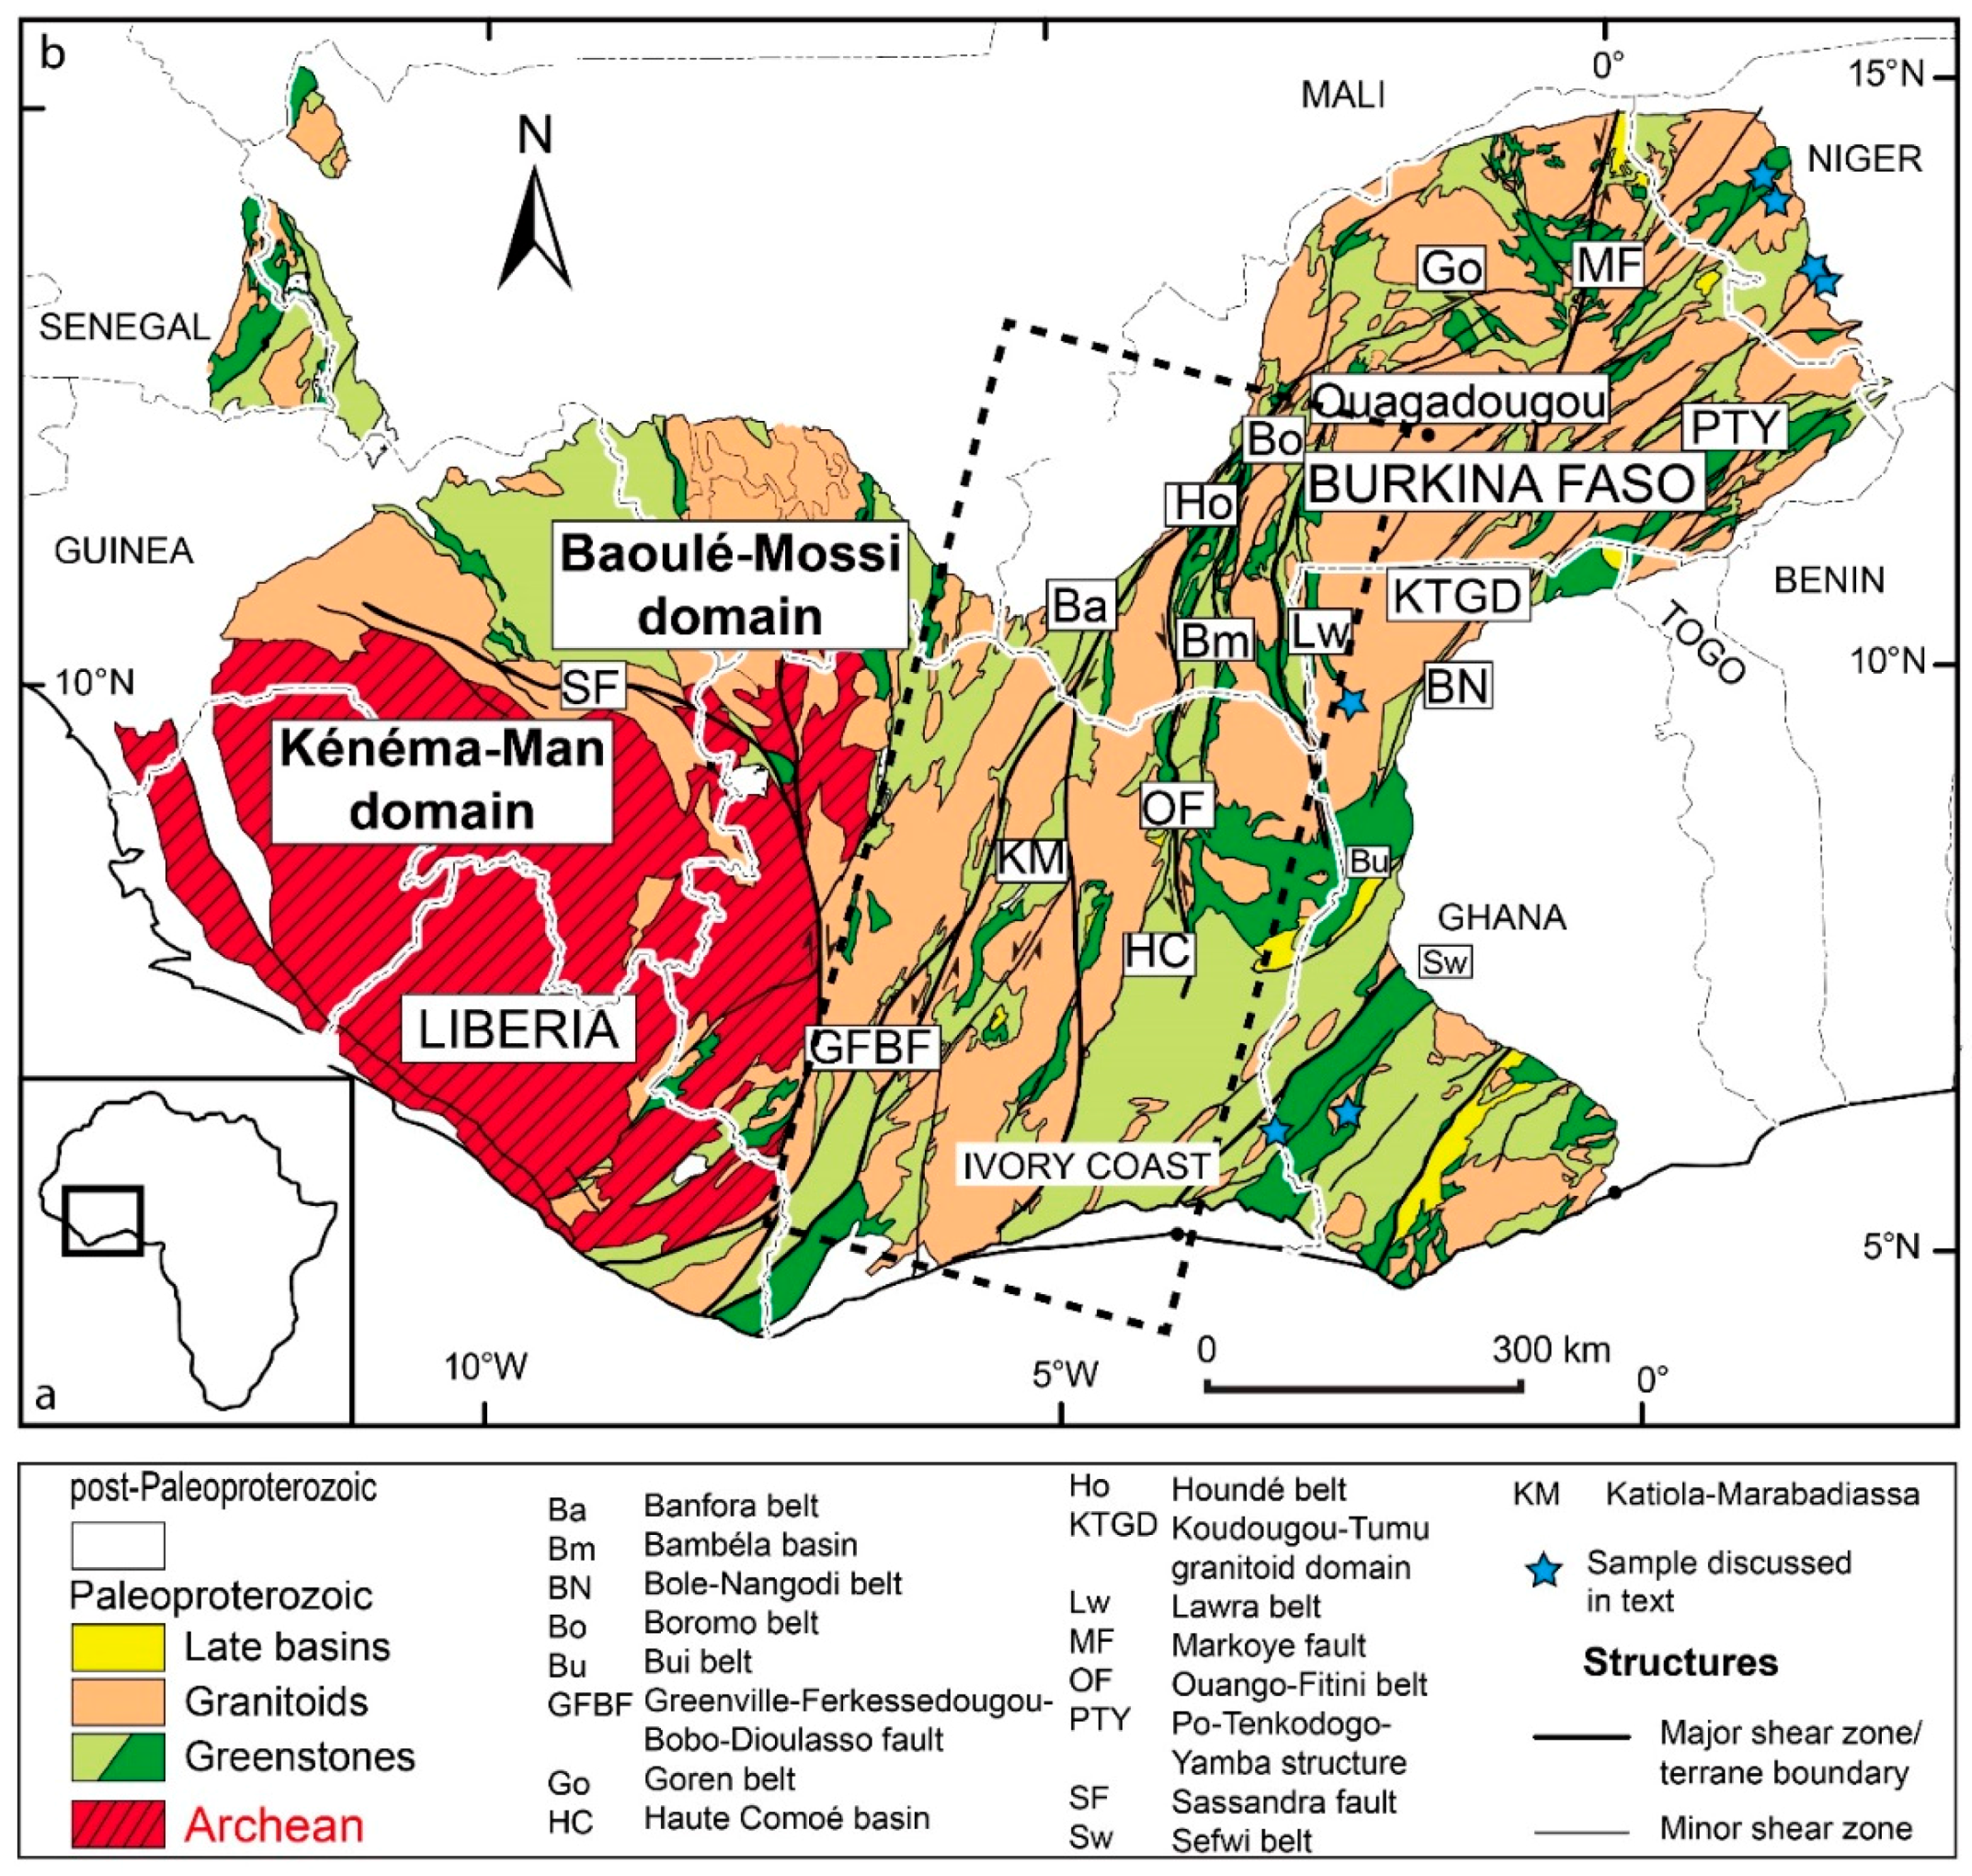
2.1. Geological Framework of the Leo-Man Shield

The Leo-Man Shield consists of the Paleoproterozoic Baoulé–Mossi domain to the east and the Archaean age Kénema–Man domain to the west (Figure 1). The Baoulé–Mossi domain consists of narrow and large volcano-sedimentary basins (greenstones sensu lato) and linear (or arcuate narrow) volcanic belts (greenstones sensu stricto) separated by extensive granitoid sequences. Radiometric dating shows that the early pulses of granitoid intrusions contemporaneous to the Birimian volcanisms were emplaced at around 2.20–2.17 Ga [11,12]. The main plutonic activity took place at around 2.15–1.98 Ga [13,14,15,16,17,18,19]. The number of deformation phases characterizing the Eburnean orogeny is still under debate [16]. The existence of a S1 fabric developed at the early stages (D1: the first deformation stage during the Eburnean Orogeny in the WAC, at around ~2160–2110 Ma [1]) of the Eburnean Orogeny in the volcano-sedimentary belts is supported by some authors [19] and contested by others [16]. Transition of D1 to the following D2 (D2: the second deformation stage during the Eburnean Orogeny in the WAC, at around ~2110–2090 Ma [1]) deformation phase is thought to have occurred at around 2.13 Ga in Ghana, following a major pulse in granitoid emplaced at around ~2.15 Ga [18]. The subsequent D2 deformation phase is responsible for most of the main structures observed in the Birimian Province, greenstone basins were deformed into linear to arcuate belts or transcurrent shear zones [10] mapable on magnetic images.

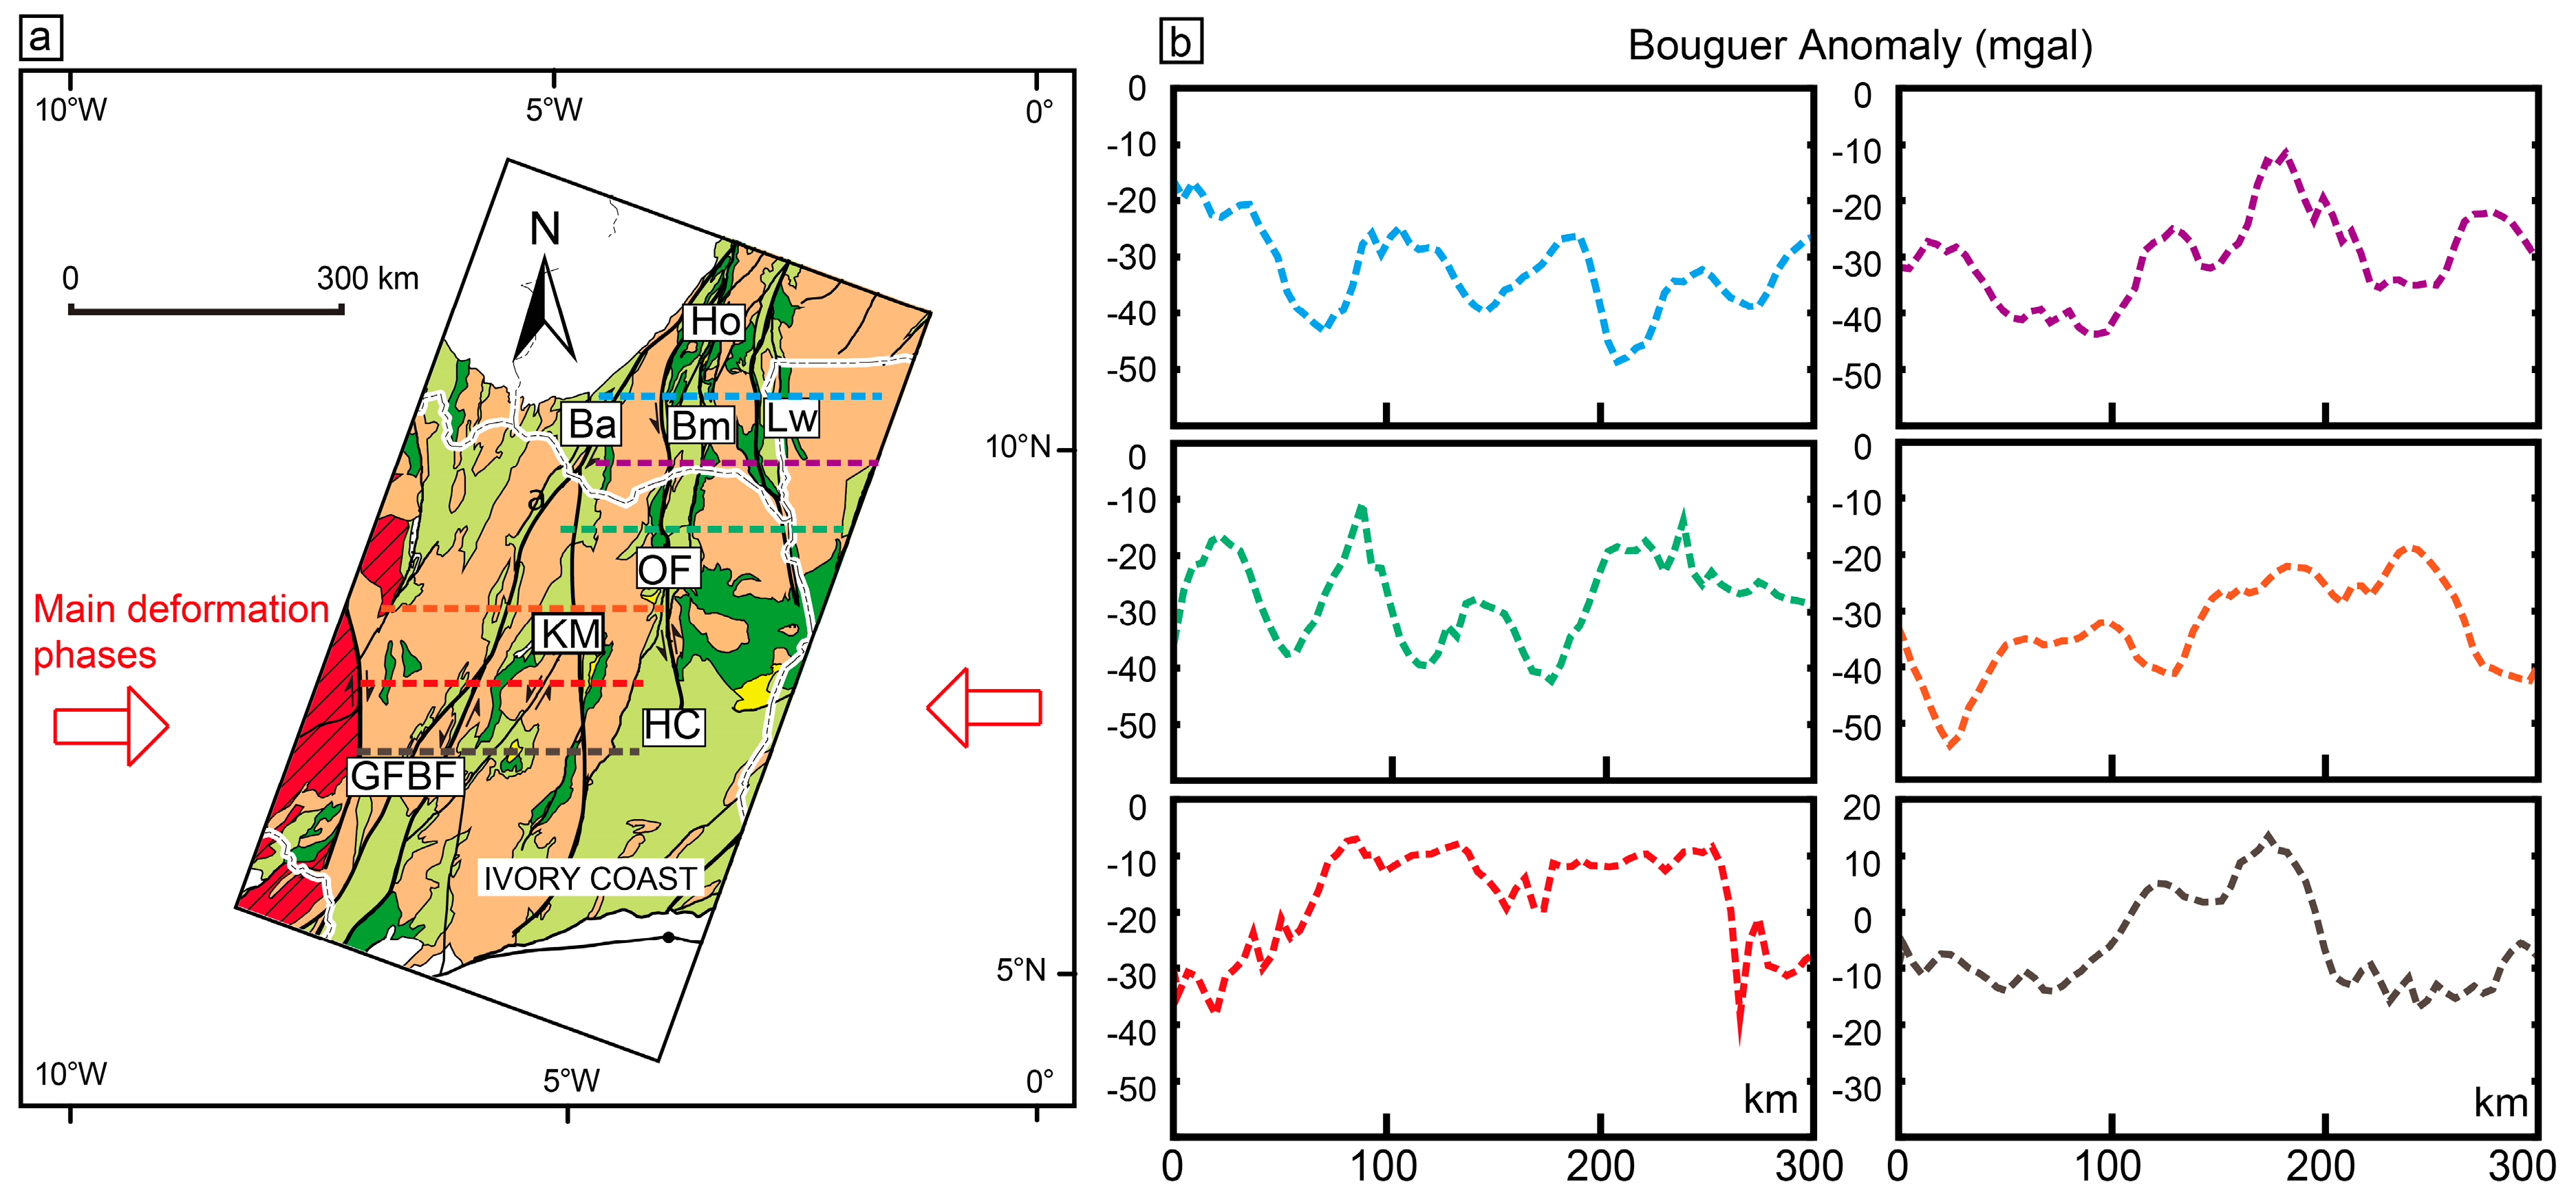
2.2. Geological Summary in South–Western Burkina Faso

The southwestern part of Burkina Faso consists of several sub-parallel north-south to north-northeast trending greenstone belts (Figure 1). From east to west is the Boromo–Lawra, Houndé–Ouango–Fitini and Banfora greenstone belts (Figure 1). The Boromo greenstone belt consists of flysch-like metasediments, tuffs and epiclastic volcano-sediments with occasional intercalations of andesites and rhyolites [1]. This belt extends down to Ghana without major interruptions, where it is named as the Lawra belt [20]. The eastern half of the Lawra belt is mainly composed of 2139 ± 2 Ma metamorphosed sedimentary rocks and 2153 ± 4 Ma granitoids [9,20,21,22]. The western half is composed of 2187 ± 3 Ma granitoids and high-grade gneisses [21], which have been metamorphosed up to amphibolite facies.
The Houndé–Ouango–Fitini (HOF, Figure 1) greenstone belt was intruded by granitoids between 2014 ± 3 and 2152 ± 2 Ma [23]. The eastern portion of the belt is composed of pyroclastic flow and volcano-sediments in the centre [1], and some rhyolites at the base. The western part of the belt is composed of intermediate to acid calc-alkaline volcanic series including basaltic andesites and pyroclastic flows [1,14].
The eastern margin of the Banfora greenstone belt (Figure 1) consists of basalt, andesite pyroclastic flow and rhyolite, while the western margin is only composed of volcano-sedimentary rocks. In the Katiola–Marabadiassa area, the belt was intruded by main pulses of granitoids between 2123 ± 3 and 2097 ± 3 Ma [17].

2.3. Geological Summary in South-Western Burkina Faso

Gravity signals of characteristic wavelength stemming from density anomalies at depth can help determine the structures in the lithosphere. In Figure 2, we show the signatures of Complete Bouguer gravity anomalies in the study area over six different profiles. These anomalies have been provided by the EGM2008 model of the BGI/Bureau Gravimétrique International [30]. The negative values and amplitude of the Bouguer Anomaly (Figure 2b) can help to reveal the architecture and geometry of large-scale structures at depth, in this case the Leo-Man Shield (Figure 2a). Similar to the gravity model of Baratoux et al. [1], the peaks and valleys of the gravity anomalies generally outline the greenstone and granitoid belts (orange and green in Figure 2a) respectively. Only the Greenville-Ferkessedougou-Bobo-Dioulasso (GFBF) area (black dotted lines in Figure 2) is marked by weakly positive anomalies. The density anomalies in Figure 2b also reflect the position of craton-scale major shear zones in the area and their steeply dip angles to an extent [1]. These shear zones transect the greenstone belts or/and define the boundaries with granitoid bodies.

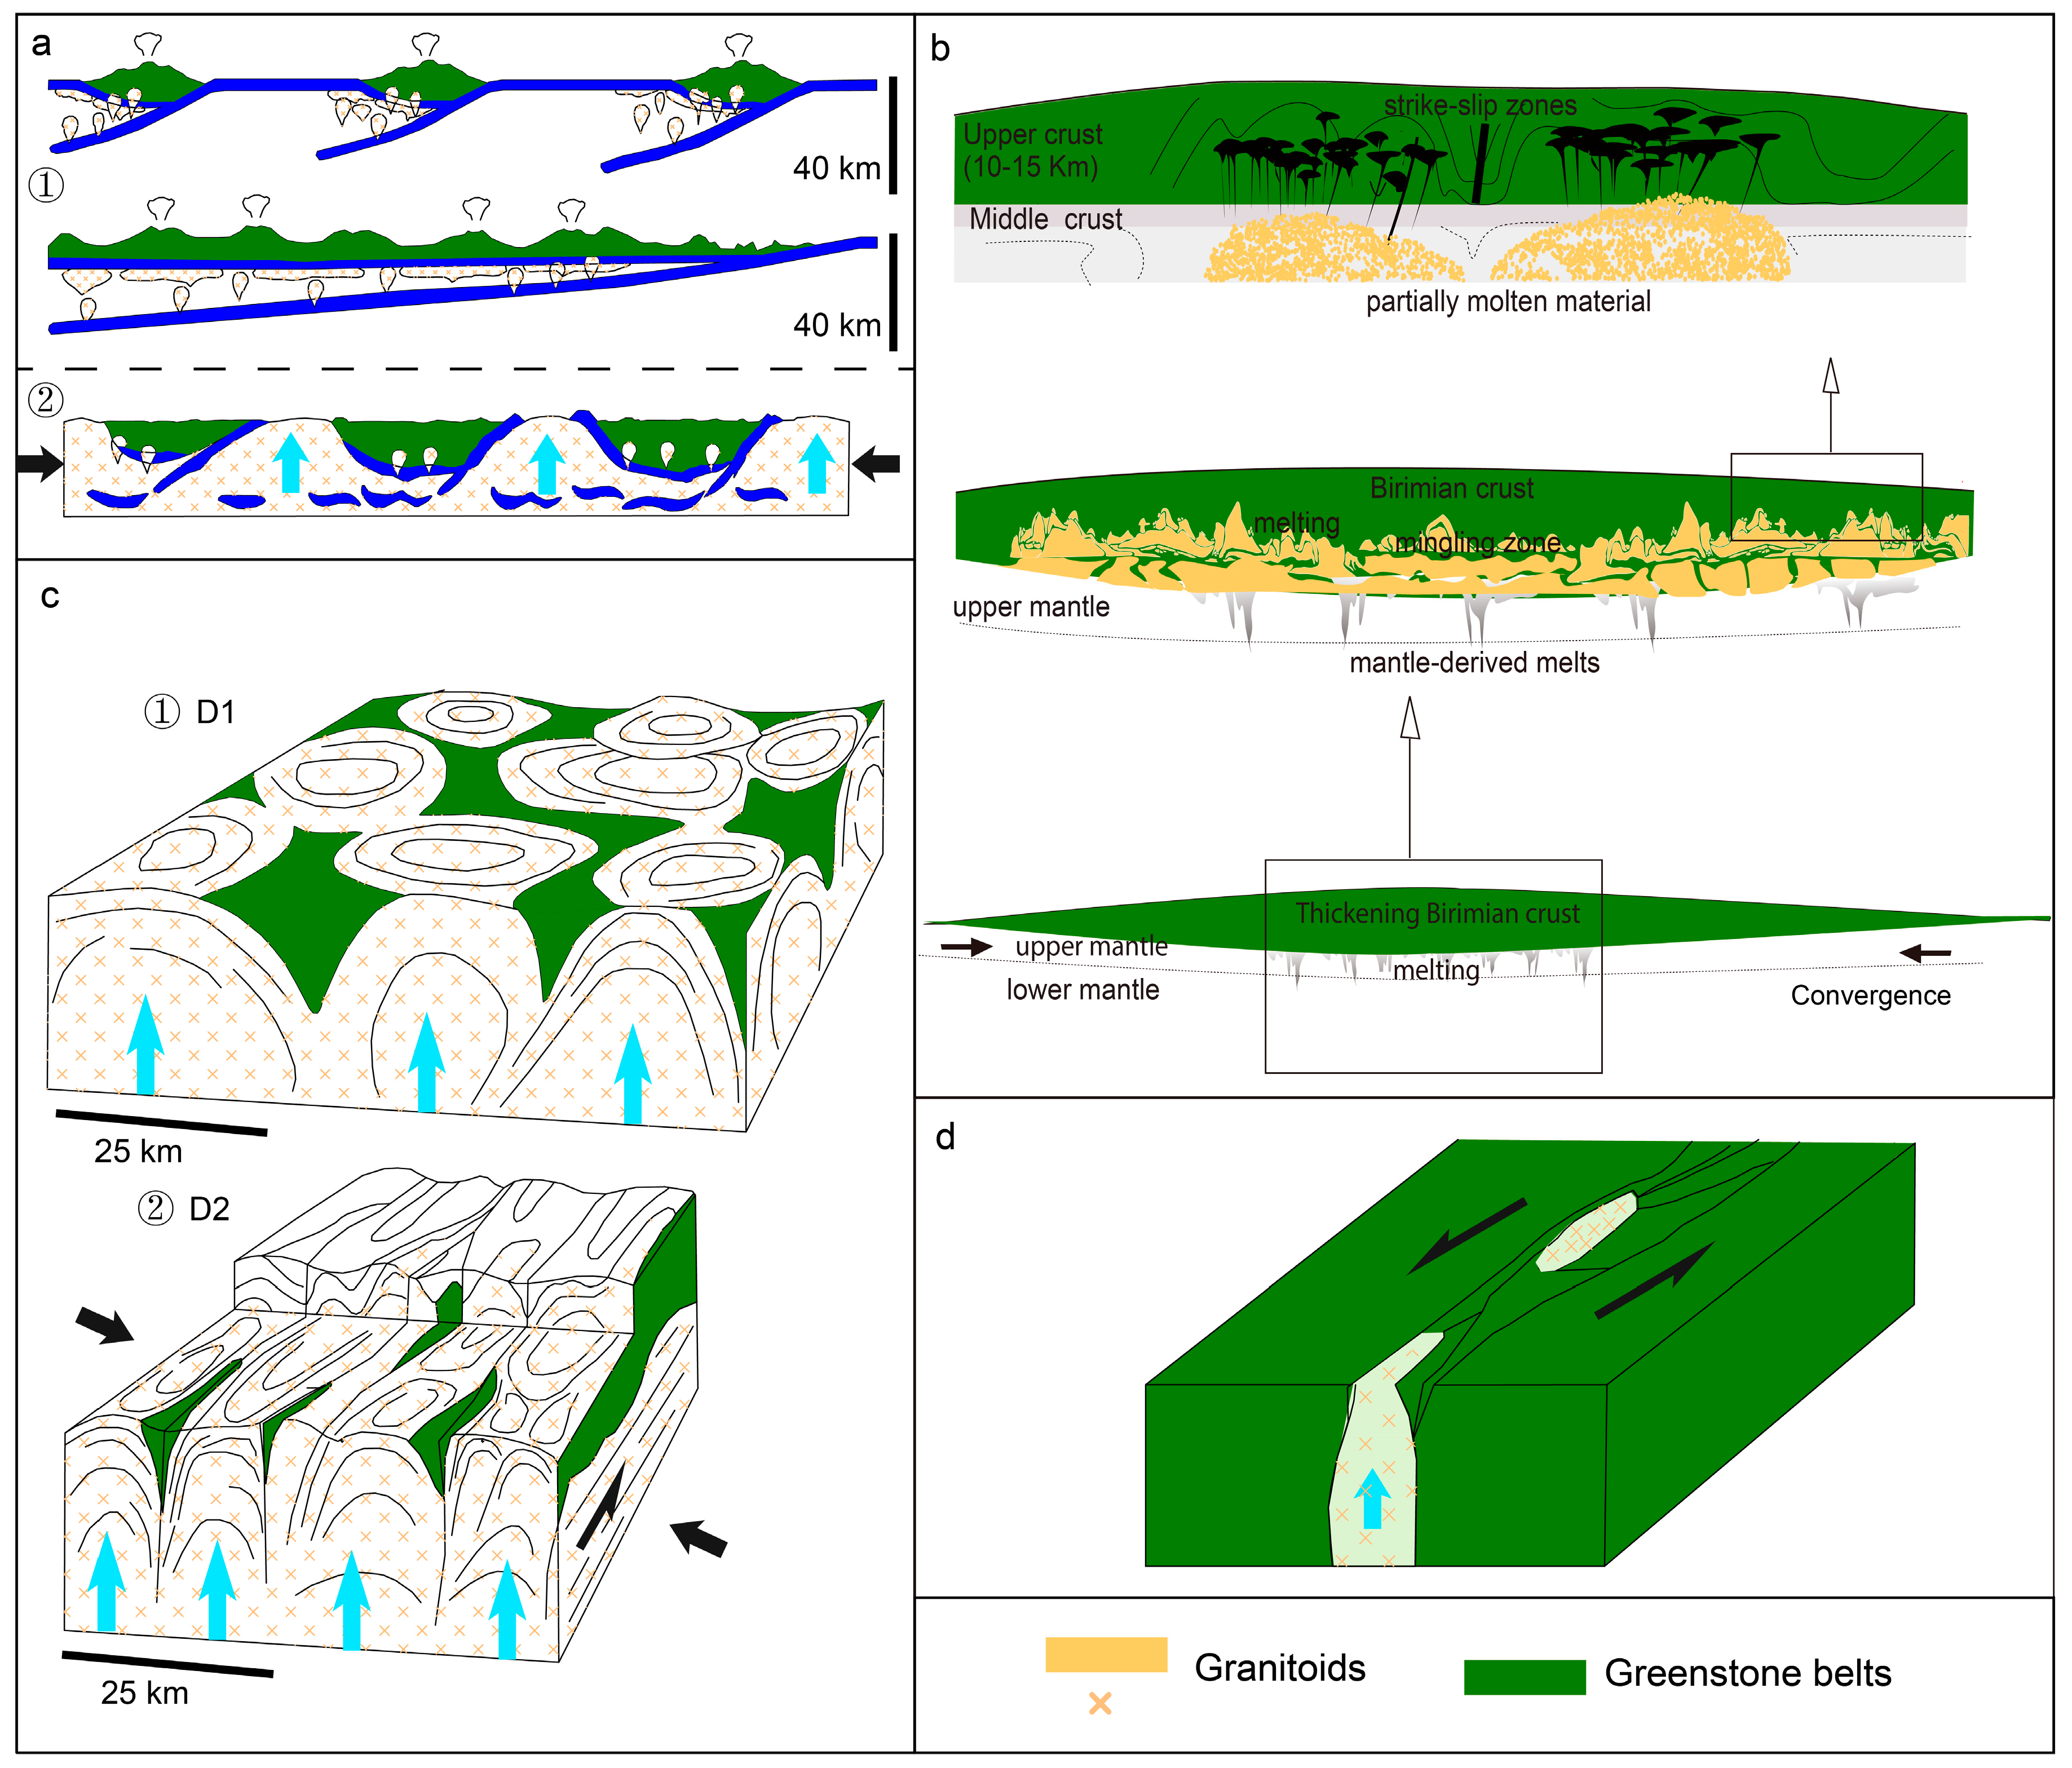
3. Tectonic Models: The Deformation of Greenstone–Granitoid Belts

Precambrian volcano-sedimentary basins have some striking similarities and differences compared to modern Phanerozoic sedimentary basins [31]. In SW Burkina Faso (Figure 1 and Figure 2), Baratoux et al. [1] proposed that the volcanic and meta-sedimentary rocks underwent long-wavelength amplitude buckling during the transition from an ocean crust to a thickened continental crust (~30 km, Figure 3a). The granitoids were proposed to be possibly generated by oceanic slab melting in subduction zone and/or by re-melting of lower crustal rocks [1]. Regarding the process of subduction, two scenarios were proposed: (1) each belt (Boromo, Houndé and Banfora greenstone belts) corresponds to a volcanic arc and (2) only one volcanic arc existed (at least 400 km in width), which was shortened and folded into the present fashion of greenstone belts.
Using a numerical study (Figure 3b), Ganne et al. [4] modelled the post-accretion Eburnean collisional-orogeny. They proposed that the exhumation of partially molten rocks, characterized by strong lateral metamorphic gradients, was mainly controlled by simultaneous folding/shortening and gravitational instabilities in the crust. However, in Ivory Coast (Figure 1 and Figure 2), Vidal et al. [16] proposed a two-stage scenario to explain the evolution of deformation on the basis of “dome and basin” fashion (Figure 3c). The D1 stage is characterized by the self-development of “dome and basin” only due to the contrast in density between granitoids and greenstone basins without the involvement of horizontal tectonic forces. This mechanism corresponds well with the fashion of diapirs emplaced in the Archaean orogenies [32,33]. The D2 stage is characterized by coeval ascent of diapirs and shortening.
Compared to Vidal et al. [16], an opposing model (crustal thickening by nappe stacking) was proposed by Feybesse et al. [18] for the Sunyani–Comoé basin (Figure 1) based on the geometric relationship between upwelling leucogranites and regional shear zones (Figure 3d). The D1 stage would be responsible for thrusting and accretion. During the D2 stage, leucogranites would be emplaced in the crust in two steps: (1) initiating brittle deformation in the crust; (2) leucogranites emplaced through the brittle fractures under transcurrent regimes.
These different tectonic models suggest that the overall tectonic regime in the WAC during the Eburnean Orogeny is still a matter of debate, due to limited outcrop exposures [1,10], uncertain geophysical signatures of the Moho depth and lithospheric thickness [34] and vague thermal state of the mantle (Tp). For the initial geodynamic setting, it is thought to be related with immature arcs [35] or oceanic plateaus [36,37]. All these uncertainties suggest that the origin of granitoids in the WAC remains incompletely understood.

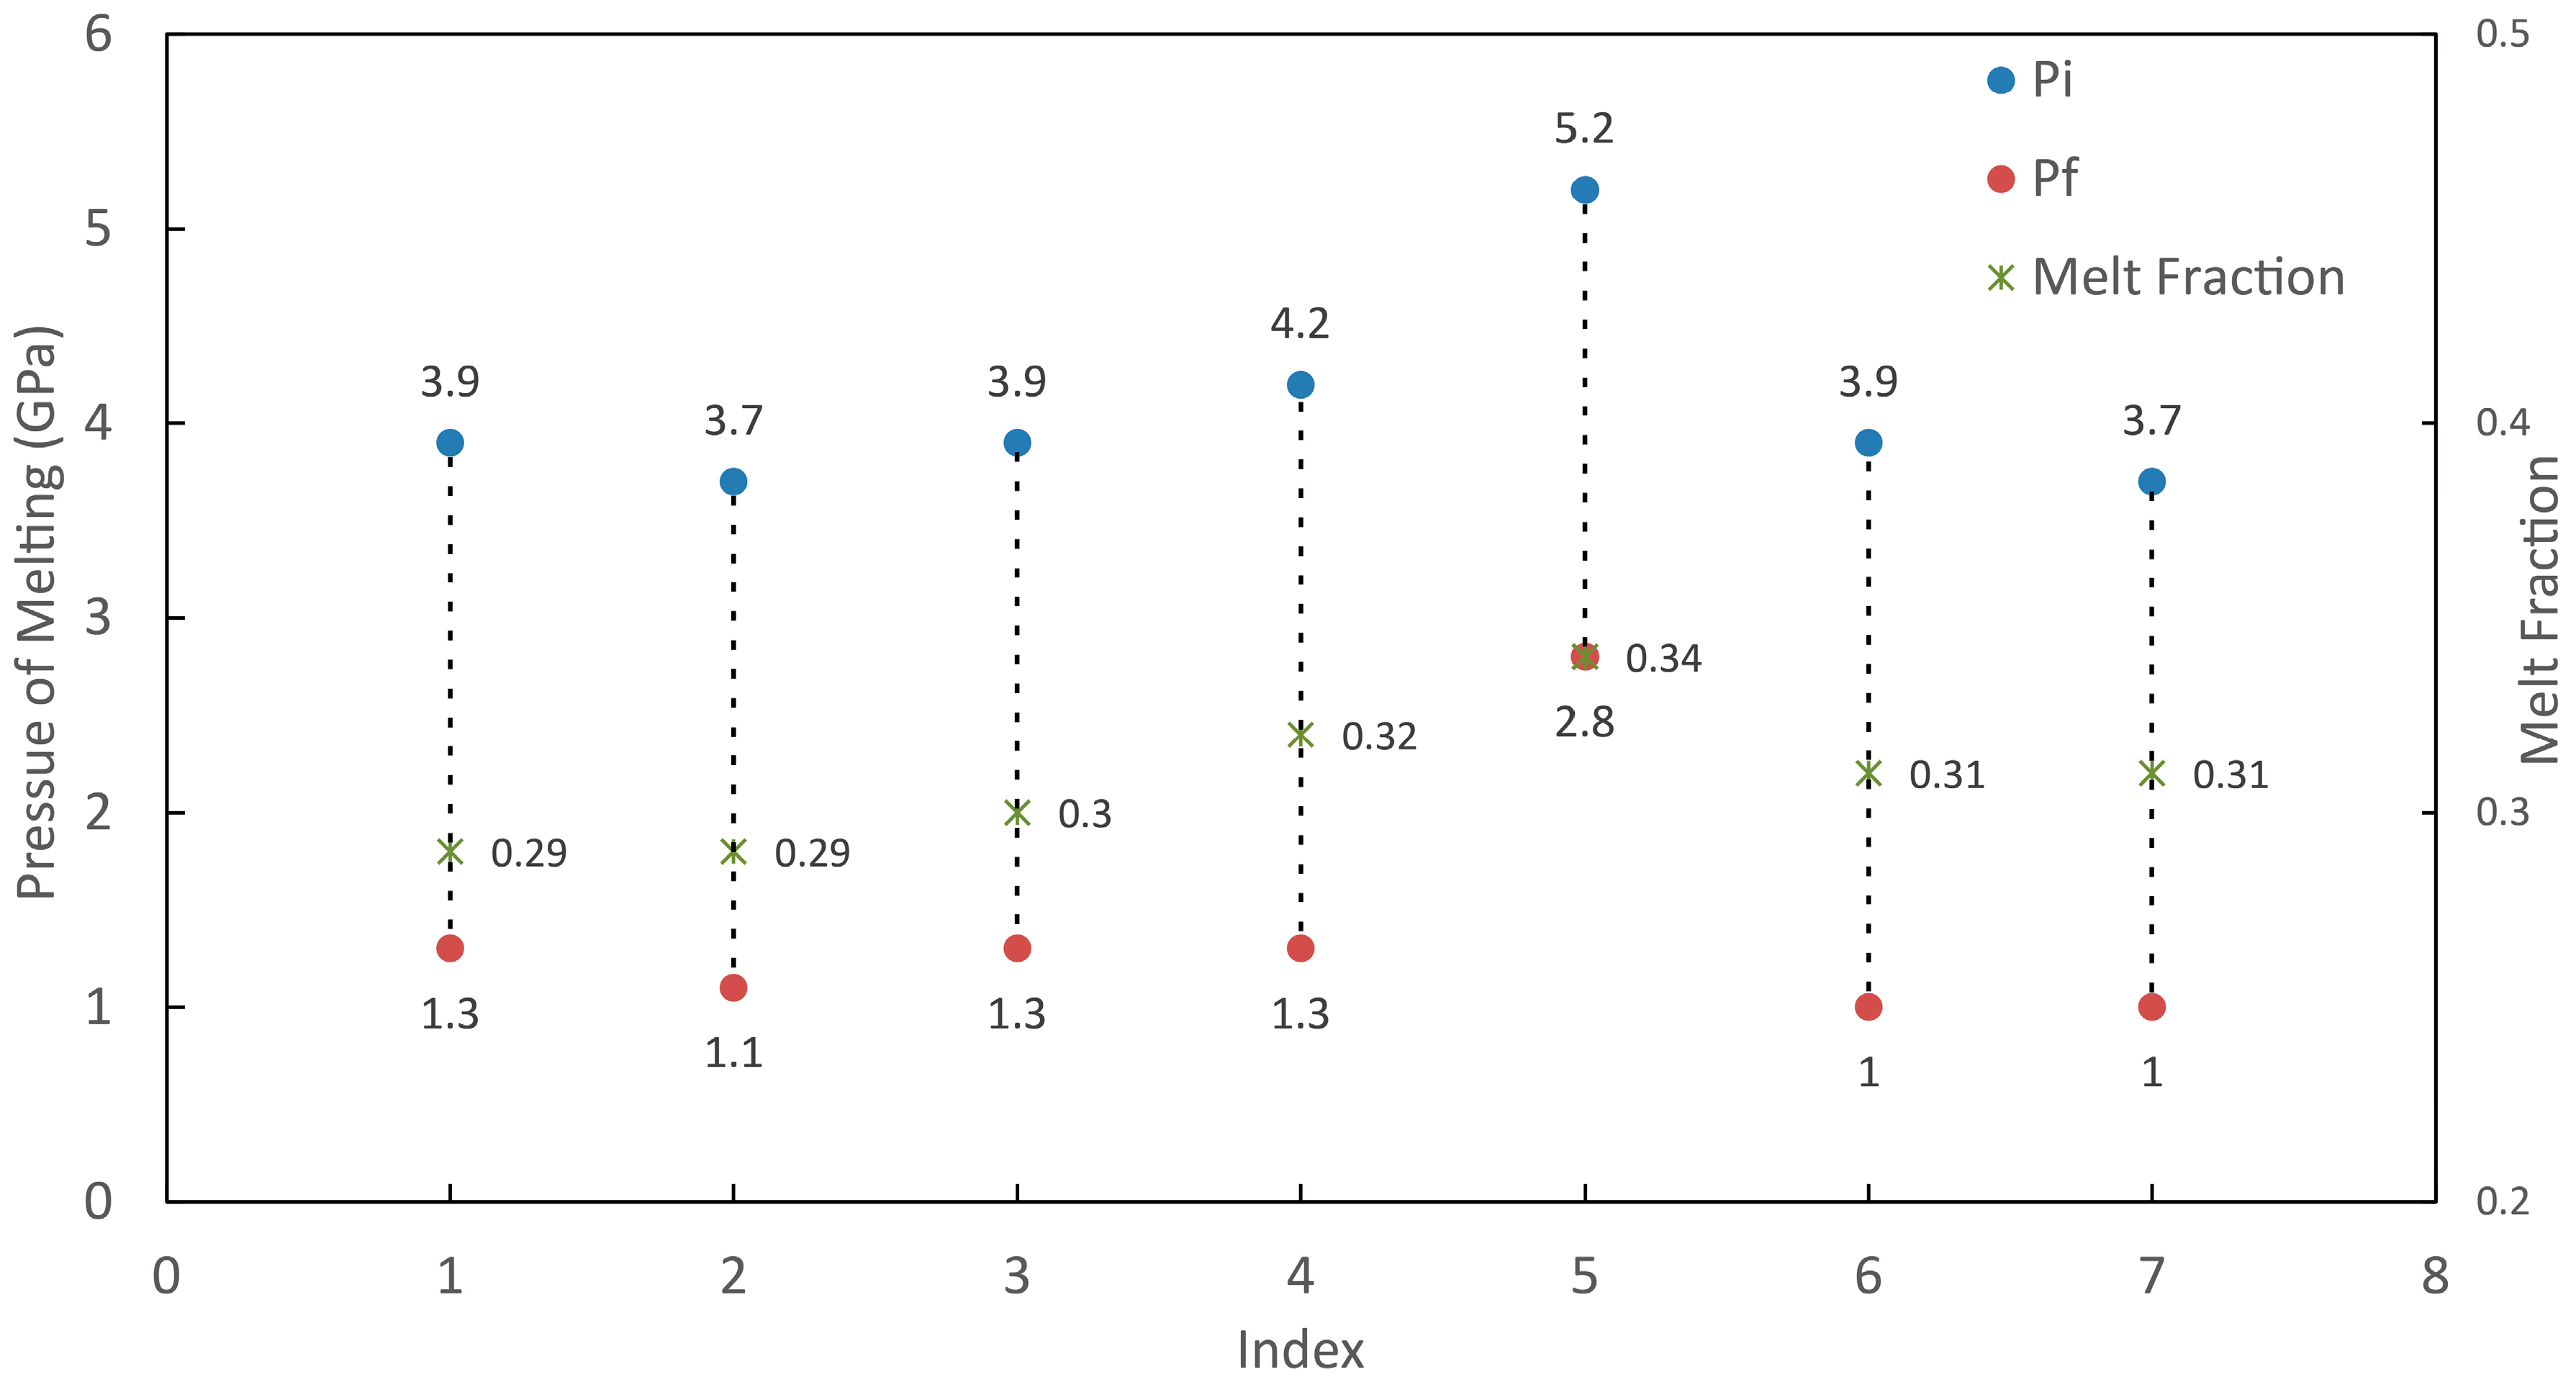
4. Ambient Mantle Temperature (Tp)

The thermal state of the mantle depends on the balance between heat production by radiogenic elements and heat loss by mantle convection [38,39,40]. Basalts are thought to be a thermal probe of the mantle, as their composition significantly changes with the Tp through geological time [40,41]. The Tp evolution calculated on a global scale shows a limited secular cooling of 200–150 °C since ca. 4.0 Ga [40].
To estimate Tp info in the WAC during the Eburnean Orogeny, we have explored different magma databases (GEOROC database; WAXI database, the West African Exploration Initiative project) and calculated Tp using the software PRIMELT3 [42]. All Tp solutions have been filtered according to the graphic procedures given in Herzberg and Asimow, [43]. Seven samples (their GPS coordinates are indicated by blue stars, Figure 1) of volcanic rocks or lavas (less than 1% survived from the dataset of >1000 data) yielded successful solutions (Figure 4 and Table 1). The bulk composition of samples is provided in Table A1. All samples yield approximate ages of about ca. 2.20–2.10 Ga. Fe2O3 is calculated with FeO/FeOT = 0.9 and Fe2O3/TiO2 = 0.5. All calculated primary magma compositions are aggregates of all melt increments that mix perfectly.
The Tp yields between 1500 and 1600 °C, approximately having a mean value of 1520 °C (Figure 4). The pressures of initial (Pi) and final (Pf) melting yield about 3.7–5.2 GPa (corresponding to a depth of about 120–170 km) and 1–1.3 GPa, respectively (Figure 5). Melt fraction ranges between about 0.29–0.34 (Table 1).

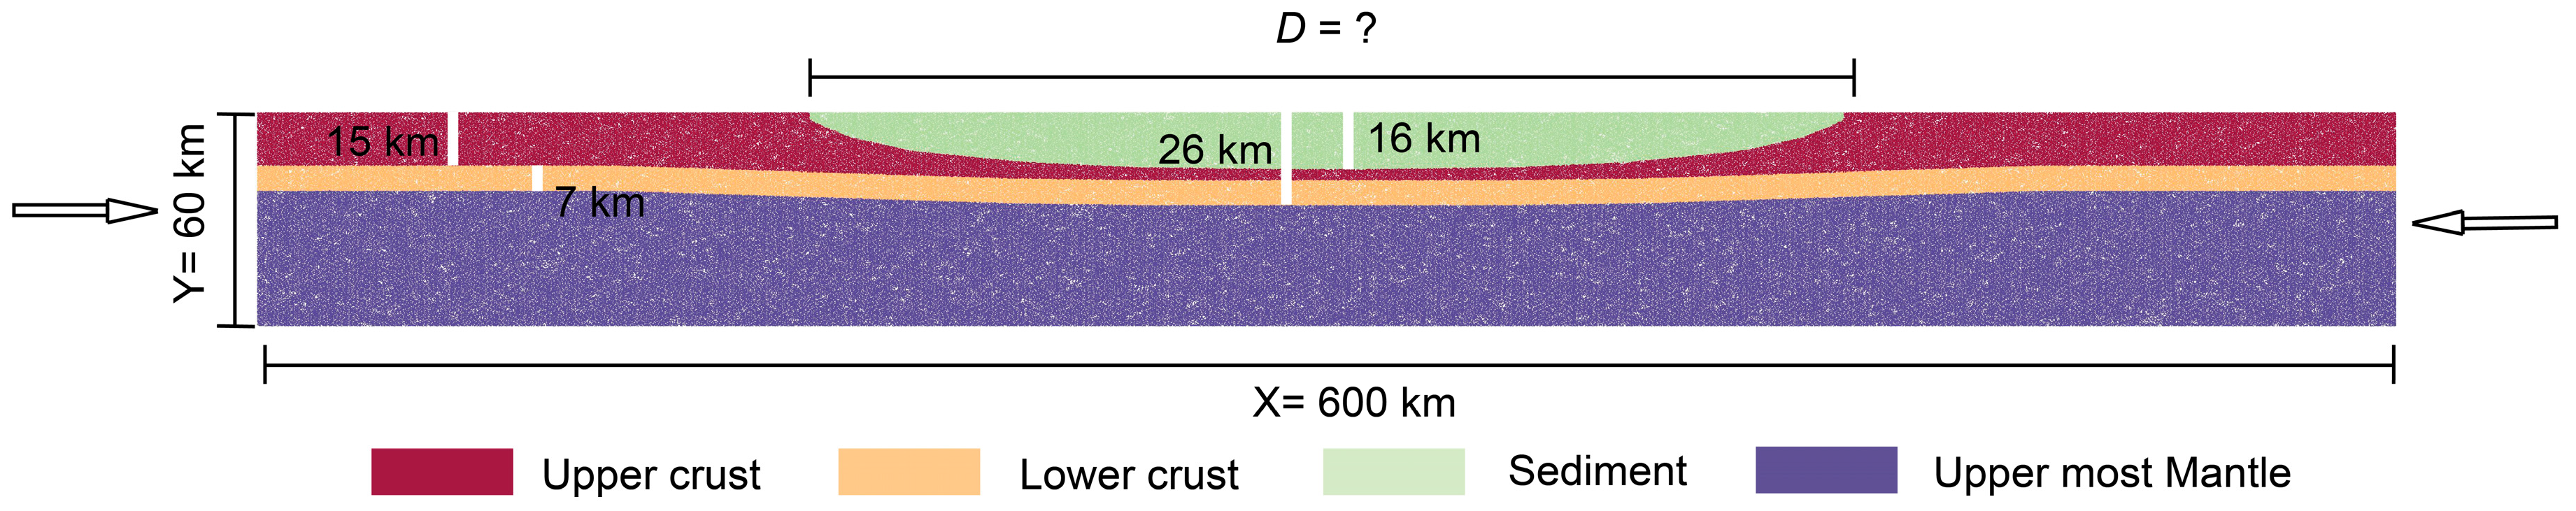
5. Numerical Method and Model Setup

In this study, six 2D thermo-mechanical models have been run building on our previous work [4] with the code Underworld [44,45]. This code uses a Lagrangian Particle-in-Cell (PIC) finite element scheme. The governing equations for momentum, mass and energy conservation are solved according to the Underworld framework (the method is not recalled here as more details on the method description can be found in De Smet et al. [46]; Moresi et al. [44,45]).
The model domain (Figure 6) is 600 km long (X direction) and 60 km thick (Y direction), with a resolution of 2 km × 1 km (X and Y direction) in a 2D geometry and using a visco-plastic rheology. We use a random initial particle layout; 30 particles are initiated in each cell [44,45]. The model is made of a lithospheric mantle, a volcano-sedimentary basin, an upper crust and a lower crust. In the upper crust, we define a volcano-sedimentary basin and we vary its width using the six models. The model setup is given in Figure 6. In this paper, we apply convergent velocity boundary conditions at a rate of 2.5 mm/year on either side. The base of the model domain is free slip, a free re-meshing boundary condition is applied to the model surface to produce relief [44,47]. For the thermal conditions of the model, we model the compression of a “hot” lithosphere. We apply fixed temperatures of 0 °C at the surface, and the temperature at the Moho depth is about 500–625 °C, that is consistent with the results of Mckenzie et al. [48] and Wang et al. [49].
At depth, rock deformation is sensitive to temperature. Generally, this behavior is described by a temperature-dependent non-Newtonian power law [50]. Parameters used in Equation (1) are given in Table 3. Viscosity ( η ) is given by:
η = 0.25 · ( 0.75 A ) ( 1 / n ) · ε ˙ ( ( 1 / n ) 1 ) · e x p ( Q / n R T )
where ε ˙ is the second invariant of the strain rate, Q is the activation energy, R is the universal gas constant, A is a pre-exponential constant and n is a power law exponent. Other physical and thermal properties are given in Table 4.
The effect of latent heating [51] is introduced into the modelling, following the methodology of Gerya et al. [52] and Ganne et al. [4] to model the effective heat capacity of partially molten rocks (melt fraction >1%) and their expansion coefficient. The latent heat of melting is fixed to 300 kJ/kg for all crustal rocks. The volumetric melt fraction is calculated following the methodologies of Gerya et al. [52]; Ganne et al. [4]. The volumetric melting coefficient ( X M ) for calculating melt fraction ( M ) according to temperature is expressed as Equations (2) and (3):
X M = 0   at   T T s o l i d u s X M = T T s o l i d u s T l i q u i d u s T s o l i d u s   at   T s o l i d u s < T < T l i q u i d u s X M = 1   at   T T l i q u i d u s
where T s o l i d u s and T l i q u i d u s are the wet solidus and dry liquidus temperatures of crust layers, respectively. We assume that the T s o l i d u s and T l i q u i d u s do not change with pressure.
For the volumetric melt fraction ( M ), we assume that it increases linearly with temperature when above the wet solidus temperature and below the dry liquidus temperature [4,52]. M is expressed as
M = X M · M m a x
When the temperature reaches T s o l i d u s , an effective viscosity is used to model partially molten rocks. Gerya et al. [52] employed a constant viscosity of 1017 Pa s for partially molten rocks. Whereas Ganne et al. [4] assigned an effective viscosity function (Equation (4)) exponentially proportional to the volumetric melt fraction ( M ). The effective viscosity we obtained ranges between 6 × 10¹⁷ Pa×s ( M = 1) and 8 × 10¹⁸ Pa·s ( M = 0.1) according to different melting conditions. We use Equation (4) to model the effective viscosity when the volumetric melt fraction exceeds 1% [53]. Melting points of different layers are listed in Table 5.
η e f f = 5 × 10 16 · e x p ( 2.5 + ( 1 M ) ( 1 M M ) 0.48 )
The density [54] is calculated based on temperature and a thermal expansion coefficient of 3 × 10⁻⁵ K−1. A constant thermal diffusivity of 10−6 m2/s is applied to the whole modelling domain. For the uppermost mantle, a linear equation relating density to temperature is expressed as Equation (5):
ρ e f f = ρ [ 1 α · ( T T 0 ) ]
For the layers involving partial melting, we employ a similar equation as De Smet et al. [46]; Gerya et al. [52]; Ganne et al. [4]. The effective density varying with temperature, melt fraction and pressure is calculated by Equation (6):
ρ e f f = ρ [ 1 α · ( T T 0 ) m c · M + β · ( P P 0 ) ]
where ρ e f f is the effective density, α is the thermal expansion coefficient, ρ is the original density, T is the local temperature, T 0 is the reference temperature (surface), mc is the coefficient of expansion related to phase change [55], β is the compressibility coefficient (10−11 Pa−1, [4,55]), P is the local pressure and P 0 is the reference pressure.

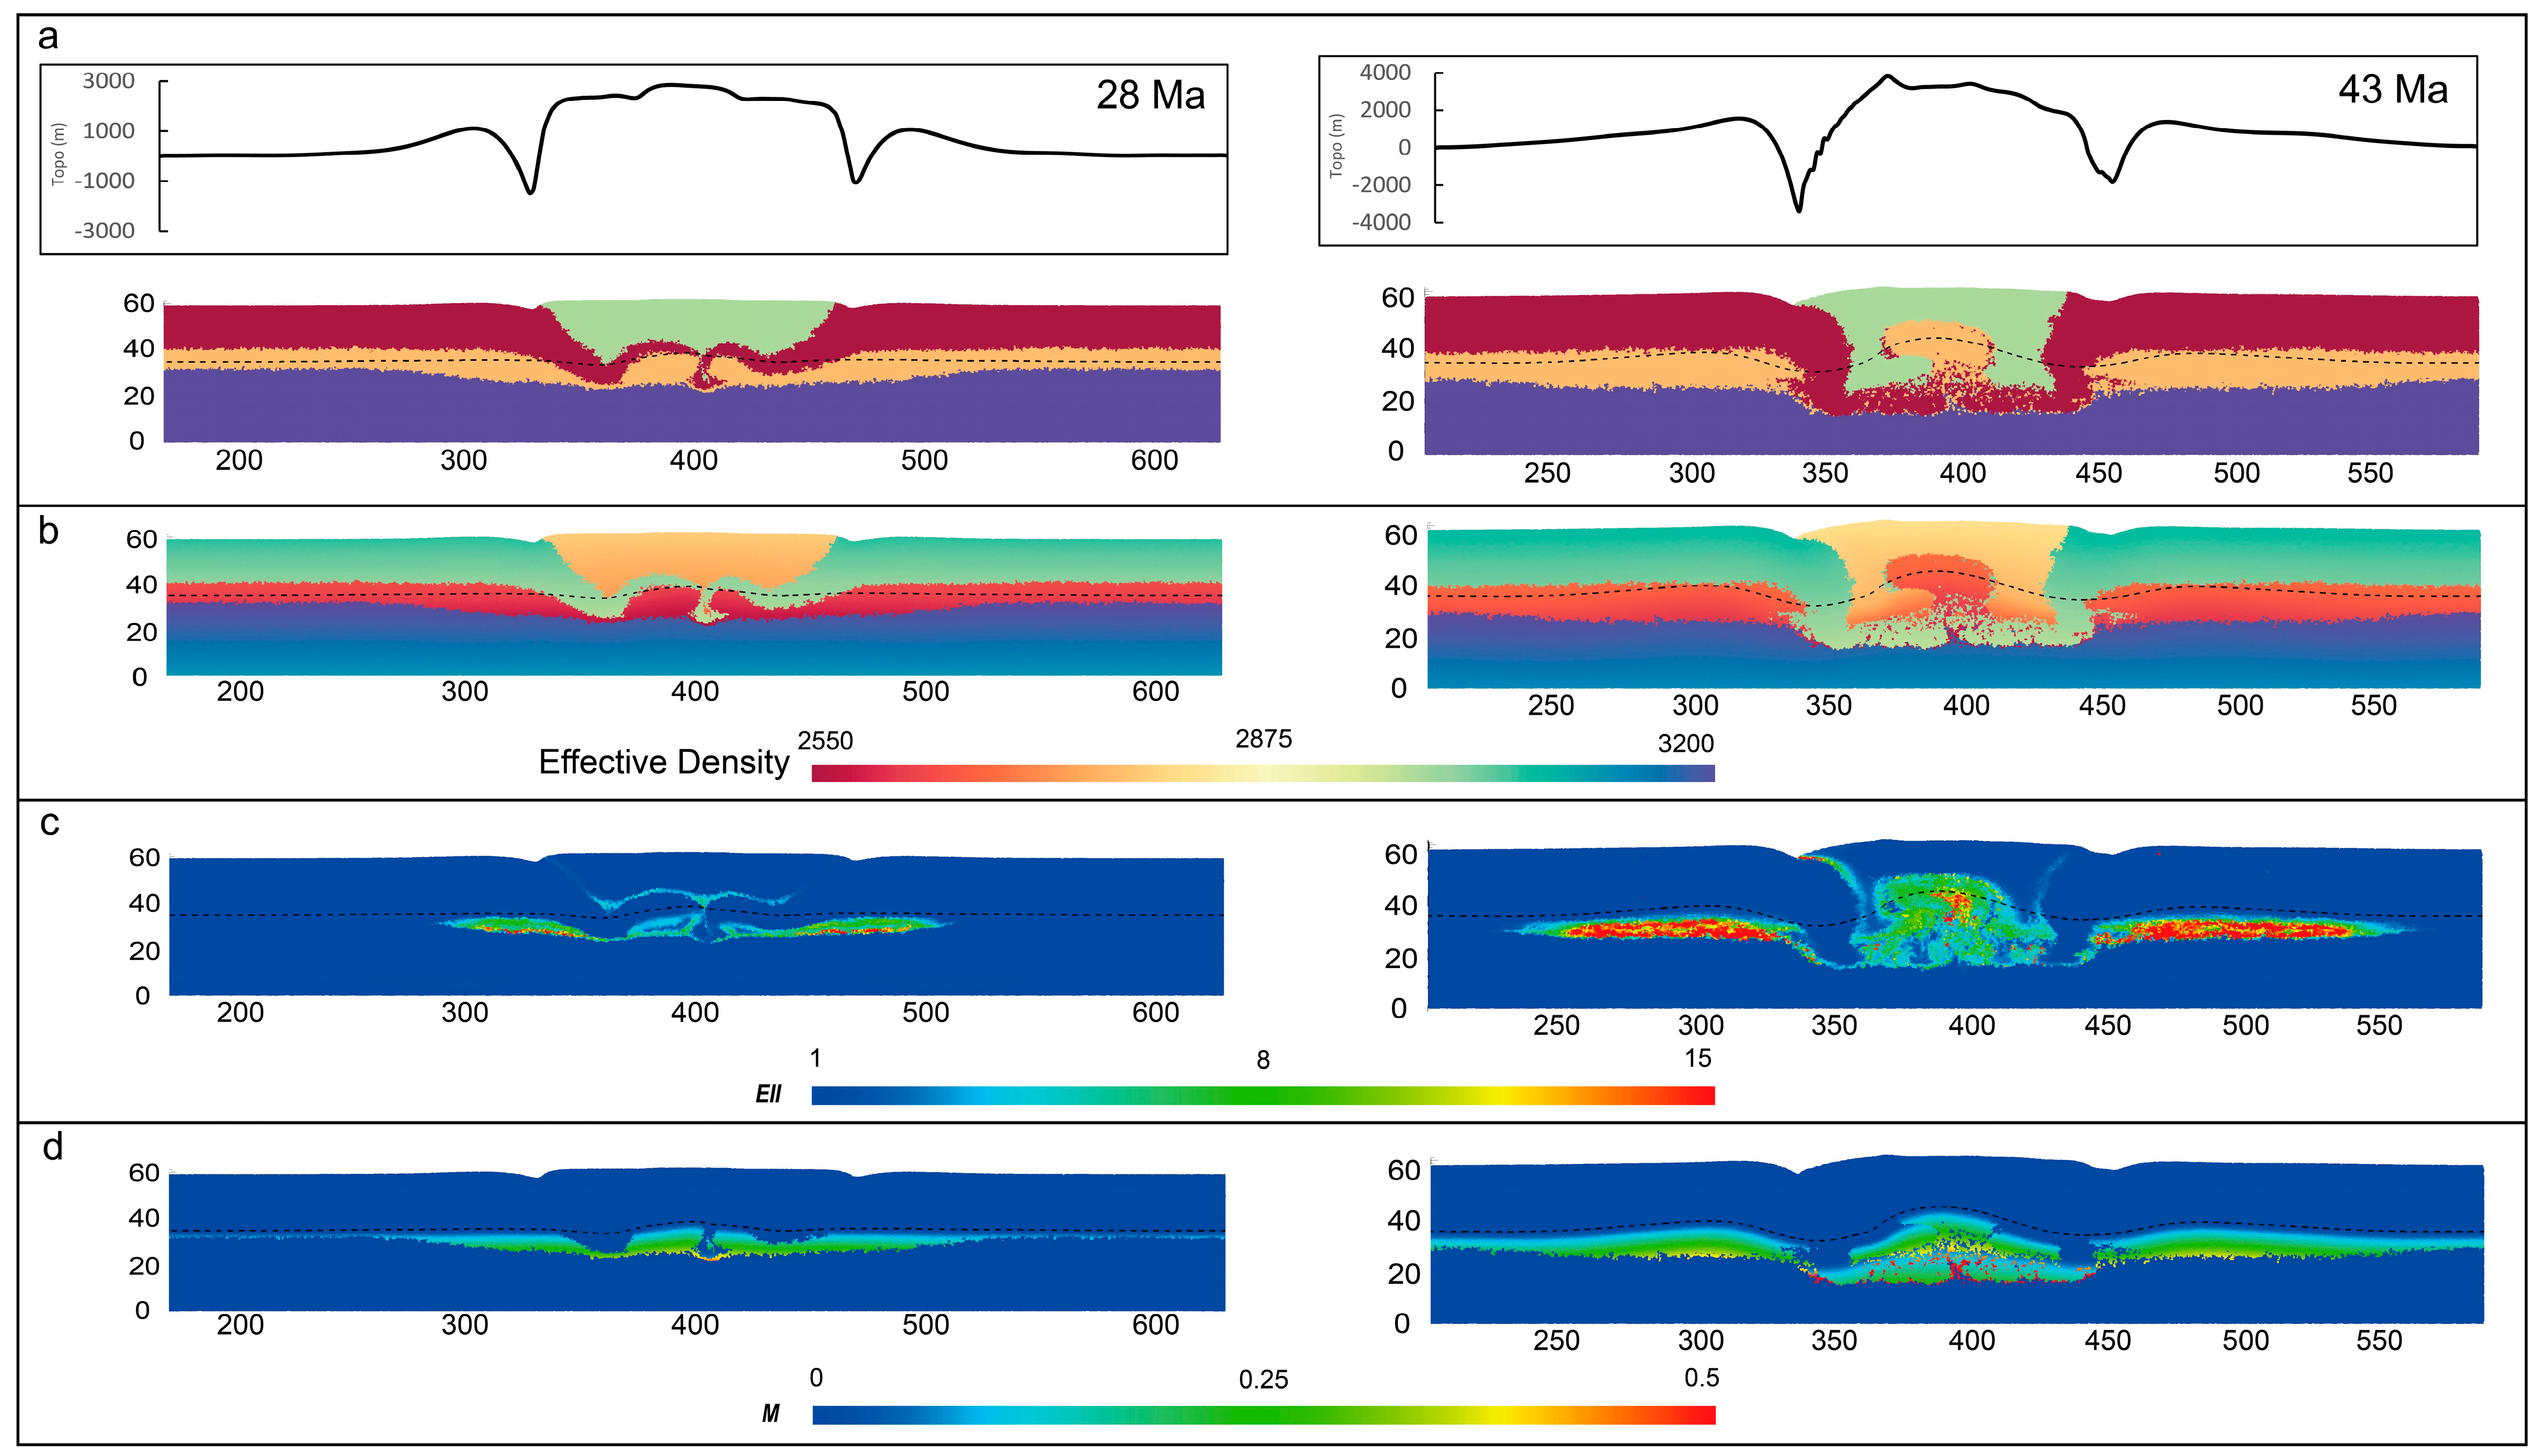
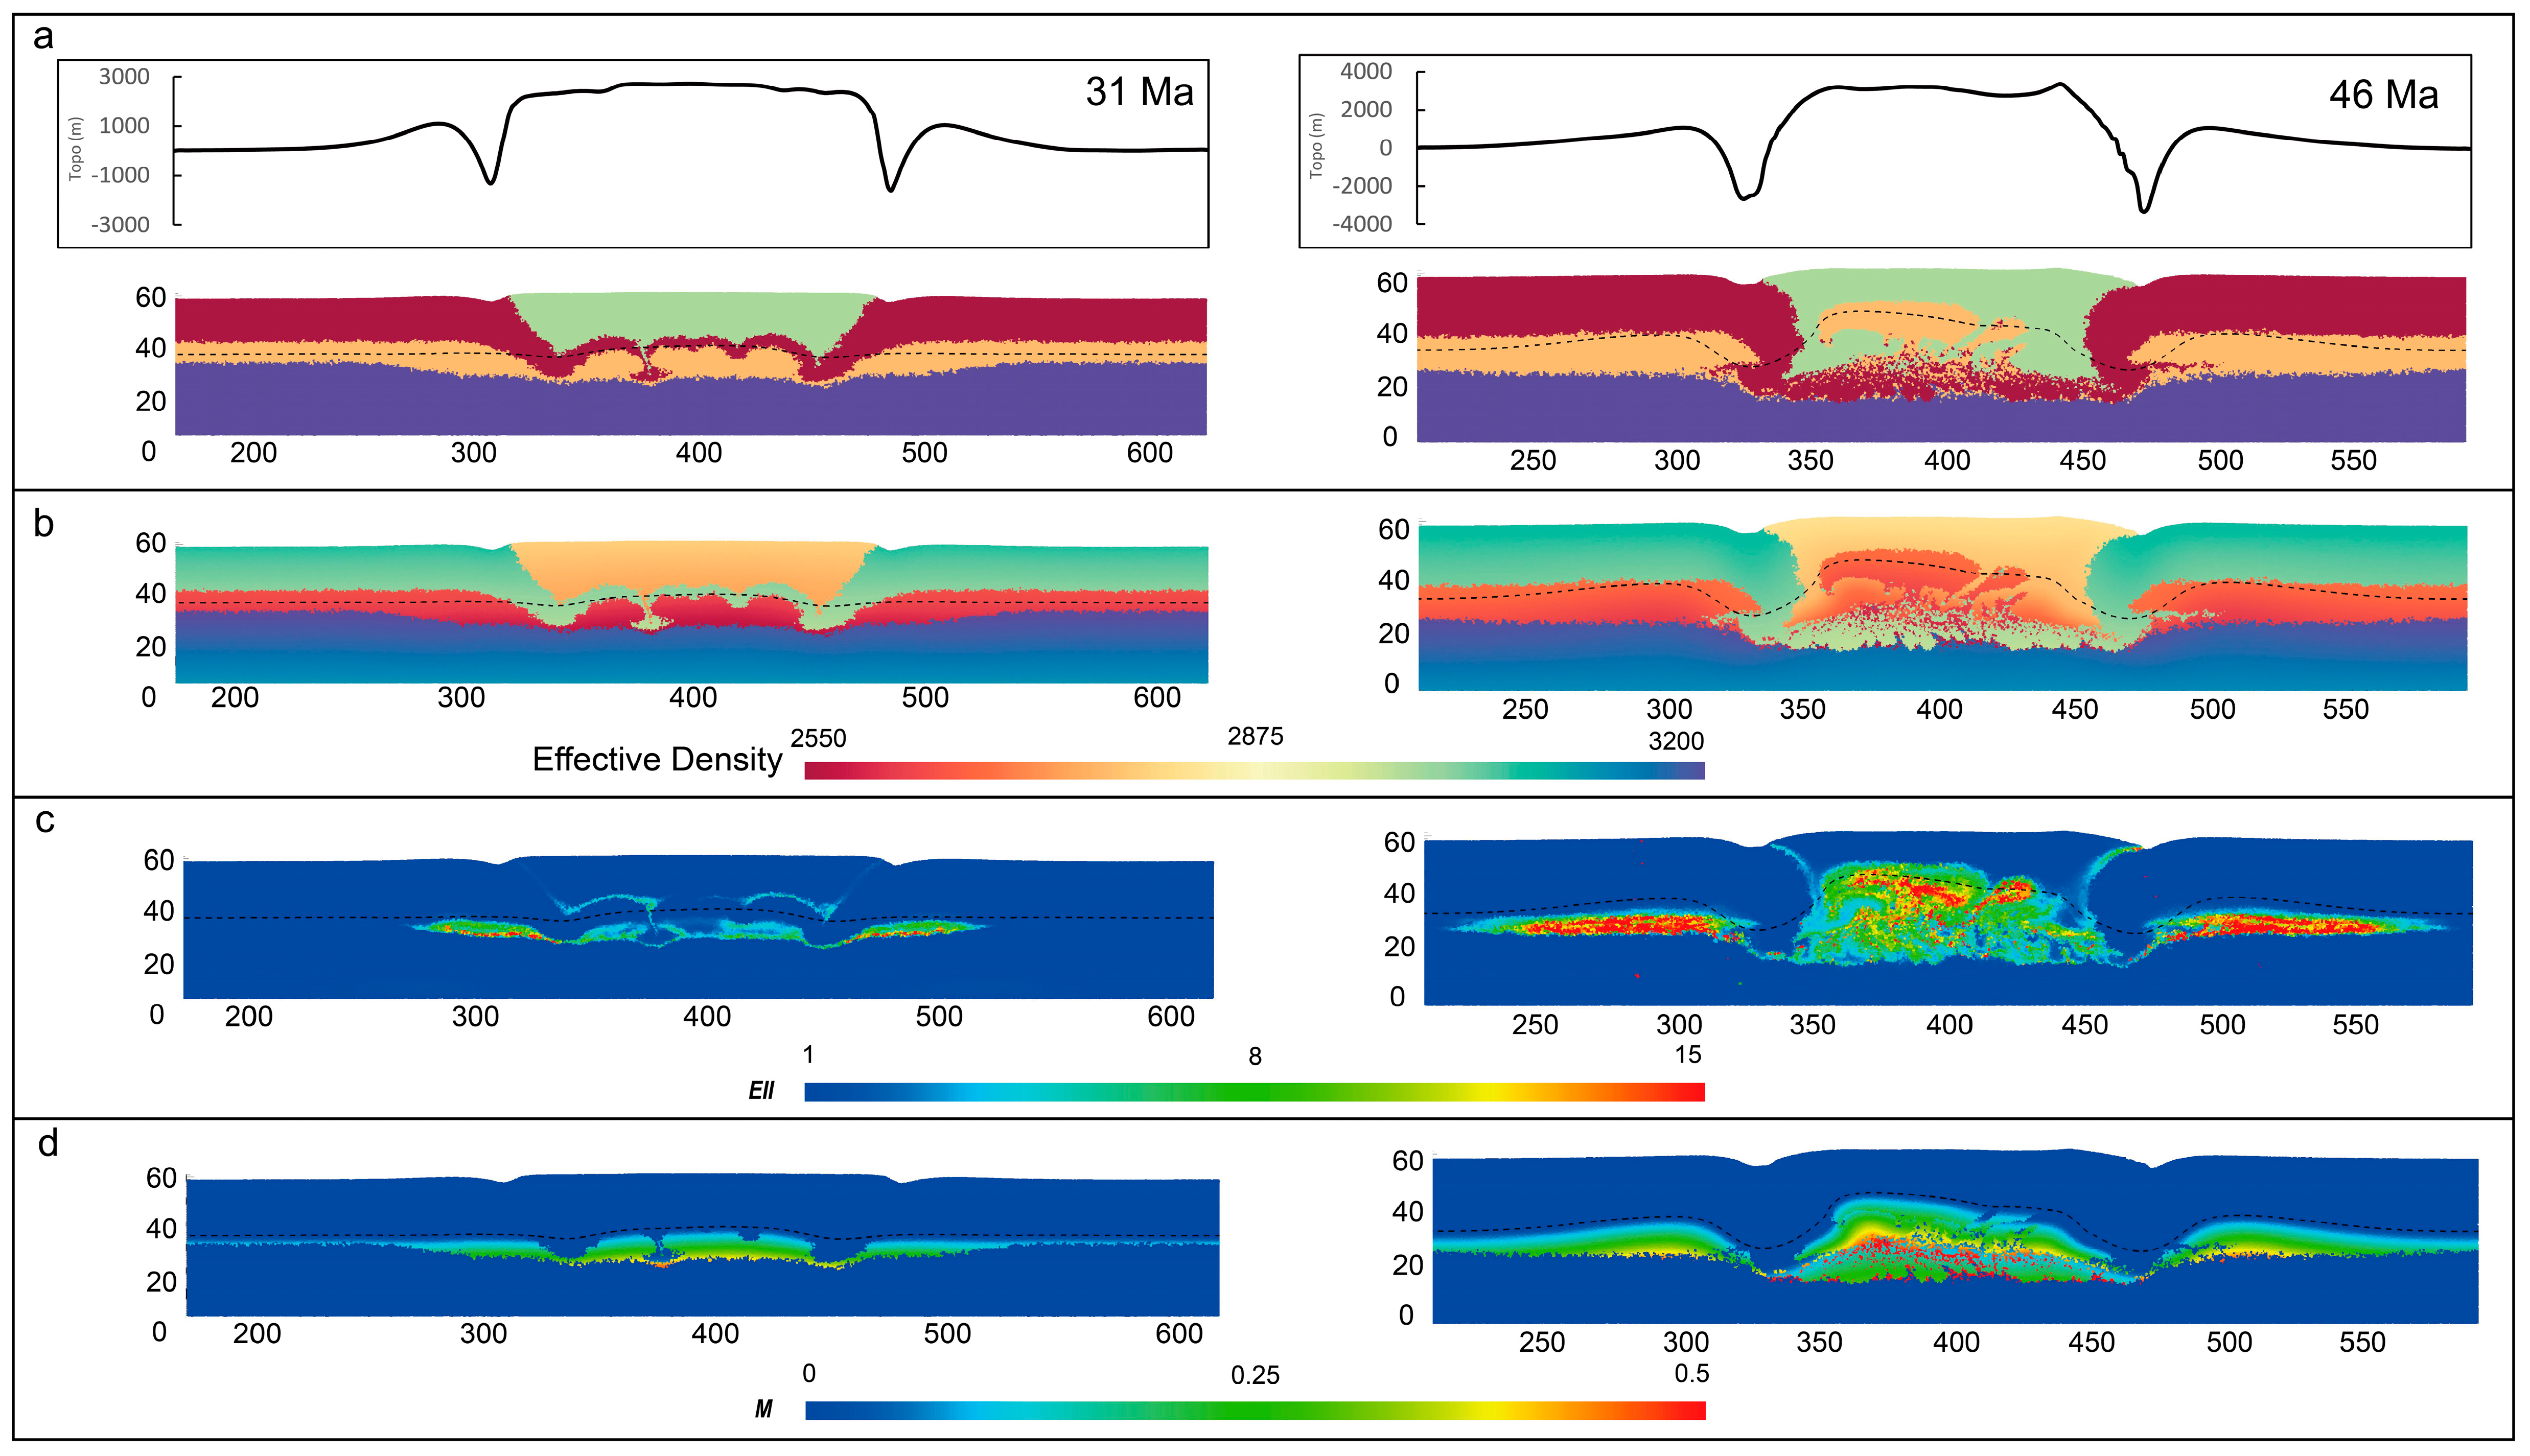
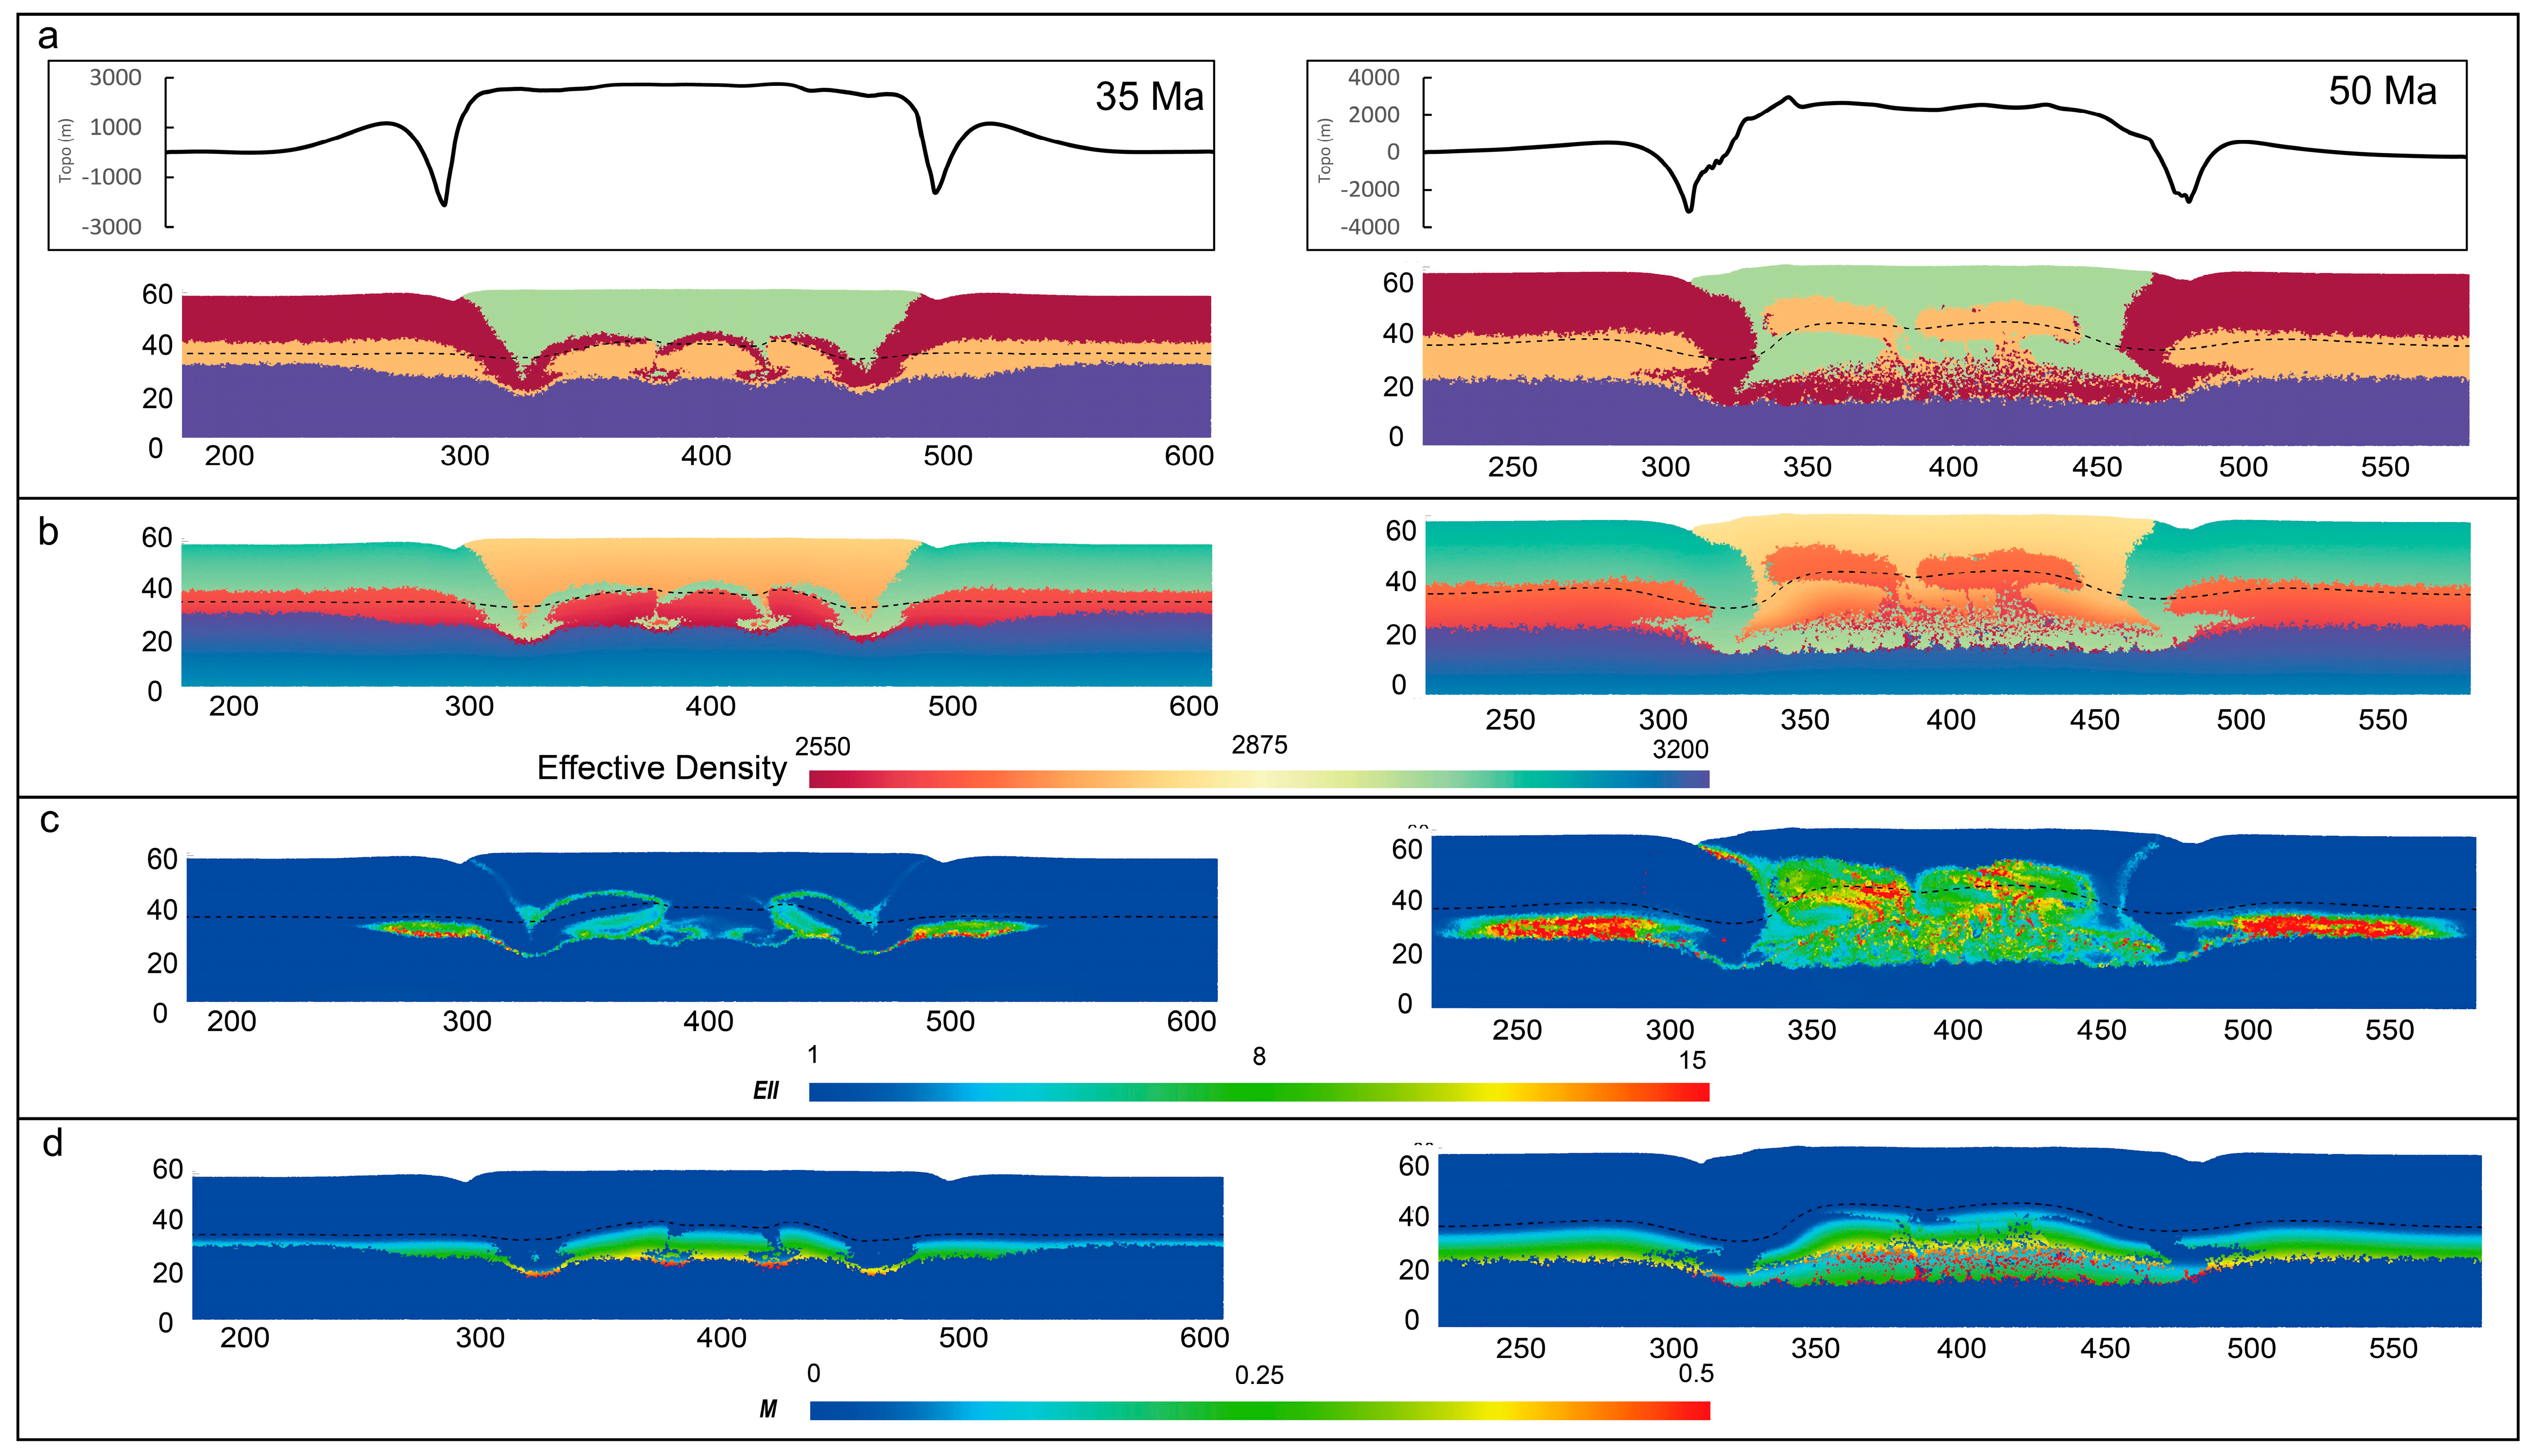
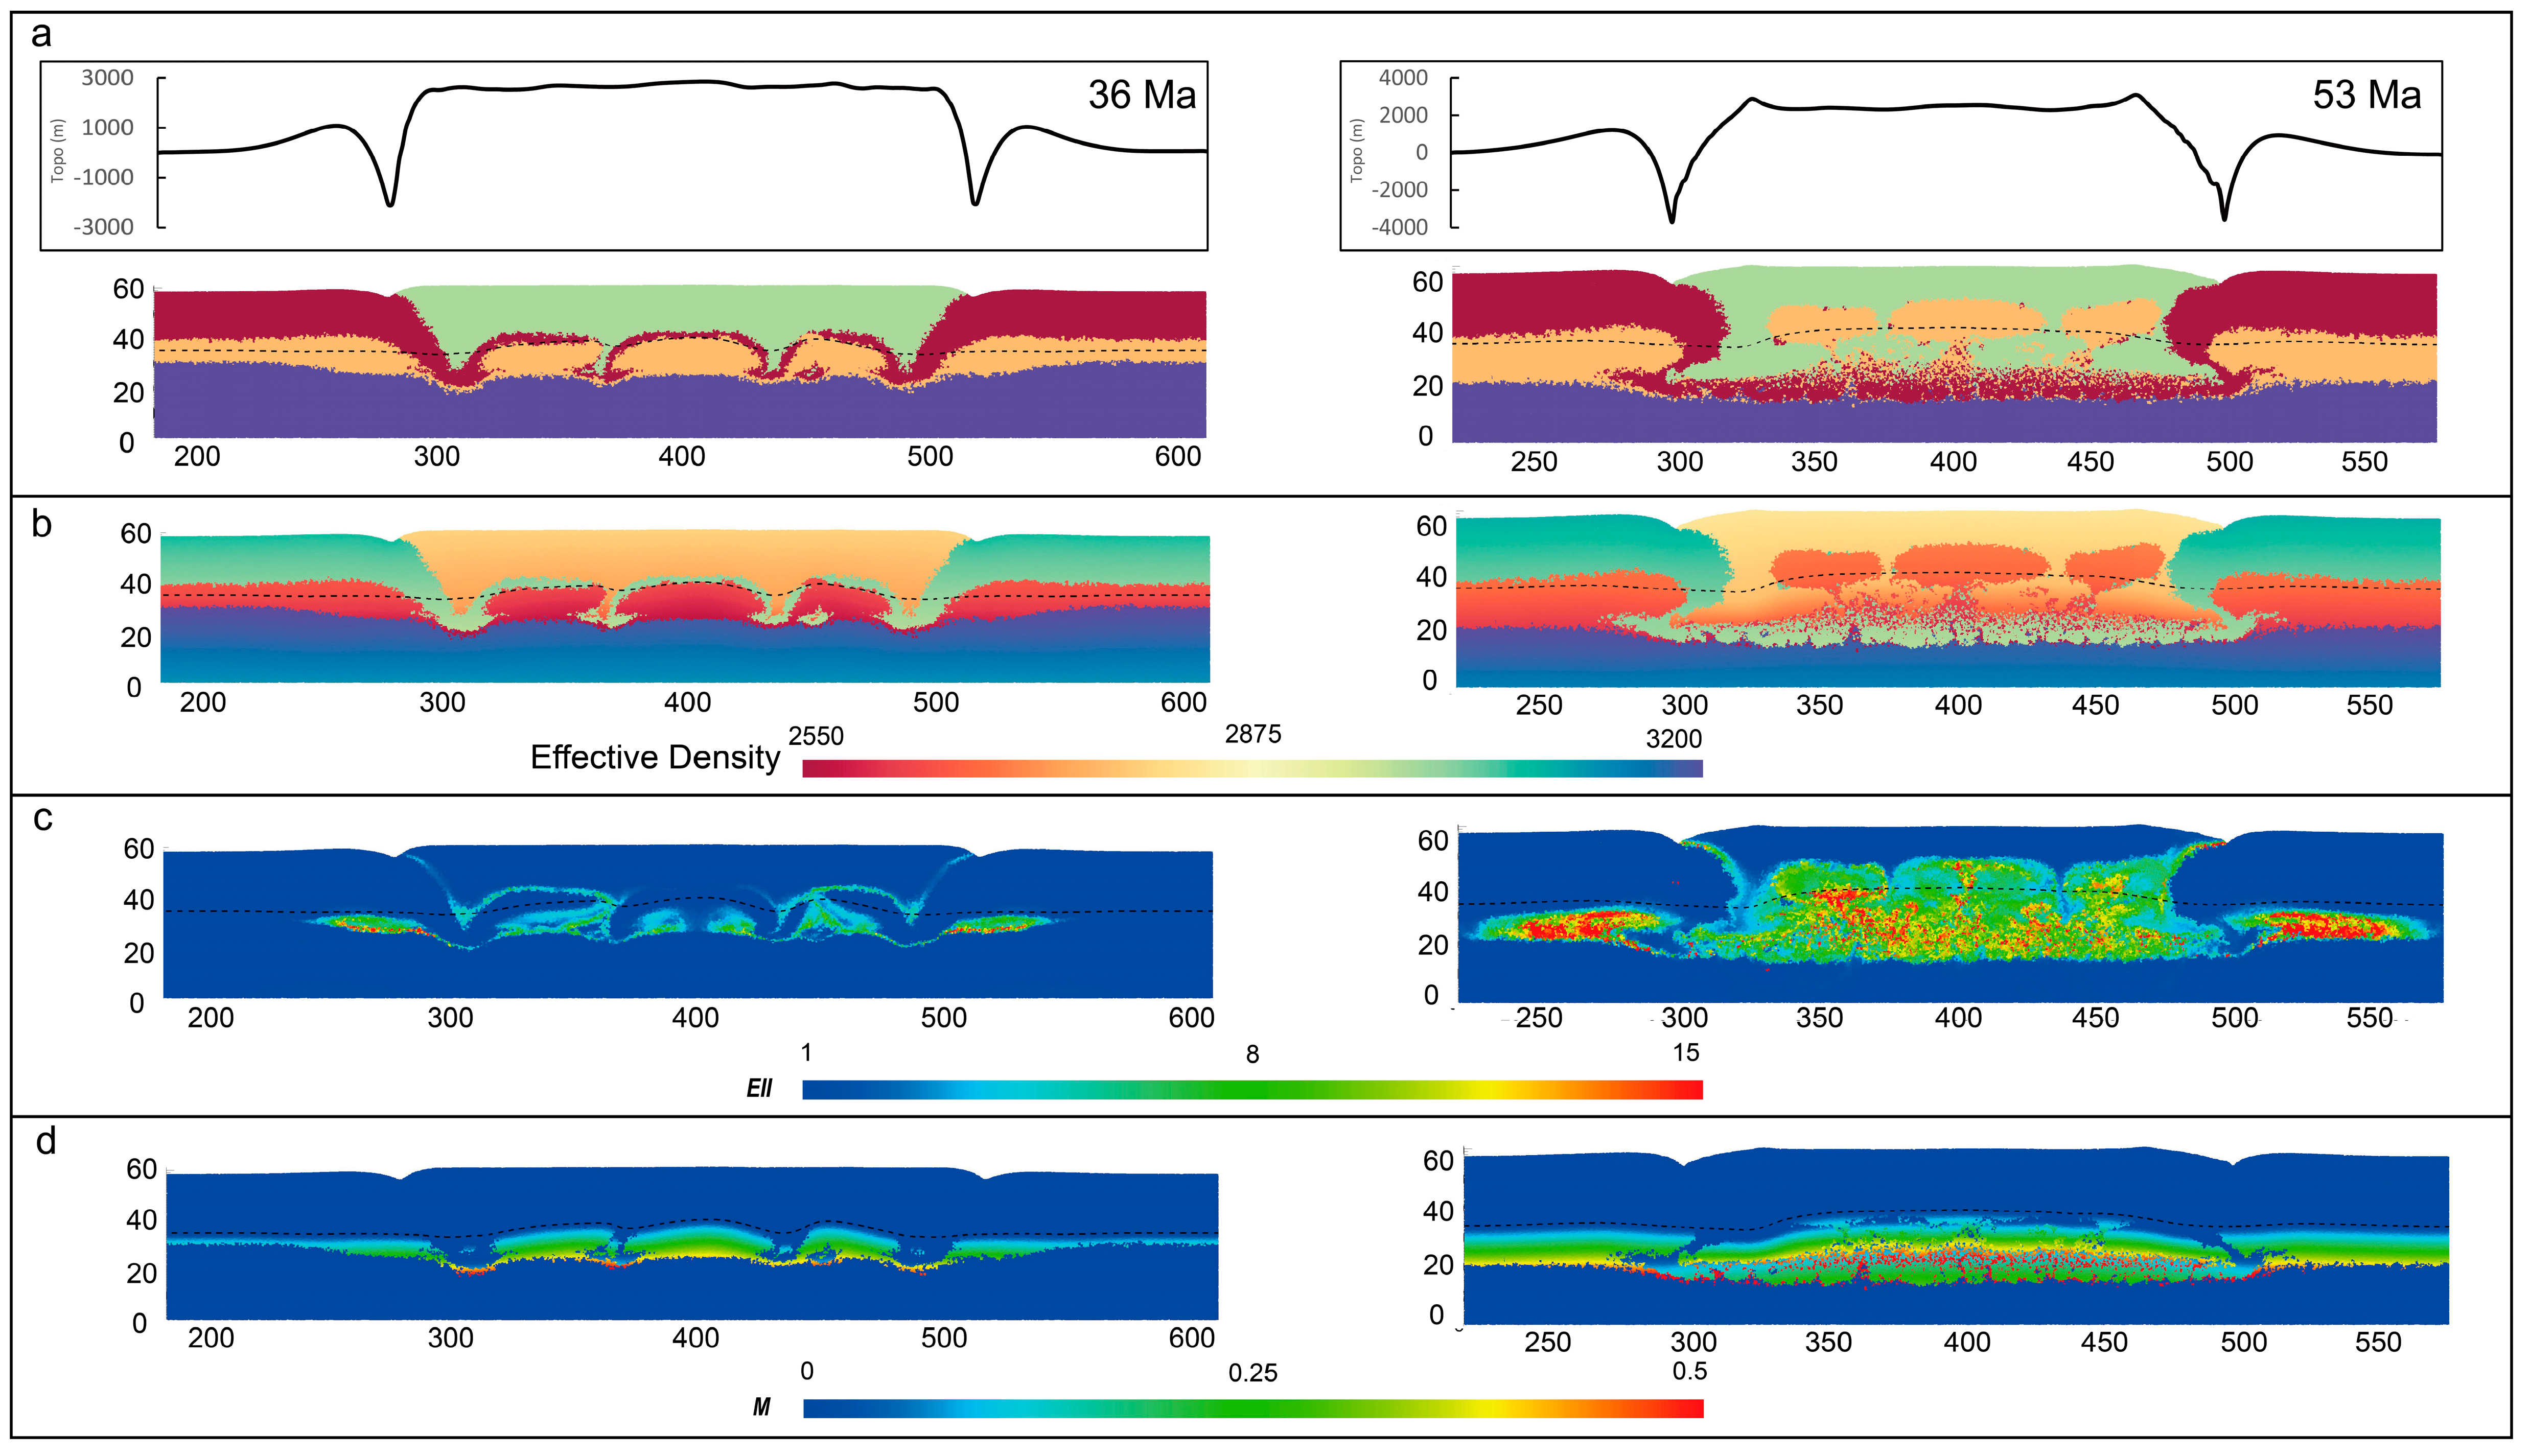
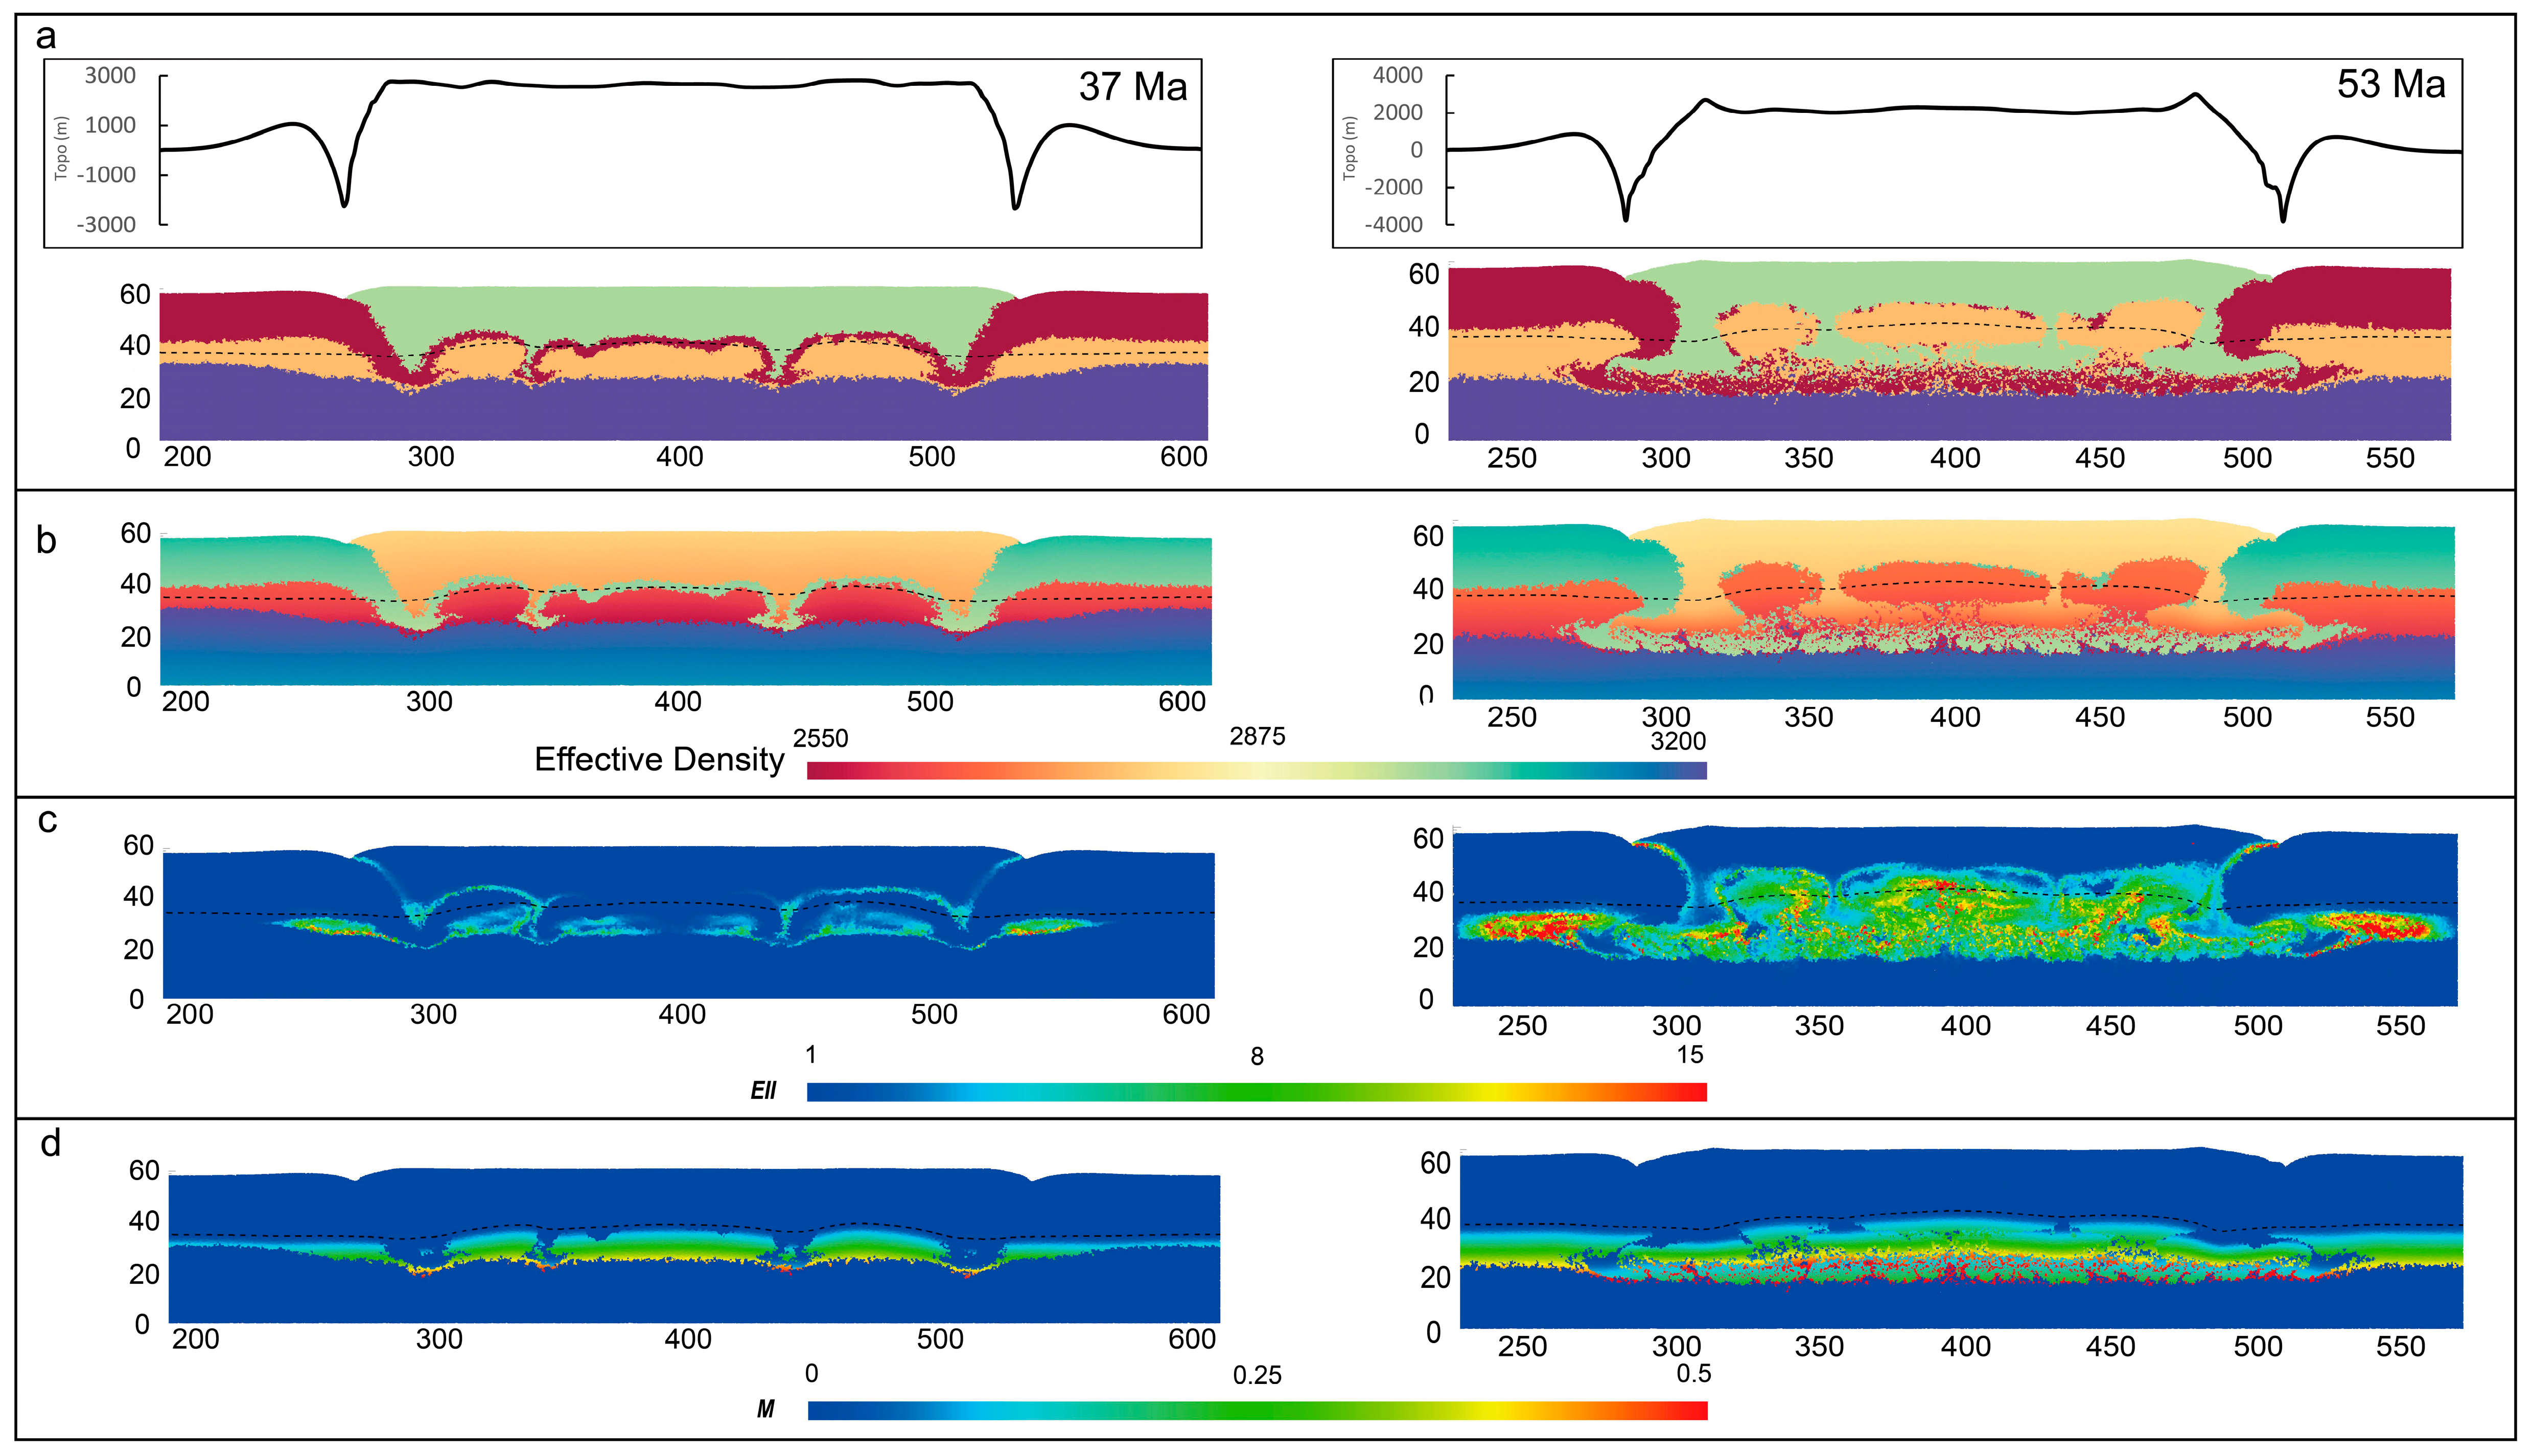
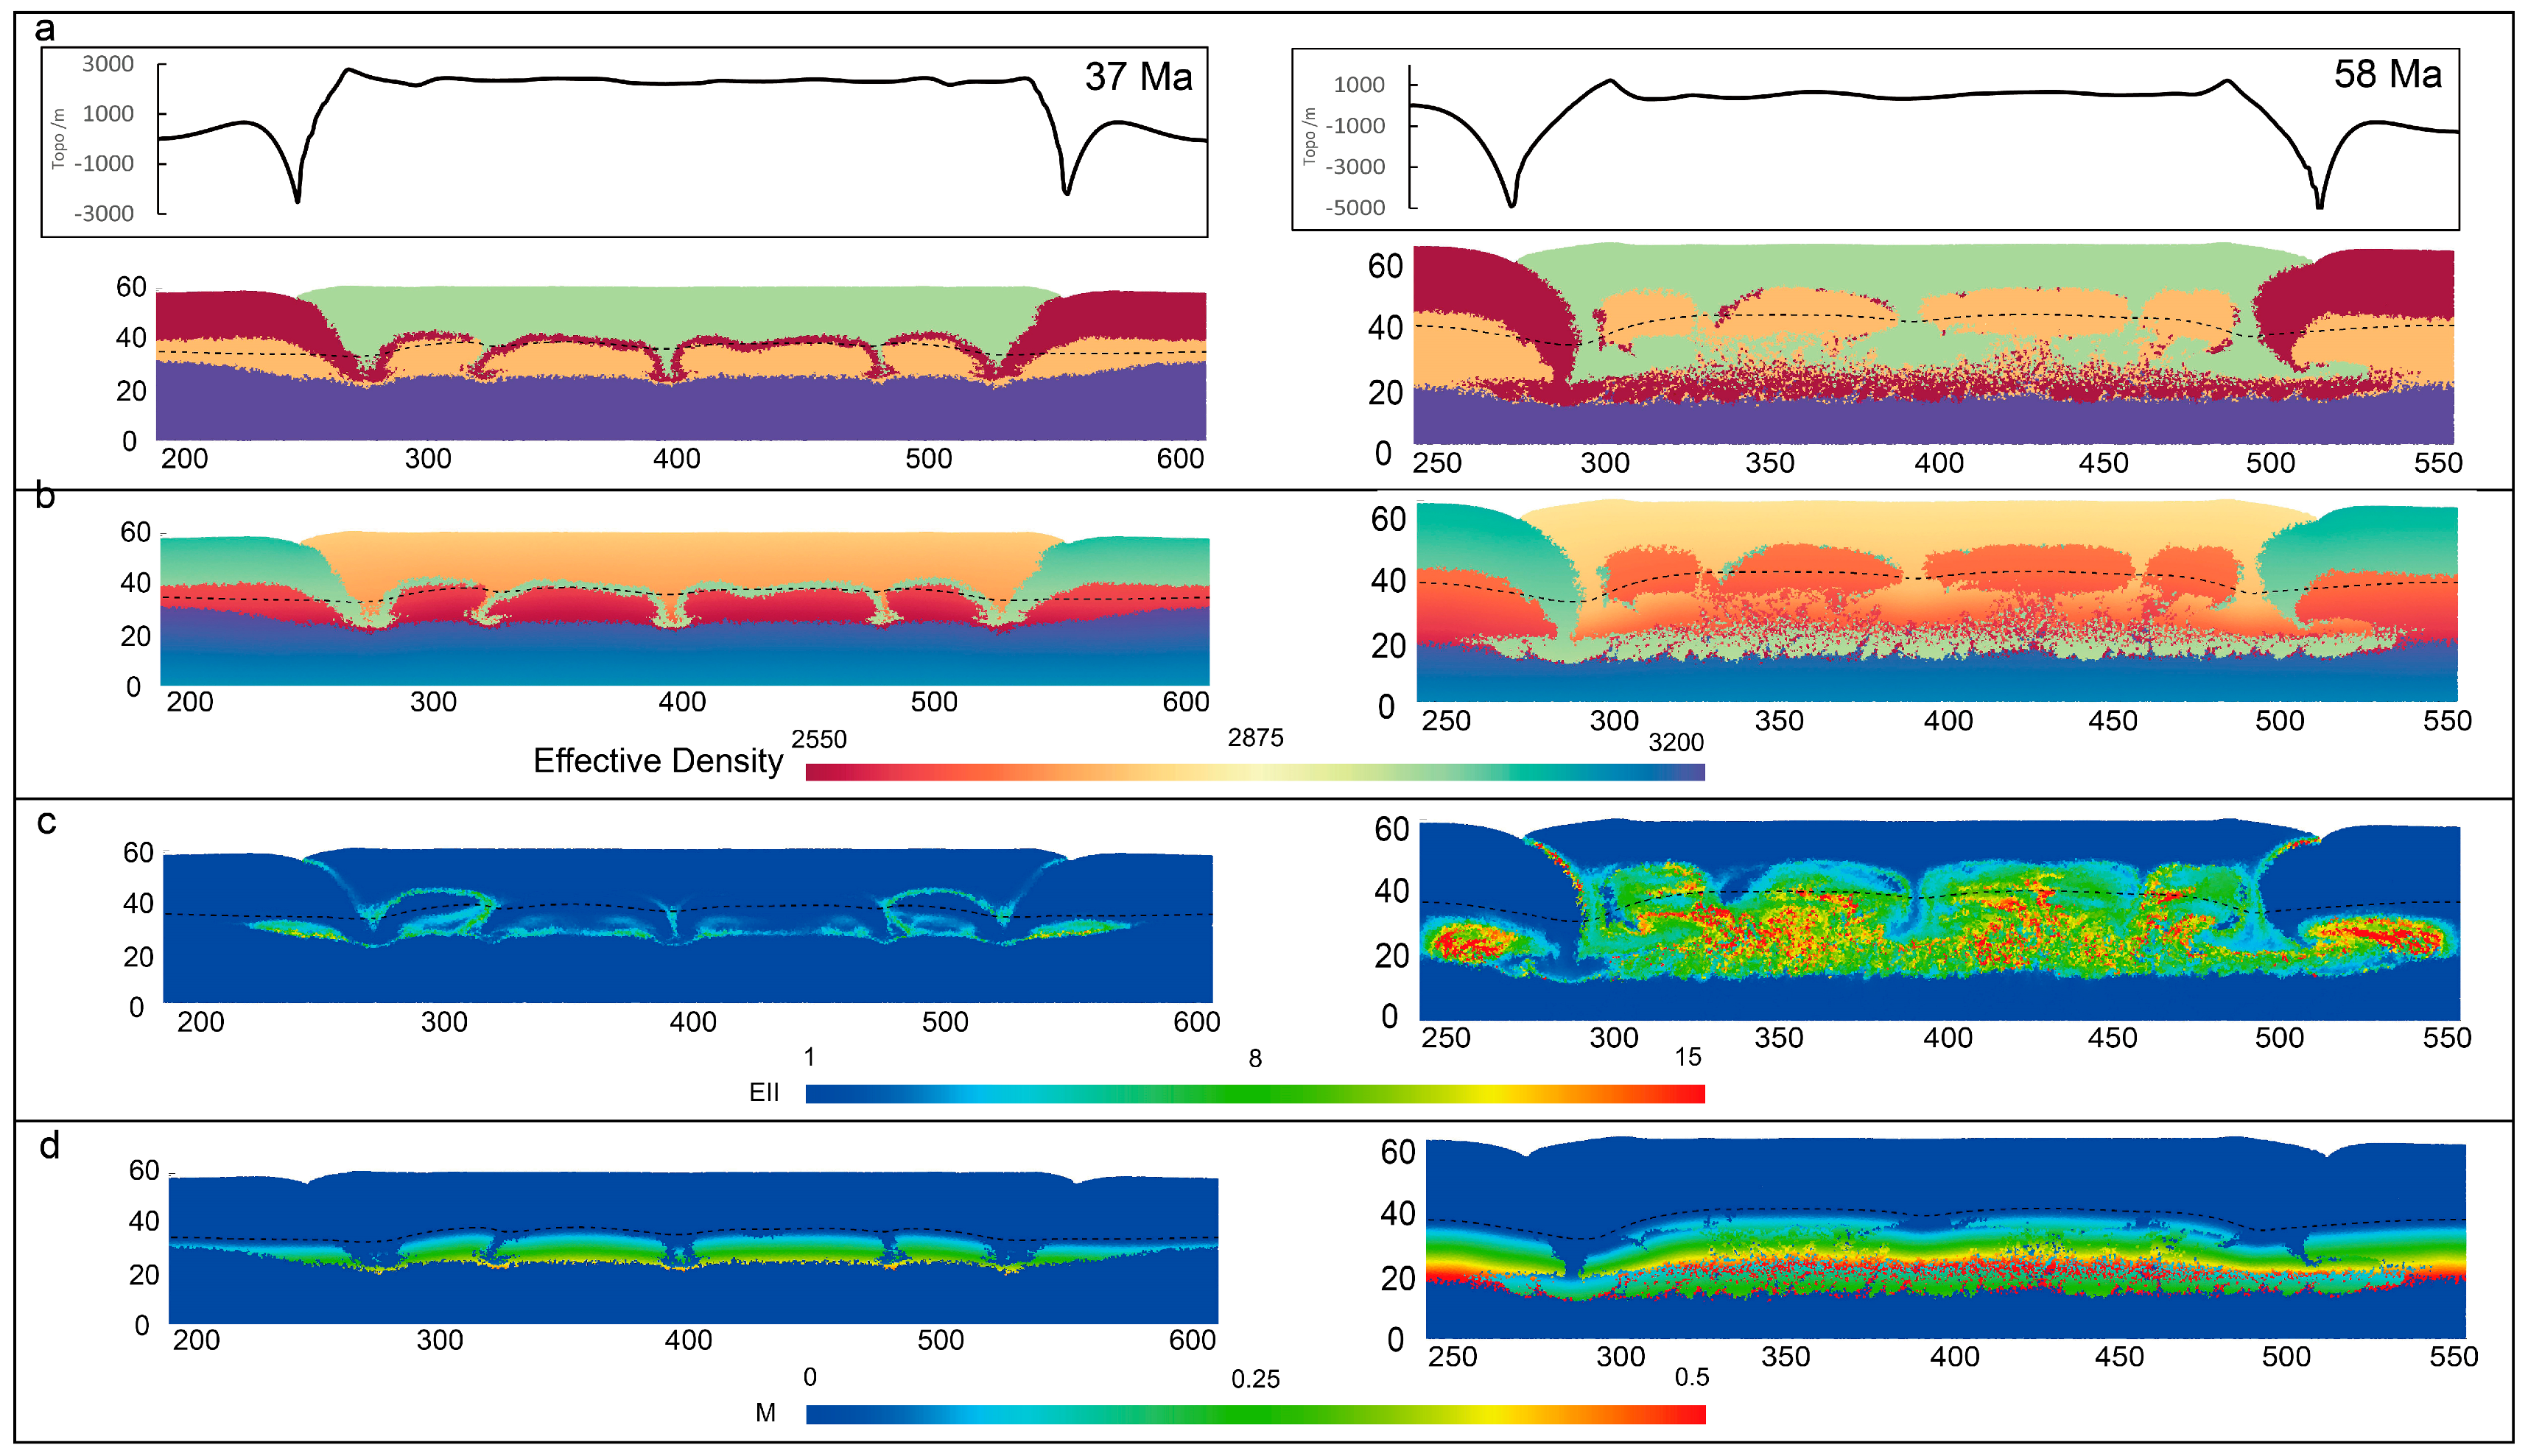
6. Thermo-Mechanical Modelling Results

Six 2D thermo-mechanical models are used to test the influence of the width of the volcano-sediment in the evolutionary geometry of diapirs made of lower crustal sources (listed in Table 2). All simulations were run in parallel on the cluster machine EOS located at CALMIP in Toulouse, France (Intel Ivy Bridge 2.8 GHz, 20 cores per node, 5 nodes used in this study).

6.1. Model200 and Model250

Model200 and Model250 show a similar single diapir resulting from the development of two and two to three crustal-scale folds (Figure 7 and Figure 8), respectively. Within the first compressional stage (Model200, about 28 Ma; Model250, 31 Ma), the competent mafic crust beneath the weak sediment develops folds. The lower crustal rocks undergo partial melting with increasing buried depth. A narrow reservoir preserving early moderate-high pressure volcano-sedimentary rocks forms between the folds (about 30–35 km deep, corresponding to about 10 kbar). The mafic layer prevents a direct contact and interaction between the lower crust and sediment rocks (Figure 7a and Figure 8a). As convergence continues, partially molten lower crustal rocks are buried to deeper depth. The gravity instabilities resulting from increasing temperature, pressure and melt fraction become significant. At about 43 Ma for Model200 (46 Ma for Model250), the less dense lower crust rocks completely break through the overlying mafic layer and ascend into the weak sediment. A diapir widely spreads and emplaces at a depth of 10–15 km. The width of the diapir is about 50 km for Model200 (70 km for Model250). High strain zones (shear) mostly focus within the center of the diapir and lower crust layer and on the left and right sides of the volcano-sediment layer (Figure 7c and Figure 8c).
Regarding the relief, the results show the surface uplifts with time in general. For Model200, the uplift and subsidence reach about 2800 m and −1500 m at 28 Ma, about 3800 m and −3300 m at 43 Ma. For Model250, the maximum uplift and subsidence reach about 2700 m and −1600 m at about 31 Ma, about 3300 m and −3300 m at 46 Ma (Figure 7a and Figure 8a).

6.2. Model290

When the width of the sediment is increased to 290 km, the mafic layer beneath the weak sediment is deformed into three crustal-scale folds by about 35 Ma. These folds have a similar width of about 50 km (Figure 9). High strain slowly concentrates in the middle fold (Figure 9c). With continuing convergence, lower crustal rocks start to ascend towards the sedimentary zone. The middle fold plays a significant role in flowing into the other two folds via formed weaknesses between neighboring folds. Two narrow zones form between the folds under compression, which exist as reservoirs to preserve high pressure volcano-sedimentary rocks. At about 50 Ma, two similar diapirs emplace at a depth of 10–15 km (corresponding to 3 kbar). The diapirs are about 50 km wide. The sedimentary rocks beneath the diapirs reach a high melt fraction of >0.5 (Figure 9d).
Regarding the relief, the results show that the position of diapir head control the distribution of uplift. The maximum uplift and subsidence reach about 2700 m and −2000 m at 35 Ma, about 2950 m and −3100 m at 50 Ma (Figure 9a).

6.3. Model350 and Model400
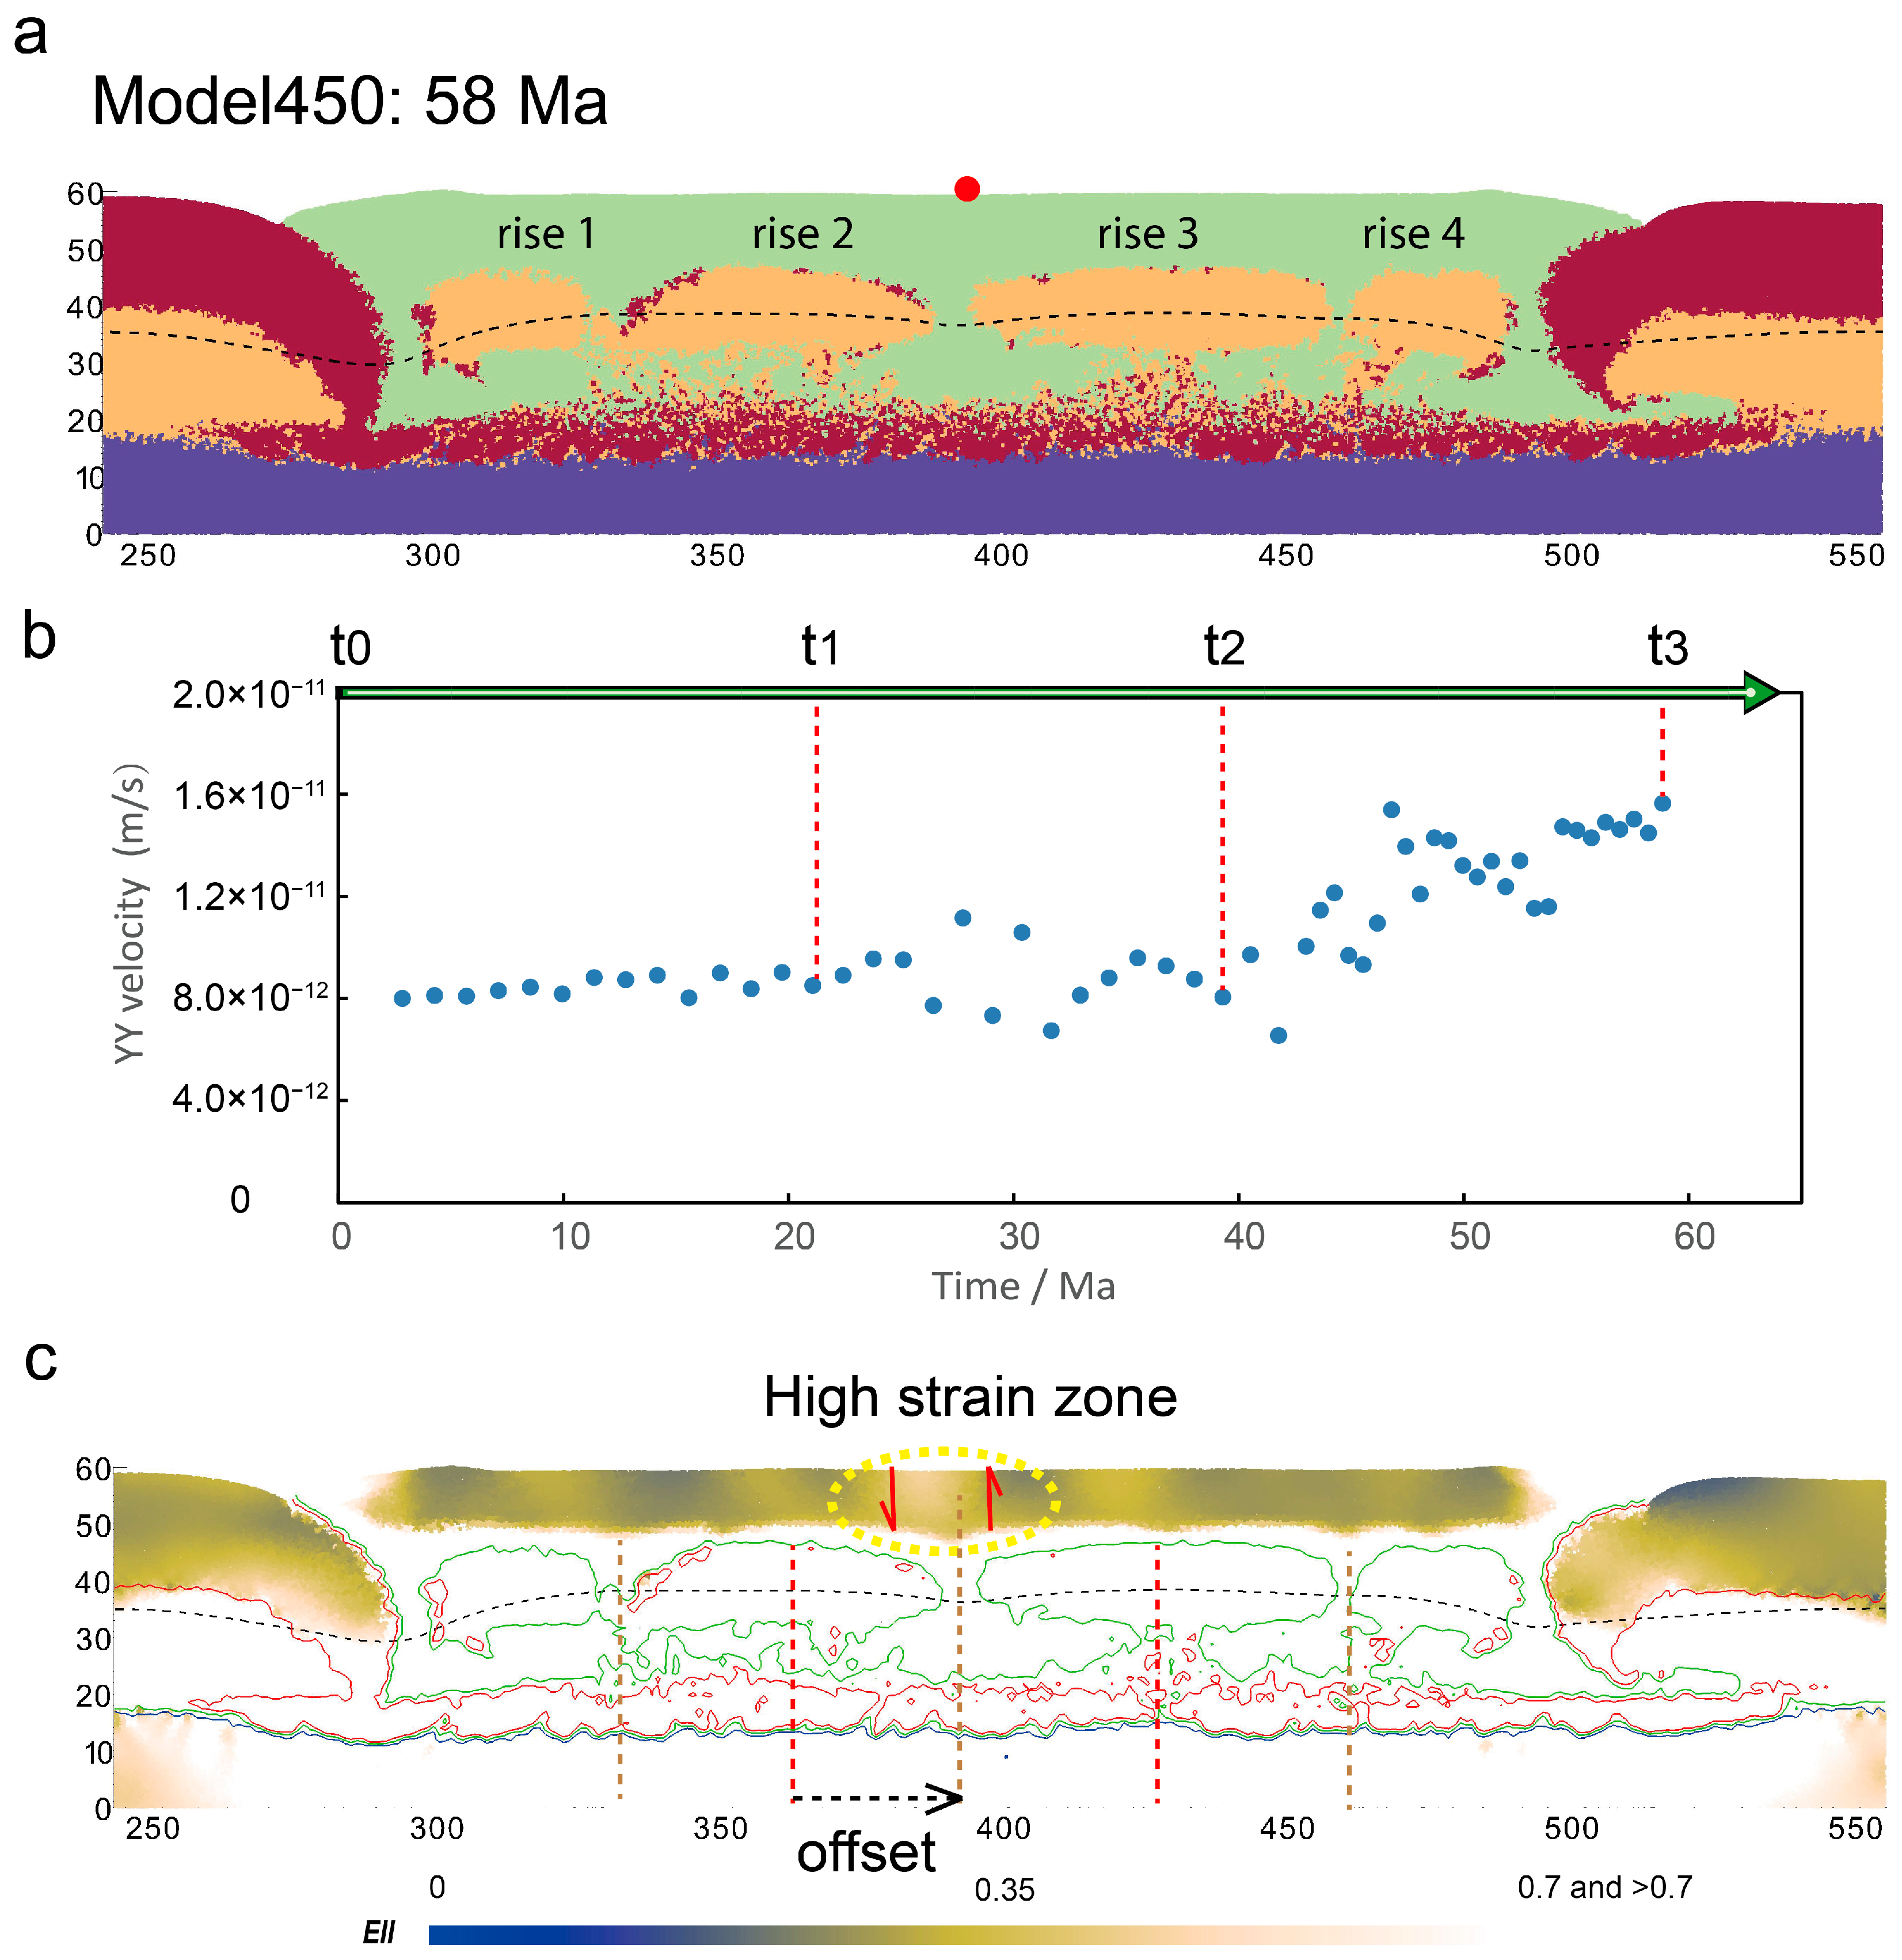
Model350 and Model400 show a similar process from folding to exhumation. A wide buckle fold is deformed into three crustal-scale folds during compression (Figure 10 and Figure 11). The middle fold has a larger size than the ones on the left and right sides. Similar to other cases displayed in Figure 7, Figure 8 and Figure 9, two narrow reservoirs are observed. They persevere much more high pressure sedimentary rocks compared to the scenarios in Model200, Model250 and Model290. These persevered sedimentary and lower crustal rocks start to undergo partial melting with increasing burial depth. For Model350, the width of folds is about 50–70 km. For Model400, the width of the folds ranges between 30 and 100 km. At 36 Ma, the lower crustal rocks start to break completely through the overlying mafic layer due to the fact that the force instabilities become more significant. At 53 Ma, three diapirs completely break through the mafic layer and emplace in the sediment layer. No interaction between two neighboring diapirs occurs during the processes of folding-exhumation, which is different from what was observed in cases Model200, Model250 and Model290. The widths of diapirs are 30–50 km in Model350 and 30–80 km in Model400 (Figure 10 and Figure 11).
For Model350, the maximum uplift and subsidence yield about 2800 m and −2000 m at 36 Ma, 3100 m and −3700 m at 53 Ma, respectively. For Model400, the maximum uplift and subsidence yield about 2800 m and −2300 m at 37 Ma, about 3000 m and −3800 m at 53 Ma (Figure 10a and Figure 11a).

6.4. Mode450

When the width of volcano-sediment layer is set to 450 km, a large buckle fold is deformed into four crustal-scale folds by about 37 Ma during compression (Figure 12). Two wide folds are in the middle of the model domain, which are about 70–80 km wide. Two smaller ones are about 30–40 km wide. Three reservoirs preserving high pressure volcano sedimentary rocks form between the neighboring folds as convergence continues (the maximum burial depth of sedimentary rocks is up to about 35 km, melt fraction is about 0.3–0.4). High strain zones mainly focus in the smaller folds and the reservoirs. The accumulation ( E I I ) of the second invariant of the strain rate ranges between 6 and 10 (Figure 12c).
At about 58 Ma, two groups of diapirs distinguished by their sizes ascend into the overlying weak volcano-sediment layer and emplace at a depth of about 10–15 km. Neighboring diapirs are separated by about five (between the two diapirs on the left or right sides) −10 km (between the two middle ones) wide sedimentary rocks. The mafic crustal layer bends and intrudes into the lower crust layer. The maximum uplift and subsidence yield about 2500 m and −2500 m at 37 Ma. At 58 Ma, the maximum uplift and subsidence yield about 1200 m and −5400 m, respectively.

7. Discussion

7.1. The Mantle Potential Temperature

Modern orogenic belts (the Alpine or Himalayan orogenic belts) are the loci of singular mineralization, proceeding at High-Pressure and Low-Temperature conditions. The proceeded conditions are within the blueschist and greenschist metamorphic facies series [56,57]. The apparent lack of High-Pressure rocks before the Neoproterozoic time (1000–540 Ma) is still a key debate challenging the existence of modern subduction zones in the Archaean (ca. 4.00–2.50 Ga) and Paleoproterozoic (ca. 2.50–1.80 Ga) times [58].
The mechanical strength of the continental lithosphere evolves over geological time and space, and is primarily influenced by the secular cooling effect of Tp [59,60,61]. The Tp in the WAC during the Eburnean Orogeny, ranges between 1500 and 1600 °C (Figure 4). Using an estimated cooling rate of 40–60 °C/Ga [62], this suggests that the Tp could probably reach about 1550–1700 °C in the Archaean time in the WAC. This is in good agreement with the global Tp estimates since ca. 0–4 Ga performed by Herzberg et al. [40]. Moderate thermal conditions in the mantle certainly help to maintain strongest lithospheres in the Paleoproterozoic times in the WAC. We could further speculate that a strongest lithosphere will help to maintain a thickest crust characterized by coolest thermal gradients and that thicker crustal sections might preferentially host large and deepest sedimentary basins. Last but not the least, lower temperatures in the mantle will propagate to lower magma production that will stall and evolve at different depths in the lithospheric section, resulting in the more differentiated magma as granitoids.
The maximum thickness of the lithosphere in West Africa is estimated between 300 and 350 km in the Archaean time and decreased to 200 ± 50 km in the early Proterozoic time [62,63,64]. This decrease probably resulted from delamination processes. The thickness of the lithosphere in the early Proterozoic time is roughly in good agreement with the estimated thickness using the pressure of initial melting of primary magmas given in Figure 5 (ranging between 3.7 and 5.2 GPa, corresponding to a depth of about 120–170 km in the WAC). The crust in Archaean province becomes thinner and less dense [65,66,67] resulting from the thermal weakening of the underlying convective mantle [68,69]. In some Paleoproterozoic regions, arcs form thickened crust. In the WAC, we suggest that the protracted magmatic activities prior to ca. 2.20 Ga were probably not sufficient to thicken the Birimian crust during the continental plate subduction. This was due to the fact that paleo-subduction slabs commonly dipped steeper [68] and shallower compared to present-day subduction processes [70,71,72]. From ca. 2.15 Ga (corresponding to the D1 deformation phase during the Eburnean Orogeny), active margins were dominated by collisional processes (arcs amalgamation) rather than the previously dominant slab-driving subduction (arcs forming) processes [1,4]. The collisional processes were characterized by the extensive occurrences of buckling and folding resulting from shortening deformation phases [73]. This major geodynamic change further promoted the processes of crustal thickening and led to the formation of over 40 km [9] thick Birimian crust.

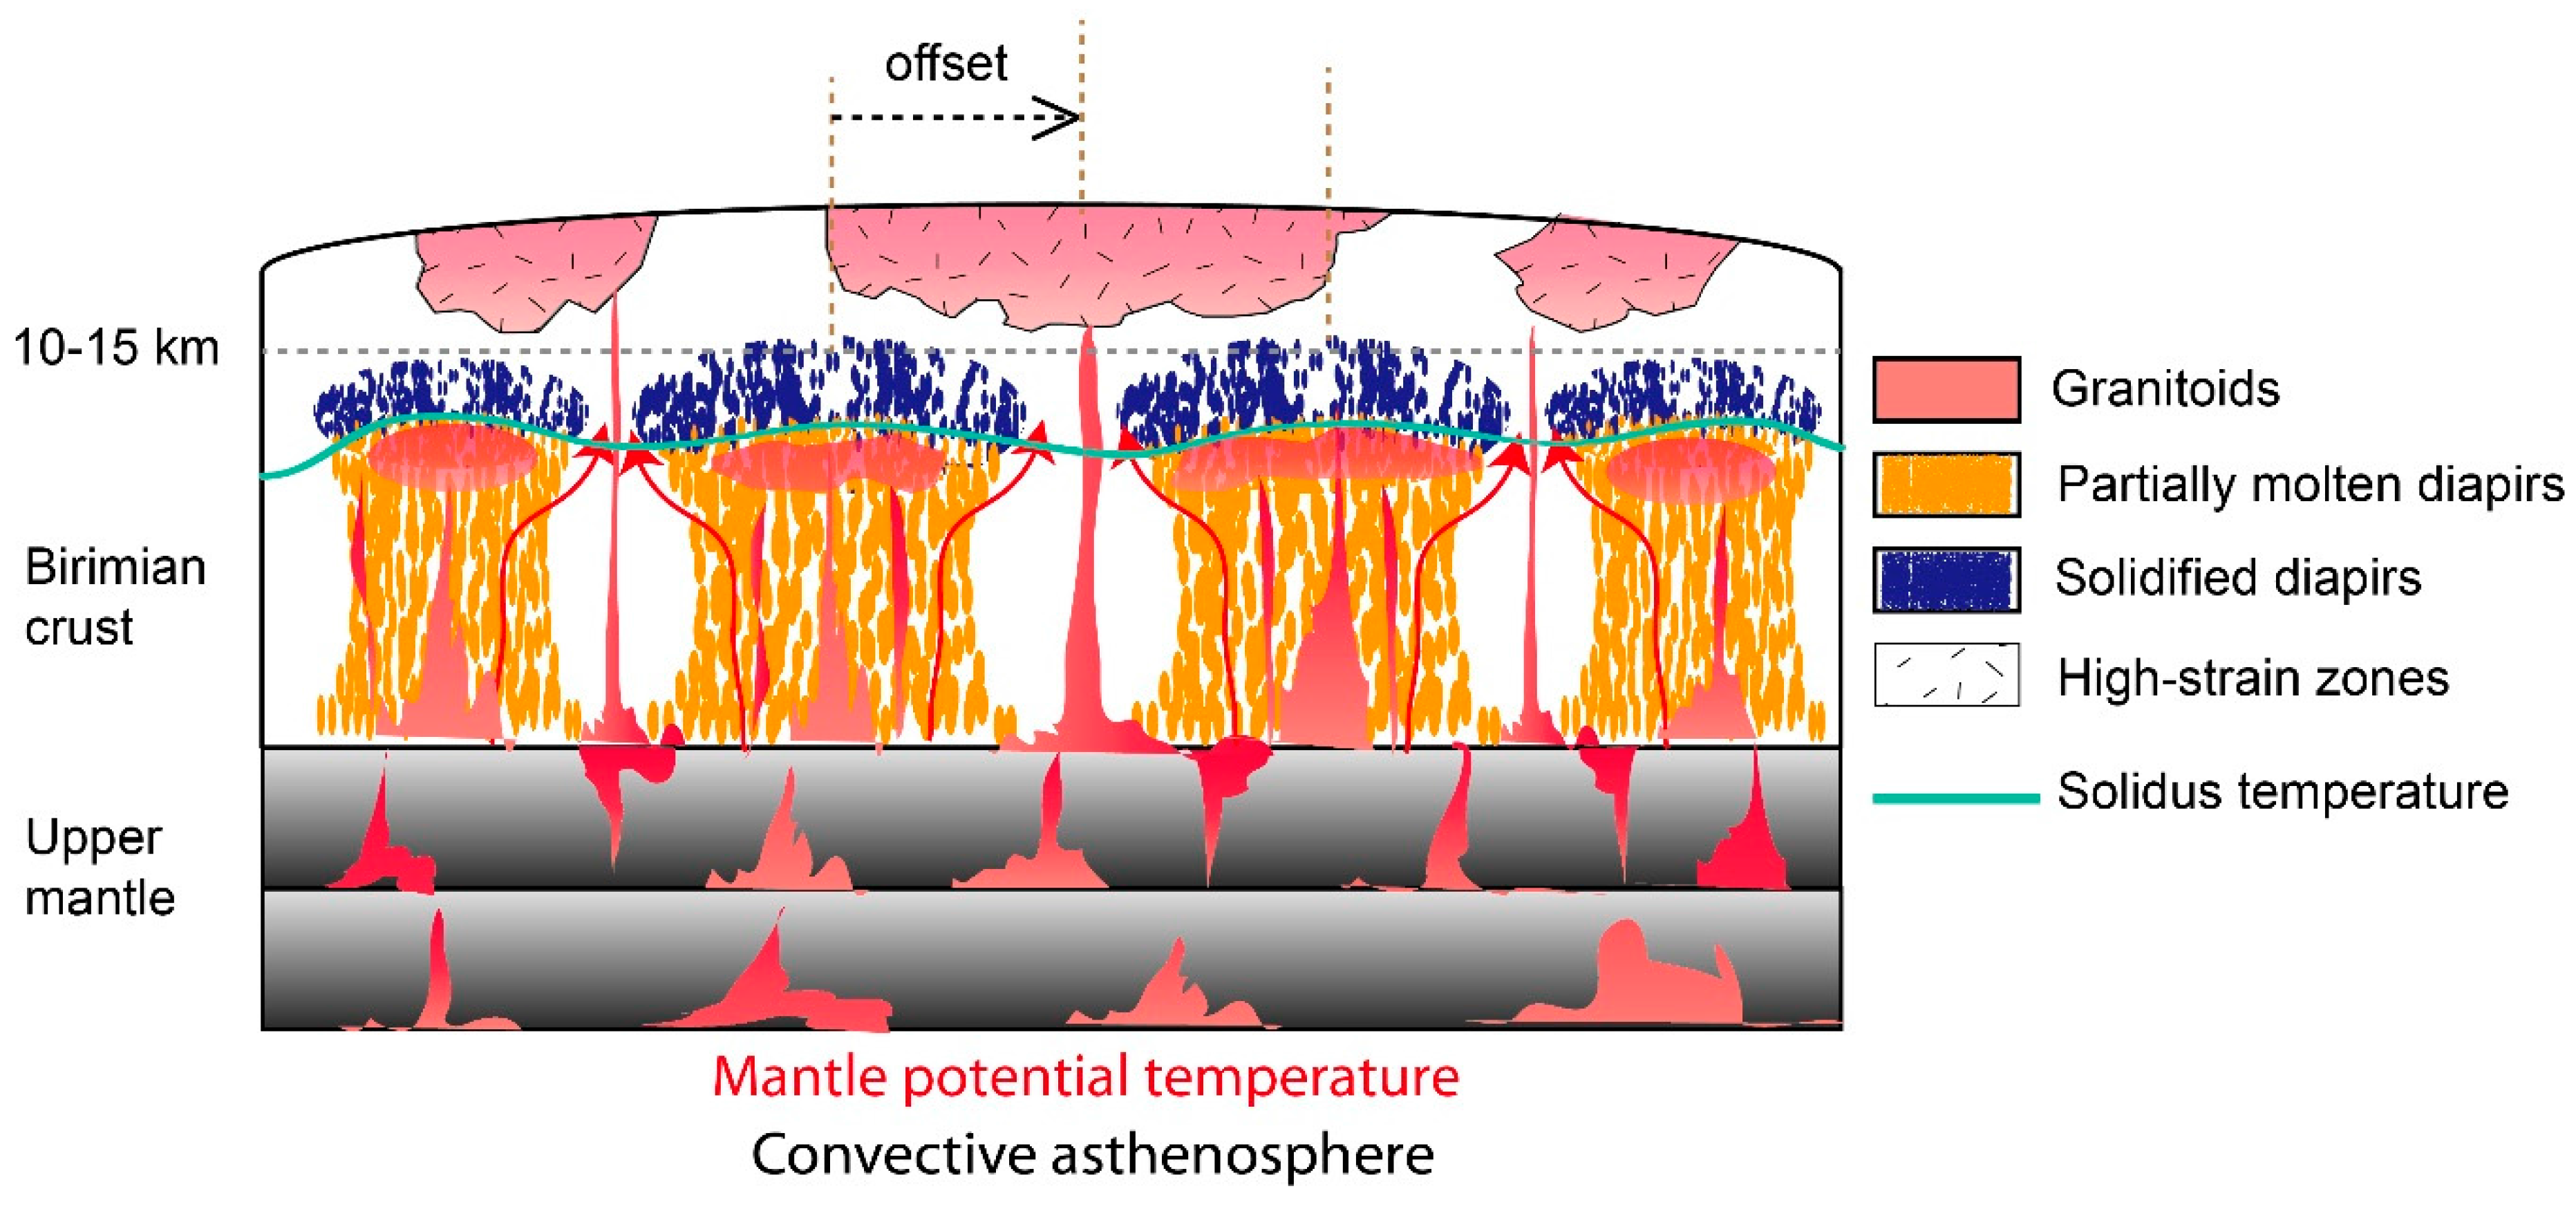
7.2. A New Tectonic Scenario

In the Baoulé–Mossi domain, the dominant structures of greenstone–granitoid belts are shown in Figure 13a. The greenstone belts (thus the Ba-KM-GFBF, Ho-BM-OF and LW belts) were intruded and separated by several episodic pulses of granitoid intrusions made of small increments during the Eburnean Orogeny (more details on radiometric ages of granitoids can be found in Baratoux et al. [1]. Different tectonic models used to account for the structural evolution in the Nassian and Western Burkina Faso domains were proposed by Vidal et al. [16] and Baratoux et al. [1], respectively (Figure 13b,c). The tectonic scenario proposed by Baratoux et al. [1] on the basis of using closely-separated slabs or a flat slab is still under debate, as the melting at the origin of arc volcanism generally initiates at a depth of 100 km and not at several locations along the slab [74]. The main difference between the two tectonic models is the role of compressional versus gravitational forces in deforming the greenstone–granitoid belts. The granitoid intrusions between adjacent belts are 30–90 km wide (indicated by yellow dotted ellipses in Figure 13a). The mechanisms of the formation of such granitoids and their origins are still an open question due to the debates on the geodynamic and tectonic regimes in the WAC.
Our results (Model450, Figure 14a) show that four diapirs widely spread in the middle crust and are mechanically capped by the upper crust. The uplift increases in a relatively constant and low rate in the period of t0–t2 (Figure 14b), characterizing the process of folding. Subsequently, uplift increases in a high rate as a result of the occurrences of exhumation. High-strain zones (EII = 0.5, yellow ellipses in Figure 14c, about 30–50 km wide) are observed above the two major diapirs (rise 2 and rise 3). There is an offset of 30–50 km between the diapirs axis and the high strain zones.
According to the numerical results, we here suggest a geodynamic scenario to shed new light on the evolution of greenstone-granitoid belts (Figure 15). Granitoids correspond to evolved magma that potential differentiated in the crustal section of lithosphere (see the concept of mush column in Cashmann et al. [75] for review or Ganne et al. [76]). From a physical point of view, they are characterized by a density >2.7 kg·m−3, that is lower than much of the mafic material stored in the upper crust within volcanic belts. Density inversions (or anomalies) in the upper crust will naturally tend to promote the extraction and ascent of liquids (melt) from evolved magma reservoirs in the middle crust [76] to form small intrusions in the volcanic belts. However, depending of the rheology of the crust, it is also expected that large-scale redistribution of partially crystalized granitoids magma (mush) can take place in the upper crust, generating dome-like structures.
Our modelling suggests that a very high melt fraction of granitoids (possibly derived from either subducted mélanges, lower crust and/or mantle melting) would be accumulated at depths of subcontinental mantle. Since the gravitational instabilities resulting from density and viscosity contrasts [4] become significant as compression continues, the granitoids would ascend and intrude into the upper crust through some potentially weak zones. In our models, high strain zones (Figure 7c, Figure 8c, Figure 9c, Figure 10c, Figure 11c and Figure 12c) are largely produced within the diapirs. The diapirs are made of upper solidified lids and lower partially molten materials because of the distribution of the solidus temperature of the lower crust (Figure 12 and Figure 15). This indicates that the granitoids (red flows in Figure 15) would canalize along the partially molten parts of diapirs before feeding the upper crust. When the granitoids arrive at the solidified lids of the diapirs (dark blue segments in Figure 15), they could not directly intrude the upper crust due to the high resistance of solidified lids of diapirs to deformation. Therefore, some potential weaknesses would be required to channelize the granitoids into the upper crust.
Over the compressional stage, a large amount of strain is concentrated in volcano-sedimentary rocks which are mostly preserved in between the diapirs. These preserved volcano-sedimentary rocks must be mechanically weak compared to the solidified lids of diapirs (Figure 14 and Figure 15). Therefore, we suggest that the ascending granitoids capped by the solidified lids of diapirs would favour migrating horizontally and intruding into the upper crust via the weakness zones between diapirs (numerical results shown in Figure 14, diagram shown in Figure 15). When the granitoids pass through the weakness zones, high strain zones (Figure 14c) produced above the weakness zones between diapirs in the upper crust would become preferential reservoirs/sites (granitoids areas filled by dashes in Figure 15) for emplacement of the granitoids (they constitute the so-called granitoid belts).

7.3. Implications for the Birimian Crust

The granitoids (plutonic activity) play a dominant role in continental growth throughout geological time [77,78,79,80]. Granitoids can either be derived from the melting of subduction slabs [81,82], re-melting in the progressively thickened lower mafic crust [83,84,85] and mantle melting. However, in the Birimian terrane, the origin of granitoids remains uncertain due to the fact that the geodynamic and tectonic regimes is still a matter of debate. In terms of the spatial-temporal evolution of greenstone-granitoid belts in the WAC, if we agree with the model (Figure 15), this indicates that the pluton bodies in this region are assembled by a series of sheet-like intrusions (constituted by many continuous small magmatic pulses). This sheet-like intrusion model coincides well with our field works according to geochronological data, the current geochronological data available for West Africa (i.e., the Boromo, Houndé belts and neighbouring magmatic terranes) suggests small continuous magmatic episodes in anyone region rather than a single large pulse [1,4]. (more detailed radiometric ages of rocks can be found in Baratoux et al. [1]).
This model also suggests that the diapirs (made of lower crustal rocks) produced by Ganne et al. [4] and by this present work might be widely emplaced in the middle crust. The geometry of the solidified lids of the diapirs would have a significant impact on migration and percolation of granitoids. At the same time, a dissymmetry of structures is suggested between the upper and middle-lower segments of crust, with the dome-like granitoids overlying high-grade sedimentary synforms and high-grade diapirs underlying low-grade greenstone belts (Figure 15).
Our modelling results show that a partial melting zone, fueled by burial of felsic materials, is partially redistributed as a result of gravitational instabilities in the middle crust. The partially molten rocks (lower crustal sources) blocked at a depth of about 10–15 km in the middle crust, creating a retention zone, which could have contributed to a mechanical decoupling between the upper and middle crust [86]. Such a partitioning of the crust, preventing the recycling of early formed rocks, could explain the local preservation of cold thermal gradients (10–15 °C/km) in some parts of the Birimian terranes [56] as well as some archaic feature (dome and basin architecture in the Tera area in Niger). Conversely, this mechanical isolation could have progressively led to a chemical homogenization in the middle and lower parts of the Birimian crust.

7.4. Limitations and Perspectives

To improve the model assumptions, we aim to develop asymmetric models by including asymmetric volcano-sedimentary basins [87]. This improvement will help to reveal more realistic patterns of deformation of greenstone-granitoid belts. For partial melting, it was modelled by a linear function of temperature [4,51,88]). In future models, we aim to fully output the metamorphic data calculated with the Perple-x code and directly input it into the numerical model. This can improve the relationship between partial melting and temperature of rocks. In addition, more parametric tests (i.e., viscosity and density contrasts) and field constraints (geophysics, geochemistry, radiometric dating and coupling the upwelling processes of granitoids) should be considered in future models. 3D modeling remains necessary in order to study the transpressional regime and the associated formation of strike-slips that would possibly be located along the high shear zones of this 2D modelling.
Regarding the decreasing effect of viscosity due to partial melting, Vanderhaeghe, [86] revealed that the effective viscosity of partially molten rocks ranges between 106 (M = 1) and 1018 Pa·s ( M = 0.1). In the present paper, the effective viscosity of partially molten material is still overestimated and ranges between 6 × 10¹⁷ Pa·s (M = 1) and 8 × 10¹⁸ Pa·s ( M = 0.1) [4]. According to the difference in viscosity of partially molten rocks between our models and natural cases, the deformation of molten rocks in the models must show more resistance to deformation compared to natural cases. The overestimated viscosity of the partially molten rocks also indicates that the solidified lids of the diapirs produced in this study (Figure 15) may be emplaced in some regions at depths shallower than the depth presented in the model (10–15 km deep).
High strain zones are always thought to play a significant role in dragging fluid and feeding the upper crust from deeper sources. However, the numerical model presented here still cannot model the transfer process of fluid due to the present software limitation [89]. This limitation can be improved soon if we could employ a two-phase fluid-solid software package.

8. Conclusions

In this study, we reported the Tp estimates for the WAC during the Eburnean Orogeny (ca. 2.20–2.00 Ga). The Tp results yield 1500–1600 °C. The pressures of initial (Pi) and final (Pf) melting yield about 3.7–5.2 GPa (corresponding to a depth of about 120–170 km) and 1–1.3 GPa, respectively. Melt fraction for accumulated fractional melting ranges between 0.29 and 0.34.
2D thermo-mechanical models were used to explore the width of volcano-sedimentary basin on the geometrical evolution of diapirs made of lower crustal rocks under compression. The models show that the thin mafic crust layer beneath the sediment is deformed into a large buckle fold during the early compressional stage, with a constant rate of uplift. Subsequently, relief grows in an increasing rate when the emplacement of diapirs occurs.
Benefitting from the mantle temperature, the pressure estimates and the numerical modelling results, a new geodynamic model was constructed to account for the evolution of deformation of greenstone-granitoid belts in the WAC during the Eburnean Orogeny (ca. 2.2–2.0 Ga). This model suggests that, a series of sheet-like granitoid flows possibly derived from subducted mélanges, lower crust and/or mantle melting accumulated at depths of subcontinental mantle would channel along the diapirs before feeding the upper crust. When the granitoids arrive at the solidified lids of diapirs, they would favor migrating horizontally and intrude into the upper crust through the weakening zones between diapirs.
This model also suggests an asymmetry of structures between the upper and middle-lower crust, with the dome-like granitoids overlying high-grade sedimentary synforms and high-grade diapirs underlying low-grade greenstone belts. High grade partially molten rocks may be widely capped by a resistant upper crust at a depth of about 10–15 km in the Leo–Man Shield.

Acknowledgments

Mark Jessell is warmly thanked for fruitful discussions and encouragements at different stages of the paper. The Project Funded by the Priority Academic Program Development of Jiangsu Higher Education Institutions (PAPD). We thank the development teams at the Victorian Partnership for Advanced Computing (VPAC) and Monash University for technical assistance with the software Underworld. This work was granted access to the High-Performance Computing resources of both the French supercomputing centre, CCRT of the French Nuclear Agency and the regional computing centre, CALMIP in Toulouse, France. We also thank the GEOROC (http://georoc.mpch-mainz.gwdg.de/georoc/) and WAXI project groups for kindly providing mafic magma dataset. Figures are plotted using open source package Visit developed by the Lawrence Livermore National Laboratory. Two anonymous reviewers are warmly thanked for providing very useful comments, which greatly improve the paper.

Author Contributions

X.F. and J.G. conceived and designed the experiments; X.F. performed the experiments; X.F. and E.W. analyzed the data; X.F. wrote the paper., X.F., E.W., P.A., R.M. and J.G. contribute to discussion.

Conflicts of Interest

The authors declare no conflict of interest.

Appendix A

Table A1. The bulk compositions of original samples used to estimate the Tp in the WAC (Ca. 2.2–2.1 Ga).
ReferenceHirdes et al. [28]Ama Salah et al. [25]Thomas et al. [29]Galipp et al. [27]Ama Salah et al. [25]Soumaila [26]Soumaila [26]
Sap_ID 1074AS-393EC2036KG 18AS-5755810
LocationGhana
Sefwi Belt
Niger
Nigerian iptako
Ghana
Wa-Larwa Belt
Ghana
Sefwi Belt
Niger Nigerian LiptakoNiger
Nigerian Liptako (Zawa Tondi)
Niger
Nigerian Liptako (Zawa Tondi)
Rock TypeBASALTBASALTBASALTBASALTBASALTBASALTBASALT
latitude613.59.6666.0813.51414
longitude−2.81.5−2.46−2.951.511
SiO249.3450.2950.1350.6249.1850.1851.06
TiO20.3430.310.440.620.280.550.53
Al2O314.5816.2514.0614.2314.0314.2413.3
FeOTotal9.098.6570719.49.6410.573039.1358.856
MnO0.1640.160.1620.170.190.160.17
MgO8.647.979.778.629.649.038.79
CaO13.00912.8413.2112.3912.6612.4111.95
Na2O21.41.461.851.231.432.42
K2O0.1880.010.280.10.080.130.32
P2O50.0340.040.030.070.140.160.15
LOI2.12.3101.821.911.471.33

References

  1. Baratoux, L.; Metelka, V.; Naba, S.; Jessell, M.W.; Grégoire, M.; Ganne, J. Juvenile Paleoproterozoic crust evolution during the Eburnean orogeny (∼2.2–2.0 Ga), western Burkina Faso. Precambrian Res. 2011, 191, 18–45. [Google Scholar] [CrossRef]
  2. Condie, K.C. Greenstones through time. In Archaean Crustal Evolution; Elsevier: Amsterdam, The Netherlands, 1997; Volume 11, pp. 85–120. [Google Scholar]
  3. Condie, K.C. Plate Tectonics and Crustal Evolution; Elsevier: Amsterdam, The Netherlands, 2013; pp. 99–104. [Google Scholar]
  4. Ganne, J.; Gerbault, M.; Block, S. Thermo-mechanical modeling of lower crust exhumation—Constraints from the metamorphic record of the Palaeoproterozoic Eburnean orogeny, West African Craton. Precambrian Res. 2014, 243, 88–109. [Google Scholar] [CrossRef]
  5. Glazner, A.F.; Bartley, J.M.; Coleman, D.S.; Gray, W.; Taylor, R.Z. Are plutons assembled over millions of years by amalgamation from small magma chambers? GSA Today 2004, 14, 4–11. [Google Scholar] [CrossRef]
  6. Bittner, D.; Schmeling, H. Numerical modelling of melting processes and induced diapirism in the lower crust. Geophys. J. Int. 1995, 123, 59–70. [Google Scholar] [CrossRef]
  7. Petford, N.; Cruden, A.R.; McCaffrey, K.J.W.; Vigneresse, J.L. Granite magma formation, transport and emplacement in the Earth’s crust. Nature 2000, 408, 669–673. [Google Scholar] [CrossRef] [PubMed]
  8. Miller, C.F.; Watson, E.B.; Harrison, T.M. Perspectives on the source, segregation and transport of granitoid magmas. Trans. R. Soc. Edinb. Earth Sci. 1988, 79, 135–156. [Google Scholar] [CrossRef]
  9. Block, S.; Ganne, J.; Baratoux, L.; Zeh, A.; Parra-Avila, A.L.; Jessell, M.; Ailleres, L.; Siebenaller, L. Petrological and geochronological constraints on lower crust exhumation during Paleoproterozoic (Eburnean) orogeny, NW Ghana, West African craton. J. Metamorph. Geol. 2015, 33, 463–494. [Google Scholar] [CrossRef]
  10. Jessell, M.W.; Amponsah, P.O.; Baratoux, L.; Asiedu, D.K.; Loh, G.K.; Ganne, J. Crustal-scale transcurrent shearing in the Paleoproterozoic Sefwi-Sunyani-Comoé region, West Africa. Precambrian Res. 2012, 212–213, 155–168. [Google Scholar] [CrossRef]
  11. Oberthür, T.; Vetter, U.; Davis, D.W.; Amanor, J.A. Age constraints on gold mineralization and Paleoproterozoic crustal evolution in the Ashanti belt of southern Ghana. Precambrian Res. 1998, 89, 129–143. [Google Scholar] [CrossRef]
  12. De Kock, G.S.; Armstrong, R.A.; Siegfried, H.P.; Thomas, E. Geochronology of the Birim Supergroup of the West African craton in the Wa-Bolé region of west-central Ghana: Implications for the stratigraphic framework. J. Afr. Earth Sci. 2011, 59, 1–40. [Google Scholar] [CrossRef]
  13. Milési, J.P.; Ledru, P.; Feybesse, J.L.; Dommanget, A.; Marcoux, E. Early Proterozoic ore deposits and tectonics of the Birimian orogenic belt, West Africa. Precambrian Res. 1992, 58, 305–344. [Google Scholar] [CrossRef]
  14. Hirdes, W.; Davis, D.W.; Lüdtke, G.; Konan, G. Two generations of Birimian (Paleoproterozoic) volcanic belts in northeastern Côte d’Ivoire (West Africa): Consequences for the “Birimian controversy”. Precambrian Res. 1996, 80, 173–191. [Google Scholar] [CrossRef]
  15. Vidal, M.; Delor, C.; Pouclet, A.; Simeon, Y.; Alric, G. Evolution géodynamique de l‘Afrique de l‘Ouest entre 2.2 Ga et 2 Ga; le style archéen’ des ceintures vertes et des ensembles sedimentaires birimiens du nord-est de la Côte-d’Ivoire. Bulletin de la Société géologique de France 1996, 167, 307–319. [Google Scholar]
  16. Vidal, M.; Gumiaux, C.; Cagnard, F.; Pouclet, A.; Ouattara, G.; Pichon, M. Evolution of a Paleoproterozoic weak type orogeny in the West African Craton (Ivory Coast). Tectonophysics 2009, 477, 145–159. [Google Scholar] [CrossRef] [Green Version]
  17. Doumbia, S.; Pouclet, A.; Kouamelan, A.; Peucat, J.J.; Vidal, M.; Delor, C. Petrogenesis of juvenile-type Birimian (Paleoproterozoic) granitoids in Central Côte-d’Ivoire, West Africa: Geochemistry and geochronology. Precambrian Res. 1998, 123, 47–65. [Google Scholar] [CrossRef]
  18. Feybesse, J.L.; Billa, M.; Guerrot, C.; Duguey, E.; Lescuyer, J.L.; Milesi, J.P.; Bouchot, V. The paleoproterozoic Ghanaian province: Geodynamic model and ore controls, including regional stress modeling. Precambrian Res. 2006, 149, 149–196. [Google Scholar] [CrossRef]
  19. Hein, K.A.A. Succession of structural events in the Goren greenstone belt (Burkina Faso): Implications for West African tectonics. J. Afr. Earth Sci. 2010, 56, 83–94. [Google Scholar] [CrossRef]
  20. Leube, A.; Hirdes, W.; Mauer, R.; Kesse, G.O. The early Proterozoic Birimian Supergroup of Ghana and some aspects of its associated gold mineralization. Precambrian Res. 1990, 46, 139–165. [Google Scholar] [CrossRef]
  21. Agyei Duodu, J.; Loh, G.K.; Boamah, K.O. Geological Map of Ghana 1:1,000,000; Geological Survey Department of Ghana (GSD): Accra, Ghana, 2009.
  22. Amponsah, P.O.; Salvi, S.; Béziat, D.; Siebenaller, L.; Baratoux, L.; Jessell, M.W. Geology and geochemistry of the shear hosted Julie deposit, NW Ghana. J. Afr. Earth Sci. 2015, 112, 505–523. [Google Scholar] [CrossRef]
  23. Lüdtke, G.; Hirdes, W.; Konan, G.; Koné, Y.; Yao, C.; Diarra, S.; Zamblé, Z. Géologie de la région Haute Comoé Nord—Feuilles Kong (4b et 4d) et Téhini-Bouna (3a à 3d); Bulletin 1; Bundesanstalt für Geowissenschaften und Rohstoffe: Hanover, Germany, 1998. [Google Scholar]
  24. Milési, J.P.; Feybesse, J.L.; Pinna, P. Geological map of Africa 1:10,000,000, SIGAfrique project. In Proceedings of the 20th Conference of African Geology, Orleans, France, 2–7 June 2004. [Google Scholar]
  25. Ama Salah, I.; Liegeois, J.P.; Pouclet, A. Evolution of a Birimian oceanic island arc of Nigerian liptako (Sirba): Geology, geochronology and geochemistry. J. Afr. Earth Sci. 1996, 22, 235–254. [Google Scholar] [CrossRef]
  26. Soumaila, A. Etude Structurale, Pétrographique et Géochimique de la Ceinture Birimienne de Diagorou-Darbani Liptako, Niger Occidental (Afrique de l’ouest). Ph.D. Thesis, Université de Franche-Comté, Besançon, France, 2000. [Google Scholar]
  27. Galipp, K.; Klemd, R.; Hirdes, W. Metamorphism and geochemistry of the Paleoproterozoic Birimian Sefwi volcanic belt (Ghana, West Africa). Geol. Jahrb. 2003, 111, 151–191. [Google Scholar]
  28. Hirdes, W.; Konan, K.G.; N’Da, D.; Okou, A.; Sea, P.; Zamble, Z.B.; Davis, D.W. Geology of the Northern Portion of the Oboisso Area, Côte d’Ivoire. Sheets 4A, 4B, 4B BIS, 4; Direction de la Géologie, Abidjan, Côte d’Ivoire and Bundesanstalt für Geowissenschaften und Rohstoffe: Hanover, Germany, 2007. [Google Scholar]
  29. Thomas, E.; De Kock, G.S.; Baglow, N.; Viljoen, J.; Siaka, Z. Geological Map Explanation Map Sheet 0903B (1:100,000); Mining Sector Support Programme; CGS, BRGM, Geoman, GSD: Accra, Ghana, 2009.
  30. Pavlis, N.K.; Holmes, S.A.; Kenyon, S.C.; Factor, J.K. The development and evaluation of the Earth Gravitational Model 2008 (EGM2008). J. Geophys. Res. Solid Earth 2012, 117. [Google Scholar] [CrossRef]
  31. Rose, P.K.; Eriksson, P.G.; Sarkar, S.; Wright, D.T.; Samanta, P.; Mukhopadhyay, S.; Mandal, S.; Banerjee, S.; Altermann, W. Sedimentation patterns during the Precambrian: A unique record? Mar. Pet. Geol. 2012, 33, 34–68. [Google Scholar]
  32. Gorman, B.E.; Pearce, T.H.; Birkett, T.C. On the structure of Archaean greenstone belts. Precambrian Res. 1978, 6, 23–41. [Google Scholar] [CrossRef]
  33. Chardon, D.; Choukroune, P.; Jayananda, M. Strain patterns, décollement and incipient sagducted greenstone terrains in the Archaean Dharwar craton (south India). J. Struct. Geol. 1996, 18, 991–1004. [Google Scholar] [CrossRef]
  34. Jessell, M.W.; Begg, G.C.; Miller, M.S. The geophysical signatures of the West African Craton. Precambrian Res. 2016, 274, 3–24. [Google Scholar] [CrossRef]
  35. Dioh, E.; Béziat, D.; Debat, P.; Grégoire, M.; Ngom, P.M. Diversity of the Palaeoproterozoic granitoids of the Kédougou inlier (Eastern Sénégal): Petrographical and geochemical constraints. J. Afr. Earth Sci. 2006, 44, 351–371. [Google Scholar] [CrossRef]
  36. Lompo, M. Geodynamic evolution of the 2.25-2.0 Ga Palaeoproterozoic magmatic rocks in the Man-Leo Shield of the West African Craton. A model of subsidence of an oceanic plateau. Geol. Soc. Lond. Spec. Publ. 2009, 323, 231–254. [Google Scholar] [CrossRef]
  37. Boher, M.; Abouchami, W.; Michard, A.; Albarede, F.; Arndt, N.T. Crustal growth in West Africa at 2.1 Ga. J. Geophys. Res. Solid Earth 1992, 97, 345–369. [Google Scholar] [CrossRef]
  38. Thompson, R.N.; Gibson, S.A. Transient high temperatures in mantle plume heads inferred from magnesian olivines in Phanerozoic picrites. Nature 2000, 407, 502–506. [Google Scholar] [CrossRef] [PubMed]
  39. Putirka, K.D.; Perfit, M.; Ryerson, F.J.; Jackson, M.G. Ambient and excess mantle temperatures, olivine thermometry, and active vs. passive upwelling. Chem. Geol. 2007, 241, 177–206. [Google Scholar] [CrossRef]
  40. Herzberg, C.; Condie, K.; Korenaga, J. Thermal history of the Earth and its petrological expression. Earth Planet. Sci. Lett. 2010, 292, 79–88. [Google Scholar] [CrossRef]
  41. Herzberg, C. Basalts as temperature probes of Earth’s mantle. Geology 2011, 39, 1179–1180. [Google Scholar] [CrossRef]
  42. Herzberg, C.; Asimow, P.D. PRIMELT3 MEGA. XLSM software for primary magma calculation: Peridotite primary magma MgO contents from the liquidus to the solidus. Geochem. Geophys. Geosyst. 2015, 16, 563–578. [Google Scholar] [CrossRef]
  43. Herzberg, C.; Asimow, P.D. Petrology of some oceanic island basalts: PRIMELT2. XLS software for primary magma calculation. Geochem. Geophys. Geosyst. 2008, 9, Q09001. [Google Scholar] [CrossRef]
  44. Moresi, L.; Dufour, F.; Mühlhaus, H.B. A Lagrangian integration point finite element method for large deformation modeling of viscoelastic geomaterials. J. Comput. Phys. 2003, 184, 476–497. [Google Scholar] [CrossRef] [Green Version]
  45. Moresi, L.; Quenette, S.; Lemiale, V.; Meriaux, C.; Appelbe, B.; Muhlhaus, H. Computational approaches to studying non-linear dynamics of the crust and mantle. Phys. Earth Planet. Inter. 2007, 163, 69–82. [Google Scholar] [CrossRef]
  46. De Smet, J.H.; Van den Berg, A.P.; Vlaar, N.J. Stability and growth of continental shields in mantle convection models including recurrent melt production. Tectonophysics 1998, 296, 15–29. [Google Scholar] [CrossRef]
  47. Feng, X.; Amponsah, P.O.; Martin, R.; Ganne, J.; Jessell, M.W. 3-D numerical modelling of the influence of pre-existing faults and boundary conditions on the distribution of deformation: Example of North-Western Ghana. Precambrian Res. 2016, 274, 161–179. [Google Scholar] [CrossRef]
  48. Mckenzie, D.; Jackson, J.; Priestley, K. Thermal structure of oceanic and continental lithosphere. Earth Planet. Sci. Lett. 2005, 233, 337–349. [Google Scholar] [CrossRef]
  49. Wang, K.; Burov, E.; Gumiaux, C.; Chen, Y.; Lu, G.; Mezri, L.; Zhao, L. Formation of metamorphic core complexes in non-over-thickened continental crust: A case study of Liaodong Peninsula (East Asia). Lithos 2015, 238, 86–100. [Google Scholar] [CrossRef] [Green Version]
  50. Ranalli, G. Rheology of the Earth; Springer Science & Business Media: Berlin, Germany, 1995; p. 413. [Google Scholar]
  51. Peace, A.; McCaffrey, K.; Imber, J.; Hobbs, R.; van Hunen, J.; Gerdes, K. Quantifying the influence of sill intrusion on the thermal evolution of organic-rich sedimentary rocks in nonvolcanic passive margins: An example from ODP 210-1276, offshore Newfoundland, Canada. Basin Res. 2017, 29, 249–265. [Google Scholar] [CrossRef] [Green Version]
  52. Gerya, T.V.; Perchuk, L.L.; Burg, J.P. Transient hot channels: Perpetrating and regurgitating ultrahigh-pressure, high-temperature crust-mantle associations in collision belts. Lithos 2008, 103, 236–256. [Google Scholar] [CrossRef]
  53. Pinkerton, H.; Stevenson, R.J. Methods of determining the rheological properties of magmas at sub-liquidus temperatures. J. Volcanol. Geotherm. Res. 1992, 53, 47–66. [Google Scholar] [CrossRef]
  54. Wang, D.; Lu, X.; Song, Y.; Shao, R.; Qi, T. Influence of the temperature dependence of thermal parameters of heat conduction models on the reconstruction of thermal history of igneous-intrusion-bearing basins. Comput. Geosci. 2010, 36, 1339–1344. [Google Scholar] [CrossRef]
  55. Rey, P.F.; Teyssier, C.; Whitney, D.L. The role of partial melting and extensional strain rates in the development of metamorphic core complexes. Tectonophysics 2009, 477, 135–144. [Google Scholar] [CrossRef]
  56. Maluski, H.; Matte, P. Ages of alpine tectonometamorphic events in the northwestern Himalaya (Northern Pakistan) by 39Ar/40Ar method. Tectonics 1984, 3, 1–18. [Google Scholar] [CrossRef]
  57. Prelević, D.; Jacob, D.E.; Foley, S.F. Recycling plus: A new recipe for the formation of Alpine-Himalayan orogenic mantle lithosphere. Earth Planet. Sci. Lett. 2013, 362, 187–197. [Google Scholar] [CrossRef]
  58. Ganne, J.; De Andrade, V.; Weinberg, R.F.; Vidal, O.; Dubacq, B.; Kagambega, N.; Naba, S.; Baratoux, L.; Jessell, M.; Allibon, J. Modern-style plate subduction preserved in the Palaeoproterozoic West African craton. Nat. Geosci. 2012, 5, 60–65. [Google Scholar] [CrossRef]
  59. Willett, S.; Beaumont, C.; Fullsack, P. Mechanical model for the tectonics of doubly vegent compressional orogens. Geology 1993, 21, 371–374. [Google Scholar] [CrossRef]
  60. Burg, J.P.; Ford, M. Progeny through time: An overview. Geol. Soc. Lond. Spec. Publ. 1997, 121, 1–17. [Google Scholar] [CrossRef]
  61. Anderson, D.L. Large igneous provinces, delamination, and fertile mantle. Elements 2005, 1, 271–275. [Google Scholar] [CrossRef]
  62. Abbott, D.; Burgess, L.; Longhi, J.; Smith, W.H. An empirical thermal history of the Earth’s upper mantle. J. Geophys. Res. 1994, 99, 13835–13850. [Google Scholar] [CrossRef]
  63. Clouser, R.H.; Langston, C.A. Upper mantle structure of southern Africa from P waves. J. Geophys. Res. Solid Earth 1990, 95, 17403–17415. [Google Scholar] [CrossRef]
  64. Artemieva, I.M.; Mooney, W.D. Thermal thickness and evolution of Precambrian lithosphere: A global study. J. Geophys. Res. Solid Earth 2001, 106, 16387–16414. [Google Scholar] [CrossRef]
  65. Qiu, X.; Priestley, K.; McKenzie, D. Average lithospheric structure of southern Africa. Geophys. J. Int. 1996, 127, 563–581. [Google Scholar] [CrossRef]
  66. De Beer, J.H.; Meyer, R. Geophysical characteristics of the Namaqua-Natal Belt and its boundaries, South Africa. J. Geodyn. 1984, 1, 473–494. [Google Scholar] [CrossRef]
  67. Durrheim, R.J.; Mooney, W.D. Evolution of the Precambrian lithosphere: Seismological and geochemical constraints. J. Geophys. Res. Solid Earth 1994, 99, 15359–15374. [Google Scholar] [CrossRef]
  68. Ross, G.M.; Eaton, D.W.; Boerner, D.E.; Miles, W. Tectonic entrapment and its role in the evolution of continental lithosphere: An example from the Precambrian of western Canada. Tectonics 2000, 19, 116–134. [Google Scholar] [CrossRef]
  69. Korenaga, J. Archaean geodynamics and the thermal evolution of Earth. Geophys. Monogr.-Am. Geophys. Union 2006, 164, 7–32. [Google Scholar]
  70. Abbott, D.; Mooney, W. The structural and geochemical evolution of the continental crust: Support for the oceanic plateau model of continental growth. Rev. Geophys. 1995, 33, 231–242. [Google Scholar] [CrossRef]
  71. Choukroune, P.; Ludden, J.N.; Chardon, D.; Calvert, A.J.; Bouhallier, H. Archaean crustal growth and tectonic processes; a comparison of the Superior Province, Canada and the Dharwar Craton, India. Geol. Soc. Lond. Spec. Publ. 1997, 121, 63–98. [Google Scholar] [CrossRef]
  72. Van Hunen, J.; Van den Berg, A.P. Plate tectonics on the early Earth: Limitations imposed by strength and buoyancy of subducted lithosphere. Lithos 2008, 103, 217–235. [Google Scholar] [CrossRef]
  73. Pons, J.; Barbey, P.; Dupuis, D.; Leger, J.M. Mechanisms of pluton emplacement and structural evolution of a 2.1 Ga juvenile continental crust: The Birimian of southwestern Niger. Precambrian Res. 1995, 70, 281–301. [Google Scholar] [CrossRef]
  74. Crameri, F.; Tackley, P.J. Spontaneous development of arcuate single–sided subduction in global 3-D mantle convection models with a free surface. J. Geophys. Res. Solid Earth 2014, 119, 5921–5942. [Google Scholar] [CrossRef]
  75. Cashman, K.V.; Sparks, S.J.; Blundy, J.D. Vertically extensive and unstable system: A unified view of igneous processes. Science 2017, 355. [Google Scholar] [CrossRef] [PubMed]
  76. Ganne, J.; Bachmann, O.; Feng, X. Deep into magma plumbing systems: Interrogating the crystal cargo of volcanic deposits. Geology, in press.
  77. Rudnick, R.L. Making continental crust. Nature 1995, 378, 571–577. [Google Scholar] [CrossRef]
  78. Smithies, R.H.; Champion, D.C. The Archaean high-Mg diorite suite: Links to tonalite-trondhjemite-granodiorite magmatism and implications for early Archaean crustal growth. J. Petrol. 2000, 41, 1653–1671. [Google Scholar] [CrossRef]
  79. Martin, H.; Smithies, R.H.; Rapp, R.; Moyen, J.F.; Champion, D. An overview of adakite, tonalite-trondhjemite-granodiorite (TTG), and sanukitoid: Relationships and some implications for crustal evolution. Lithos 2005, 79, 1–24. [Google Scholar] [CrossRef]
  80. Moyen, J.F. The composite Archaean grey gneisses: Petrological significance, and evidence for a non-unique tectonic setting for Archaean crustal growth. Lithos 2011, 123, 21–36. [Google Scholar] [CrossRef]
  81. Martin, H. Effect of steeper Archaean geothermal gradient on geochemistry of subduction-zone magmas. Geology 1986, 14, 753–756. [Google Scholar] [CrossRef]
  82. Martin, H.; Moyen, J.F.; Rapp, R. The sanukitoid series: Magmatism at the Archaean-Proterozoic transition. Earth Environ. Sci. Trans. R. Soc. Edinb. 2009, 100, 15–33. [Google Scholar] [CrossRef]
  83. Condie, K.C. TTGs and adakites: Are they both slab melts? Lithos 2005, 80, 33–44. [Google Scholar] [CrossRef]
  84. Zhao, J.H.; Zhou, M.F. Neoproterozoic adakitic plutons in the northern margin of the Yangtze Block, China: Partial melting of a thickened lower crust and implications for secular crustal evolution. Lithos 2008, 104, 231–248. [Google Scholar] [CrossRef]
  85. Huang, X.L.; Xu, Y.G.; Lan, J.B.; Yang, Q.J.; Luo, Z.Y. Neoproterozoic adakitic rocks from Mopanshan in the western Yangtze Craton: Partial melts of a thickened lower crust. Lithos 2009, 112, 367–381. [Google Scholar] [CrossRef]
  86. Vanderhaeghe, O. Melt segragation, pervasive melt migration and magma mobility in the continental crust: The structural record from pores to orogens. Phys. Chem. Earth Part A Solid Earth Geod. 2001, 26, 213–223. [Google Scholar] [CrossRef]
  87. Maierová, P.; Lexa, O.; Schulmann, K.; Štípská, P. Contrasting tectono-metamorphic evolution of orogenic lower crust in the Bohemian Massif: A numerical model. Gondwana Res. 2014, 25, 509–521. [Google Scholar] [CrossRef]
  88. Otto, C.; Kempka, T.; Kapusta, K.; Stańczyk, K. Fault Reactivation Can Generate Hydraulic Short Circuits in Underground Coal Gasification—New Insights from Regional-Scale Thermo-Mechanical 3D Modeling. Minerals 2016, 6, 101. [Google Scholar] [CrossRef]
  89. Feng, X.; Jessell, M.W.; Amponsah, P.O.; Martin, R.; Ganne, J.; Liu, D.; Batt, E.G. Effect of strain-weakening on Oligocene-Miocene self-organization of the Australian-Pacific plate boundary fault in southern New Zealand: Insights from numerical modelling. J. Geodyn. 2016. [Google Scholar] [CrossRef]
Figure 1. (a) Simplified map of Africa. (b) Simplified geological map of the Leo–Man Shield, modified after Milési et al. [24]. The Archaean basement is surrounded by greenstone-granitoids belts. The samples (blue stars) used to estimate the mantle potential temperature (Tp) are collected from Ama Salah et al. [25]; Soumaila, [26]; Galipp et al. [27]; Hirdes et al. [28]; Thomas et al. [29]. More detailed information on the samples are provided in Table 1 and Table A1.
Minerals 08 00073 g001
Figure 2. (a) Six geological profiles in which the Complete Bouguer gravity anomalies was acquired. (b) The Complete Bouguer gravity anomalies collected from the geological profiles (different color lines correspond to the geographic location shown in Figure 2a).
Minerals 08 00073 g002
Figure 3. Different tectonic models accounting for the evolution of greenstone-granitoid belts in the Leo–Man Shield were proposed by (a) Baratoux et al. [1], (b) Ganne et al. [4] (c) Vidal et al. [16], (d) Feybesse et al. [18], respectively. Boundary conditions are indicated with black arrows. The upward motion of granitoids is indicated by blue arrows.
Minerals 08 00073 g003
Figure 4. The Tp is calculated with the software PRIMELT3 [42]. The grey and orange dotted lines indicate the approximately minimum (1500 °C) and maximum (1600 °C) values, respectively. The horizontal axis corresponds to the “index” row in Table 1.
Minerals 08 00073 g004
Figure 5. The pressures of initial and final melting of samples are calculated with the PRIMELT3 software [42]. Melt fraction ranges between 0.29 and 0.34. The horizontal axis shows the sample information, corresponding to the “index” row in Table 1. Pi—Pressure of initial melting, Pf—Pressure of final melting.
Minerals 08 00073 g005
Figure 6. 2D thermo-mechanical model. The convergent rate is set to 2.5 mm/year on either side. In the upper crust, we define a 16 km thick volcano-sediment in the center overlaying the 10 km thick crustal layers (including 3 km mafic crust and 7 km lower crust). The width of sediment (D) is variable according to different cases listed in Table 2.
Minerals 08 00073 g006
Figure 7. Model200 shows the evolution of folding-exhumation when the width of sediment is set to 200 km. The solidus temperature of the lower crust is shown in black dashed line. (a) At 28 Ma, buoyant lower crustal rocks start to form two crustal-scale folds and break through the mafic layer beneath the sediment (28 Ma). At about 43 Ma, partially molten lower crust rocks ascend into the sediment and form a diapir. Relief (Topo) is modelled using a free re-meshing surface boundary condition. The height of left side of the model is taken as 0 point to calculate uplift or subsidence. (b) Effective density is calculated by Equations (5) and (6). (c) The accumulation ( E I I ) of the second invariant of the strain rate ( ε I I , s−1) is employed to identify shear zones over time (calculated by E I I = 0 t ε I I · Δ t ). (d) Melt fraction is obtained by Equations (2) and (3).
Minerals 08 00073 g007
Figure 8. Model250, the width of sediment is set to 250 km. The solidus temperature of the lower crust is shown in dashed line. (a) At about 31 Ma, lower crustal rocks start to break through the mafic layer beneath the weak sediment. At 46 Ma, partially molten rocks ascend towards the sediment and form a diapir, which is wider than the diapir observed in Model250. (b) Effective density is calculated by Equations (5) and (6). (c) The accumulation ( E I I ) of the second invariant of the strain rate ( ε I I , s−1) is employed to identify shear zones over time (calculated by E I I = 0 t ε I I · Δ t ). (d) Melt fraction is obtained by Equations (2) and (3).
Minerals 08 00073 g008
Figure 9. Model290, the width of sediment is set to 290 km. The solidus temperature of the lower crust is shown in dashed line. (a) At 35 Ma, lower crustal rocks form three crustal-scale folds. Moderate-high pressure volcano-sedimentary rocks are preserved in two-fold hinges. As convergence continues (50 Ma), partially molten lower crustal rocks ascend into the sedimentary basin and form two similar diapirs. (b) Effective density is calculated by Equations (5) and (6). (c) The accumulation ( E I I ) of the second invariant of the strain rate ( ε I I , s−1) is employed to identify shear zones over time (calculated by E I I = 0 t ε I I · Δ t ). (d) Melt fraction is obtained by Equations (2) and (3).
Minerals 08 00073 g009
Figure 10. Model350, the width of sediment is set to 350 km. The solidus temperature of the lower crust is shown in dashed line. (a) At 36 Ma, less dense lower crustal rocks start to form three crustal-scale folds. Two-fold hinges are wider and preserve much more moderate-high pressure volcano-sedimentary rocks that that in case Model290. At 53 Ma, partially molten lower crustal rocks ascend into the sediment and form three diapirs. (b) Effective density is calculated by Equations (5) and (6). (c) The accumulation ( E I I ) of the second invariant of the strain rate ( ε I I , s−1) is employed to identify shear zones over time (calculated by E I I = 0 t ε I I · Δ t ). (d) Melt fraction is obtained by Equations (2) and (3).
Minerals 08 00073 g010
Figure 11. Model400, the width of sediment is set to 400 km. The solidus temperature of the lower crust is shown in dashed line. (a) At 37 Ma, buoyant lower crustal rocks start to form three crustal-scale folds and break through the competent mafic layer beneath the sediment. Moderate-high pressure volcano-sedimentary rocks are preserved in two-fold hinges. At 53 Ma, partially molten lower crustal rocks ascend into the sediment and form three diapirs. (b) Effective density is calculated by Equations (5) and (6). (c) The accumulation ( E I I ) of the second invariant of the strain rate ( ε I I , s−1) is employed to identify shear zones over time (calculated by E I I = 0 t ε I I · Δ t ). (d) Melt fraction is obtained by Equations (2) and (3).
Minerals 08 00073 g011
Figure 12. Model450, the width of sediment is set to 450 km. The solidus temperature of the lower crust is shown in dashed line. (a) At 37 Ma, buoyant lower crustal rocks form four crustal-scale folds. Moderate-high pressure volcano-sedimentary rocks are preserved in three-fold hinges. At 58 Ma, partially molten lower crustal rocks ascend into the weak sediment and form four diapirs with different sizes. (b) Effective density is calculated by Equations (5) and (6). (c) The accumulation ( E I I ) of the second invariant of the strain rate ( ε I I , s−1) is employed to identify shear zones over time (calculated by E I I = 0 t ε I I · Δ t ). (d) Melt fraction is obtained by Equations (2) and (3).
Minerals 08 00073 g012
Figure 13. (a) Greenstone-granitoid belts, together with two representative tectonic models [1,16]. Yellow dotted ellipses are used to locate granitoid intrusions. Red arrows represent the orientation of main deformation phases in compression during the Eburnean Orogeny. (b) “Dorm and basin” structure resulting from upwelling diapirs (due to buoyancy) including two stages (①, ②), insights from the study in the Nassian domain (after Vidal et al. [16]). (①) is the self-development of “dome and basin”; (②) is characterized by coeval ascent of diapirs and shortening. (c) The tectonic model accounting for the evolution of deformation in Western Burkina Faso was suggested by Baratoux et al. [1].
Minerals 08 00073 g013
Figure 14. (a) Numerical results of Model450 (see detailed info in Figure 12). We shortly name the diapirs as rise 1, rise 2, rise 3 and rise 4 from left to right sides for the purposes of the discussion. The solidus temperature of the lower crust is marked by black dotted line. (b) The impact of the lower crust exhumation on the process of uplift. (The position used for plotting uplift is indicated by red point in Figure 14a). (c) The accumulation (EII) of the second invariant of the strain rate is employed to identify fast/slow shear strain rate over time (58 Ma) in the upper crust (about 10–20 km thick). Solid color lines represent the boundaries of different materials/states. There is an offset of 30–50 km between diapir axis (in the middle crust) and high strain zones in the upper crust. The high strain zones would favor the emplacement of dome-like granitoid bodies.
Minerals 08 00073 g014
Figure 15. Sketching the scenario of greenstone-granitoid belts during the Eburnean Orogeny. Diapirs are made of upper solidified lids and partially molten lower crust rocks. This feature results from the distribution of solidus temperature of the lower crust (light green line) according to the numerical results in Figure 14. We suggest that a series of sheet-like granitoids possibly derived from either subducted mélanges, lower crust and/or mantle melting accumulated at depths of the subcontinental mantle would canalize along diapirs before feeding the upper crust. When the granitoids arrive at the solidified lids of the diapirs, they would favour migrating horizontally and intruding into the upper crust through weakening zones between the diapirs. This model also suggests a dissymmetry of structures between the upper and middle-lower segments of crust, with the dome-like granitoids overlying high-grade sedimentary synforms and high-grade diapirs underlying low-grade greenstone belts. Red = granitoids; orange = partially molten materials of diapirs (lower part); blue = solidified lids of diapirs (upper segment); light green line = solidus temperature of lower crust (Figure 14c).
Minerals 08 00073 g015
Table 1. Primary Magma Solutions for volcanic rocks in the West African Craton (WAC) (ca. 2.2–2.1 Ga).
RefferencesHirdes et al. [28]Ama Salah et al. [25]Thomas et al. [29]Galipp et al. [27]Ama Salah et al. [25]Soumaila. [26]Soumaila. [26]
Sample1074AS-393EC2036KG 18AS-5755810
Index1234567
LocationGhana SefwiNigerian LiptakoGhana Wa-LarwaGhana SefwiNigerian LiptakoNigerian LiptakoNigerian Liptako
SiO2 a48.3048.8248.5048.5647.2649.0149.81
TiO20.270.250.350.470.200.440.43
Al2O311.5212.7711.2010.6810.0311.3410.75
Fe2O30.140.120.170.230.100.220.21
FeO9.559.279.569.9110.669.509.23
MnO0.160.160.160.170.180.160.17
MgO17.9817.3418.0919.1321.4318.0317.36
CaO10.3210.1410.569.349.109.939.70
Na2O1.581.101.161.380.881.141.95
K2O0.150.010.220.070.060.100.26
T OL (°C) b1394.791375.321391.871414.031450.211390.571389.12
T P (°C) c1529.531515.181531.791553.911599.651530.551515.78
T P (°C) d1512.181495.541514.831541.441599.421513.381496.23
OL Mg e0.920.910.920.920.920.920.91
F AFM f0.290.290.300.320.340.310.31
Pi (GPa) g3.93.73.94.25.23.93.7
Pf (GPa) h1.31.11.31.32.811
a Lava sample in original source reference for which PRIMELT3.XLS has been applied. b Olivine liquidus temperature at 1 atmosphere (°C). c Mantle potential temperature (°C) (PRIMELT2.XLS). d Mantle potential temperature (°C) (PRIMELT3.XLS). e Mg number of olivine to crystallize from primary magma at 1 atmosphere (atm). f Melt fractions for peridotite KR-4003 for the case of accumulated fractional melting. g Pressure of initial melting. h Pressure of final melting.
Table 2. Parameters for each model, Exp # represents the name of experiment.
Width of Sediment (D = ?)200 km250 km290 km350 km400 km450 km
Exp #Model200Model250Model290Model350Model400Model450
Table 3. Rheological properties of different lithospheric layers (Ranalli, [50] and references therein).
LayerA (MPa−n/s)nQ (KJ/mol)
Upper crust 2.0 × 10−43.4260
Lower crust1.3 × 10−32.4219
Sediment3.2 × 10−42.3154
Upper most mantle7 × 10−43.3520
Table 4. Parameters used in experiments.
ParameterSymbolValue-Units
Densityρupper3050 kg/m3
ρlower2700 kg/m3
ρsediment2800 kg/m3
ρmantle3250 kg/m3
Width of sedimentDkm
Dislocation creep power law pre-exponential factorAMPa−n/s
Dislocation creep power law exponentndimensionless
Power law creep activation energyEKJ/mol
Temperature T°C
Gas constantR8.314 J mol−1·K−1
Heat capacityC1000 J/kg·K
Latent heat lhkJ/kg
Gravitational accelerationg9.81 m/s2
Friction angle for Drucker-Pragerφ8–20°
Cohesion for Drucker-Pragerσ5–10 Mpa
Viscosity limitη1018 < η < 1023 Pa·s
Table 5. Melting points of different lithospheric layers (According to metamorphic modelling with Perple-x by Ganne et al. [4]).
LayerRock Type T s o l i d u s (°C) T l i q u i d u s (°C) M m a x
Upper crustDiabase83612000.3
Lower crustQuartzodiorite63612000.8
SedimentWet quartzite70012000.8

