3.1. Effect of Chromite Particle Size
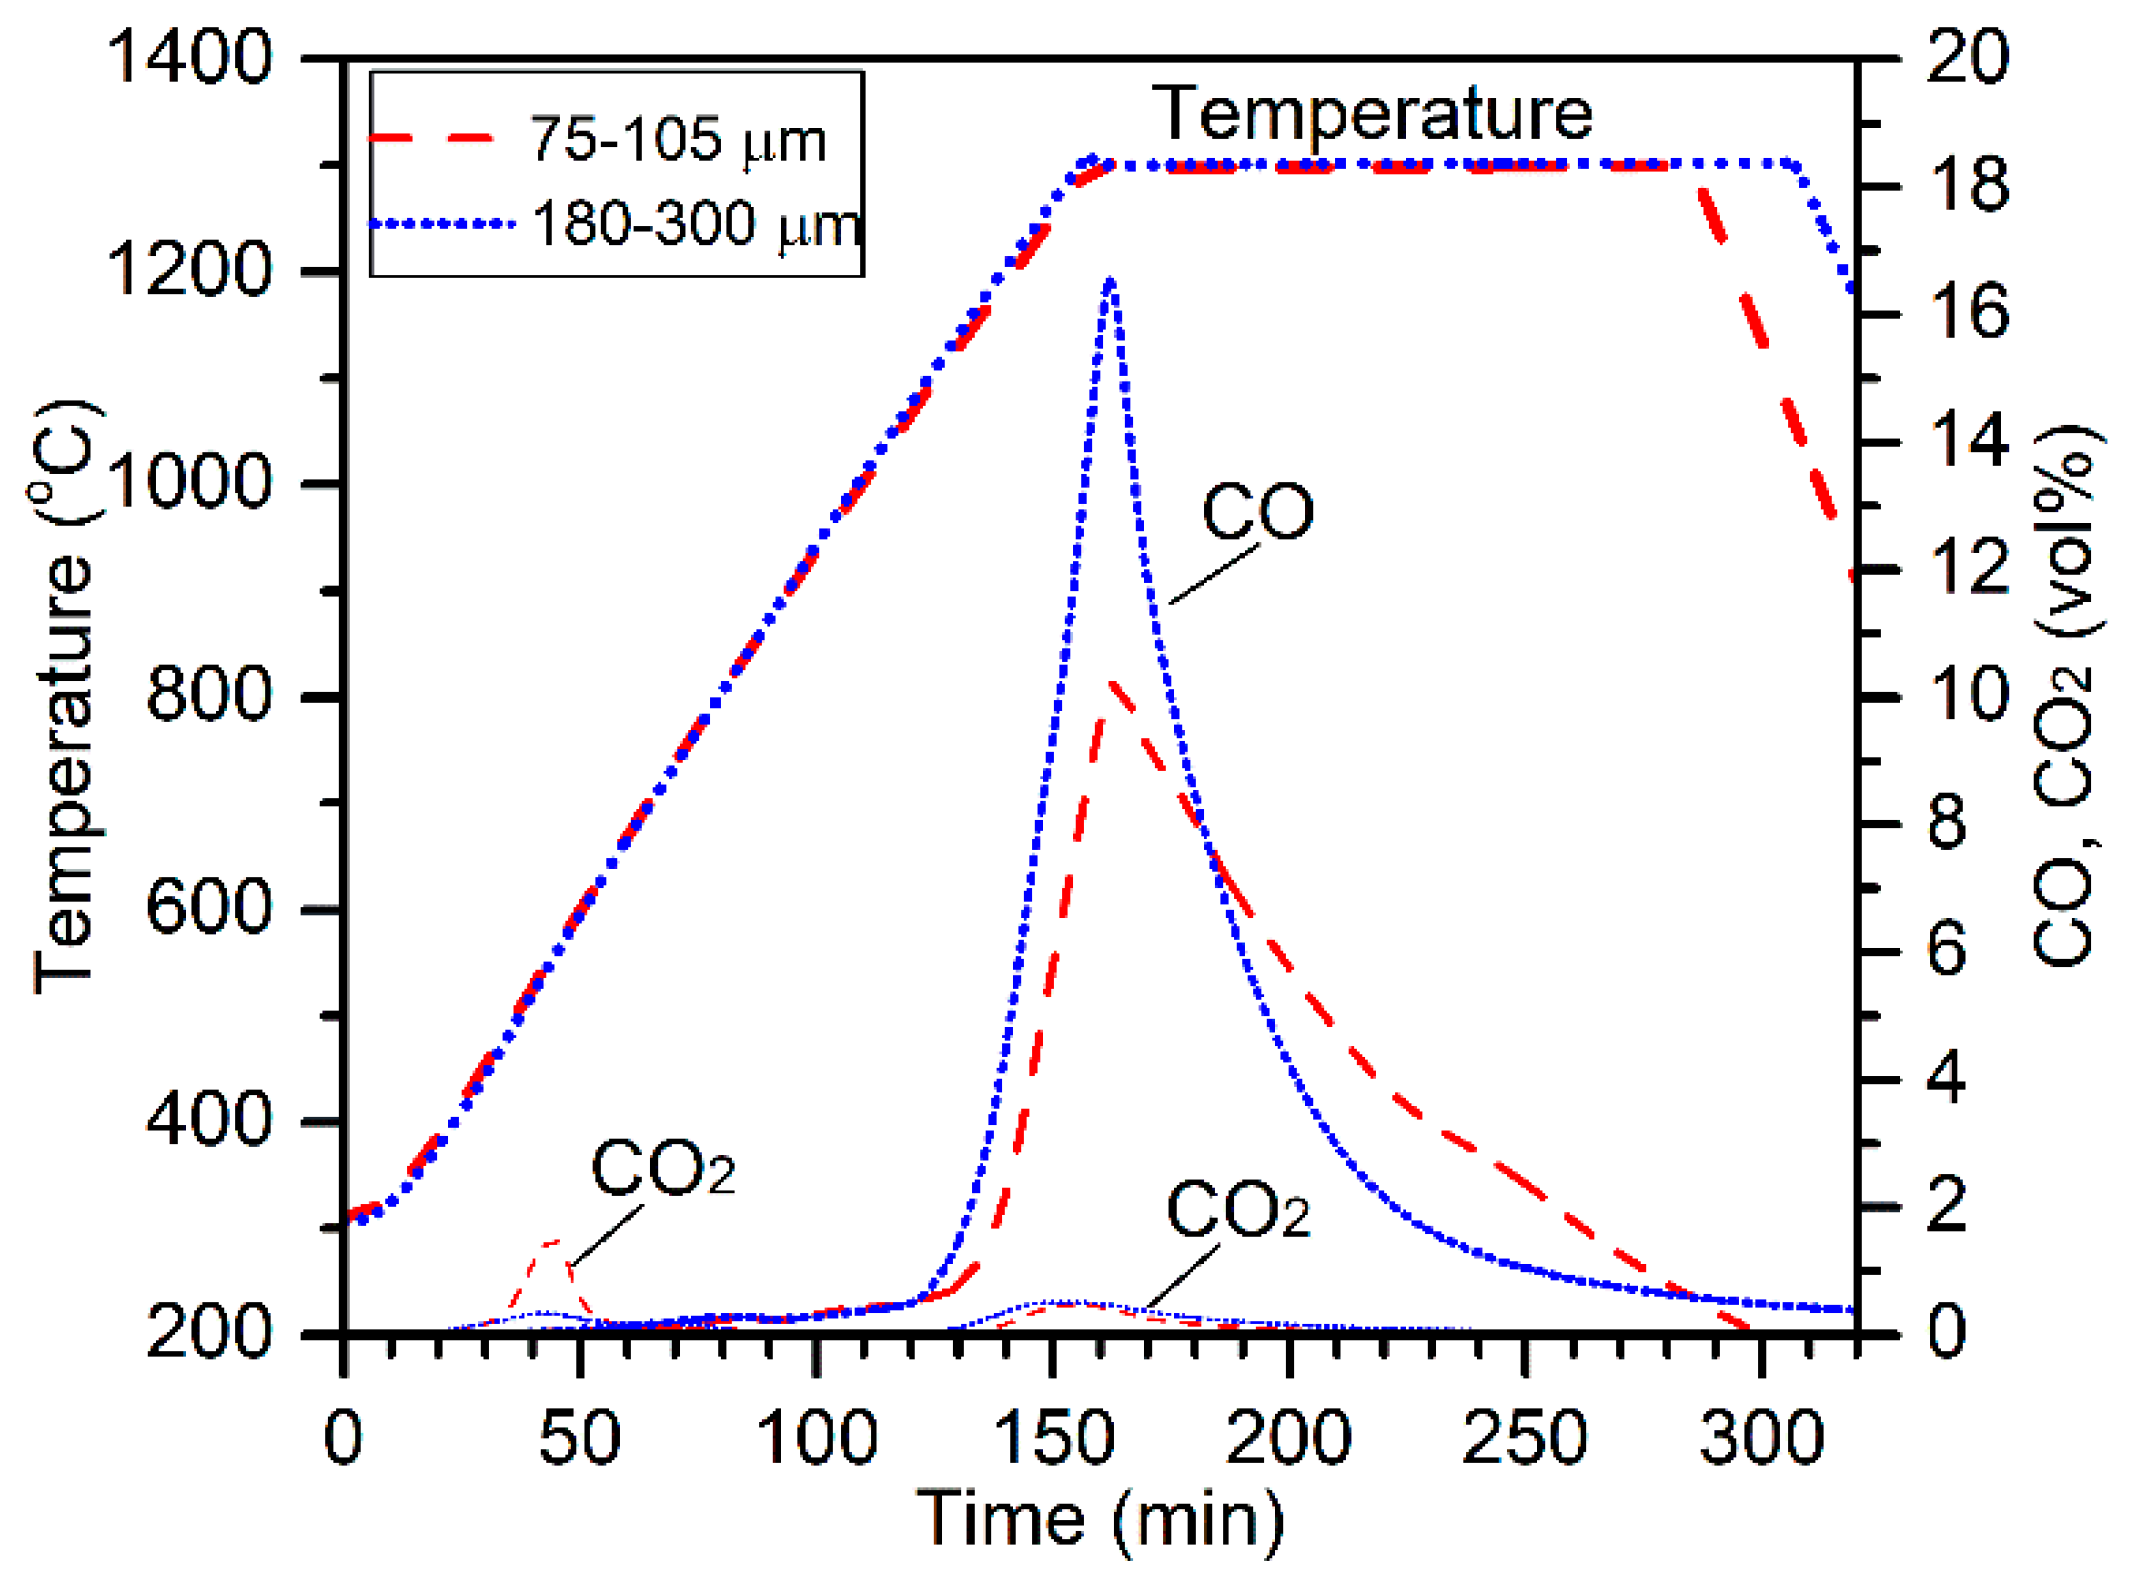
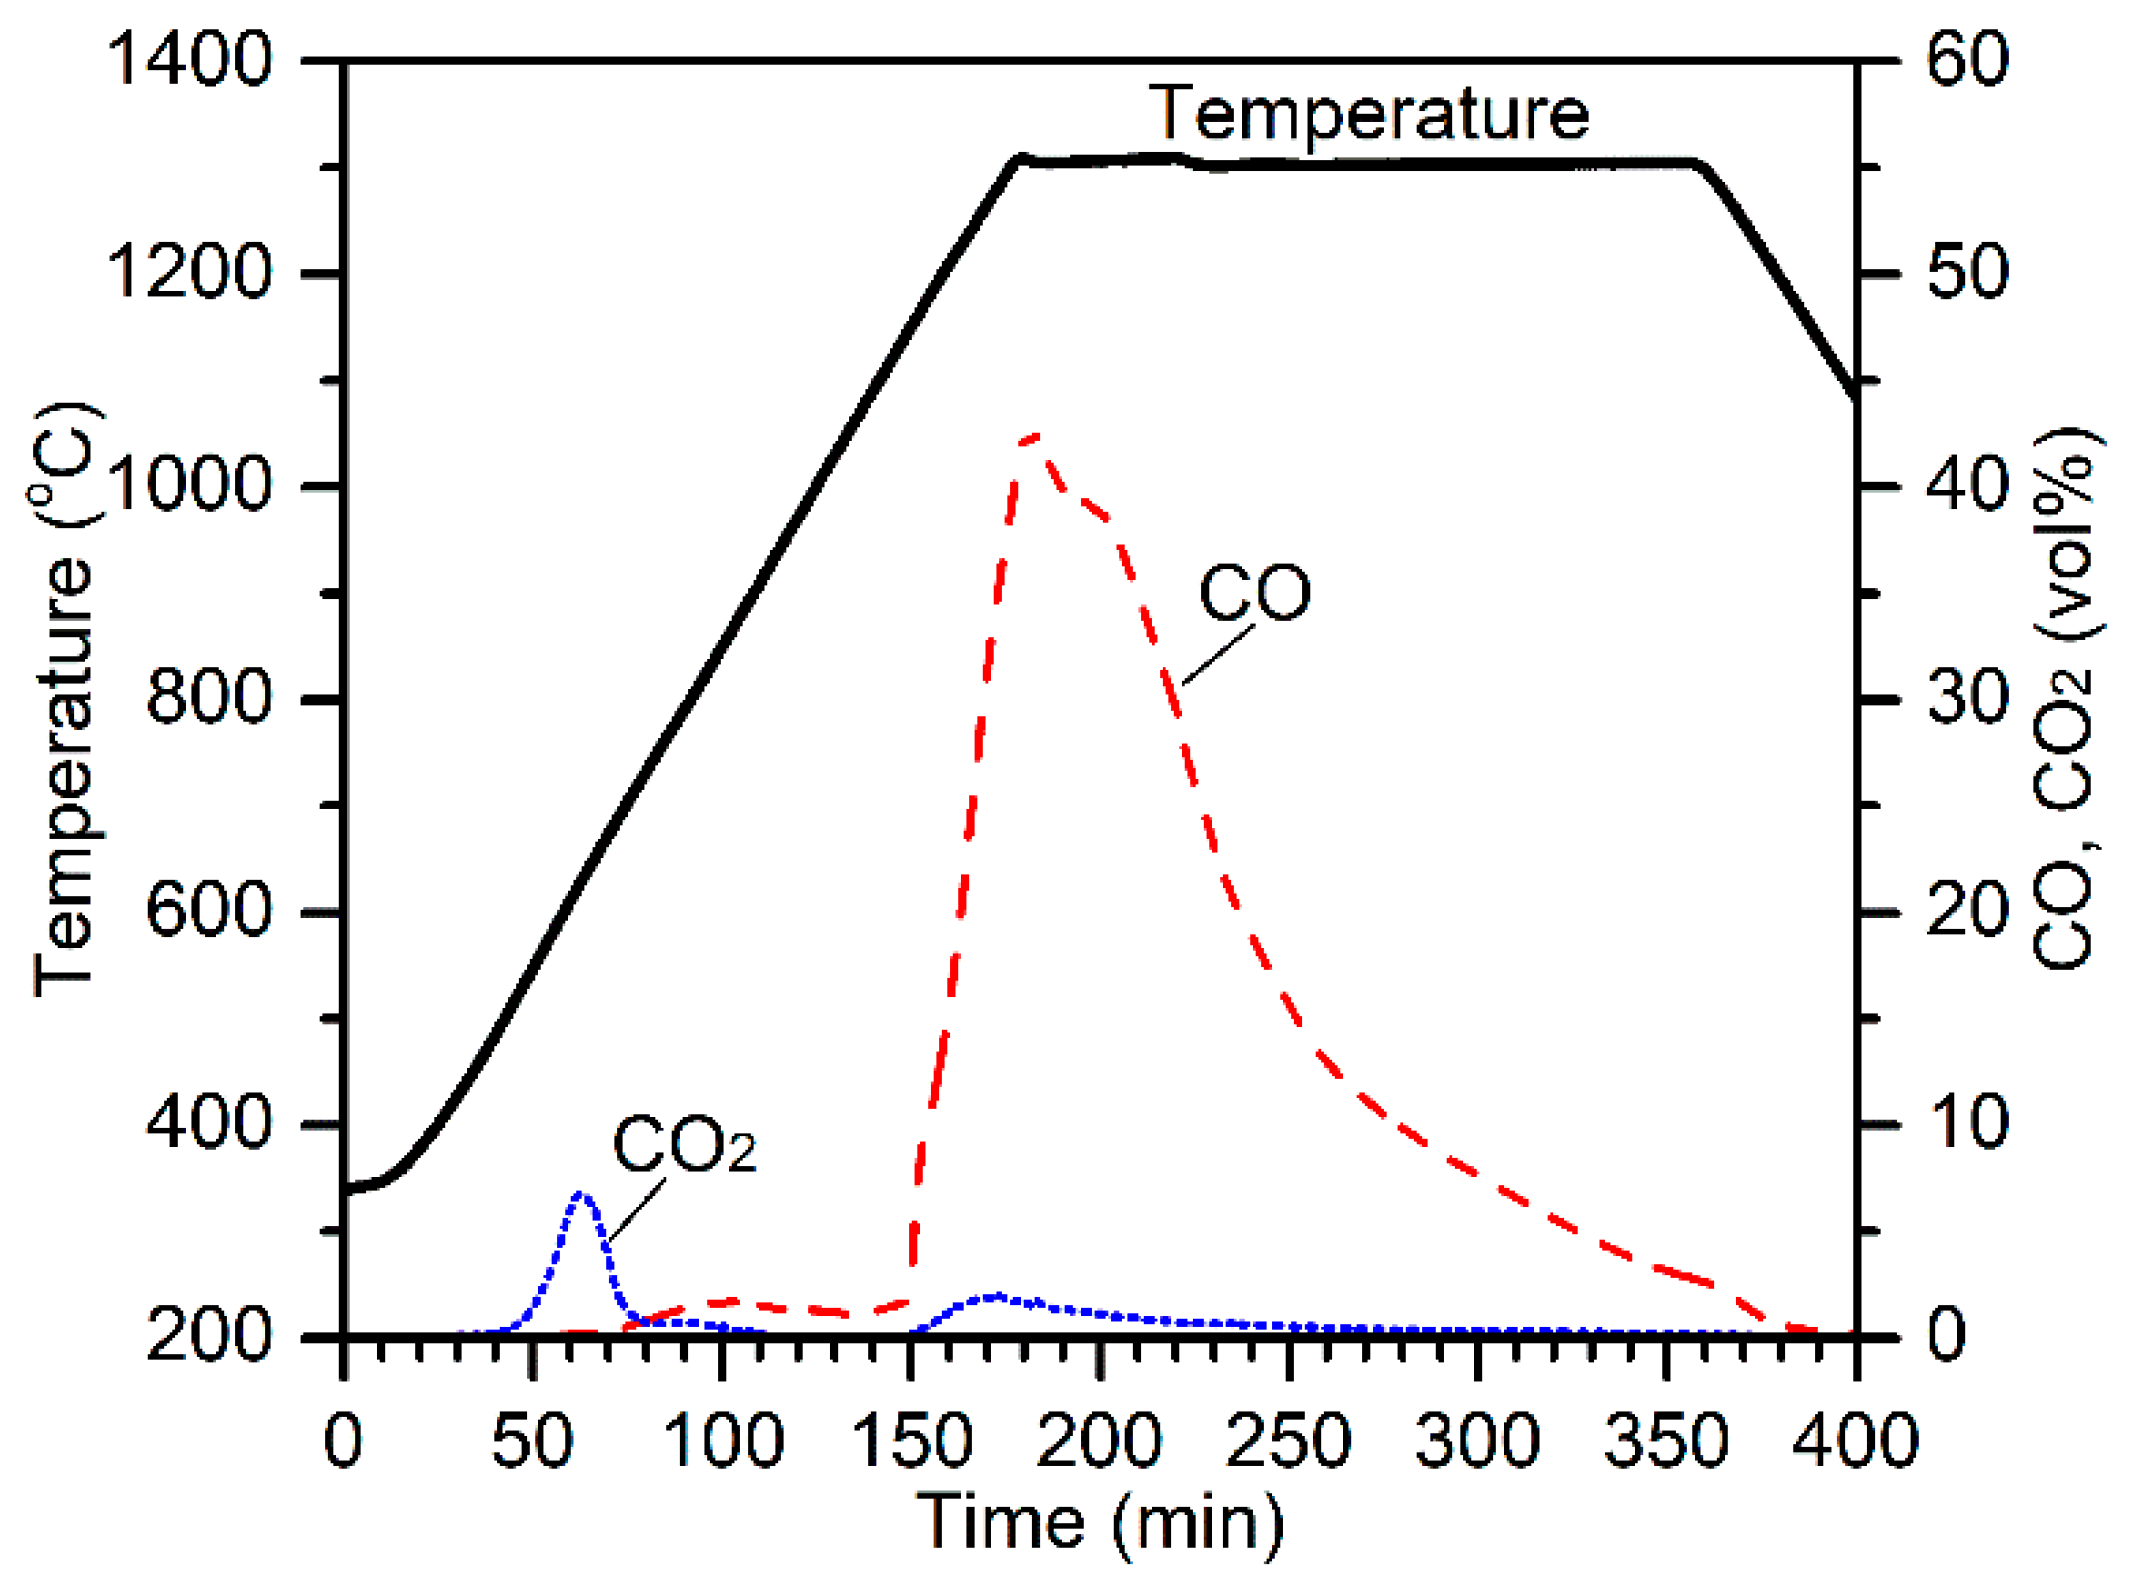
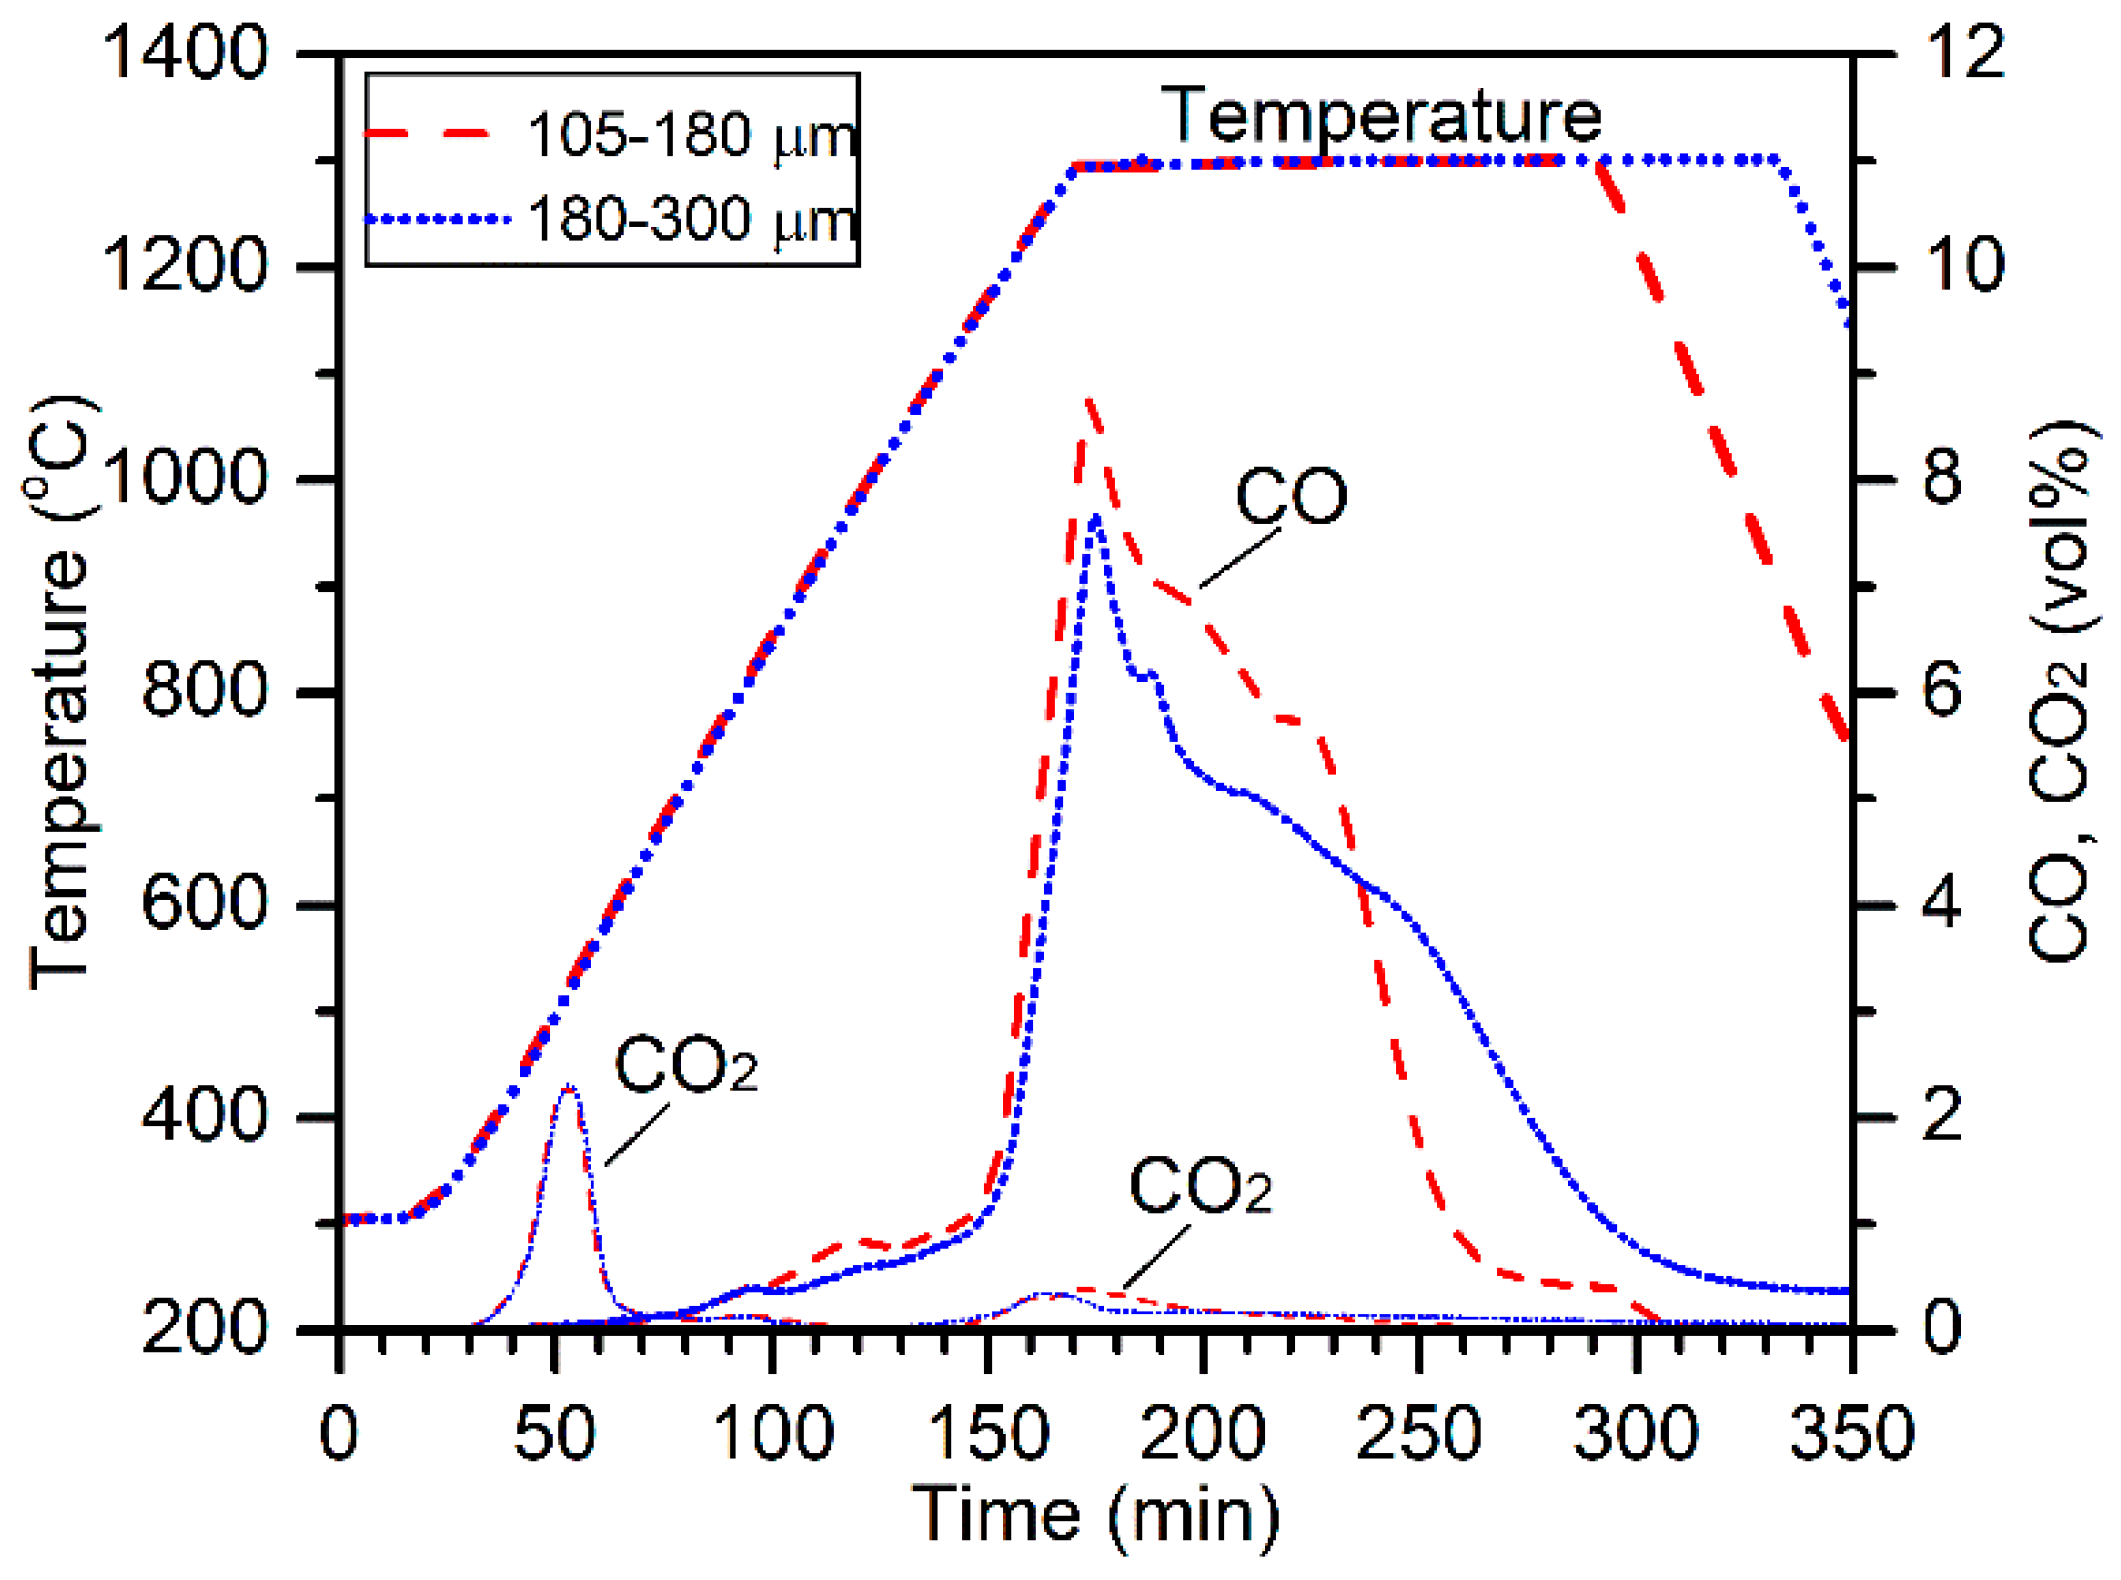
The effect of the chromite particle size was evaluated by conducting electric tube furnace tests at 1300 °C on 13 mm pellets composed of 10.0 g chromite (75–105 µm or 180–300 µm), 2.2 g charcoal (75–105 µm), and 3.0 g CaCl
2. The off-gas CO and CO
2 concentrations are plotted in
Figure 2 along with the temperature profiles for comparison. The CO
2 peak at about 40 min (500 °C) was due to the decomposition of magnesite [
10]. Higher evolution of CO
2 for the reduction of 75–105 µm chromite was due to the presence of higher amounts of magnesite. Carbothermic reduction of chromite by charcoal resulted in the evolution of massive CO and minor CO
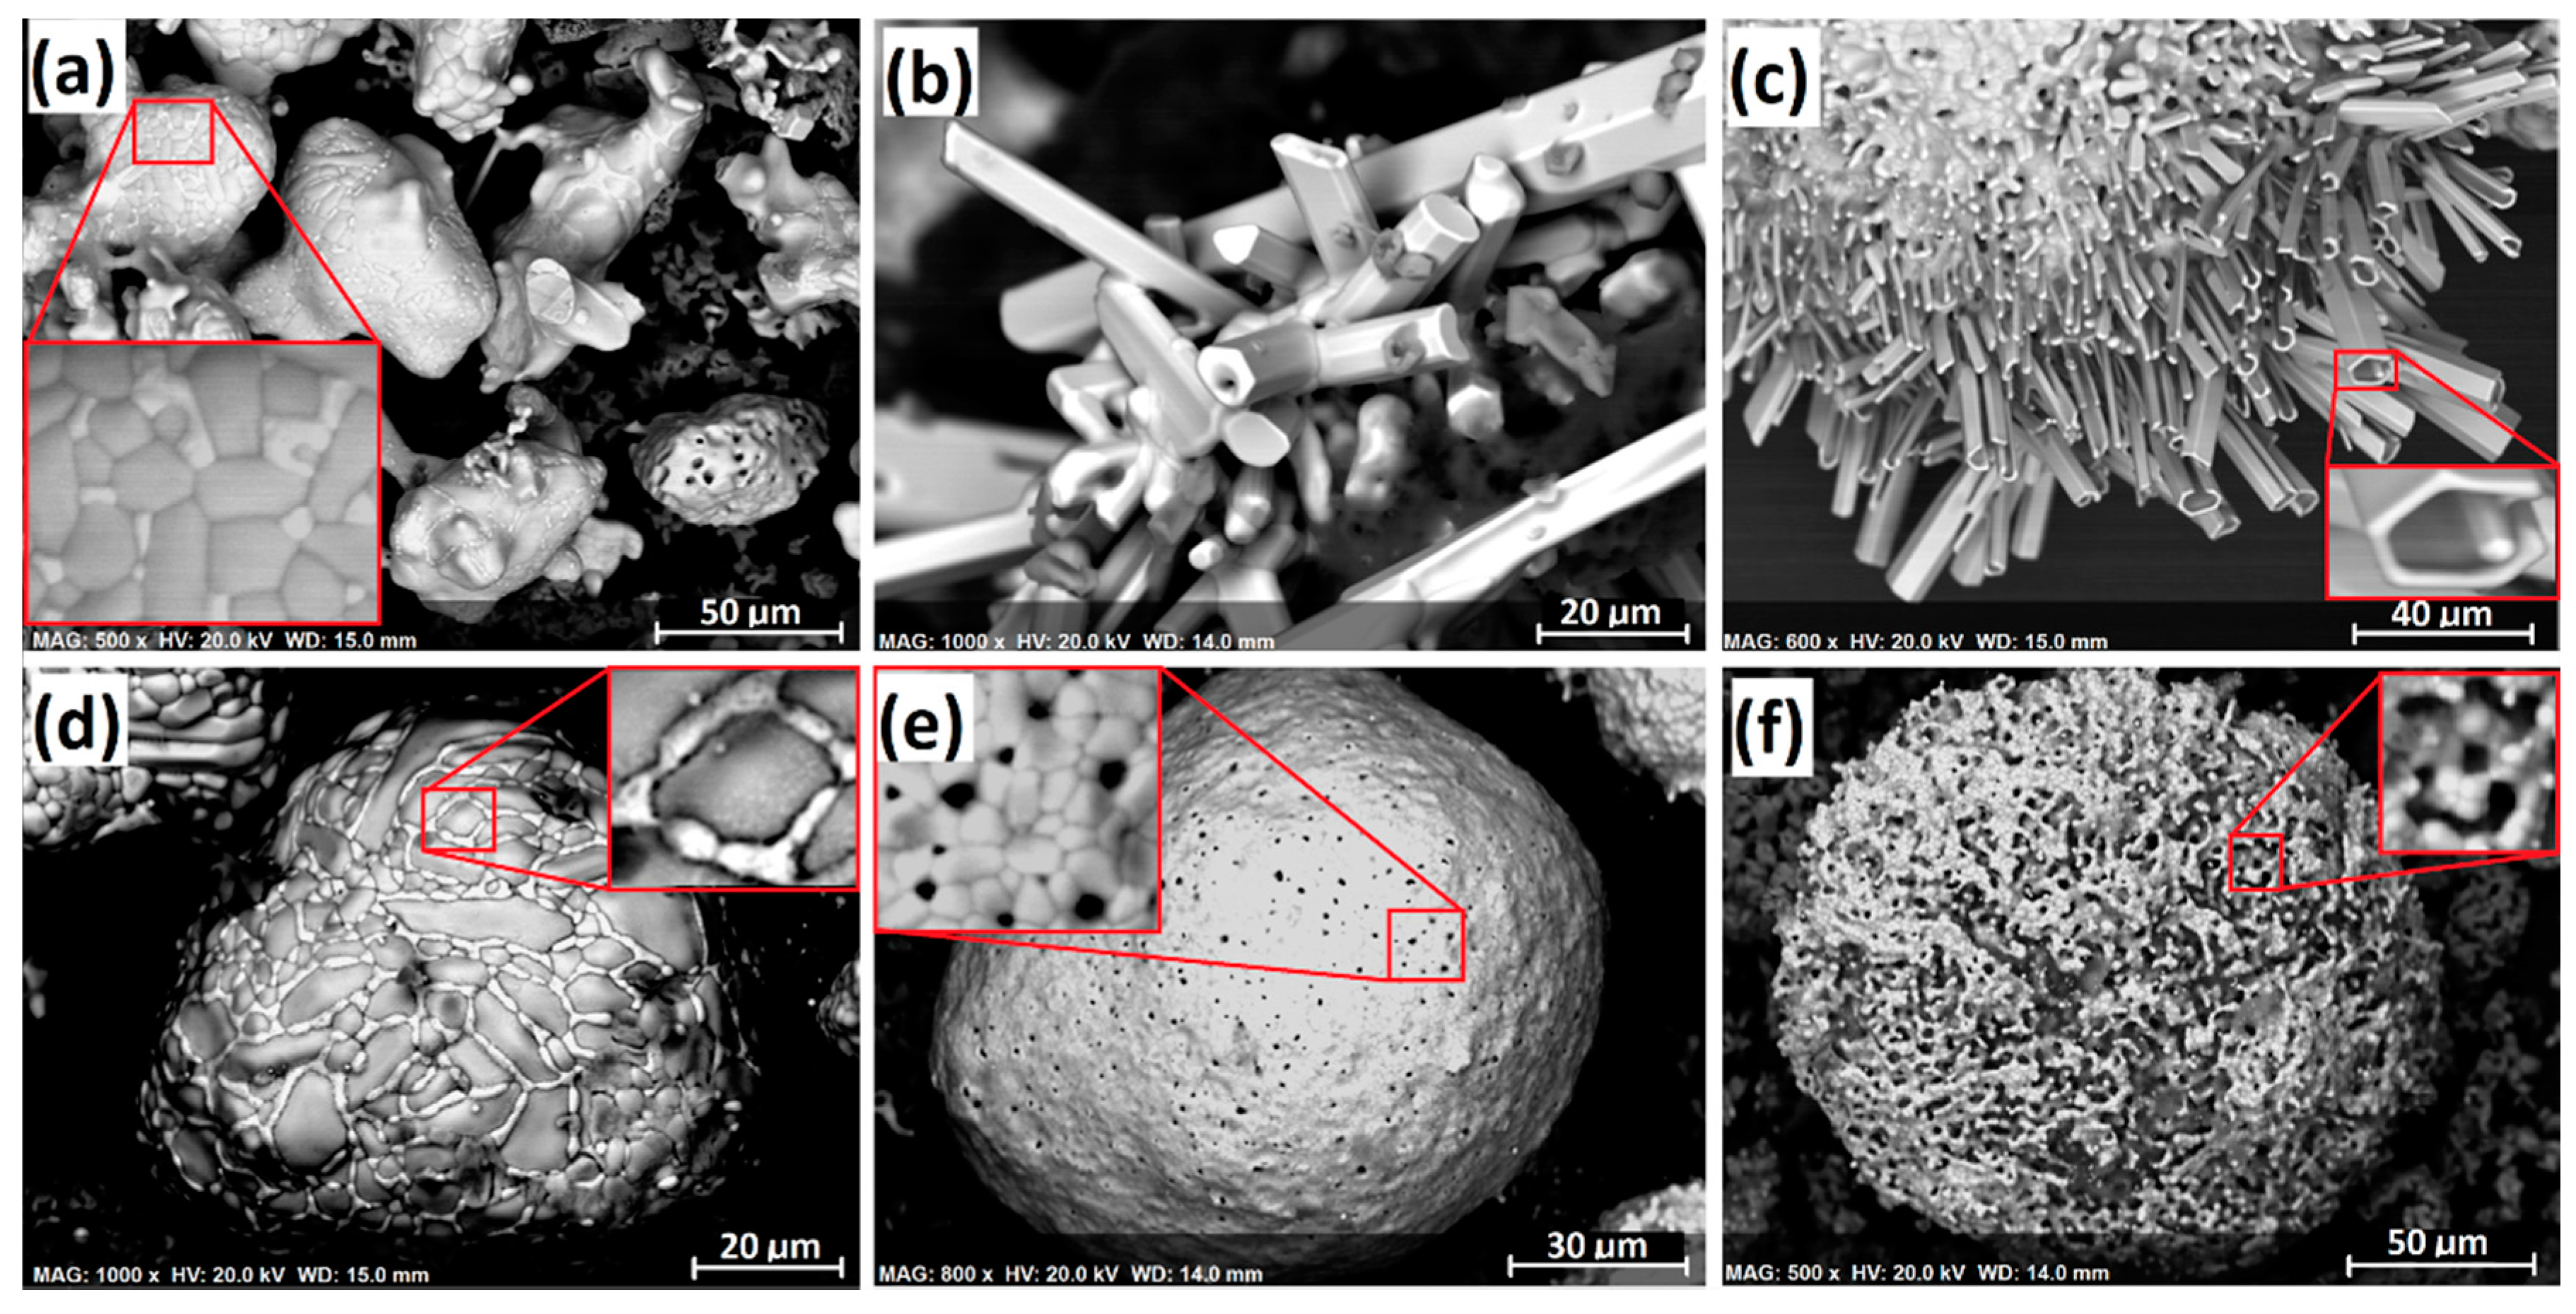
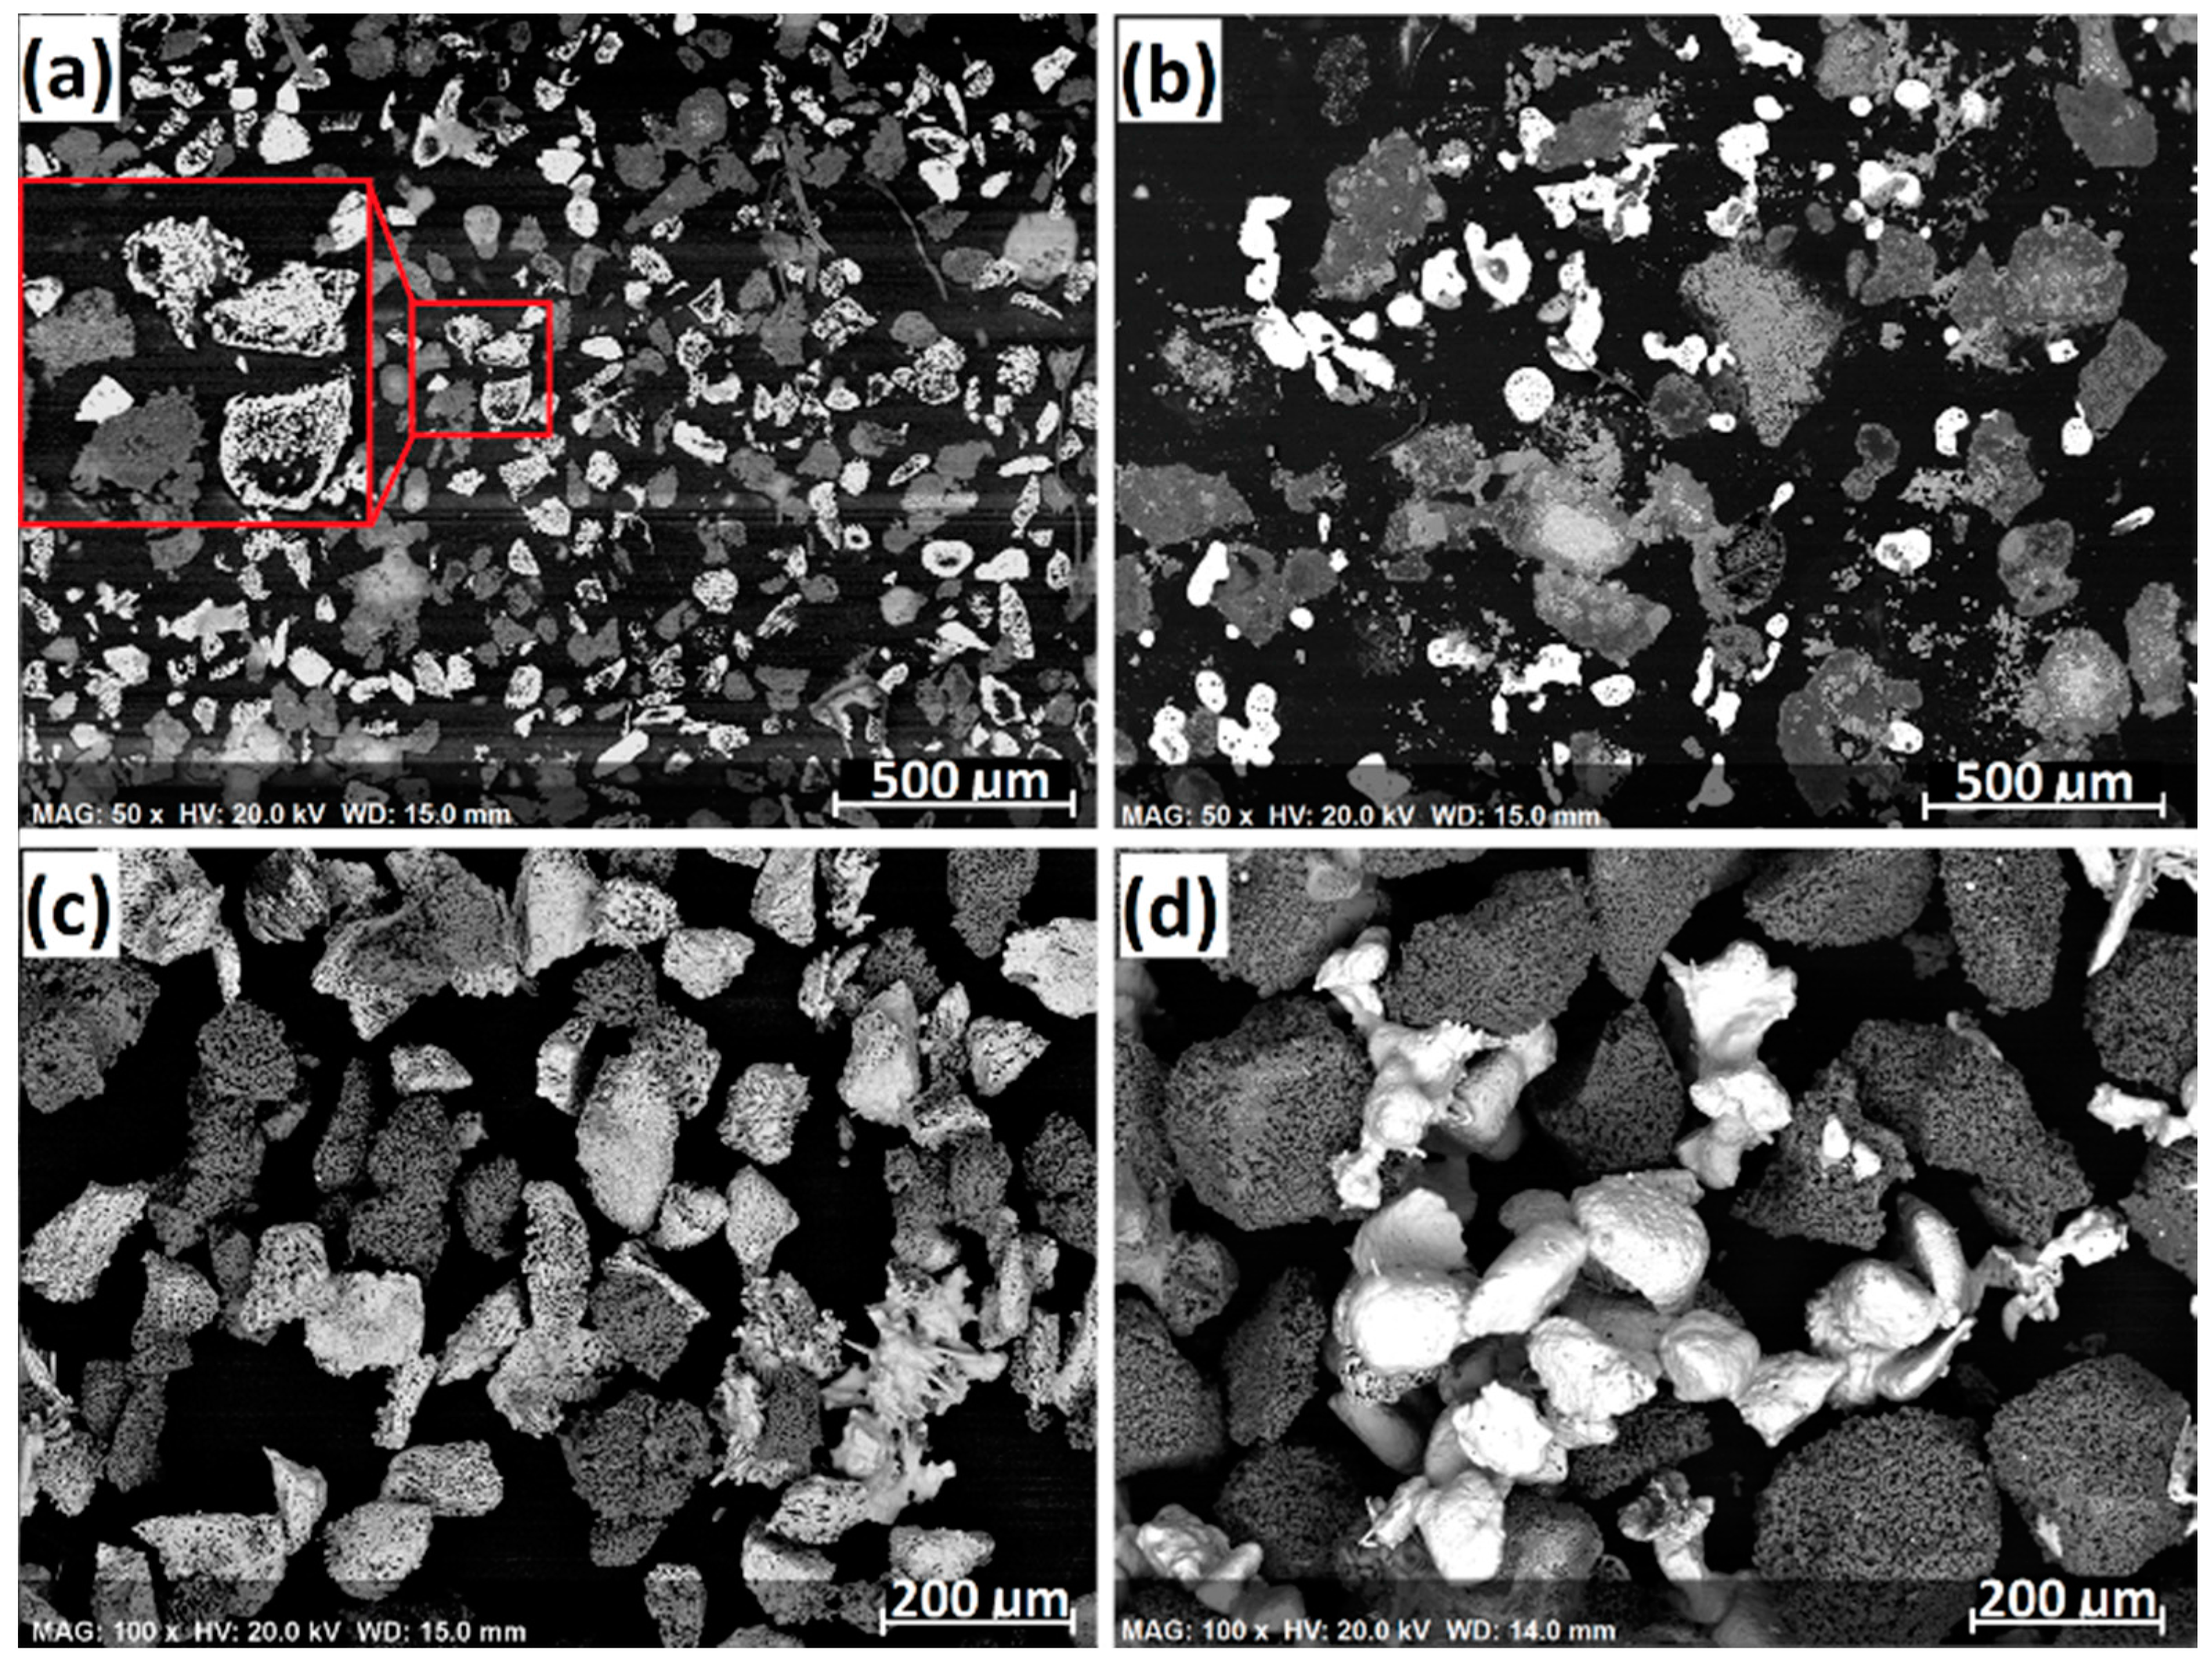
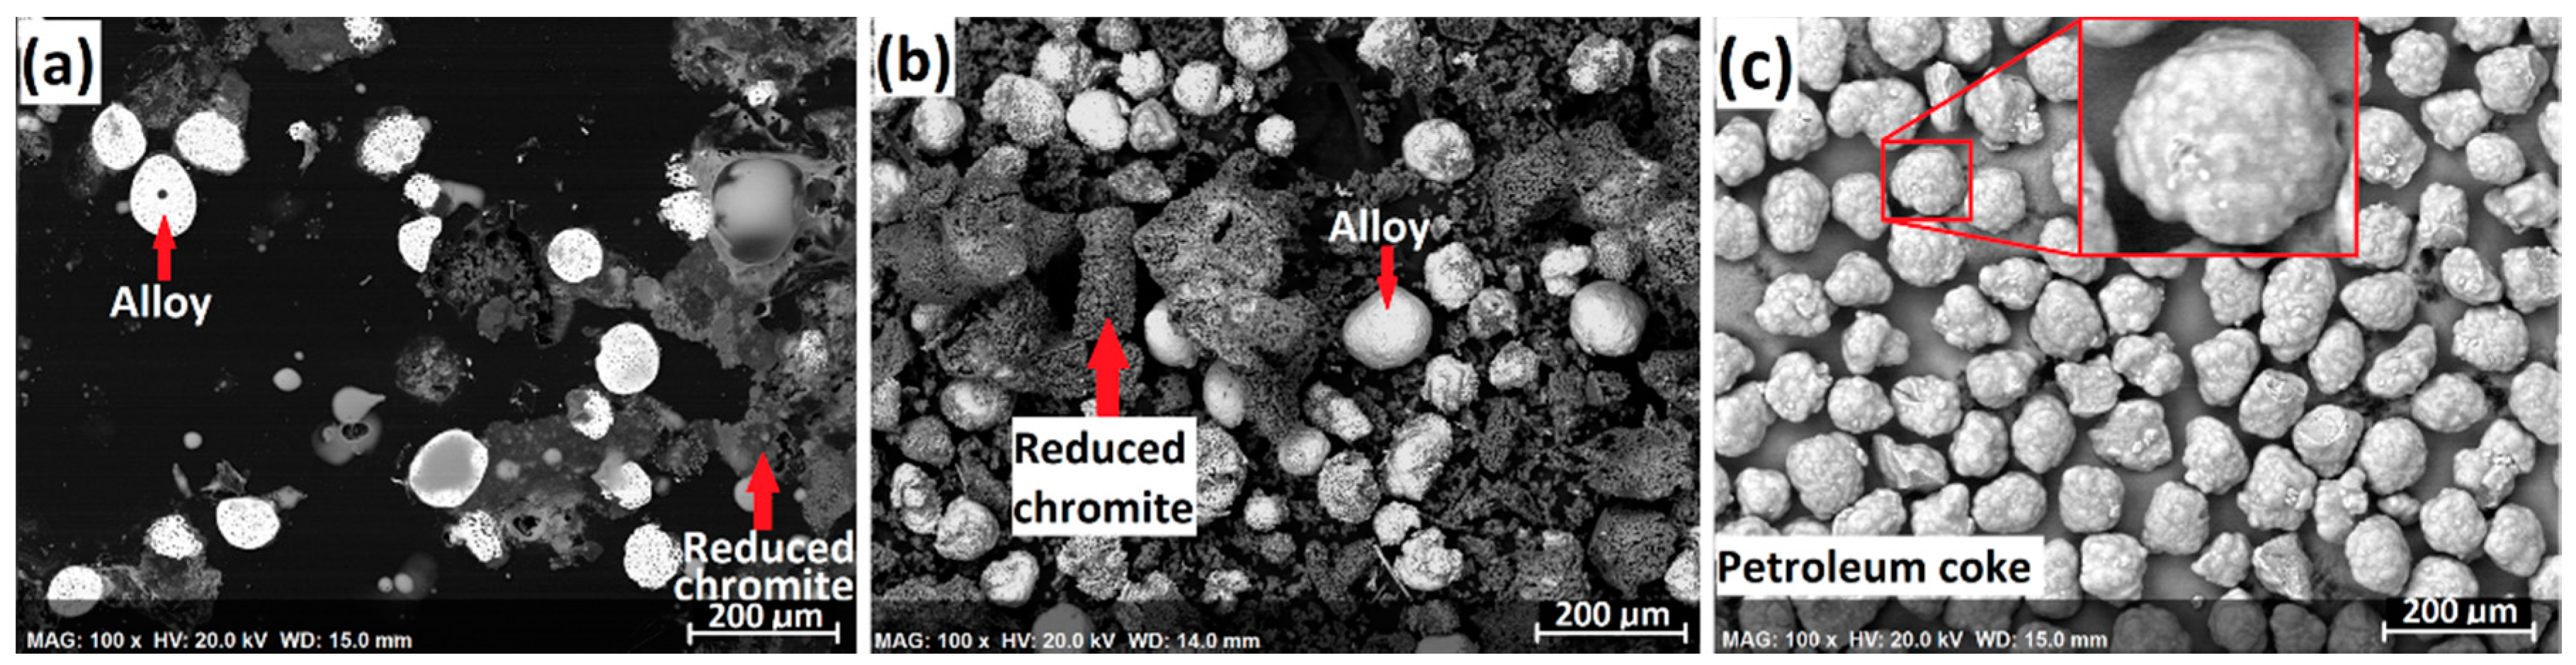
2 gases, peaking at 160 min (1300 °C). Interestingly, the CO peak for 180–300 µm chromite reduction was significantly higher at the beginning of reduction, although the chromite particle size range was significantly higher. It appears that using a larger particle size range of chromite was beneficial on the aspect of reduction kinetics. Cross-sections and surface morphologies of the reduced products are illustrated in
Figure 3. The white particles are the individual ferrochrome alloy particles that were formed from the segregation reduction of chromite in the presence of CaCl
2. The grey particles are the residual gangue and reduced chromite particles that are porous and composed of mainly MgAl
2O
4 and MgO phases, in which little alloy phase is present. This demonstrates that CaCl
2 is very effective in selectively removing the Cr and Fe from chromite followed by metallization on the carbon particles while minimizing the alloy formation from within the chromite particles.
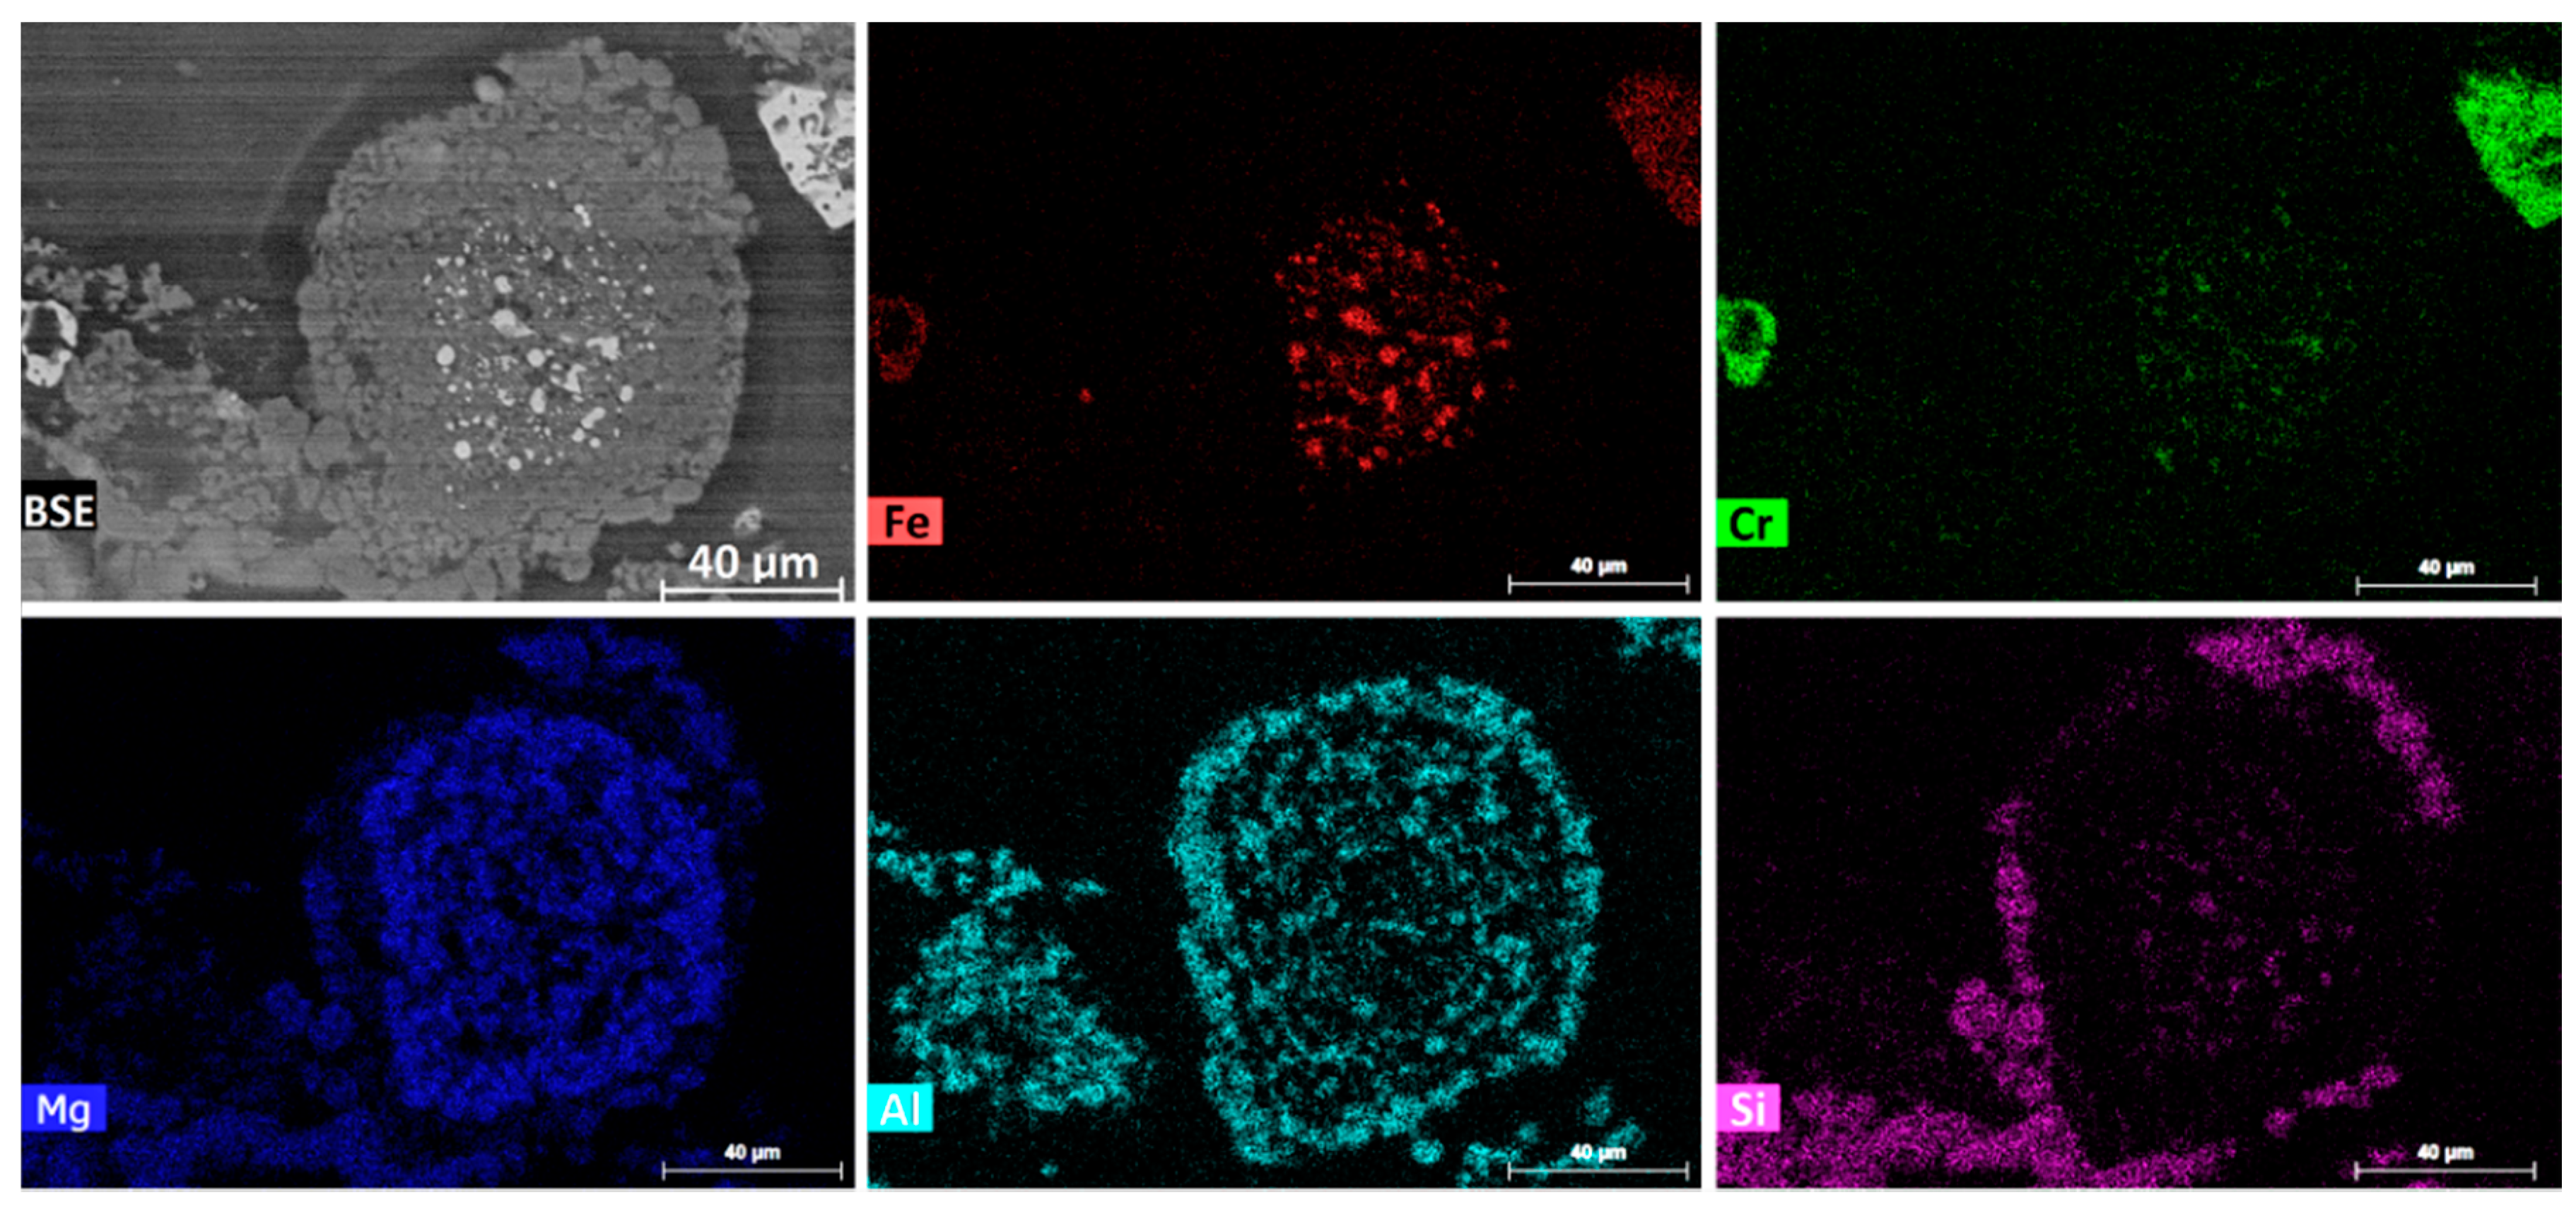
A very small portion of the reduced chromite particles still contained a number of discrete alloy particles that were generally less than 5 µm in size.
Figure 4 illustrates the backscattered electron (BSE) image and elemental mapping of a typical chromite particle of this type. The micron-sized discrete alloy particles were located in a zone close to the center of the chromite particle and were invariably Fe-rich. The elemental mapping image in
Figure 4 shows that the reduced chromite particle was composed of mainly MgAl
2O
4 and MgO phases, with the MgAl
2O
4 phase concentrated on the outer edge. It also shows the presence of likely molten siliceous gangue (purple) that
wetted the chromite surface.
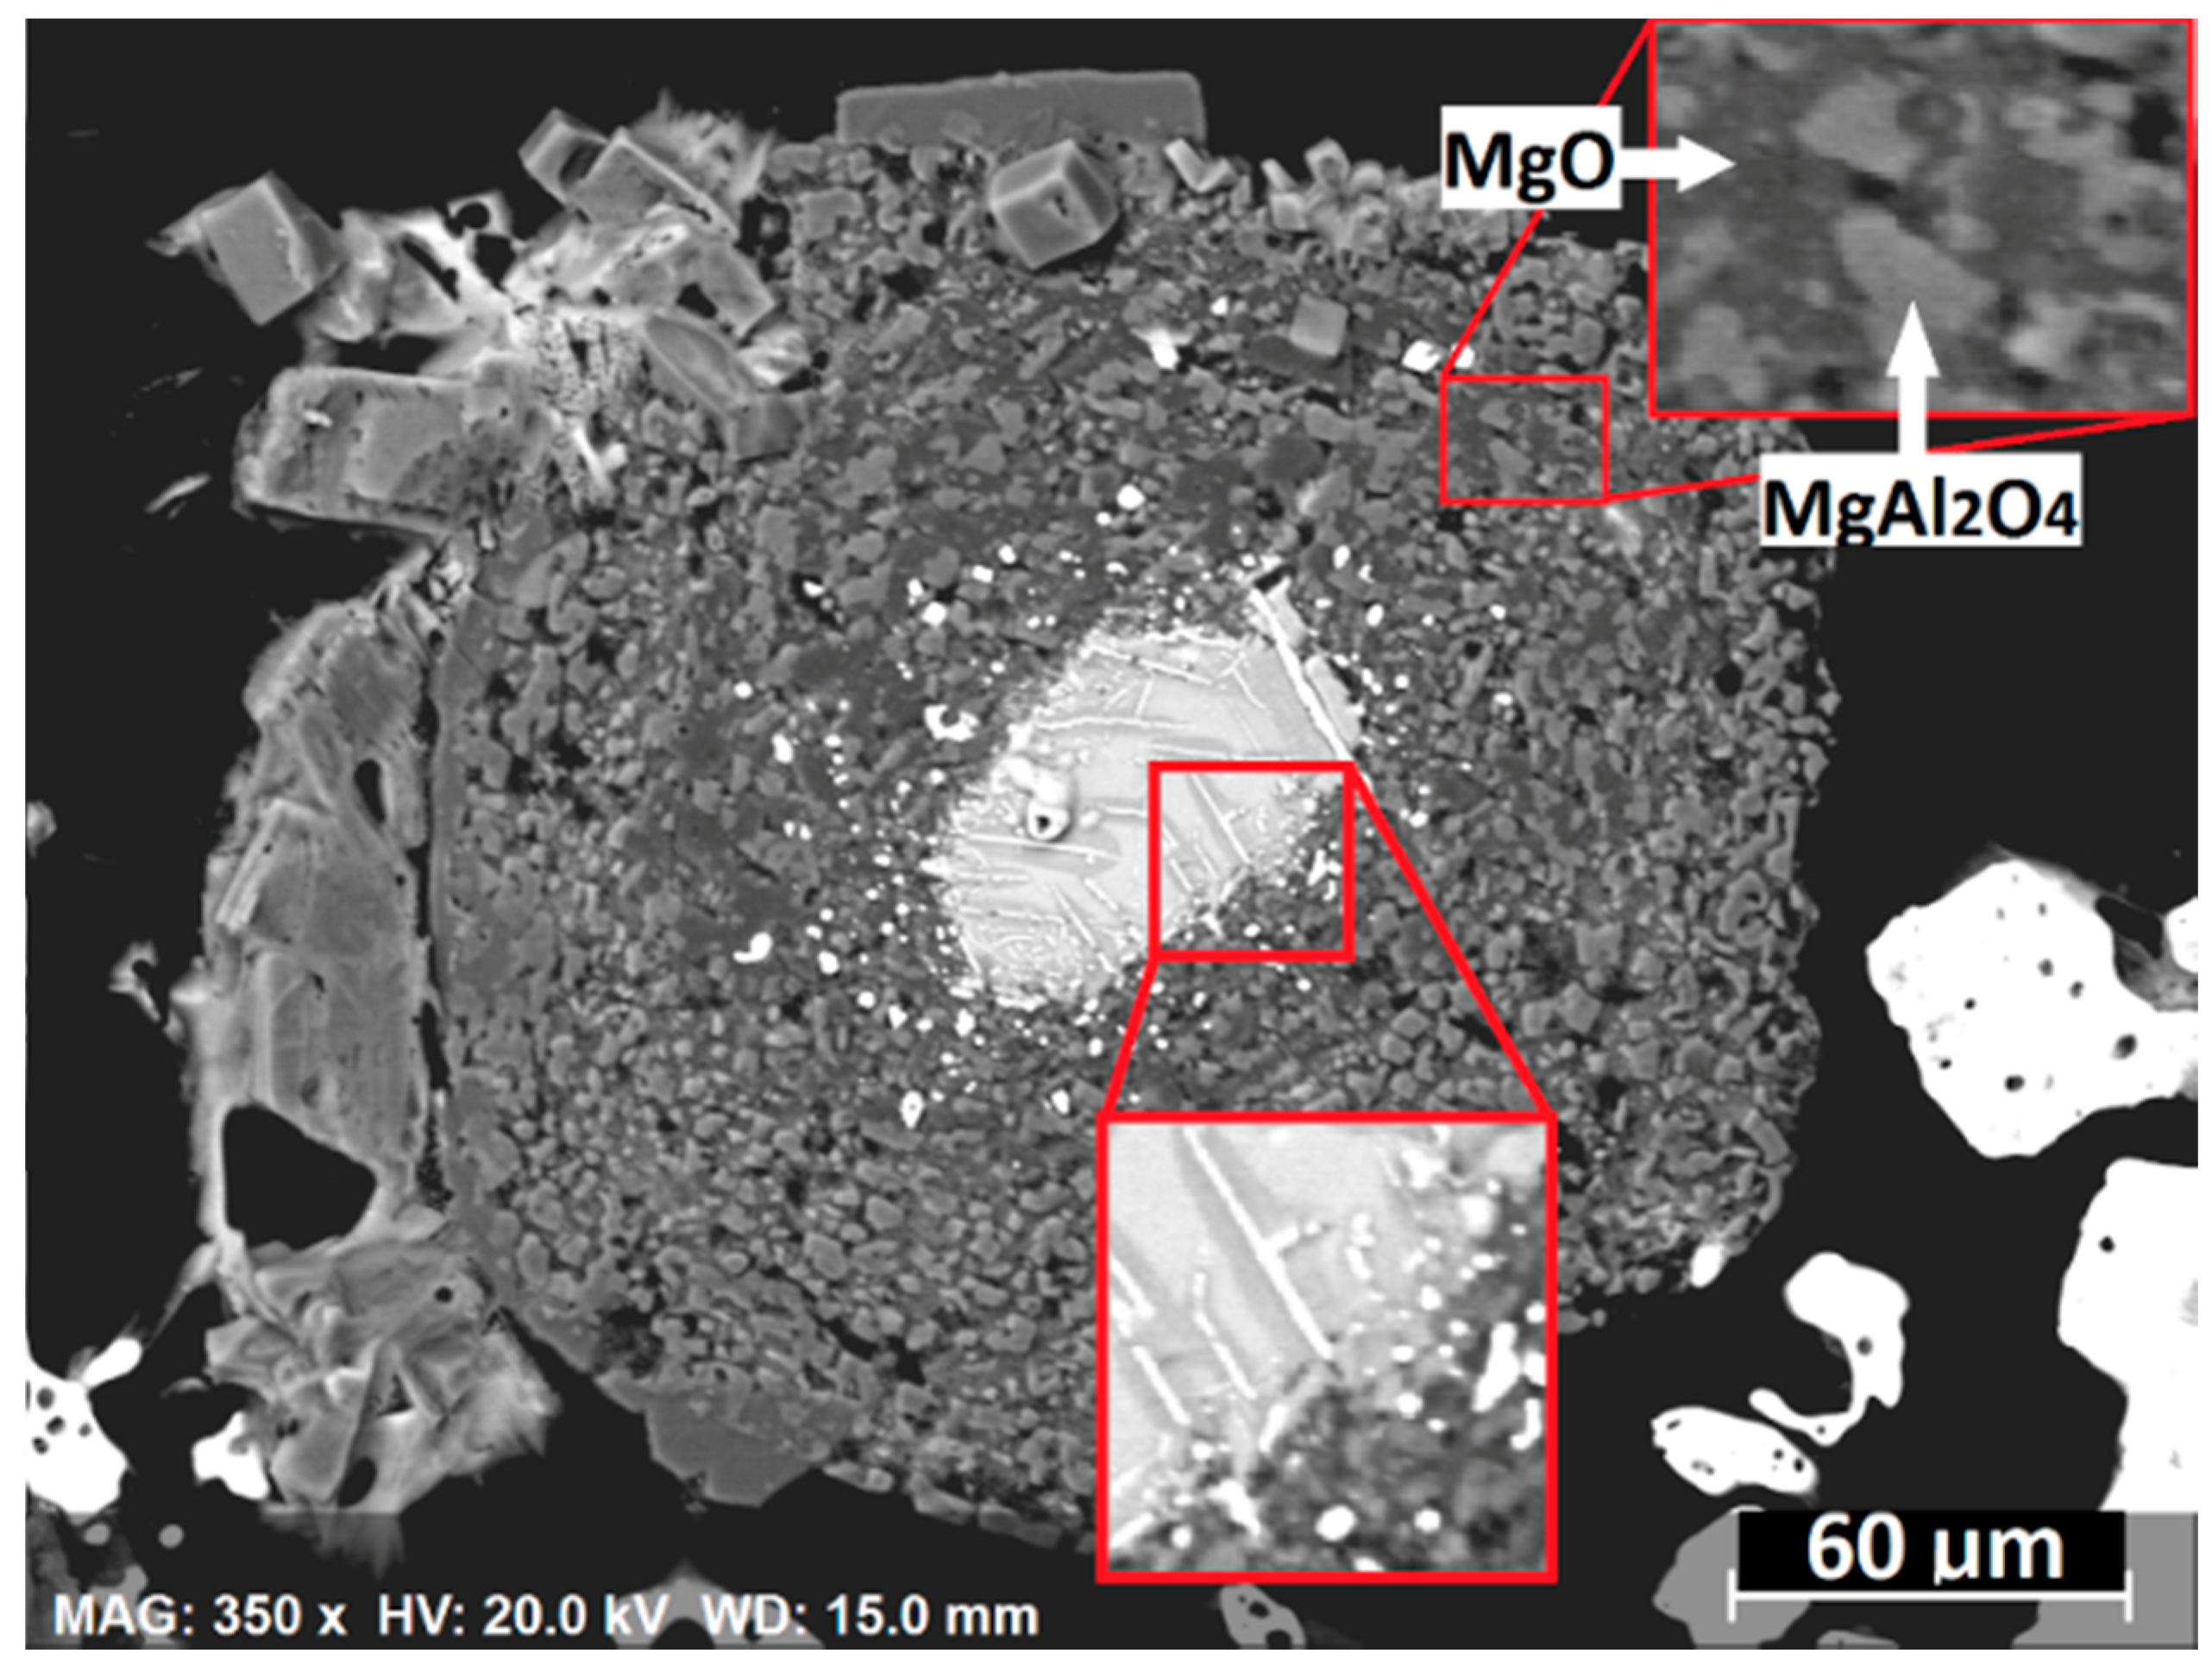
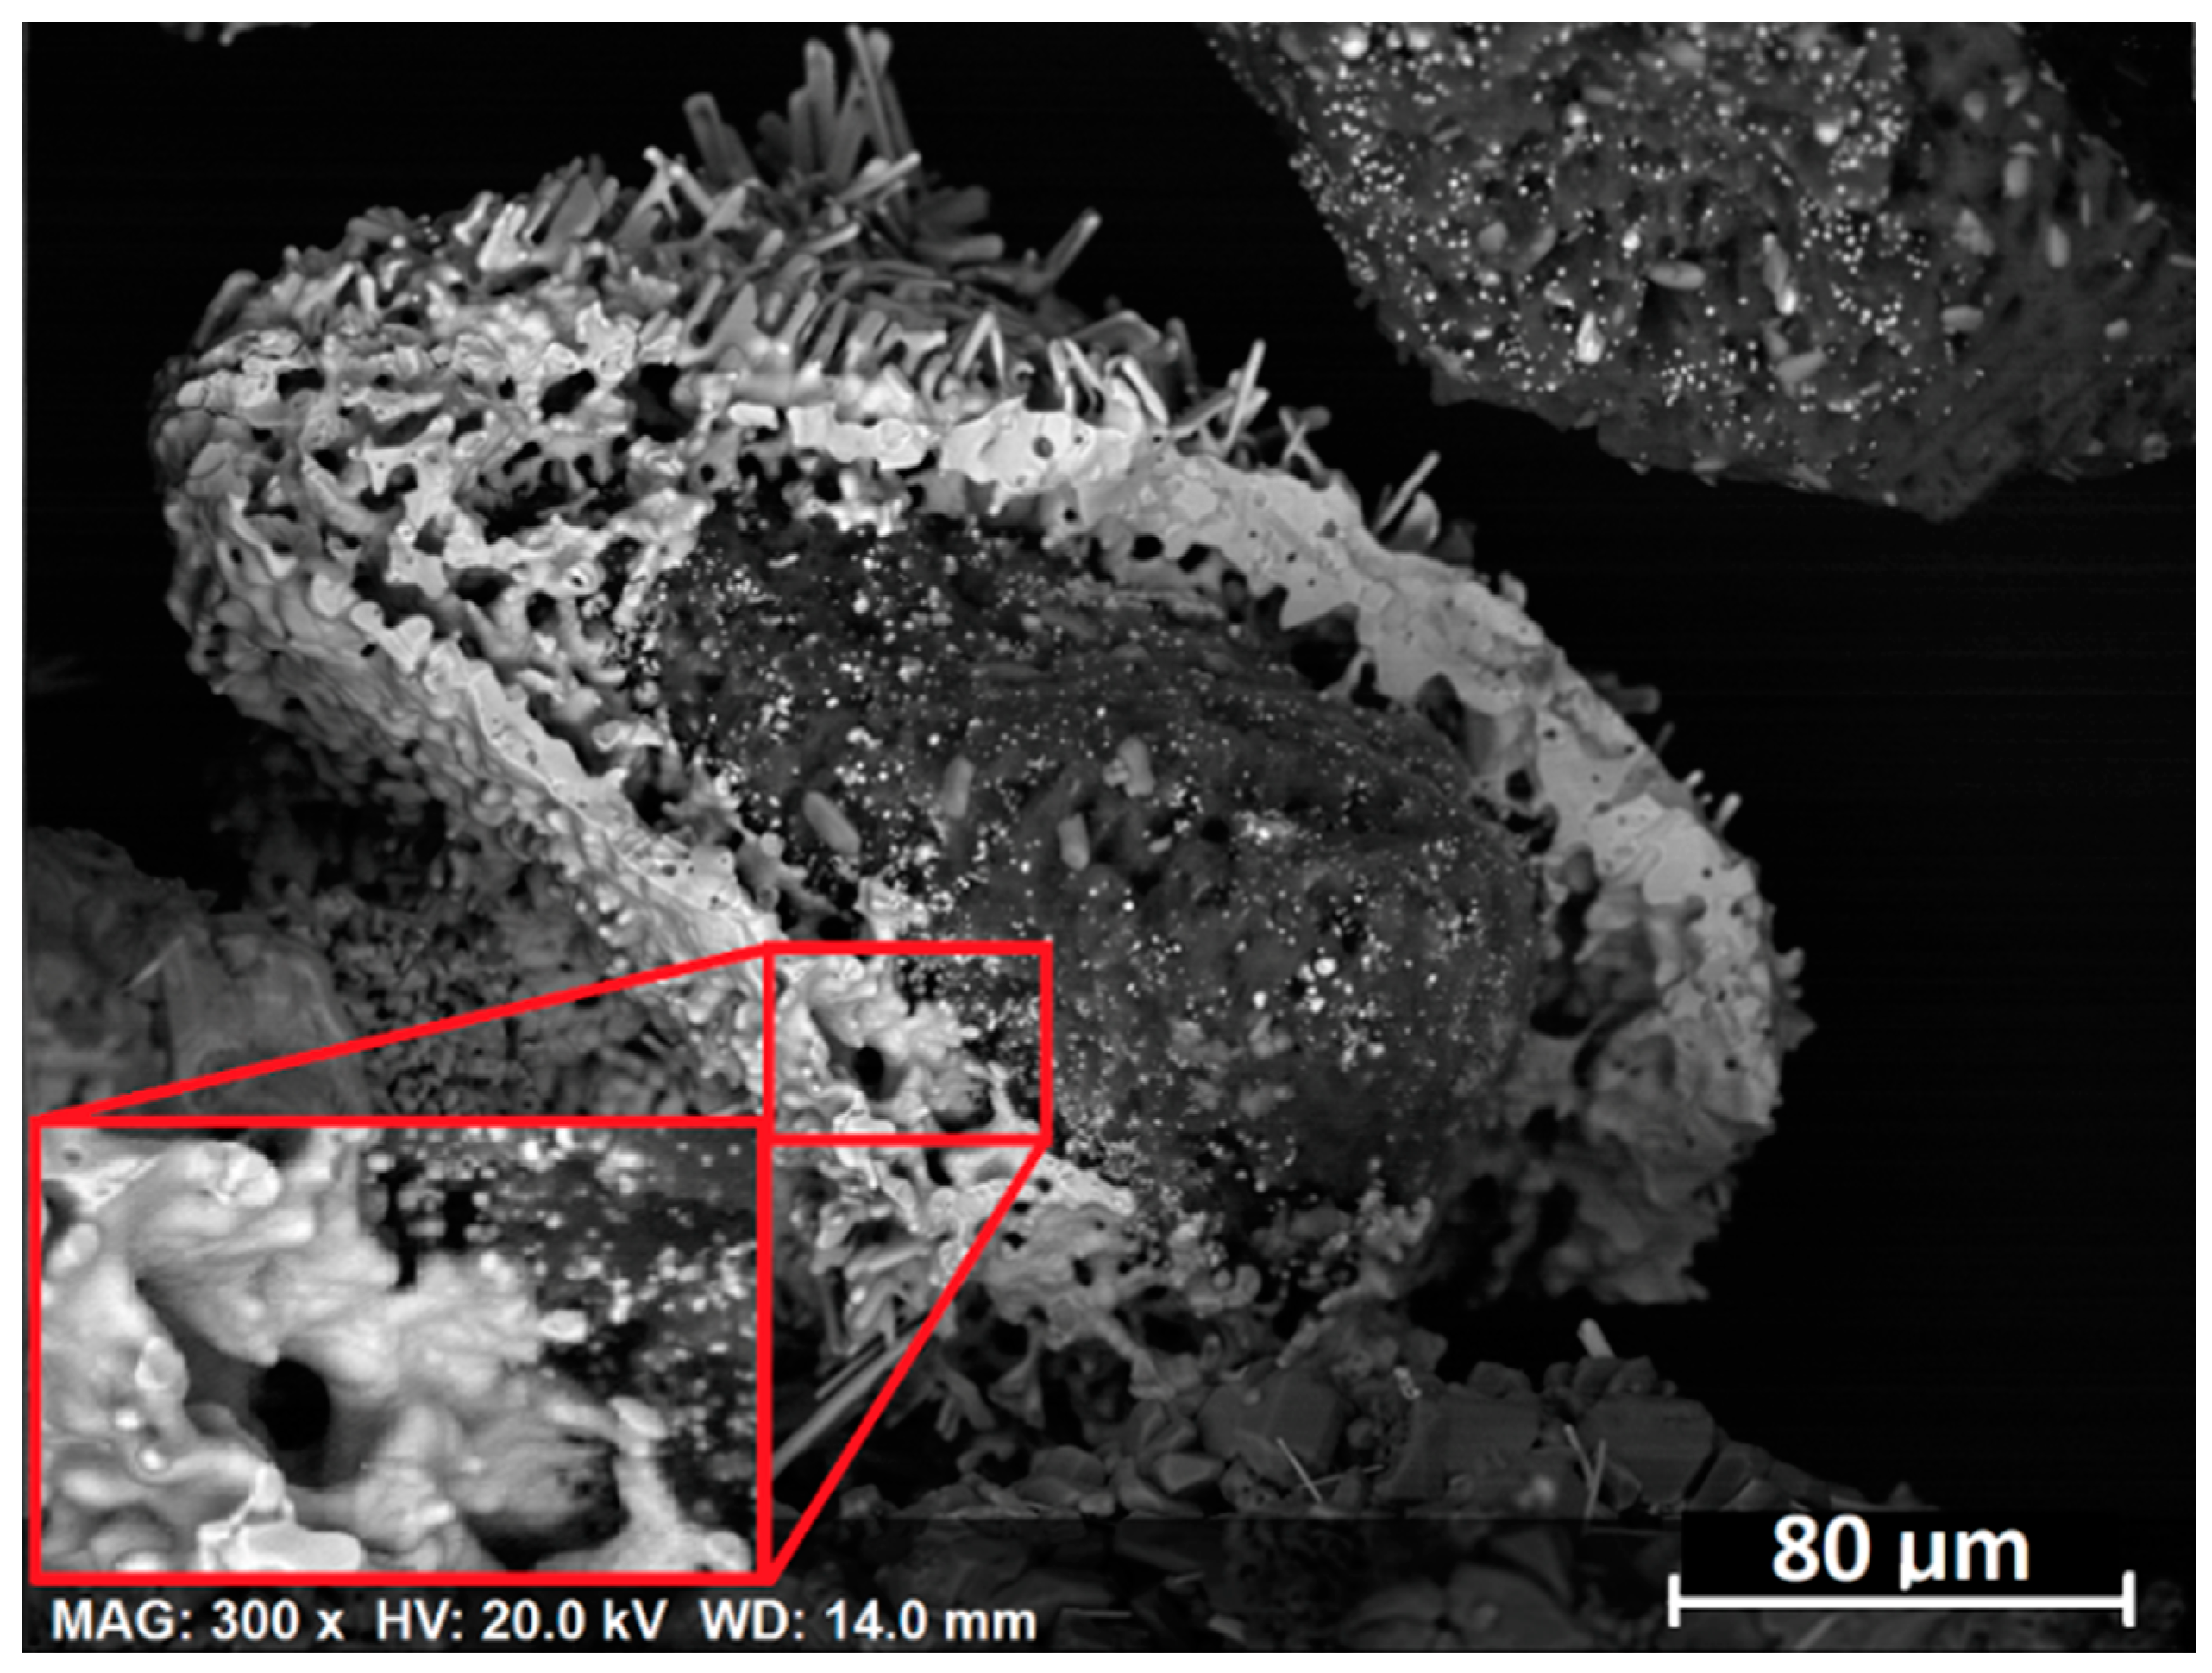
Figure 5 illustrates a partially reduced chromite particle, demonstrating an intermediate stage in the formation of the discrete Fe-rich alloy particles. Within each chromite particle, segregation by CaCl
2 and reduction/metallization of the Cr and Fe are two competing processes. At the beginning of segregation reduction, the chromite particles were surrounded by gaseous or molten CaCl
2. Segregation took place effectively resulting in the removal of Cr and Fe from the chromite particle, forming a reacted rim surrounding the unreacted chromite core. The rim became thicker with the progress of segregation reduction, which was accompanied by the shrinking unreacted core. At some point, the rim became appreciably thick and the chloridizing agent became less effective in segregating the unreacted core. The oxygen potential within the chromite was eventually low enough to cause preferential Fe reduction and metallization within the chromite core, forming an Fe-rich alloy whisker surrounded by a secondary chromite zone that was Fe-deficient [
10]. This Fe-deficient chromite appears as a darker zone surrounding the white whisker-shaped Fe-rich alloy as shown in
Figure 5. The chloridizing agent was incapable of segregating the already-formed alloy phase. Therefore, the Fe-rich alloy phase remained in the chromite particle when the chromite core continued to shrink, which would disappear as shown in
Figure 4. It appears that the Fe-rich alloy gradually changed its shape from whiskers to spheres driven by the minimization of the surface energy of each individual alloy particle, eventually forming the micron-sized spherical Fe-rich alloy particles.
3.6. Segregation Reduction Mechanism
To investigate the carbothermic segregation reduction mechanism of chromite in the presence of CaCl
2, the possible reactions between the chromite ore and the CaCl
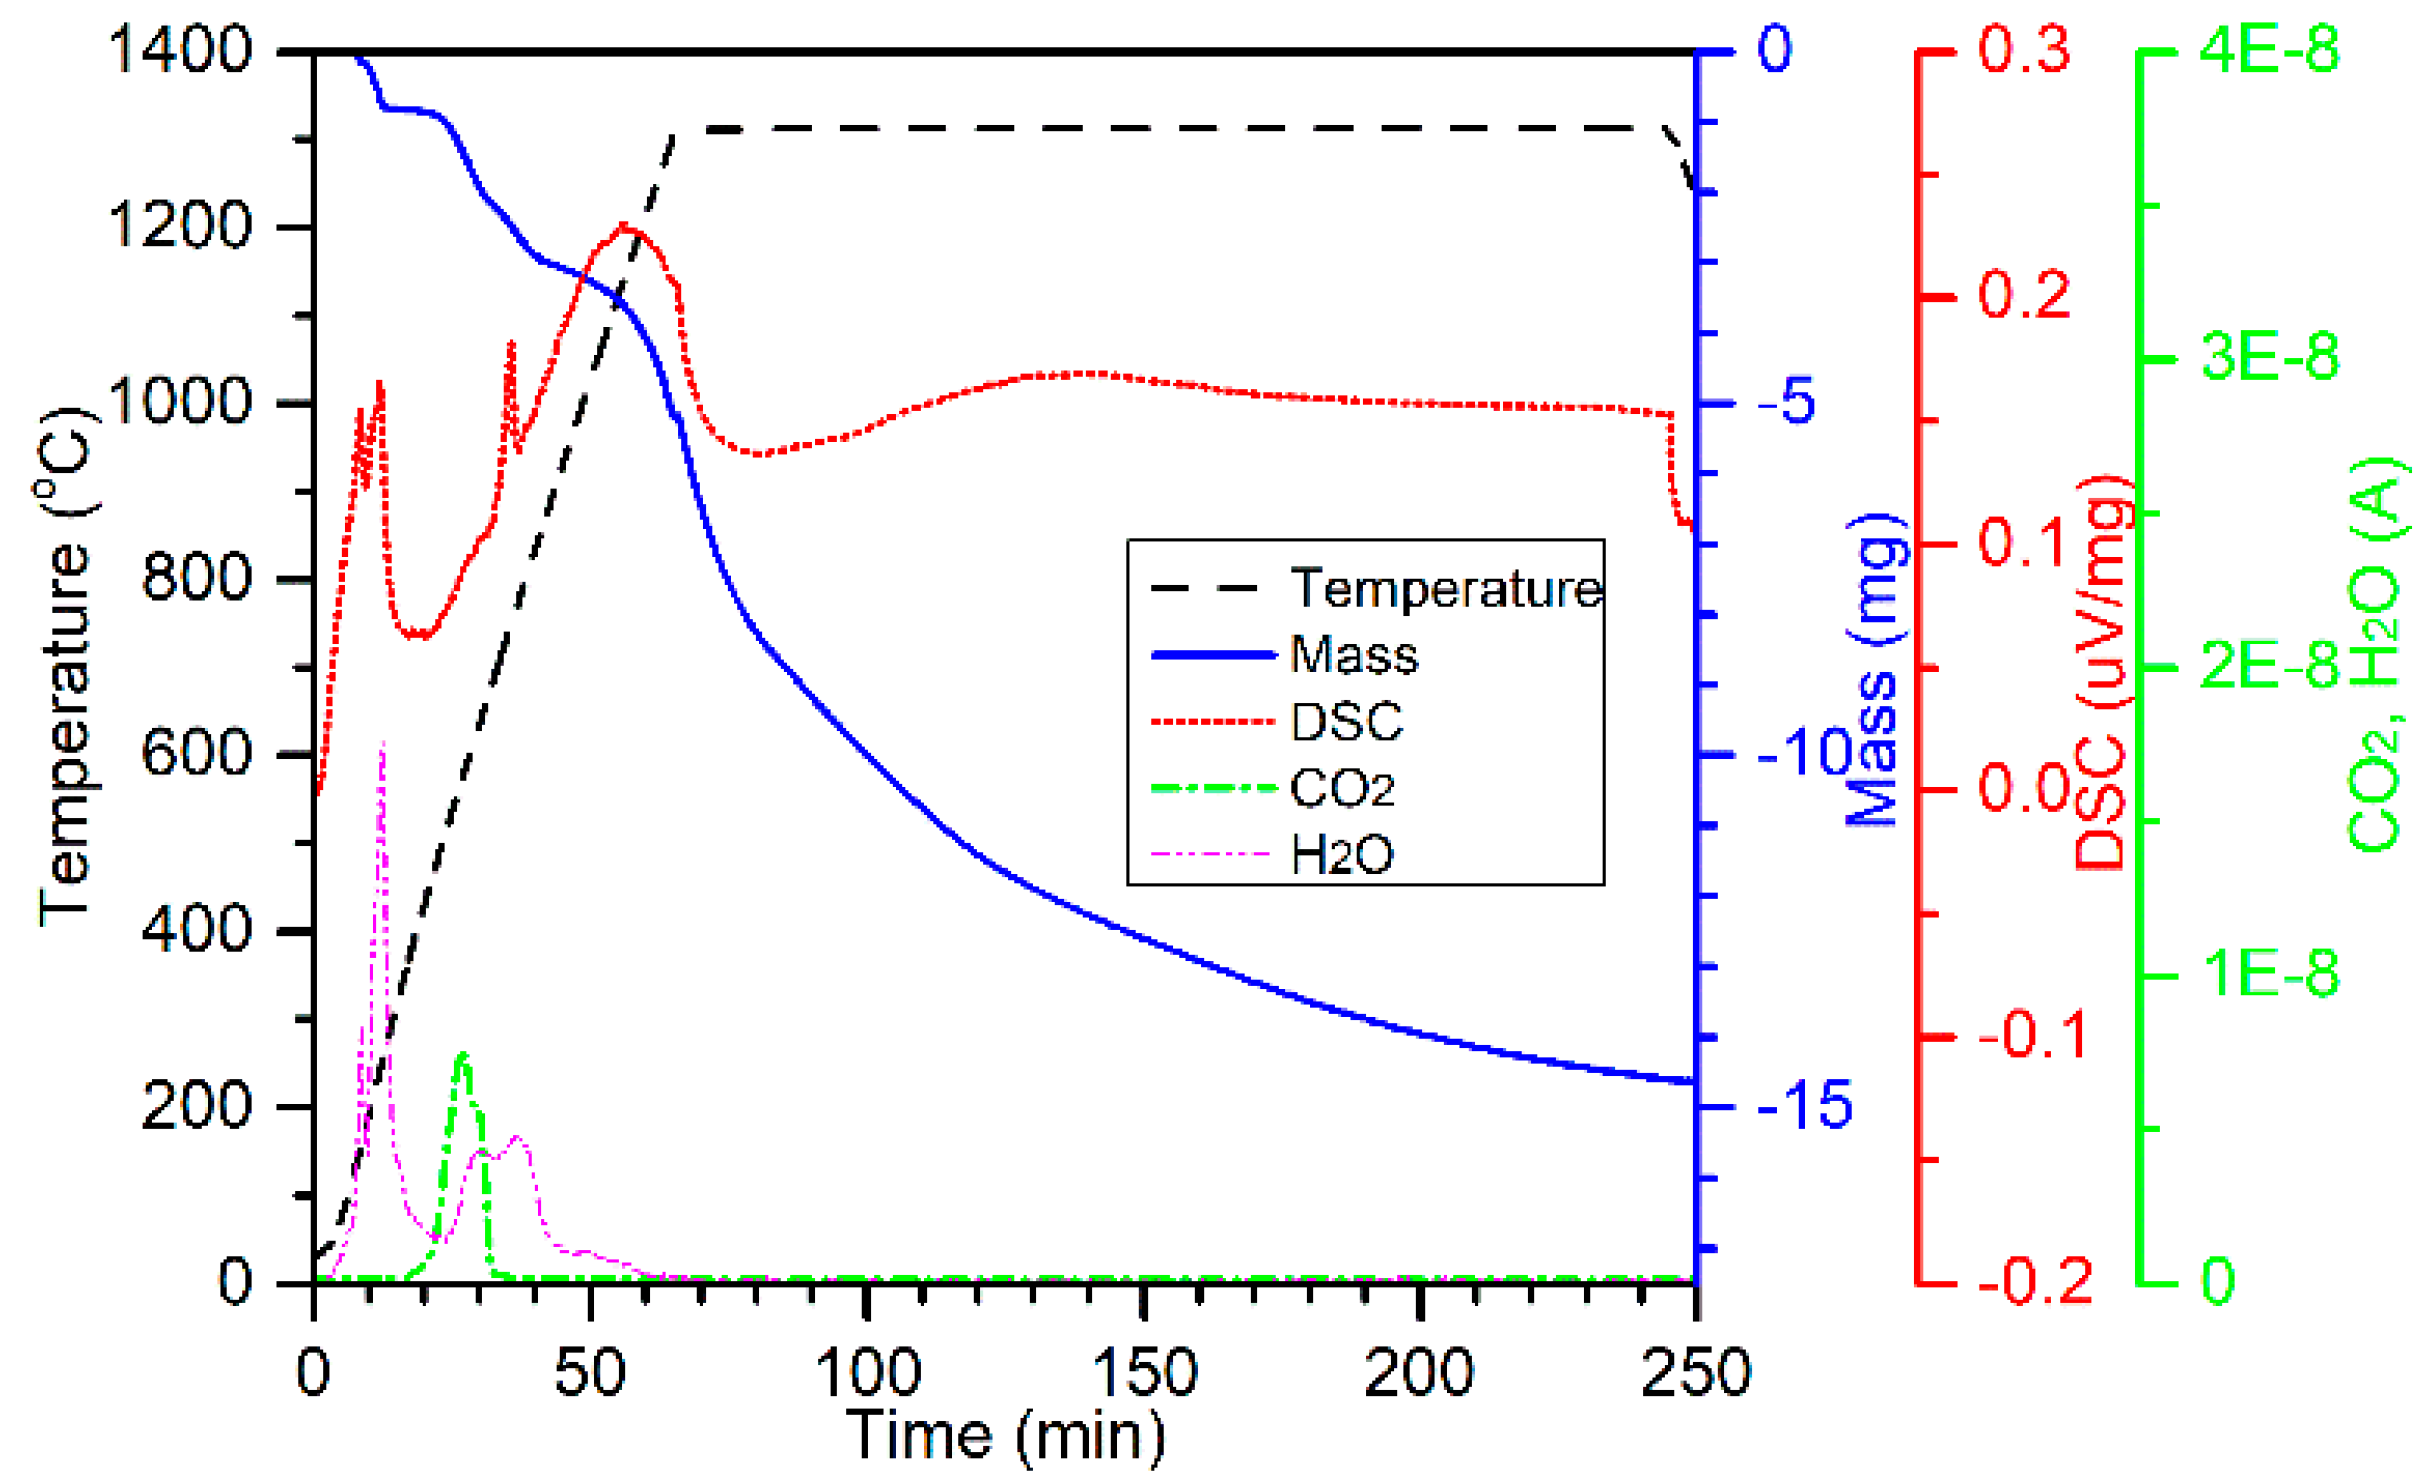
2 were studied by the TG-DSC-MS test. The 75–105 µm chromite fraction was mixed with 30 wt % ground CaCl
2 without the addition of any carbonaceous reductant. Approximately 70 mg of the mixture was taken and heated to 1300 °C in Ar at 20 °C/min and held for 3 h before cooling to room temperature (
Figure 13). As seen, two endotherms took place at about 150 °C and 250 °C, corresponding to two H
2O peaks and a mass loss. These two endotherms resulted from the thermal dehydration of CaCl
2·
xH
2O (
x ≈ 0.3). The slight hydration of CaCl
2 was due to the absorption of moisture during sample preparation. The formation of CO
2 at about 580 °C was from the thermal decomposition of magnesite, which was also observed in the furnace tests (e.g.,
Figure 2). Melting of CaCl
2 took place at about 756 °C, which is marked by the presence of the third endotherm. Thermal dehydration of clinochlore and phlogopite started at about 500 °C and continued until the temperature reached about 1280 °C, which is represented by the continuous mass loss and evolution of gaseous H
2O. Mass loss continued at the isothermal temperature of 1300 °C, which could possibly be from the continuous vaporization of the molten CaCl
2. XRD analysis of the sample collected from this test suggests the presence of chromite and wadalite (Ca
6Al
5Si
2O
16Cl
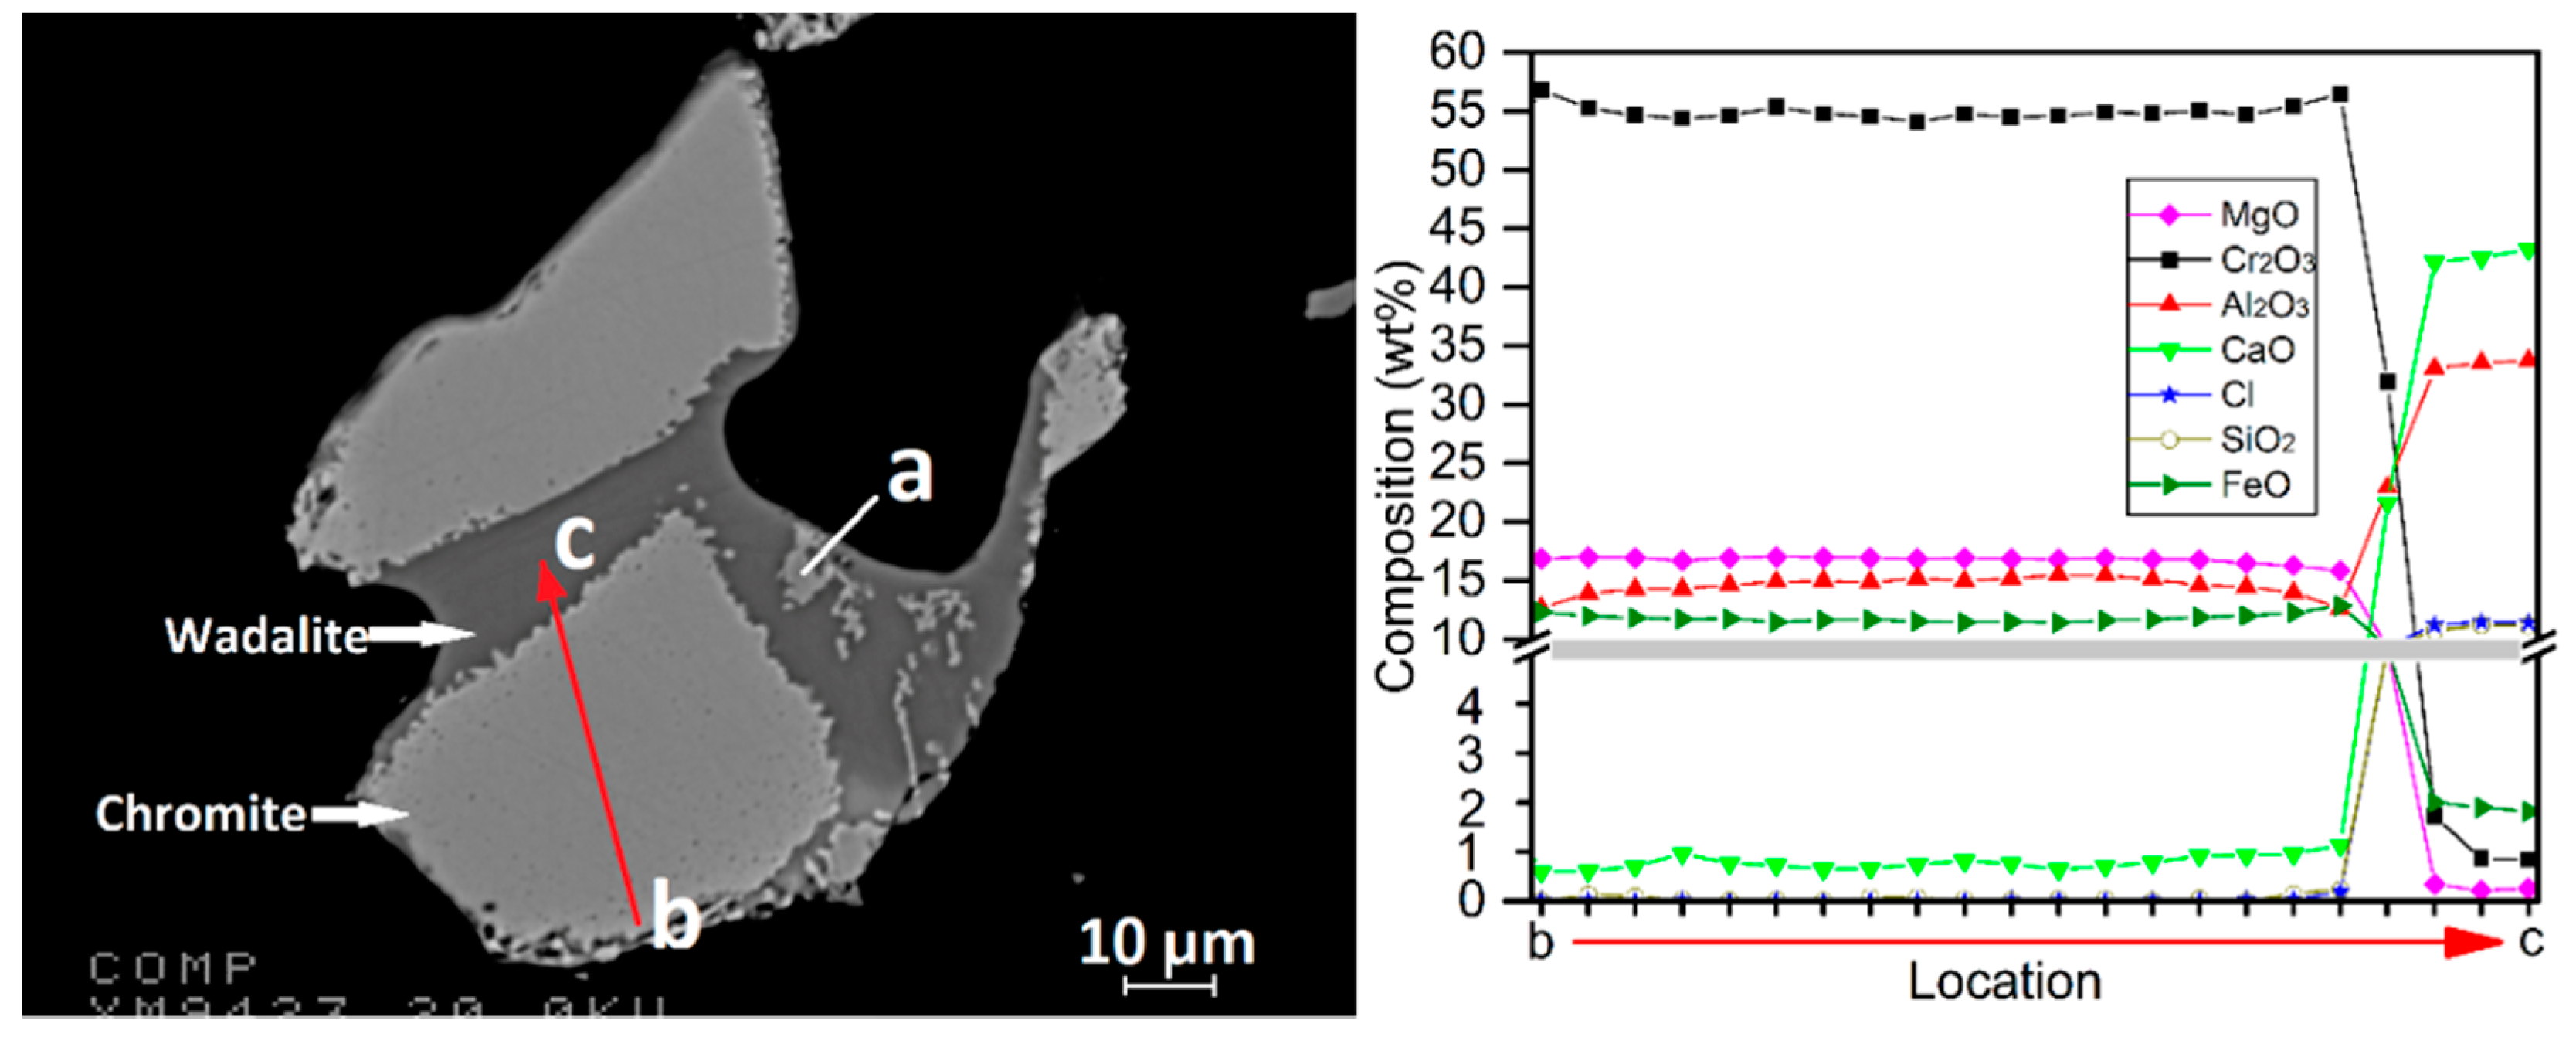
3) as the two dominant species. Morphology of the wadalite in the sample as shown in
Figure 14 suggests that it was molten at 1300 °C. Dissolution of the adjacent chromite particles by the molten wadalite resulted in its disintegration, forming discrete chromite particles disseminated in the molten wadalite phase, such as particle
a. Based on EPMA analysis as shown in
Figure 14, the composition of the chromite particle can be represented as (Mg
0.8Fe
0.2)(Cr
1.4Al
0.5Fe
0.1)O
4 with an average CaO concentration of 0.8 wt %. Chromite containing as much as 4.2 wt % CaO was identified by EPMA. In comparison, the chromite phase in the pristine ore sample (Fe
0.5Mg
0.5)(Cr
1.4Al
0.5Fe
0.1)O
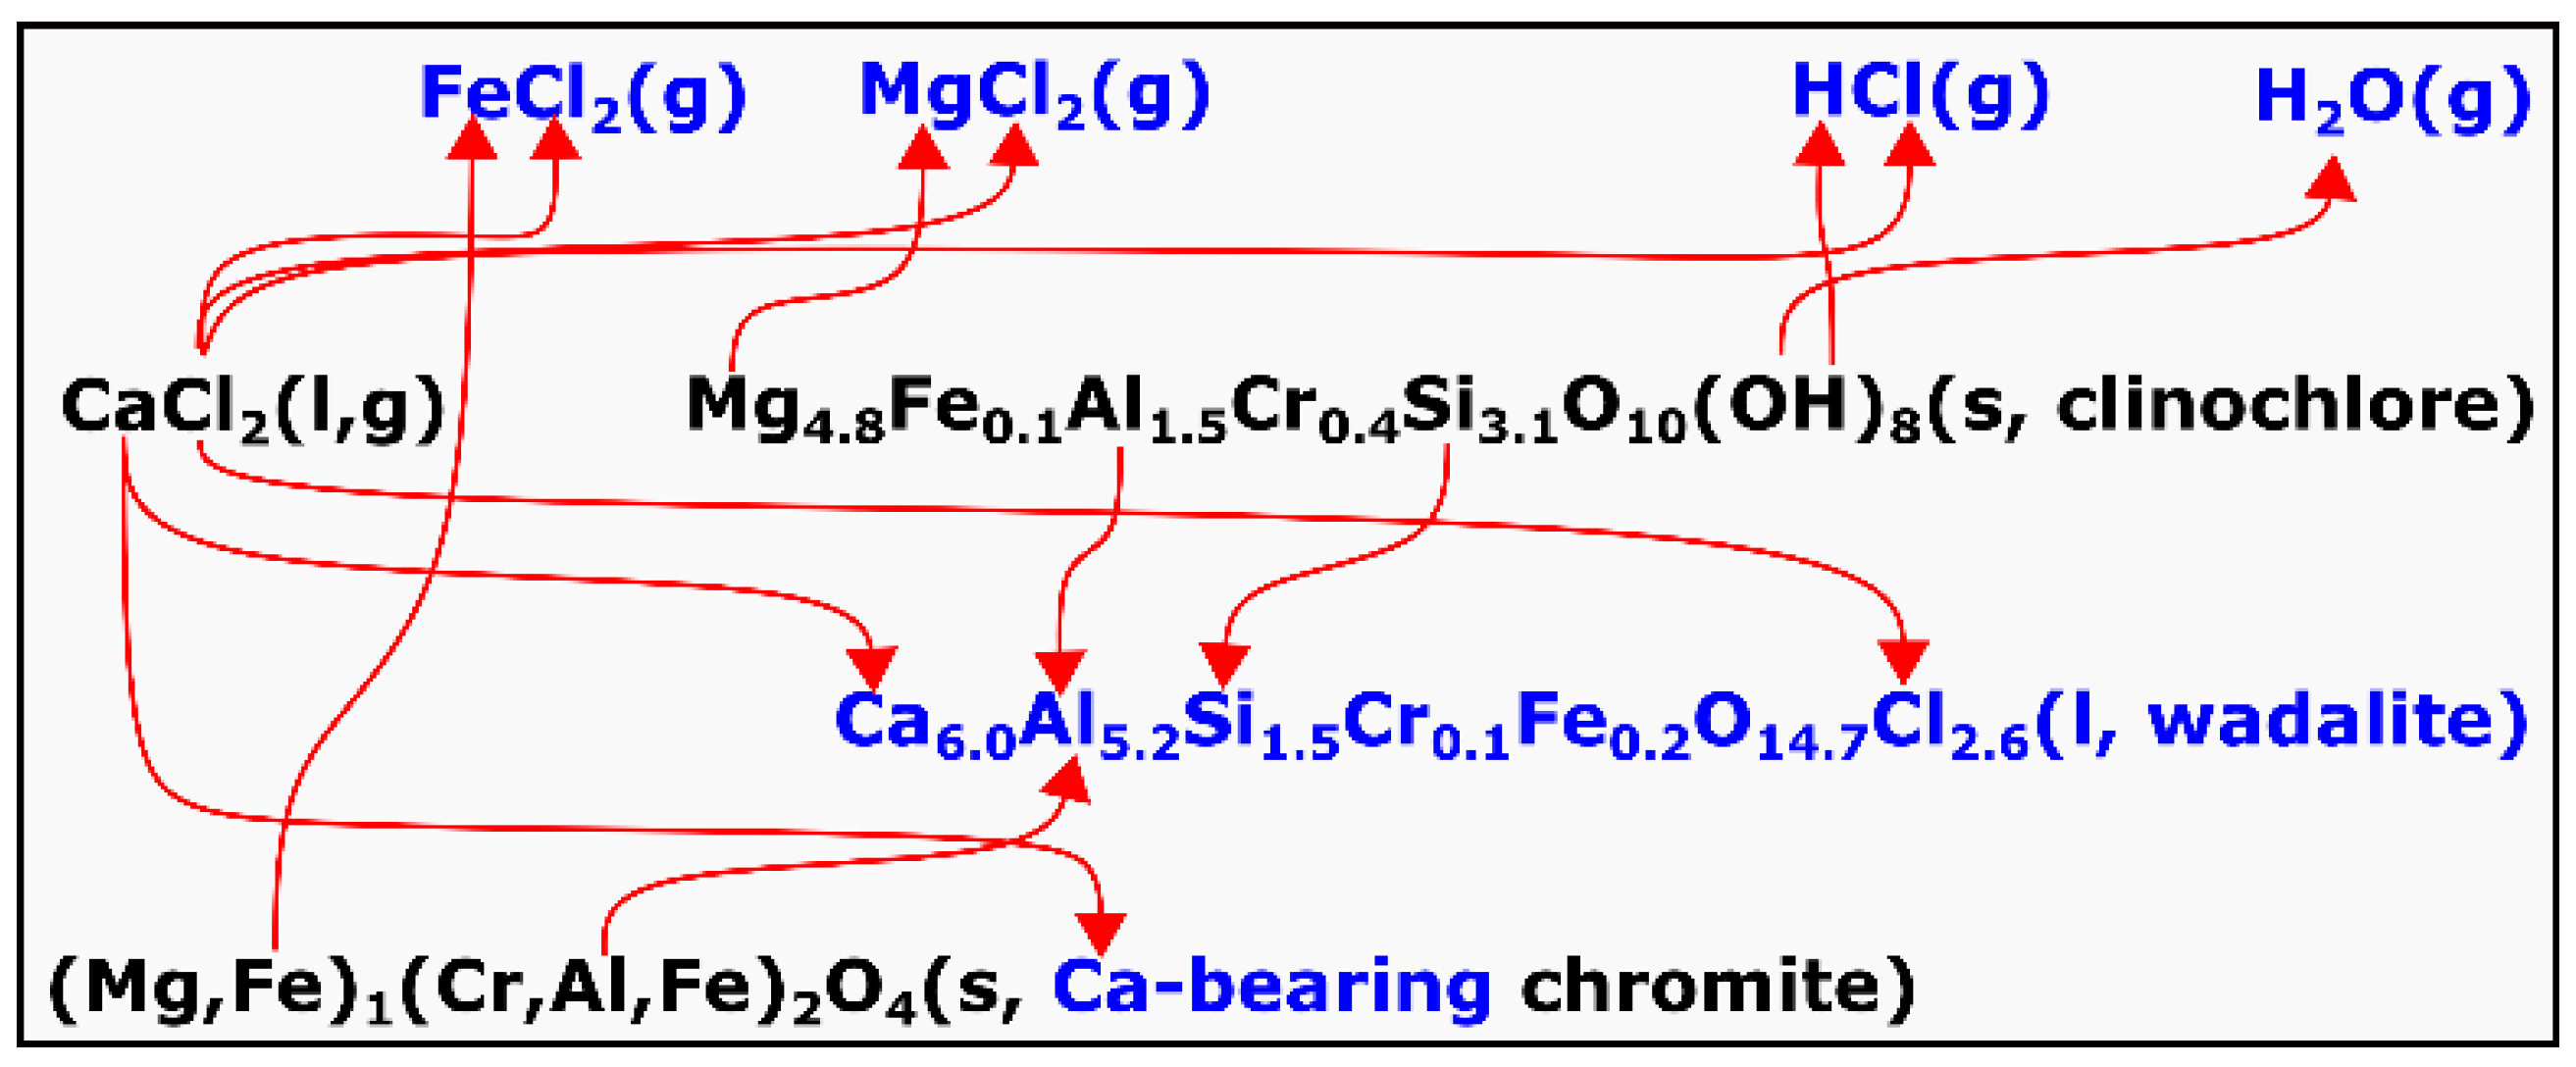
4 contained only trace amounts of CaO, which is about three orders of magnitudes lower. The formation of wadalite and the Ca-bearing chromite is suggested to be due to sequential reactions involving CaCl
2, which can be represented by Equation (7) and
Figure 15. This was proposed based on the following analyses.
The average stoichiometry of the clinochlore in the chromite ore can be represented as Mg
4.8Fe
0.1Al
1.5Cr
0.4Si
3.1O
10(OH)
8 based on the EPMA analysis. It was reported by Villieras et al. [
31] that the thermal dehydroxylation of clinochlore leads to the formation of a heterogeneous structure with the presence of micropores. This formation of micropores would have accelerated its reaction with molten CaCl
2. The wadalite phase formed was highly aluminous with an Al/Si molar ratio of 2.5, whereas it was only 0.49 in the clinochlore, suggesting that Al
2O
3 was produced by the dissolution of chromite. This is evidenced by the gradual disintegration of chromite in the presence of the molten wadalite (
Figure 14). It was further confirmed by the EPMA line scan along the arrow
b → c as shown in
Figure 14 because the incongruent dissolution of chromite into the wadalite phase led to the decreasing Al
2O
3 concentration gradient from the center of the chromite particle to the boundary between chromite and wadalite. Evidenced by the drastic decrease in Fe
2+ of the chromite phase (Mg
0.8Fe
0.2)(Cr
1.4Al
0.5Fe
0.1)O
4 after the test when comparing to that of the pristine chromite (Fe
0.5Mg
0.5)(Cr
1.4Al
0.5Fe
0.1)O
4, the removal of octahedral FeO became apparent, which was probably due to chloridization forming volatile FeCl
2. In addition, other chlorides were likely to have formed, such as gaseous MgCl
2, from chloridization of Mg
2+ in the clinochlore. Formation of HCl was also likely in the presence of gaseous H
2O, which was released from the dehydroxylation of clinochlore. Evolution of all the gas species that appear in
Figure 15 and their subsequent removal by the Ar flow resulted in the continuous mass loss, which is shown in
Figure 13. However, this does not exclude the possible formation of other chlorides such as CrCl
2, CrCl
3, and AlCl
3, etc.
Although wadalite was the main product of the interactions between CaCl
2 and the chromite ore, other species were also identified, such as Ca
2SiO
4 and a Cl-bearing calcium silicate, which are shown in
Figure 16. Discrete Ca-bearing chromite particles were produced from the interactions (
Figure 15) and were spread in the likely molten silicate at 1300 °C, which subsequently produced wadalite, Ca
2SiO
4, and the Cl-bearing calcium silicate upon solidification.
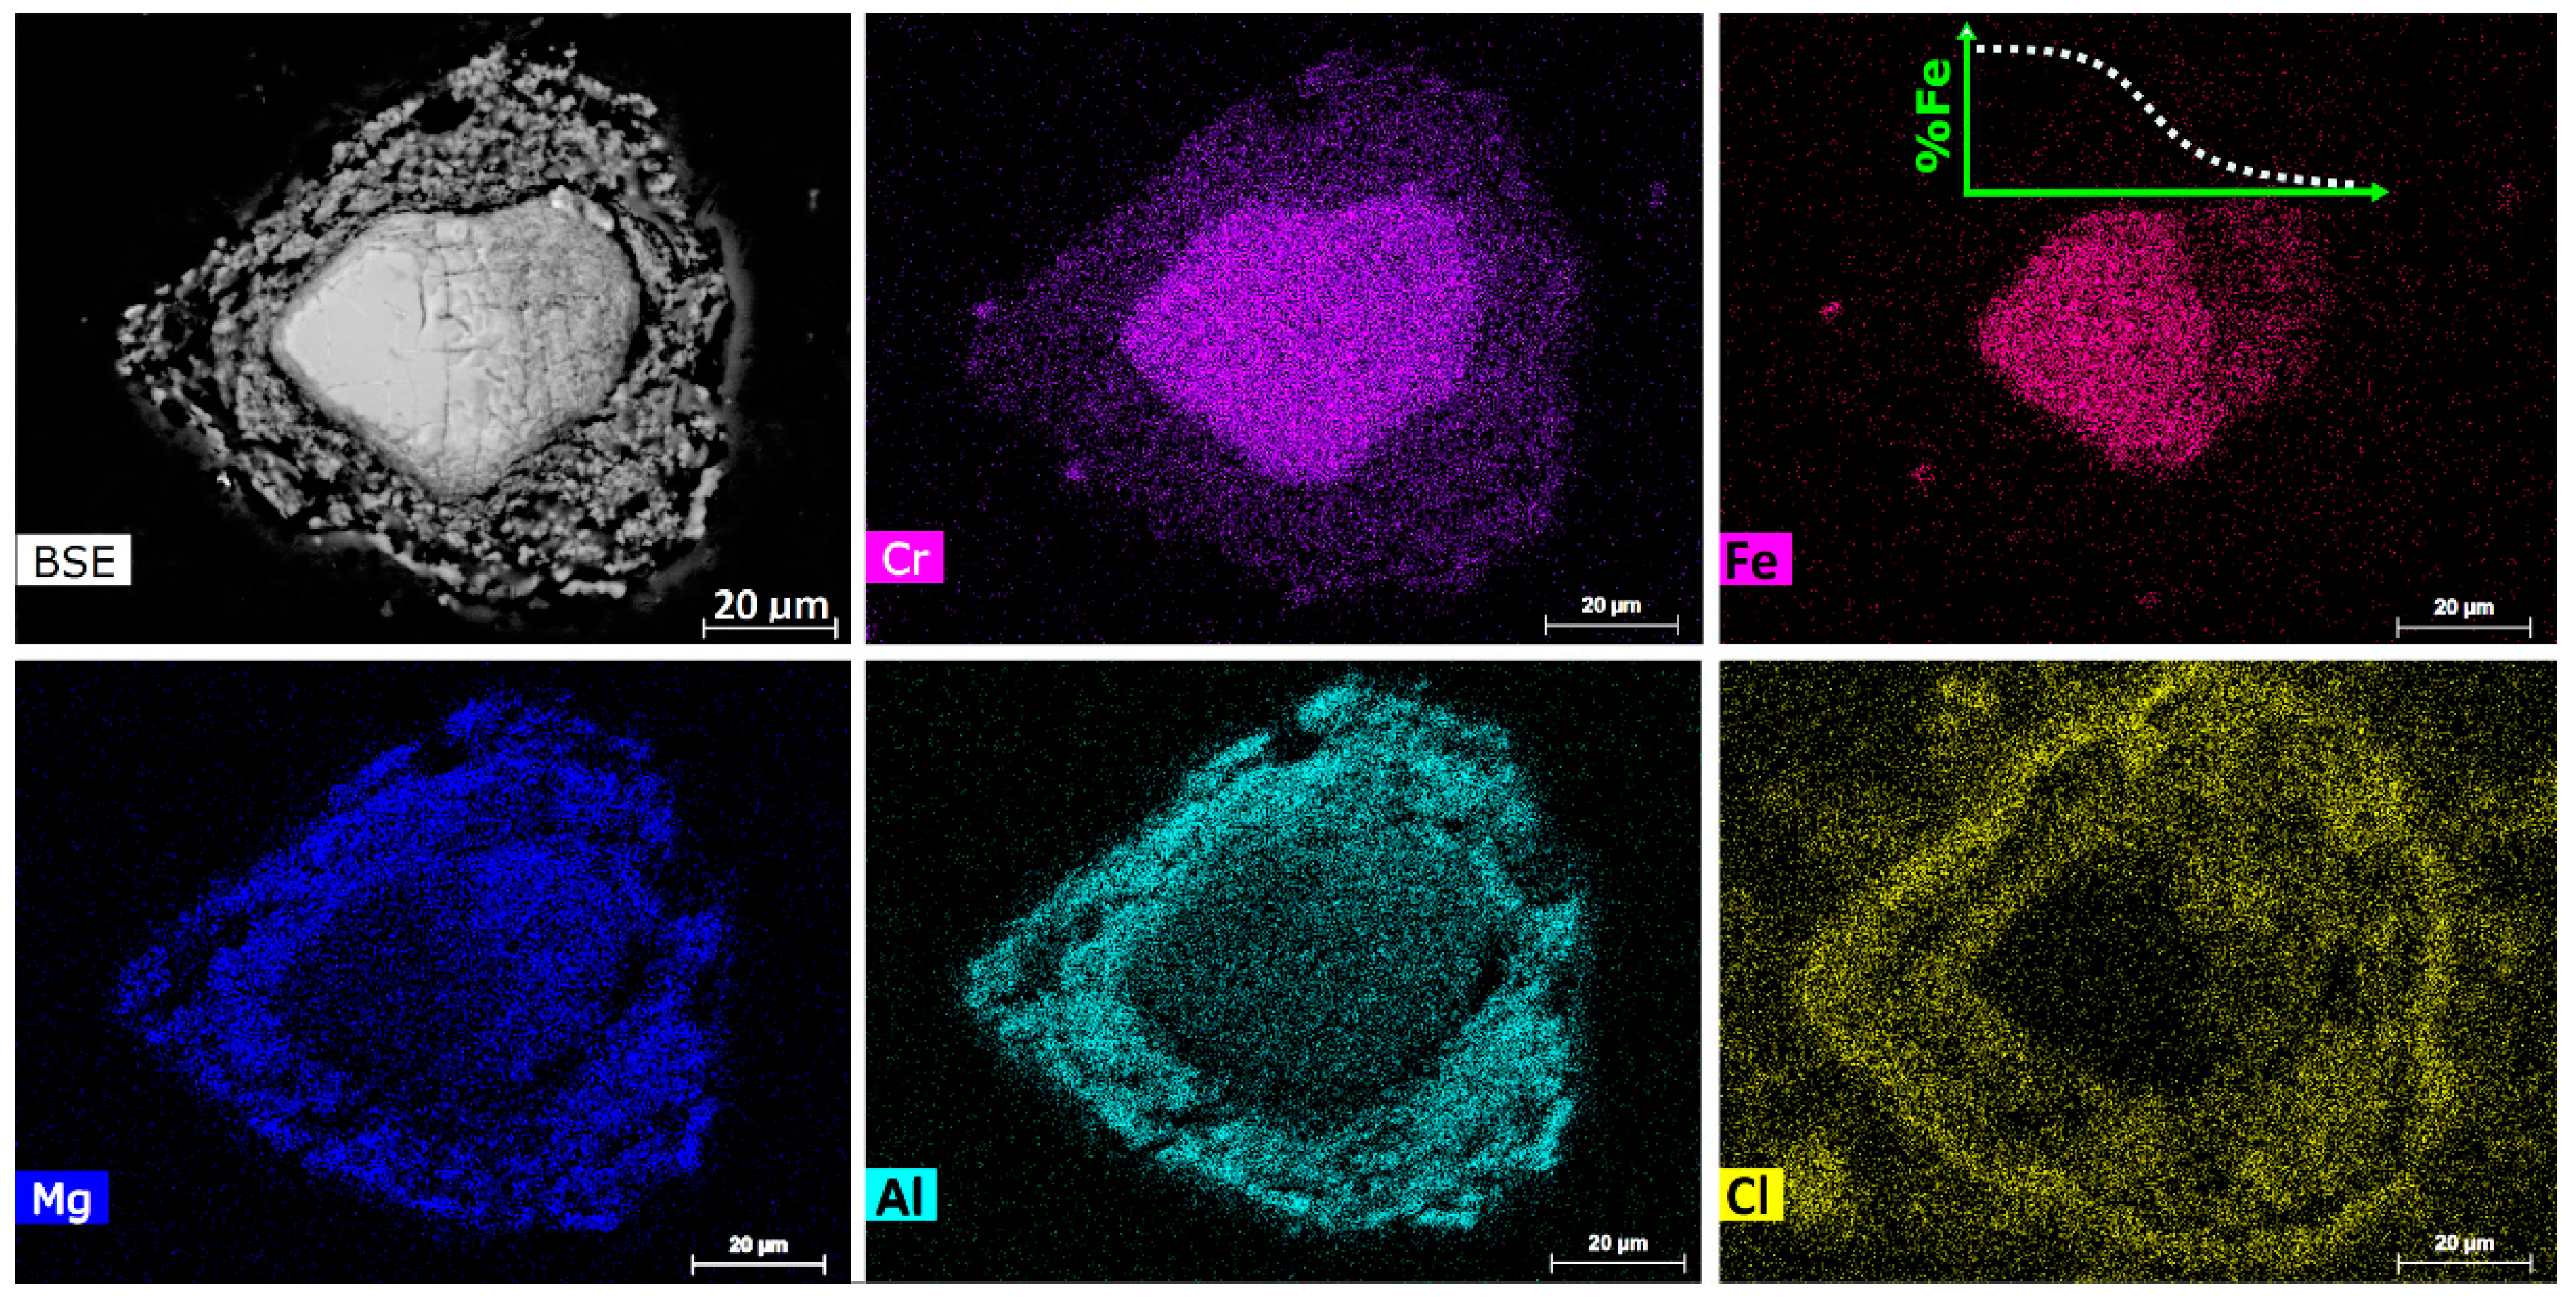
Another TG-DSC-MS test was performed on 75–105 µm chromite mixed with 30 wt % CaCl
2 and 25 wt % graphite powder (25–37 µm). A partial reduction was achieved by heating at 20 °C/min to 1300 °C, followed by immediate cooling to room temperature. EPMA analysis of the partially reduced sample showed the formation of ferrochrome alloys on carbon particles with a Cr/Fe ratio of about 1.4, which is lower than that of the pristine chromite (i.e., Cr/Fe = 2.0).
Figure 17 illustrates the BSE and elemental mapping images of a partially reduced chromite particle. The residual chromite core exhibited an Fe concentration gradient, indicating the preferential chloridization of the Fe species. The oxide rim surrounding the chromite core was highly porous and impregnated with chlorides, as shown by the Cl mapping. Consequently, this ubiquitous presence of the molten and/or gaseous CaCl
2 in the space between the chromite and carbon particles, and especially inside the porous chromite rim, significantly decreased the gaseous reduction potential, thereby minimizing the metallization within the chromite particles.
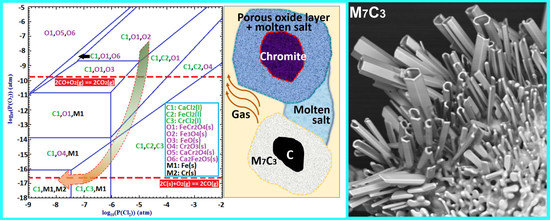
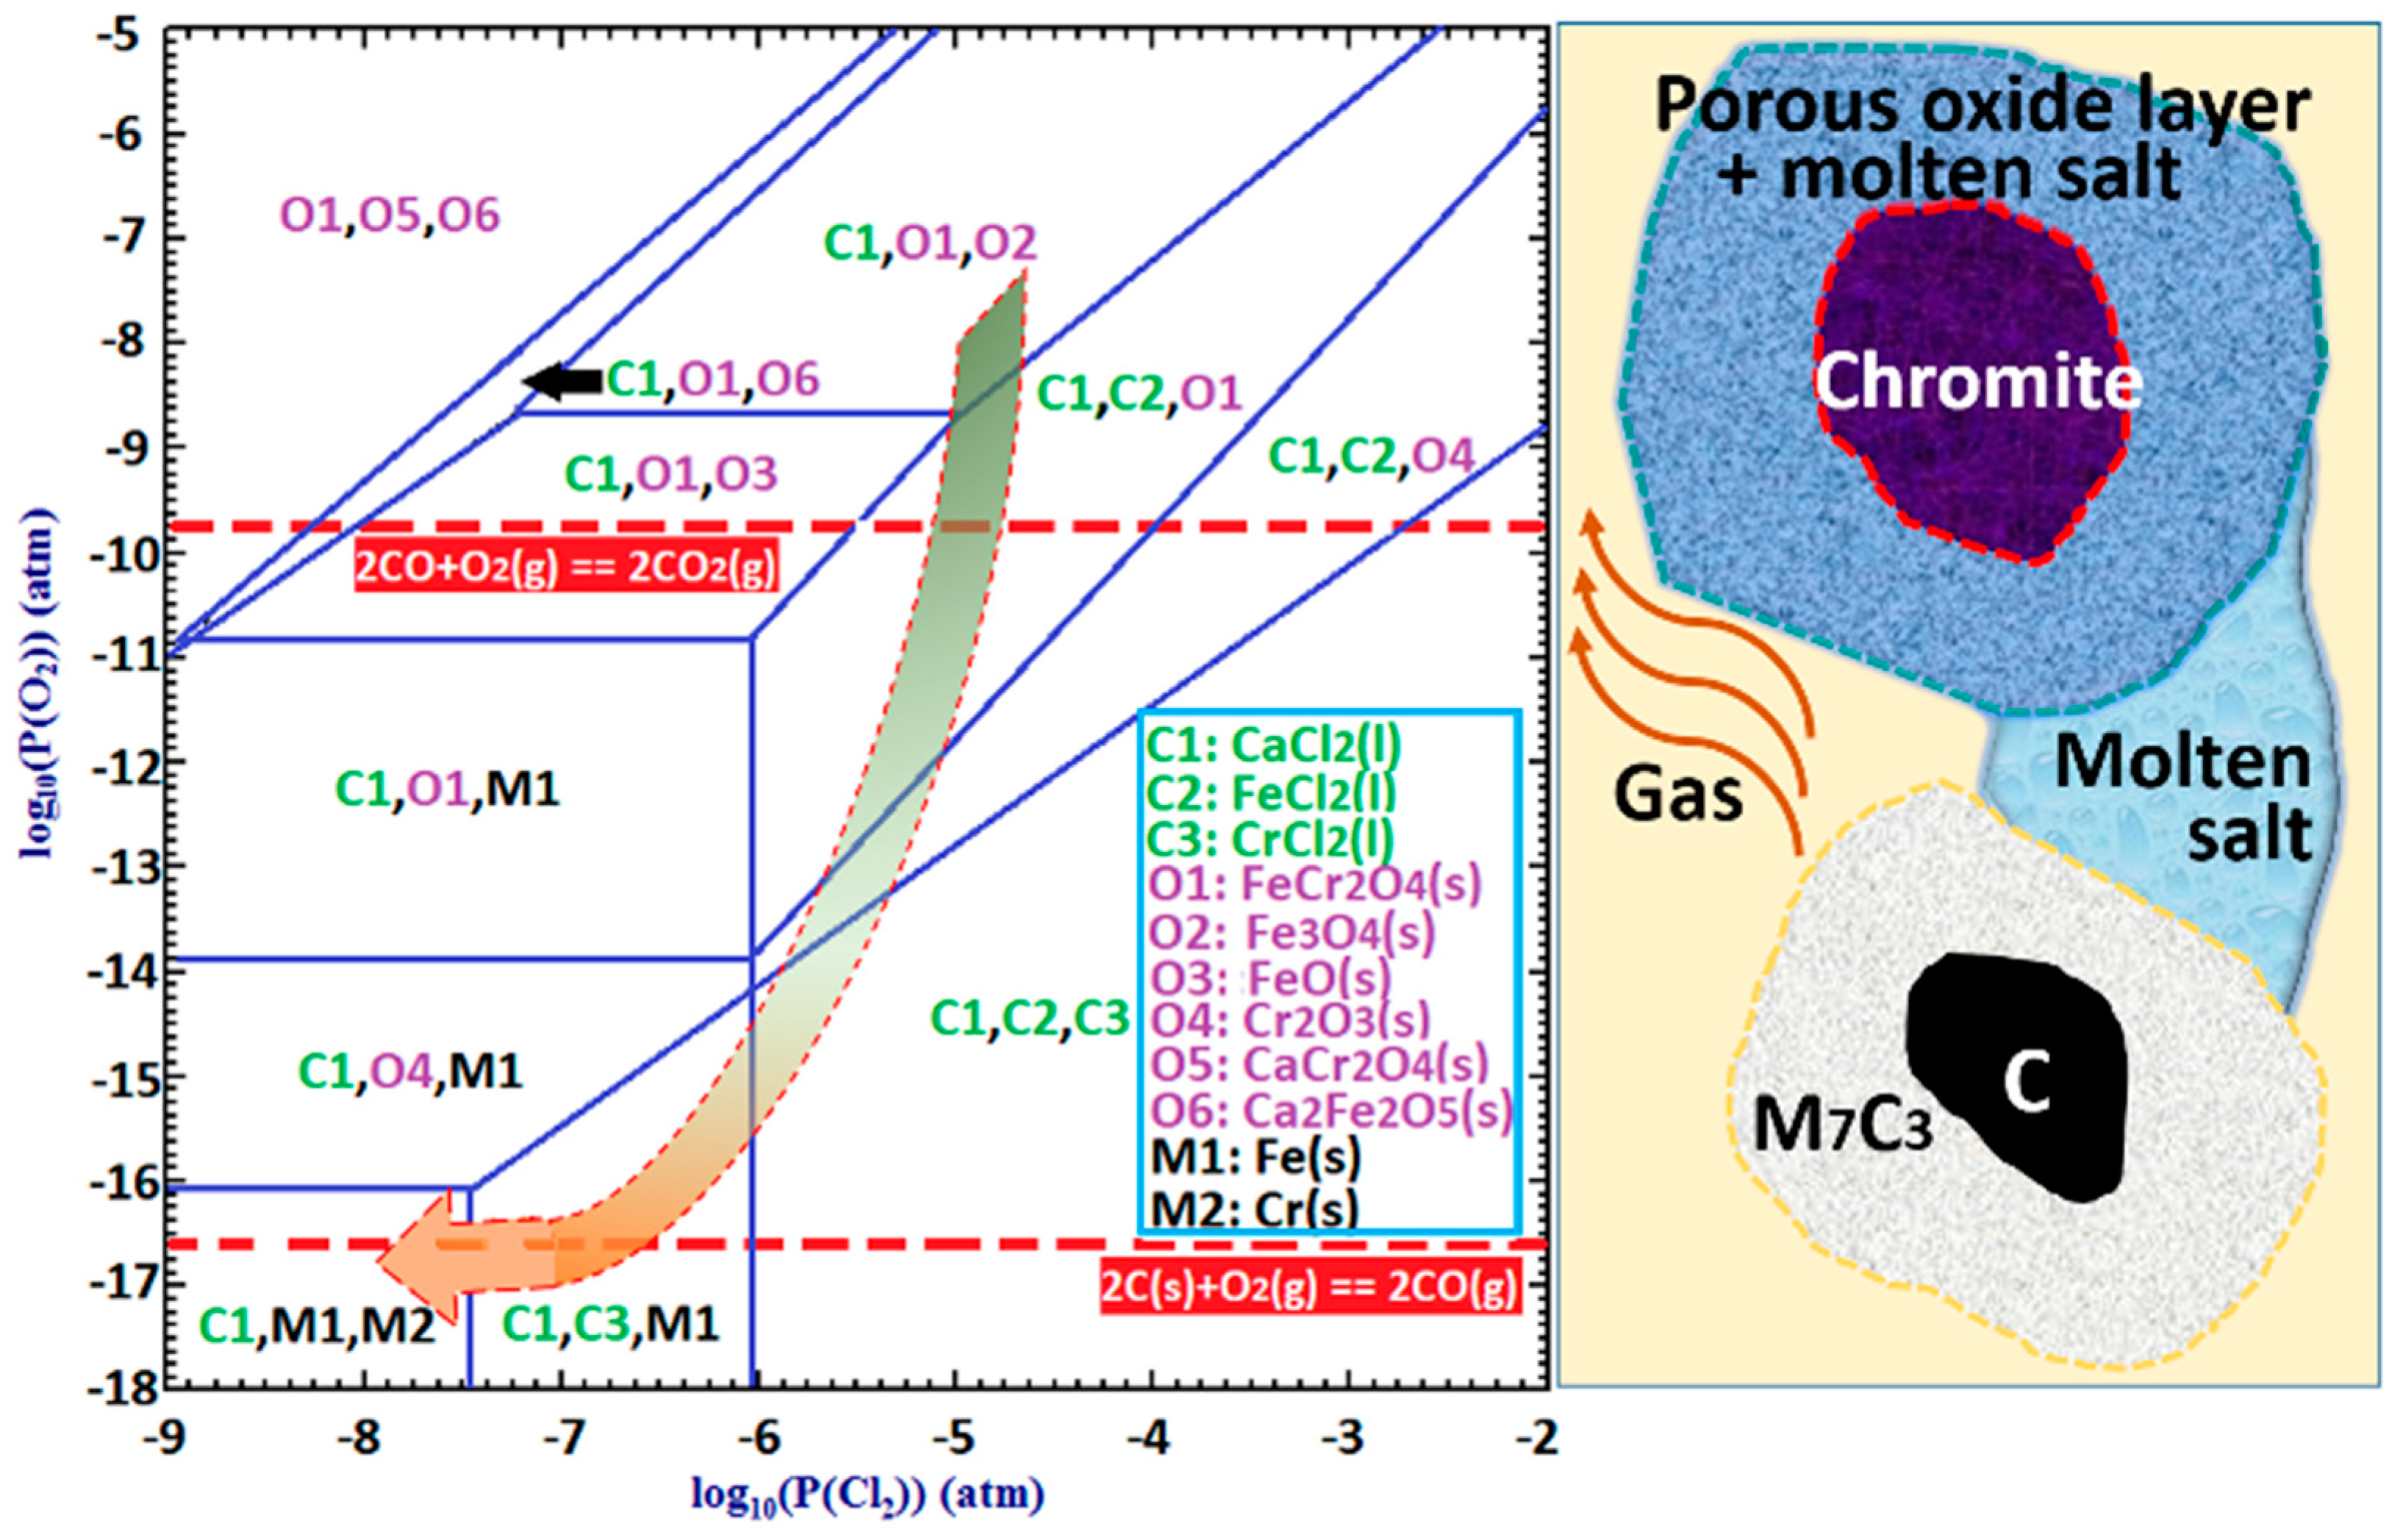
To better understand the role of CaCl
2 in the segregation reduction of chromite, a phase stability diagram of the Cr-Fe-Ca-Cl-O system at 1300 °C was plotted using FactSage [
17] as a function of the partial pressures of O
2 and Cl
2, which is shown in
Figure 18. Two horizontal red dashed lines represent the equilibrium O
2 potentials that can be achieved from carbothermic reduction by CO and C, respectively. With the presence of solid carbon, carbothermic reduction of chromite can take place via two possible mechanisms. The first mechanism is the direct reduction of chromite by solid carbon, which takes place in localized areas where the chromite and carbon particles are in physical contact. The second mechanism is the indirect gaseous reduction of chromite with CO as the direct reducing agent, coupled with the Boudouard reaction, which is represented by Equations (8) and (9), respectively. The Boudouard reaction provides the driving force for the continuation of the reaction Equation (8) by constantly removing the gaseous product (i.e., CO
2) and re-generating the gaseous reductant (i.e., CO). Apparently, the direct reduction mechanism involves solid diffusion, requiring physical contact between the chromite and carbon particles, while the indirect reduction mechanism necessitates counterflow and transport of CO and CO
2 in the gas phase. As schematically illustrated in
Figure 18 on the right-hand side, in the segregation reduction system with the presence of molten and/or gaseous CaCl
2 between the chromite and carbon particles, both the direct and indirect reduction can be hindered by reducing the physical contact between chromite and carbon particles, and by slowing the counter flow of CO and CO
2. Due to the introduction of this kinetic limitation, variation in localized thermodynamic equilibriums is promoted. In other words, the local O
2 potential inside or immediately surrounding the carbon particles is closer to that of the C-CO equilibrium (i.e., ~1 × 10
−16.6 atm), while the local O
2 potential inside the chromite particles is comparatively much higher and could be close to that of the CO-CO
2 equilibrium (i.e., ~1 × 10
−9.8 atm). This restricts the formation of ferrochrome to the carbon particles, because it requires an O
2 potential of lower than 1 × 10
−16 atm, as shown in
Figure 18. As indicated by the arrow in the phase stability diagram, the chromite would be progressively exposed to a lowering O
2 potential with continuation of the carbothermic reduction, which in turn promotes the chloridization of Fe and Cr species forming FeCl
2 and CrCl
2. In addition, chloridization of Cr species requires a lower O
2 potential than that for Fe species, which explains the preferential chloridization of Fe from the chromite core as appears in
Figure 17. The presence of molten and/or gaseous CaCl
2 in the sample mixture maintained the chloridizing atmosphere that allowed the formation and transportation of volatile chlorides of Fe and Cr, before being reduced on the carbon particles forming ferrochrome alloy.
Using the phase stability diagram in
Figure 18, the formation of discrete micron-sized Fe-rich ferrochrome particles in some chromite particles as shown in
Figure 4 and
Figure 5 can also be explained. Due to the heterogeneous nature of the sample mixture, CaCl
2 could be distributed unevenly. Therefore, some chromite cores were exposed to a lower chloridizing atmosphere (e.g., P
Cl2 < 1 × 10
−6 atm) because of the deficiency of CaCl
2 in their porous rim. When the O
2 potential inside the chromite particles was lower than 1 × 10
−10.9 atm (
Figure 18), preferential metallization of Fe took place, forming the discrete Fe-rich ferrochrome particles in the core region of the chromite particles.
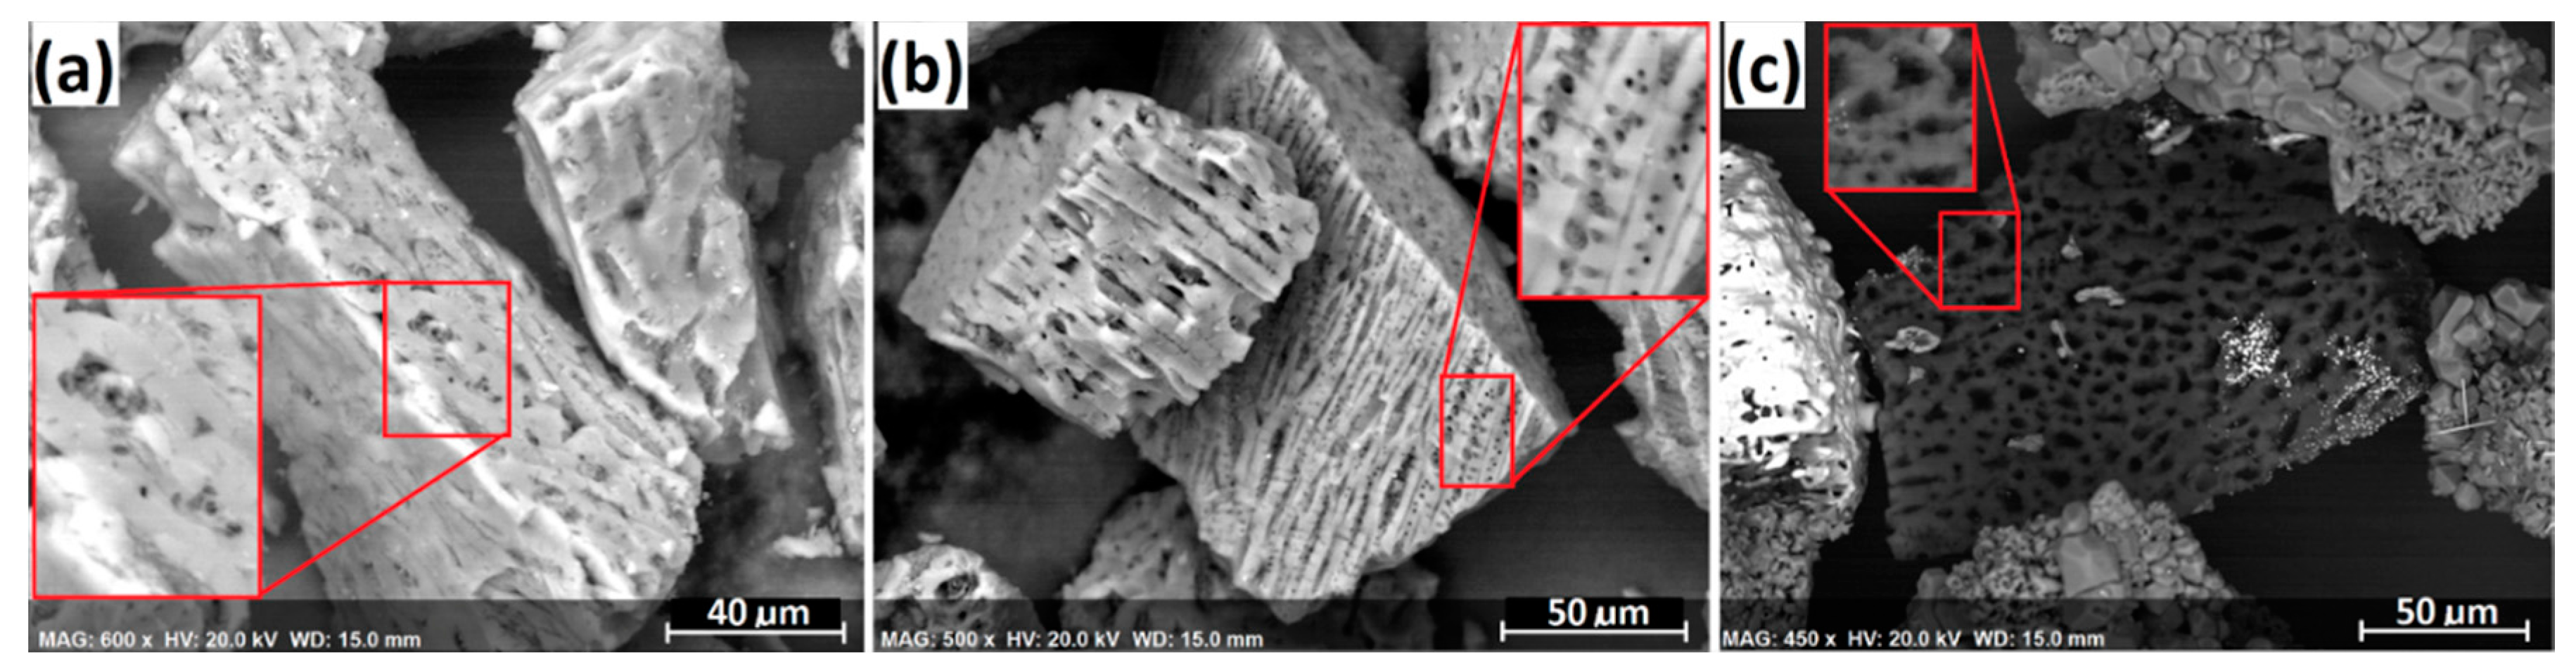
The formation mechanism of the ferrochrome carbide whiskers was also investigated. Because the whisker formation only took place when charcoal was used, and it was not observed when petroleum coke was used as the carbonaceous reductant, reactivity of the charcoal must have played a significant role.
Figure 19 exhibits (a) the surface morphology of the charcoal used for reduction, (b) the calcined charcoal after heating at 1300 °C for 10 min in an argon atmosphere, and (c) the residual charcoal in the segregation reduction product. As seen, significant amounts of micropores were formed in the calcine charcoal, possibly due to the removal of volatiles. The porosity became much higher during segregation reduction, indicated by
Figure 19c. In addition, whisker formation was significantly promoted in the presence of higher amounts of siliceous gangue (e.g., clinochlore), suggesting the involvement of clinochlore (Equation (7) and
Figure 15). Therefore, the formation mechanism of ferrochrome whiskers is tentatively suggested as follow. A significant amount of H
2O, which was produced from thermal dehydroxylation of clinochlore and phlogopite, was retained in the porous charcoal particles. It was subsequently reduced by charcoal to form H
2, represented by Equation (10). Based on thermodynamic analysis, gaseous MgCl
2 and HCl generated from the interaction among CaCl
2, clinochlore, and chromite (
Figure 15) are strong chloridizing agents (Equations (11) and (12)). Due to the high surface area of the porous charcoal, a stronger reducing potential (i.e., lower P
O2) was generally present in the gas phase resulting from the accelerated Boudouard reaction (Equation (9)) and the reduction of H
2O (Equation (10)). Therefore, not only was metallization by H
2 reduction (Equation (13)) taking place on the carbon particle surface but its growth into the space further away from the carbon particles was being promoted, resulting in whisker formation and growth. The combination of these conditions was essential for the formation and growth of the ferrochrome whiskers. Continuous segregation reduction was realized from the complete cycle of H
2 re-generation (Equation (10)), metallization and HCl re-generation (Equation (13)), and chloridization (Equation (12)). The loss of gaseous H
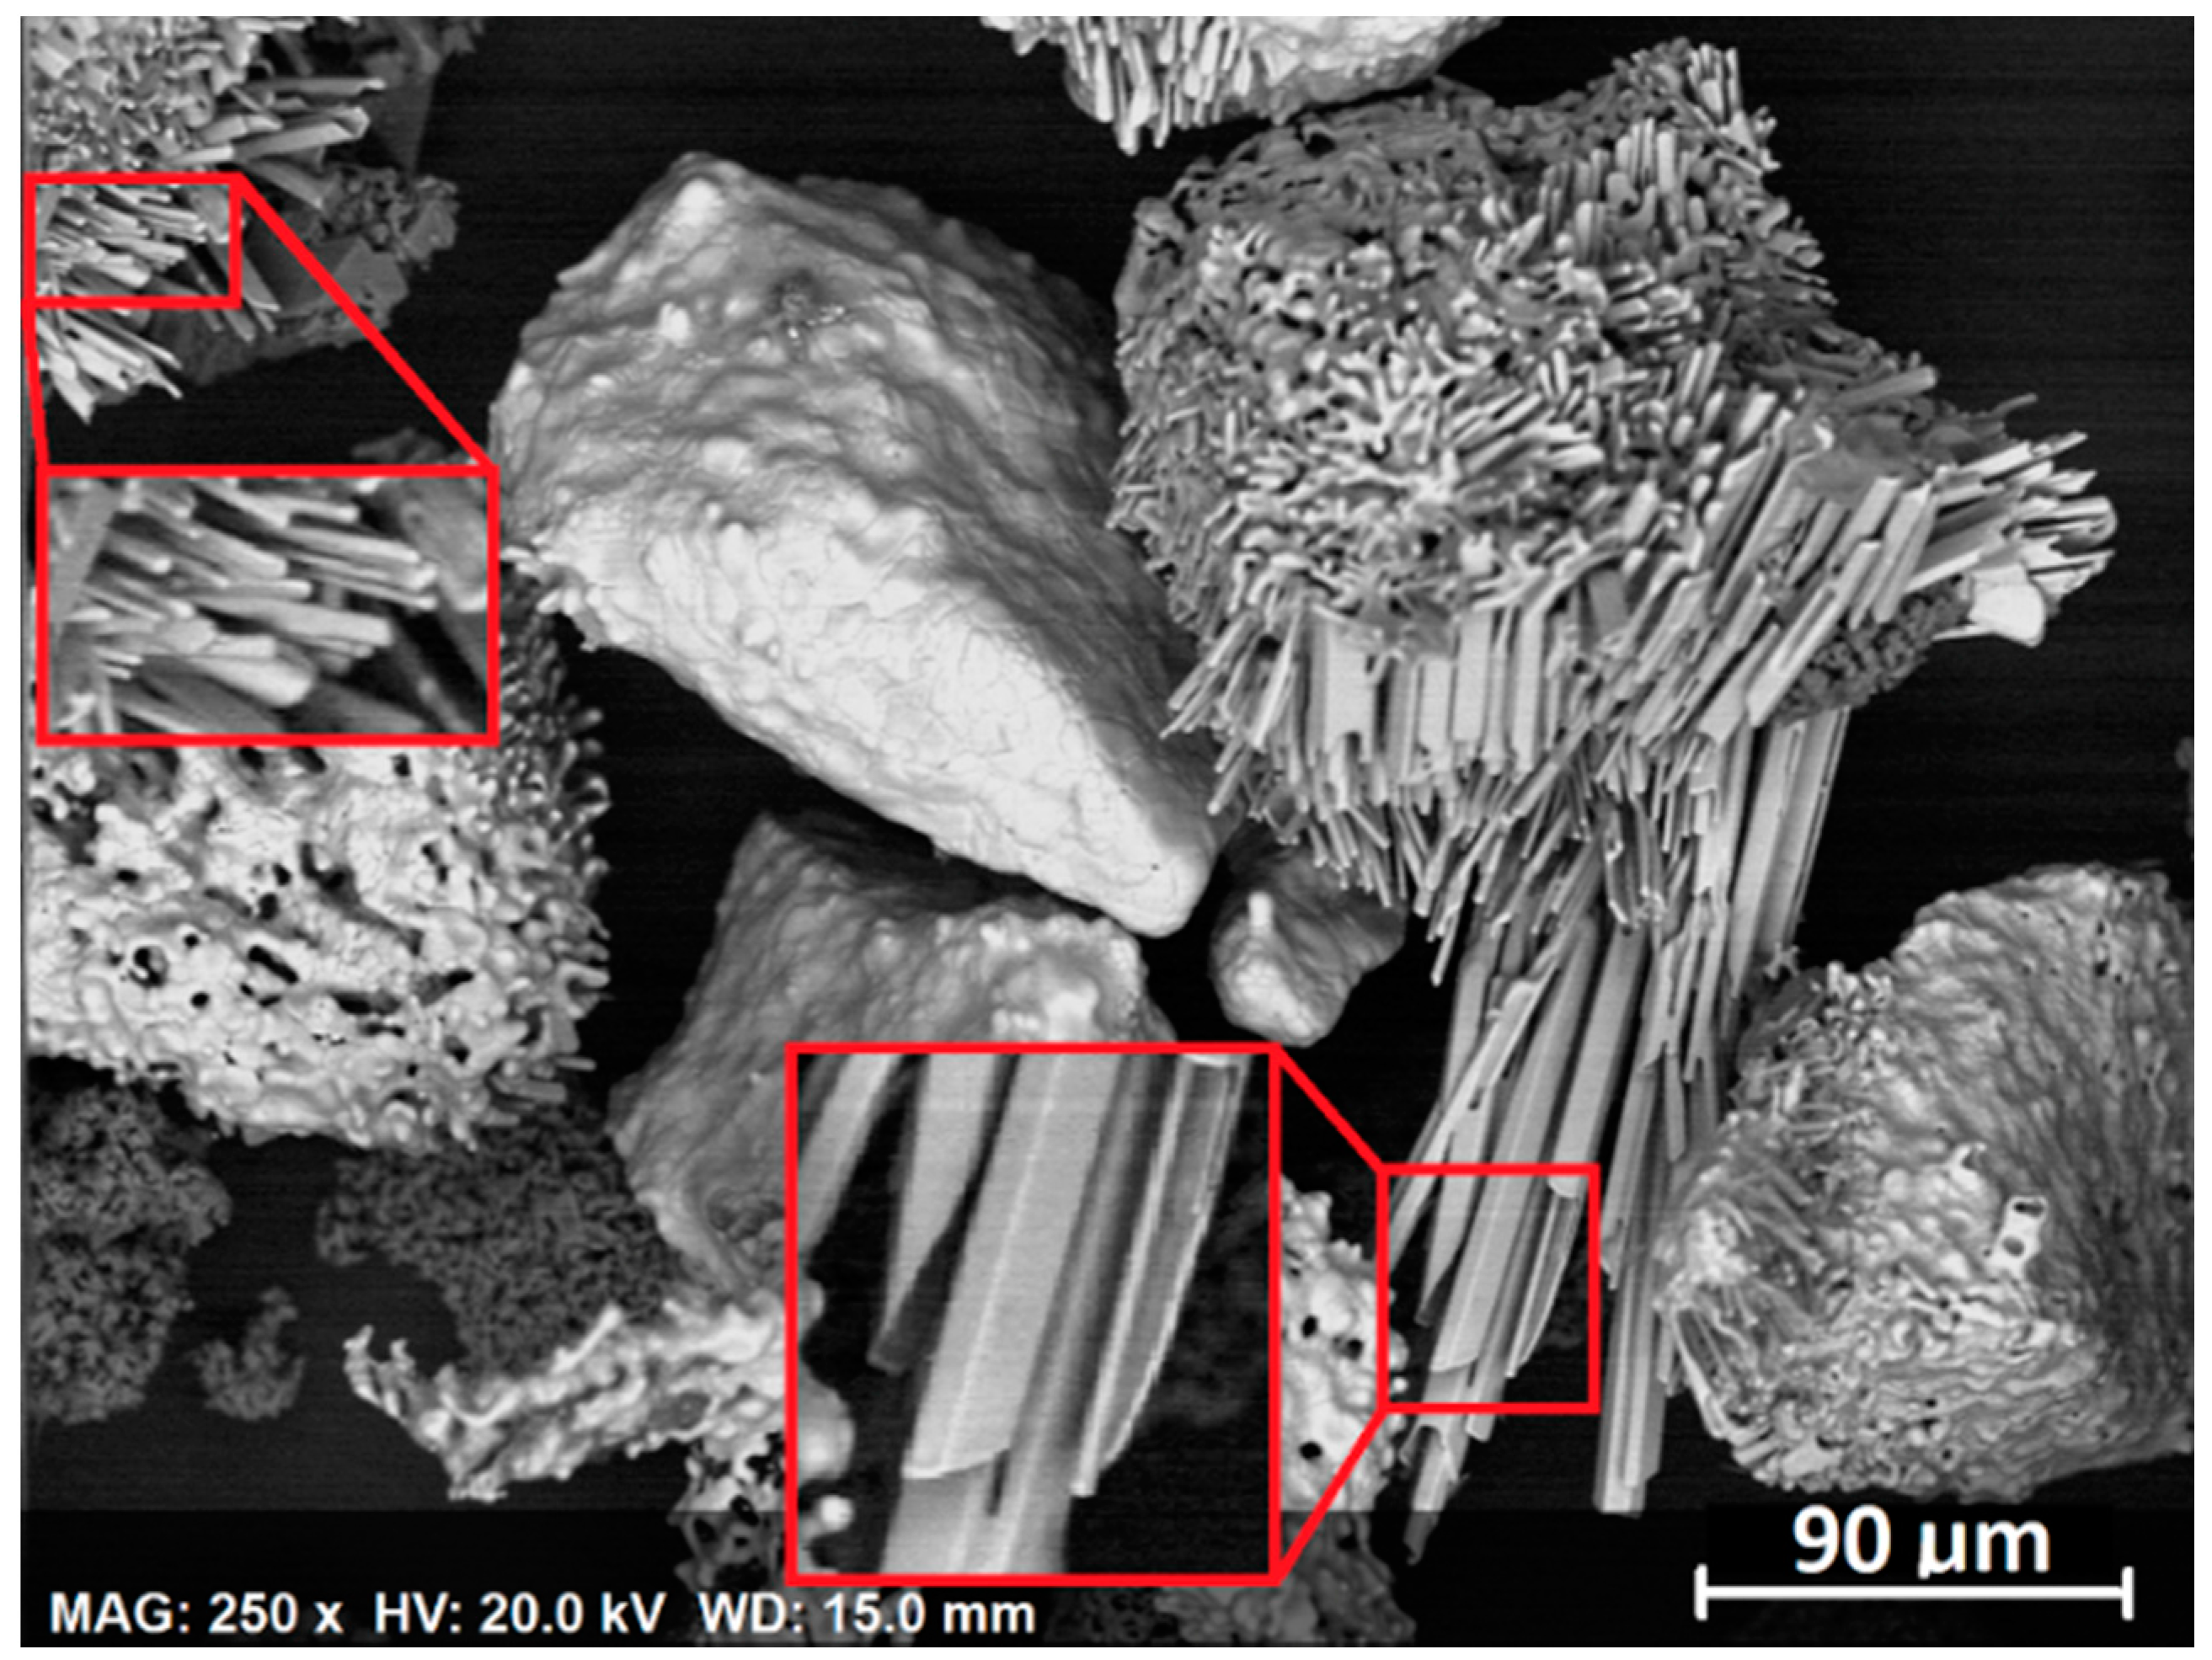
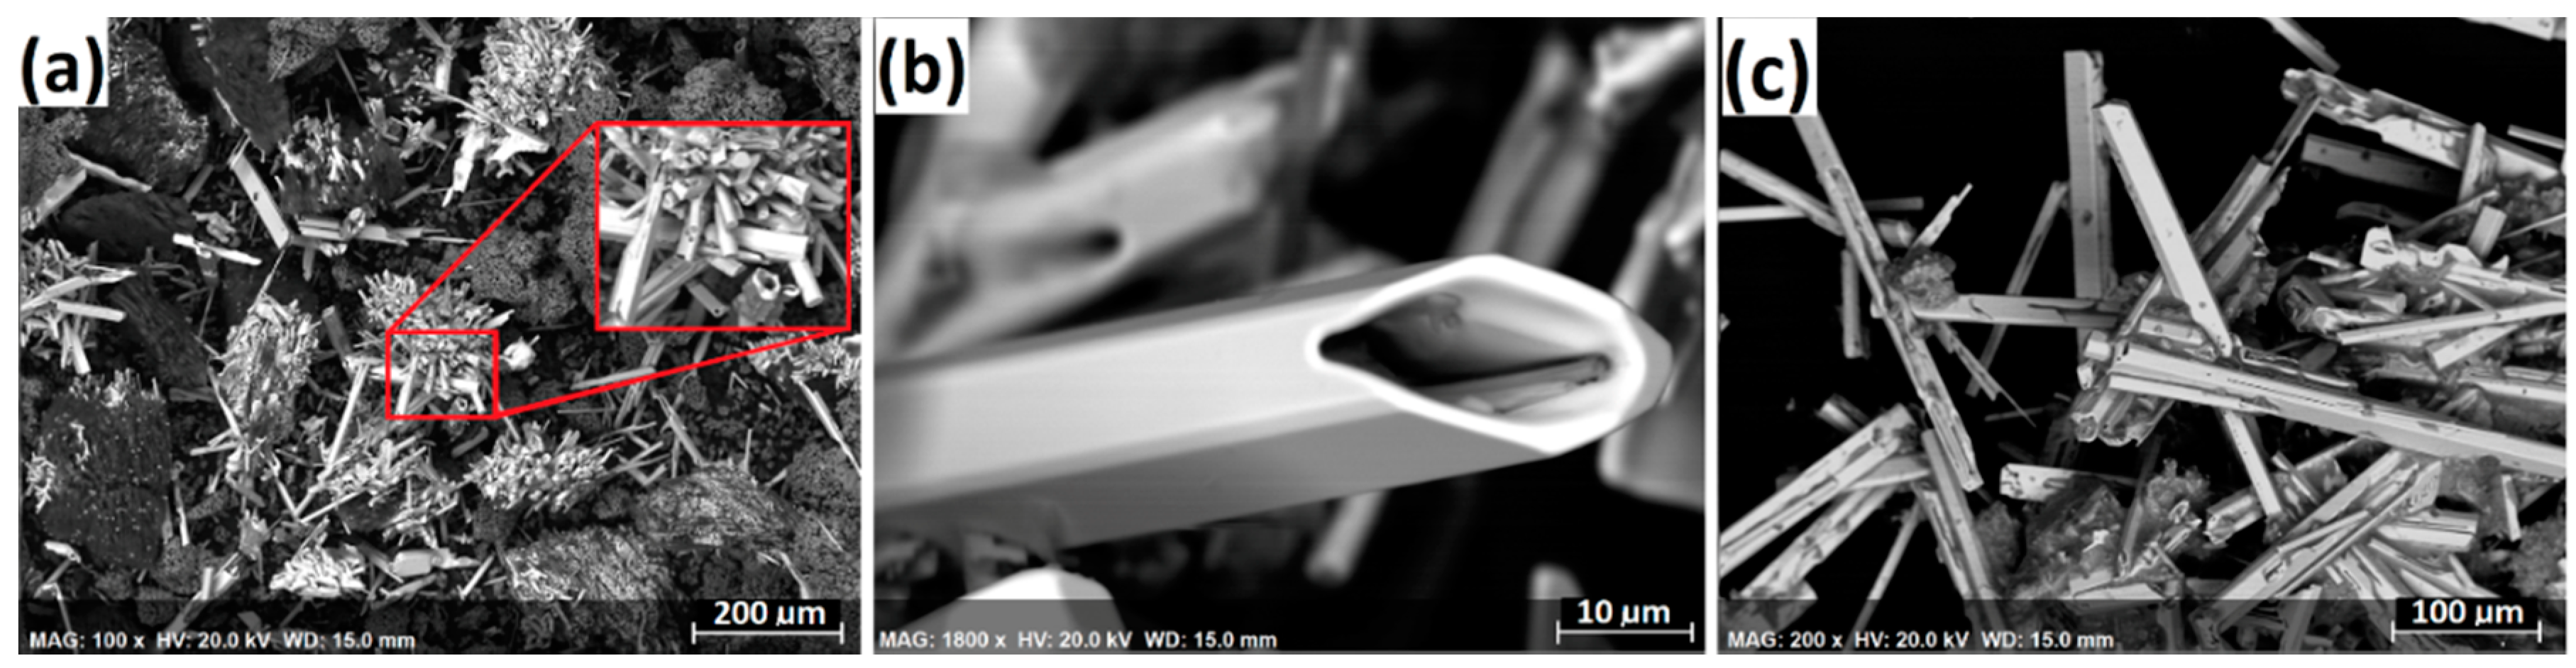
2, H
2O, and HCl into the Ar flow can be significantly reduced by increasing the sample size. A large-scale electric tube furnace test was therefore performed with the same Ar flow of 500 mL/min using a mixture of 150 g chromite (37–75 µm), 33 g charcoal (105–180 µm), and 45 g ground CaCl
2, heated at 1300 °C for 3 h. The loss of those reactive gas species into the Ar flow was significantly reduced because of a much larger sample thickness. Much higher amounts of carbide whiskers were formed in the product, which is shown in
Figure 20. In addition, long carbide whiskers (~200 µm in length) grew on the inner wall of the alumina crucible above the material bed during segregation reduction, as seen in
Figure 20c. The results from this large-scale test are in good agreement with the proposed mechanism for whisker formation.
It should be noted that formation of the polycrystalline-type ferrochrome particles (e.g.,
Figure 12a) was less likely to have involved the hydrogen-bearing gases (i.e., H
2O, H
2, and HCl). This is suggested by the higher reduction rate achieved when 180–300 µm chromite was reduced as shown in
Figure 2, and regular-shaped polycrystalline ferrochrome particles were formed (
Figure 3b,d). Because this chromite fraction contained much less gangue (i.e., clinochlore and phlogopite) as shown in
Table 1, the contribution from the hydrogen-bearing gases was much less significant. This suggests the presence of another important segregation mechanism, which requires further investigation.


