Hydration Effects on the Stability of Calcium Carbonate Pre-Nucleation Species

 , ,
, ,  and
and 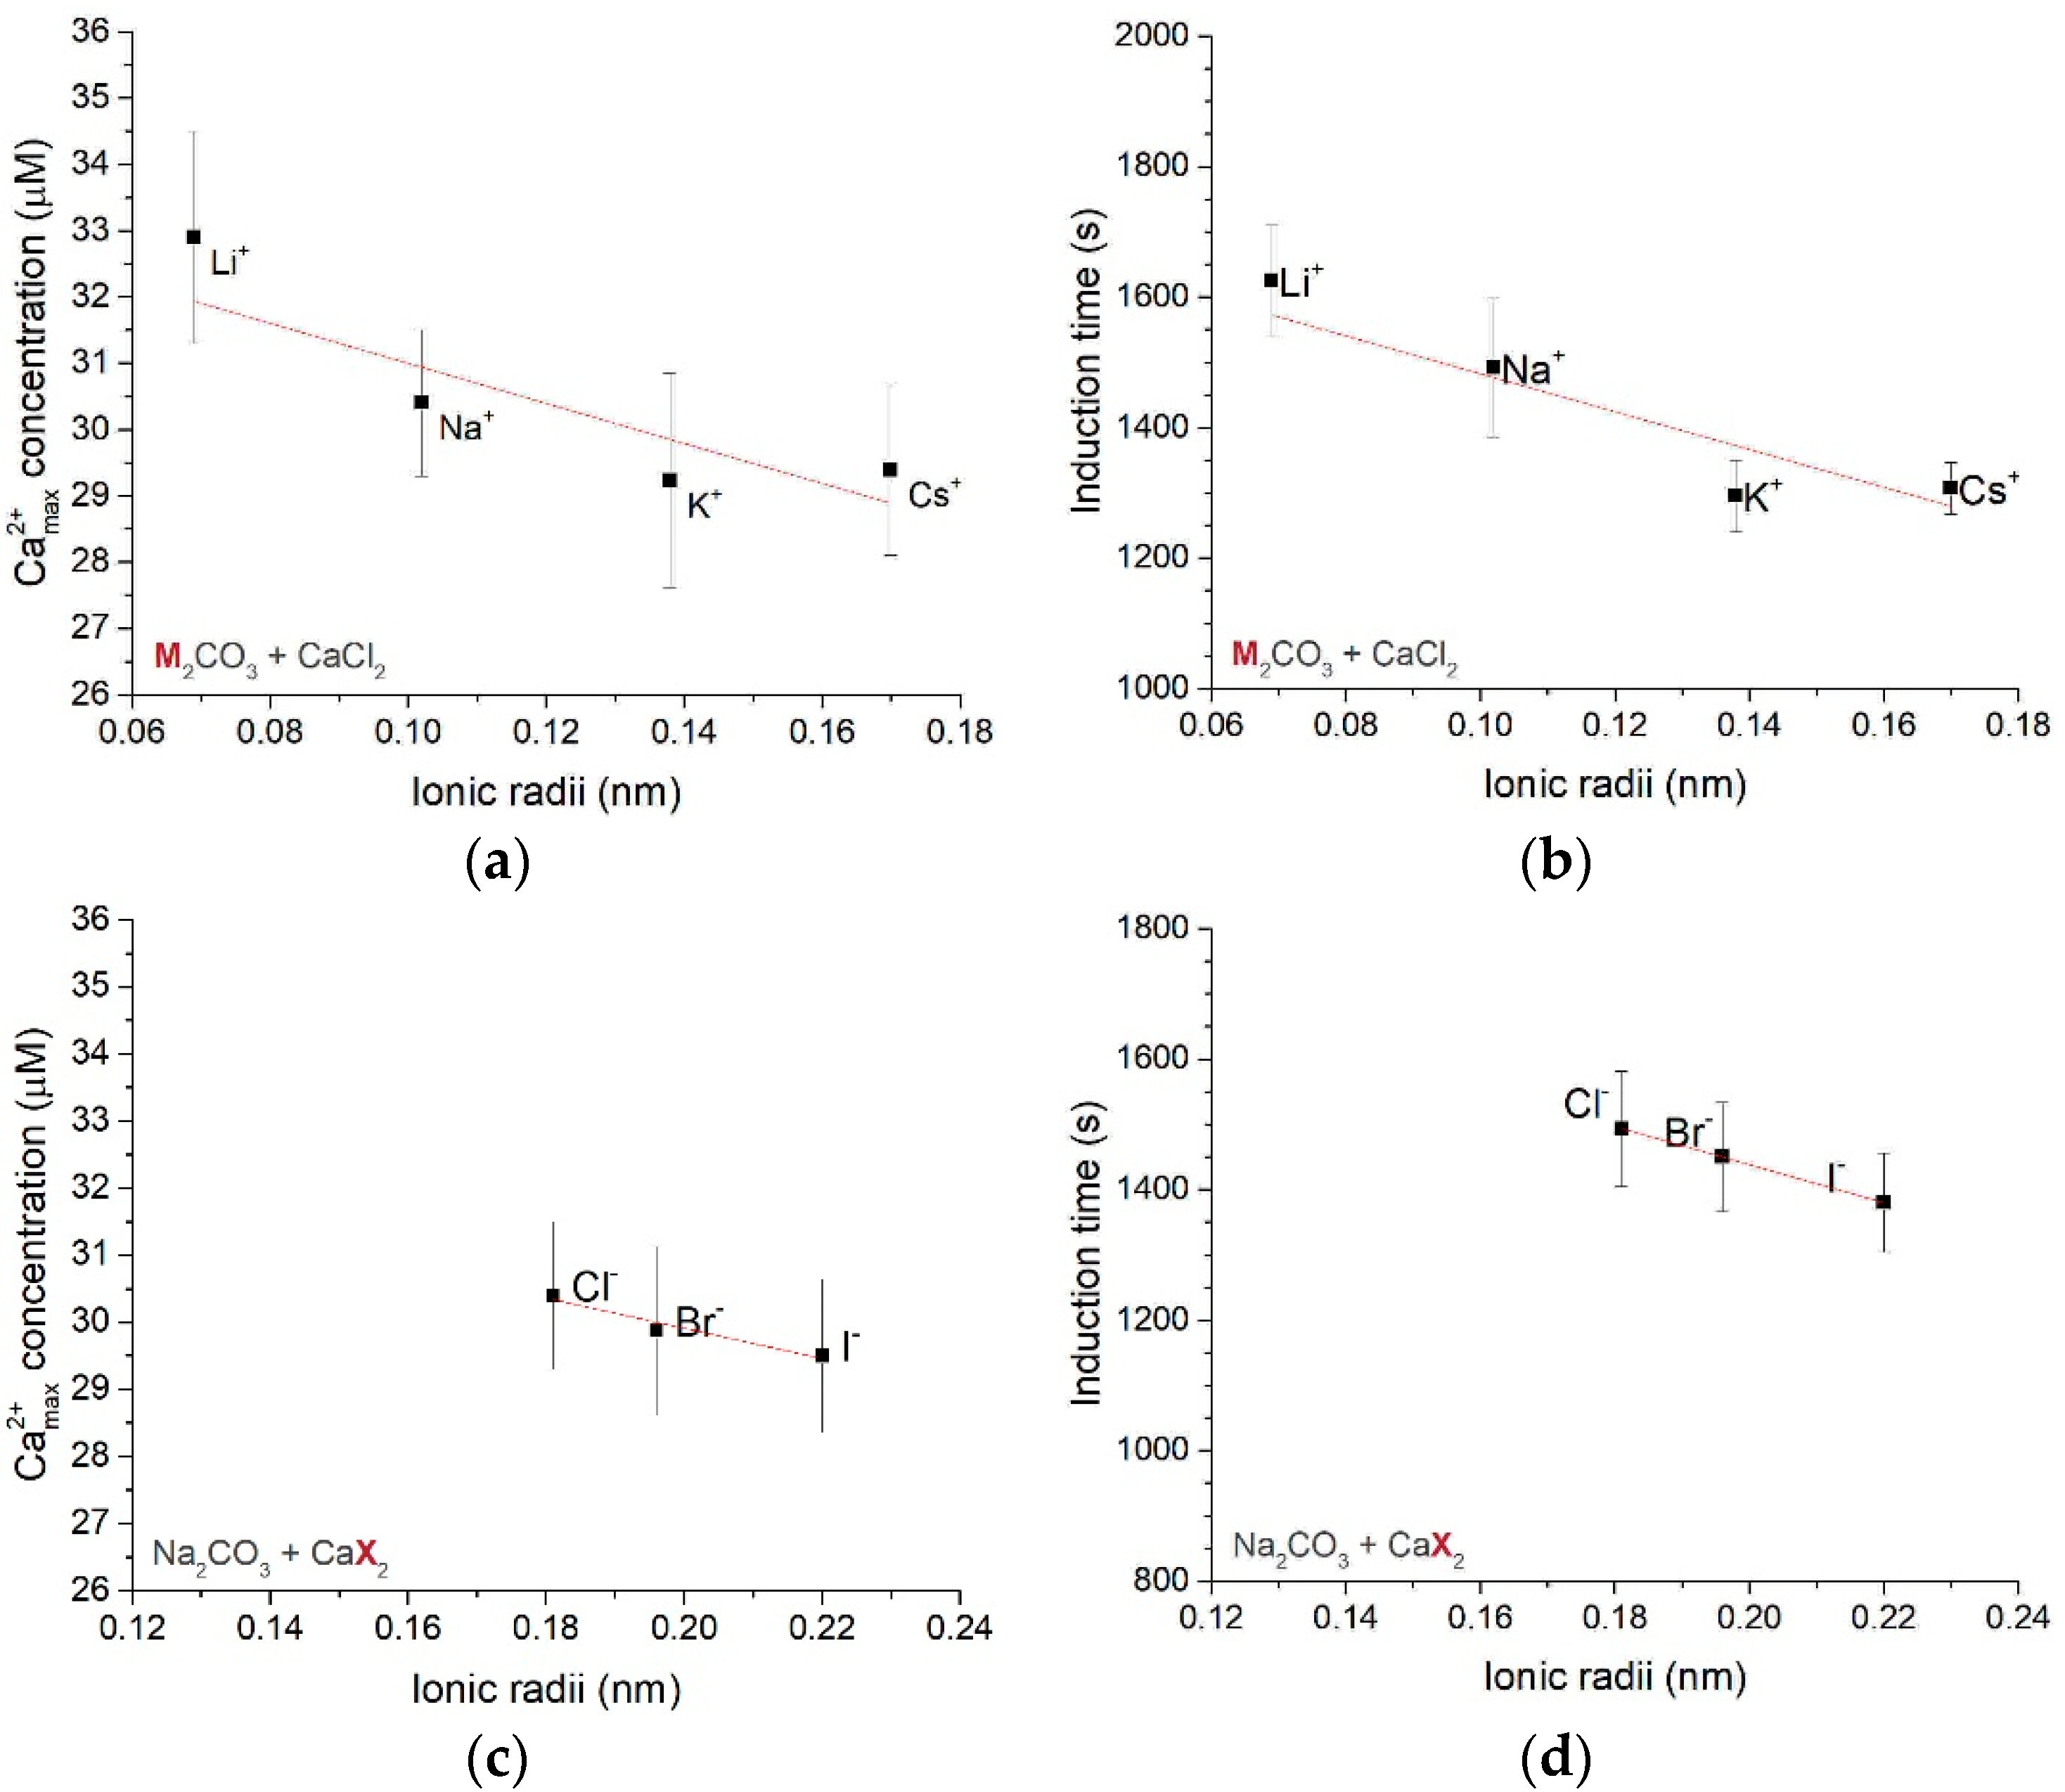
Abstract
:1. Introduction
2. Materials and Methods
2.1. Titration Experiments
2.2. Dynamic Light Scattering
2.3. Electron Microscopy
2.4. X-ray Diffraction Analysis
3. Results
3.1. Type I Experiments
3.1.1. Effect of Different Counter-Ions in the Carbonate or Calcium Sources
3.1.2. Dynamics of Calcium Carbonate Binding
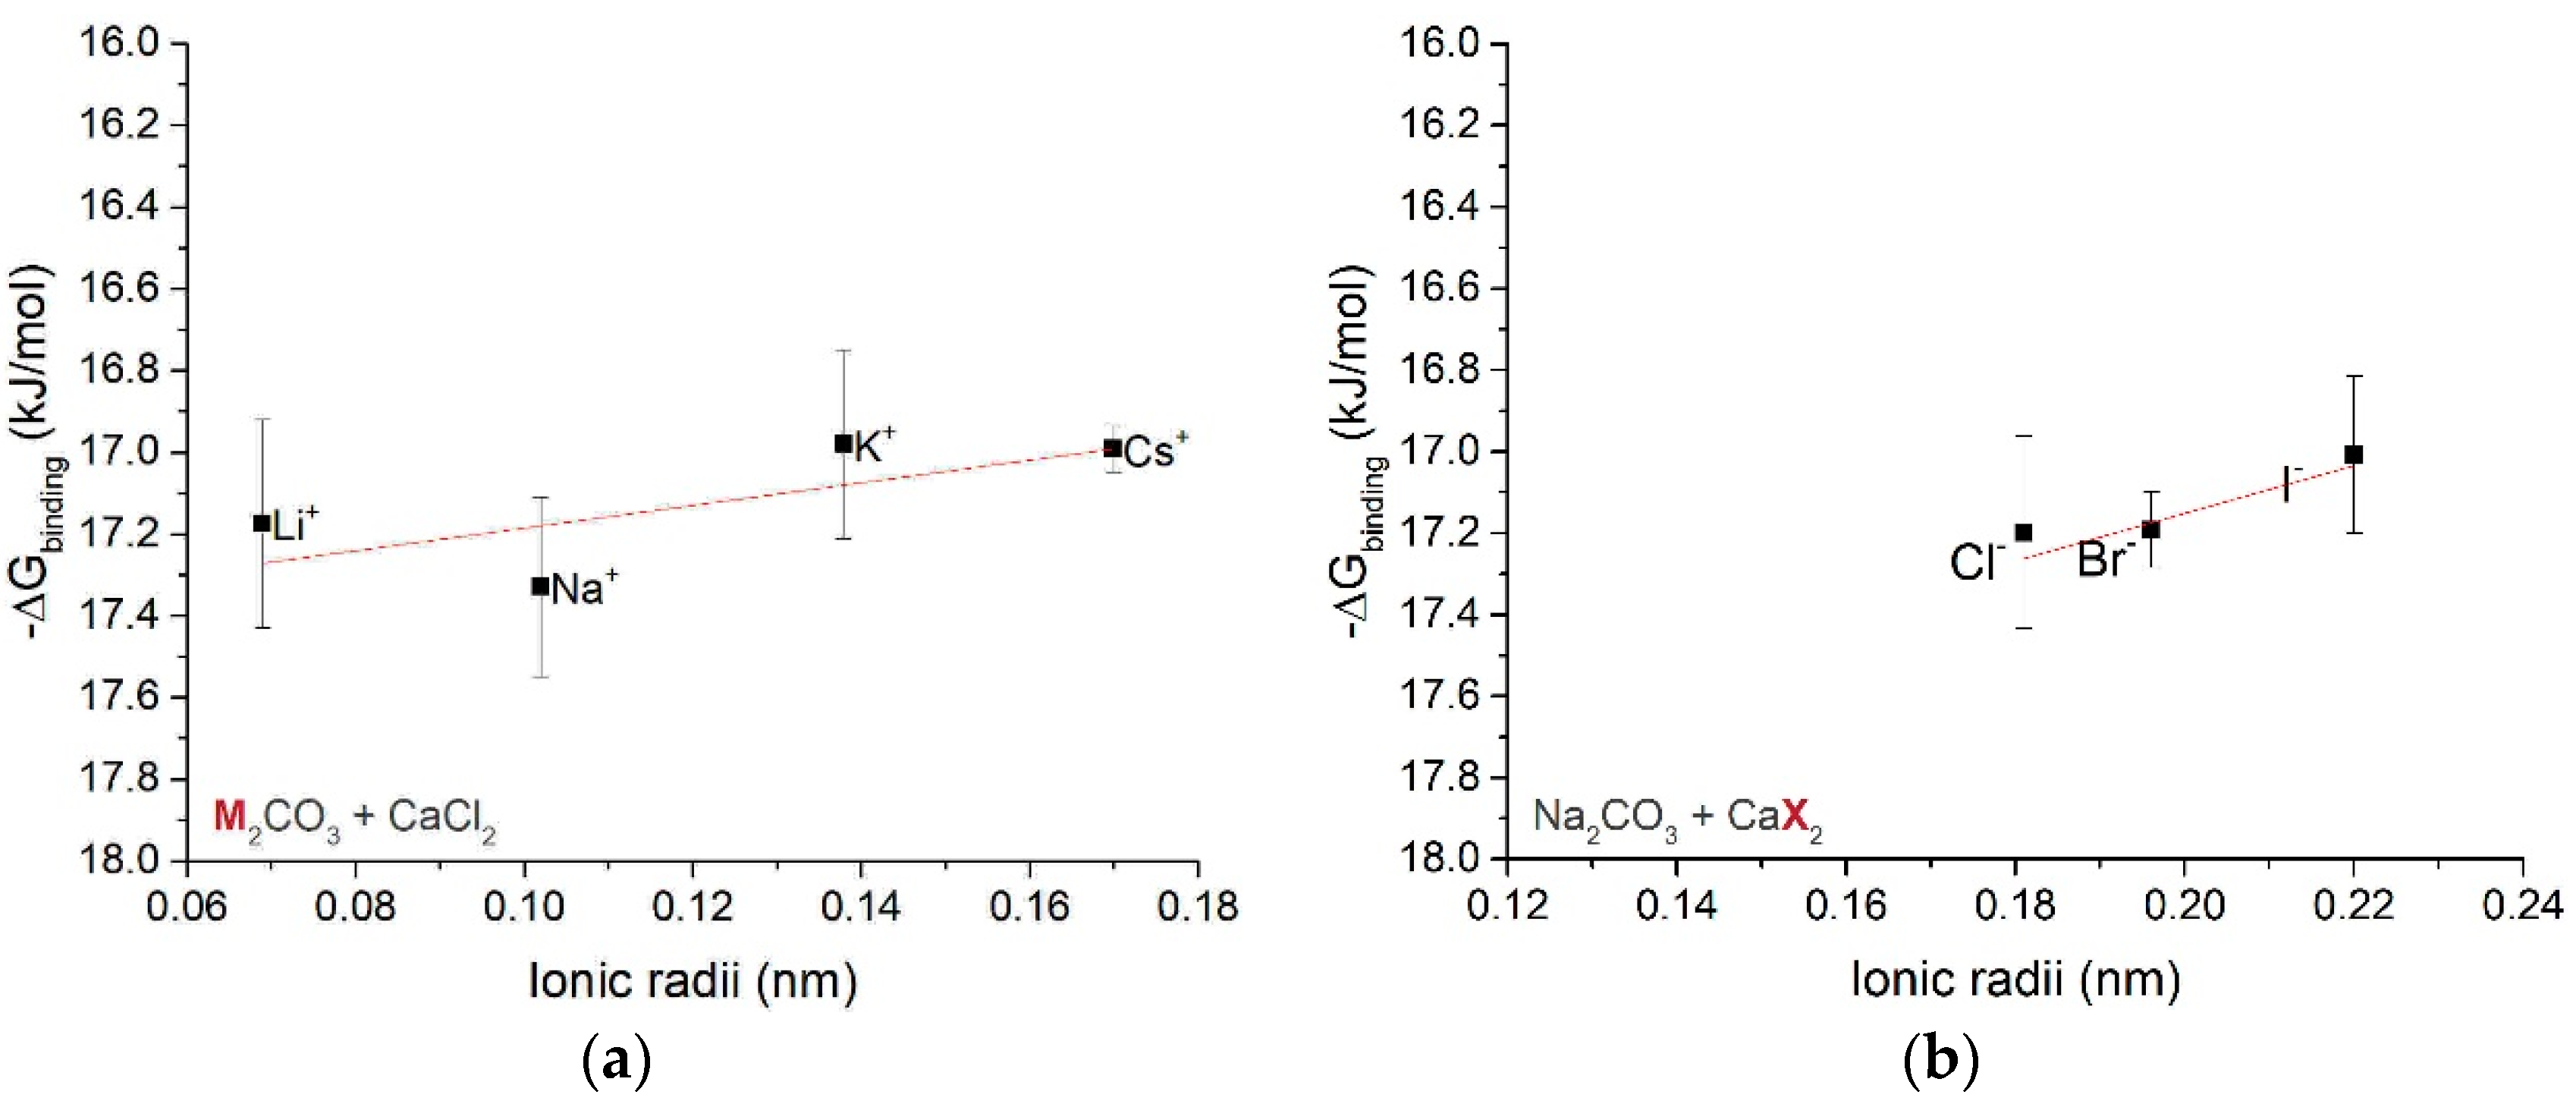
3.1.3. Free Energy of Ion Associates
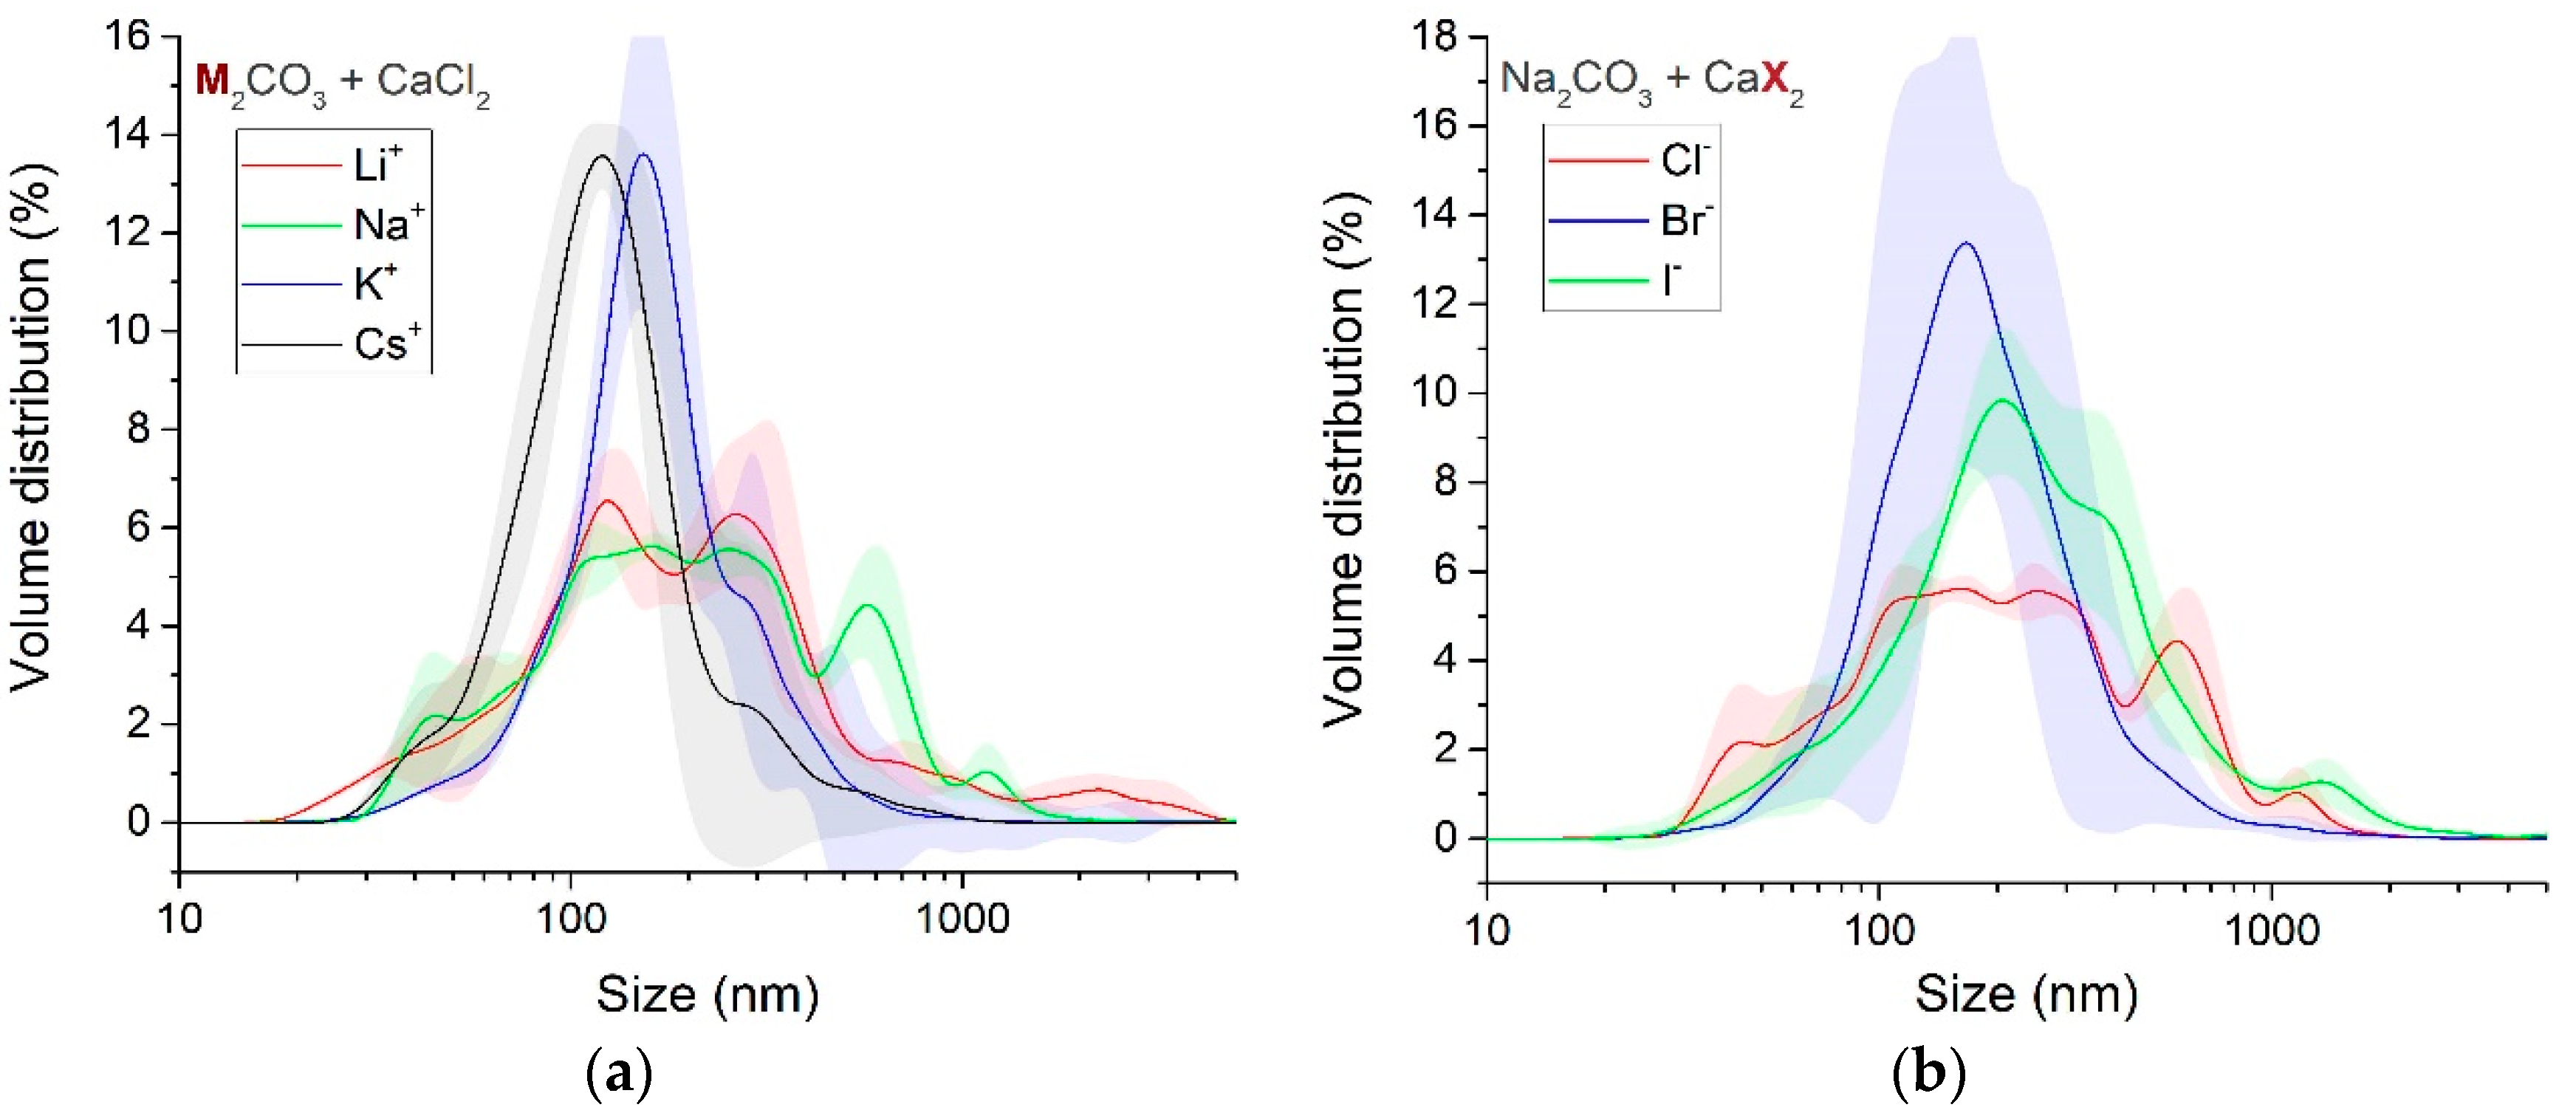
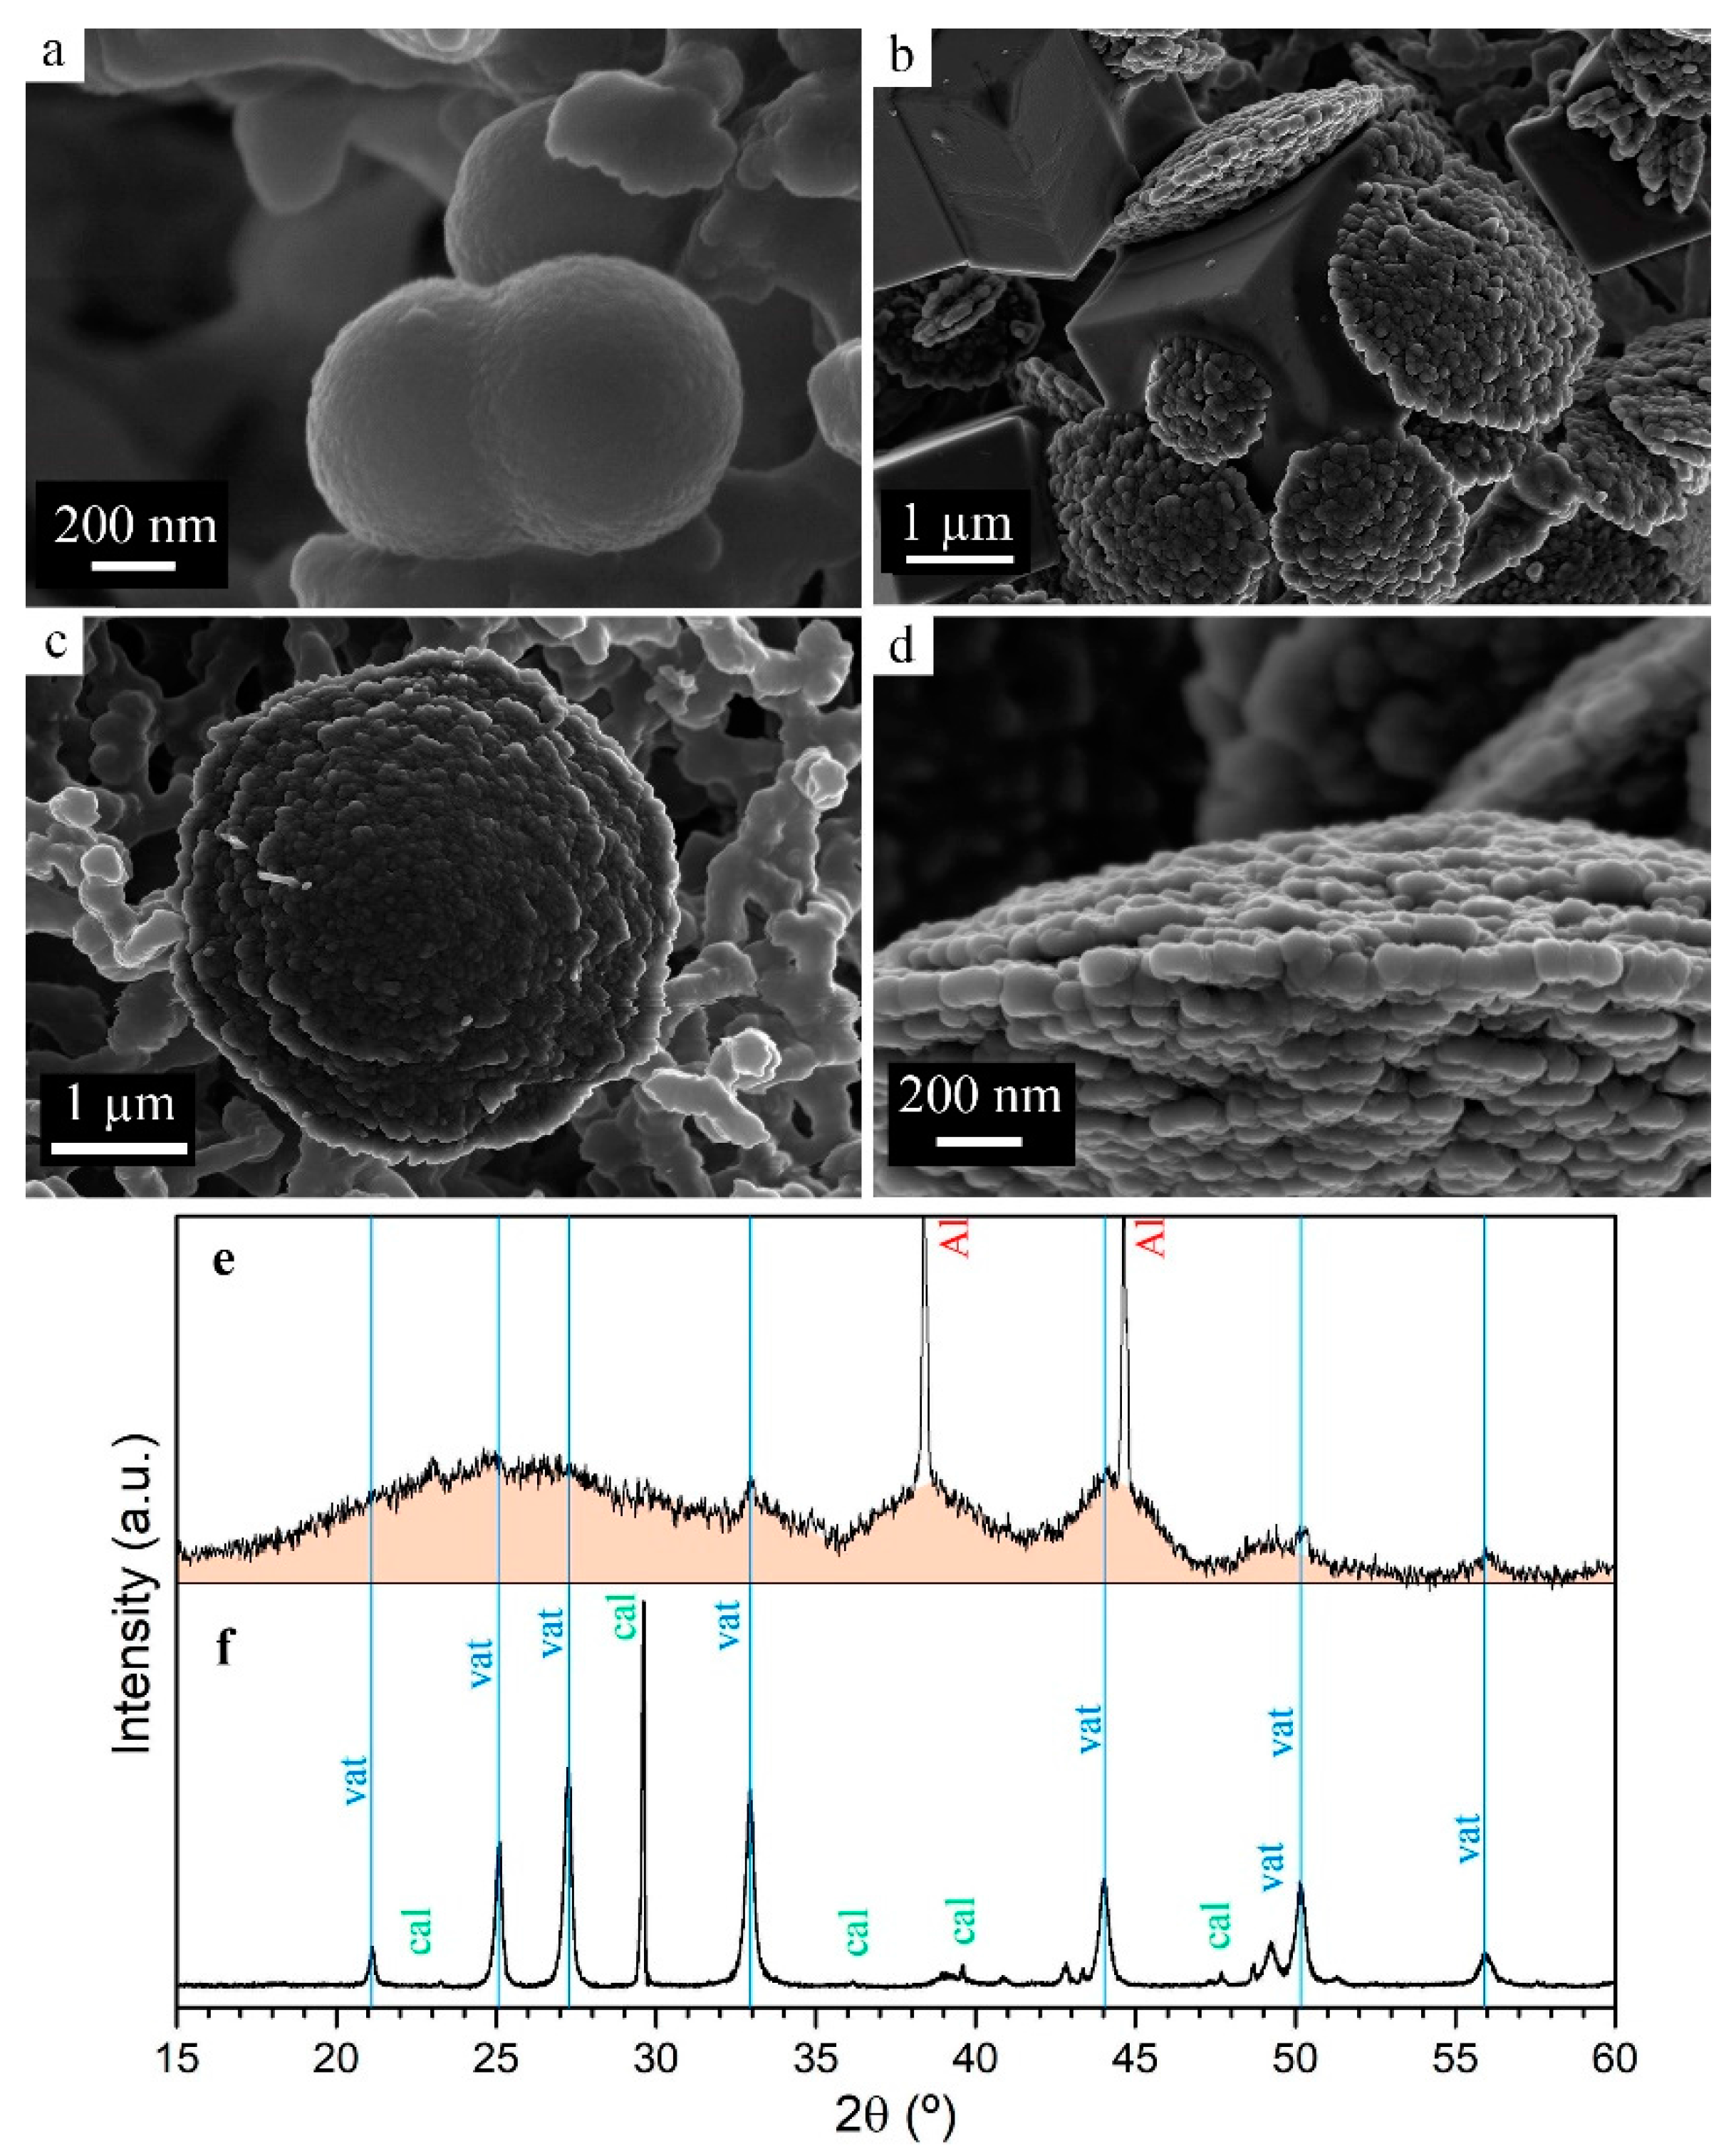
3.1.4. Particle Size and Phase Evolution
3.2. Type II Experiments
4. Discussion
4.1. Ion-Water Interactions
4.2. Calcium Carbonate Pre-Nucleation Clusters
4.3. Effects on ACC Solubility and Polymorph Selection
4.4. Influence of Background Electrolyte Concentration
5. Conclusions
Supplementary Materials
Acknowledgments
Author Contributions
Conflicts of Interest
References
- Gower, L.B. Biomimetic model systems for investigating the amorphous precursor pathway and its role in biomineralization. Chem. Rev. 2008, 108, 4551–4627. [Google Scholar] [CrossRef] [PubMed]
- Cam, N.; Georgelin, T.; Jaber, M.; Lambert, J.F.; Benzerara, K. In vitro synthesis of amorphous Mg-, Ca-, Sr- and Ba-carbonates: What do we learn about intracellular calcification by cyanobacteria? Geochim. Cosmochim. Acta 2015, 161, 36–49. [Google Scholar] [CrossRef]
- Zhong, C.; Chu, C.C. Acid polysaccharide-induced amorphous calcium carbonate (ACC) films: Colloidal nanoparticle self-organization process. Langmuir 2009, 25, 3045–3049. [Google Scholar] [CrossRef] [PubMed]
- Tobler, D.J.; Blanco, J.D.R.; Dideriksen, K.; Sand, K.K.; Bovet, N.; Benning, L.G.; Stipp, S.L.S. The effect of aspartic acid and glycine on amorphous calcium carbonate (ACC) structure, stability and crystallization. Proced. Earth Planet. Sci. 2014, 10, 143–148. [Google Scholar] [CrossRef]
- Bentov, S.; Weil, S.; Glazer, L.; Sagi, A.; Berman, A. Stabilization of amorphous calcium carbonate by phosphate rich organic matrix proteins and by single phosphoamino acids. J. Struct. Biol. 2010, 171, 207–215. [Google Scholar] [CrossRef] [PubMed]
- De Yoreo, J.J.; Dove, P.M. Shaping crystals with biomolecules. Science 2004, 306, 1301–1302. [Google Scholar] [CrossRef] [PubMed]
- Zeng, J.; Yin, Z.; Chen, Q. Effect of tetracarbon additives on gibbsite precipitation from seeded sodium aluminate liquor. J. Cent. South Univ. Technol. 2008, 15, 622–626. [Google Scholar] [CrossRef]
- Orshesh, Z.; Hesaraki, S.; Khanlarkhani, A. Blooming gelatin: An individual additive for enhancing nanoapatite precipitation, physical properties, and osteoblastic responses of nanostructured macroporous calcium phosphate bone cements. Int. J. Nanomed. 2017, 12, 745–758. [Google Scholar] [CrossRef] [PubMed]
- Wolf, S.E.; Böhm, C.F.; Harris, J.; Demmert, B.; Jacob, D.E.; Mondeshki, M.; Ruiz-Agudo, E.; Rodríguez-Navarro, C. Nonclassical crystallization in vivo et in vitro (I): Process-structure-property relationships of nanogranular biominerals. J. Struct. Biol. 2016, 196, 244–259. [Google Scholar] [CrossRef] [PubMed]
- Rodríguez-Navarro, C.; Ruiz-Agudo, E.; Harris, J.; Wolf, S.E. Nonclassical crystallization in vivo et in vitro (II): Nanogranular features in biomimetic minerals disclose a general colloid-mediated crystal growth mechanism. J. Struct. Biol. 2016, 196, 260–287. [Google Scholar] [CrossRef] [PubMed]
- Lowenstam, H.A.; Weiner, S. On Biomineralization; Oxford University Press: Oxford, UK, 1989. [Google Scholar]
- Gago-Duport, L.; Briones, M.J.I.; Rodríguez, J.B.; Covelo, B. Amorphous calcium carbonate biomineralization in the earthworm’s calciferous gland: Pathways to the formation of crystalline phases. J. Struct. Biol. 2008, 162, 422–435. [Google Scholar] [CrossRef] [PubMed]
- Loste, E.; Wilson, R.M.; Seshadri, R.; Meldrum, F.C. The role of magnesium in stabilising amorphous calcium carbonate and controlling calcite morphologies. J. Cryst. Growth 2003, 254, 206–218. [Google Scholar] [CrossRef]
- Gonzalez-Munoz, M.T.; Ben Chekroun, K.; Ben Aboud, A.; Arias, J.M.; Rodriguez-Gallego, M. Bacterially induced Mg-calcite formation: Role of Mg2+ in development of crystal morphology. J. Sediment. Res. 2000, 70, 559–564. [Google Scholar] [CrossRef]
- Davis, K.J. The Role of Mg2+ as an Impurity in Calcite Growth. Science 2000, 290, 1134–1137. [Google Scholar] [CrossRef] [PubMed]
- Zhang, Y.; Dawe, R.A. Influence of Mg2+ on the kinetics of calcite precipitation and calcite crystal morphology. Chem. Geol. 2000, 163, 129–138. [Google Scholar] [CrossRef]
- Berg, J.K.; Jordan, T.; Binder, Y.; Börner, H.G.; Gebauer, D. Mg2+ Tunes the Wettability of Liquid Precursors of CaCO3: Toward Controlling Mineralization Sites in Hybrid Materials. J. Am. Chem. Soc. 2013, 135, 12512–12515. [Google Scholar] [CrossRef] [PubMed]
- Demichelis, R.; Raiteri, P.; Gale, J.D. Structure of hydrated calcium carbonates: A first-principles study. J. Cryst. Growth 2013. [Google Scholar] [CrossRef]
- Demichelis, R.; Raiteri, P.; Gale, J.D.; Quigley, D.; Gebauer, D. Stable prenucleation mineral clusters are liquid-like ionic polymers. Nat. Commun. 2011, 2, 590. [Google Scholar] [CrossRef] [PubMed]
- Gebauer, D.; Volkel, A.; Colfen, H. Stable prenucleation calcium carbonate clusters. Science 2008, 322, 1819–1822. [Google Scholar] [CrossRef] [PubMed]
- Burgos-Cara, A.; Putnis, C.V.; Rodriguez-Navarro, C.; Ruiz-Agudo, E. Hydration effects on gypsum dissolution revealed by in situ nanoscale atomic force microscopy observations. Geochim. Cosmochim. Acta 2016, 179, 110–122. [Google Scholar] [CrossRef]
- Ruiz-Agudo, E.; Kowacz, M.; Putnis, C.V.; Putnis, A. The role of background electrolytes on the kinetics and mechanism of calcite dissolution. Geochim. Cosmochim. Acta 2010, 74, 1256–1267. [Google Scholar] [CrossRef]
- Ruiz-Agudo, E.; Putnis, C.V.; Wang, L.; Putnis, A. Specific effects of background electrolytes on the kinetics of step propagation during calcite growth. Geochim. Cosmochim. Acta 2011, 75, 3803–3814. [Google Scholar] [CrossRef]
- Kowacz, M.; Putnis, A. The effect of specific background electrolytes on water structure and solute hydration: Consequences for crystal dissolution and growth. Geochim. Cosmochim. Acta 2008, 72, 4476–4487. [Google Scholar] [CrossRef]
- Ruiz-Agudo, E.; Urosevic, M.; Putnis, C.V.; Rodríguez-Navarro, C.; Cardell, C.; Putnis, A. Ion-specific effects on the kinetics of mineral dissolution. Chem. Geol. 2011, 281, 364–371. [Google Scholar] [CrossRef]
- Collins, K.D.; Neilson, G.W.; Enderby, J.E. Ions in water: Characterizing the forces that control chemical processes and biological structure. Biophys. Chem. 2007, 128, 95–104. [Google Scholar] [CrossRef] [PubMed]
- Marcus, Y. Thermodynamics of solvation of ions. Part 5.—Gibbs free energy of hydration at 298.15 K. J. Chem. Soc. Faraday Trans. 1991, 87, 2995–2999. [Google Scholar] [CrossRef]
- Saharay, M.; Yazaydin, A.O.; Kirkpatrick, R.J. Dehydration-induced amorphous phases of calcium carbonate. J. Phys. Chem. B 2013, 117, 3328–3336. [Google Scholar] [CrossRef] [PubMed]
- Saharay, M.; James Kirkpatrick, R. Onset of orientational order in amorphous calcium carbonate (ACC) upon dehydration. Chem. Phys. Lett. 2014, 591, 287–291. [Google Scholar] [CrossRef]
- Kowacz, M.; Prieto, M.; Putnis, A. Kinetics of crystal nucleation in ionic solutions: Electrostatics and hydration forces. Geochim. Cosmochim. Acta 2010, 74, 469–481. [Google Scholar] [CrossRef]
- Kielland, J. Individual activity coefficients of ions in aqueous solutions. J. Am. Chem. Soc. 1937, 59, 1675–1678. [Google Scholar] [CrossRef]
- Zhuo, K.; Dong, W.; Wang, W.; Wang, J. Activity coefficients of individual ions in aqueous solutions of sodium halides at 298.15 K. Fluid Phase Equilib. 2008, 274, 80–84. [Google Scholar] [CrossRef]
- Rodriguez-Navarro, C.; Kudlacz, K.; Cizer, O.; Ruiz-Agudo, E.; Kudłacz, K.; Cizer, Ö.; Ruiz-Agudo, E.; Kudlacz, K.; Cizer, O.; Ruiz-Agudo, E. Formation of amorphous calcium carbonate and its transformation into mesostructured calcite. CrystEngComm 2015, 17, 58–72. [Google Scholar] [CrossRef]
- Zou, Z.; Bertinetti, L.; Politi, Y.; Jensen, A.C.S.; Weiner, S.; Addadi, L.; Fratzl, P.; Habraken, W.J.E.M. Opposite particle size effect on amorphous calcium carbonate crystallization in water and during heating in air. Chem. Mater. 2015, 27, 4237–4246. [Google Scholar] [CrossRef]
- Parkhurst, D.L.; Appelo, C.A.J. Description of Input and Examples for PHREEQC Version 3--A Computer Program for Speciation, Batch-Reaction, One-Dimensional Transport, and Inverse Geochemical Calculations; U.S. Geological Survey: Reston, VA, USA, 2013.
- Verch, A.; Gebauer, D.; Antonietti, M.; Cölfen, H. How to control the scaling of CaCO3: A “fingerprinting technique” to classify additives. Phys. Chem. Chem. Phys. 2011, 13, 16811–16820. [Google Scholar] [CrossRef] [PubMed]
- Qiu, S.R.; Wierzbicki, A.; Salter, E.A.; Zepeda, S.; Orme, C.A.; Hoyer, J.R.; Nancollas, G.H.; Cody, A.M.; De Yoreo, J.J. Modulation of calcium oxalate monohydrate crystallization by citrate through selective binding to atomic steps. J. Am. Chem. Soc. 2005, 127, 9036–9044. [Google Scholar] [CrossRef] [PubMed]
- Hu, Y.-Y.; Rawal, A.; Schmidt-Rohr, K. Strongly bound citrate stabilizes the apatite nanocrystals in bone. Proc. Natl. Acad. Sci. USA 2010, 107, 22425–22429. [Google Scholar] [CrossRef] [PubMed]
- Rodriguez-Blanco, J.D.; Shaw, S.; Benning, L.G. The kinetics and mechanisms of amorphous calcium carbonate (ACC) crystallization to calcite, via vaterite. Nanoscale 2011, 3, 265–271. [Google Scholar] [CrossRef] [PubMed]
- Jiang, W.; Pacella, M.S.; Athanasiadou, D.; Nelea, V.; Vali, H.; Hazen, R.M.; Gray, J.J.; McKee, M.D. Chiral acidic amino acids induce chiral hierarchical structure in calcium carbonate. Nat. Commun. 2017, 8, 15066. [Google Scholar] [CrossRef] [PubMed]
- Bosbach, D.; Junta-Rosso, J.L.; Becker, U.; Hochella, M.F. Gypsum growth in the presence of background electrolytes studied by scanning force microscopy. Geochim. Cosmochim. Acta 1996, 60, 3295–3304. [Google Scholar] [CrossRef]
- Wolthers, M.; Nehrke, G.; Gustafsson, J.P.; Van Cappellen, P. Calcite growth kinetics: Modeling the effect of solution stoichiometry. Geochim. Cosmochim. Acta 2012, 77, 121–134. [Google Scholar] [CrossRef]
- Weaver, M.L.; Qiu, S.R.; Hoyer, J.R.; Casey, W.H.; Nancollas, G.H.; De Yoreo, J.J. Inhibition of calcium oxalate monohydrate growth by citrate and the effect of the background electrolyte. J. Cryst. Growth 2007, 306, 135–145. [Google Scholar] [CrossRef]
- Putnis, C.V.; Ruiz-Agudo, E. The mineral-water interface: Where minerals react with the environment. Elements 2013, 9, 177–182. [Google Scholar] [CrossRef]
- Ruiz-Agudo, E.; Putnis, C.V.; Rodriguez-Navarro, C. Reactions between minerals and aqueous solutions. In Mineral Reaction Kinetics: Microstructures, Textures, Chemical and Isotopic Signatures; Mineralogical Society of Great Britain & Ireland: Middlesex, UK, 2017; Volume 16, pp. 419–467. [Google Scholar]
- Dove, P.M.; Czank, C.A. Crystal chemical controls on the dissolution kinetics of the isostructural sulfates: Celestite, anglesite, and barite. Geochim. Cosmochim. Acta 1995, 59, 1907–1915. [Google Scholar] [CrossRef]
- Pokrovsky, O.S.; Schott, J. Iron colloids/organic matter associated transport of major and trace elements in small boreal rivers and their estuaries (NW Russia). Chem. Geol. 2002, 190, 141–179. [Google Scholar] [CrossRef]
- Kowacz, M.; Groves, P.; Esperança, J.M.S.S.; Rebelo, L.P.N. On the use of ionic liquids to tune crystallization. Cryst. Growth Des. 2011, 11, 684–691. [Google Scholar] [CrossRef]
- Ruiz-Agudo, E.; Putnis, C.V. Direct observations of mineral fluid reactions using atomic force microscopy: The specific example of calcite. Mineral. Mag. 2012, 76, 227–253. [Google Scholar] [CrossRef]
- Aoba, T. The effect of fluoride on apatite structure and growth. Crit. Rev. Oral Biol. Med. 1997, 8, 136–153. [Google Scholar] [CrossRef] [PubMed]
- DeYoreo, J.J.; Vekilov, P.G. Principles of crystal nucleation and growth. Rev. Mineral. Geochem. 2003, 54, 57–93. [Google Scholar] [CrossRef]
- Gebauer, D.; Kellermeier, M.; Gale, J.D.; Bergström, L.; Cölfen, H. Pre-nucleation clusters as solute precursors in crystallisation. Chem. Soc. Rev. 2014, 43, 2348–2371. [Google Scholar] [CrossRef] [PubMed]
- Sear, R.P. Nucleation: Theory and applications to protein solutions and colloidal suspensions. J. Phys. Condens. Matter 2007, 19, 33101. [Google Scholar] [CrossRef]
- Collins, K.D. Charge density-dependent strength of hydration and biological structure. Biophys. J. 1997, 72, 65–76. [Google Scholar] [CrossRef]
- Collins, K.D. Ion hydration: Implications for cellular function, polyelectrolytes, and protein crystallization. Biophys. Chem. 2006, 119, 271–281. [Google Scholar] [CrossRef] [PubMed]
- Marcus, Y. Effect of ions on the structure of water: Structure making and breaking. Chem. Rev. 2009, 109, 1346–1370. [Google Scholar] [CrossRef] [PubMed]
- Marcus, Y. Ions in Water and Biophysical Implications; Springer: Dordrecht, The Netherlands, 2012; Volume 53. [Google Scholar]
- Hribar, B.; Southall, N.T.; Vlachy, V.; Dill, K.A. How ions affect the structure of water. J. Am. Chem. Soc. 2002, 124, 12302–12311. [Google Scholar] [CrossRef] [PubMed]
- Samoĭlov, O.I. Structure of Aqueous Electrolyte Solutions and the Hydration of Ions; Consultants Bureau: London, UK, 1965. [Google Scholar]
- Pouget, E.M.; Bomans, P.H.H.; Goos, J.A.C.M.; Frederik, P.M.; de With, G.; Sommerdijk, N.A.J.M. The initial stages of template-controlled CaCO3 formation revealed by cryo-TEM. Science 2009, 323, 1455–1458. [Google Scholar] [CrossRef] [PubMed] [Green Version]
- Dorvee, J.R.; Veis, A. Water in the formation of biogenic minerals: Peeling away the hydration layers. J. Struct. Biol. 2013, 183, 278–303. [Google Scholar] [CrossRef] [PubMed]
- Malenkov, G.G.; Samoĭlov, O.I. Electrostatic interaction and coordination of molecules in water. J. Struct. Chem. 1965, 6, 6–10. [Google Scholar] [CrossRef]
- Kinoshita, M.; Harano, Y. Potential of mean force between solute atoms in salt solution: Effects due to salt species and relevance to conformational transition of biomolecules. Bull. Chem. Soc. Jpn. 2005, 78, 1431–1441. [Google Scholar] [CrossRef]
- Samoĭlov, O.I. The theory of the salting out in aqueous solutions-II. Dependence of dehydration and hydration on the initial degree of hydration of a cation undergoing salting out. J. Struct. Chem. 1967, 7, 177–180. [Google Scholar] [CrossRef]
- Samoĭlov, O.I. Theory of salting out from aqueous solutions-III. Dependence of salting out on characteristics of ions of salting-out agent. J. Struct. Chem. 1971, 11, 929–931. [Google Scholar] [CrossRef]
- Buhmann, D.; Dreybrodt, W. Calcite dissolution kinetics in the system H2O-CO2-CaCO3 with participation of foreign ions. Chem. Geol. 1987, 64, 89–102. [Google Scholar] [CrossRef]
- Long, X.; Meng, R.; Wu, W.; Ma, Y.; Yang, D.; Qi, L. Calcite microneedle arrays produced by inorganic ion-assisted anisotropic dissolution of bulk calcite crystal. Chem.-A Eur. J. 2014, 20, 4264–4272. [Google Scholar] [CrossRef] [PubMed]
- Samoĭlov, O.I. The theory of salting out from aqueous solutions-I. General problems. J. Struct. Chem. 1967, 7, 12–19. [Google Scholar] [CrossRef]


© 2017 by the authors. Licensee MDPI, Basel, Switzerland. This article is an open access article distributed under the terms and conditions of the Creative Commons Attribution (CC BY) license (http://creativecommons.org/licenses/by/4.0/).
Share and Cite
Burgos-Cara, A.; Putnis, C.V.; Rodriguez-Navarro, C.; Ruiz-Agudo, E. Hydration Effects on the Stability of Calcium Carbonate Pre-Nucleation Species. Minerals 2017, 7, 126. https://doi.org/10.3390/min7070126
Burgos-Cara A, Putnis CV, Rodriguez-Navarro C, Ruiz-Agudo E. Hydration Effects on the Stability of Calcium Carbonate Pre-Nucleation Species. Minerals. 2017; 7(7):126. https://doi.org/10.3390/min7070126
Chicago/Turabian StyleBurgos-Cara, Alejandro, Christine V. Putnis, Carlos Rodriguez-Navarro, and Encarnacion Ruiz-Agudo. 2017. "Hydration Effects on the Stability of Calcium Carbonate Pre-Nucleation Species" Minerals 7, no. 7: 126. https://doi.org/10.3390/min7070126
APA StyleBurgos-Cara, A., Putnis, C. V., Rodriguez-Navarro, C., & Ruiz-Agudo, E. (2017). Hydration Effects on the Stability of Calcium Carbonate Pre-Nucleation Species. Minerals, 7(7), 126. https://doi.org/10.3390/min7070126