Article

Chemical Force Microscopy Study on the Interactions of COOH Functional Groups with Kaolinite Surfaces: Implications for Enhanced Oil Recovery

Department of Earth Sciences, Durham University, Durham DH1 3LE, UK
*
Author to whom correspondence should be addressed.
Minerals 2017, 7(12), 250; https://doi.org/10.3390/min7120250
Submission received: 10 November 2017 / Revised: 5 December 2017 / Accepted: 12 December 2017 / Published: 19 December 2017
(This article belongs to the Special Issue Organo-Mineral Interactions)

Abstract

:
Clay–oil interactions play a critical role in determining the wettability of sandstone oil reservoirs, which, in turn, governs the effectiveness of enhanced oil recovery methods. In this study, we have measured the adhesion between –COOH functional groups and the siloxane and aluminol faces of kaolinite clay minerals by means of chemical force microscopy as a function of pH, salinity (from 0.001 M to 1 M) and cation identity (Na+ vs. Ca2+). Results from measurements on the siloxane face show that Ca2+ displays a reverse low-salinity effect (adhesion decreasing at higher concentrations) at pH 5.5, and a low salinity effect at pH 8. At a constant Ca2+ concentration of 0.001 M, however, an increase in pH leads to larger adhesion. In contrast, a variation in the Na+ concentration showed less effect in varying the adhesion of –COOH groups to the siloxane face. Measurements on the aluminol face showed a reverse low-salinity effect at pH 5.5 in the presence of Ca2+, whereas an increase in pH with constant ion concentration resulted in a decrease in adhesion for both Ca2+ and Na+. Results are explained by looking at the kaolinite’s surface complexation and the protonation state of the functional group, and highlight a more important role of the multicomponent ion exchange mechanism in controlling adhesion than the double layer expansion mechanism.

Graphical Abstract

1. Introduction

Global crude oil consumption has sharply increased in the last decades; however, primary and secondary recovery methods may still leave up to 65% of the original oil in place (OOIP) in the reservoir [1,2]. In order to increase oil yield, the petroleum industry uses tertiary or enhanced oil recovery (EOR) methods, as well as modified secondary recovery approaches. Enhanced oil recovery methods include steam and CO2 injection, chemical flooding, pH alteration, inter alia. One method that is currently highlighted is low salinity enhanced oil recovery (LSEOR) owing to its use of a low-cost, environment-friendly substance, its sustainability, and its effectiveness [3,4]. For this reason, a multitude of studies have been conducted to understand the fundamental geochemical processes driving LSEOR; nevertheless, a debate still exists on the exact nature and importance of these processes and hence whether LSEOR can be applied to any given field [3,4]. Most authors agree, however, on a series of factors or conditions that need to be met for low salinity EOR to be effective, these include: the presence of clay minerals, the presence of a saline connate water (containing multivalent ions), exposure of the rock to acidic and basic oil components, and a significant reduction of salinity in the flooding water [3].
LSEOR processes applied to sandstone reservoirs are believed to improve oil yields through the overall modification of wettability [5]. This change of wettability would drive the detachment of oil molecules from the mineral-lined pore surfaces of the sandstone. Lager et al. [6] proposed that multicomponent ion exchange (MIE) of divalent cations (Mg2+ and Ca2+) was the main mechanism responsible for increasing oil yields on their core brine injection experiments. In their model, the divalent cations preferentially acted as an electrostatic bridge between the negatively charged clay surfaces and the negatively charged polar oil molecules. During the low salinity brine injection phase, monovalent cations would substitute the divalent cations bridging the clay mineral surface and the oil molecules, resulting in the release of oil from the clay surface, which would induce the overall reservoir wettability state to more water-wetting. However, both Strand et al. [5] and Austad et al. [7] have pointed out that wettability is not controlled only by low cation concentration, but also through a pH effect. These authors proposed that carboxylate functional groups (–COOH), some of the most common found in crude oil, are more preferential adsorbed through hydrogen linkage than Ca2+ bridging on a negative clay surface. In other words, polar crude oil directly adsorbs on clay surfaces, as divalent cations screen its charge. A low salinity injection will then reduce the amount of Ca2+, with water also dissociating into H+ and OH. H+ will then replace the Ca2+, whereas OH competes for the H from crude oil functional groups (–COOH), effectively breaking the hydrogen linkages that bound the oil to the clay. This means that if the brine contains a large number of OH, or high pH, the polar crude oil components might release more easily from the clay surfaces. From looking at these two different mechanisms, two questions arise with regard to clay–oil interactions: (1) how does the polar crude oil adsorb onto a clay surface, is it cation bridging or direct bonding? (2) What is the main factor controlling the release of the polar oil, a decrease in brine concentration or increasing pH, or a combination of the two?
Sandstone mainly consists of quartz, feldspar, and clay minerals. The latter has been suggested to be fundamental to the low salinity effect [4] as they are overwhelmingly present on the sandstones’ pore surfaces, even coating optically clear quartz surfaces as nanoparticles [8,9]. In addition, clay minerals display a permanent negative charge on their basal surfaces, which increases their reactivity and propensity to interact with oil molecules and ions in solution [5]. Kaolinite is one of the most important clay minerals present in sandstones, sometimes accounting for more than 50% of the clay minerals surface exposed at the pore surface [8]. Studies on the low salinity effect mechanisms generally assume clays present negatively charged surfaces [6,7]; however, kaolinite is in fact a 1:1 clay mineral composed of two different faces (Figure 1), namely a silica tetrahedral basal plane (siloxane face) and an aluminum hydroxide (or brucite-type) octahedral sheet (aluminol face). Kaolinite has a theoretical chemical composition of Al2Si2O5(OH)4; however, it does have a small amount of isomorphous substitutions, mostly the substitution of Al3+ for Si4+ in the tetrahedral layer and of Mg2+ for Al3+ in the octahedral plane. Consequently, the siloxane face possesses a small, permanent negative charge [10,11,12,13], whereas the aluminol face has a pH-dependent surface charge [10,11,13]. For these reasons, a difference in the wetting behavior (and affinity to oil molecules) across the two different exposed surfaces is to be expected.
Atomic force microscopy (AFM) is a widely-used technique in the study of mineral–solution interface phenomena [14]. For this reason, it has been increasingly used in the search of the main mechanism behind LSEOR, through the determination of surface charge [12,13] or by measuring the adhesion of organic functional groups to mineral or model surfaces, in the so-called chemical force microscopy (CFM) mode. Surface area normalized adhesion force can be directly correlated to macroscopic contact angle measurements; therefore, in principle, it can be used to measure the wetting behavior of a mineral surface, as has been shown by Hassenkam et al. [15], and CFM studies on LSEOR have been varied and focused mostly on measurements on cored samples (both carbonate and sandstones) [15,16,17,18,19,20,21,22,23], but have also included studies on quartz [24], muscovite [24], feldspar [25] and model sapphire [26] surfaces. Although results of these studies vary, the general conclusion is that they point to the prevalence of the double layer expansion mechanism as the most important driving LSEOR, and, most importantly, to the role of adsorbed organic material into controlling the adhesion of oil molecules in reservoir rocks. This being said, no study solely using oriented clay minerals in CFM experiments has been reported, however.
In this present study, CFM has been used to measure the adhesion between –COOH functionalized AFM probes and the aluminol and siloxane surfaces of kaolinite. The effect of cation identity (Ca2+ vs. Na+), concentration (from 1 M to 0.001 M) as well as pH (5–9) on the measured adhesion was assessed. The main objective of the study is to understand the role, if any, of the chemistry of the two different exposed crystal basal surfaces in driving the LSEOR mechanism.

2. Materials and Methods

2.1. Oriented Kaolinite Sample Preparation

In order to study the adhesion over a particular kaolinite face, it was imperative to prepare films of oriented kaolinite crystals (KGa-1b from the Clay Minerals Society Source Clay Repository). To this end, a modified version of method originally developed by Gupta and Miller [11] was used. This method is based on the fact that the negatively charged surface of siloxane is attracted to a positively charged surface (for example, sapphire), whereas the positively charged alumina face is attracted to a negatively charged surface (like muscovite mica). The effectiveness of this method on producing orientated samples has been verified by Alagha et al. [27] For both preparations, a suspension of kaolinite crystals was prepared by adding 10 mg powdered kaolinite to 10 ml Milli-Q water. The suspension was then homogenously dispersed using a QSonica sonicator probe (Q125) at 20% amplitude for a total of 14 min sonication time (with a 2 s:5 s sonication/rest cycle). After sonication, the solution was left for 30 min to settle the larger, agglomerated crystals. Finally, a few droplets of the solution were taken from the upper part of the vial with a glass pipette and were deposited on the prepared substrate. The substrate was then introduced in an oven to dry at 70 °C for one hour, followed by rinsing with Milli-Q water (to remove any potentially loose crystals) and further drying (20 min) in the oven (70 °C). For samples oriented with the siloxane face up, freshly cleaved muscovite mica sheets of 11 mm × 11 mm (Agar Scientific, Essex, UK) were used. For samples with the aluminol face oriented up, polished sapphire substrates (Valley Design Corp., Shirley, MA, USA) were used. The sapphire was cleaned by washing with ethanol and acetone, followed by 30 min in a UV/ozone cleaner [12]. Prior to performing the AFM experiment, the substrate was glued to a glass slide using an epoxy glue and then it was introduced in the fluid cell.

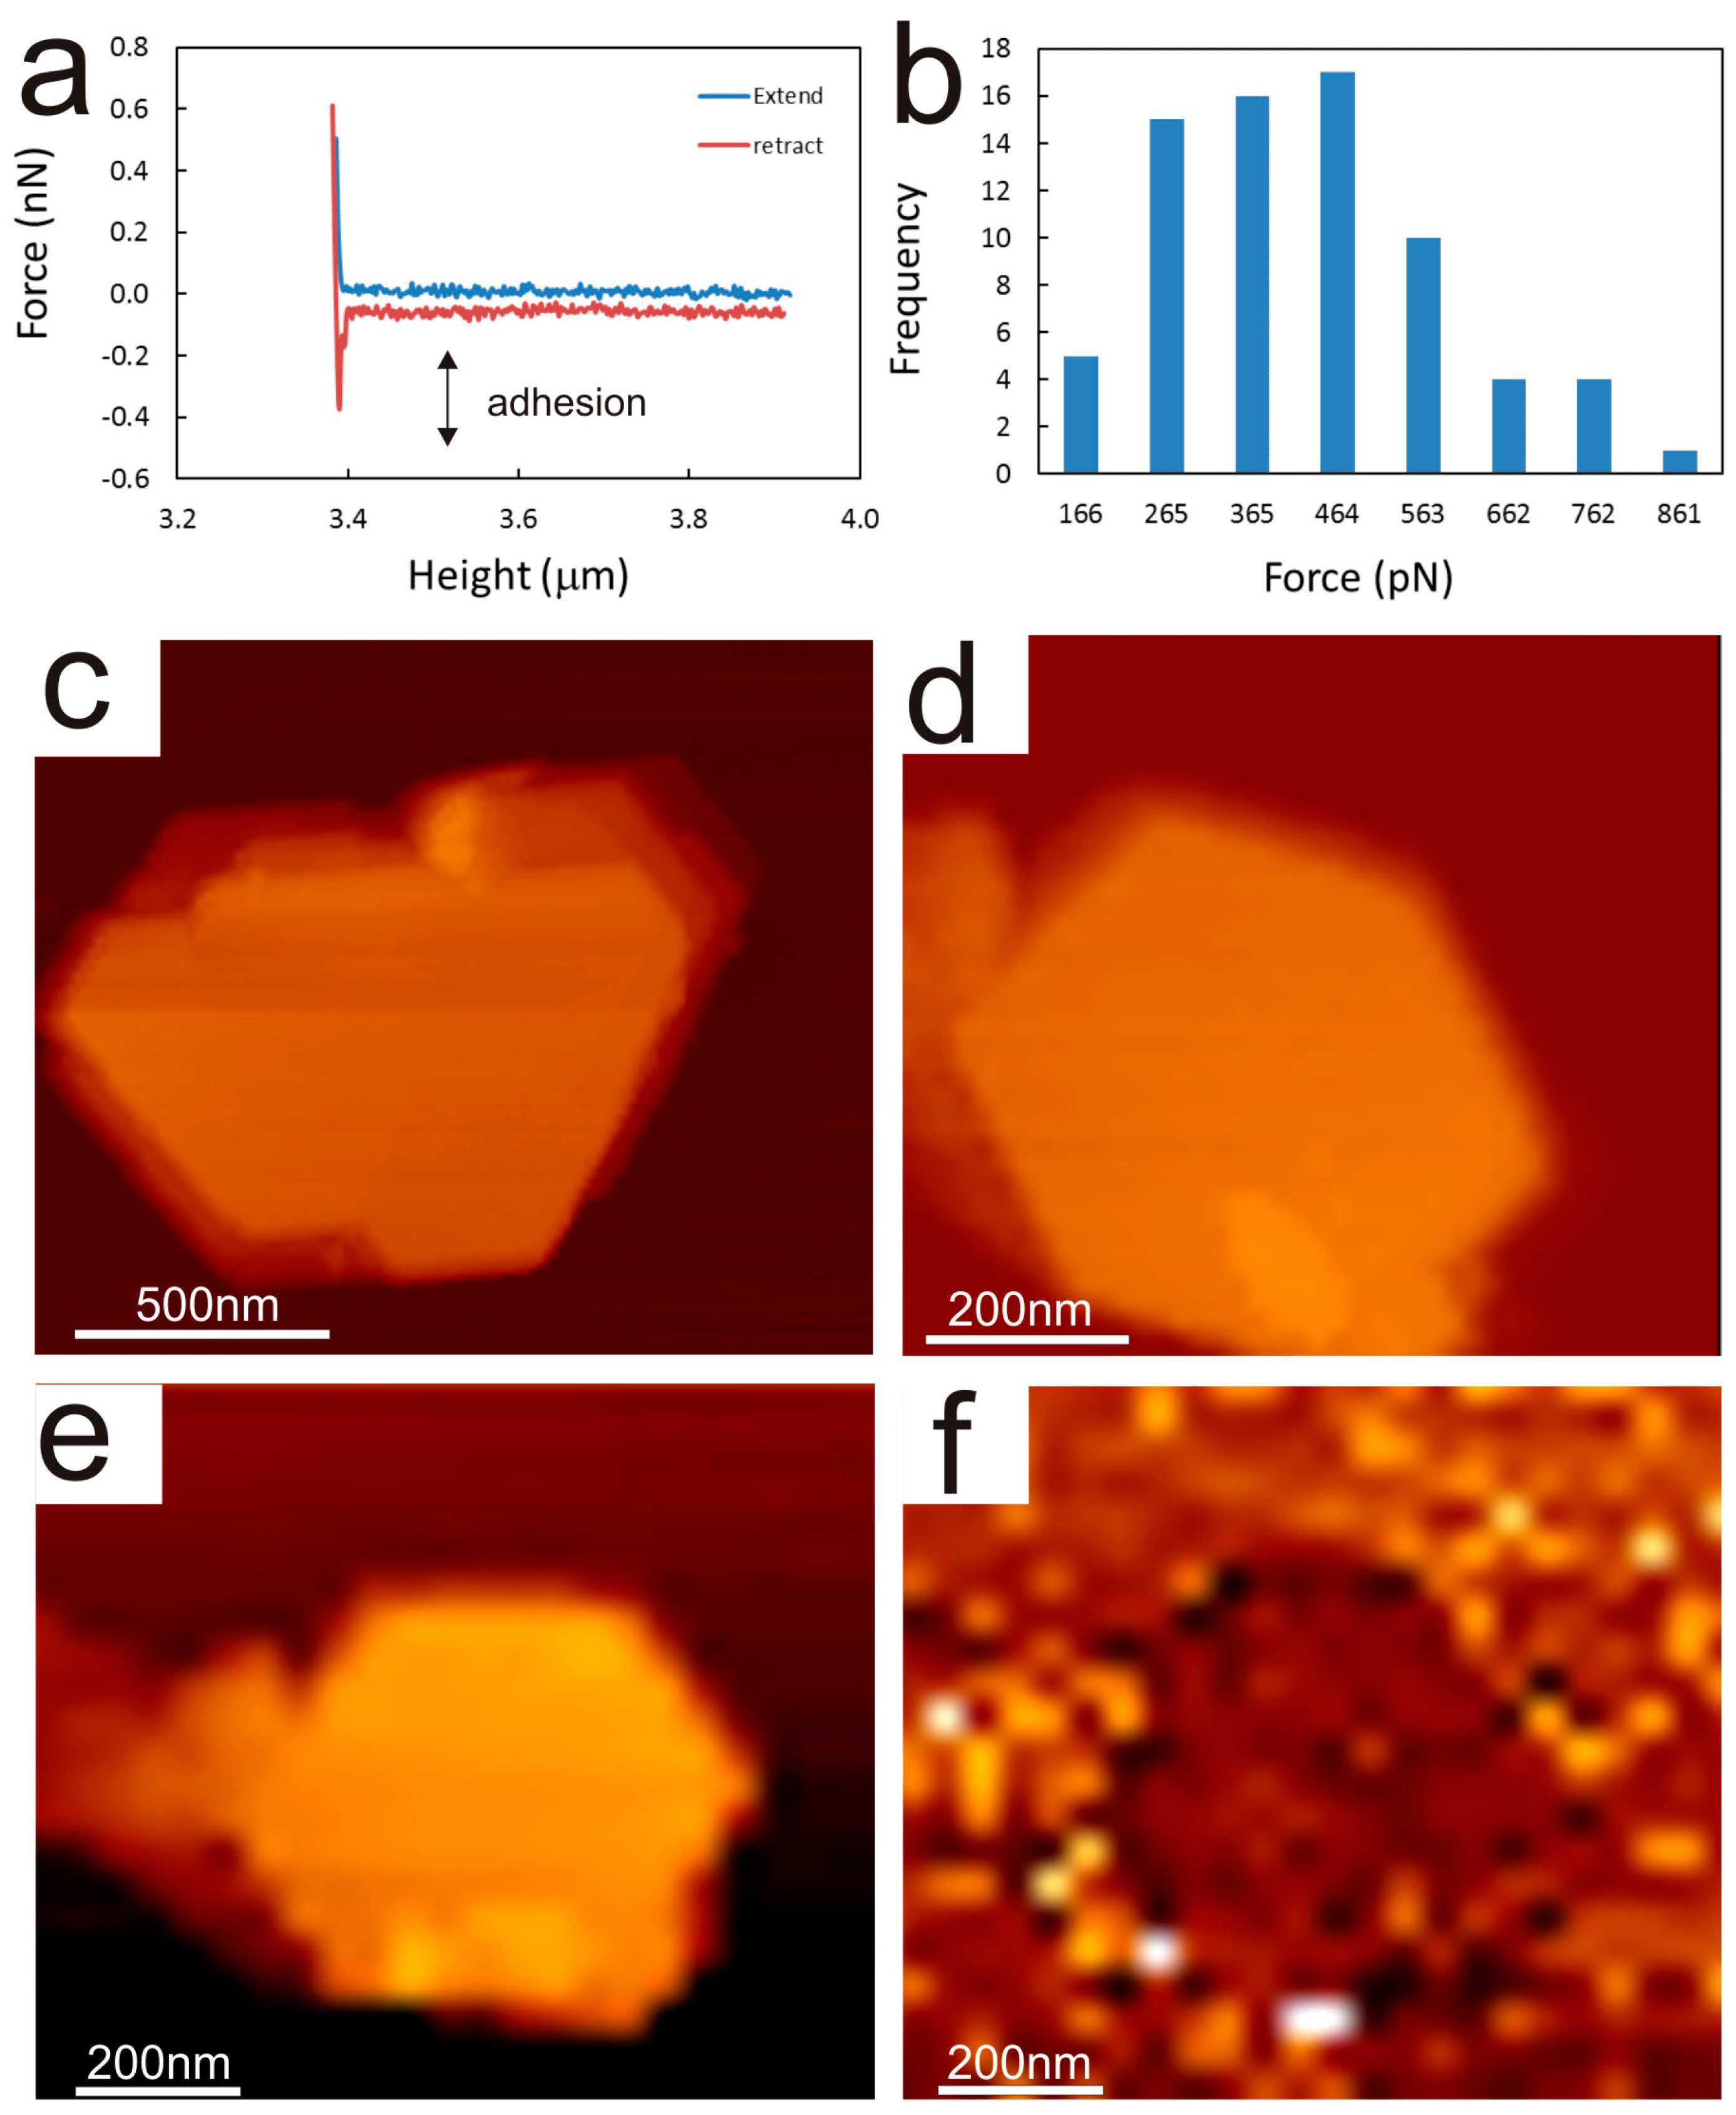
2.2. Chemical Force Microscopy

Chemical force microscopy measurements were performed using a Nanowizard 3 AFM (JPK Instruments AG, Berlin, Germany). Scanning of the kaolinite samples was done using the Force Mapping mode, were the AFM probe is brought up and down (i.e., into contact and out of contact with the substrate/sample) in a regular, user-defined fashion, creating a so-called force-distance curve (FD) at every pixel of the image (Figure 2a). From these force distance curves, a multitude of information concerning the adhesion and other mechanical properties of the sample can be extracted [28], therefore creating a “map” of these properties, which can be superimposed onto the topographical information, also registered during the scanning.
Experiments were started by scanning the sample in Milli-Q water using a proprietary, fast Force Mapping mode (Quantitative ImagingTM, JPK Instruments AG, Berlin, Germany), at low resolutions (32 × 32 pixels), and low applied force (≈ 0.3 nN), in order to find an adequate crystal to perform the CFM experiment. The main characteristics that were looked after were that the crystal was flat and single (not an agglomerate), that was stable (i.e., did not move) during scanning, and that had a size close to or larger than 1 μm across. Scanning at this stage was performed using a Pyrex-Nitride probes TR series (PNP-TR) (NanoWorld AG, Neuchâtel, Switzerland) which has a nominal spring constant of 0.67 N/m. Once an adequate crystal was found, it was scanned with a resolution of 64 × 64 pixels (Figure 2c,d), so any possible contamination on the surface of the crystal that could hinder the CFM measurements could be observed.
The CFM experiment was started by substituting the “standard” probe with a commercial, –COOH functionalised tip (ST-PNP, from SmartTip BV Enschede Netherlands). All cantilevers have a triangle shape and a tip radius of <40 nm. The tip was then calibrated (in water) by first measuring the cantilever sensitivity (V/nm) by performing a force distance curve (either against a glass or sapphire substrate). After this, the tip was brought out of contact and calibration of the vertical spring constant was done using the thermal method [29] and the correction factors from Butt and Jaschke [30]. The value obtained was used to convert the measured deflection signal (in V) into force units (N). For the probes used, calculated vertical spring constant varied between 0.055 and 0.04 N/m. After calibration, the CFM experiment was started by introducing the first corresponding solution of the particular experiment (Table 1) followed by scanning the previously identified crystal in the force mapping mode. Two force mapping mode scans were done per each solution composition (or pH), the first with a 0 s delay time and the second with a 1 s delay (whilst in contact with the crystal surface). This was done to ensure that proper contact and bonding between the functional groups and the kaolinite crystal occurred, which leads to a more reliable measure of the adhesion forces [26]. Each scan was performed with a minimum resolution of 25 × 25 pixels (or 625 total FD curves). This relatively low resolution was chosen to minimize potential loss of functionalization by the tip due to its repeated contact with the mineral’s surface. However, it still provides a relatively large number of sample points per kaolinite crystals (>100 pixels). Representative topography and adhesion maps from a CFM experiment are shown in Figure 2e,f, respectively. The rest of parameters used during the force mapping scanning were: set point of 0.4 nN, z range (piezo height away from the sample): 700 nm, approach (and retraction) speed of the probe: 10 nm/s. Experimental solutions were manually exchanged from the fluid cell for a total of 4 times, to ensure full removal of the previous solution. During the exchange, the tip was rinsed several times with Milli-Q water and the new solution, and was not allowed to dry.

2.3. Data Processing

All data from the CFM experiments were analyzed using the JPK Data Processing software (Version 4.3) (JPK Instruments AG, Berlin, Germany). To calculate the adhesion, each force distance curve was analyzed in the following way: (1) the baseline subtraction tool was used to “bring” the retract curve to a 0 N position (i.e., to remove the effect of hydrodynamic drag, as expressed by a difference in the laser position at zero load between approach and retract curves, as can be seen in Figure 1a), and also to remove any tilt of the baseline (out of contact) portion of the curve, ensuring a 0 N load at the point where the probe snaps out of contact and across the full extension of the baseline; (2) the minimum value tool was then used to locate the minimum value of force recorded (which corresponds to the adhesion), measured against the 0 N baseline. This procedure was applied to all the recorded FD curves using the batch analysis function. After completion, the software creates an image (adhesion map) with the calculated data. Using the adhesion map, it was then possible to measure the adhesion on the surface of each kaolinite crystal. This was done by selecting all data inside the crystal (minus edges, which tend to show a higher adhesion). The data were then saved as an ASCII file and analysed for average and standard deviation. In addition, data were statistically treated to determine the upper and lower inner bounds, which were then used to identify data outliers that were then removed from the data set. Figure 2b shows a representative histogram of the adhesion data as measured in the kaolinite crystal shown in Figure 2e. The relatively high spread in the data may reflect, to some extent, the heterogeneous distribution of surface charge in kaolinite that was recently described by Kumar et al. [12].
All data shown in the figures correspond to that measured with a 1 s dwell time. Data were not normalized per contact area because of difficulties in measuring the tip radius without damaging the probe. This is due to the fact that, in order to measure its radius, the probe has to be scanned against a roughness standard sample, which could lead to the loss of functionalization (due to high friction forces). Therefore, relatively large variations in the absolute values of measured adhesion are reported across different experiments, even in similar systems (same functionalization, same trigger force, same solution composition). These differences are probably due to variations in the contact radius, derived from the fabrication of the AFM probes, which need to be gold coated before functionalization. For these reasons, the data reported here have to be considered in terms of the qualitative differences or changes observed within each experiment, and no conclusions are derived from comparing data across different experiments.

2.4. Aqueous Solutions

Experiments reported here were performed with solutions of either CaCl2 or NaCl composition. These two cations (Ca2+ and Na+) were chosen as representative of monovalent and divalent cations because they are the most common ions in formation and seawater. In addition, the reduction of Ca2+ concentration has been observed to play a critical role in the low salinity effect [31,32], and it forms the basis of the MIE mechanism as the main driver in the process. For both cations, solutions were prepared using Milli-Q water and reagent-grade NaCl and CaCl2 (Sigma-Aldrich, St. Louis, MO, USA). A 1 M solution of each reactant was prepared and was later diluted to prepare the 0.01 M and 0.001 M solutions. pH was measured using a Jenway model 3520 pH meter, equipped with a Schott Instruments pH probe (blue line), which had been previously calibrated with pH 4.01, 7 and 10.01 standard solutions (Fisher Scientific, Hampton, NH, USA). pH of the solutions was mostly not adjusted, and measured to be around 5.5. When adjusted, it was done so by means of HCl and NaOH solutions for the NaCl experiments, and with HCl and Ca(OH)2 for those experiments performed with CaCl2 solutions.

3. Results and Discussion

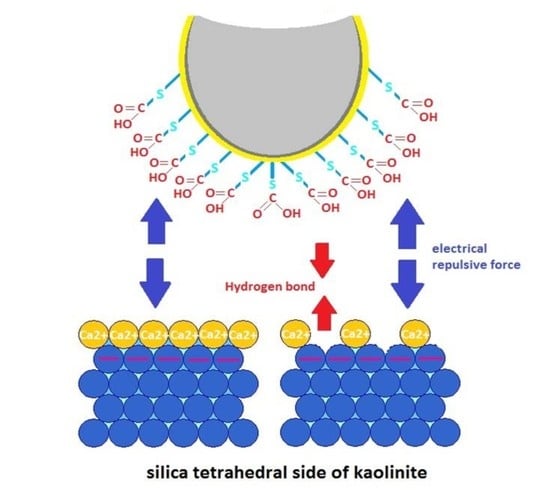
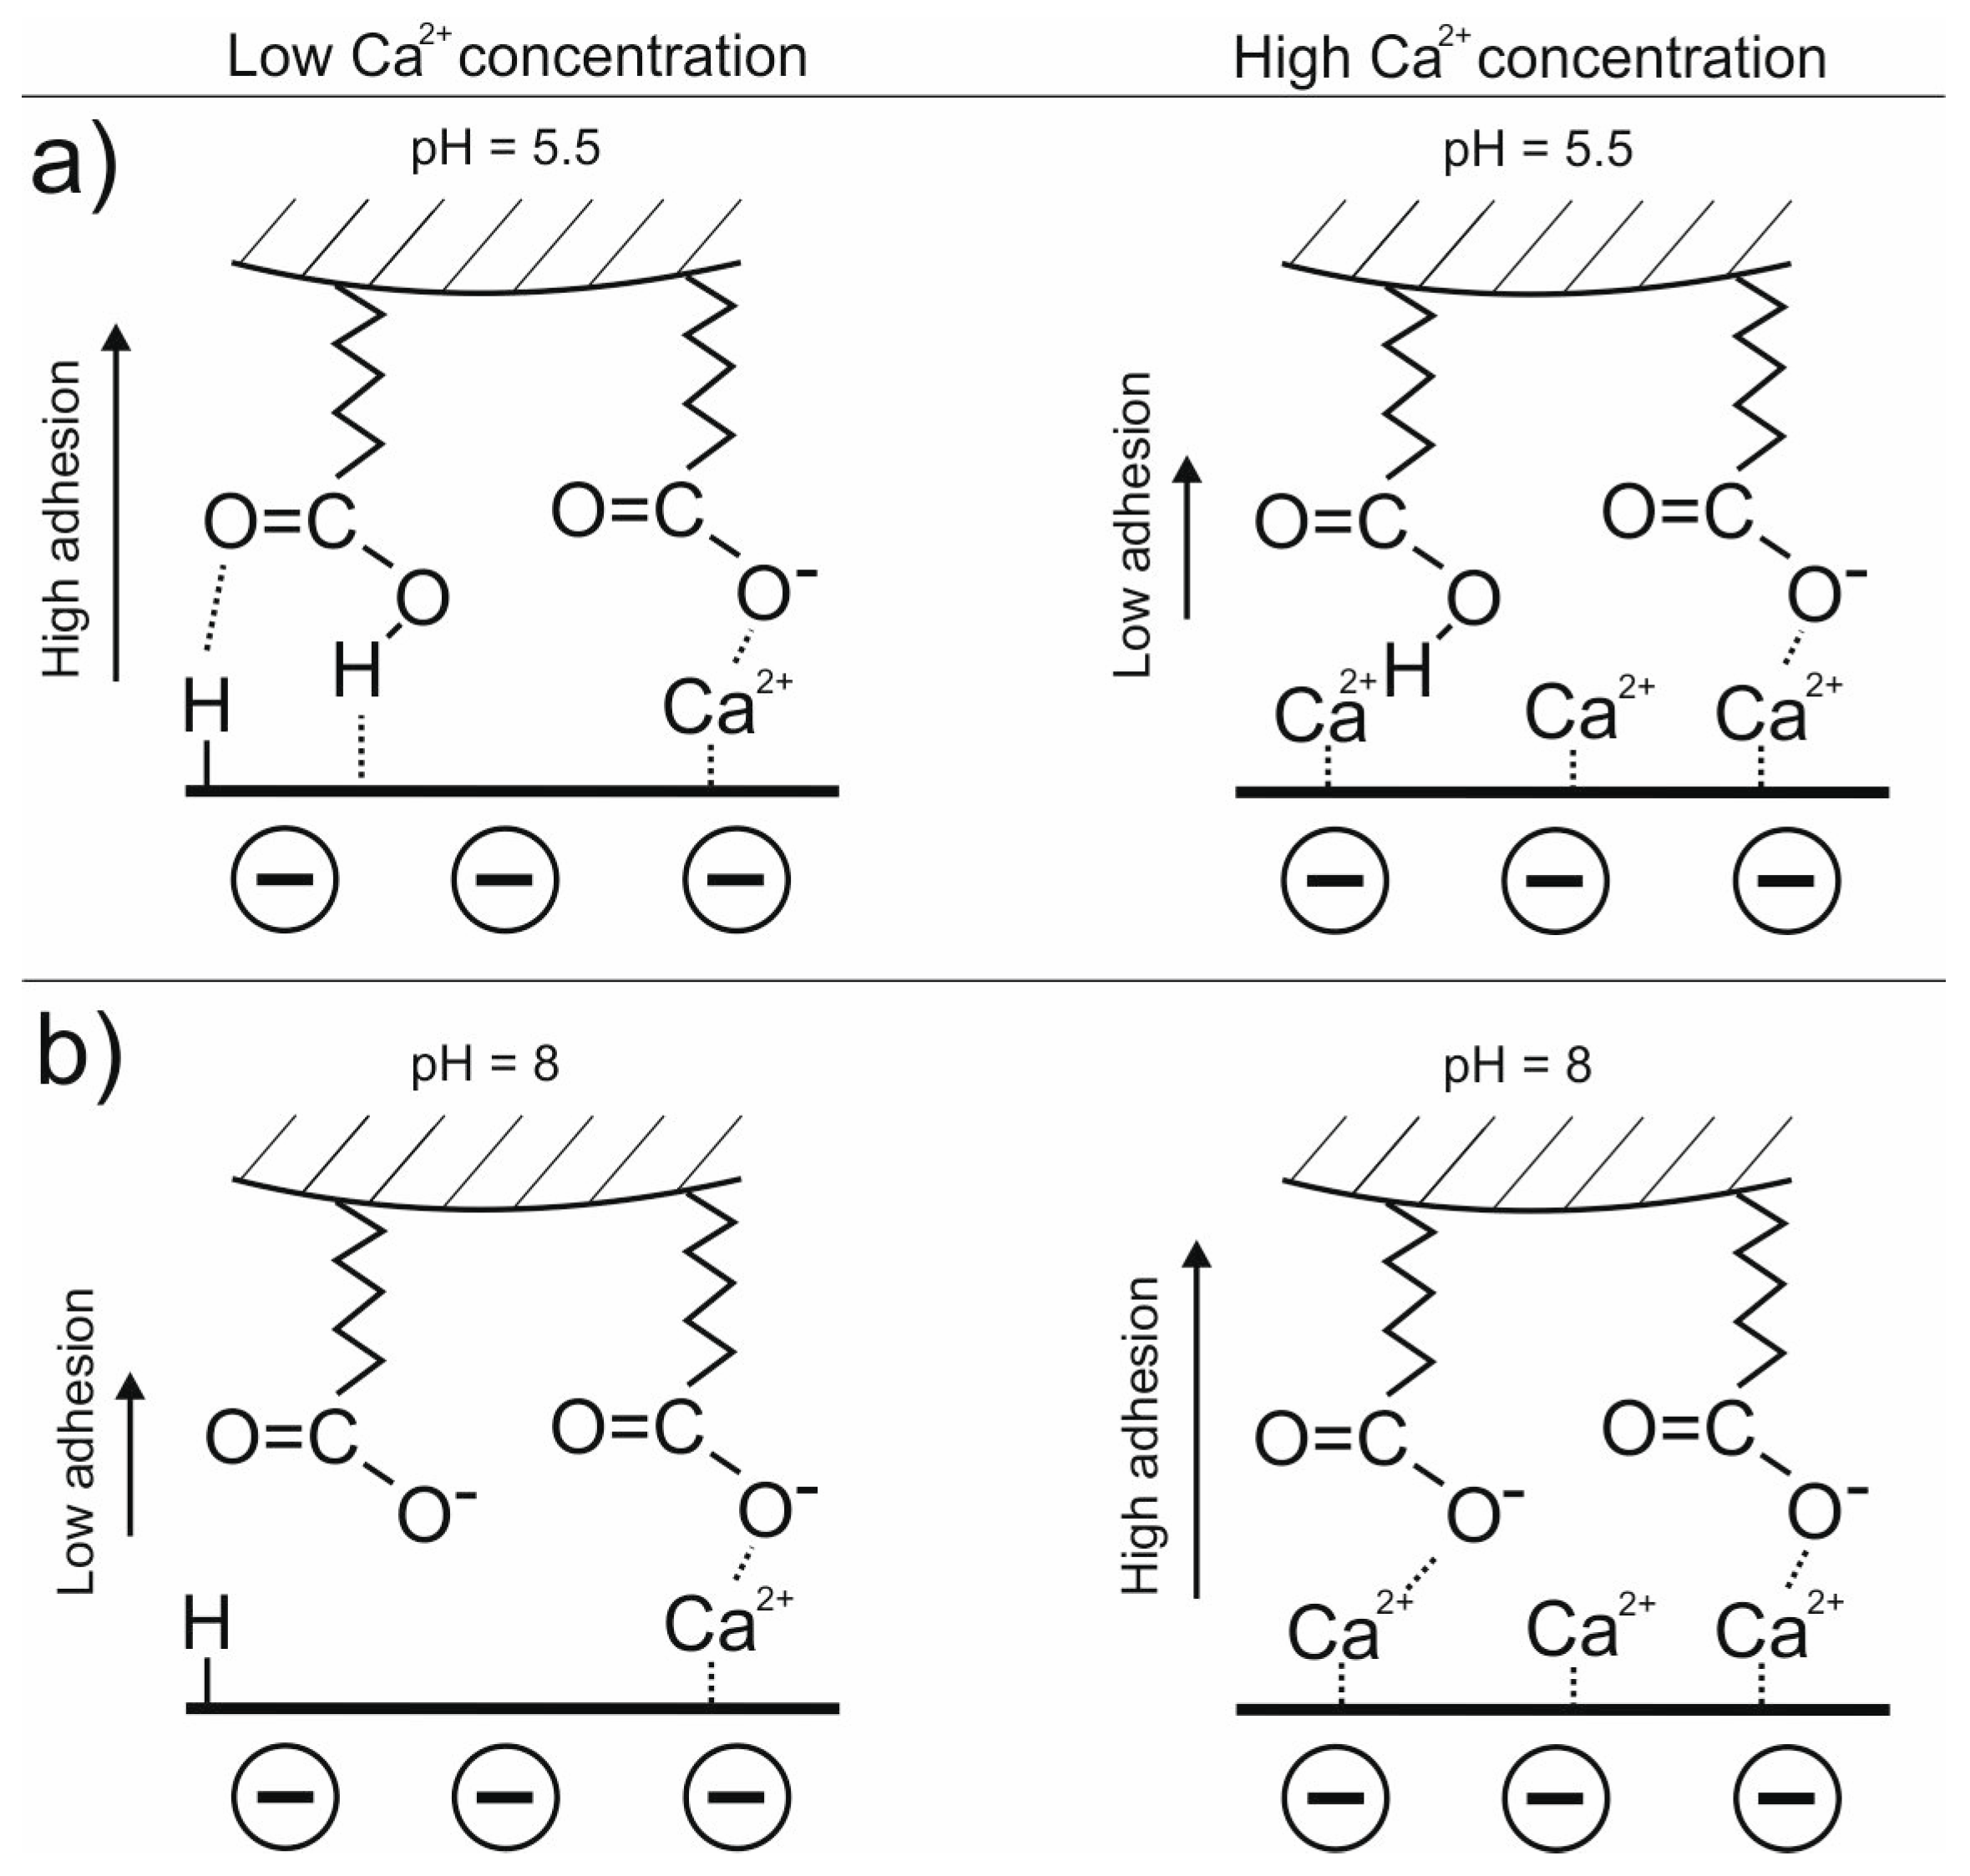
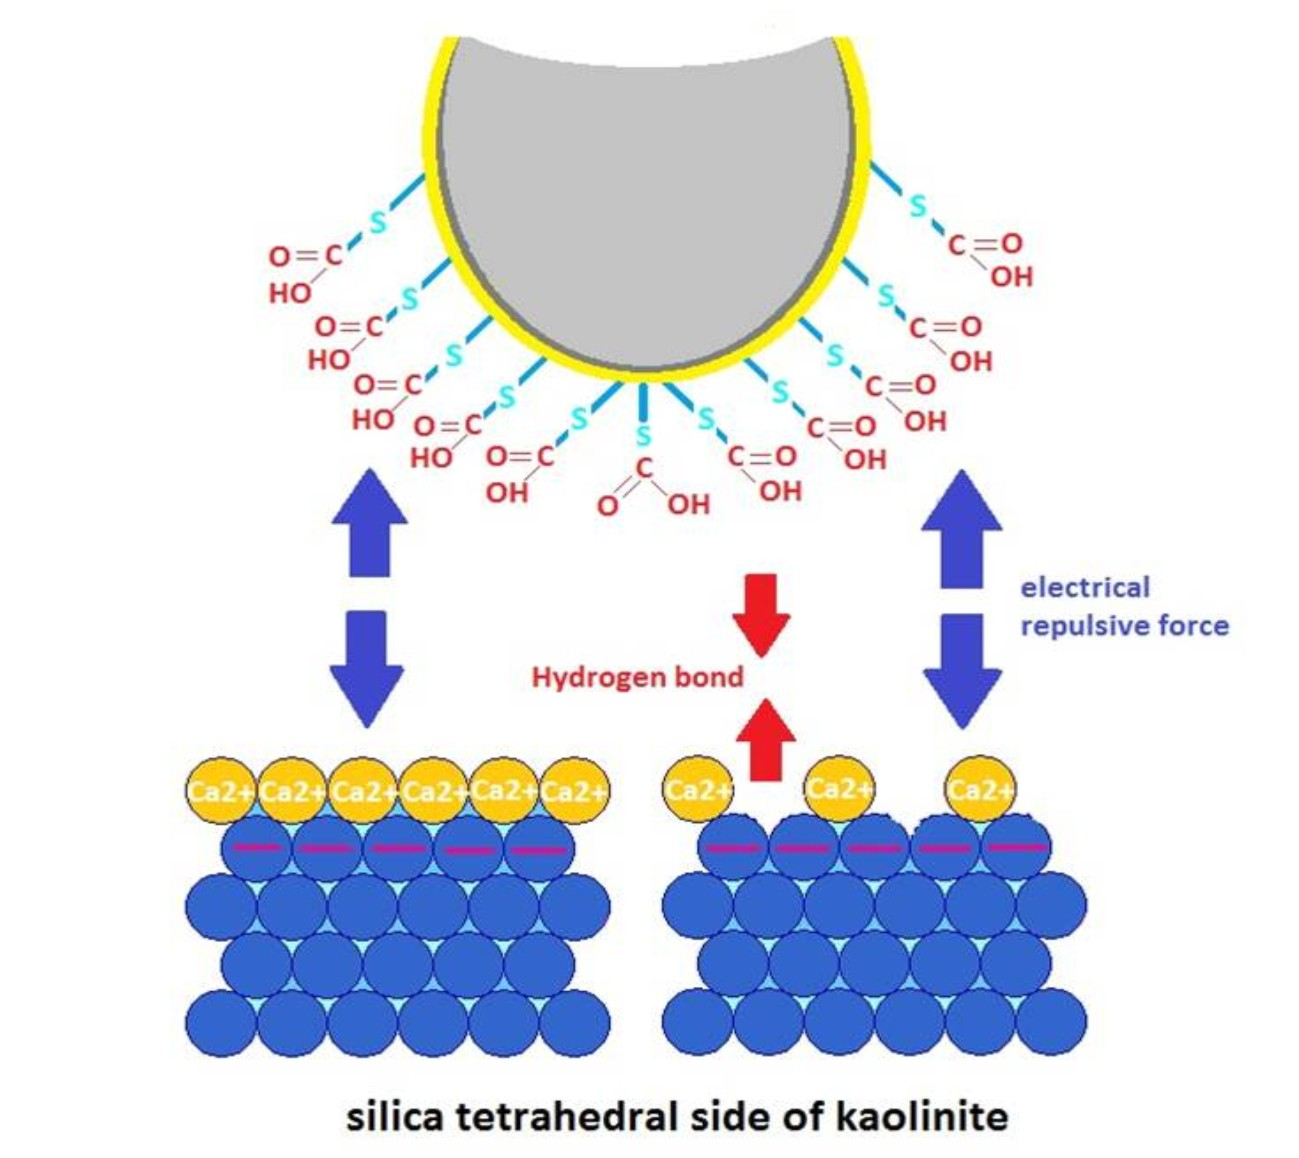
3.1. Adhesion of –COOH Groups to the Siloxane Face

The bulk of experiments shown in this paper were performed over the siloxane face of kaolinite as this will probably be the most exposed face on the pore, at least in terms of the nanoparticles coating quartz grains, which are quite prevalent in real reservoir rocks [8,22].

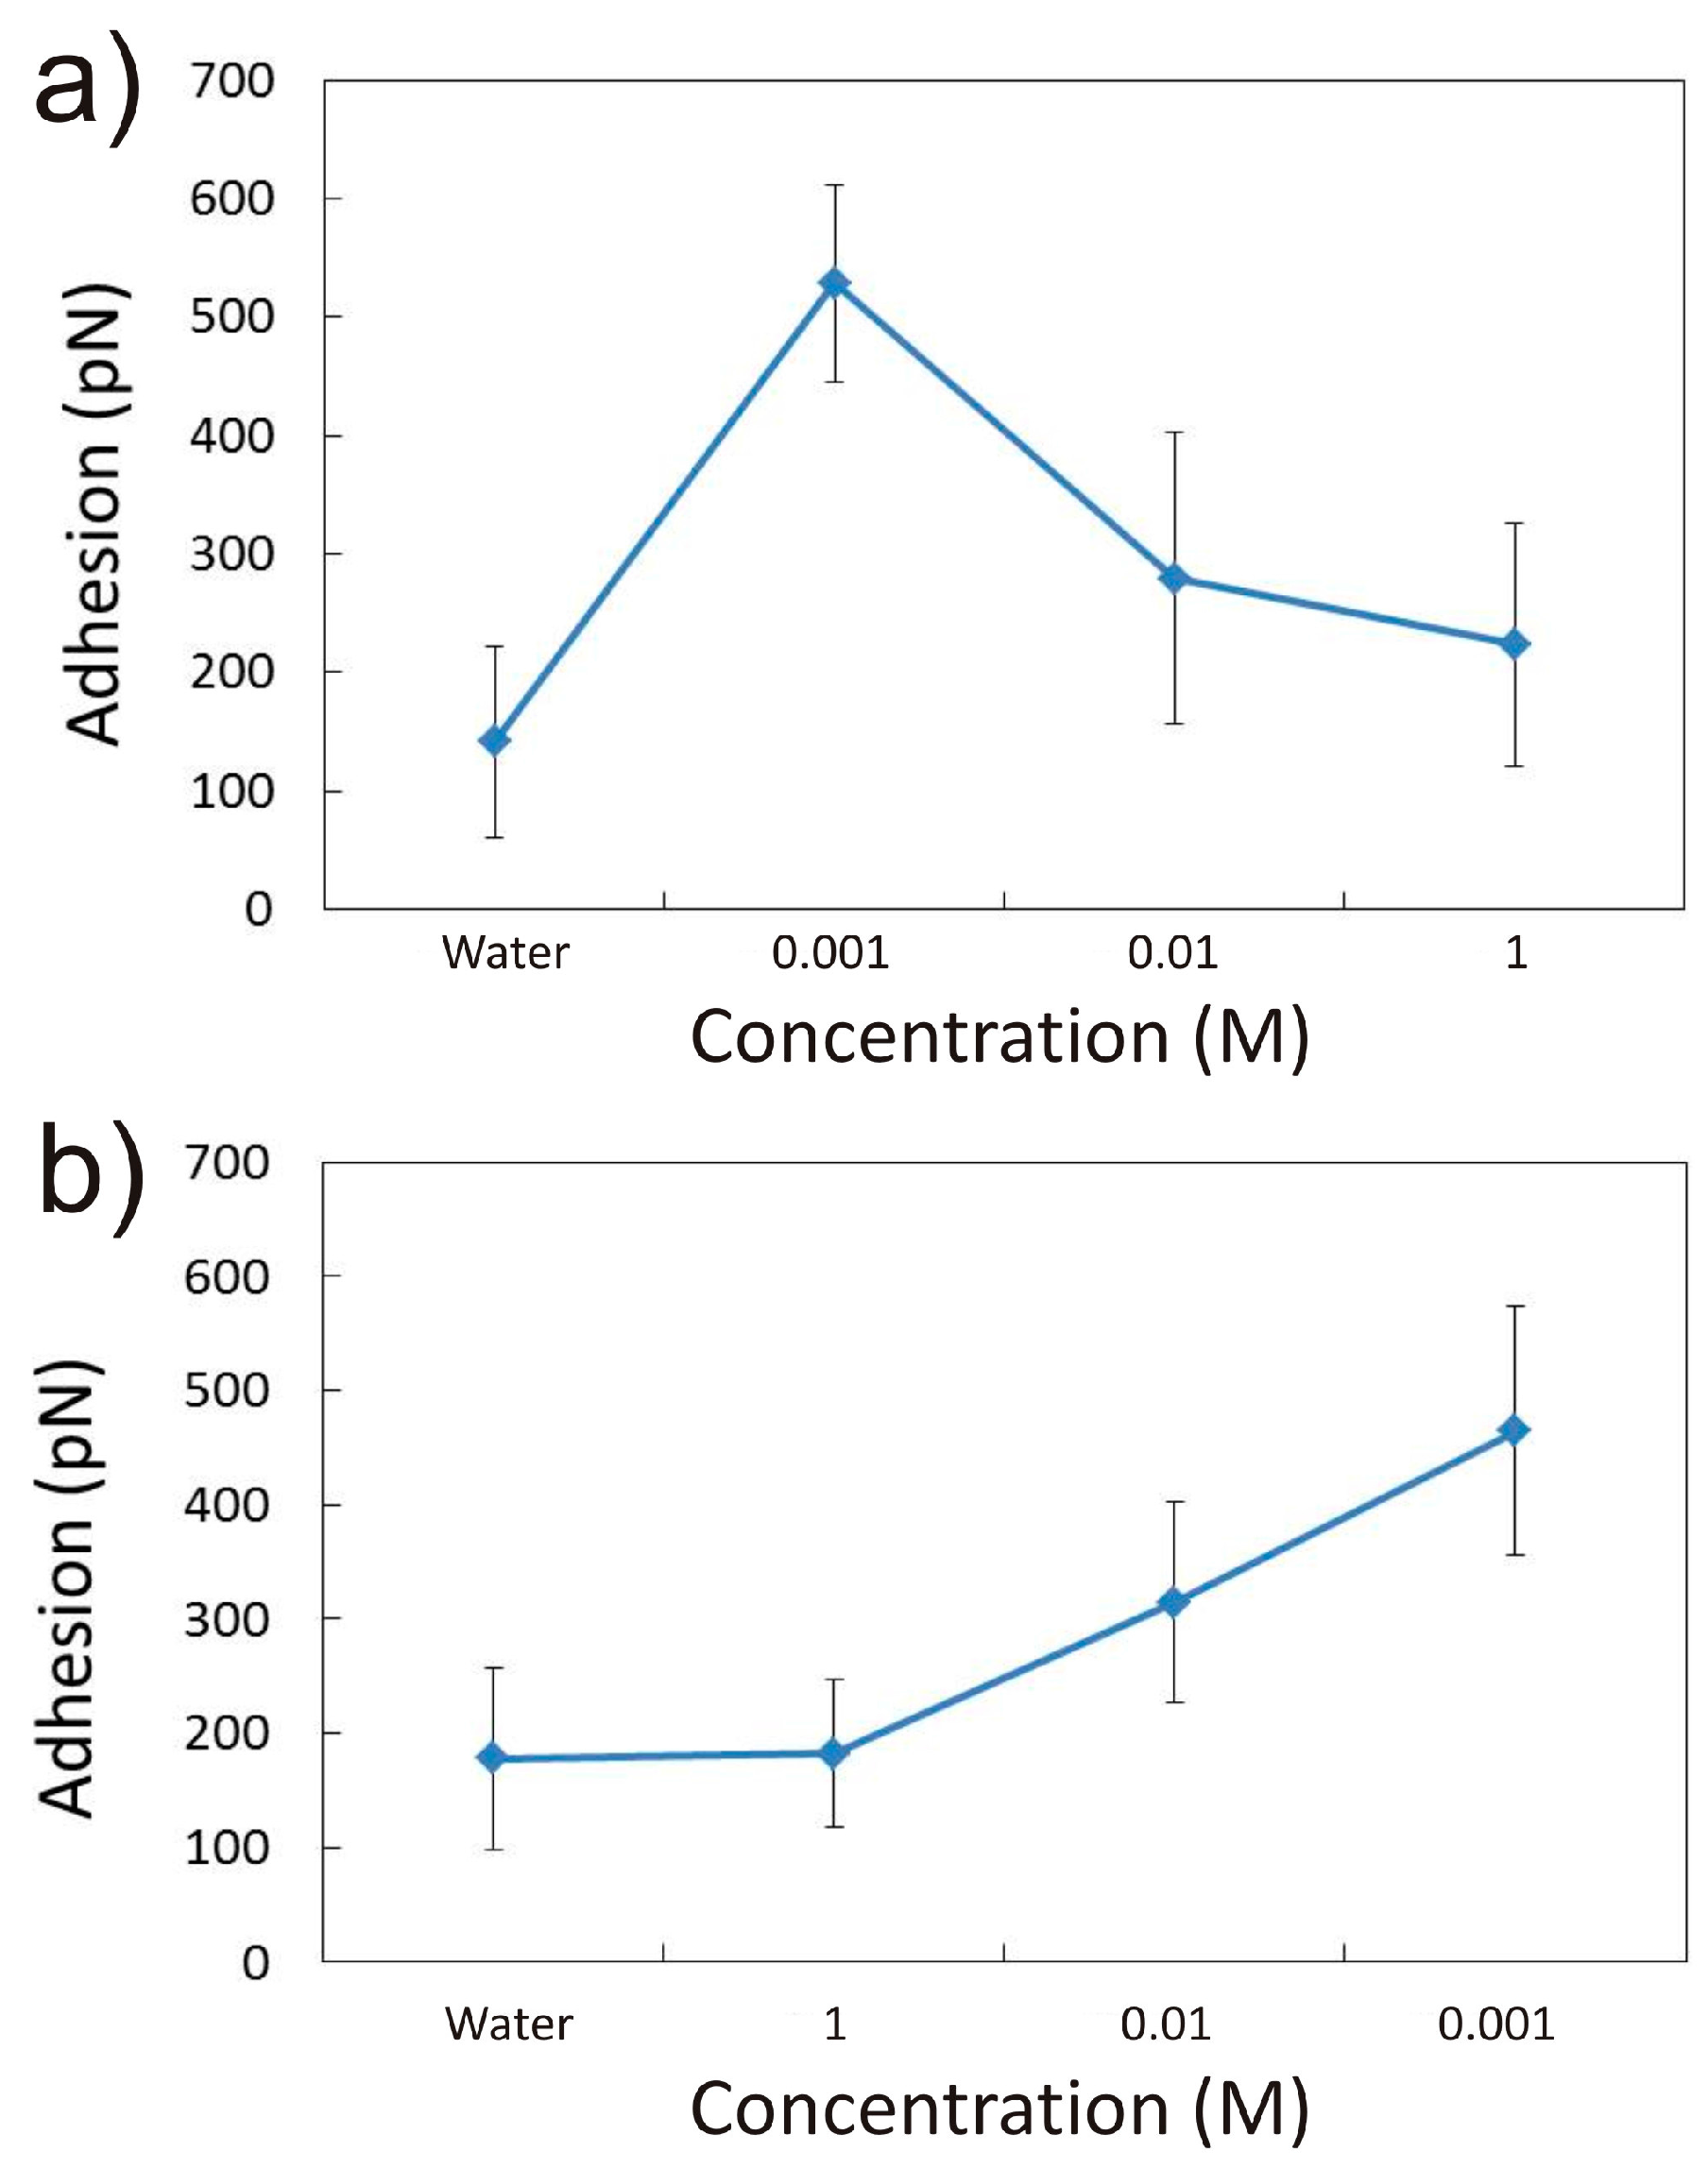
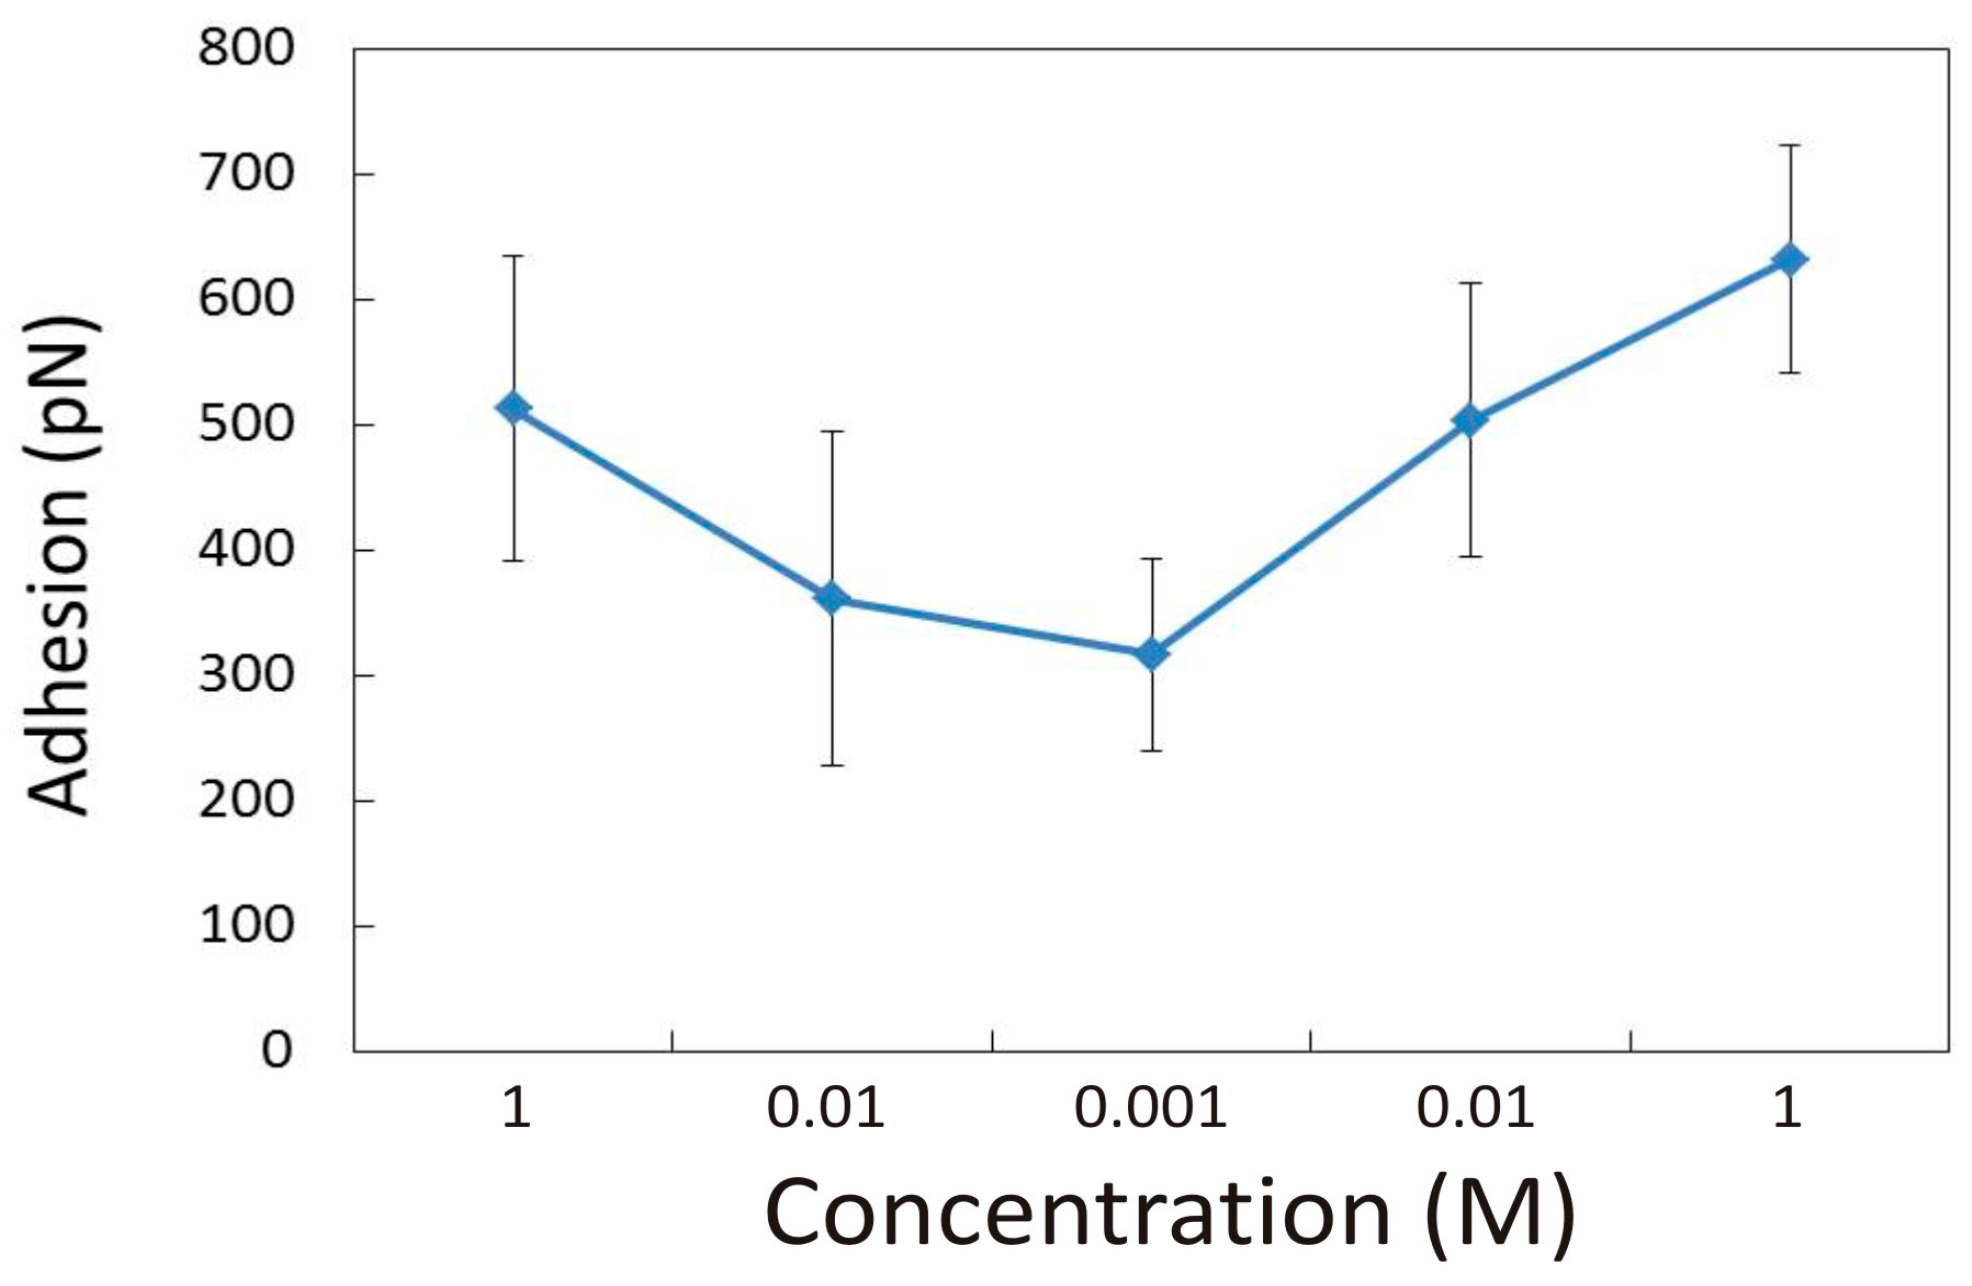
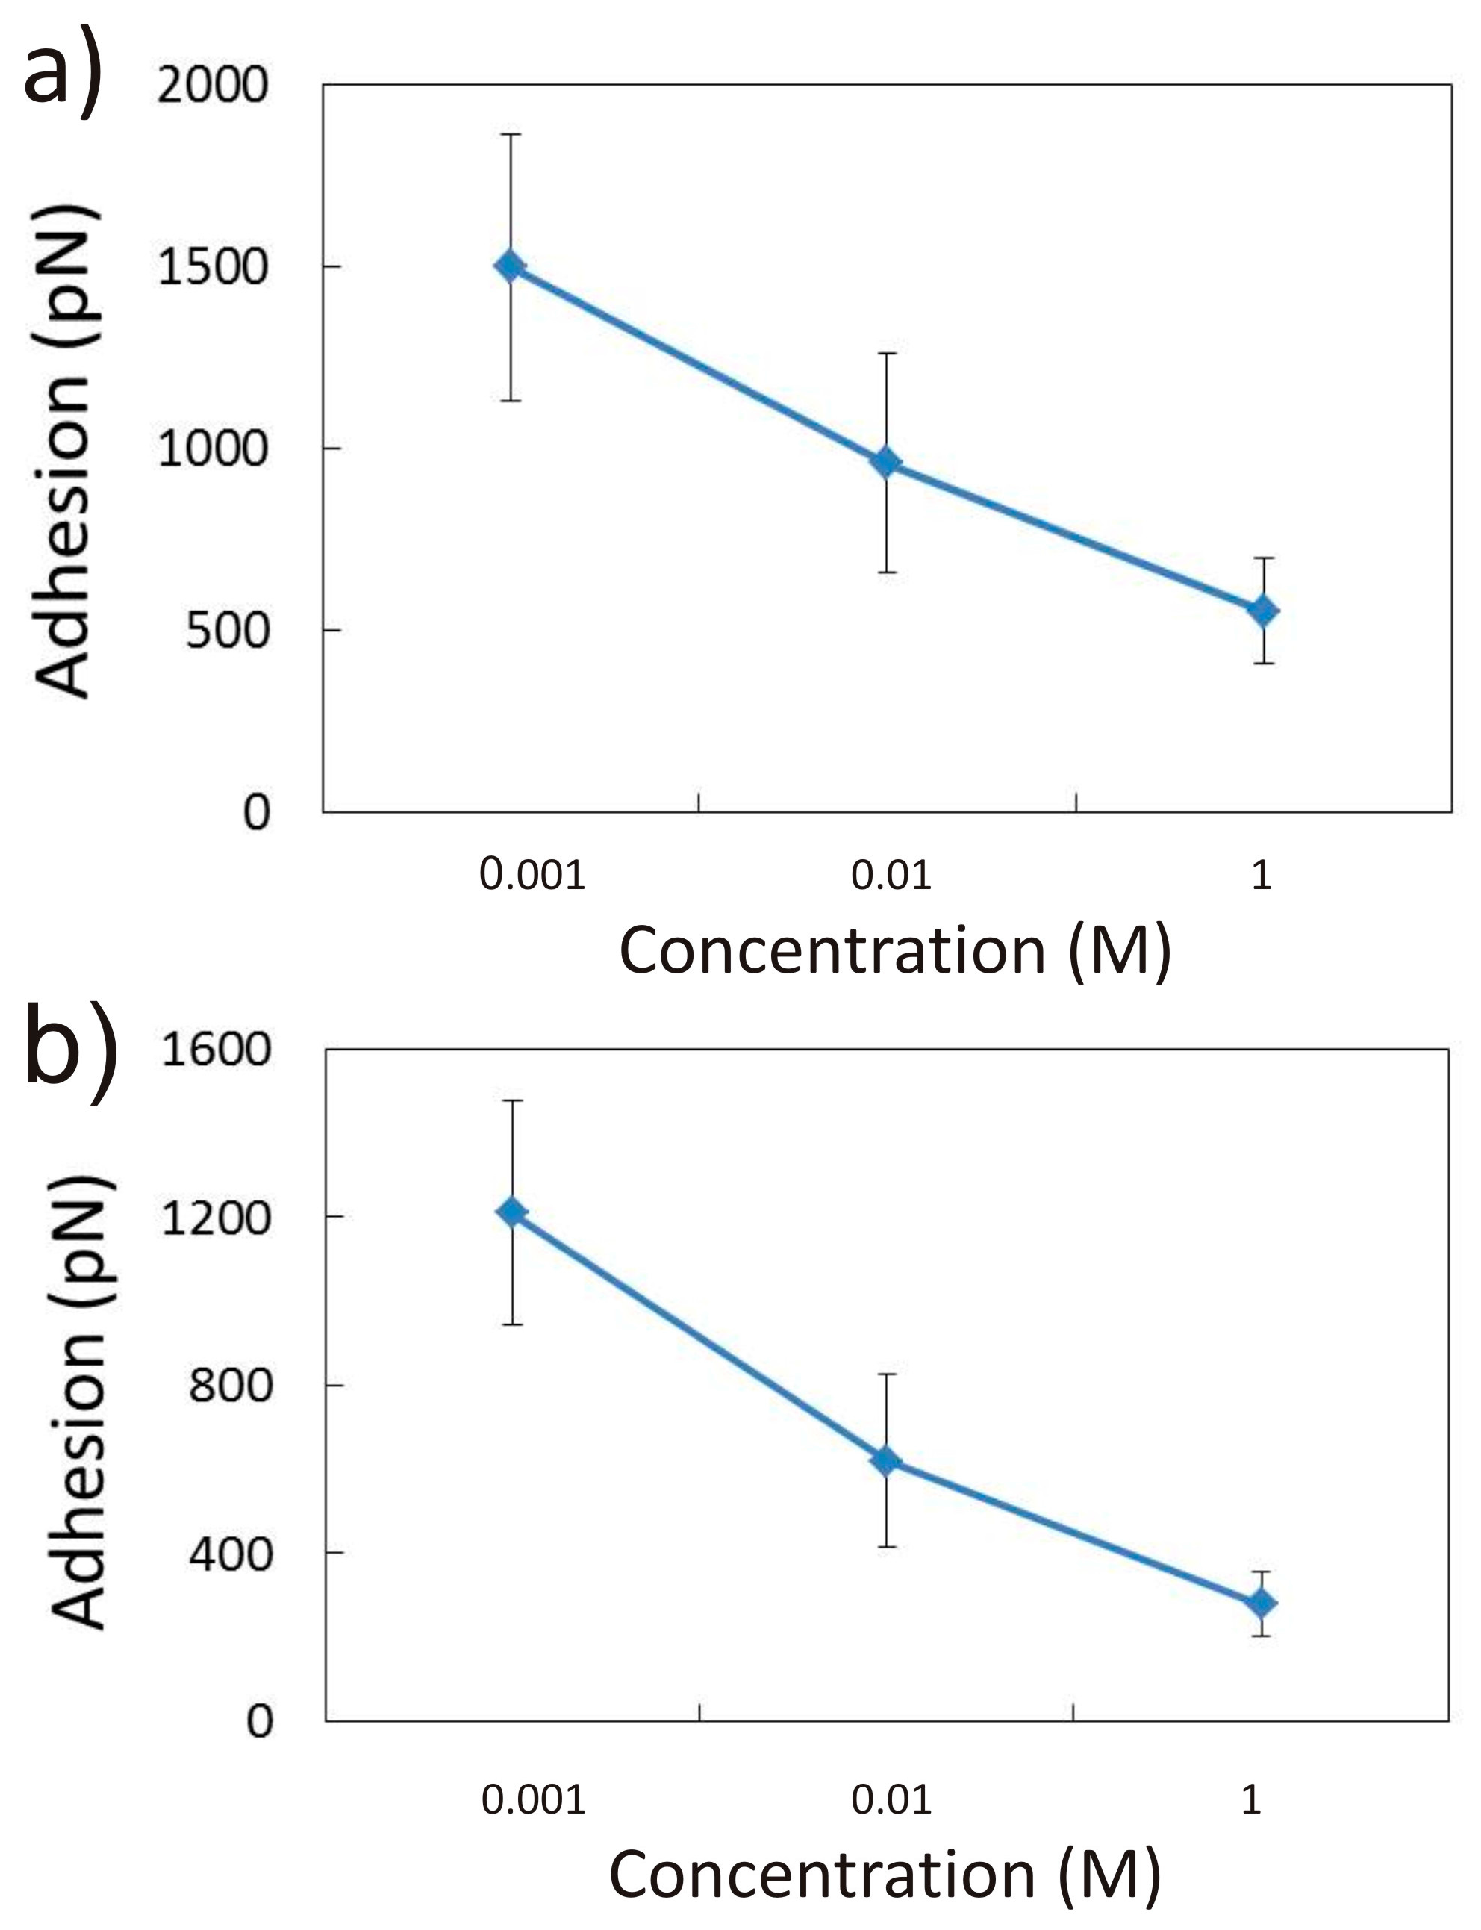
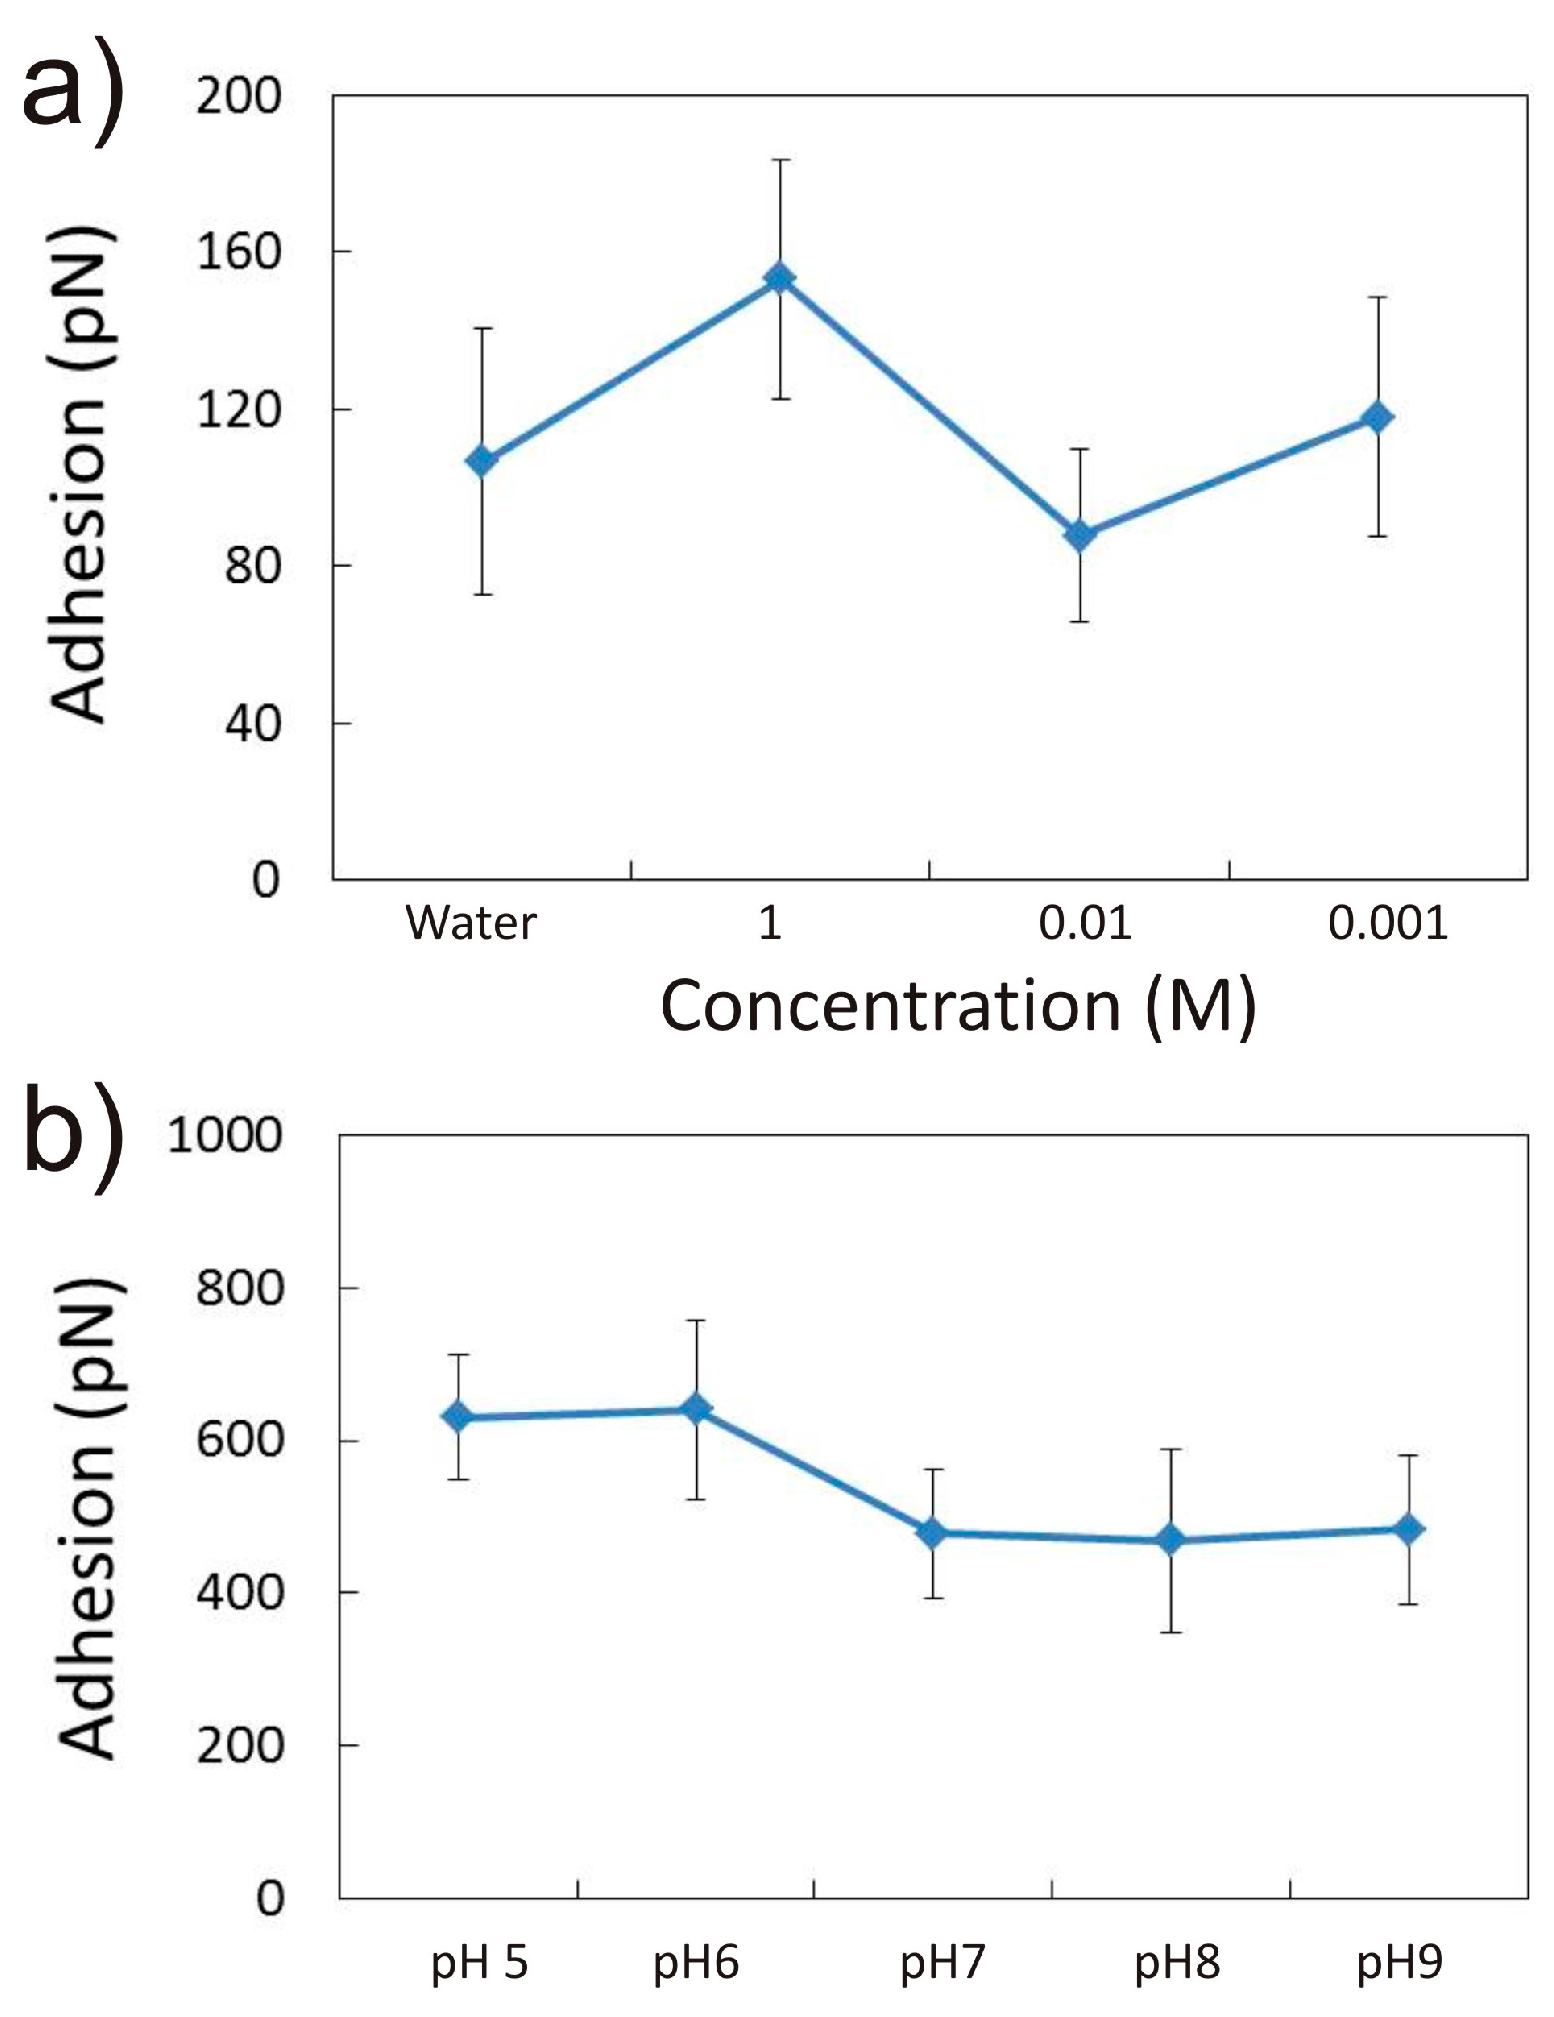
3.1.1. Effect of CaCl2 Concentration

The effect of the concentration of Ca2+ on the adhesion of –COOH groups on the siloxane face was studied at two different pH values: 5.5 (which is the typical value for sandstone reservoirs) and 8. This was done to try to disentangle a pure MIE mechanism from one combined with a variation in pH, as it has been reported that pH can play a large role in determining the oil adsorption capacity (or adhesion) [5,7,33]. Figure 3 shows the results from experiments kao-Si-1 and kao-Si-2. In Figure 3a, it can be seen that the measured adhesion (at 1 s dwell time) increases significantly from ≈125 pN measured in water to ≈500 pN) when measured in a 0.001 M CaCl2 solution. This is followed by a continuous decrease down to ≈220 pN when the solution composition was exchanged to 0.01 and 1 M. This result, therefore, indicates a decrease in adhesion with an increase in concentration, which is the opposite of the so-called low salinity effect. Two more experiments were performed using the same conditions and solution sequence (kao-Si-9 and kao-Si-10) and they both showed the same trend (Figure S1), indicating good reproducibility of the results. In addition, a separate experiment (kao-Si-2) was performed with the same solutions, but the opposite sequence of introduction in the fluid cell, in order to see if this had any effect on the observed trend. Figure 3b shows results from this experiment. It can be seen that the adhesion increased as the Ca2+ concentration decreased from 1 M to 0.001 M, therefore confirming the result. At pH 8, however, the opposite picture emerged, as can be seen in Figure 4, which shows the results from experiment kao-Si-3, where the solution concentration was first decreased from 1 M to 0.001 M and then increased back up to the original 1 M (Table 1). Results show a large adhesion measured at 1 M (≈520 pN), which then decreases in two steps down to ≈300 pN after addition of the 0.01 M and 0.001 M solutions. After this, the solutions with a concentration of 0.01 M and 1 M were reintroduced into the fluid cell, which led to an increase in the measured adhesion reaching ≈500 and ≈610 pN, respectively. This indicates that the trend in increased adhesion at higher concentration can be “recovered”, and, therefore, that the measurements are not affected by other processes, or experimental factors, like tip “weathering”, which may affect the functionalisation and, consequently, the “sensitivity” of the probe.
The results reported at low pH seem to run against the basic understanding of the MIE mechanism, where –COOH groups will be bound to the mineral surface via a divalent cation bridge or through the formation of an organo-metallic complex [31]. In this model, a reduction in Ca2+ concentration would result in a smaller amount of bridging and therefore to less adhesion. Authors have, however, usually linked the MIE mechanism to a variation in pH as well [5,33] as, in their experiments, this parameter was allowed to vary, or it is varied in a controlled manner. In the case of the experiments shown here, the pH was kept constant throughout its duration, and only the concentration was changed. These conditions are also ideal to test the double layer expansion mechanism, which generally predicts an increase in the width of the double layer extending away from the surface of the mineral, when the ionic strength of the solution is reduced [3,4]. This expansion then is linked to an increase in the range of repulsion forces, and therefore to a decrease in the overall adhesion of the organic molecules to the mineral surfaces. For the experiments reported in Figure 3, and using the standard equation to measure the double layer width (or Debye length):
k 1 = ( ε ε 0 k T I e 2 N A × 10 3 ) 1 2 ,
where k−1 is the Debye length, ε is the permittivity of vacuum, ε0 is the relative permittivity of the solution, k is the Boltzmann’s constant, T is the temperature, I is the ionic strength of the solution, e is the charge of an electron and NA is the Avogadro’s number. Using this equation, the Debye length was calculated for each CaCl2 solution used in the low pH experiments, giving lengths of 5.53, 1.75 and 0.184 nm for concentrations of 0.001, 0.01 and 1 M, respectively. These calculations predict a large decrease in the double layer width as concentration was increased, but the related decrease in adhesion was not observed, instead the opposite was true. Therefore, neither the standard double layer expansion mechanism, nor a basic MIE mechanism can be invoked to explain our results; however, a closer look at the surface complexation and deprotonation reactions may offer a better explanation.
At the experimental conditions (constant pH), the protonation state of the –COOH will remain unchanged and, therefore, should be critical in determining the adhesion to the kaolinite surface. In addition, as has been established by numerous authors, the overall charge of the kaolinite siloxane surface is negative, although some authors have found it to vary, to some extent, as a function of pH [10,11], and to also be affected by the ionic strength of the electrolyte on which its immersed, although always maintaining its negative value [13].
The protonation state of –COOH groups bound to AFM probes is known to be affected by the pH in a similar way to its unbound counterparts in solution, and has been reported to have a pKa = 5.5 ± 0.5, according to CFM measurements performed by Vezenov [34]. Therefore, for the experiments performed at a pH ≈ 5.5, it can be expected that the AFM probe will contain a similar number of –COOH and –COO; groups, and therefore has an overall negative charge. Strand et al. [5] and Austad et al. [7] explained the observed high affinity of organic matter to clay surfaces at near-to-neutral pH through the formation of hydrogen bonds between the carbonyl oxygen and protons adsorbed to the clay surface, in addition to bonds between the hydrogen in the –COOH molecule and the negative charge on the clay mineral. The presence of Ca2+, however, complicates this picture as there will be competition with protons for surface sites, which may lead to the development of cation bridging (Figure 5a). Sorption reactions on the clay surface can be defined by the general equation:
SX     S   + X + ,
where ≡S represents a surface site in the siloxane surface, X+ represents a cation (H+, Ca2+, Na+) near the surface and ≡SX a cation bound to a surface site. Several authors have reported a much larger affinity for H+ for clay surfaces [5,35,36], as demonstrated by pK values (for reaction 2) for H+ and Ca2+, of 5.3 and 1.5, respectively [36]. The concentration of species at the mineral surface [X+] would be given by the well-known Boltzman distribution:
[ X + ] = [ X + ] e ( Z i e Ψ 0 k T ) ,
where [X+] is the cation concentration near the surface, [X+] is the bulk cation concentration, Zi is the cation valency and Ψ0 is the surface potential. For the lower Ca2+ concentration (0.001 M) and pH ≈ 5.5 conditions, we can assume a surface potential in the order of −70–40 mV [11,13], leading to relative concentrations of [H+] over [Ca2+] of approximately three orders of magnitude apart. Considering this and the relative pK values for reaction 2, only a relatively small amount of surface sites will be expected to be complexed with Ca2+ as opposed to those bound to H+. At these conditions, the protonated –COOH molecules will bind to the surface, and a small amount of –COO may form bridging bonds through adsorbed Ca2+, resulting in a large measured adhesion. At high Ca2+ concentrations (1 M), however, the number of surface-bound Ca2+ ions will increase significantly, resulting in a smaller number of sites available for hydrogen bonding with –COOH molecules and only cation bridging will occur, resulting in a smaller adhesion.
For the experiments performed at pH ≈ 8, the surface chemistry characteristics of the system will be different (Figure 5b). At this pH, the –COOH groups in the AFM probe will be completely deprotonated (–COO) and therefore any bonding with the clay surface will be expected to occur via cation bridging. In addition, the higher pH will be translated onto a much smaller concentration of H+ bound to the siloxane surface compared to that of [Ca2+]. Assuming just these two sorption reactions (Equation (2)), for the low Ca2+ concentrations (0.001 M), we would expect a difference close to an order of magnitude in adsorbed species, in favour of Ca2+. Increase in the Ca2+ will significantly reduce the number of H+-bound sites, increasing the amount of bridging, and therefore the measured adhesion, as was observed in the experiment. Finally, some authors have suggested that high Ca2+ may induce a charge reversal on negatively charged surfaces [36]. For the experiments reported here, the simple surface speciation model described above seems to point in this direction and which would also explain the increase in adhesion with concentration at pH 8. However, we could not see definitive experimental evidence for this in our experiments, like the observation of long-range attraction forces on the force-distance curves.

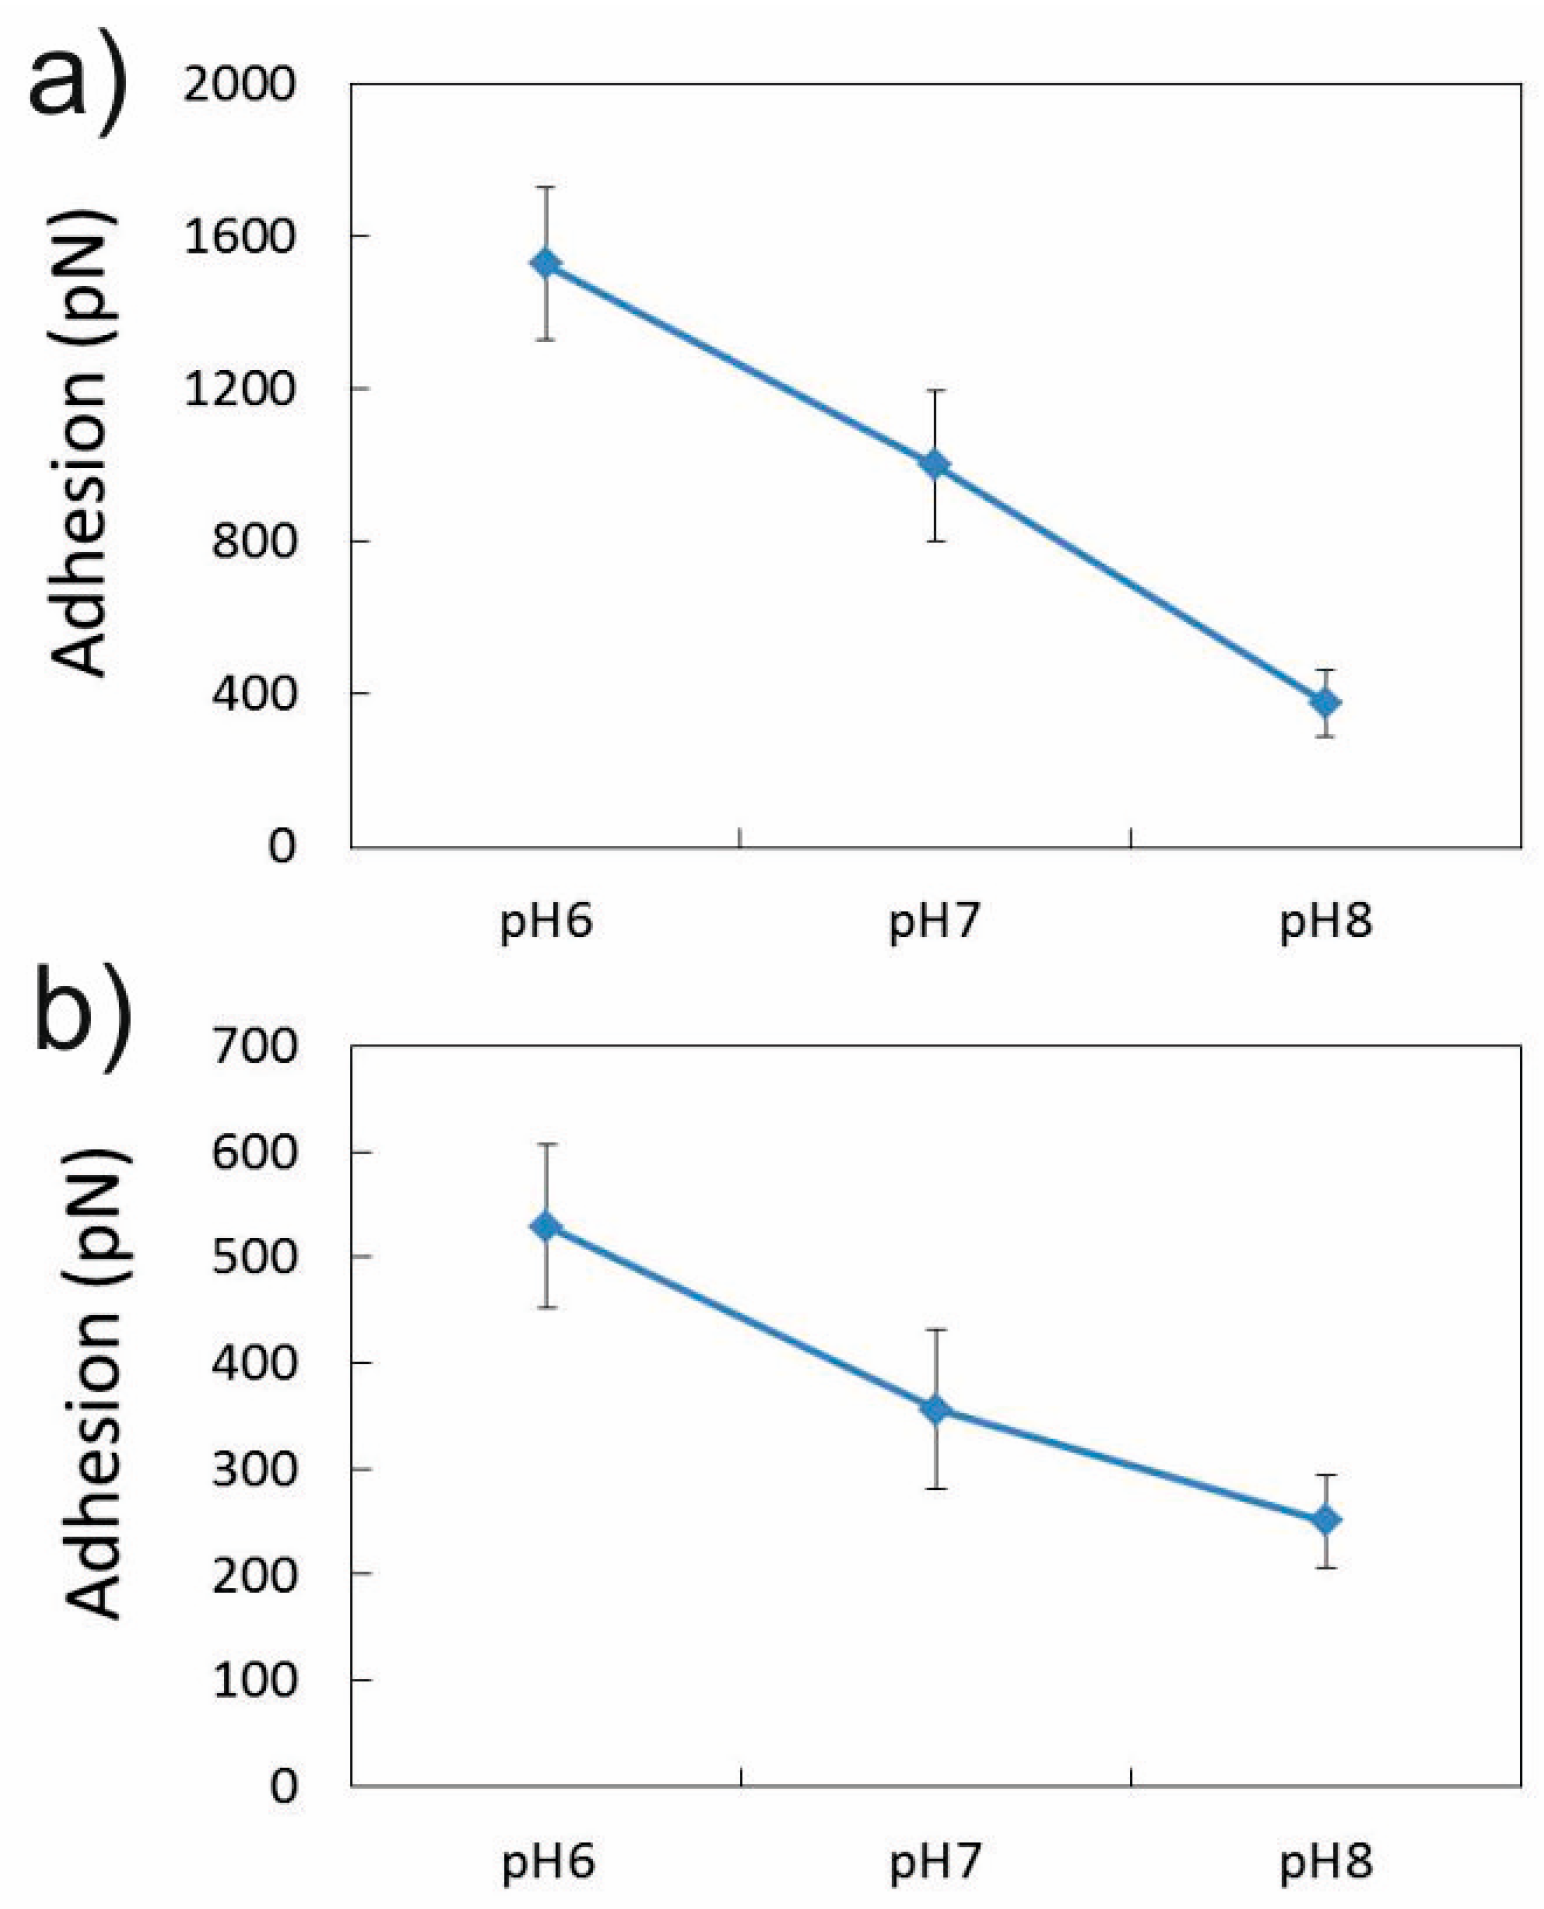
3.1.2. Effect of pH in the Presence of 0.001 M CaCl2

As noted above, pH has been invoked in several studies as an important factor in determining the effectiveness of LSEOR as well as in establishing the most important underlying mechanisms. Austad et al. have shown experimental data where an increase in the pH of the effluent solution is observed after injection of low salinity water [5]. In addition, Shi et al. [33] observed a small decrease in the measured adhesion for CFM experiments performed on sandstone grains using –CH3 and –COOH functionalised AFM probes. For these reasons, it was decided to perform a series of experiments where the Ca2+ solution composition was kept constant (at 0.001 M), but the pH was varied. The low Ca2+ concentration was chosen as we were more interested in the low-salinity effect. Three different experiments were carried out (kao-Si-4, kao-Si-5 and kao-Si-6) and the results are reported in Figure 6. As can be seen in the figure, for all three experiments, an overall increase in the measured adhesion was observed when the pH was increased from 4 to 9. However, the actual magnitude of variation of the measured adhesion varied considerably across experiments. Experiments kao-Si-4 and kao-Si-6 (Figure 6a,b, respectively) show a continuous, but smaller increase in adhesion, from pH 5 to 8, followed by a larger increase when the pH was increased to 9, as can be seen in the drastic change of the slope of the trend line connecting the data points. Experiment kao-Si-5, on the contrary, shows a different pattern, with a large increase in adhesion after pH 5, followed by a decrease at pH 8 and a larger increase after pH 9. This relatively lack of reproducibility in the measurements may have been due to different experimental factors such as tip shape, modification of the tip shape during the experiment or contamination when changing the solutions. It may also be due to variation of the surface charge across different crystals, something we cannot discount, based on recent reports of important variations of this property across individual crystals [12]. In any case, the observed general trend of smaller increase in adhesion at neutral pH followed by a faster increase at higher pHs is supported by the three experiments.
The observed increase in measured adhesion with increasing pH, however, is not in agreement with either CFM measurements performed on sandstone samples [33], nor with the studies on the adsorption of benzoic acid [37] and crude oil [38] by kaolinite. In the former experiments, the presence of organic groups in the surface was invoked to explain the results, so a direct comparison to the results shown here is not appropriate. In the latter studies, bulk kaolinite was used, as opposed to the specific adhesion measurements on the siloxane surfaces reported here, and the experiments were not performed in the presence of Ca ions either. These could indicate the adhesion on the aluminol face (and on crystal edges) may have a larger role in shaping the shaping the increase in adhesion reported by those authors. This point is further discussed below in Section 3.2.2, where measurements on the aluminol face are discussed.
The observed increase in the measured adhesion can be explained by looking again at the protonation state of the –COOH molecules and the surface complexation of the kaolinite surface, as they both vary with pH. At the lower pH studied (5), the probe will be mostly composed of protonated –COOH groups and a large majority of surface-complexed sites will be bound to H+ (but still maintaining an overall negative charge), which would result in bonding through the aforementioned hydrogen bonding mechanism. As the pH is increased, the –COOH groups will become deprotonated, decreasing the amount of hydrogen bonding. However, at the same time, the relative amount of Ca2+ bound to the surface will increase steadily, as the H+ concentration in solution (and near the surface) decreases, whereas that of Ca2+ in solution stays the same (and varies little near the surface), therefore increasing the number of bonds that will occur through cation bridging and resulting in an overall increase of the measured adhesion. The role of bridging Ca2+ in modifying the measured adhesion was explored in a separate experiment that measured the adhesion of –COOH functionalised probes in the absence of any cations (MQ water) at pH ≈ 7 and pH ≈ 4 (HCl). In this case, a large increase (≈110%) in the measured adhesion was observed at the lower pH value, i.e., the opposite of what was measured in the presence of Ca2+ (Figure 6). This result, therefore, indicates that sorption of Ca2+ on the kaolinite surface (and therefore cation bridging) is critical in determining the –COOH adhesion behaviour.
Finally, the observed larger increase in adhesion from pH 8 to 9 may not respond completely to the increase in Ca2+ complexed to the surface, but a combination with another mechanism. This is because at, pH 7–8, the vast majority of –COOH groups will be deprotonated and this number would not be expected to change with an increasing pH; therefore, an increase in adhesion solely through an increase in cation bridging seems unlikely. An additional mechanism that could contribute to the large increase in adhesion may be related to a decrease in the electric double layer repulsive forces. Recently, Gupta et al. [11] measured the change in surface charge and potential of siloxane and alumina surfaces and reported a decrease in both quantities when solution pH increased from 8 to 9. Although their experiments were conducted with a KCl electrolyte, it is feasible to assume a similar reduction on our experiments with Ca2+, and even expect a larger decrease in surface potential due to the larger affinity of Ca2+ for the siloxane surface. A reduction in surface potential will have the effect of decreasing the amount of Ca2+ near the crystal surface (when compared to a pH 8 solution), affecting the amount of complexed-Ca, but the decrease in proton concentration at pH 9 will partially offset this (when considering the surface complexation model). On the other hand, the reduction of surface potential will lead to a reduction in the repulsion forces between depronotated, anionic, –COO groups and the negatively charged kaolinite surface with the net effect of substantially increasing the measured adhesion in the CFM experiments.

3.1.3. Effect of NaCl Concentration and pH

A series of experiments were carried out with NaCl solutions to understand the effect of this monovalent ion in determining the adhesion of –COOH groups to the siloxane surface of kaolinite crystals (Table 1). In two experiments, kao-Si-7 and kao-Si-9, the pH was kept constant at around 5.5 and the concentration was varied from 0.001 to 1 M. A third experiment, kao-Si-8, was performed to study the effect of changing the pH on the measured adhesion. Figure 7a shows the results from experiment kao-Si-7 where solutions where introduced in the fluid cell with decreasing NaCl concentration. In the figure, it can be seen that the measured adhesion decreased when the Na+ concentration changed from 1 to 0.01 M, only to increase again (although to a lower total adhesion value than that measured at 1 M) when the solution composition decreased further to 0.001 M. Although the changes in the average measured adhesion are relatively significant (50% and 40%, respectively), the relatively large standard deviations diminish their statistical importance. A similar result was observed in experiment kao-Si-9 (Figure S2) where the order of introduction of solutions to the fluid cell was reversed, and even less variation in adhesion across the different solutions was measured. From these observations, it can be said that a variation in the Na+ did not lead to a clearly defined trend in the variation of the measured adhesion. This result indicates that double layer interactions do not appear to be the determining factor in controlling the adhesion response when Na+ is present in the solution. This is because the large change in concentration, which would considerably affect the size of the double layer (calculated to decrease from 9.5 nm at 1 M to 0.3 nm at 0.001 M), does not produce the expected trend of increasing adhesion of –COOH groups to kaolinite at large concentrations. On the other hand, if we attend at the predicted surface complexation (and considering a pKa of 0.5 for Na+ binding to surface site, as per reaction 2), we will expect a large predominance of H+ bound to the surface compared to Na+ ions, even at the highest Na+ concentration of 1 M, favouring hydrogen bonding with the –COOH groups. At the same time, however, an overall decrease in the total amount of H-bound sites will occur with increasing concentration, which may lead to a decrease in hydrogen bonding and adhesion, but this may probably be compensated by the decrease in the double layer size (due to the increase in concentration), resulting in the lack of a characteristic trend in the measure adhesion. This explanation also reinforces the role of monovalent vs. divalent cations (MIE theory) in determining adhesion, as a clear difference in behaviour is observed when comparing experiments performed in the presence of Ca2+ with those with Na+.
The effect of pH on the adhesion of –COOH groups to kaolinite in the presence of Na+ with a concentration of 0.001 M was studied in experiment kao-Si-8, whose results are shown in Figure 7b. In the figure, it can be seen that the adhesion at pH of 5 and 6 is very similar (≈630 pN), but then it decreases by about 25%, to ≈480 pN, after pH 7, and stays around this value for pH 8 and 9. These results agree, to some extent, with previous observations that acidic organic molecules bind better to kaolinite surfaces in the presence of NaCl than just deionised water [37]. They also indicate that Na+ plays a smaller role in determining the organic matter adhesion than Ca2+, as can be seen from comparing Figure 6 and Figure 7b. The trend observed can be explained by looking into the protonation of –COOH groups—at pH 5–6, a large number of groups in the tip will be protonated, and therefore be able to bond to the kaolinite surface by the aforementioned hydrogen bonding mechanism; on the contrary, at pH ≥ 7, most carboxylate groups will be deprotonated and will not form strong bonds in the absence of bridging cations such as Ca2+. Neither the variation in the relative amount of H+ to Na+—surface bound ions nor the previously reported decrease in surface potential [11] above pH 8 show any effect in modifying the adhesion. The contrast between this result and that observed from the Ca2 experiments once again reinforces the critical role of Ca2+ in controlling –COOH adhesion.

3.2. Adhesion of –COOH Groups to the Aluminol Face

A series of experiments were performed on the aluminol face of kaolinite to determine any differences in the adhesion response to solution composition and pH to those observed in the silanol face (Table 1).

3.2.1. Influence of CaCl2 Concentration

An experiment was performed to assess the influence of the CaCl2 concentration in the adhesion at a pH ≈ 5.5 (kao-Al-1) as this cation type produced the most interesting results in the CFM experiments performed over the siloxane face. Two different crystals were scanned at the same time (within the same image) and the results from the measurements are reported in Figure 8. It can be seen that the measured adhesion shows the same behaviour on both crystals, with a significant reduction in the recorded values as the Ca2+ concentration was increased. This behaviour is the same as that observed for the experiments performed on the siloxane face at the same pH (Figure 3 and Figure S1) and can be explained by looking into the protonation state of the –COOH groups and the surface charge of the kaolinite surface. At a pH ≈ 5.5, the overall surface charge of the alumina surface will be positive [11], whereas the tip, having a pKa ≈ 5.5 [34], will be composed of approximately the same amount of protonated –COOH groups and deprotonated –COO groups (i.e., it will have an overall negative charge). At low CaCl2, only a relatively amount of Cl counter ions will be present at the surface and, therefore, electrostatic attraction between tip and surface will occur. We can also expect to see an increase in proton exchange with Ca2+ ions in solution that could potentially restrict the number of hydrogen bonds between surface AlOH groups and the –COOH groups at the surface. At higher concentrations of Ca2+, further exchange reactions will occur; diminishing the number of hydrogen bonds that can potentially form, in addition, a decrease in the surface charge will be expected owing to the further presence of Cl counterbalancing anions. In fact, a decrease in surface charge density at the aluminol face was observed by Liu et al. [13], when a KCl concentration was increased over 70 mM (they observed an increase from 1 to 70 mM).

3.2.2. Influence of pH

Given the results observed in the experiments performed with varying pH on the siloxane surface, further tests were performed on the aluminol face of kaolinite crystals to measure the adhesion of –COOH functionalised probes in the presence of CaCl2 and NaCl at a pH varying from 6 to 8 (Table 1). This pH range was chosen, as it has been shown that the aluminol surface changes surface potential from positive to negative between these values [11], with a point of zero charge around pH 7. Results from these experiments are shown in Figure 9. For the experiment performed with a CaCl2 concentration of 0.001 M (kao-Al-2), it can be seen that the measured adhesion decreases substantially when increasing the pH from 6 to 8 (Figure 9a). At a pH of 6, the aluminol surface is still positively charged (due to H+ sorption on aluminol sites), whereas probably a majority of carboxylate groups are deprotonated, in the form of –COO, with the rest in the protonated form (–COOH). At these conditions, it can be expected that a strong electrostatic attractive force will occur between tip and sample, a fact that is corroborated by the appearance of a small adhesion peak on the approach section of the force-distance curves measured over the kaolinite crystals. In addition, the formation of hydrogen bonding between the deprotonated –COOH groups and the surface hydroxyl groups on the aluminol surface will likely occur as well. Both processes would lead to a large measured adhesion. After pH 7, however, the aluminol surface becomes negative due to the deprotonation of the aluminol surface groups [11], whereas the –COOH groups at the tip will be almost fully deprotonated, leading to a negatively charged tip. This situation should, in principle, lead to the formation of bridging through surface bound Ca2+ ions, as has been reported elsewhere for gibbsite crystals in contact with 0.01 M CaCl2 solutions and hexanoate [39], but, if these interactions exist, they do not lead to an overall increase in adhesion. This may be due to the low concentration of Ca2+ in the solution and the relative proximity to the point of zero charge of the aluminol face. Finally, the observed decrease in adhesion with pH is more in line with the previously reported results on organic molecules sorption to kaolinite [37,38] and may explain the discrepancies observed with the results observed on the siloxane face (Figure 6) (i.e., if more sorption occurs through this face), although the presence of Ca2+ may be a determining factor as well.
Results from the experiments performed with 0.001 M NaCl (kao-Al-2) show a similar decrease in adhesion with increasing pH (Figure 8b), which seems to indicate that, at these experimental conditions, there is not a large effect of the cation type on the underlying mechanism controlling adhesion at this face. This is in contrast with results from hexanoate sorption experiments performed by Wang et al. [39], which showed a notable increase in adhesion of the organic molecule on gibbsite crystals when the aqueous solutions contained Ca2+ ions compared to when contained Na+ only. In our case, we do see a much larger measured adhesion (almost 3 times) on the Ca2+ experiments (Figure 9a) when compared to the experiments performed with Na+, but, as mentioned before, as the experiments were performed with different tips, we cannot establish this relationship.

3.3. DLE vs. MIE Mechanism

Results shown in this study suggest a complex picture on the role of cation type, composition and pH on the adhesion of acidic functional groups to kaolinite surfaces. This is in contrast to some previous studies that have attempted to explain results via a single theory such as double layer expansion or multicomponent ion exchange mechanisms. Recent studies on the sorption of –CH3 and –COOH groups on sandstone surfaces acknowledge the deficiencies of accounting for changes in adhesion by solely relying on the double layer expansion model, and, in particular on the use of DLVO theory (Derjaguin, Landau, Verwey, and Overbee), which allows for the calculation of electric double layer force, in order to address the complex adhesion behaviour shown by sandstone surfaces [33]. One of the main problems highlighted is the assumption that the surface charge density does not depend on the ionic strength, or salinity, of the solution. In fact, as has been mentioned previously in this paper, kaolinite charge density (across both faces) has been shown to be influenced by the concentration of the electrolyte with which it is in contact [13]. A more robust way of dealing with these problems is the use of charge regulation theory where surface charge (and surface potential) are a function of sorption and desorption reactions at the interface [12,40]. However, this approach has only been applied to relatively simple single mineral systems and their use on more complex “natural” surfaces where organic material may be involved remains to be seen. This said, it is clear from our results that distinct differences in behaviour are observed when comparing the experiments performed in the presence of Ca2+ with those performed with Na+, and these can be attributed in some cases to the presence of cation bridging and/or the larger affinity of siloxane surfaces for Ca2+ ions; therefore, it is clear that cation type definitely plays a critical role in controlling the adhesion of –COOH as has recently been acknowledged for work performed using contact angle and quartz microbalance measurements [39]. In addition, we have observed that pH is also a crucial parameter in defying the adhesion behaviour, due to its role in varying the protonation state of relevant functional groups, in agreement with recent studies. Therefore, it seems crucial that, in order to fully understand and develop adequate theoretical frameworks to predict the behaviour of low salinity solutions, a greater emphasis should be given to determine the surface complexation reactions (and associated reaction constant) as well as those controlling the protonation state of relevant functional groups.

4. Conclusions

In this study, we have measured the adhesion between –COOH functional groups and the siloxane and aluminol faces kaolinite by means of chemical force microscopy as a function of pH, salinity (0.001 to 1 M) and cation identity (Na+ vs. Ca2+). Results from measurements on the siloxane face show that Ca2+ displays a reverse low-salinity effect (with adhesion decreasing at higher concentrations) at pH 5.5, and a low salinity effect at pH 8. This contrasting behavior at different pH values cannot be explained by recurring to a double layer expansion mechanism, but can be described by looking at the variations in complexation at the surface and the deprotonation of the –COOH groups when the pH is varied. At a pH of 5.5, the tip still possesses a large number of protonated –COOH groups that will form hydrogen bonds with surface-bound H+, and any sorbed Ca2+ may form cation bridges with deprotonated –COO groups. As the Ca2+ concentration is increased, Ca2+ will substitute H+ at the clay surface, reducing the number of hydrogen bonds and therefore decreasing the adhesion. At pH 8.8, a different situation develops with the –COOH groups at the probe now fully deprotonated and the source of adhesion only due to cation bridging; therefore, a decrease in concentration would lead to a decrease in this mode of bonding and a lower measured adhesion.
At constant Ca2+ concentration of 0.001 M, however, an increase in pH (from 5 to 9) leads to larger adhesion. Again, this behaviour is explained by changes in the protonation state of the tip, which varies between being fully protonated at pH 5 to being fully deprotonated at pH 9. The increase in adhesion is due to an increase in the number of Ca2+ bridging as the ratio of Ca2+/H+ bound to the surface increases with pH. The larger increase in adhesion recorded at the pH 8 to 9 interval can be explained by this effect in combination with a reduction on the double layer width due to a decrease in surface potential. On the contrary, a variation in the Na+ concentration did not show any discernible trend in varying the adhesion of –COOH groups to the siloxane face, which again points in the direction of a minimal effect on double layer expansion but an effect on the cation identity and complexation of the kaolnite surface.
Measurements on the aluminol face showed a reverse low-salinity effect at pH 5.5 and in the presence of Ca2+, similar to what was observed on the siloxane face at the same pH. This result can be explained by a decrease in hydrogen bonding and electrostatic attraction by the accumulation of a larger number of counterions on the kaolinite surface as the CaCl2 is increased. An increase in pH with constant ion concentration resulted in a decrease in adhesion for both Ca2+ and Na+, opposite to what was observed in the siloxane face, but which correlates better with the behavior observed on reported experiments that looked at the sorption of acidic organic molecules to kaolinite. In this case, the change in the charge sign of the aluminol face seems to be the main driver of the observed trend.
In summary, the results presented here indicate a more complex relationship between different effects, but where cation identity and pH variation are the most important determining factors in varying the adhesion of –COOH molecules to kaolinite surfaces. Therefore, these results align better with the multicomponent ion exchange mechanism (with pH variation) that has been invoked to explain the operation of low salinity water flooding in core experiments and field tests.

Supplementary Materials

The following are available online at www.mdpi.com/2075-163X/7/12/250/s1, Figure S1: Adhesion graphs for experiments kao-Si-9 (a) and kao-Si-10 (b), performed with a –COOH probe over the siloxane face of kaolinite and in the presence of CaCl2 of various concentrations (0.001, 0.01 and 1 M). Both graphs show a decrease in adhesion as the CaCl2 is increased, Figure S2: Adhesion graph for experiments kao-Si-9 performed with a –COOH probe over the siloxane face of kaolinite and in the presence of NaCl of various concentrations (0.001, 0.01 and 1 M). No clear trend on the measured adhesion is observed when varying the NaCl concentration.

Acknowledgments

The authors thank Ian Collins (BP Exploration & Operating Company) and Pete Salino (BP Exploration and Operating Company) for useful discussions and guidance. The authors also thank BP for funding.

Author Contributions

N.S. carried out approximately 60% of the experiments, 80% of data analysis and wrote the first draft of the manuscript. P.C. gave guidance for CFM experiments and data analysis and helped with data interpretation and on the writing of the final draft of the manuscript. A.S. performed approximately 20% of experiments and 10% of data analysis. H.B. performed approximately 20% of experiments and 10% of data analysis. H.C.G. provided guidance on experimental design and overall project direction. In addition, he helped with the interpretation of the data and in the writing of the final draft of the paper.

Conflicts of Interest

The authors declare no conflict of interest.

References

  1. International Energy Agency. World Energy Outlook; International Energy Agency: Paris, France, 2013. [Google Scholar]
  2. Muggeridge, A.; Cockin, A.; Webb, K.; Frampton, H.; Collins, I.; Moulds, T.; Salino, P. Recovery Rates, Enhanced oil Recovery and Technological Limits. Phil. Trans. R. Soc. A 2014, 372. [Google Scholar] [CrossRef] [PubMed]
  3. Jackson, M.D.; Vinogradov, J.; Hamon, G.; Chamerois, M. Evidence, mechanisms and improved understanding of controlled salinity waterflooding part 1: Sandstones. Fuel 2016, 185, 772–793. [Google Scholar] [CrossRef]
  4. Sheng, J.J. Critical review of low-salinity waterflooding. J. Pet. Sci. Eng. 2014, 120, 216–224. [Google Scholar] [CrossRef]
  5. Strand, S.; Puntervold, T.; Austad, T. Water based eor from clastic oil reservoirs by wettability alteration: A review of chemical aspects. J. Pet. Sci. Eng. 2016, 146, 1079–1091. [Google Scholar] [CrossRef]
  6. Lager, A.; Webb, K.J.; Collins, I.R.; Richmond, D.M. Losal Enhanced Oil Recovery: Evidence of Enhanced Oil Recovery at the Reservoir Scale; Society of Petroleum Engineers: Tulsa, OK, USA, 2008. [Google Scholar]
  7. Austad, T.; Rezaeidoust, A.; Puntervold, T. Chemical Mechanism of Low Salinity Water Flooding in Sandstone Reservoirs; Society of Petroleum Engineers: Tulsa, OK, USA, 2010. [Google Scholar]
  8. Kareem, R.; Cubillas, P.; Gluyas, J.; Bowen, L.; Hillier, S.; Greenwell, H.C. Multi-technique approach to the petrophysical characterization of berea sandstone core plugs (cleveland quarries, USA). J. Pet. Sci. Eng. 2017, 149, 436–455. [Google Scholar] [CrossRef]
  9. Hilner, E.; Andersson, M.P.; Hassenkam, T.; Matthiesen, J.; Salino, P.A.; Stipp, S.L.S. The effect of ionic strength on oil adhesion in sandstone—The search for the low salinity mechanism. Sci Rep.-UK 2015, 5, 9933. [Google Scholar] [CrossRef] [PubMed]
  10. Yin, X.; Gupta, V.; Du, H.; Wang, X.; Miller, J.D. Surface charge and wetting characteristics of layered silicate minerals. Adv. Colloid Interface Sci. 2012, 179–182, 43–50. [Google Scholar] [CrossRef] [PubMed]
  11. Gupta, V.; Miller, J.D. Surface force measurements at the basal planes of ordered kaolinite particles. J. Colloid Interface Sci. 2010, 344, 362–371. [Google Scholar] [CrossRef] [PubMed]
  12. Kumar, N.; Zhao, C.L.; Klaassen, A.; van den Ende, D.; Mugele, F.; Siretanu, I. Characterization of the surface charge distribution on kaolinite particles using high resolution atomic force microscopy. Geochim. Cosmochim. Acta 2016, 175, 100–112. [Google Scholar] [CrossRef]
  13. Liu, J.; Miller, J.D.; Yin, X.; Gupta, V.; Wang, X. Influence of ionic strength on the surface charge and interaction of layered silicate particles. J. Colloid Interface Sci. 2014, 432, 270–277. [Google Scholar] [CrossRef] [PubMed]
  14. Jupille, J. Analysis of mineral surfaces by atomic force microscopy. In Spectroscopic Methods in Mineralogy and Materials Science; Henderson, G.S., Neuville, D.R., Downs, R.T., Eds.; The Mineralogical Society of America: Chantilly, VA, USA, 2014; p. 800. [Google Scholar]
  15. Hassenkam, T.; Skovbjerg, L.L.; Stipp, S.L.S. Probing the intrinsically oil-wet surfaces of pores in north sea chalk at subpore resolution. Proc. Natl. Acad. Sci. USA 2009, 106, 6071–6076. [Google Scholar] [CrossRef] [PubMed]
  16. Matthiesen, J.; Hassenkam, T.; Bovet, N.; Dalby, K.N.; Stipp, S.L.S. Adsorbed organic material and its control on wettability. Energy Fuels 2017, 31, 55–64. [Google Scholar] [CrossRef]
  17. Hassenkam, T.; Andersson, M.P.; Hilner, E.; Matthiesen, J.; Dobberschutz, S.; Dalby, K.N.; Bovet, N.; Stipp, S.L.S.; Salino, P.; Reddick, C.; et al. Could atomic-force microscopy force mapping be a fast alternative to core-plug tests for optimizing injection-water salinity for enhanced oil recovery in sandstone? SPE J. 2016, 21, 720–729. [Google Scholar] [CrossRef]
  18. Okhrimenko, D.V.; Dalby, K.N.; Skovbjerg, L.L.; Bovet, N.; Christensen, J.H.; Stipp, S.L.S. The surface reactivity of chalk (biogenic calcite) with hydrophilic and hydrophobic functional groups. Geochim. Cosmochim. Acta 2014, 128, 212–224. [Google Scholar] [CrossRef]
  19. Matthiesen, J.; Bovet, N.; Hilner, E.; Andersson, M.P.; Schmidt, D.A.; Webb, K.J.; Dalby, K.N.; Hassenkam, T.; Crouch, J.; Collins, I.R.; et al. How naturally adsorbed material on minerals affects low salinity enhanced oil recovery. Energy Fuels 2014, 28, 4849–4858. [Google Scholar] [CrossRef]
  20. Skovbjerg, L.L.; Okhrimenko, D.V.; Khoo, J.; Dalby, K.N.; Hassenkam, T.; Makoyicky, E.; Stipp, S.L.S. Preferential adsorption of hydrocarbons to nanometer-sized clay on chalk particle surfaces. Energy Fuels 2013, 27, 3642–3652. [Google Scholar] [CrossRef]
  21. Hassenkam, T.; Mitchell, A.C.; Pedersen, C.S.; Skovbjerg, L.L.; Bovet, N.; Stipp, S.L.S. The low salinity effect observed on sandstone model surfaces. Colloids Surf. Physicochem. Eng. Aspects 2012, 403, 79–86. [Google Scholar] [CrossRef]
  22. Hassenkam, T.; Pedersen, C.S.; Dalby, K.; Austad, T.; Stipp, S.L.S. Pore scale observation of low salinity effects on outcrop and oil reservoir sandstone. Colloids Surf. Physicochem. Eng. Aspects 2011, 390, 179–188. [Google Scholar] [CrossRef]
  23. Wu, J.; Liu, F.; Yang, H.; Xu, S.; Xie, Q.; Zhang, M.; Chen, T.; Hu, G.; Wang, J. Effect of specific functional groups on oil adhesion from mica substrate: Implications for low salinity effect. J. Ind. Eng. Chem. 2017, 56, 342–349. [Google Scholar] [CrossRef]
  24. Juhl, K.M.S.; Pedersen, C.S.; Bovet, N.; Dalby, K.N.; Hassenkam, T.; Andersson, M.P.; Okhrimenko, D.; Stipp, S.L.S. Adhesion of alkane as a functional group on muscovite and quartz: Dependence on ph and contact time. Langmuir 2014, 30, 14476–14485. [Google Scholar] [CrossRef] [PubMed]
  25. Lorenz, B.; Ceccato, M.; Andersson, M.P.; Dobberschütz, S.; Rodriguez-Blanco, J.D.; Dalby, K.N.; Hassenkam, T.; Stipp, S.L.S. Salinity-dependent adhesion response properties of aluminosilicate (k-feldspar) surfaces. Energy Fuels 2017, 31, 4670–4680. [Google Scholar] [CrossRef]
  26. Juhl, K.M.S.; Bovet, N.; Hassenkam, T.; Dideriksen, K.; Pedersen, C.S.; Jensen, C.M.; Okhrimenko, D.V.; Stipp, S.L.S. Change in organic molecule adhesion on alpha-alumina (sapphire) with change in nacl and cacl2 solution salinity. Langmuir 2014, 30, 8741–8750. [Google Scholar] [CrossRef] [PubMed]
  27. Alagha, L.; Wang, S.; Yan, L.; Xu, Z.; Masliyah, J. Probing adsorption of polyacrylamide-based polymers on anisotropic basal planes of kaolinite using quartz crystal microbalance. Langmuir 2013, 29, 3989–3998. [Google Scholar] [CrossRef] [PubMed]
  28. Vezenov, D.V.; Noy, A.; Ashby, P. Chemical force microscopy: Probing chemical origin of interfacial forces and adhesion. J. Adhes. Sci. Technol. 2005, 19, 313–364. [Google Scholar] [CrossRef]
  29. Hutter, J.L.; Bechhoefer, J. Calibration of atomic-force microscope tips. Rev. Sci. Instrum. 1993, 64, 1868–1873. [Google Scholar] [CrossRef]
  30. Butt, H.J.; Jaschke, M. Calculation of thermal noise in atomic force microscopy. Nanotechnology 1995, 6, 1–7. [Google Scholar] [CrossRef]
  31. Lager, A.; Webb, K.J.; Black, C.J.J.; Singleton, M.; Sorbie, K.S. Low Salinity Oil Recovery—An Experimental Investigation1; Society of Petrophycists and Well Log Analyst: Houston, TX, USA, 2008. [Google Scholar]
  32. Sorbie, K.S.; Collins, I. A Proposed Pore-Scale Mechanism for How Low Salinity Waterflooding Works; Society of Petroleum Engineers: Tulsa, OK, USA, 2010. [Google Scholar]
  33. Shi, L.; Olsson, M.H.M.; Hassenkam, T.; Stipp, S.L.S. A ph-resolved view of the low salinity effect in sandstone reservoirs. Energy Fuels 2016, 30, 5346–5354. [Google Scholar] [CrossRef]
  34. Vezenov, D.V.; Noy, A.; Rozsnyai, L.F.; Lieber, C.M. Force titrations and ionization state sensitive imaging of functional groups in aqueous solutions by chemical force microscopy. J. Am. Chem. Soc. 1997, 119, 2006–2015. [Google Scholar] [CrossRef]
  35. Kleven, R.; Alstad, J. Interaction of alkali, alkaline-earth and sulphate ions with clay minerals and sedimentary rocks. J. Pet. Sci. Eng. 1996, 15, 181–200. [Google Scholar] [CrossRef]
  36. Mugele, F.; Bera, B.; Cavalli, A.; Siretanu, I.; Maestro, A.; Duits, M.; Cohen-Stuart, M.; van den Ende, D.; Stocker, I.; Collins, I. Ion adsorption-induced wetting transition in oil-water-mineral systems. Sci. Rep.-UK 2015, 5, 10519. [Google Scholar] [CrossRef] [PubMed]
  37. Madsen, L.; Ida, L. Adsorption of carboxylic acids on reservoir minerals from organic and aqueous phase. SPE Reservoir Eval. Eng. 1998, 1, 47–51. [Google Scholar] [CrossRef]
  38. Fogden, A. Removal of crude oil from kaolinite by water flushing at varying salinity and ph. Colloids Surf. Physicochem. Eng. Aspects 2012, 402, 13–23. [Google Scholar] [CrossRef]
  39. Wang, L.; Siretanu, I.; Duits, M.H.G.; Stuart, M.A.C.; Mugele, F. Ion effects in the adsorption of carboxylate on oxide surfaces, studied with quartz crystal microbalance. Colloid Surf. A 2016, 494, 30–38. [Google Scholar] [CrossRef]
  40. Zhao, C.L.; Ebeling, D.; Siretanu, I.; van den Ende, D.; Mugele, F. Extracting local surface charges and charge regulation behavior from atomic force microscopy measurements at heterogeneous solid-electrolyte interfaces. Nanoscale 2015, 7, 16298–16311. [Google Scholar] [CrossRef] [PubMed]
Figure 1. Detail of the kaolinite crystal structure perpendicular to the <010> direction. Two 1:1 layers are shown in the drawing, with siloxane and aluminol layer highlighted in the upper one. Clearly visible are the distinct nature of both upper and lower crystal termination.
Minerals 07 00250 g001
Figure 2. Representative force-distance curve measured over a kaolinite crystal (a). Extend and retract curves (blue and red, respectively) are shown. Adhesion region highlighted in plot. (b) Representative histogram showing the spread of adhesion measurements over a kaolinite crystal; (c) height image (64 × 64 pixels) of a representative kaolinite crystal; (d) height image (64 × 64 pixels) of the kaolinite crystal measured in experiment kao-Si-4; (e) low resolution (25 × 25 pixels) height image of the crystal shown in (d); (f) adhesion map of the crystal shown in (e).
Minerals 07 00250 g002
Figure 3. Graphs showing the measured adhesion for experiments kao-Si-1 (a) and kao-Si-2 (b) performed with a –COOH probe over the siloxane surface of kaolinite and in the presence of CaCl2 solutions of different concentrations (0.001, 0.01 and 1 M) at pH ≈ 5.5. (a) the solutions were introduced in the fluid cell following a sequence of low to high CaCl2 concentration; (b) the solutions were introduced in the fluid cell following a sequence of high to low CaCl2 concentration. In both experiments, an increase in the adhesion with lower CaCl2 concentration is observed.
Minerals 07 00250 g003
Figure 4. Graph showing the measured adhesion for experiment kao-Si-3, performed with a –COOH probe over the siloxane surface kaolinite and in the presence of CaCl2 of various concentrations (0.001, 0.01 and 1 M) at pH = 8. Solutions were introduced in a sequence of high to low to high concentration. A drop in the measured adhesion is observed as the CaCl2 decreases, followed by an increase as the concentration is increased again.
Minerals 07 00250 g004
Figure 5. Idealized schematic cartoon showing the protonation state of the –COOH groups on the atomic force microscopy probe as well as complexation on the kaolinite siloxane surface at high and low concentrations of CaCl2 and two pH conditions, ≈5.5 (a) and 8 (b).
Minerals 07 00250 g005
Figure 6. Graphs showing the measured adhesion from experiments kao-Si-4 (a), kao-Si-5 (b) and kao-Si-6 (c), where the overall effect of pH on the adhesion of a –COOH functionalised probe was measured in the presence of a 0.001 M CaCl2 solution. An overall increase in adhesion as pH is increased can be observed.
Minerals 07 00250 g006
Figure 7. (a) Graph showing the role of NaCl concentration in modifying the measured adhesion of a –COOH functionalised prove over the kaolinite siloxane surface (kao-Si-7); (b) graph showing the effect of pH on the measured adhesion of –COOH groups to a kaolinite siloxane surface in the presence of 0.001 M NaCl solution (kao-Si-8).
Minerals 07 00250 g007
Figure 8. Effect of CaCl2 concentration on the measured adhesion of –COOH groups over the aluminol face of two different kaolinite crystals from experiment Ka-Al-1. (a) the effect on crystal A; (b) the effect on crystal B.
Minerals 07 00250 g008
Figure 9. Graphs showing the results for experiments kao-Al-2 and kao-Al-3, where the effect of pH on the measured adhesion of a –COOH functionalised probe on the aluminol face of kaolinite was measured in the presence of a CaCl2 concentration of 0.001 M (a), and a NaCl concentration of 0.001 M (b).
Minerals 07 00250 g009
Table 1. Solution composition, order, pH and surface studied for all experiments performed for this study.
ExperimentWaterNaCl (0.001 M)NaCl (0.01 M)NaCl (1 M)CaCl2 (0.001 M)CaCl2 (0.01 M)CaCl2 (1 M)pH
kao-Si-11 2345.5
kao-Si-21 4325.5
kao-Si-31 54/63/78
kao-Si-41 2 5/6/7/8/9
kao-Si-51 2 5/6/7/8/9
kao-Si-61 2 5/6/7/8/9
kao-Si-71432 5.5
kao-Si-812 5/6/7/8/9
kao-Si-91/52346785.5
kao-Si-101 2345.5
Kao-Al-11 2345.5
kao-Al-21 2 6/7/8
kao-Al-312 6/7/8

