Possible Involvement of Permian Phosphoria Formation Oil as a Source of REE and Other Metals Associated with Complex U-V Mineralization in the Northern Bighorn Basin?


Abstract
:
1. Introduction
Production History and Theories for Origin of Deposits
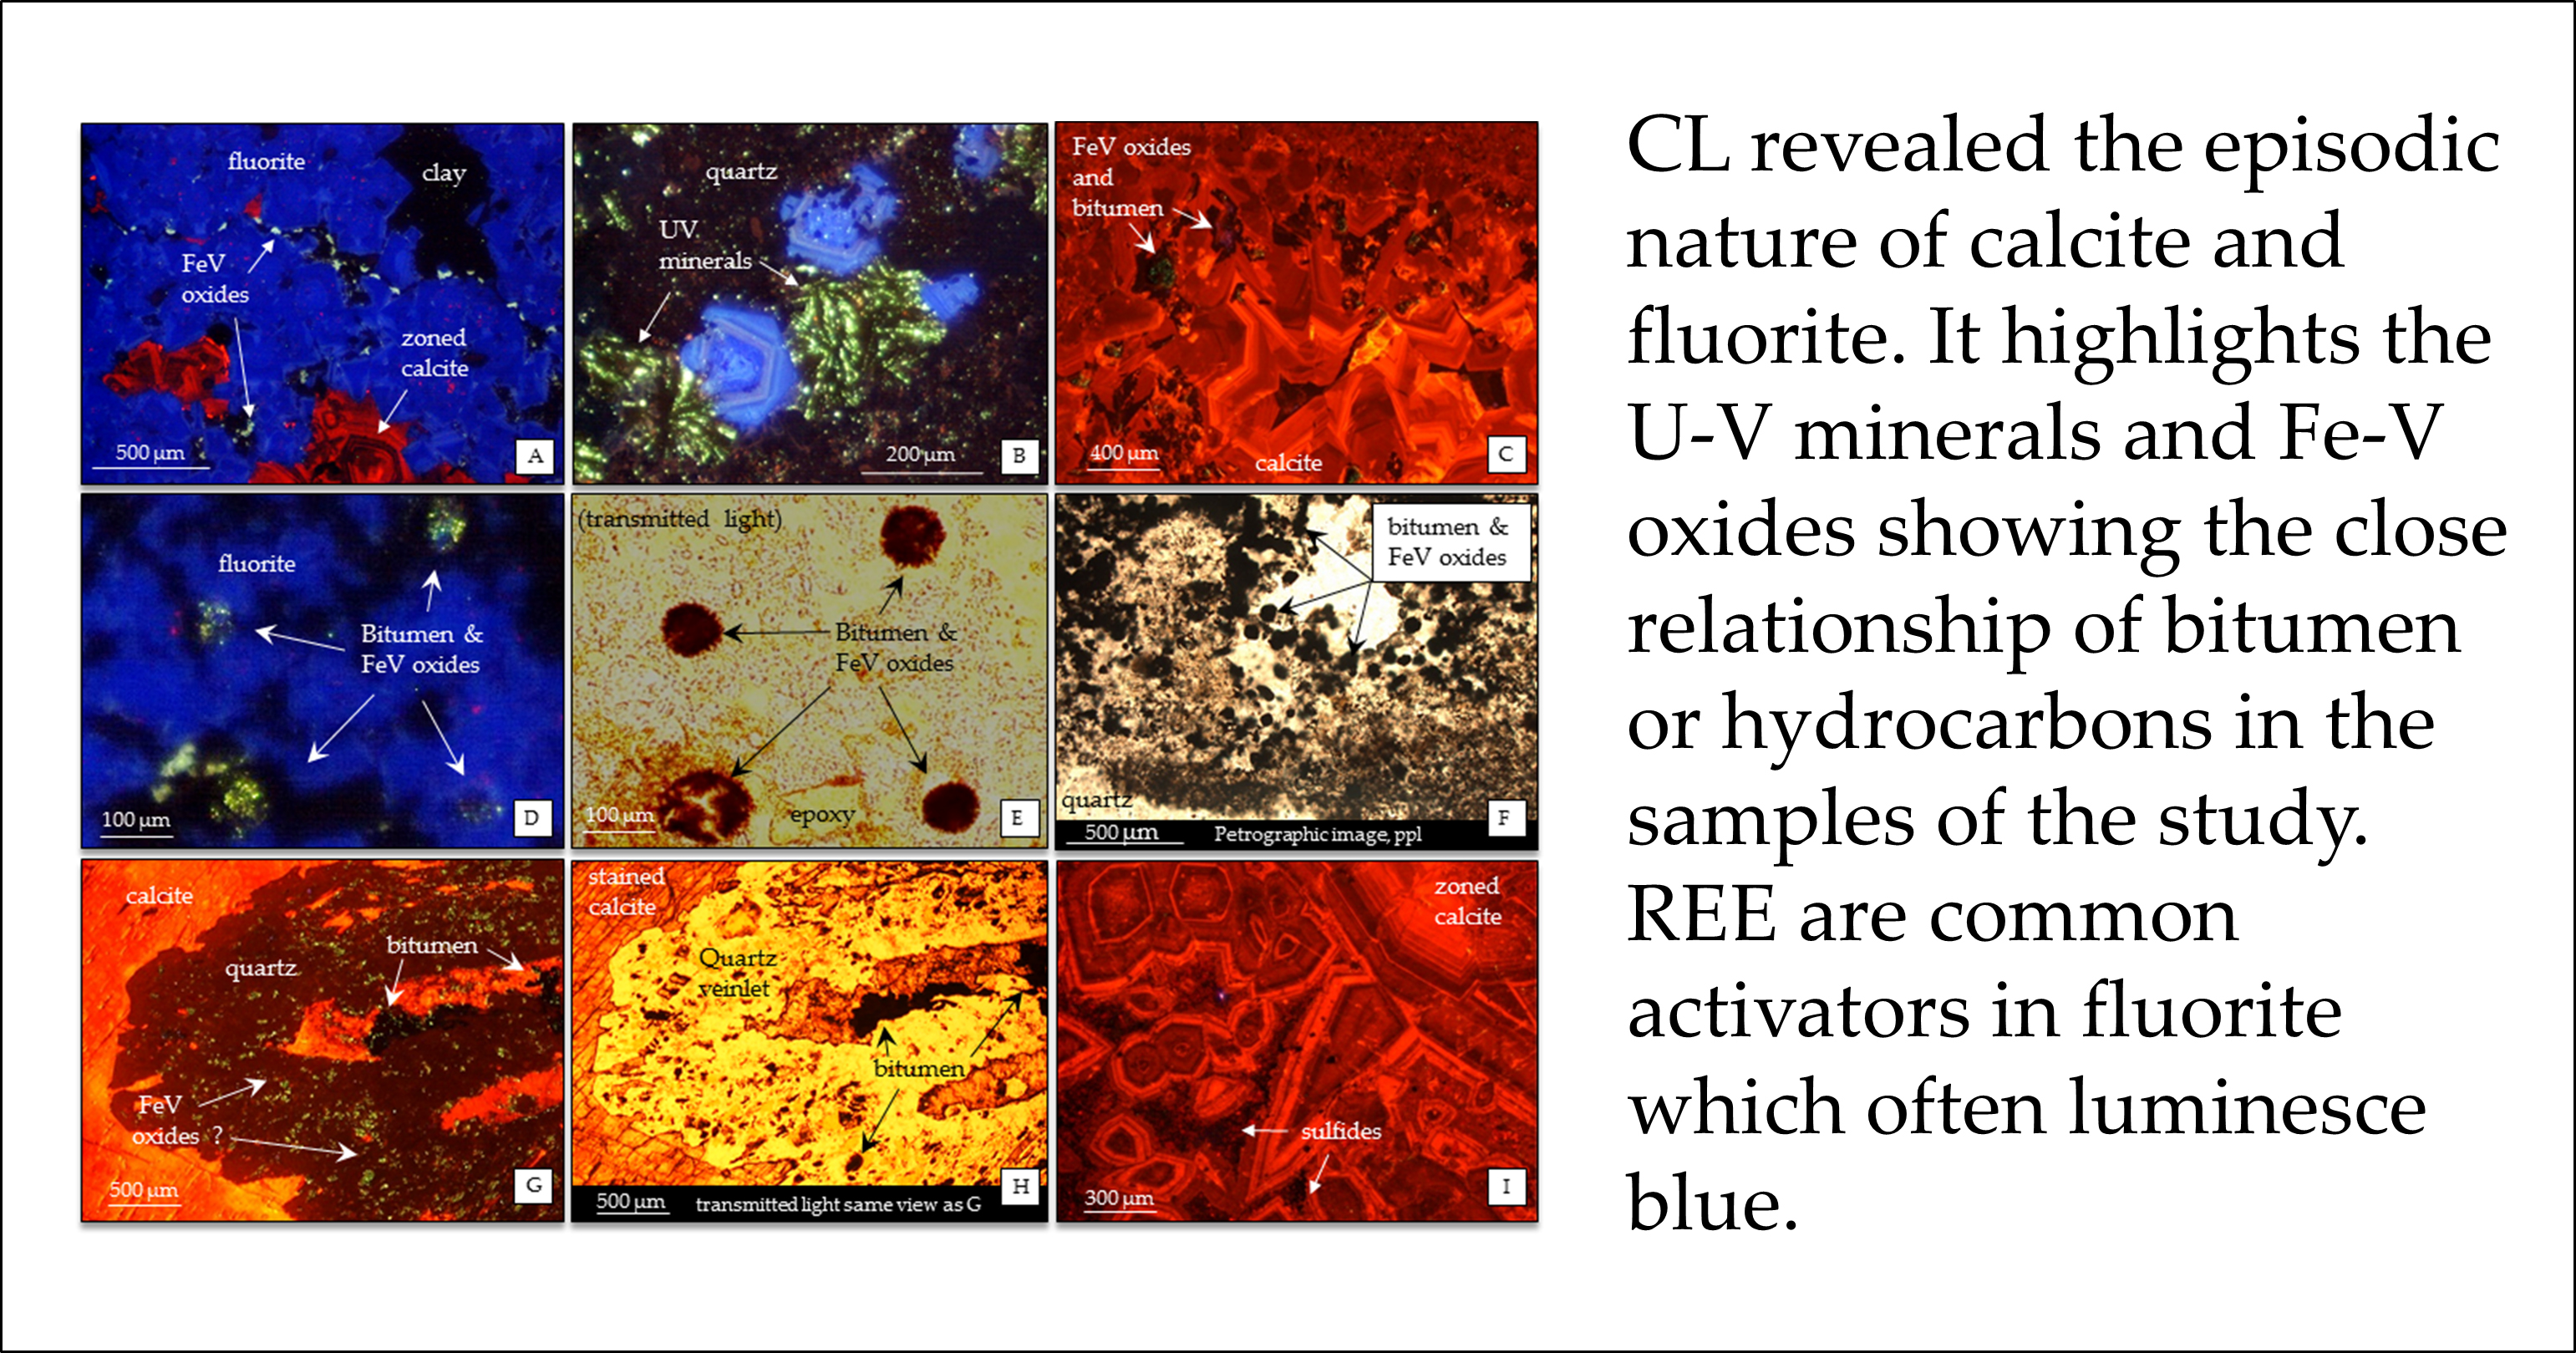
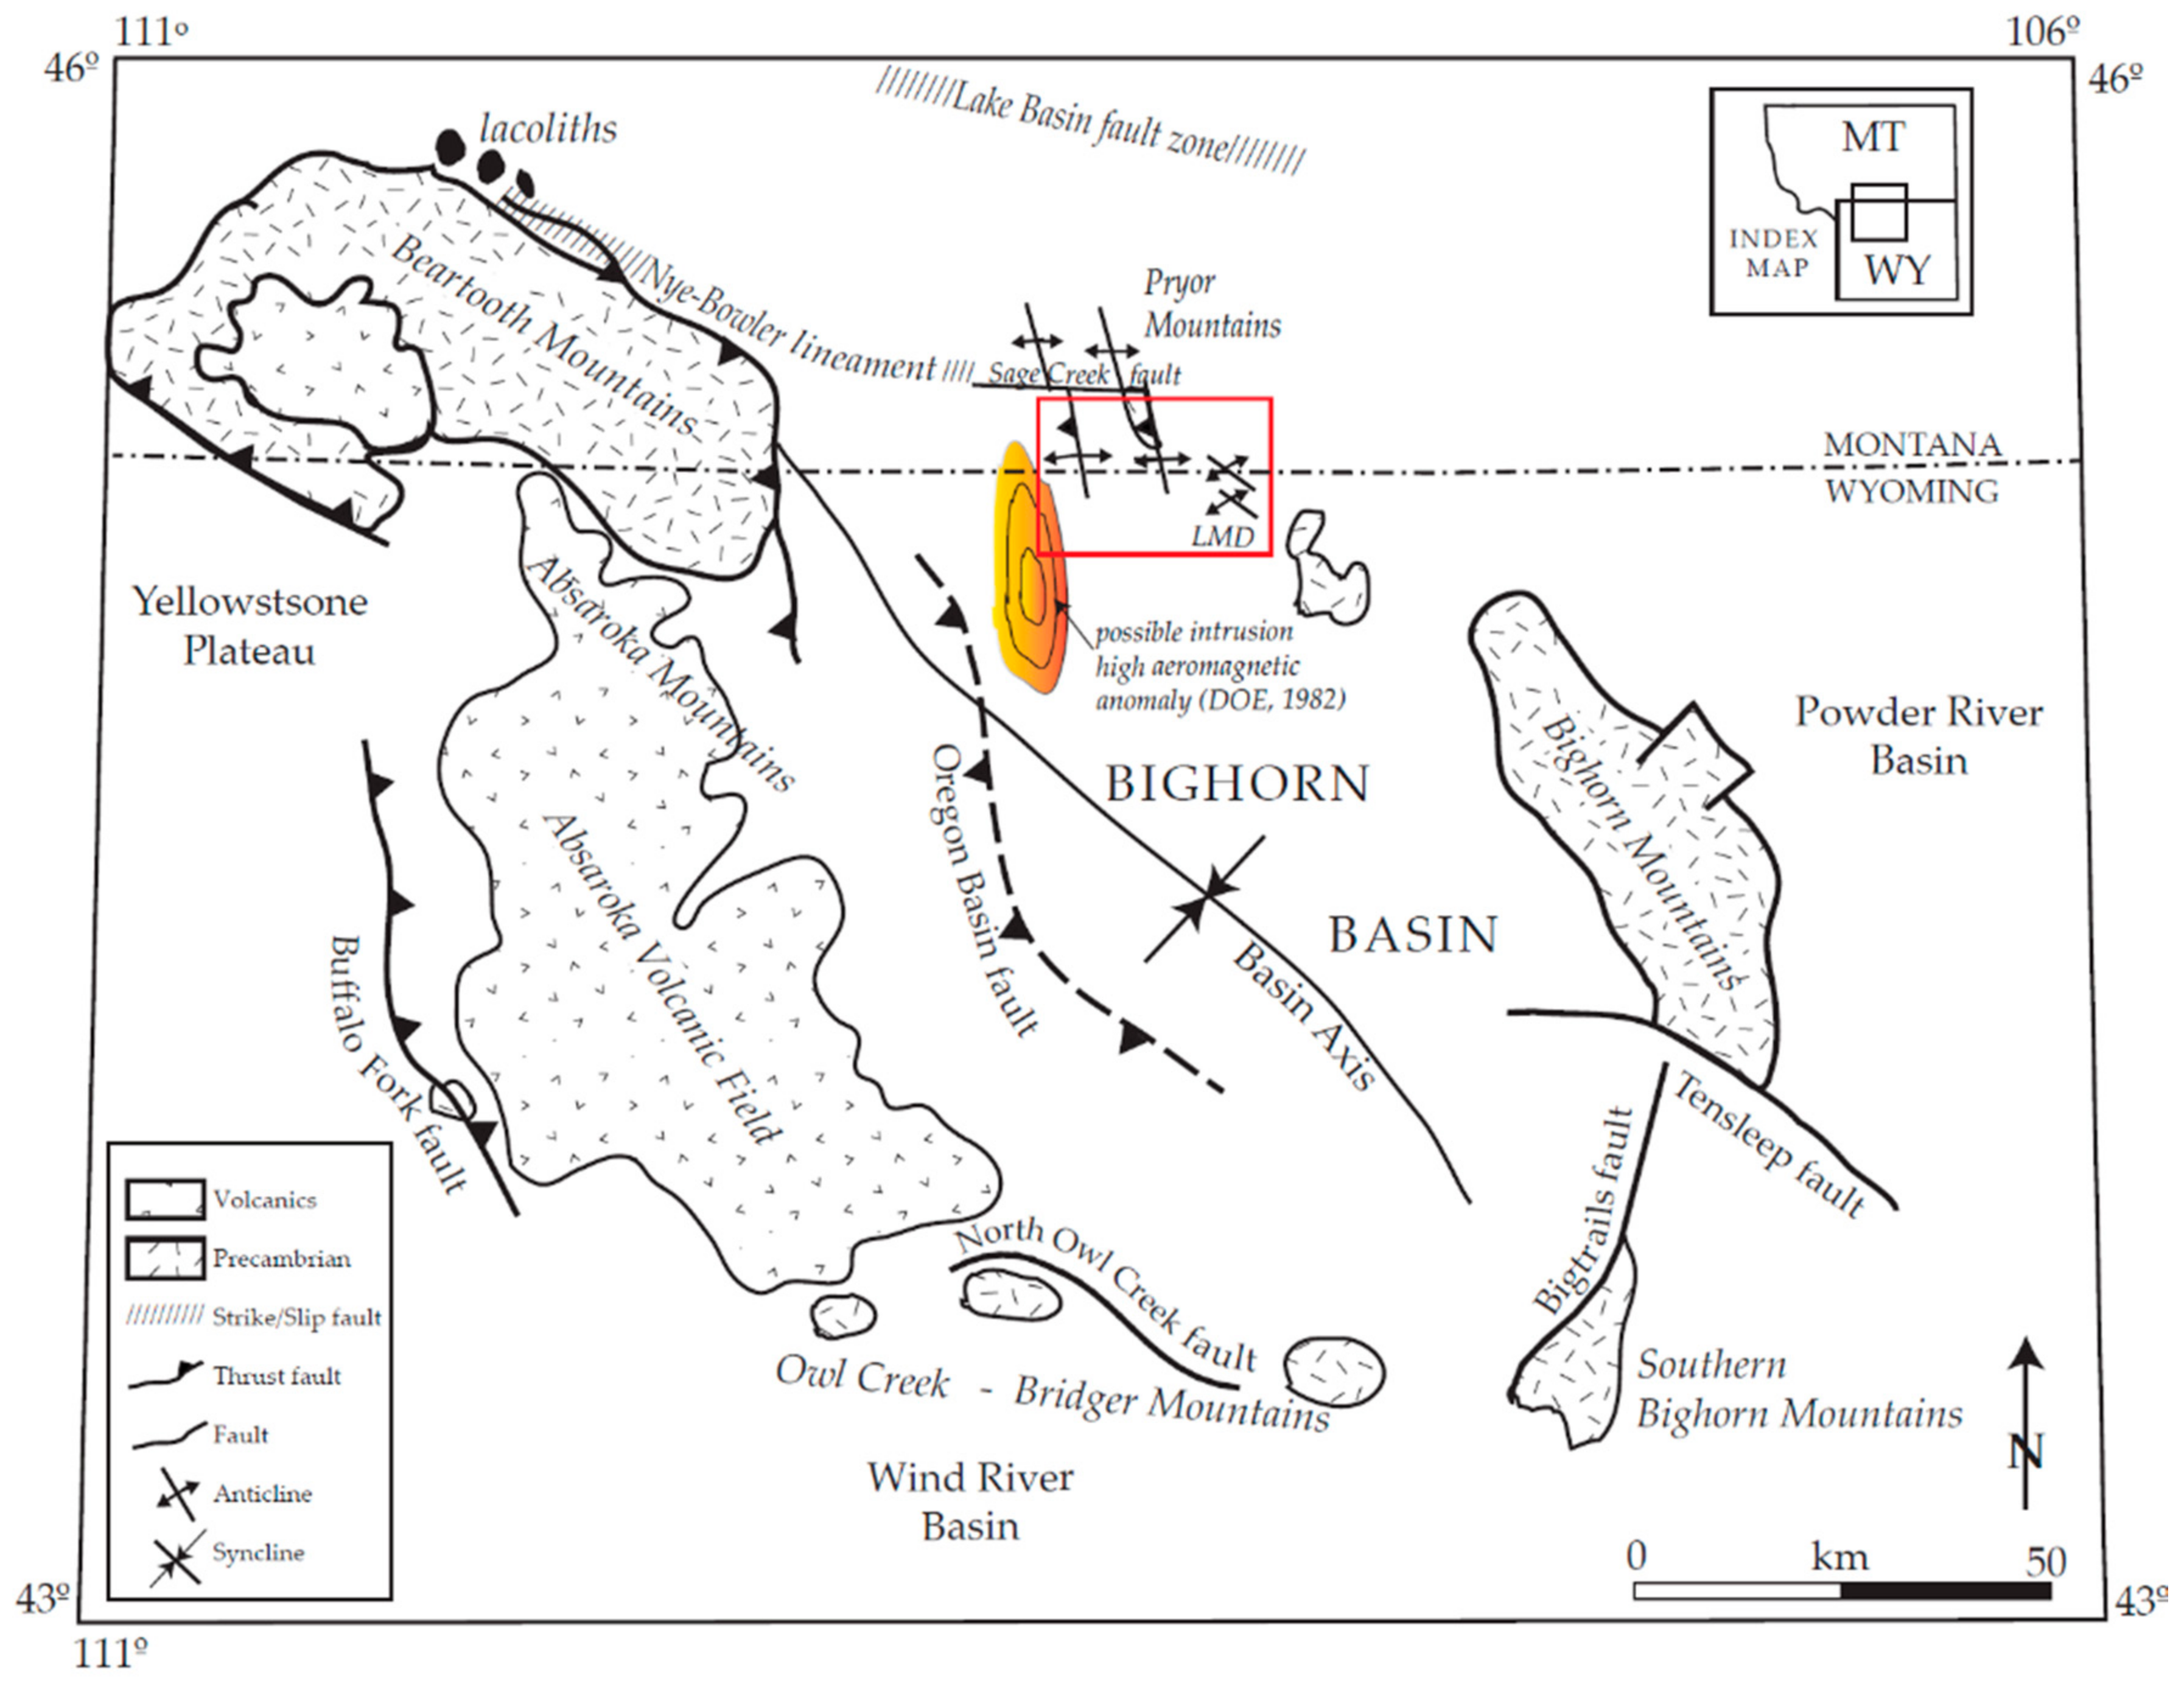
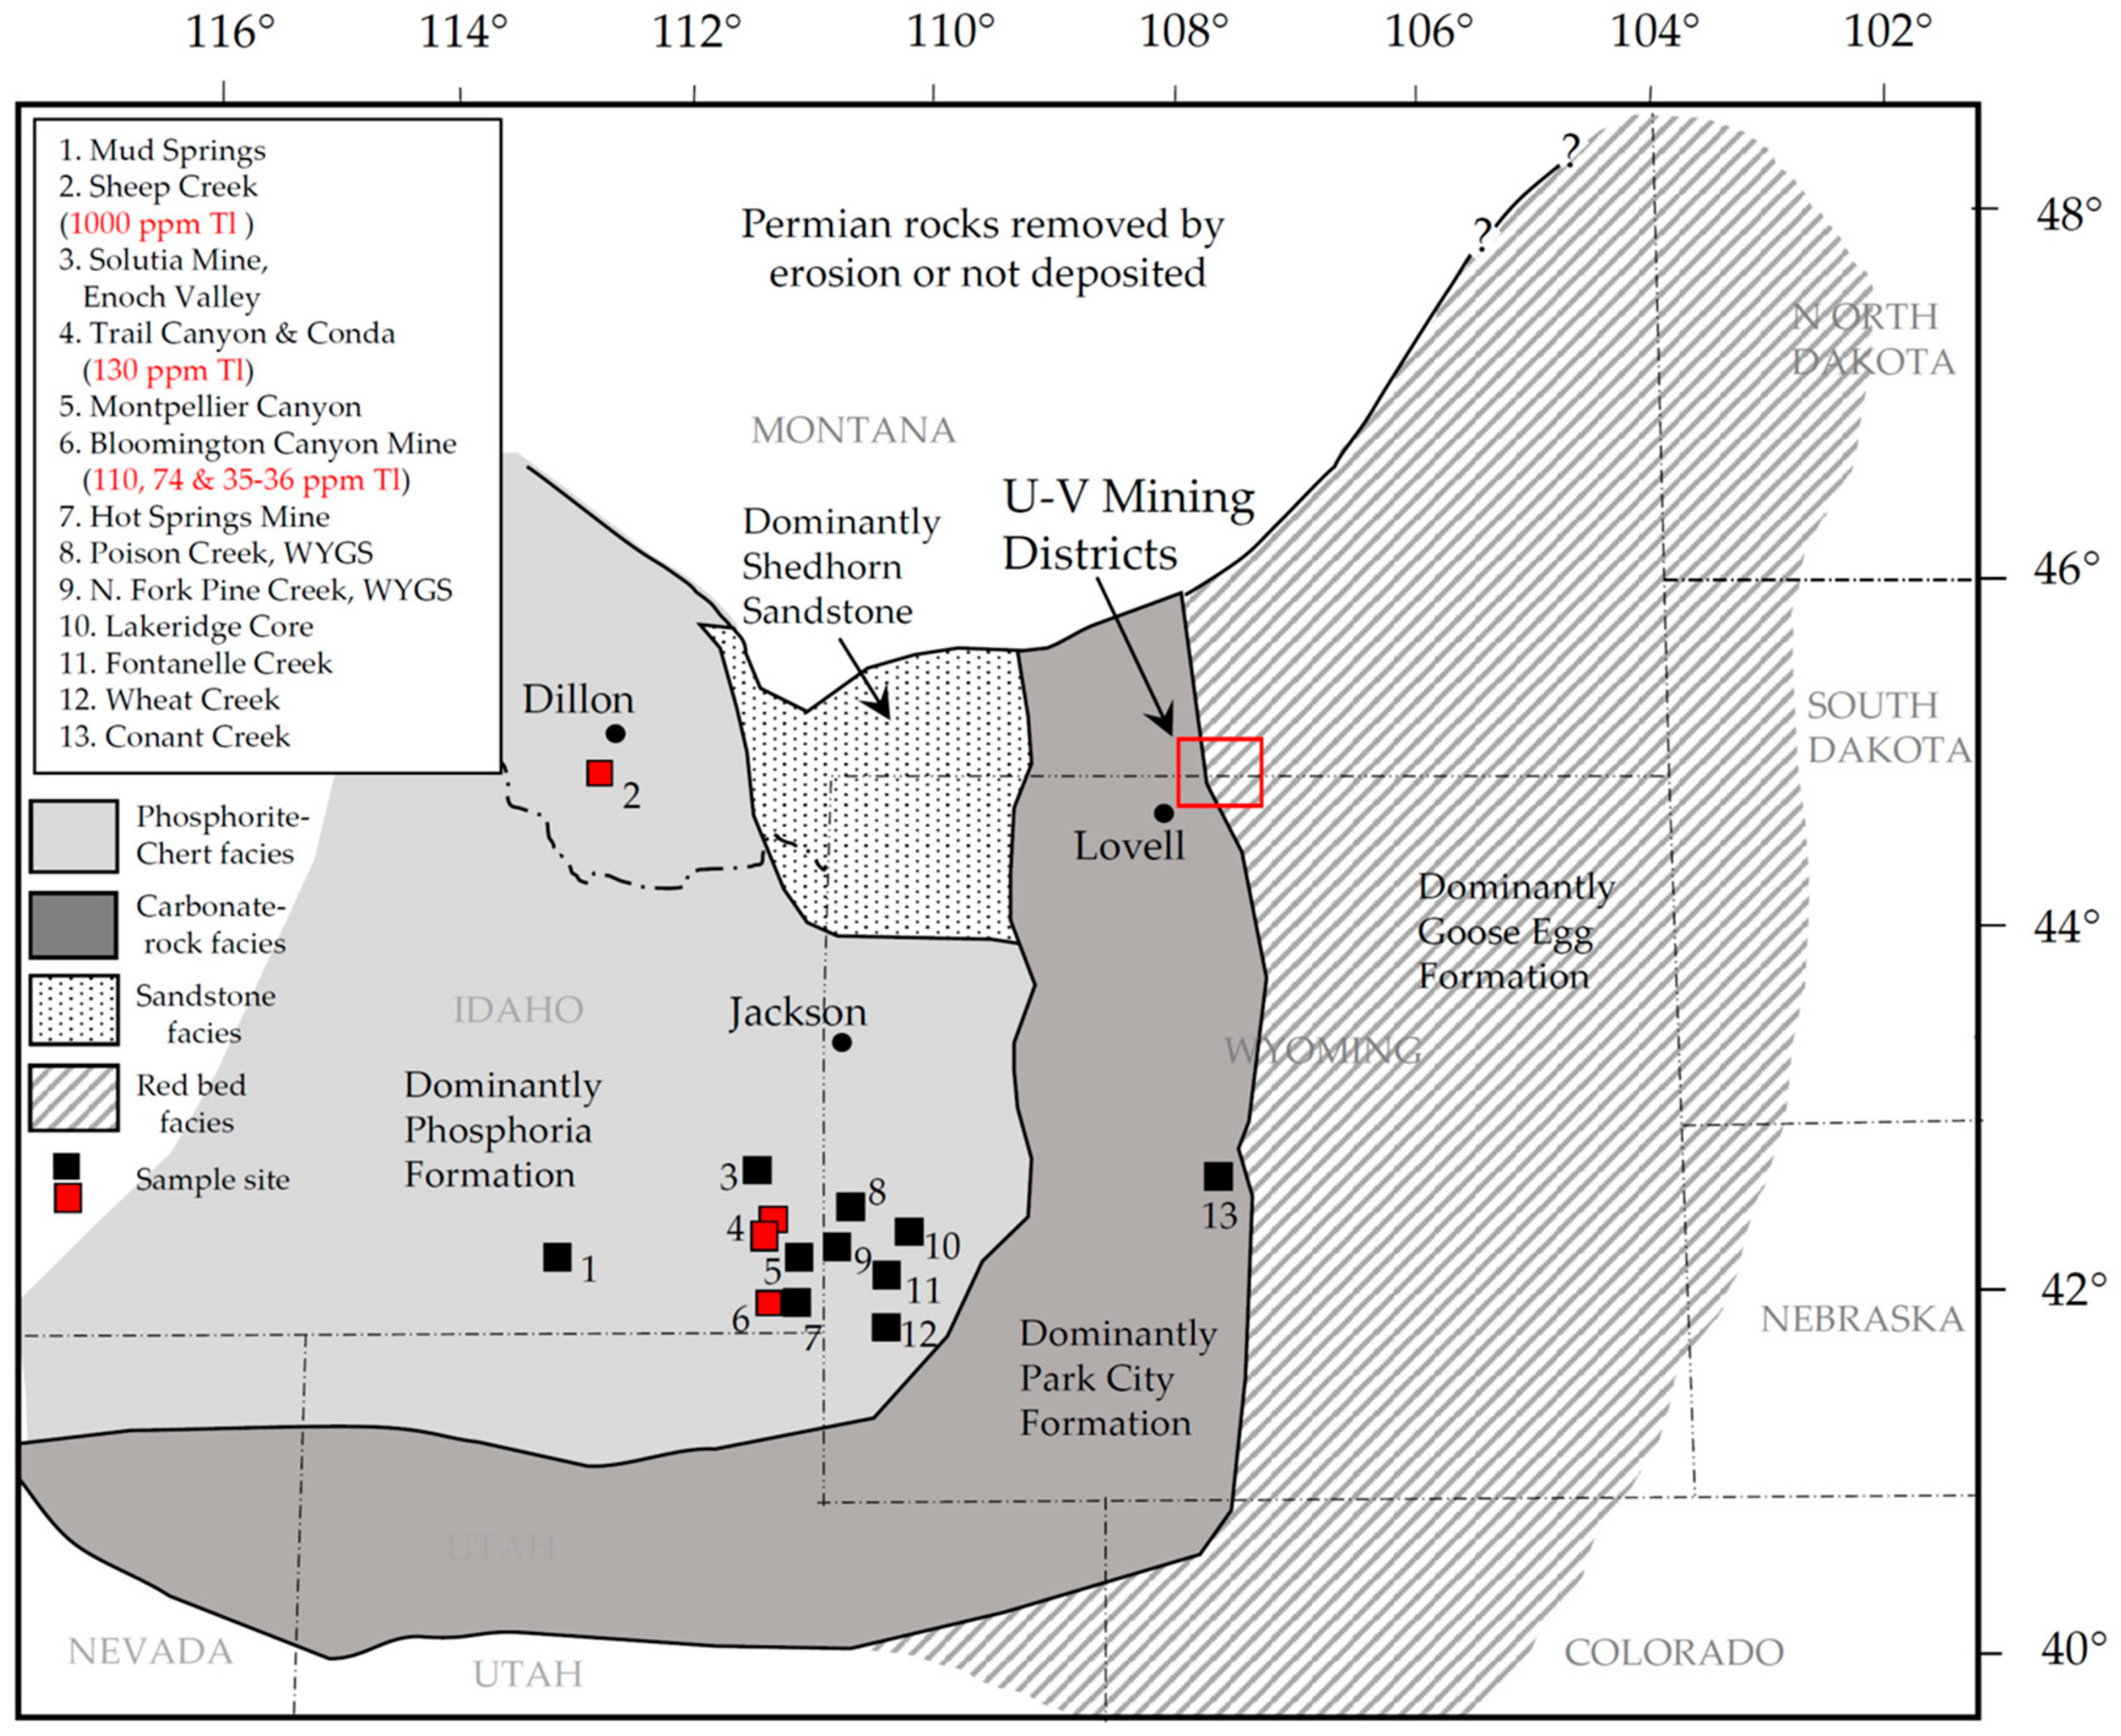
2. Study Areas
2.1. Physiography
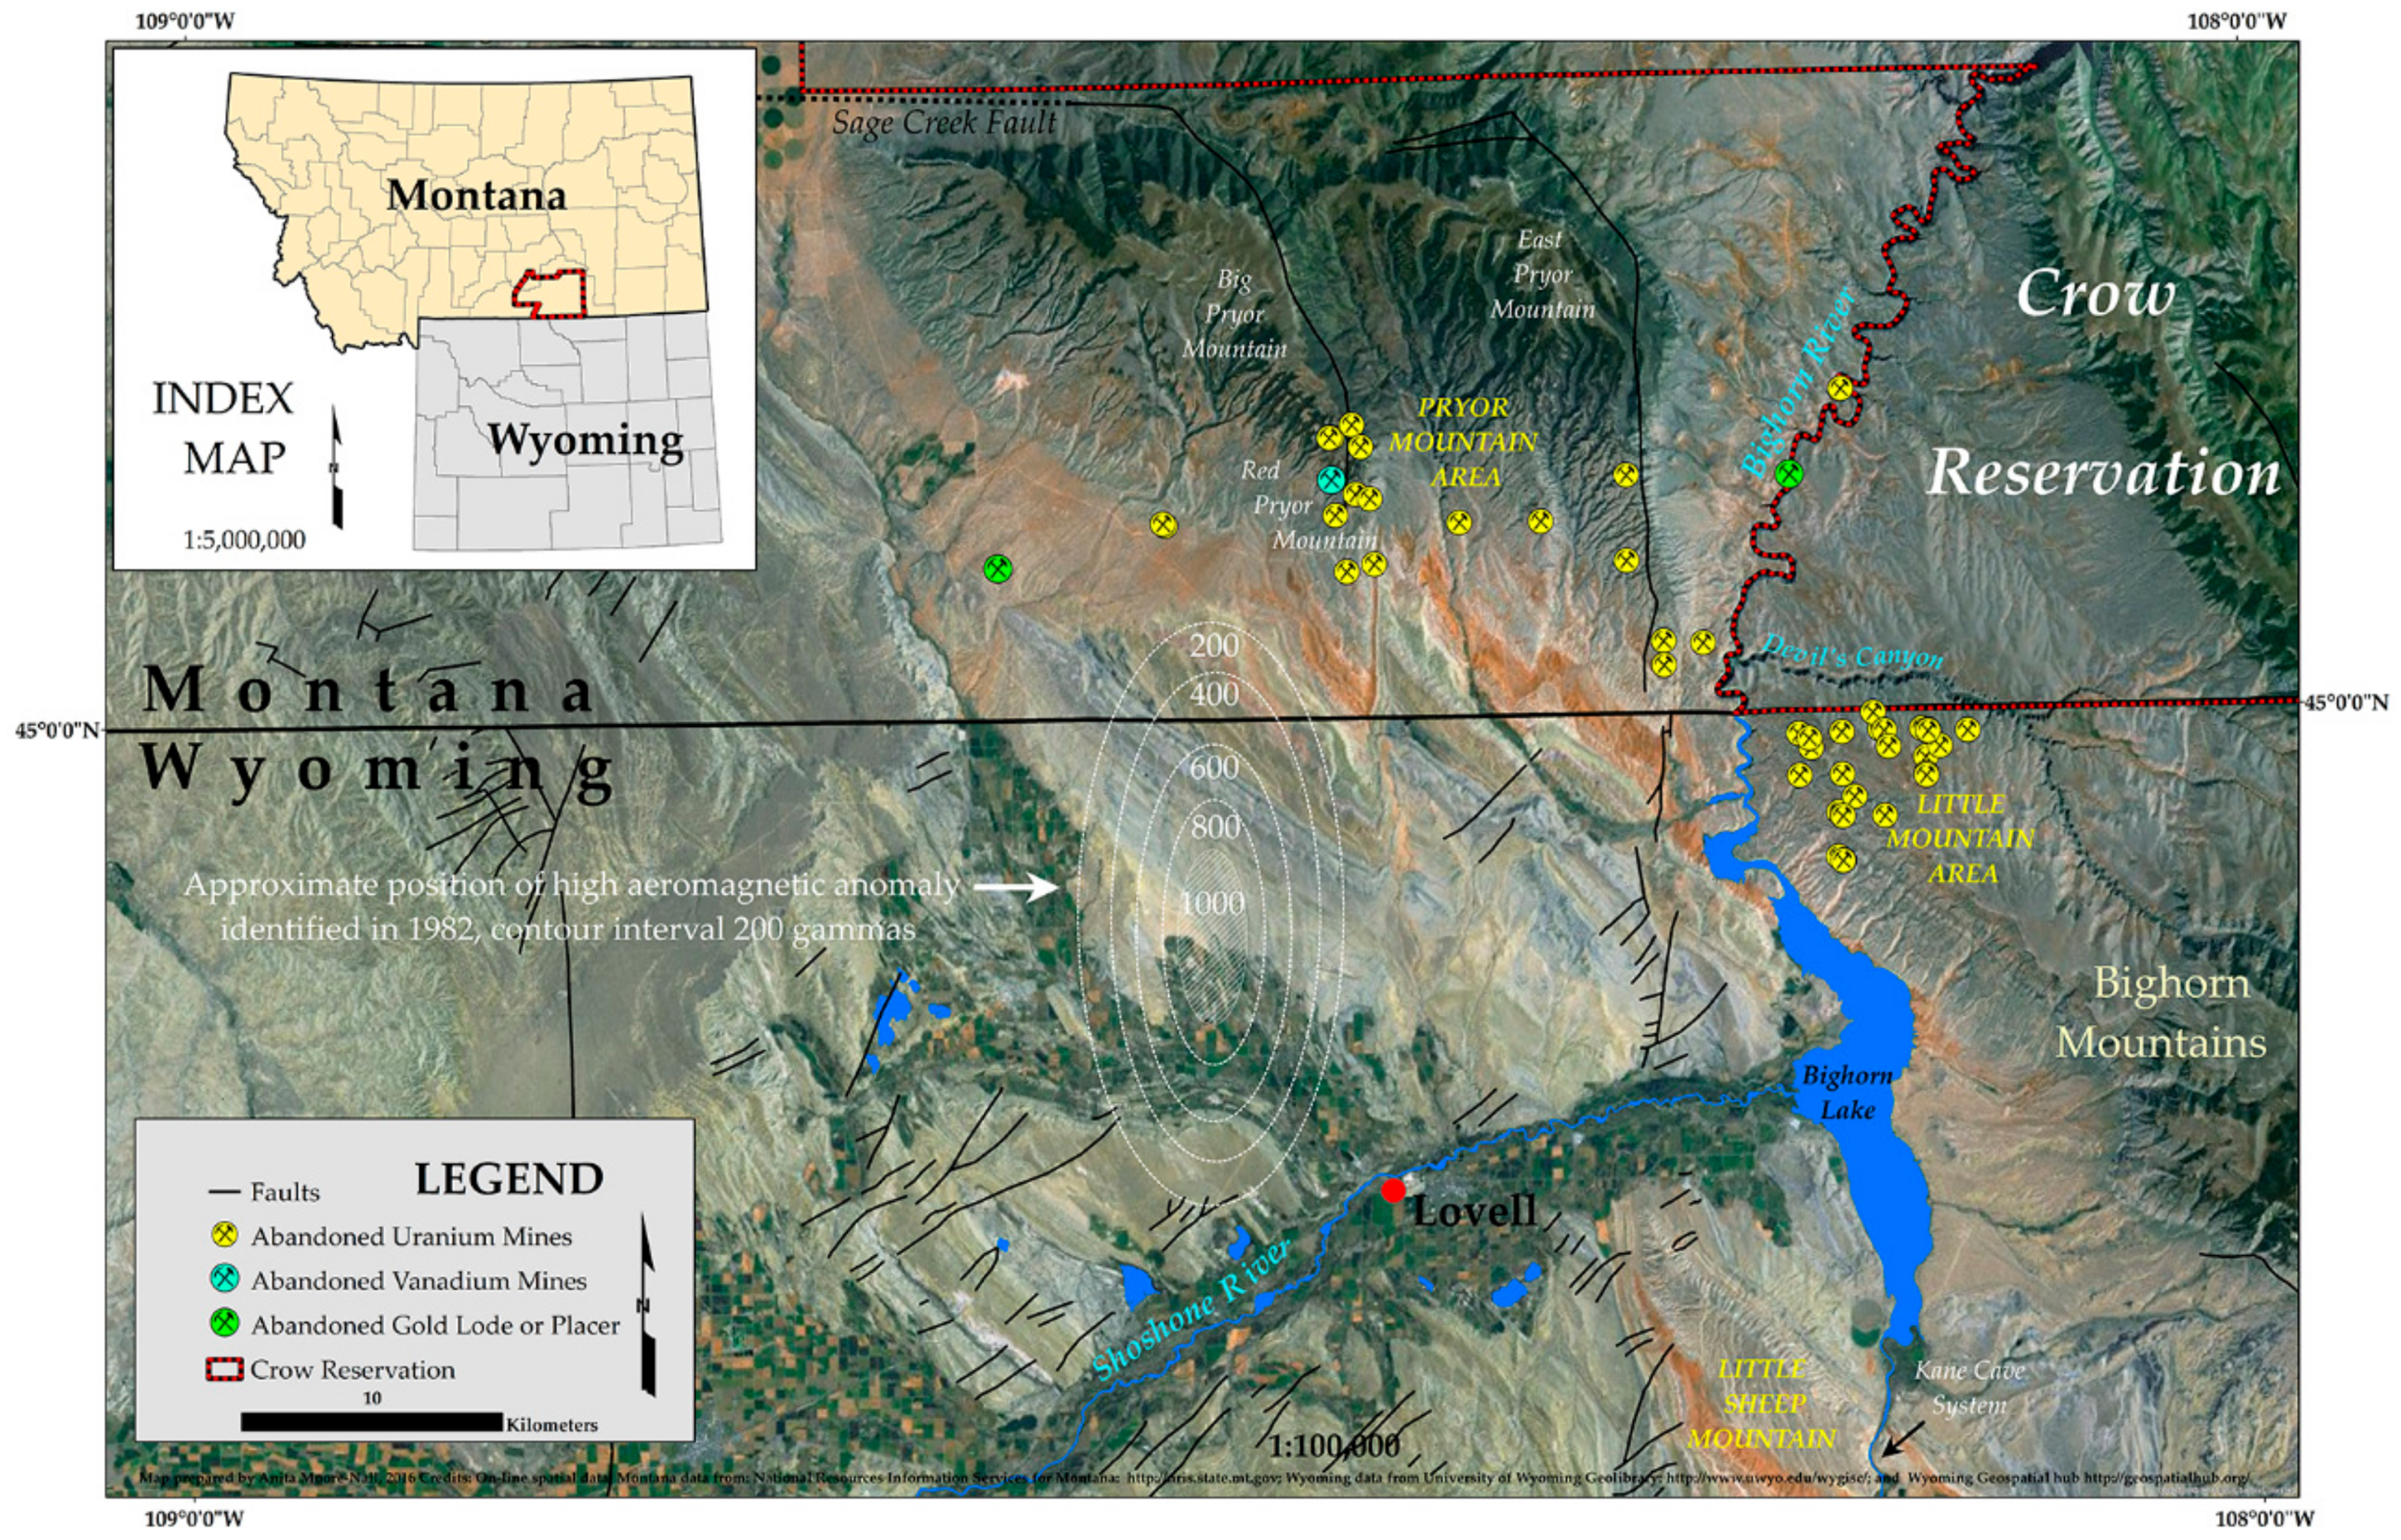
2.2. Stratigraphy
2.3. Structural Setting
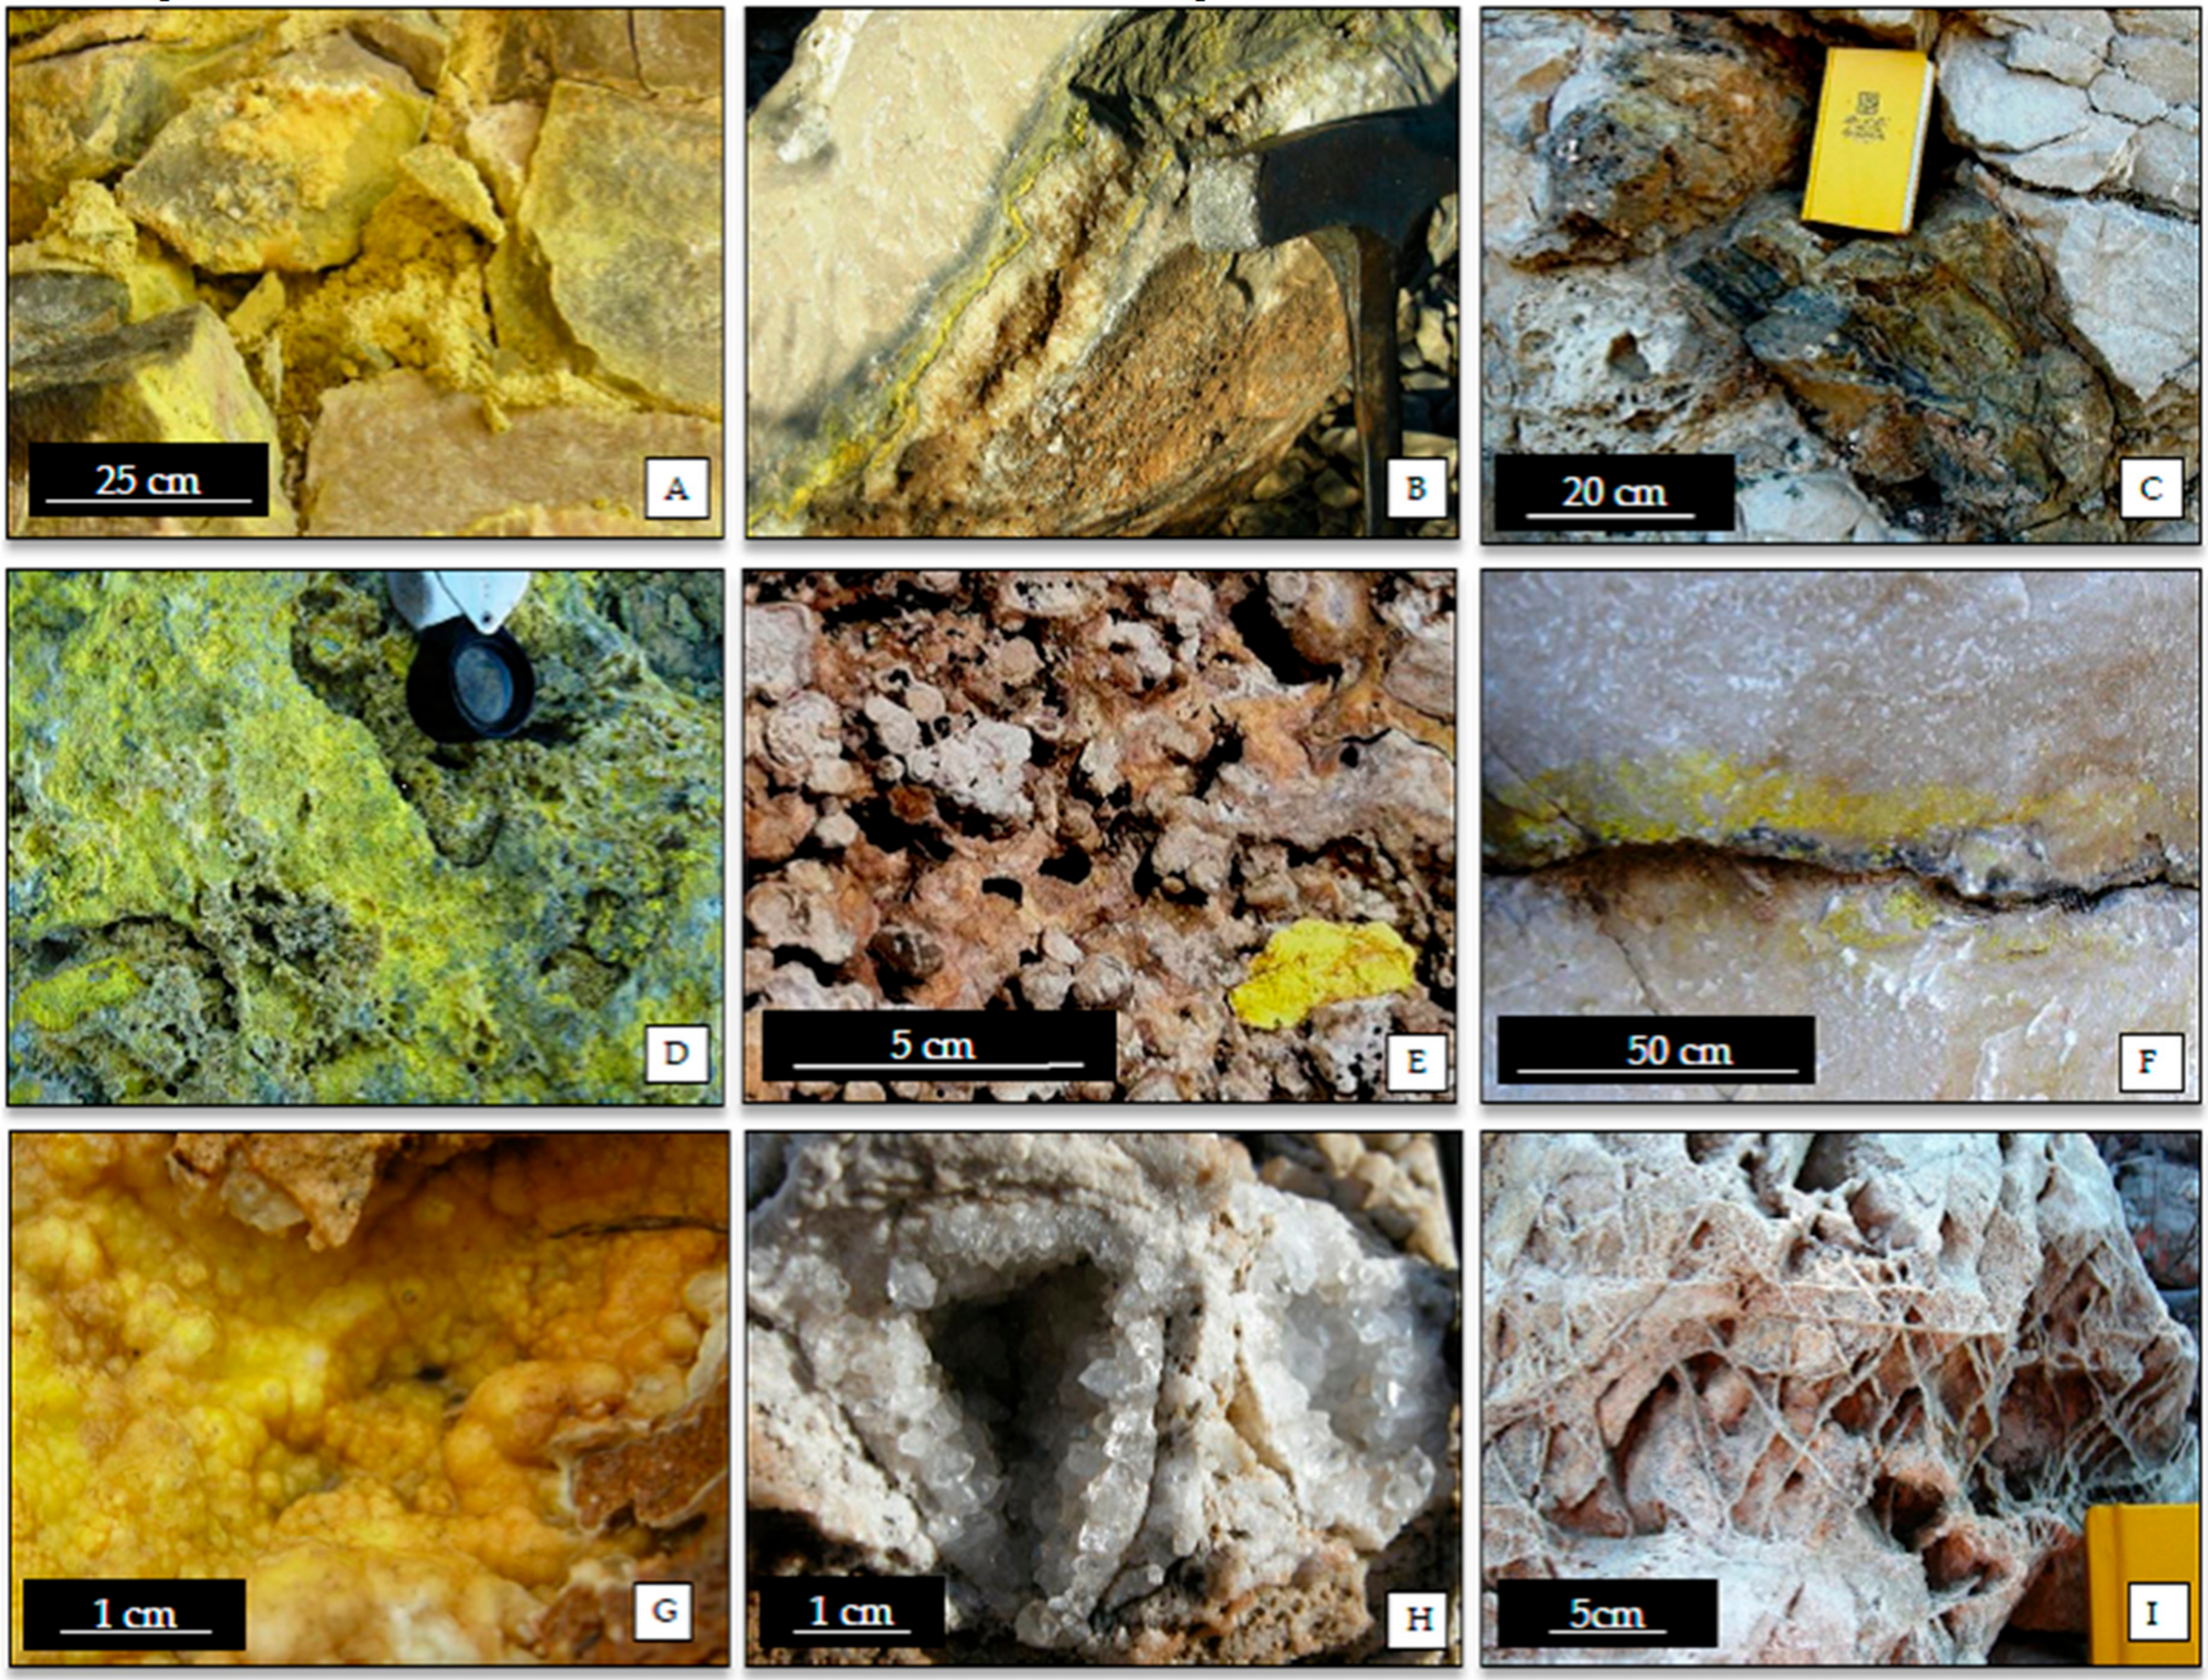
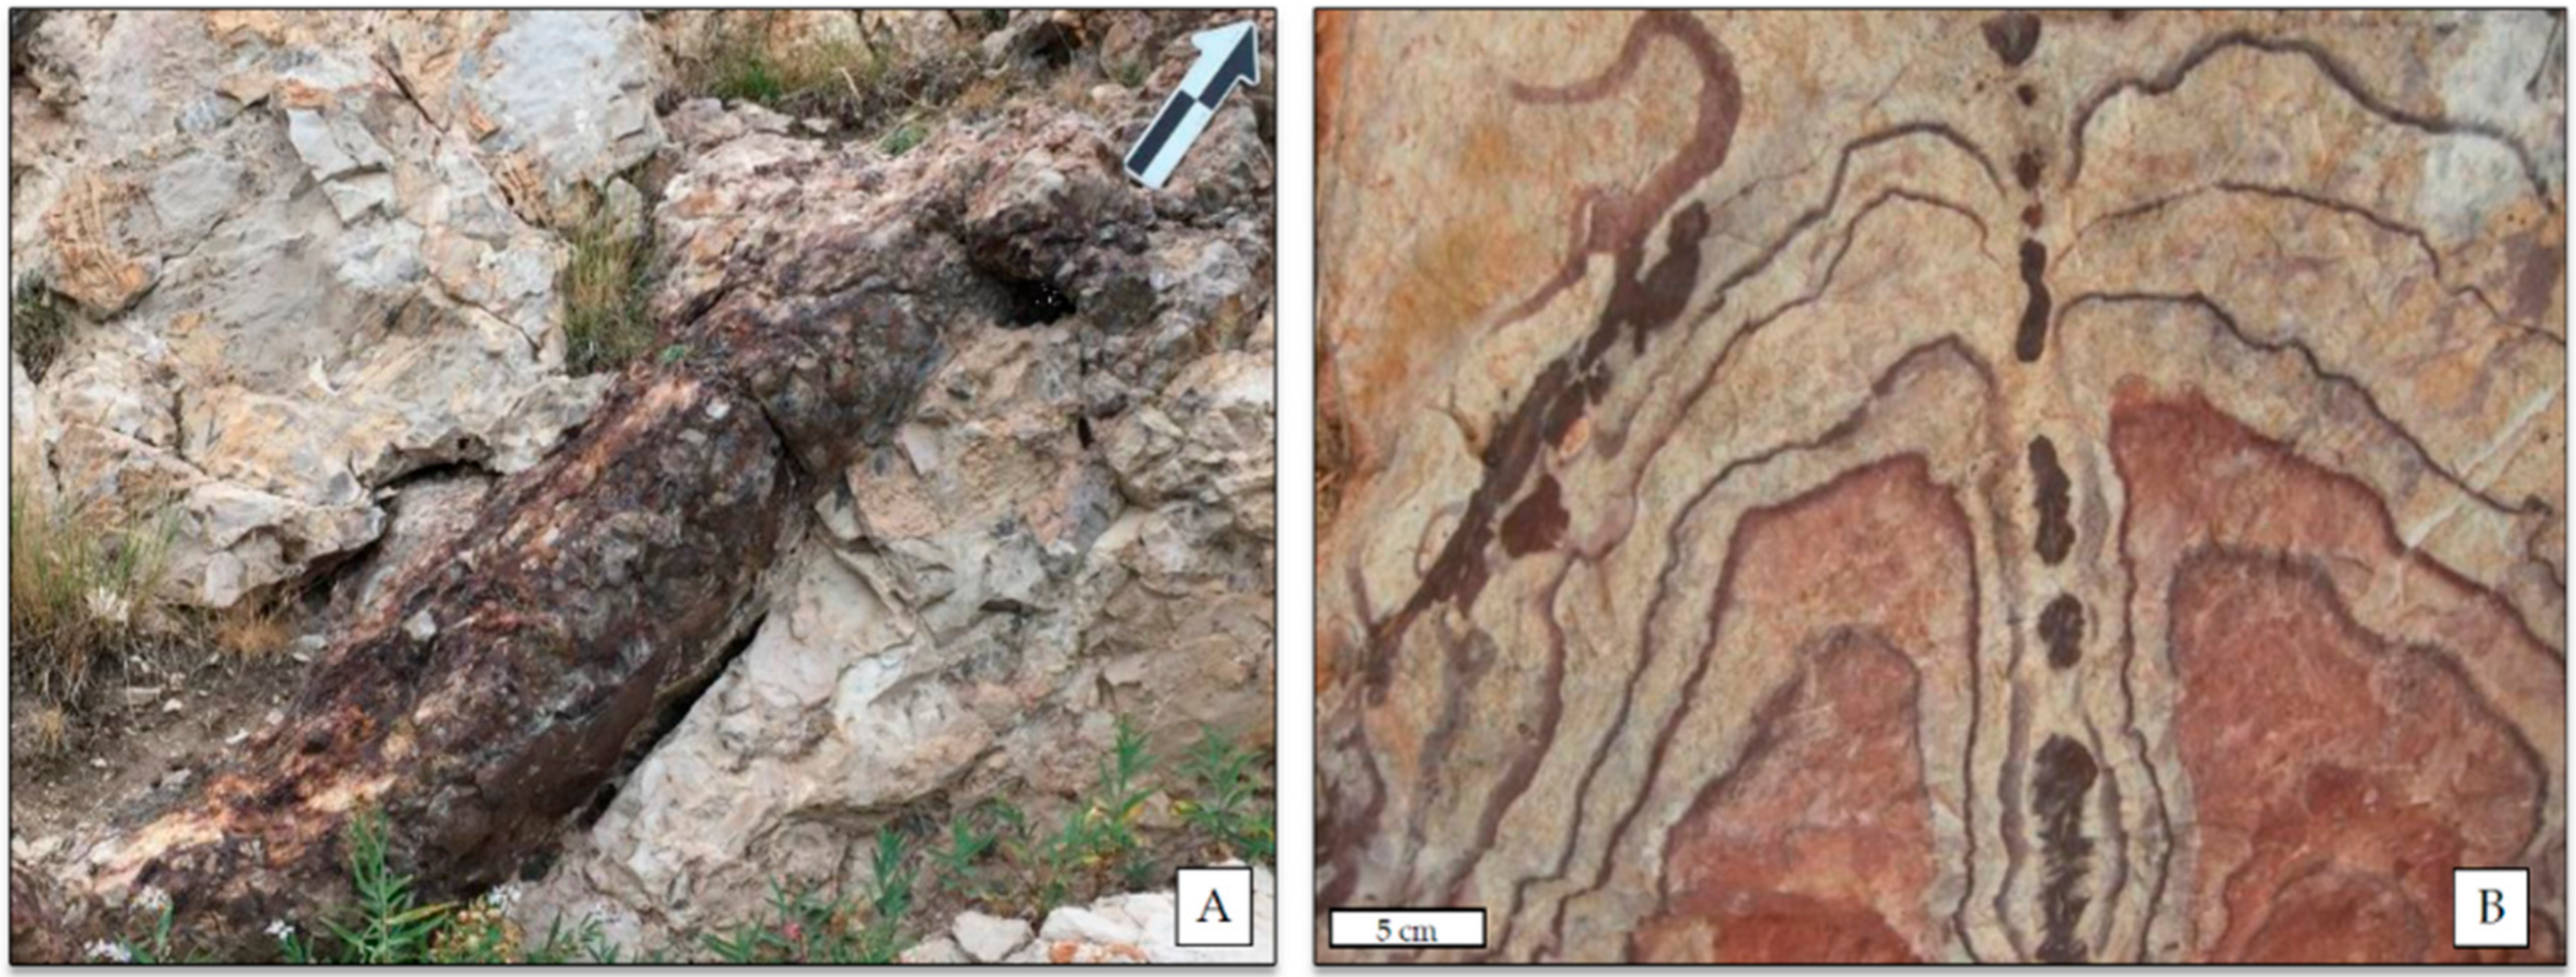
2.4. Mineralization and Alteration
Tectonic Hydrothermal Breccia, PMD
3. Methods
3.1. Field Work
3.2. Mineralogical and Geochemical Characterization
Sample Preparation
4. Results, Mineralogy and Geochemistry
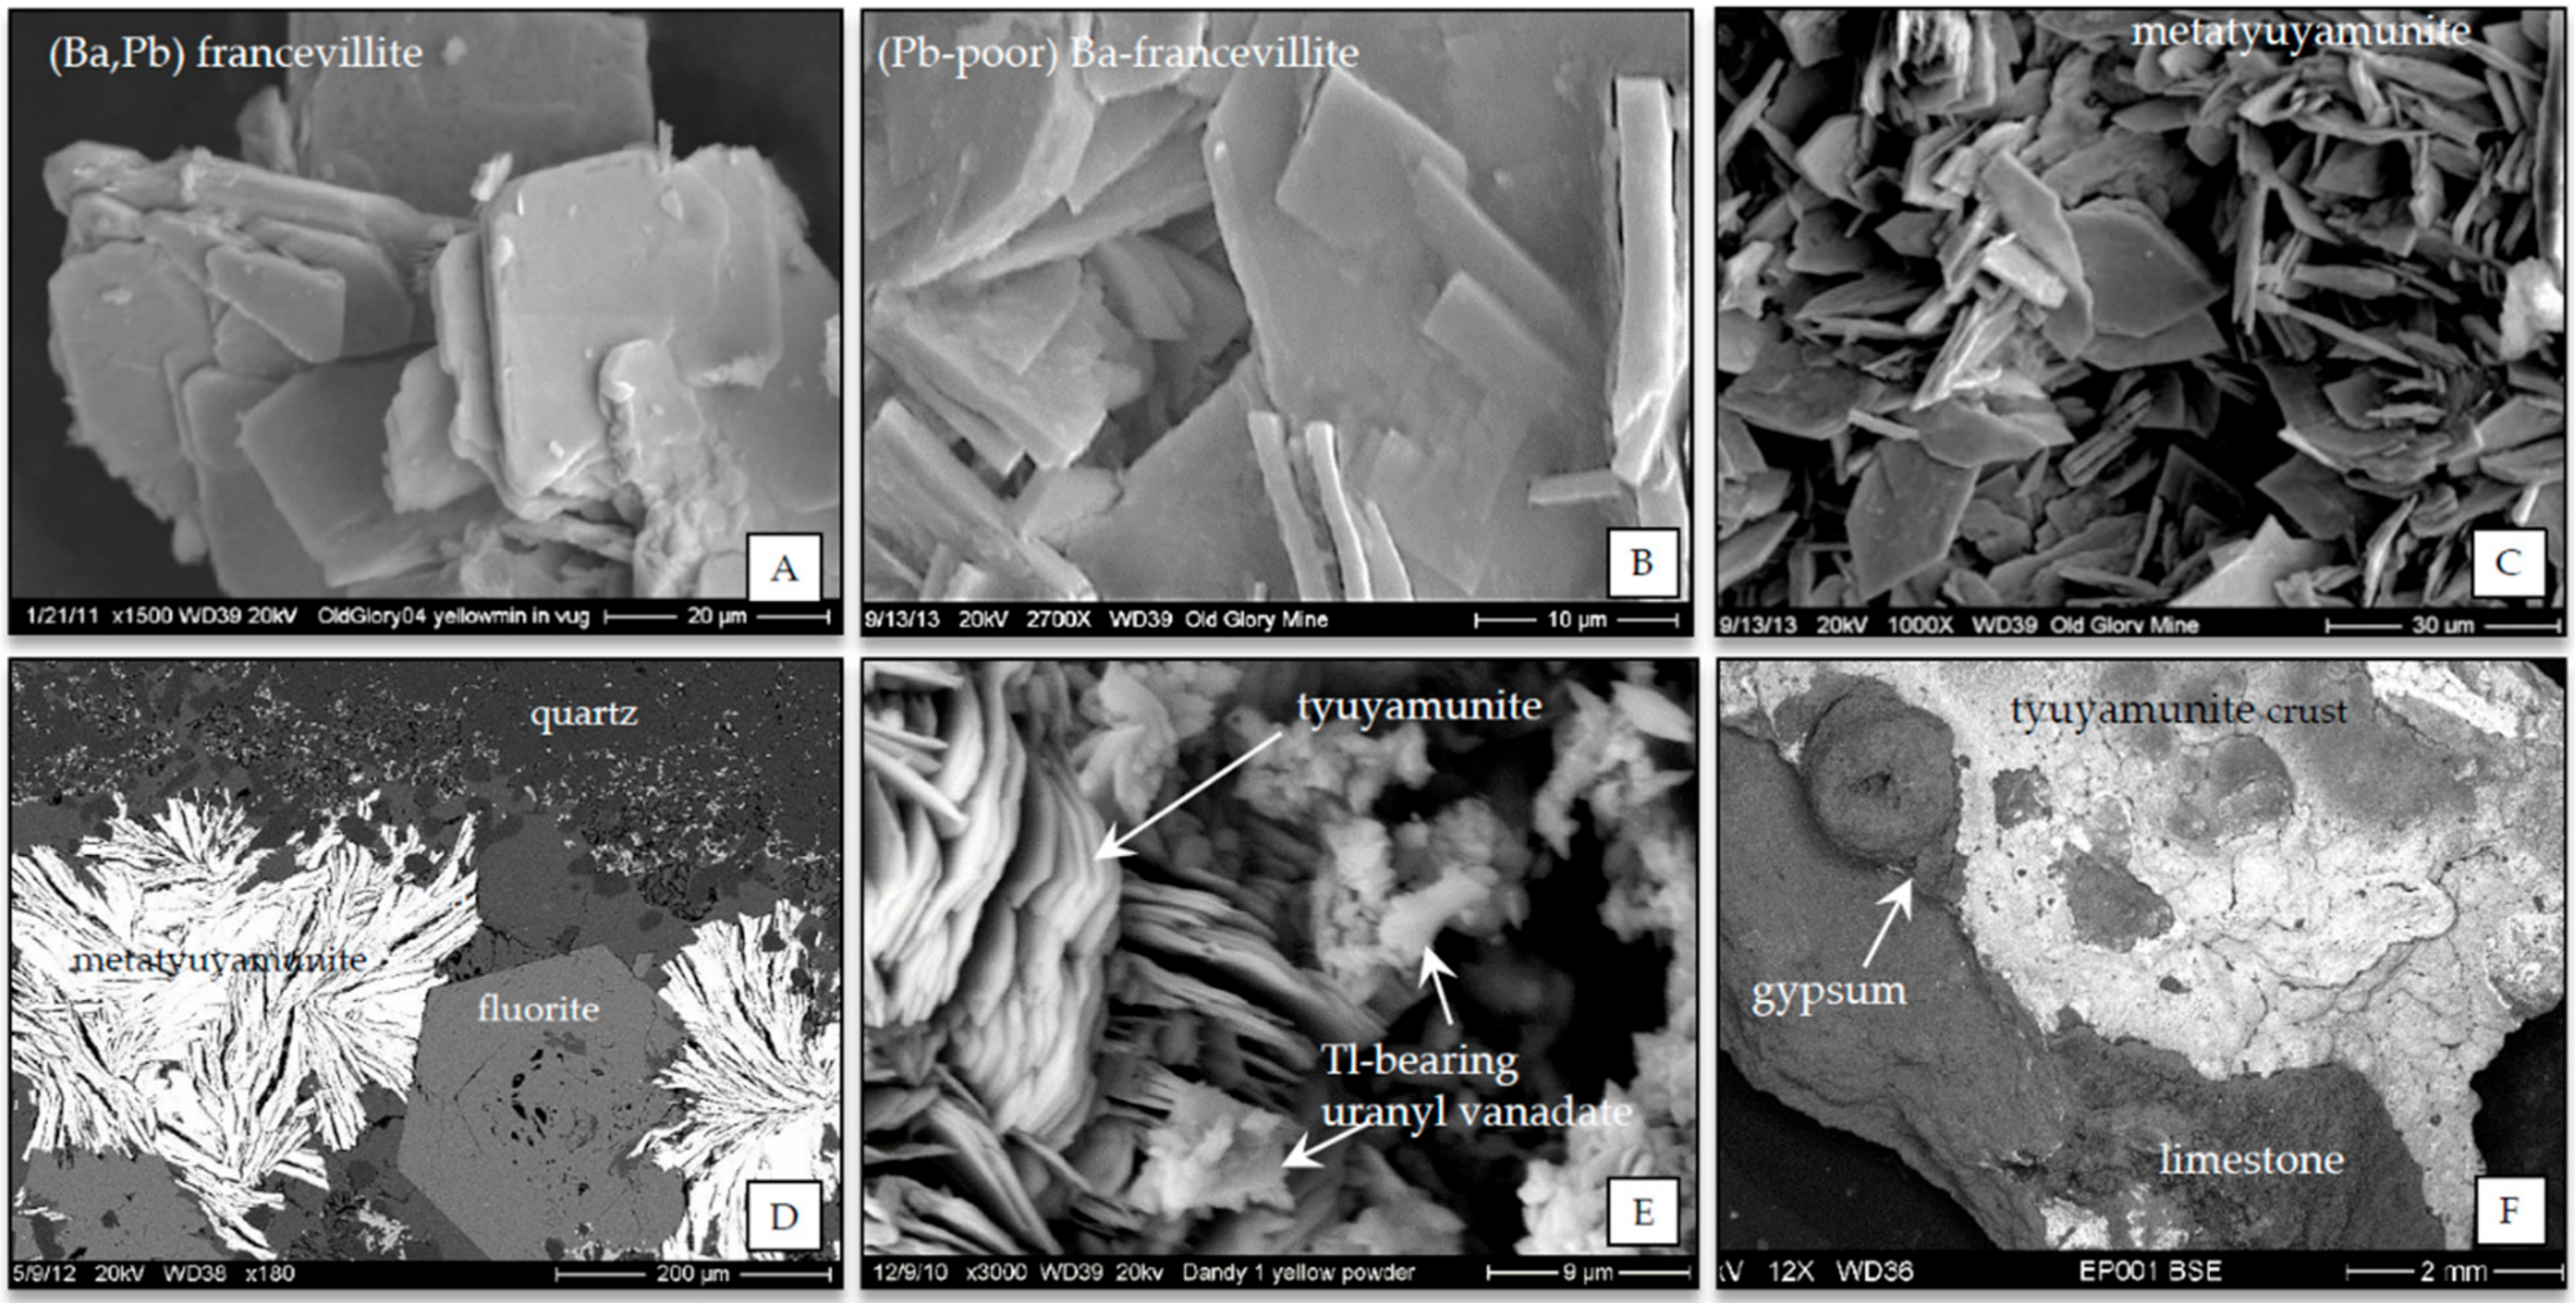
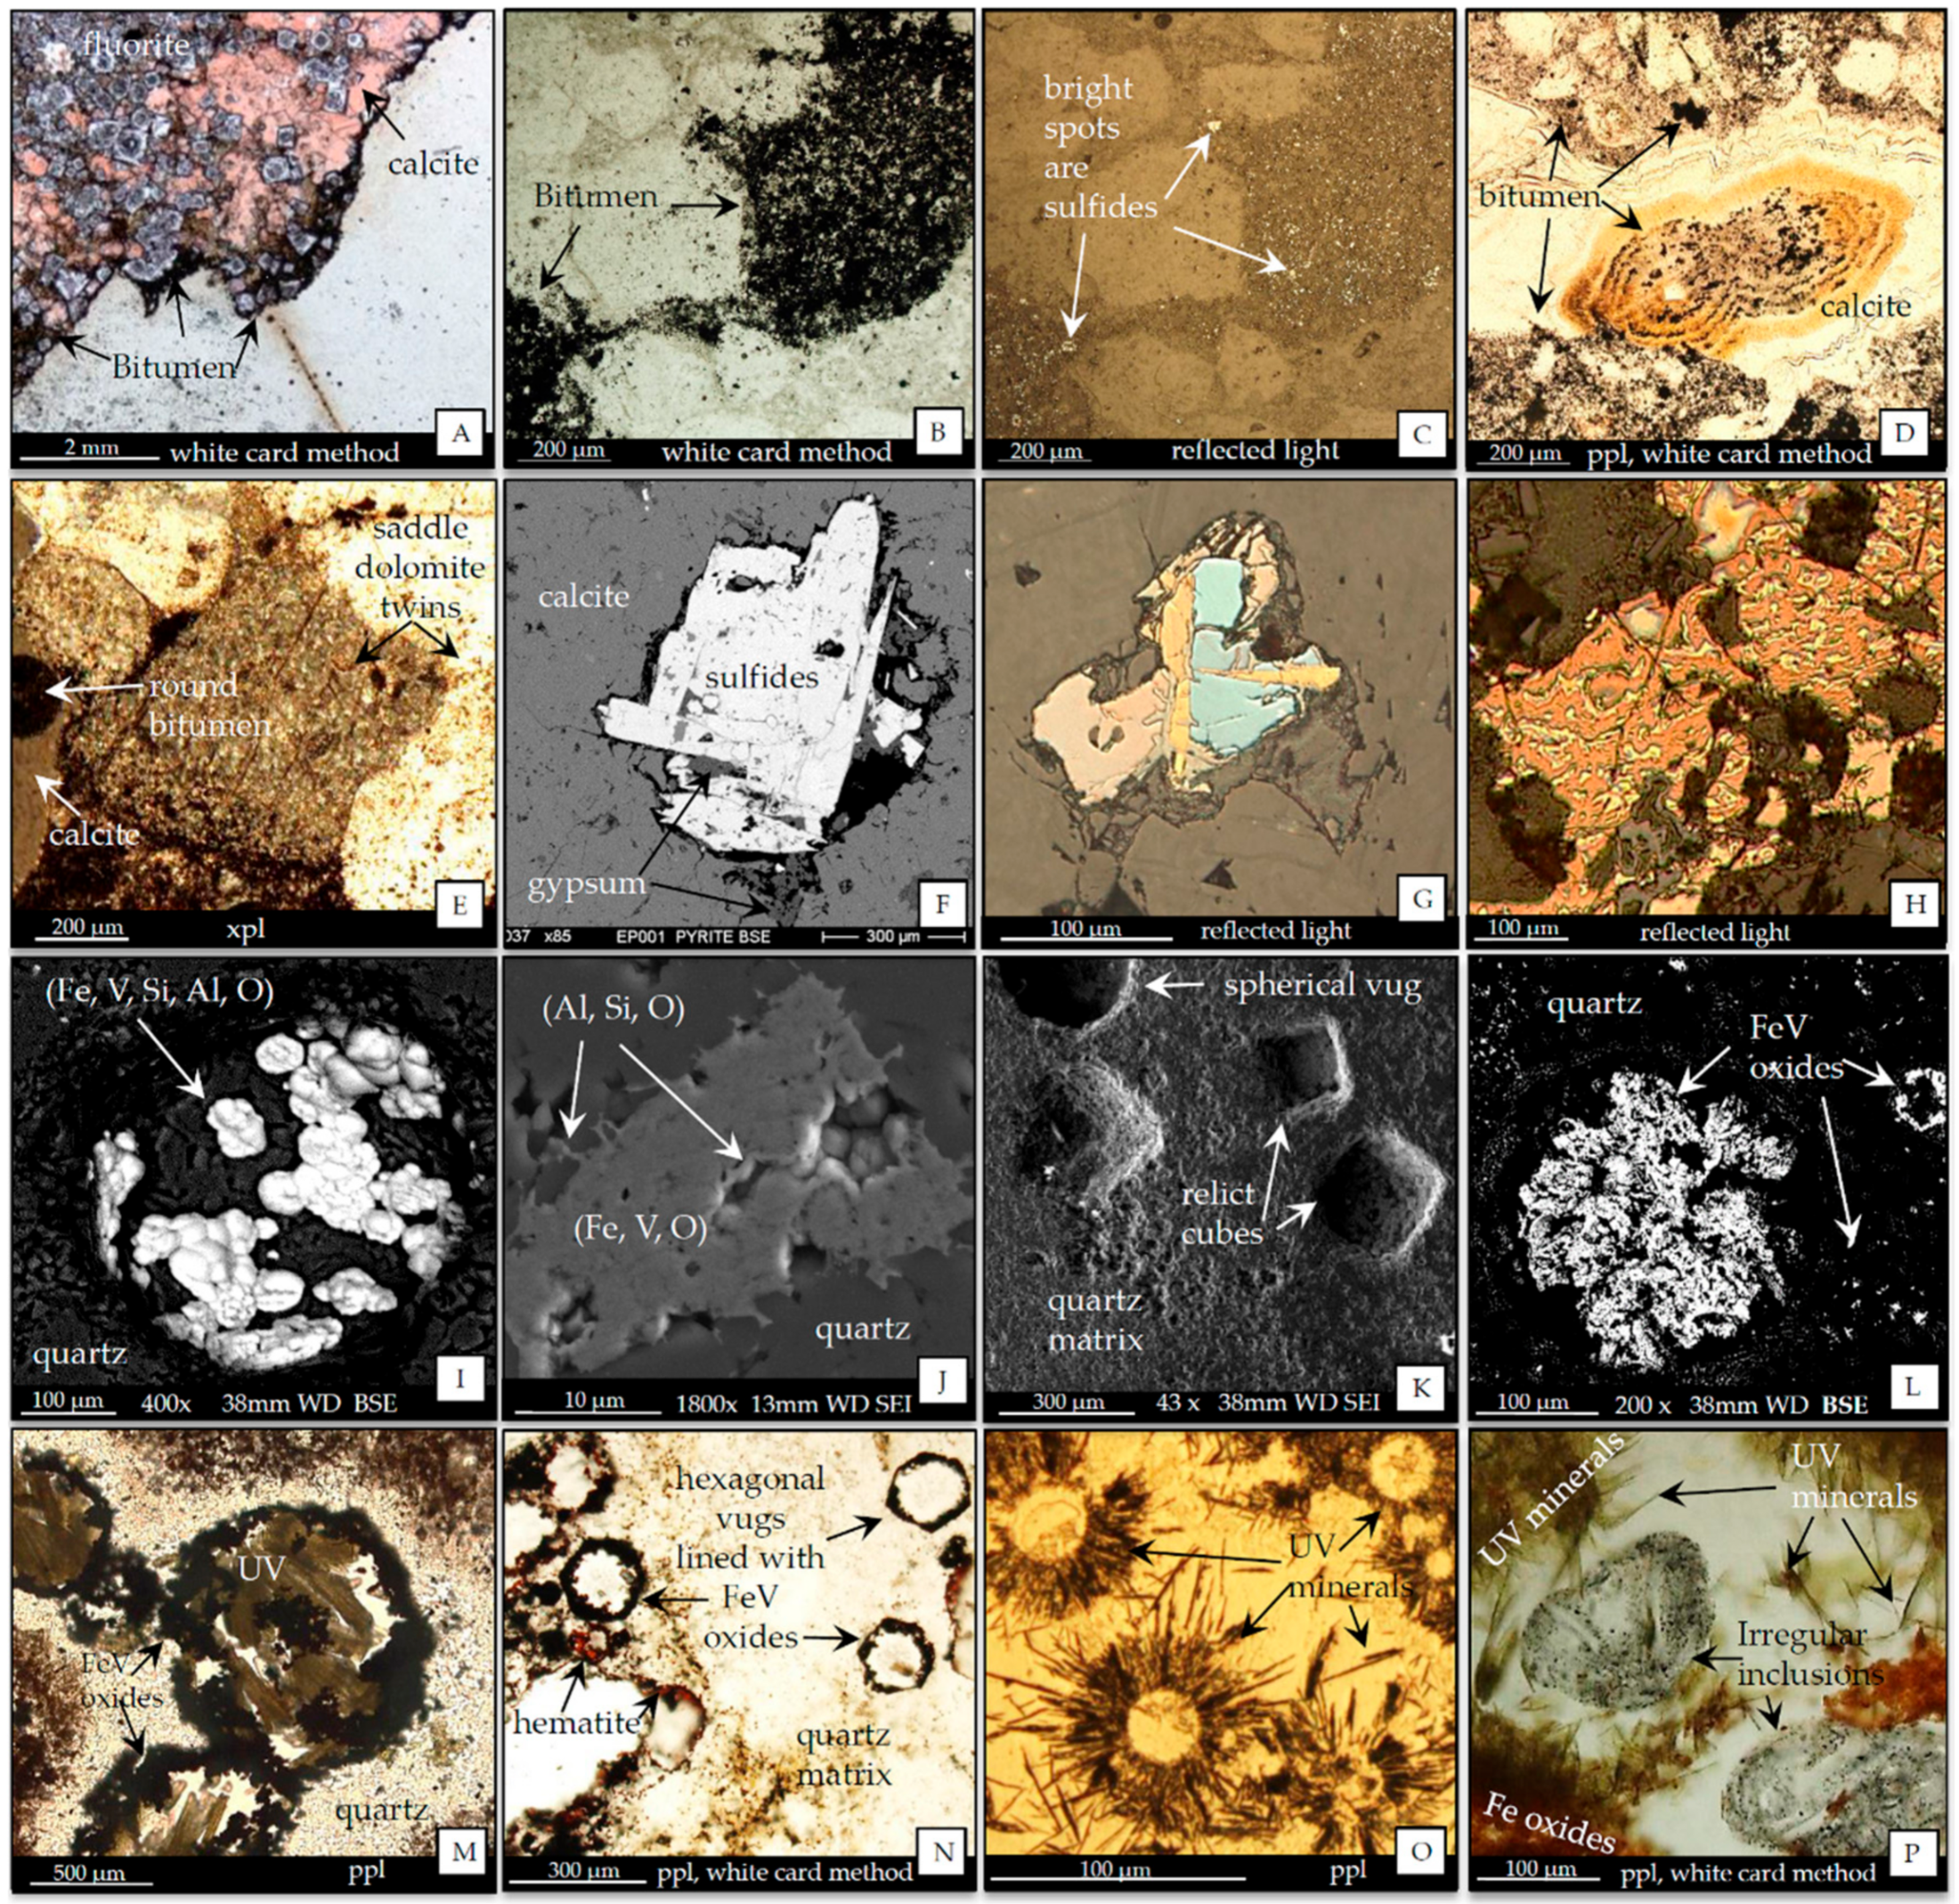
4.1. Mineralogy: Ore and Gangue Minerals
4.1.1. Ore Minerals
4.1.2. Gangue Minerals Associated with Hydrothermal Dolomitization
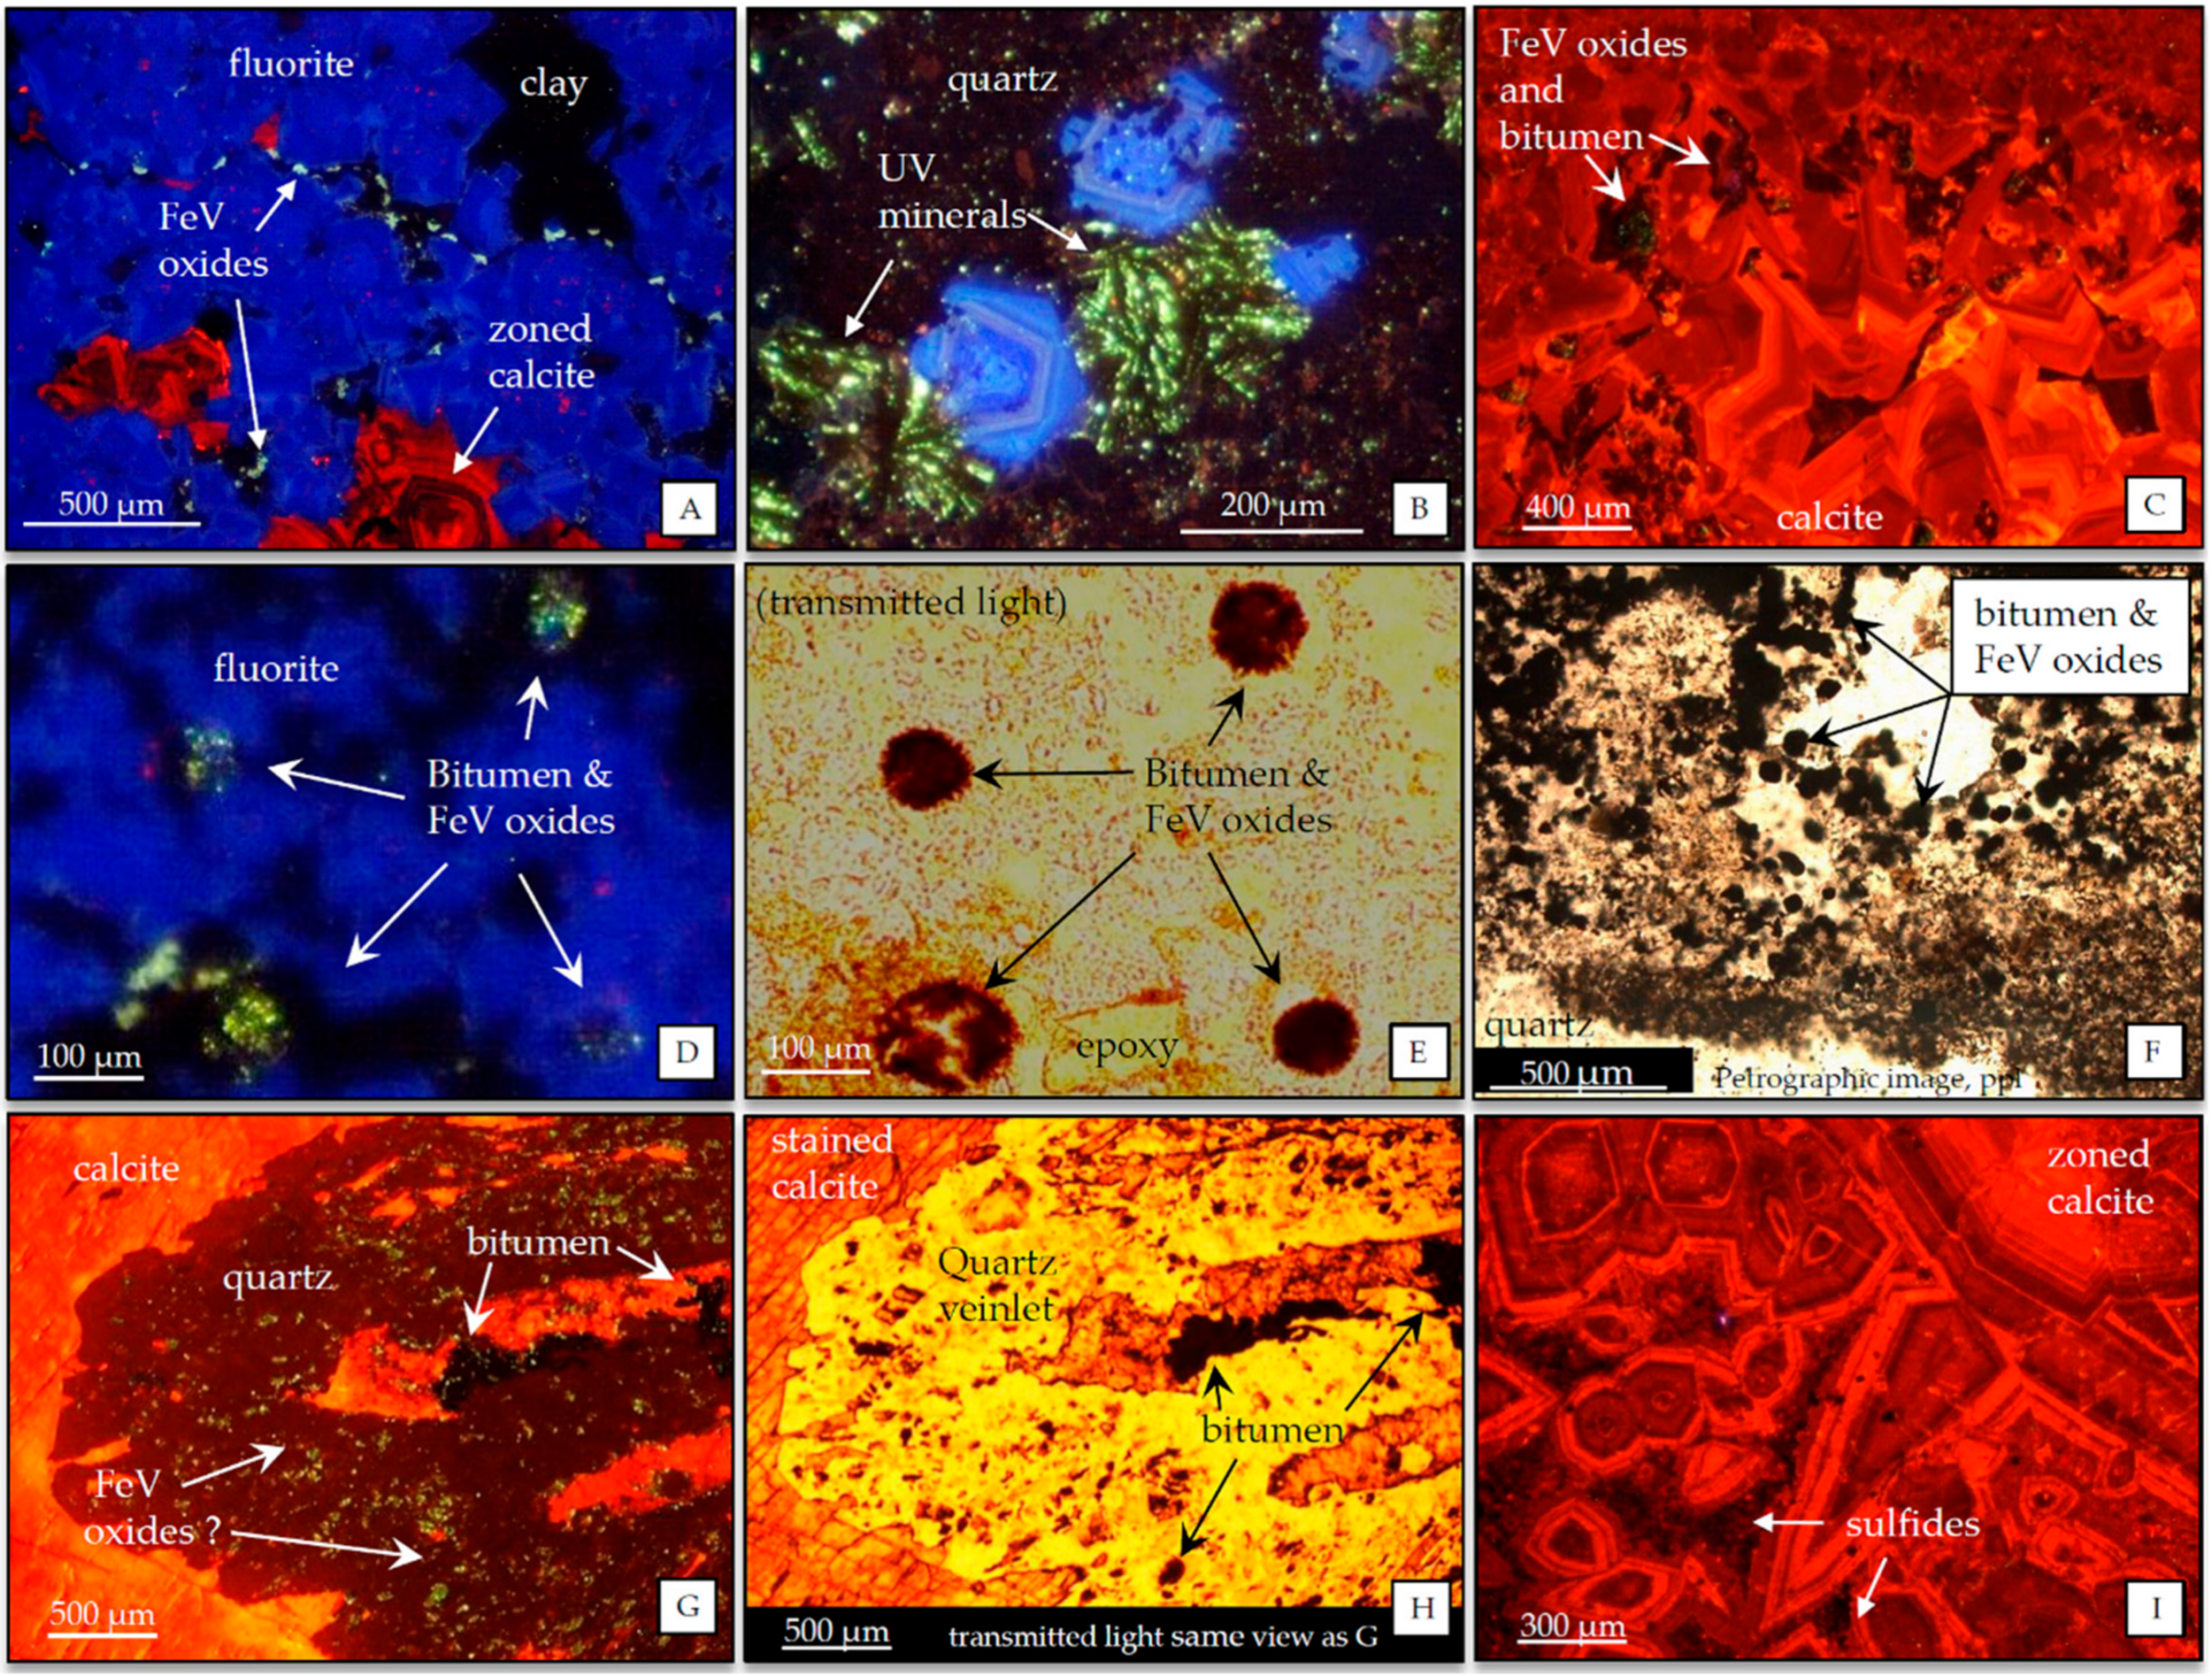
4.1.3. Bitumen, Sulfides, FeV Oxides, and Vugs
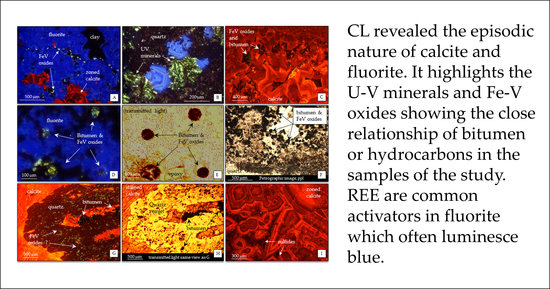
4.2. Cathodoluminescence
4.3. Fluid Inclusions
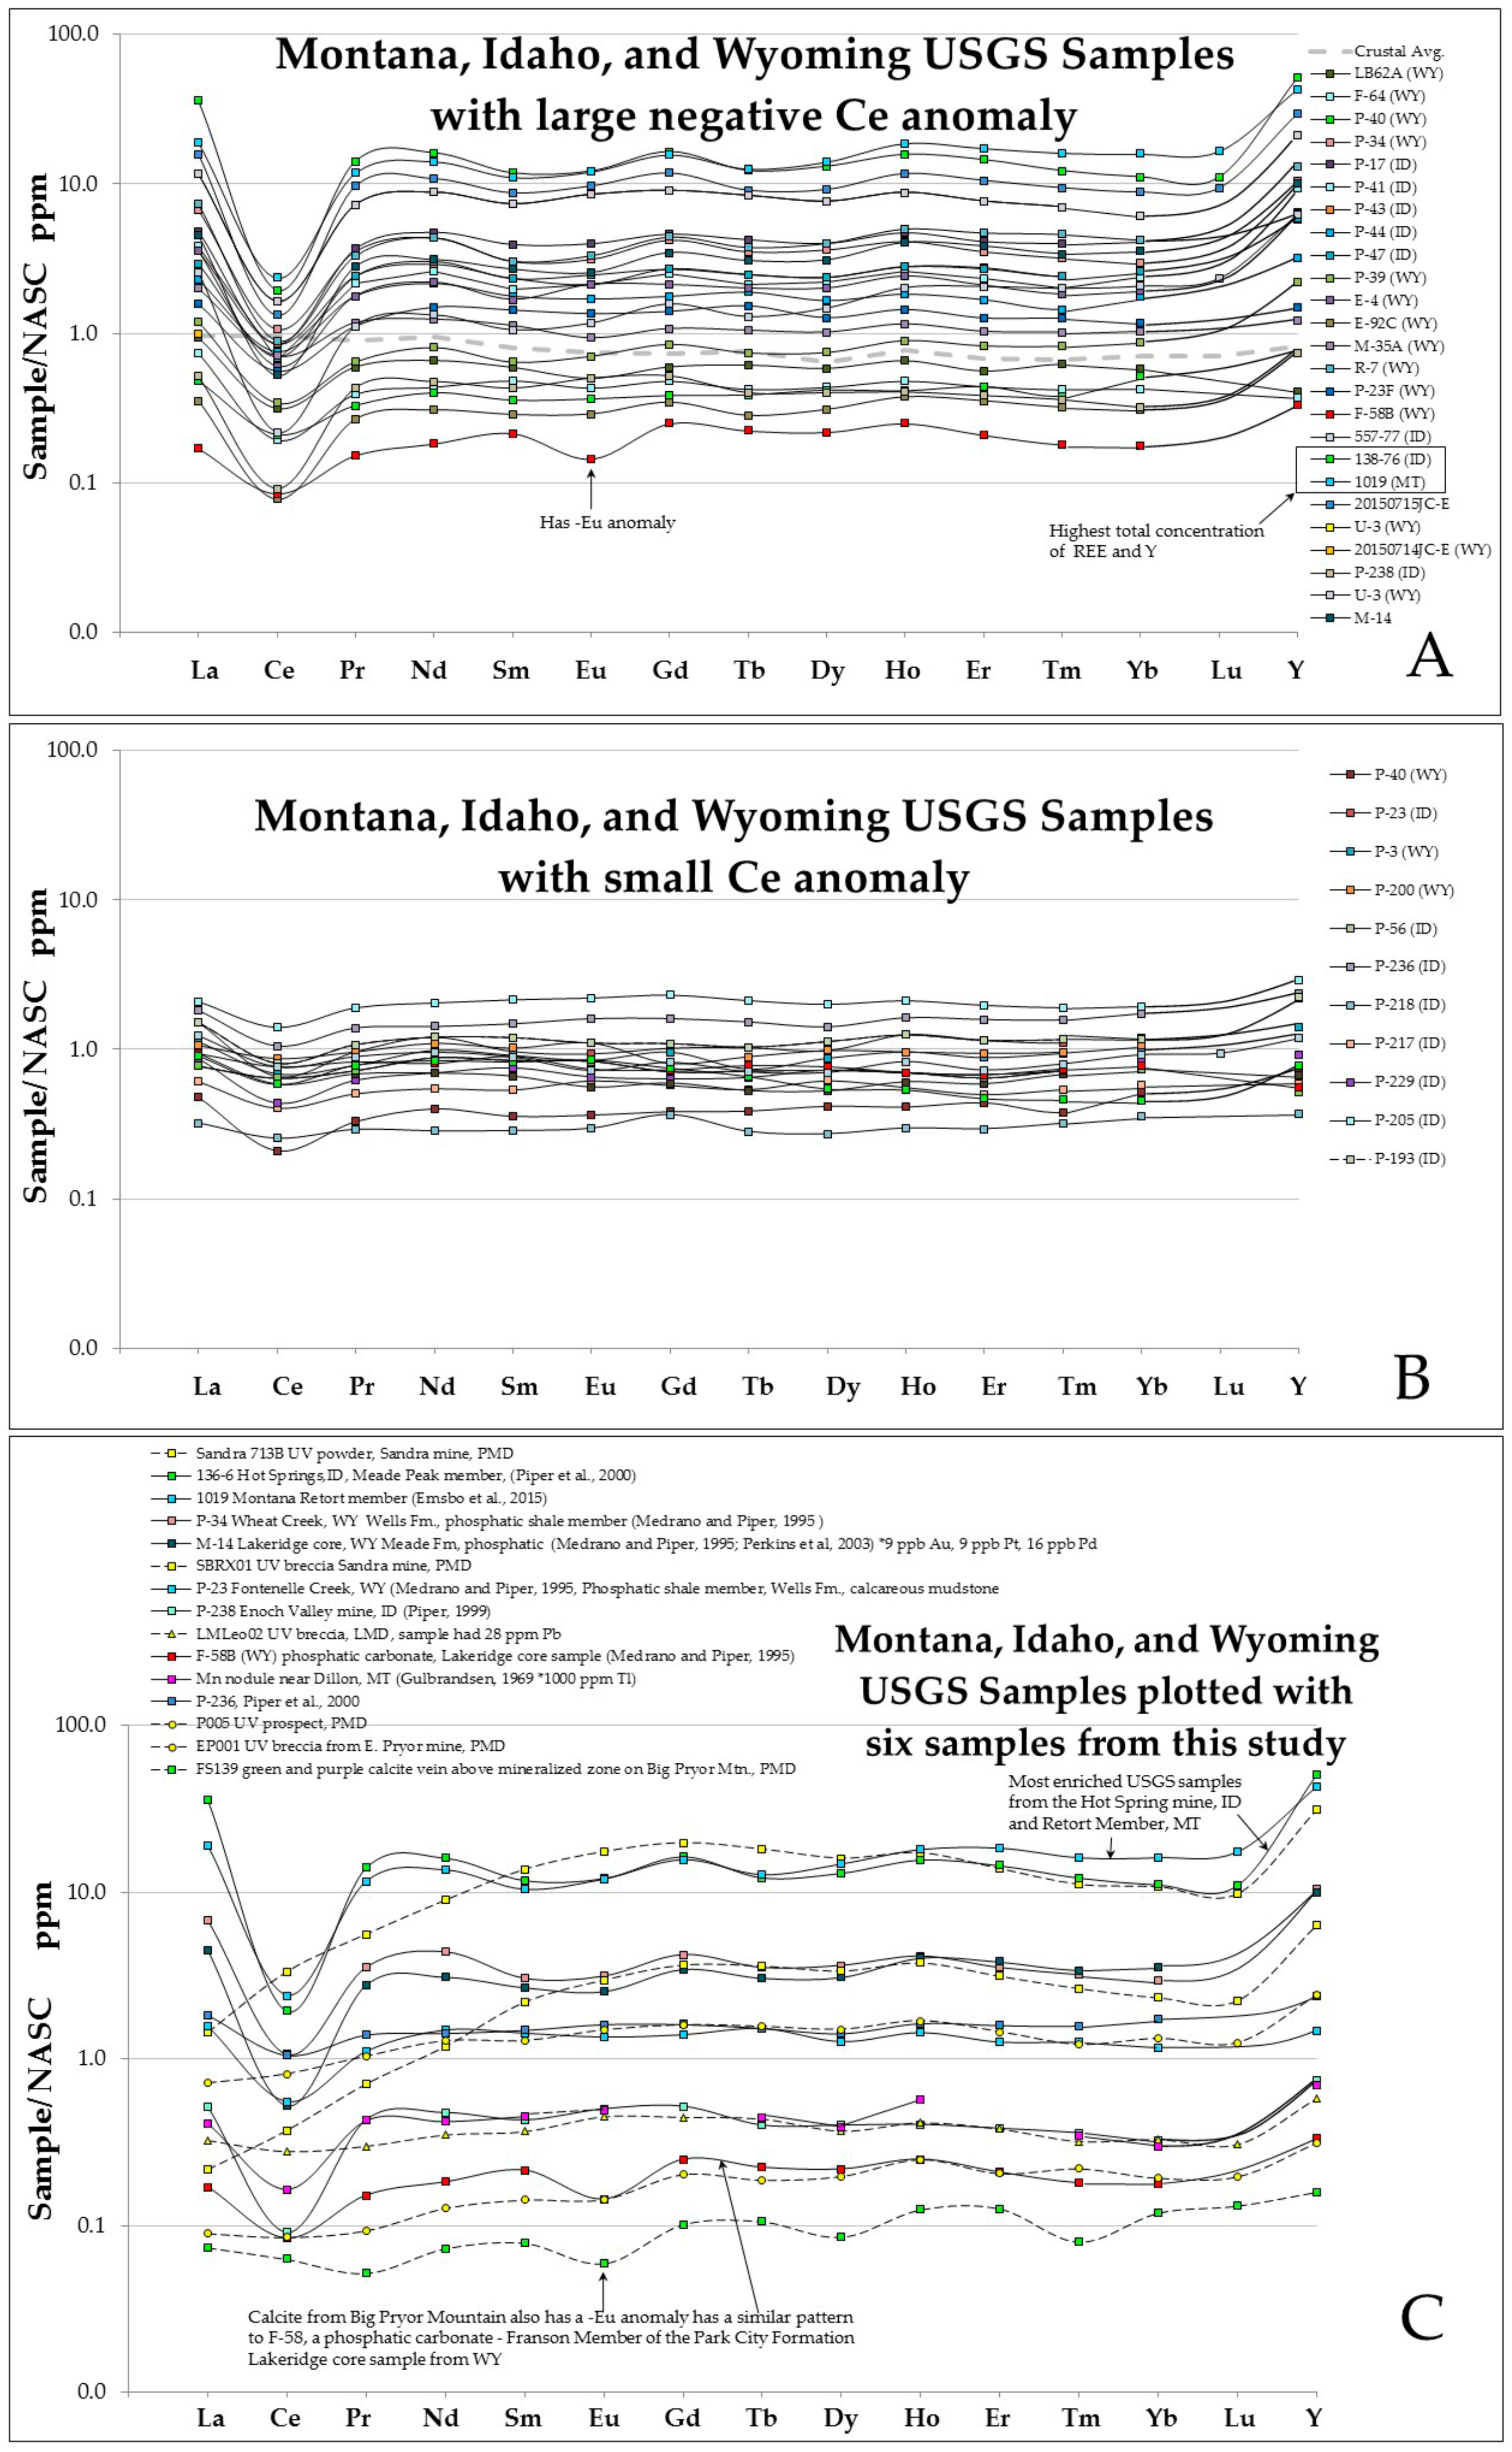
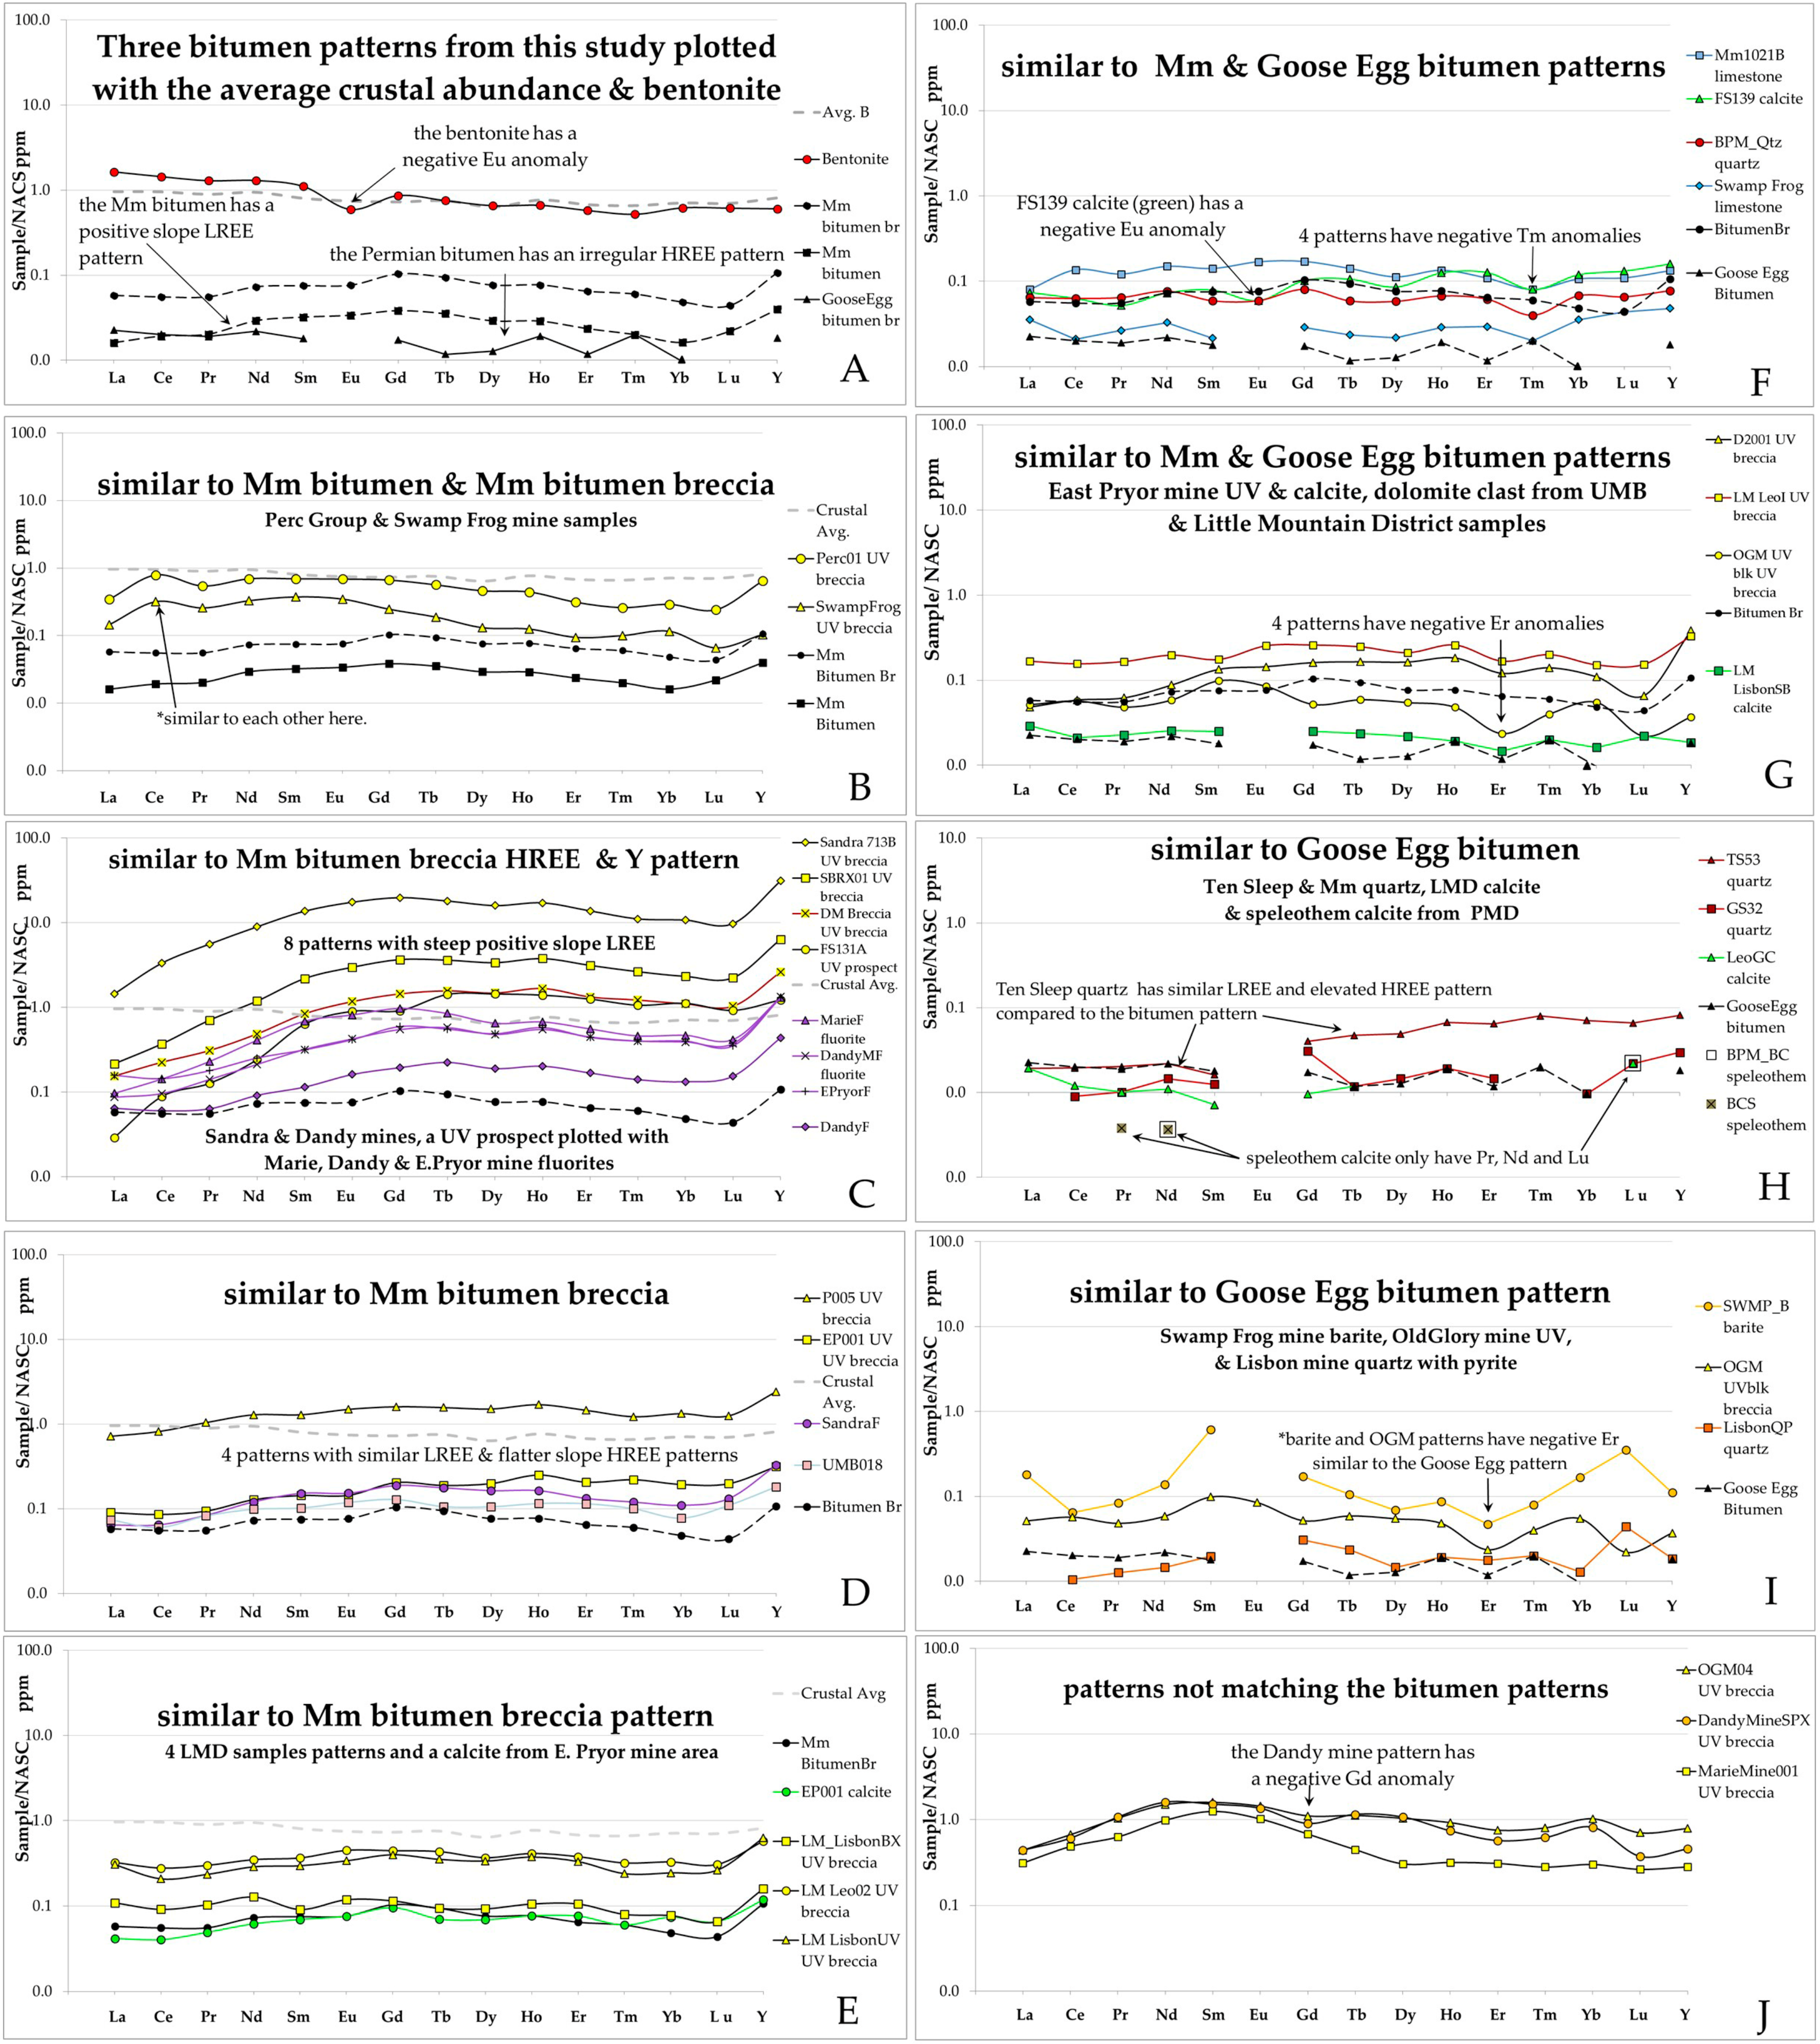
4.4. REE and Geochemical Assay Data
4.4.1. Rare Earth Elements REE Plus Y
4.4.2. REE Analyses of Permian Phosphoria Formation Data
4.4.3. Concentration of Metals in the Phosphoria Formation and in the U-V Deposits
5. Discussion
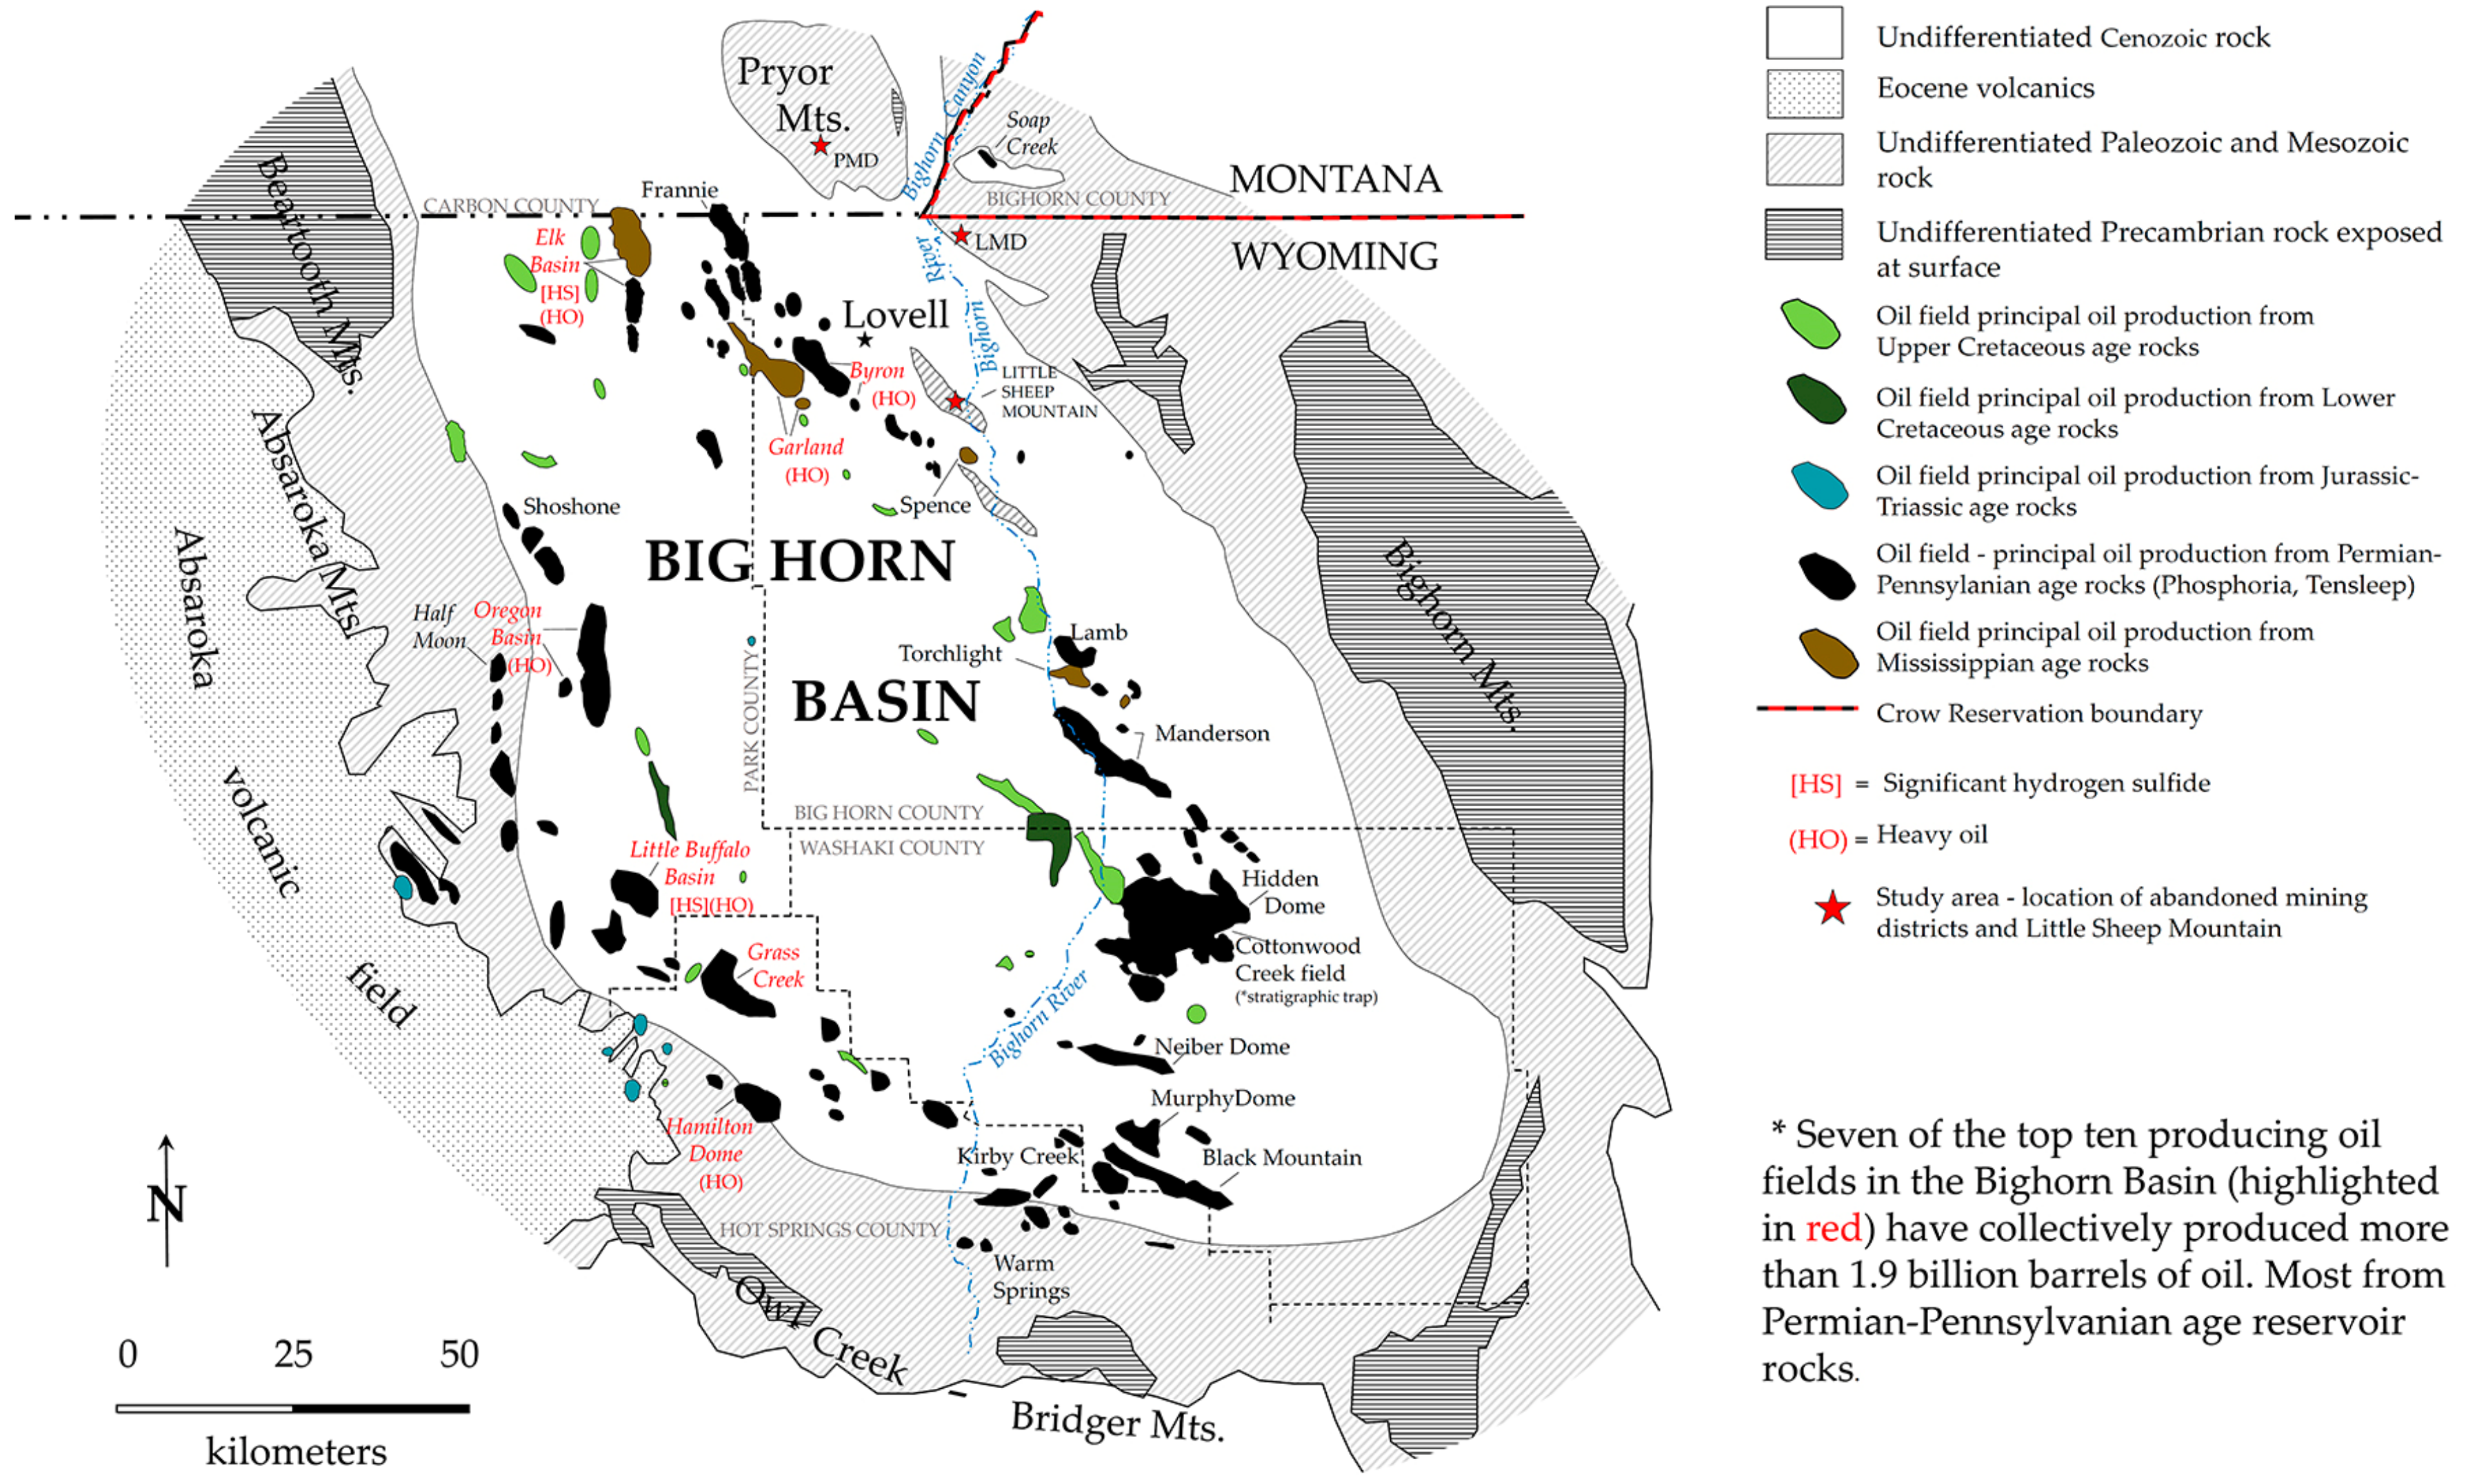
5.1. Phosphoria Oil Migration and Oilfields in the Bighorn Basin
5.2. Origin of Bitumen and Heavy Oil
5.3. Style of Breaching of Oil Traps in the Study Areas
5.4. Paragenesis of U Minerals in the Two Districts
5.4.1. Mineral Paragenesis PMD
- ➢
- ➢
- Gold detected in samples from this study by commercial assays (Appendix A, Table A1) and using the SEM. An abandoned gold lode deposit west of the PMD may have been associated with an intrusion (Figure 1, green symbol).
- ➢
- ➢
- ➢
- Abundant fluorite and barite in the PMD. High concentrations of Ba in the PMD samples with the highest values excluding the barite samples ranging from (5460–6550 ppm).
- ➢
- High silica content of the tectonic breccias, highly fractured zones with white “bull” quartz and a few outcrops or lag deposits of the same, and high silica content (95%) in reported ore during the years that the mines were operating [5].
5.4.2. Mineral Paragenesis LMD
6. Future Directions
6.1. Selective Solid Phase Extraction of U from Contaminated Water
6.2. Elements of Environmental Concern
7. Conclusions and Future Work
Acknowledgments
Author Contributions
Conflicts of Interest
Appendix A

| Element | Sandra713B | DandyF | FS142 | FS131 | OGMB |
|---|---|---|---|---|---|
| U-V-Mineral | Fluorite | Barite | U-V-Mineral | Barite | |
| Pt | <0.020 | <0.020 | na | <0.020 | na |
| Pd | <0.020 | <0.020 | na | <0.020 | na |
| Rh | <0.020 | <0.020 | na | <0.020 | na |
| Au | 0.031 | 0.067 | <0.005 | 0.055 | 2.35 |

| No. | Sample | Ag | As | Ba | Cd | Co | Cr | Cs | Cu | Fe | Ga | Hf | Hg | Li | Mo |
| 1 | FS131A U-V breccia | 1.3 | 262 | 1230 | 1.7 | <1 | <10 | 0.63 | <1 | na | 3.4 | <0.2 | 2.84 | <10 | 53 |
| 2 | LMLisbon U-V breccia | <0.5 | 89 | 42.6 | 0.9 | 9 | <10 | 0.37 | 94 | na | 28.2 | <0.2 | 0.197 | <10 | 25 |
| 3 | Swamp Frog U-V breccia | 1.3 | 556 | 1320 | <0.5 | 1 | 20 | 1.65 | 7 | na | 7.5 | 0.6 | 0.396 | 20 | 791 |
| 4 | SBRX01 U-V breccia | <0.5 | 49 | 5460 | <0.5 | 8 | 100 | 1.64 | 4 | na | 9.5 | <0.2 | 0.333 | 30 | 11 |
| 5 | LMLeo02 U-V breccia | <0.5 | 726 | 255 | 3.8 | 70 | 20 | 0.77 | 109 | na | 43.1 | 0.7 | 0.179 | 10 | 137 |
| 6 | MarieMine001 U-V breccia | <0.5 | 87 | 533 | 2.6 | <1 | 60 | 1.9 | <1 | na | 7.7 | 3.1 | 1.715 | 10 | 319 |
| 7 | Perc01 U-V breccia | <0.5 | 329 | 5170 | <0.5 | <1 | 10 | 1.2 | 6 | na | 8.7 | <0.2 | 1.21 | 10 | 52 |
| 8 | OGM04 U-V breccia | <0.5 | 1295 | 2310 | 0.5 | 7 | 40 | 0.84 | 12 | na | 10.6 | 0.6 | 0.354 | 10 | 152 |
| 9 | P005 U-V breccia | <0.5 | 1080 | 1305 | <0.5 | 9 | 50 | 1.24 | 2 | na | 15.4 | 2.3 | 1.255 | 10 | 386 |
| 10 | Sandra713B U-V breccia | <0.5 | 99 | 6550 | 0.5 | 6 | 240 | 1.63 | 14 | na | 42.1 | <0.2 | 1.485 | 40 | 29 |
| 11 | D2001 U-V breccia | <0.5 | 87 | 79.5 | 3.2 | <1 | <10 | 0.36 | <1 | na | 6 | <0.2 | 6.32 | <10 | 9 |
| 12 | DandyMSPF U-V breccia | <0.5 | 30 | 39.6 | 0.5 | <1 | 10 | 0.24 | <1 | na | 2.2 | <0.2 | 3.4 | <10 | 4 |
| 13 | DandyMBr U-V breccia | <0.5 | 130 | 61.3 | 1.7 | 5 | 10 | 0.78 | <1 | na | 10.4 | 0.2 | 12.8 | 10 | 28 |
| 14 | OGM UV blk U-V breccia | 0.5 | 46 | 1530 | <0.5 | 12 | 10 | 0.78 | 1 | na | 2 | 0.3 | na | <10 | 21 |
| 15 | DandyMSP U-V breccia | <0.5 | 94 | 2470 | <0.5 | 37 | 10 | 5.42 | 5 | na | 4.6 | 0.5 | na | 10 | 20 |
| 16 | EP001 U-V breccia | <0.5 | 50 | 27.6 | 0.9 | 7 | 10 | 0.46 | 2 | na | 1.7 | 0.4 | na | <10 | 2 |
| 17 | LMLeoIncline U-V breccia | <0.5 | 116 | 183 | 2.1 | 22 | 10 | 0.21 | 90 | na | 11.8 | 0.3 | na | <10 | 98 |
| 18 | LMLisbonBX U-V breccia | <0.5 | 212 | 140 | 0.6 | 22 | 10 | 0.66 | 17 | na | 9.3 | 0.4 | na | <10 | 93 |
| 19 | LMLisbonSB shatter breccia | na | na | 4330 | na | na | 10 | 0.14 | na | na | 0.7 | <0.2 | na | na | na |
| 20 | EP001DB dark breccia | na | na | 29.2 | na | na | 20 | 0.36 | na | na | 1.2 | 0.2 | na | na | na |
| 21 | SWMP_H host limestone | na | na | 9.7 | na | na | 10 | 0.11 | na | na | 0.6 | <0.2 | na | na | na |
| 22 | Sandra002 limestone | na | na | 23.2 | na | na | 10 | 0.05 | na | na | 0.8 | <0.2 | na | na | na |
| 23 | UMB018 silicified breccia | na | na | 6.5 | na | na | 10 | 0.02 | na | na | 1 | <0.2 | na | na | na |
| 24 | FS139 calcite | na | na | 16.5 | na | na | 10 | 0.05 | na | na | 0.5 | 0.2 | na | na | na |
| 25 | BPM_BC speleothem calcite | na | na | 46.9 | na | na | <10 | 0.02 | na | na | 0.3 | <0.2 | na | na | na |
| 26 | BCS speleothem calcite | <0.5 | <5 | 24 | <0.5 | 9 | <10 | 0.03 | 3 | na | 0.3 | <0.2 | 0.034 | <10 | 2 |
| 27 | LeoGC calcite | na | na | 24.2 | na | na | <10 | 0.02 | na | na | 1 | <0.2 | na | na | na |
| 28 | Dandy Mine fluorite | <0.5 | 22 | 29.7 | <0.5 | 3 | 10 | 0.17 | <1 | na | 1.1 | <0.2 | 0.618 | <10 | 8 |
| 29 | MarieF fluorite | <0.5 | 64 | 72 | 0.5 | 8 | 20 | 0.37 | <1 | na | 2.4 | 0.2 | 1.05 | 10 | 10 |
| 30 | EPryorF fluorite | na | na | 729 | na | na | 40 | 0.51 | na | na | 2.1 | 0.3 | na | na | na |
| 31 | DandyF fluorite | na | na | 331 | na | na | 30 | 0.5 | na | na | 2 | 0.3 | na | na | na |
| 32 | SandraF fluorite | na | na | 9.7 | na | na | 10 | 0.15 | na | na | 1 | <0.2 | na | na | na |
| 33 | SWMP_B barite | na | na | >10,000 | na | na | 20 | 0.47 | na | na | 2.1 | 0.4 | na | na | na |
| 34 | Lisbon001-dolomite breccia | <0.5 | <5 | 200 | <0.5 | 3 | 20 | 1.65 | 1 | na | 3.7 | 1 | 0.02 | 10 | 2 |
| 35 | LisbonQP quartz w/pyrite | <0.5 | <5 | 87.5 | <0.5 | 18 | <10 | 0.05 | 1 | na | 1 | <0.2 | 0.095 | <10 | 1 |
| 36 | GS32 quartz | na | na | 264 | na | na | 10 | 0.04 | na | na | 1.2 | <0.2 | na | na | na |
| 37 | TS-53 quartz | na | na | 562 | na | na | <10 | 0.14 | na | na | 1.1 | 0.2 | na | na | na |
| 38 | Bentonite | <0.5 | 6 | 597 | <0.5 | 3 | <10 | 0.86 | 2 | na | 24 | 7.8 | <0.005 | 20 | 1 |
| 39 | Mm hosted bitumen | 0.05 | 0.2 | 10 | 0.05 | 9.9 | 1 | 0.06 | 3 | 300 | <0.05 | <0.02 | 0.01 | 0.5 | 1.63 |
| 40 | Mm breccia hosted bitumen | 0.01 | <0.1 | 20 | 0.1 | 0.9 | <1 | <0.05 | 1.2 | 500 | <0.05 | <0.02 | <0.01 | 0.1 | 0.12 |
| 41 | Goose Egg hosted bitumen | 0.01 | 1 | 630 | 0.08 | 2.4 | 1 | 0.06 | 2.8 | 800 | 0.21 | <0.02 | 0.01 | 2.2 | 0.46 |
| No. | Sample | Pb | Rb | Sc | Se | Sn | Sr | Ta | Th | Tl | U | V | W | Zn | Zr |
| 1 | FS131A U-V breccia | <2 | 1.5 | 4 | na | <1 | 257 | <0.1 | 0.66 | 180 | 86,800 | 18,900 | 94 | 16 | 4 |
| 2 | LMLisbon U-V breccia | 146 | 5.9 | 1 | na | 4 | 261 | <0.1 | 0.09 | 30 | 31,100 | 8520 | 11 | 1300 | 2 |
| 3 | Swamp Frog U-V breccia | <2 | 13 | 3 | na | 1 | 192.5 | 0.1 | 1.3 | 340 | 6100 | 4160 | 81 | 44 | 23 |
| 4 | SBRX01 U-V breccia | 7 | 4.4 | 8 | na | <1 | 182.5 | <0.1 | 0.16 | 10 | 2600 | 1950 | 71 | 136 | 2 |
| 5 | LMLeo02 U-V breccia | 57 | 5.5 | 2 | na | 7 | 401 | 0.1 | 1.27 | 230 | 16,000 | 10,300 | 11 | 2230 | 29 |
| 6 | MarieMine001 U-V breccia | <2 | 18.1 | 6 | na | 1 | 62.5 | 0.2 | 6.57 | 30 | 2100 | 6740 | 40 | 57 | 128 |
| 7 | Perc01 U-V breccia | 51 | 3 | 12 | na | <1 | 227 | <0.1 | 0.24 | 170 | 20,700 | 6700 | 30 | 95 | 4 |
| 8 | OGM04 U-V breccia | 13 | 4.8 | 9 | na | 1 | 1355 | 0.1 | 1.12 | 100 | 10,600 | 4410 | 105 | 26 | 22 |
| 9 | P005 U-V breccia | 18 | 9.7 | 9 | na | 2 | 980 | 0.4 | 6.12 | 340 | 9000 | 6010 | 19 | 165 | 91 |
| 10 | Sandra713B U-V breccia | 44 | 14.8 | 39 | na | 1 | 188.5 | <0.1 | 0.55 | 20 | 21,400 | 8730 | 24 | 804 | 4 |
| 11 | D2001 U-V breccia | 35 | 2 | 1 | na | 1 | 132.5 | <0.1 | 0.15 | 50 | 17,700 | 6310 | 16 | 849 | 2 |
| 12 | DandyMSPF U-V breccia | 8 | 2.7 | 2 | na | <1 | 128 | <0.1 | 0.25 | 10 | 3000 | 3320 | 12 | 76 | 5 |
| 13 | DandyMBr U-V breccia | 55 | 6.4 | 4 | na | <1 | 147.5 | <0.1 | 0.5 | 20 | 28,100 | 10,500 | 26 | 1110 | 10 |
| 14 | OGM UV blk U-V breccia | 2 | 6.4 | 1 | na | <1 | 110 | 0.1 | 0.36 | 50 | 4900 | 1240 | 107 | 7 | 12 |
| 15 | DandyMSP U-V breccia | 35 | 31.5 | 5 | na | 6 | 513 | 0.3 | 0.94 | 490 | 8600 | 2220 | 382 | 9 | 20 |
| 16 | EP001 U-V breccia | 11 | 6.7 | 2 | na | <1 | 84.7 | <0.1 | 0.63 | 10 | 907 | 25 | 6 | 143 | 18 |
| 17 | LMLeoIncline U-V breccia | 28 | 2.4 | 1 | na | 10 | 168.5 | <0.1 | 0.73 | 20 | >1000 | 4330 | 13 | 970 | 16 |
| 18 | LMLisbonBX U-V breccia | 4 | 5.5 | 1 | na | 10 | 151.5 | <0.1 | 0.55 | 10 | 1300 | 1850 | 12 | 569 | 15 |
| 19 | LMLisbonSB shatter breccia | na | 2.3 | na | na | <1 | 191 | 0.1 | 0.19 | na | 32.7 | 164 | 13 | na | 4 |
| 20 | EP001DB dark breccia | na | 4.5 | na | na | <1 | 105 | 0.1 | 0.35 | na | 407 | 28 | 28 | na | 7 |
| 21 | SWMP_H host limestone | na | 1.5 | na | na | <1 | 108 | <0.1 | 0.15 | na | 3.07 | 7 | 10 | na | 5 |
| 22 | Sandra002 limestone | na | 0.5 | na | na | <1 | 158.5 | <0.1 | 0.1 | na | 0.52 | 6 | 4 | na | 4 |
| 23 | UMB018 silicified breccia | na | 0.2 | na | na | <1 | 63.5 | <0.1 | <0.05 | na | 3.02 | 12 | 23 | na | <2 |
| 24 | FS139 calcite | na | 0.9 | na | na | <1 | 97.8 | <0.1 | 0.15 | na | 25.1 | 123 | 10 | na | 11 |
| 25 | BPM_BC speleothem calcite | na | <0.2 | na | na | <1 | 43.2 | <0.1 | <0.05 | na | 14.8 | <5 | 4 | na | <2 |
| 26 | BCS speleothem calcite | 2 | 0.2 | <1 | na | <1 | 590 | 0.1 | <0.05 | <10 | 43.3 | 20 | 47 | 15 | <2 |
| 27 | LeoGC green calcite | na | 0.5 | na | na | <1 | 174.5 | <0.1 | 0.09 | na | 159 | 268 | 9 | na | 2 |
| 28 | Dandy Mine fluorite | 3 | 1.7 | 3 | na | 1 | 26.1 | <0.1 | 0.66 | <10 | 518 | 439 | 14 | 41 | 5 |
| 29 | MarieF fluorite | 3 | 3.8 | 3 | na | 1 | 33.7 | 0.1 | 0.7 | <10 | 842 | 871 | 25 | 65 | 7 |
| 30 | EPryorF fluorite | na | 8.2 | na | na | <1 | 132 | 0.1 | 1.14 | na | 87.7 | 51 | 23 | na | 13 |
| 31 | DandyF fluorite | na | 7.7 | na | na | <1 | 44.1 | 0.1 | 0.65 | na | 105 | 542 | 18 | na | 11 |
| 32 | SandraF fluorite | na | 2 | na | na | <1 | 52.4 | <0.1 | 0.67 | na | 53.4 | 655 | 1 | na | 4 |
| 33 | SWMP_B barite | na | 5.6 | na | na | 1 | 8260 | 0.1 | 1.15 | na | 15.2 | 195 | 11 | na | 14 |
| 34 | Lisbon001 dolomite breccia | 2 | 25.9 | 2 | na | <1 | 116.5 | 0.2 | 2.09 | <10 | 6.75 | 25 | 11 | 17 | 42 |
| 35 | LisbonQP quartz w/pyrite | <2 | 1.2 | <1 | na | <1 | 14.2 | 0.2 | 0.09 | <10 | 1.34 | <5 | 199 | <2 | 3 |
| 36 | GS32 quartz | na | 0.5 | na | na | <1 | 12.2 | 0.1 | 0.06 | na | 27.7 | 17 | 209 | na | 6 |
| 37 | TS-53 quartz | na | 1.4 | na | na | <1 | 33.7 | 0.2 | 0.21 | na | 25.3 | 26 | 279 | na | 12 |
| 38 | Bentonite | 32 | 20.1 | 2 | na | 7 | 381 | 2.3 | 32.1 | <10 | 56.7 | 22 | 6 | 64 | 245 |
| 39 | Mm hosted bitumen | 0.9 | 0.4 | 0.1 | 3.2 | 3.2 | 76.4 | <0.01 | <0.2 | 0.02 | 6.8 | 73 | 8.63 | 5 | <0.5 |
| 40 | Mm breccia hosted bitumen | 0.5 | 0.1 | 0.1 | 0.5 | 0.5 | 156 | <0.01 | <0.2 | <0.02 | 4.04 | 7 | 2.38 | 2 | <0.5 |
| 41 | Goose Egg hosted bitumen | 1.5 | 0.8 | 0.1 | 0.5 | 0.5 | 2720 | <0.01 | <0.2 | 0.03 | 11.6 | 8 | 20.8 | 9 | 0.5 |
| No. | Sample Number | La | Ce | Pr | Nd | Sm | Eu | Gd | Tb | Dy | Ho | Er | Tm | Yb | Lu | Y |
|---|---|---|---|---|---|---|---|---|---|---|---|---|---|---|---|---|
| 1 | FS131A U-V breccia | 0.9 | 5.9 | 1 | 6.6 | 3.54 | 1.06 | 4.76 | 1.21 | 7.92 | 1.45 | 4.26 | 0.53 | 3.46 | 0.42 | 33.1 |
| 2 | LMLisbon U-V breccia | 9.5 | 13.9 | 1.86 | 7.9 | 1.66 | 0.4 | 2.08 | 0.3 | 1.85 | 0.39 | 1.13 | 0.12 | 0.76 | 0.12 | 17 |
| 3 | Swamp Frog U-V breccia | 4.5 | 21.2 | 2.03 | 9 | 2.09 | 0.41 | 1.28 | 0.16 | 0.72 | 0.13 | 0.32 | 0.05 | 0.36 | 0.03 | 2.8 |
| 4 | SBRX01 U-V breccia | 6.7 | 24.7 | 5.57 | 32.5 | 12.25 | 3.51 | 19.1 | 3.07 | 18.55 | 3.92 | 10.65 | 1.32 | 7.21 | 1.02 | 172 |
| 5 | LMLeo02 U-V breccia | 10.1 | 18.6 | 2.37 | 9.6 | 2.05 | 0.53 | 2.32 | 0.37 | 2.03 | 0.43 | 1.29 | 0.16 | 1.02 | 0.14 | 15.6 |
| 6 | MarieMine001 U-V breccia | 9.7 | 32.4 | 4.96 | 26.9 | 6.97 | 1.2 | 3.54 | 0.38 | 1.68 | 0.33 | 1.05 | 0.14 | 0.93 | 0.12 | 7.6 |
| 7 | Perc01 U-V breccia | 10.7 | 52.7 | 4.29 | 19 | 3.87 | 0.81 | 3.46 | 0.48 | 2.53 | 0.46 | 1.06 | 0.13 | 0.9 | 0.11 | 17.4 |
| 8 | OGM04 U-V breccia | 13.7 | 44.5 | 8.2 | 40.9 | 8.88 | 1.69 | 5.76 | 0.95 | 5.7 | 0.96 | 2.56 | 0.4 | 3.17 | 0.32 | 21.3 |
| 9 | P005 U-V breccia | 22.3 | 54.3 | 8.21 | 35.2 | 7.19 | 1.76 | 8.33 | 1.33 | 8.28 | 1.76 | 4.94 | 0.61 | 4.11 | 0.57 | 65 |
| 10 | Sandra713B U-V breccia | 44.8 | 222 | 44.1 | 245 | 76.5 | 20.6 | 103 | 15.4 | 87.7 | 17.85 | 46.9 | 5.55 | 33.3 | 4.45 | 840 |
| 11 | D2001 U-V breccia | 1.5 | 3.9 | 0.49 | 2.4 | 0.75 | 0.17 | 0.84 | 0.14 | 0.9 | 0.19 | 0.41 | 0.07 | 0.34 | 0.03 | 10.4 |
| 12 | DandyMSPF U-V breccia | 2.1 | 5.3 | 0.95 | 4.8 | 1.46 | 0.43 | 2.39 | 0.36 | 2.06 | 0.49 | 1.3 | 0.12 | 0.74 | 0.09 | 19.8 |
| 13 | DandyMBr U-V breccia | 4.8 | 15 | 2.44 | 13.3 | 4.7 | 1.38 | 7.52 | 1.33 | 8.12 | 1.74 | 4.51 | 0.61 | 3.41 | 0.47 | 70.6 |
| 14 | OGM UV blk U-V breccia | 1.6 | 3.8 | 0.38 | 1.6 | 0.55 | 0.1 | 0.27 | 0.05 | 0.3 | 0.05 | 0.08 | 0.02 | 0.17 | 0.01 | 1 |
| 15 | DandyMSP U-V breccia | 13.7 | 40.6 | 8.46 | 43.8 | 8.45 | 1.6 | 4.7 | 0.98 | 5.91 | 0.77 | 1.94 | 0.31 | 2.53 | 0.17 | 12.3 |
| 16 | EP001 U-V breccia | 2.8 | 5.7 | 0.74 | 3.5 | 0.8 | 0.17 | 1.06 | 0.16 | 1.09 | 0.26 | 0.7 | 0.11 | 0.6 | 0.09 | 8.5 |
| 17 | LMLeoIncline U-V breccia | 5.2 | 10.4 | 1.31 | 5.4 | 0.98 | 0.3 | 1.35 | 0.21 | 1.16 | 0.27 | 0.57 | 0.1 | 0.47 | 0.07 | 8.9 |
| 18 | LMLisbonBX U-V breccia | 3.4 | 6.1 | 0.82 | 3.5 | 0.51 | 0.14 | 0.6 | 0.08 | 0.51 | 0.11 | 0.36 | 0.04 | 0.24 | 0.03 | 4.3 |
| 19 | LMLisbonSB shatter breccia | 0.9 | 1.4 | 0.18 | 0.7 | 0.14 | <0.03 | 0.13 | 0.02 | 0.12 | 0.02 | 0.05 | 0.01 | 0.05 | 0.01 | 0.5 |
| 20 | EP001DB dark breccia | 1.3 | 2.7 | 0.39 | 1.7 | 0.39 | 0.09 | 0.5 | 0.06 | 0.38 | 0.08 | 0.26 | 0.03 | 0.23 | 0.03 | 3.2 |
| 21 | SWMP_H host limestone | 1.1 | 1.4 | 0.21 | 0.9 | 0.12 | <0.03 | 0.15 | 0.02 | 0.12 | 0.03 | 0.1 | 0.01 | 0.11 | 0.02 | 1.3 |
| 22 | Sandra002 limestone | 1.1 | 1.4 | 0.22 | 1 | 0.16 | <0.03 | 0.18 | 0.03 | 0.18 | 0.05 | 0.15 | 0.02 | 0.12 | 0.03 | 2.4 |
| 23 | UMB018 silicified breccia | 2.3 | 4 | 0.65 | 2.7 | 0.57 | 0.14 | 0.67 | 0.09 | 0.58 | 0.12 | 0.39 | 0.05 | 0.24 | 0.05 | 4.9 |
| 24 | FS139 calcite | 2.30 | 4.20 | 0.41 | 2.00 | 0.44 | 0.07 | 0.53 | 0.09 | 0.47 | 0.13 | 0.43 | 0.04 | 0.37 | 0.06 | 4.30 |
| 25 | BPM_BC speleothem calcite | <0.5 | <0.5 | <0.03 | 0.10 | <0.03 | <0.03 | <0.5 | <0.01 | <0.5 | <0.01 | <0.03 | <0.01 | <0.03 | 0.01 | <0.5 |
| 26 | BCS speleothem calcite | <0.5 | <0.5 | 0.03 | 0.10 | <0.03 | <0.03 | <0.5 | <0.01 | <0.5 | <0.01 | <0.03 | <0.01 | <0.03 | <0.01 | <0.5 |
| 27 | LeoGC green calcite | 0.60 | 0.80 | 0.08 | 0.30 | 0.04 | <0.03 | 0.05 | 0.01 | <0.5 | <0.01 | <0.03 | 0.01 | <0.03 | 0.01 | <0.5 |
| 28 | Dandy Mine fluorite | 2.70 | 6.40 | 1.11 | 5.80 | 1.78 | 0.50 | 2.85 | 0.49 | 2.63 | 0.57 | 1.52 | 0.20 | 1.21 | 0.17 | 35.90 |
| 29 | MarieF fluorite | 3.00 | 9.50 | 1.81 | 11.20 | 3.84 | 0.96 | 5.06 | 0.72 | 3.57 | 0.70 | 1.89 | 0.23 | 1.45 | 0.19 | 35.20 |
| 30 | EPryorF fluorite | 4.90 | 9.60 | 1.41 | 6.90 | 1.76 | 0.49 | 3.09 | 0.47 | 2.69 | 0.60 | 1.50 | 0.20 | 1.24 | 0.16 | 35.10 |
| 31 | DandyF fluorite | 2.00 | 4.00 | 0.50 | 2.50 | 0.64 | 0.19 | 1.01 | 0.19 | 1.04 | 0.21 | 0.57 | 0.07 | 0.41 | 0.07 | 11.80 |
| 32 | SandraF fluorite | 2.00 | 4.30 | 0.66 | 3.30 | 0.85 | 0.18 | 0.98 | 0.15 | 0.90 | 0.17 | 0.45 | 0.06 | 0.34 | 0.06 | 8.80 |
| 33 | SWMP_B barite | 5.60 | 4.30 | 0.66 | 3.80 | 3.43 | <0.03 | 0.89 | 0.09 | 0.38 | 0.09 | 0.16 | 0.04 | 0.52 | 0.16 | 3.00 |
| 34 | Lisbon001-dolomite breccia | 6.70 | 12.70 | 1.44 | 6.10 | 1.05 | 0.22 | 1.04 | 0.16 | 0.88 | 0.21 | 0.58 | 0.07 | 0.56 | 0.09 | 5.10 |
| 35 | LisbonQP quartz w/pyrite | <0.5 | 0.70 | 0.10 | 0.40 | 0.11 | <0.03 | 0.16 | 0.02 | 0.08 | 0.02 | 0.06 | 0.01 | 0.04 | 0.02 | 0.50 |
| 36 | GS32 quartz | <0.5 | 0.60 | 0.08 | 0.40 | 0.07 | <0.03 | 0.16 | 0.01 | 0.08 | 0.02 | 0.05 | <0.01 | 0.03 | 0.01 | 0.80 |
| 37 | TS-53 quartz | 0.60 | 1.30 | 0.16 | 0.60 | 0.09 | <0.03 | 0.21 | 0.04 | 0.27 | 0.07 | 0.22 | 0.04 | 0.22 | 0.03 | 2.20 |
| 38 | Bentonite | 51.10 | 96.20 | 10.20 | 35.60 | 6.19 | 0.70 | 4.50 | 0.64 | 3.61 | 0.69 | 1.96 | 0.26 | 1.92 | 0.28 | 16.30 |
| 39 | Mm hosted bitumen | 0.50 | 1.28 | 0.16 | 0.80 | 0.18 | 0.04 | 0.20 | 0.03 | 0.16 | 0.03 | 0.08 | 0.01 | 0.05 | 0.01 | 1.07 |
| 40 | Mm breccia hosted bitumen | 1.80 | 3.70 | 0.44 | 2.00 | 0.42 | 0.09 | 0.54 | 0.08 | 0.42 | 0.08 | 0.22 | 0.03 | 0.15 | 0.02 | 2.88 |
| 41 | Goose Egg hosted bitumen | 3.00 | 2.20 | 1.70 | 1.30 | 0.70 | <0.03 | 0.50 | 0.30 | 0.30 | 0.40 | 0.30 | 0.40 | 0.20 | <0.01 | 3.00 |
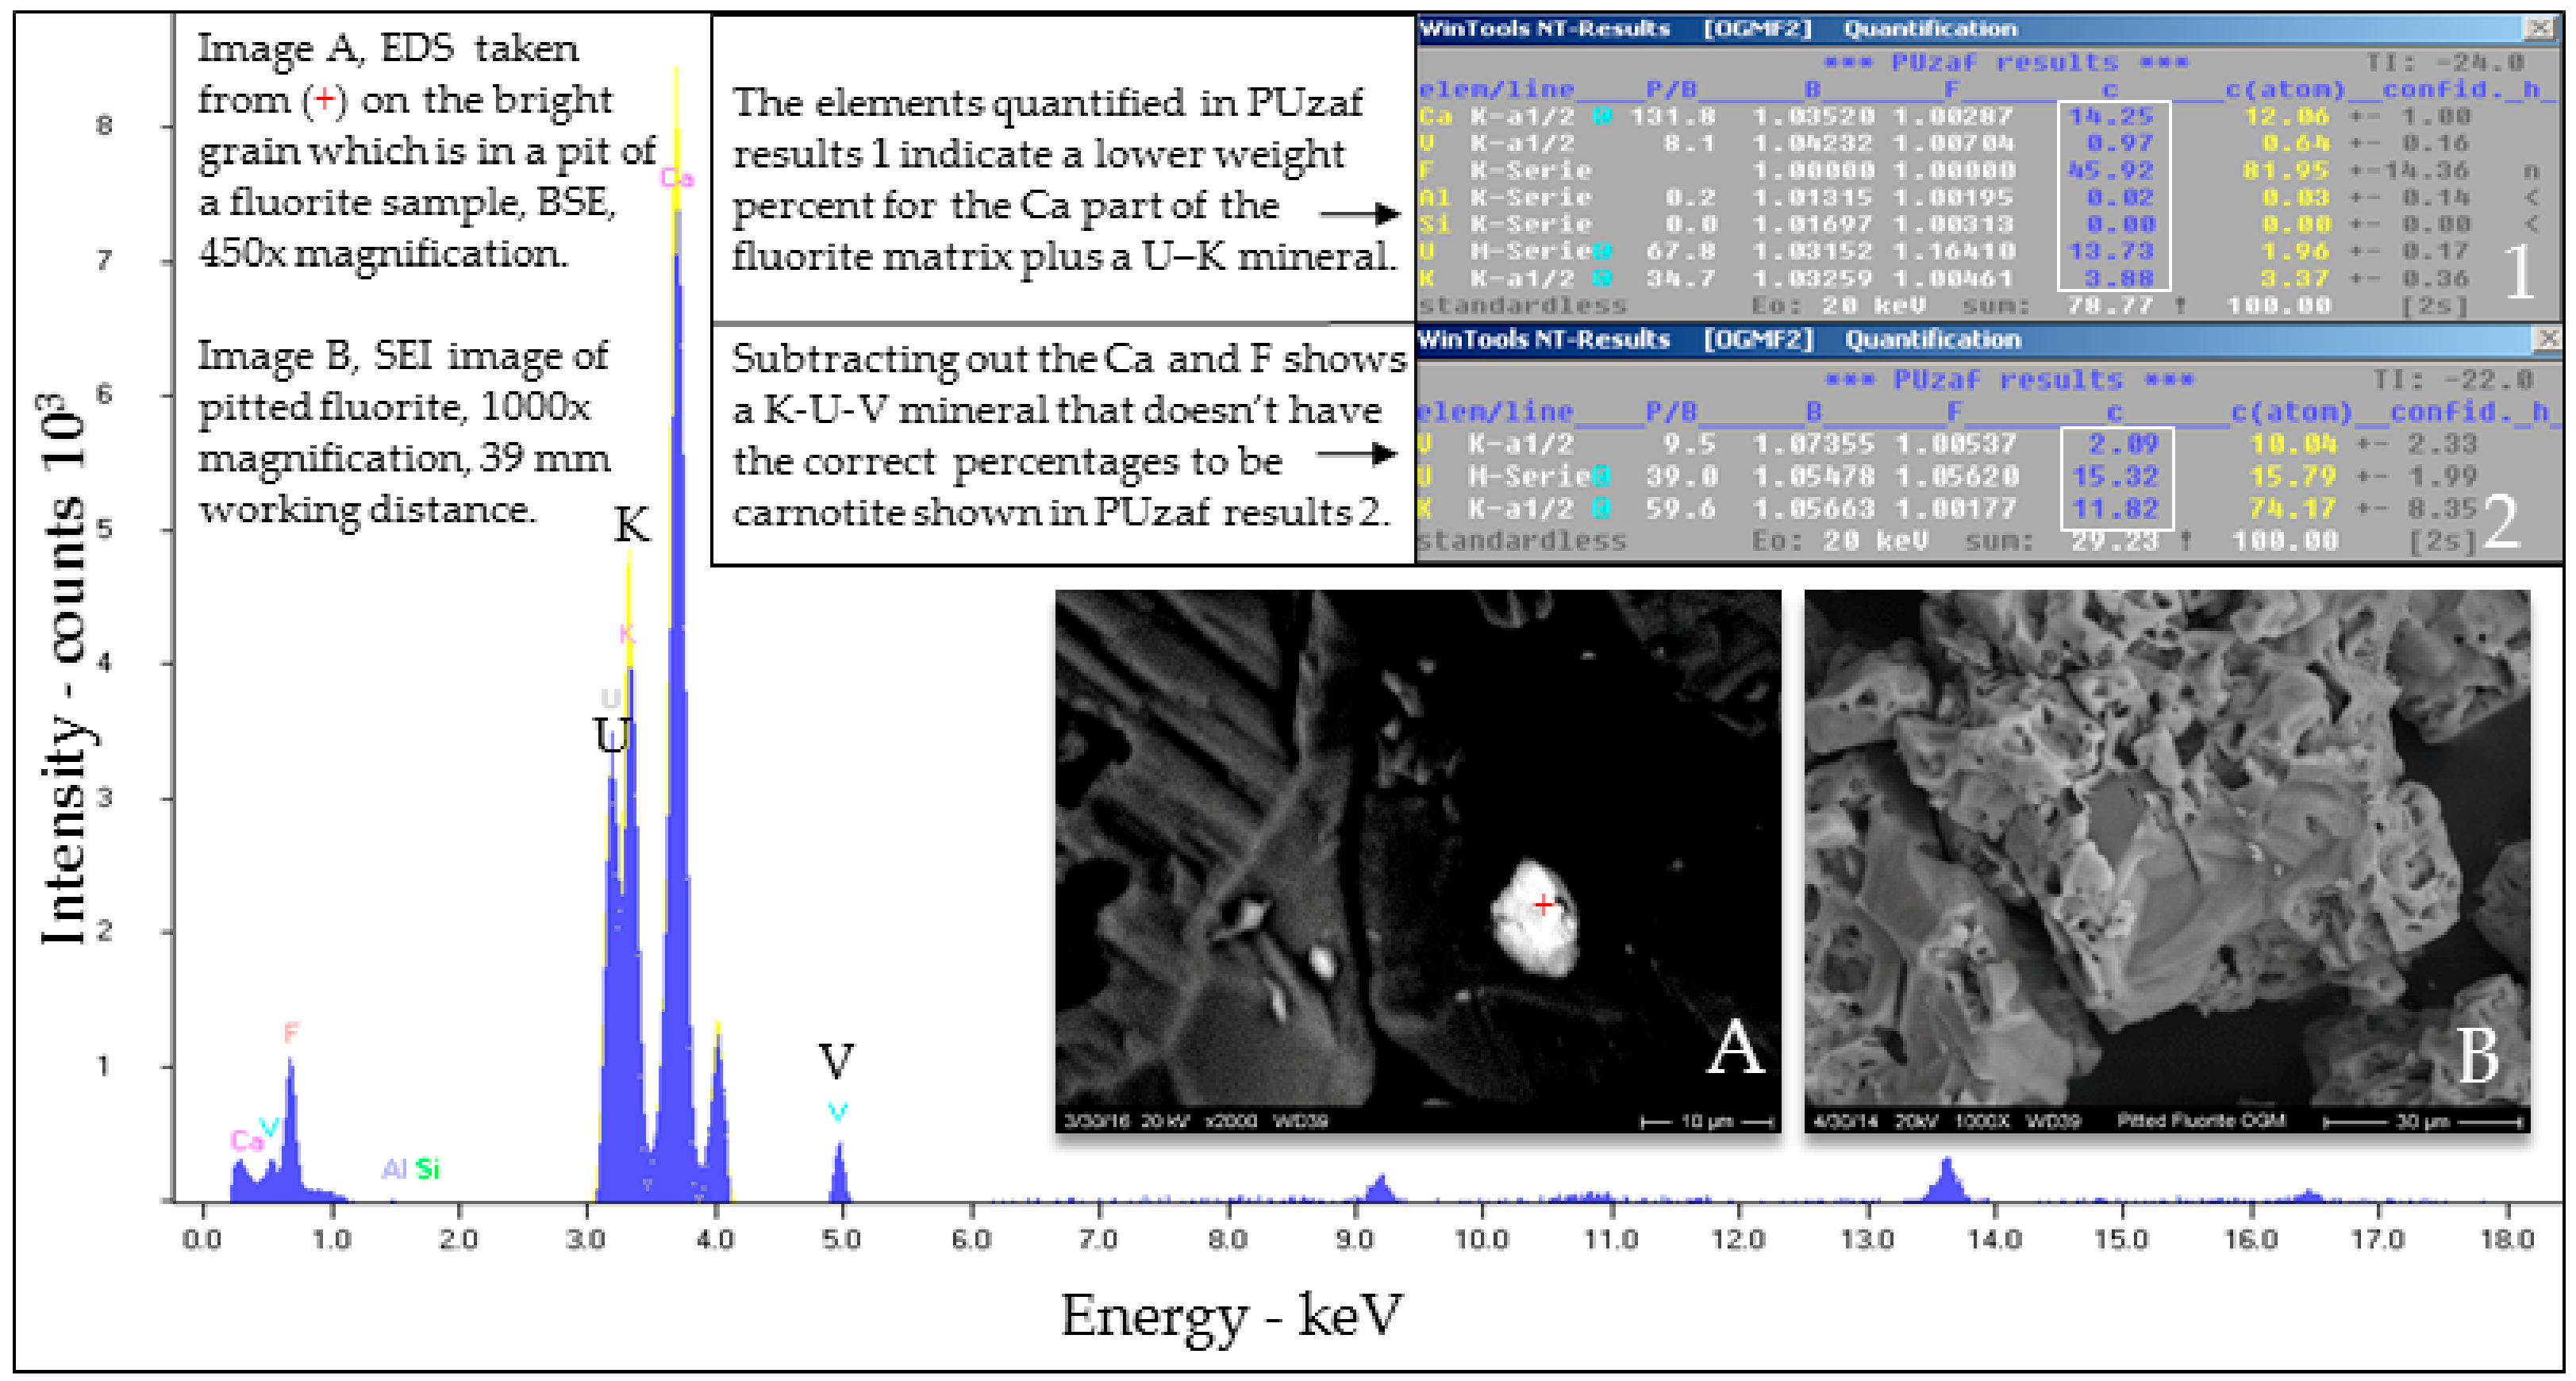
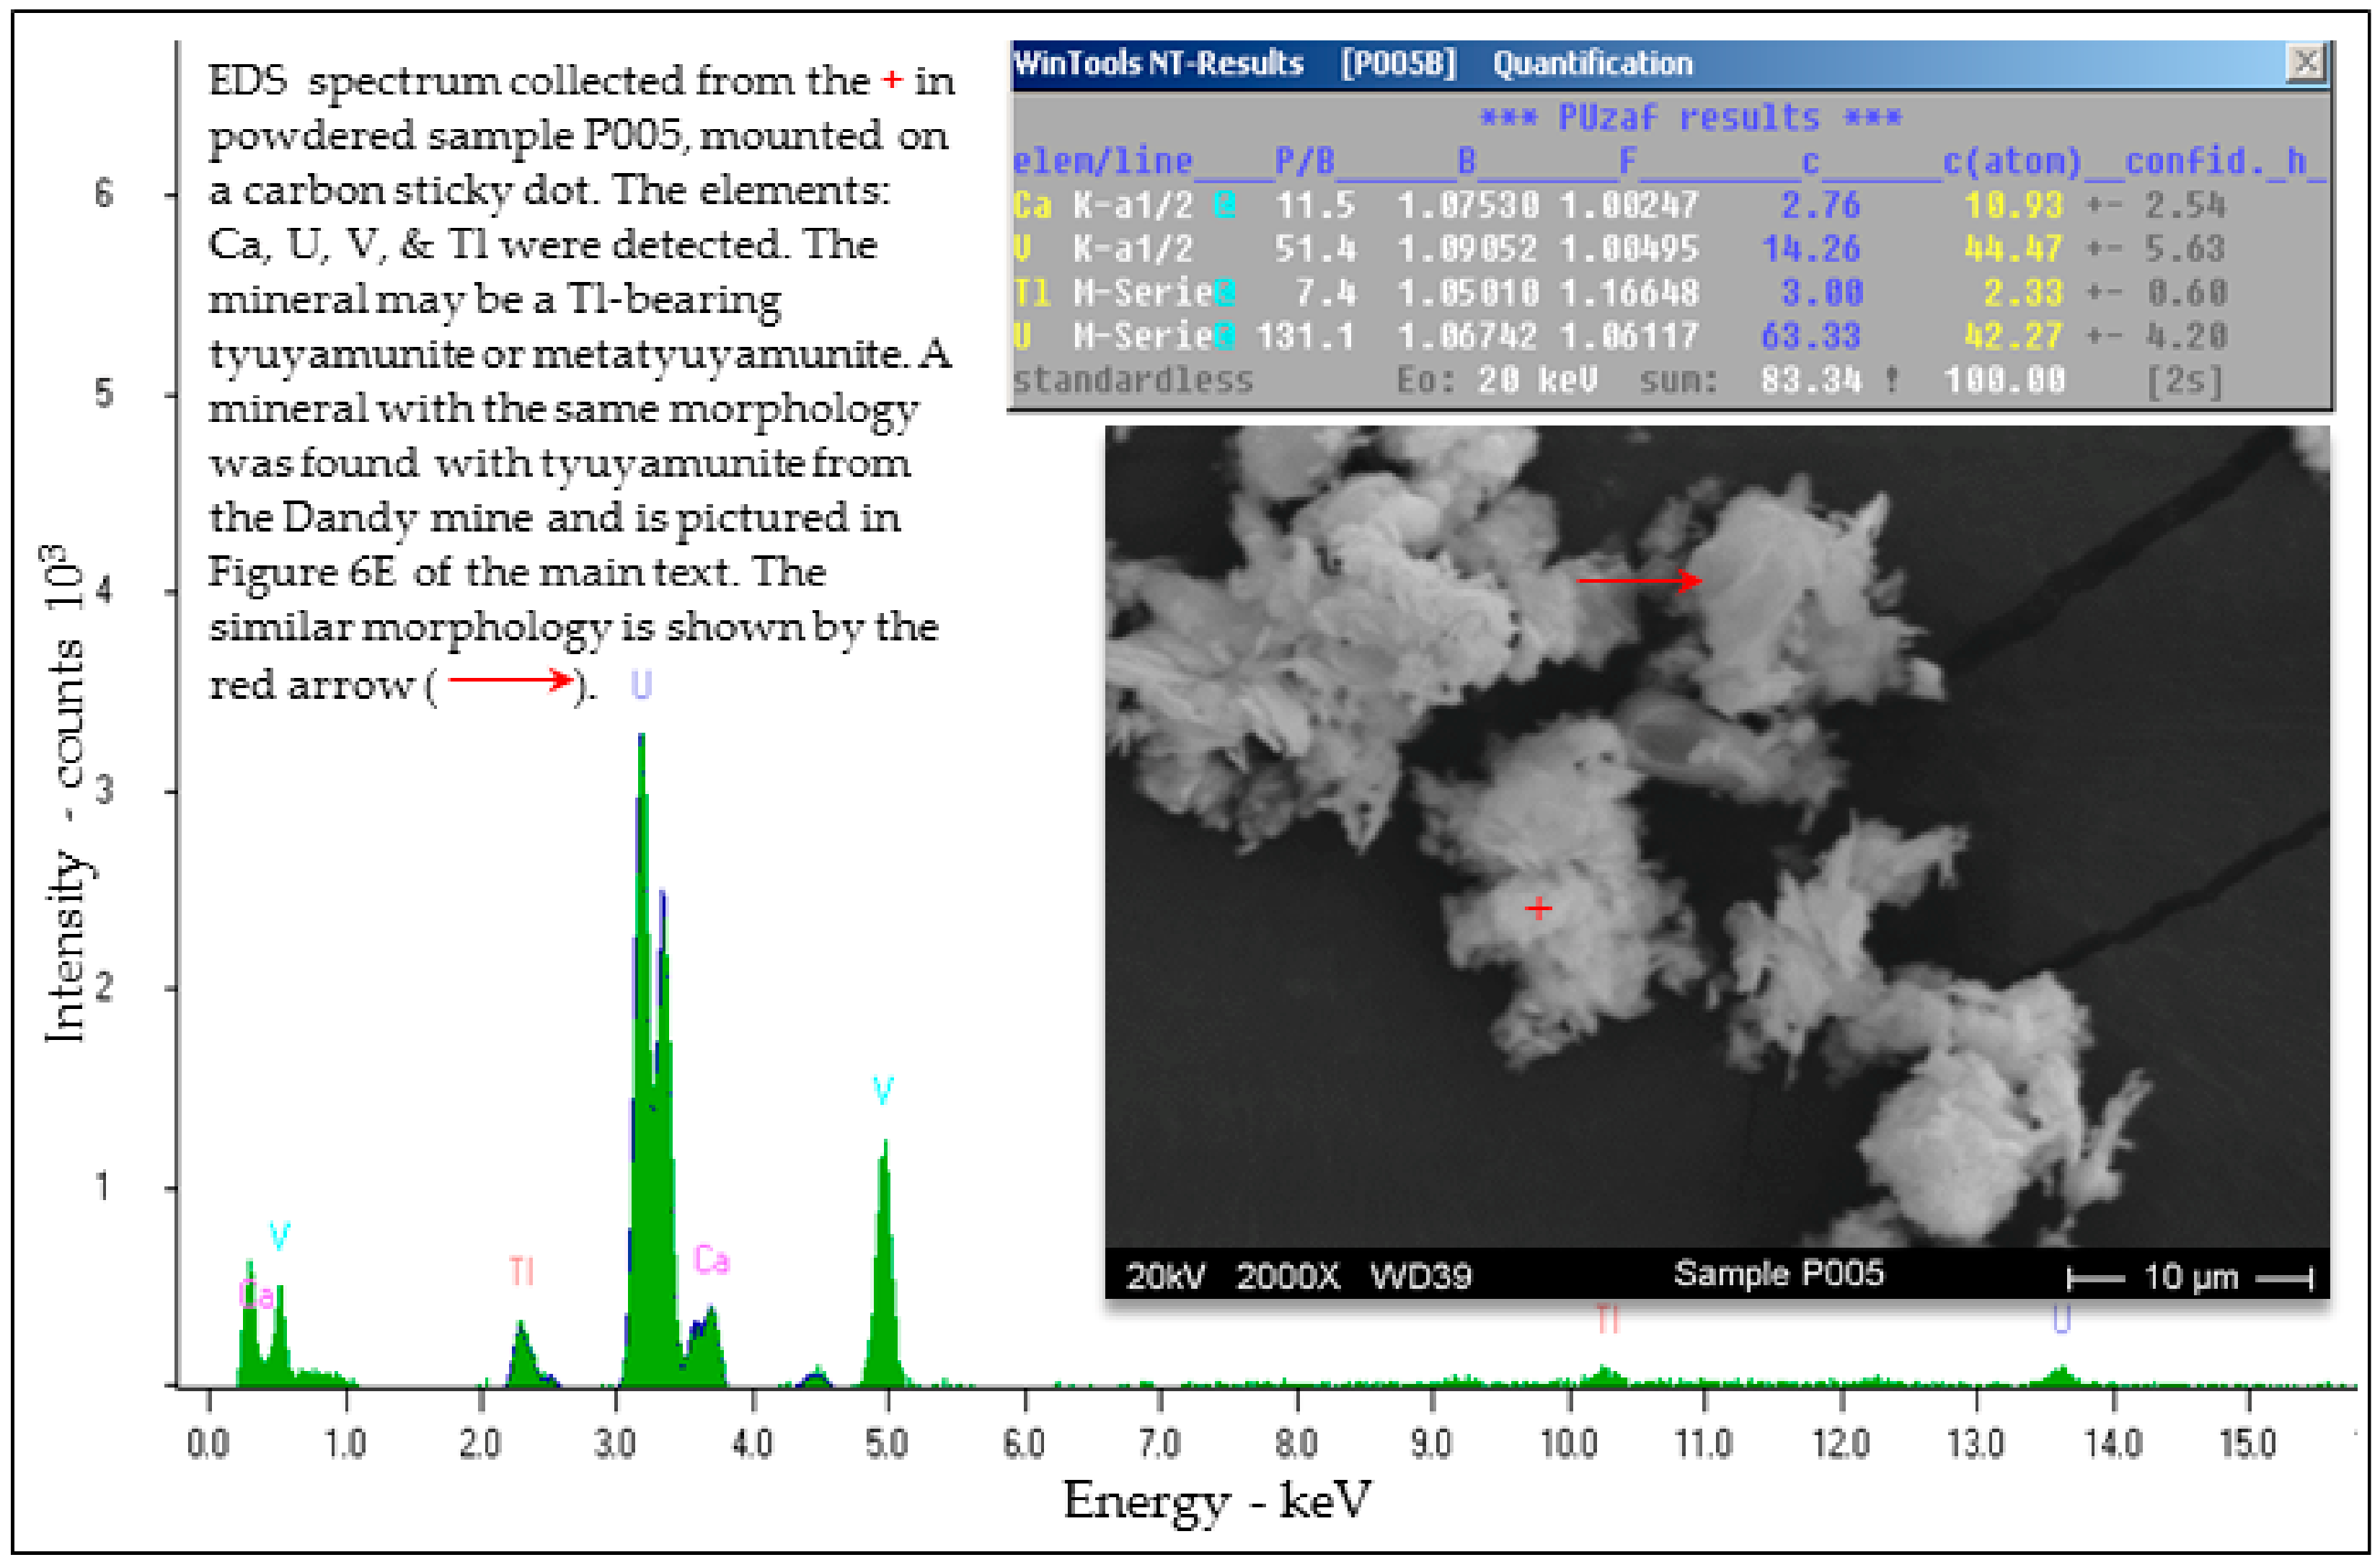
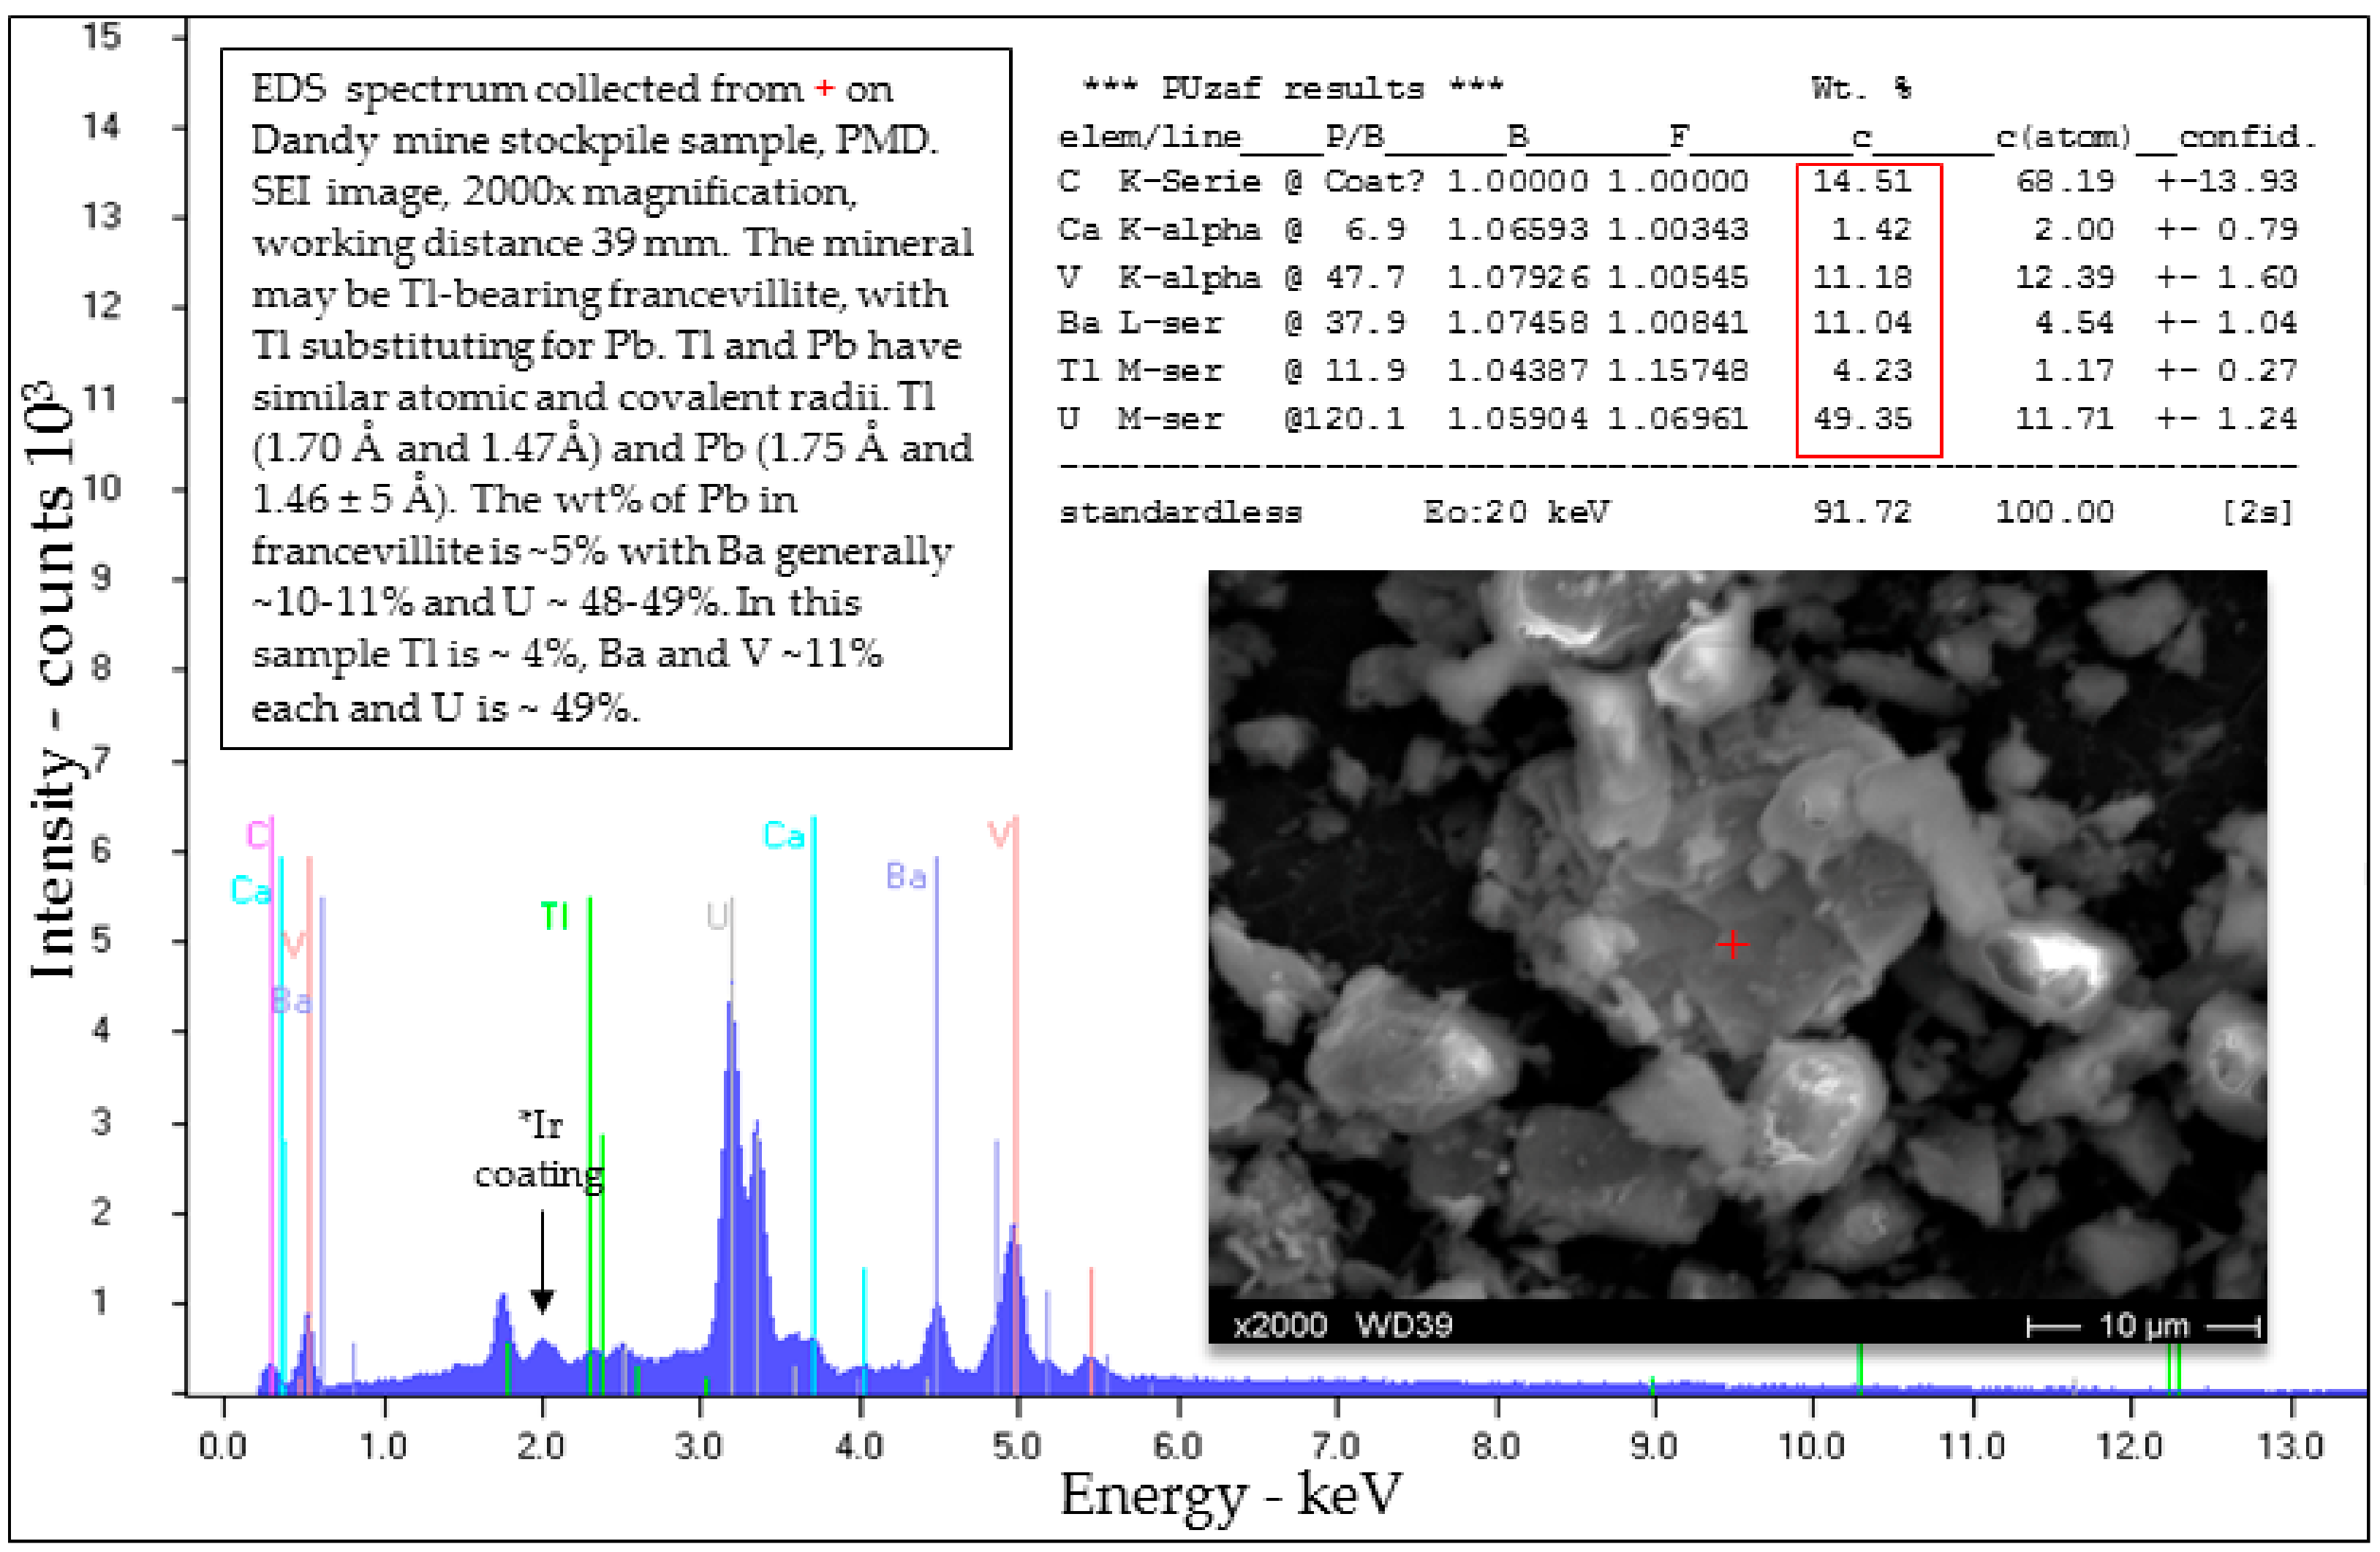
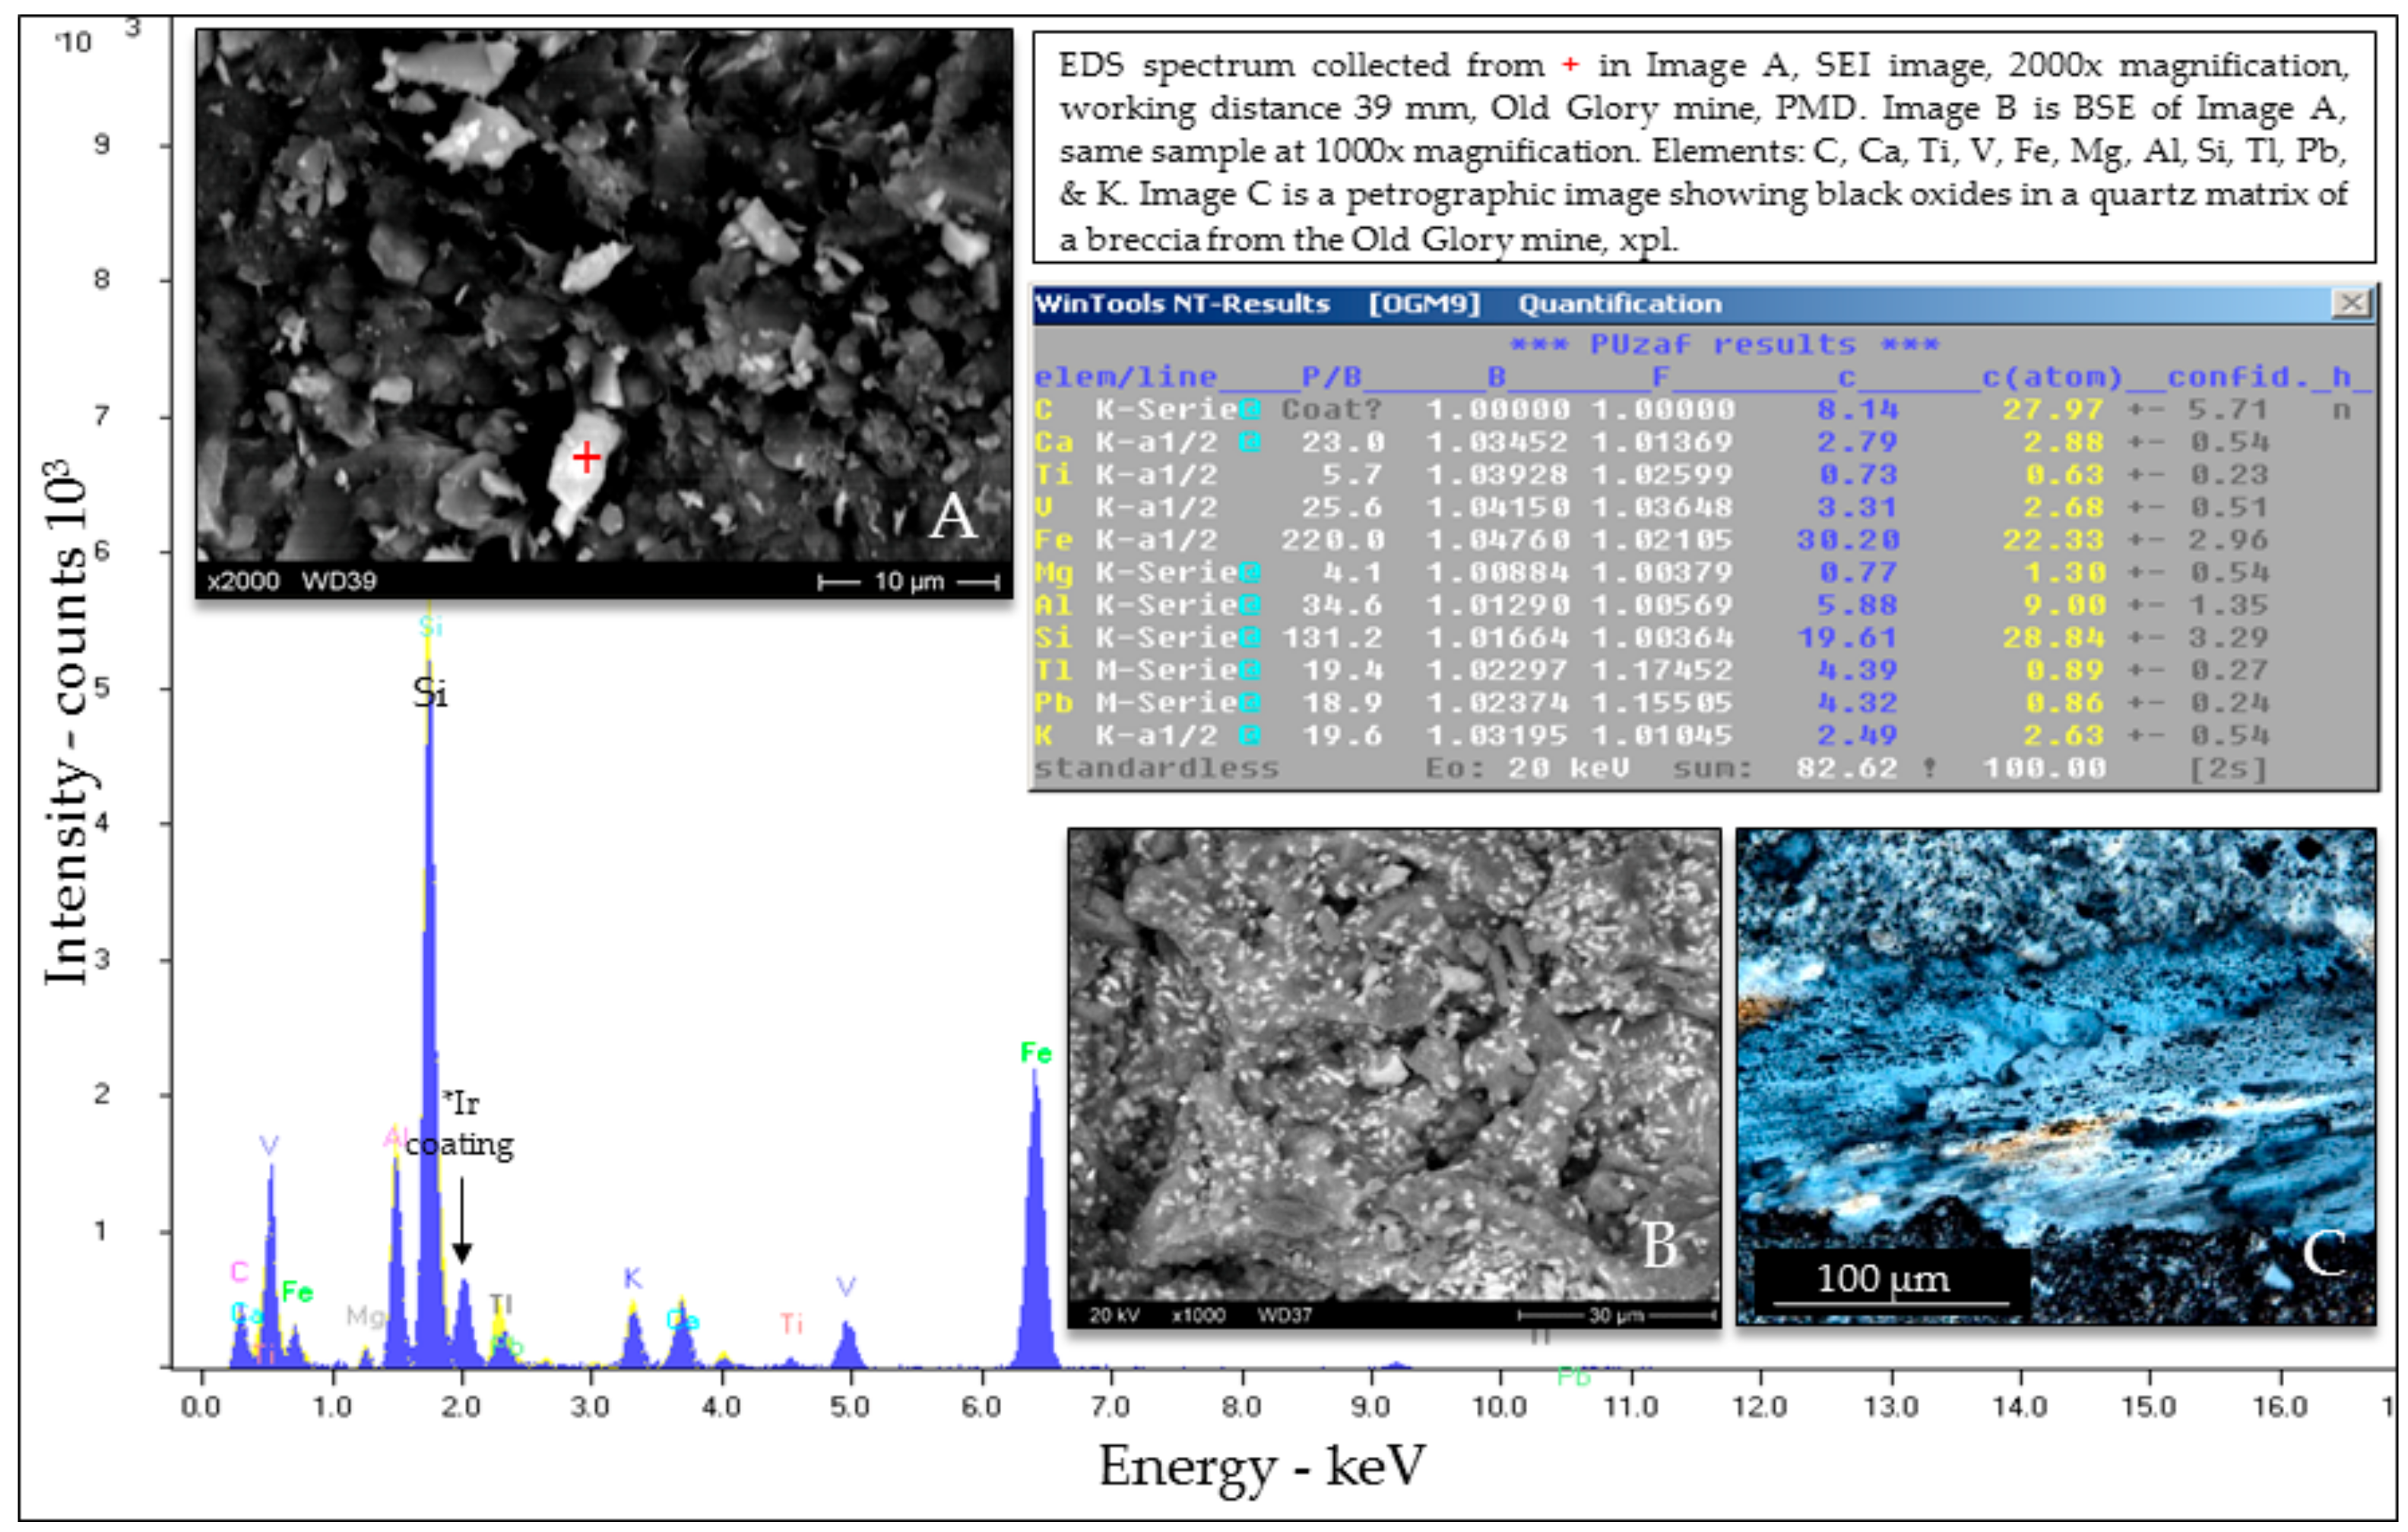
Appendix B
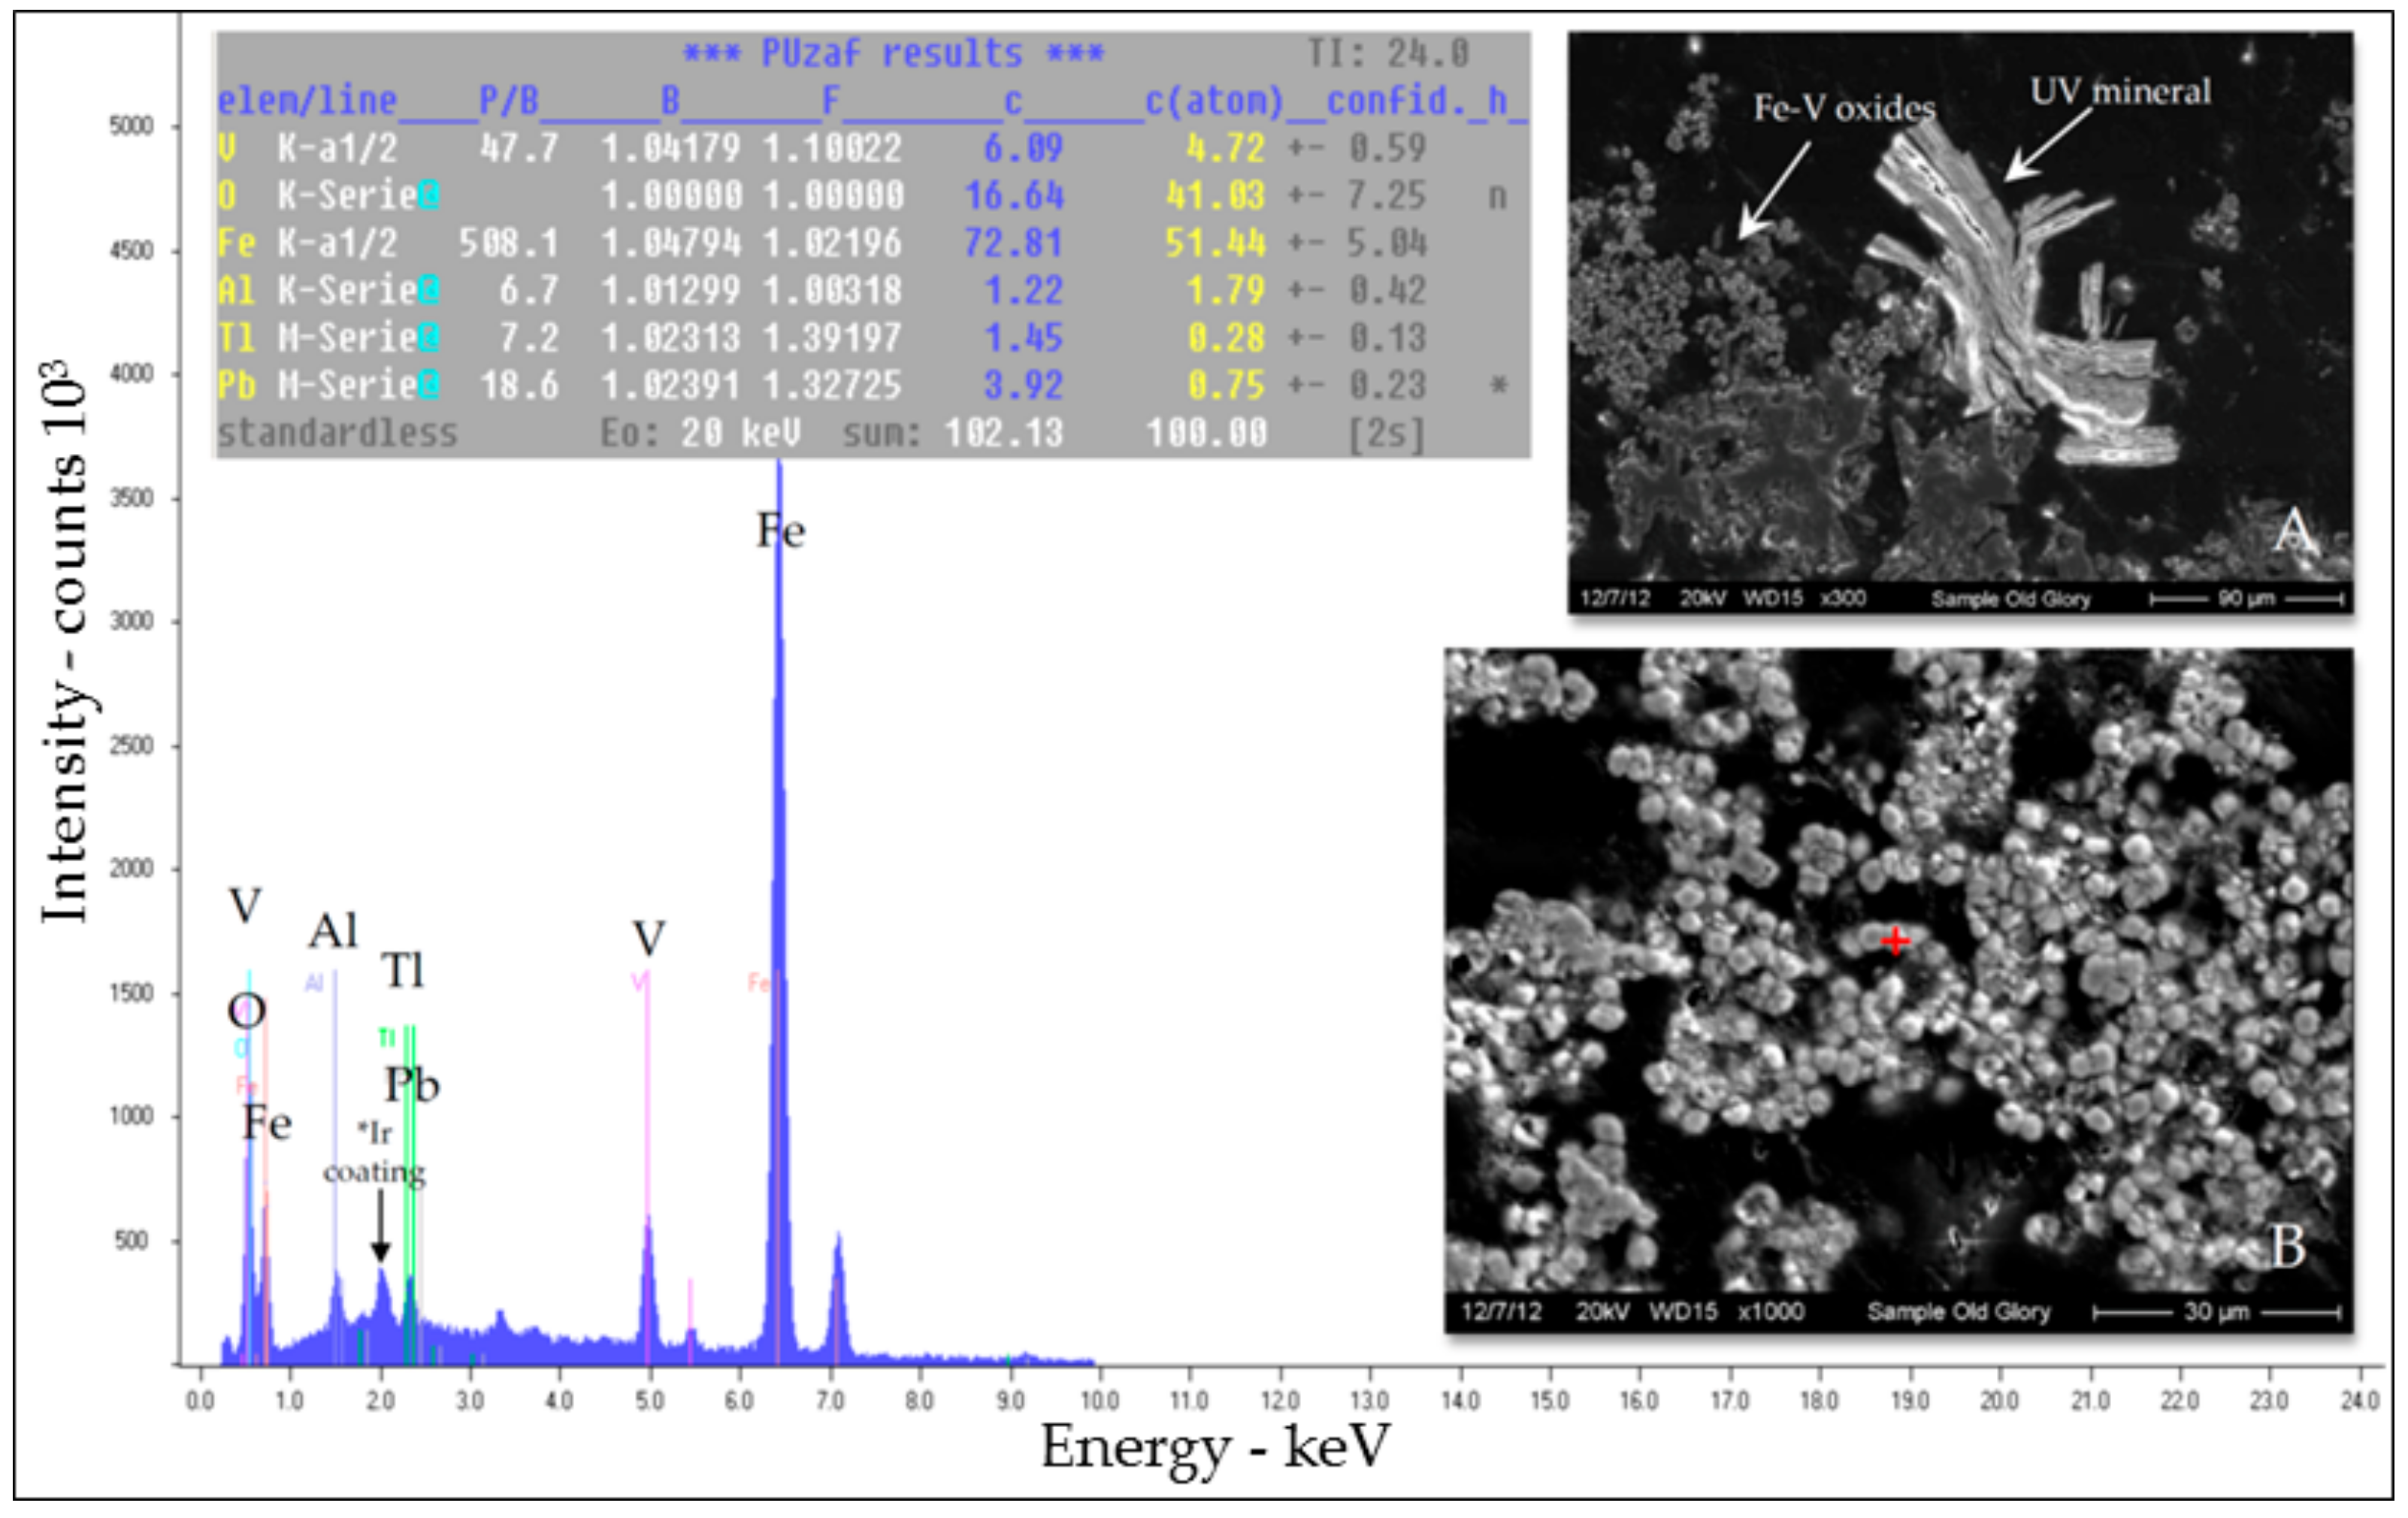
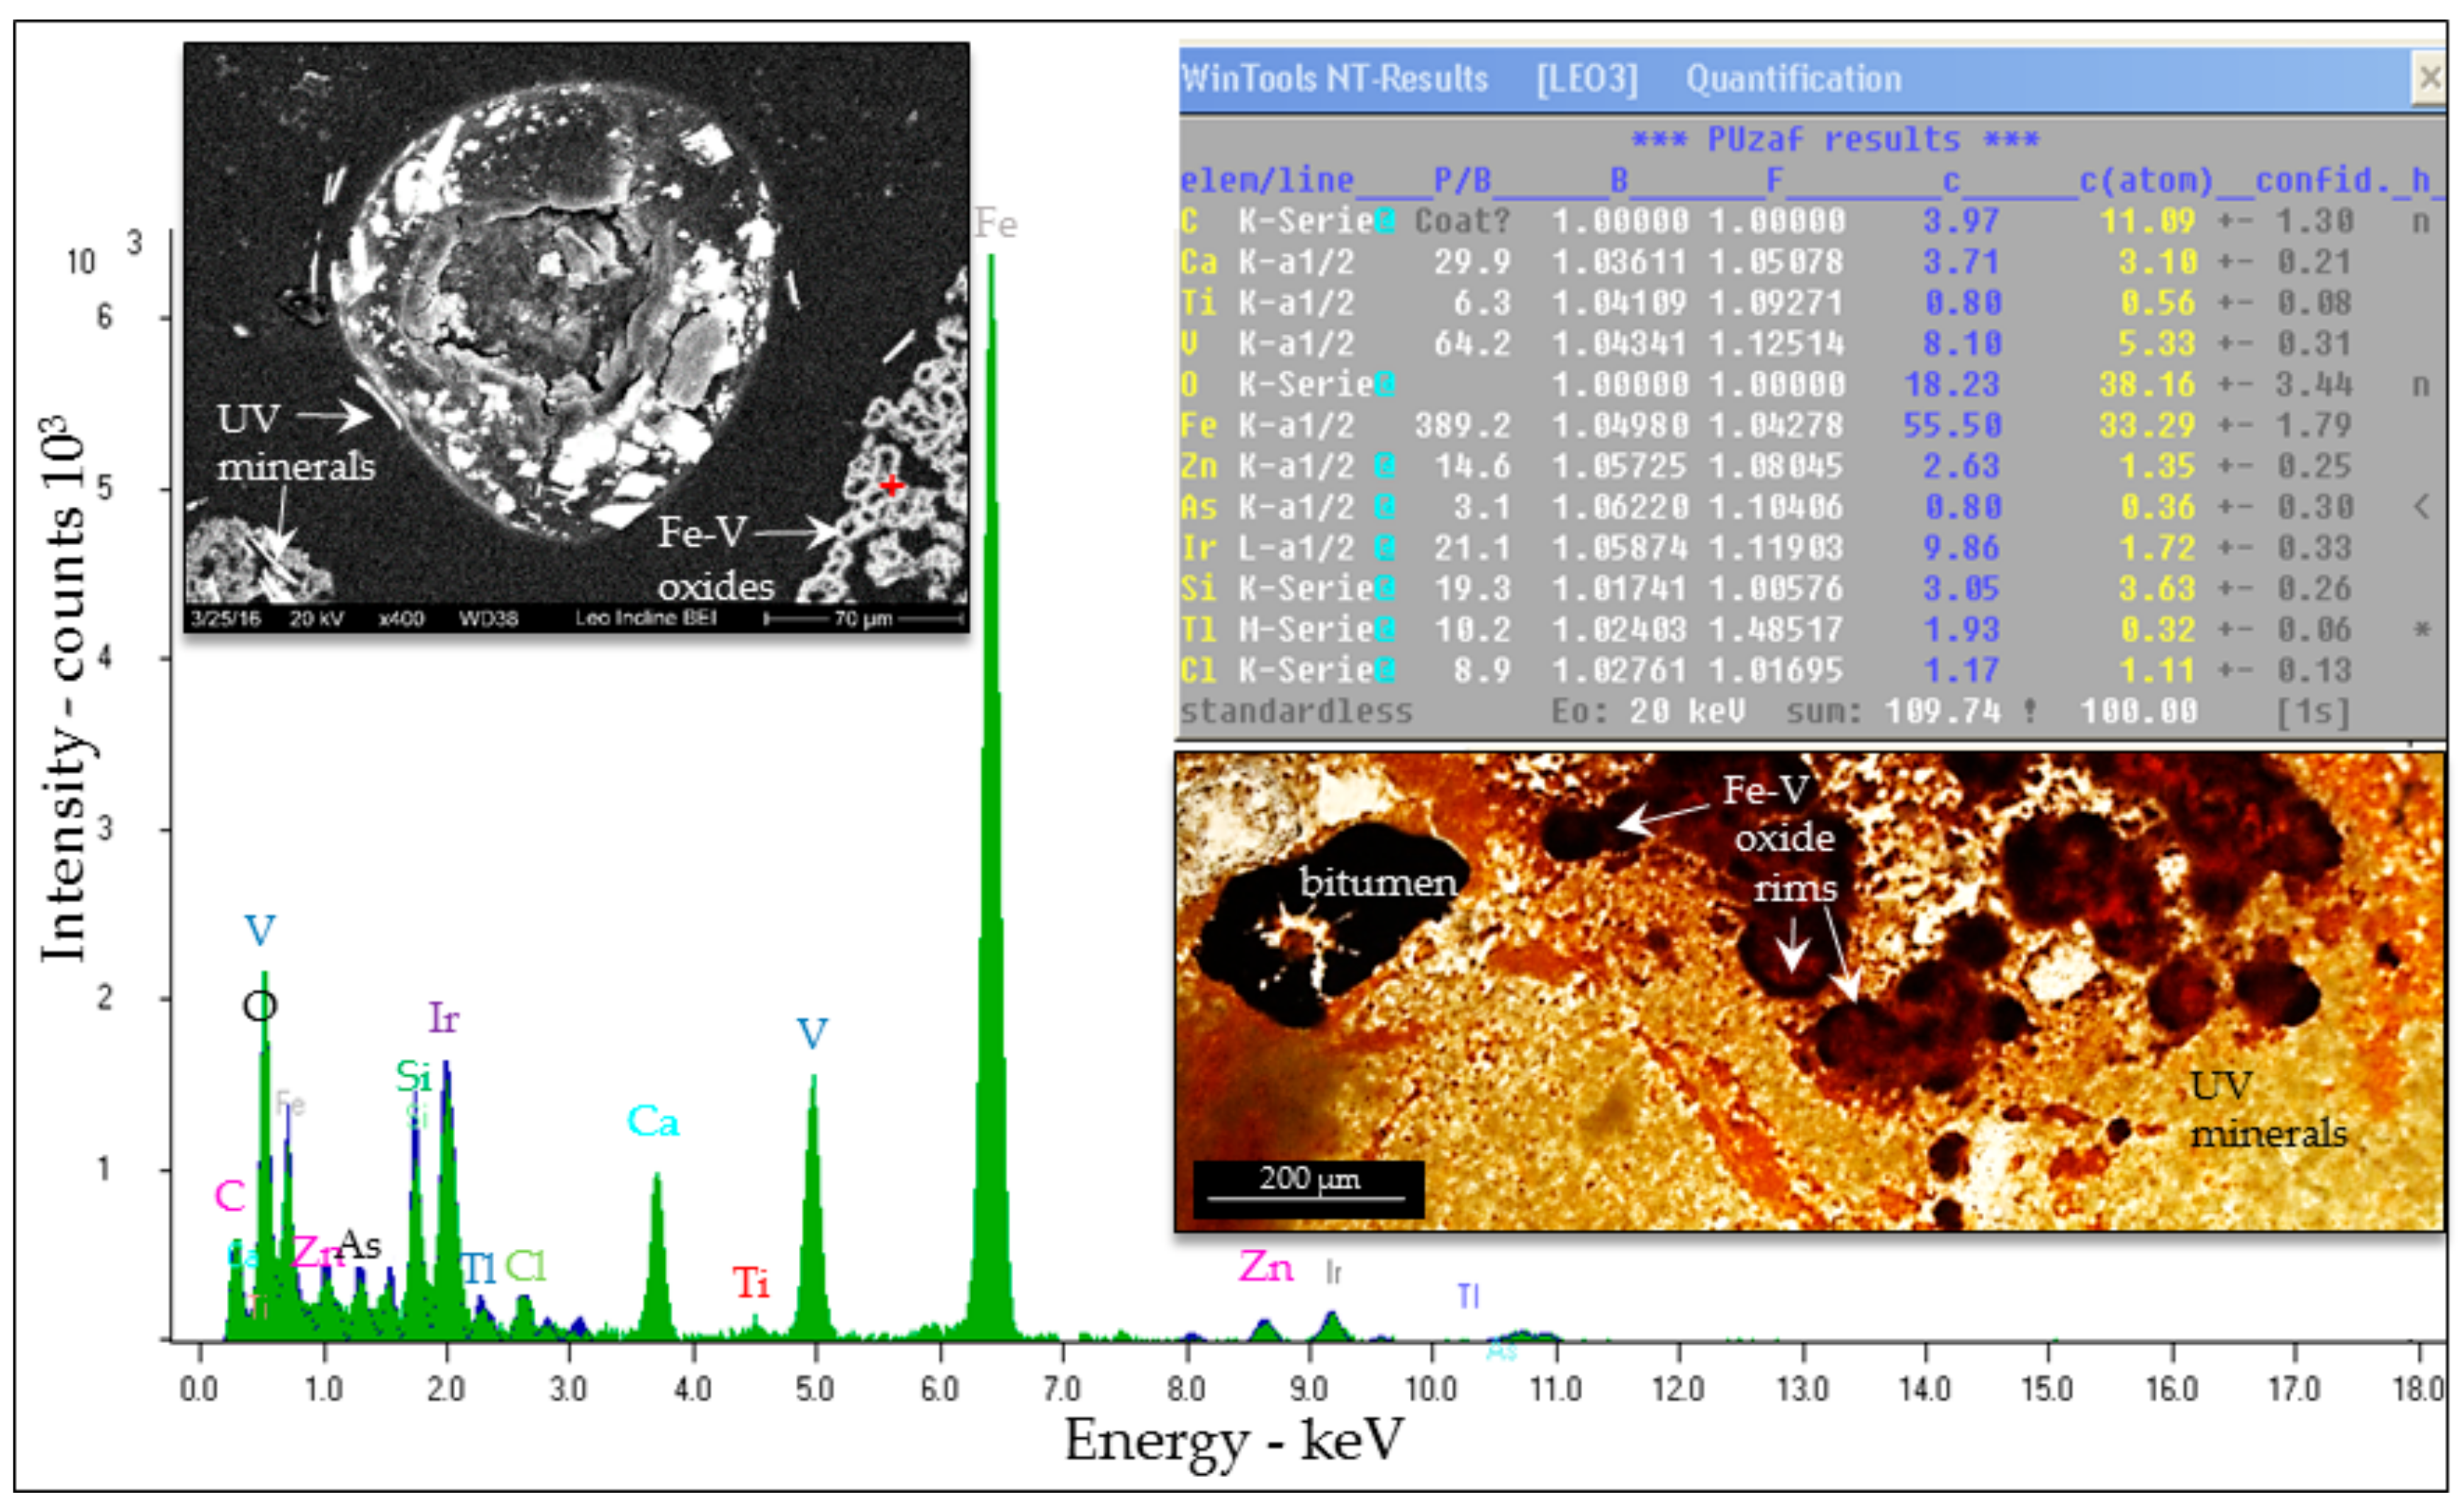
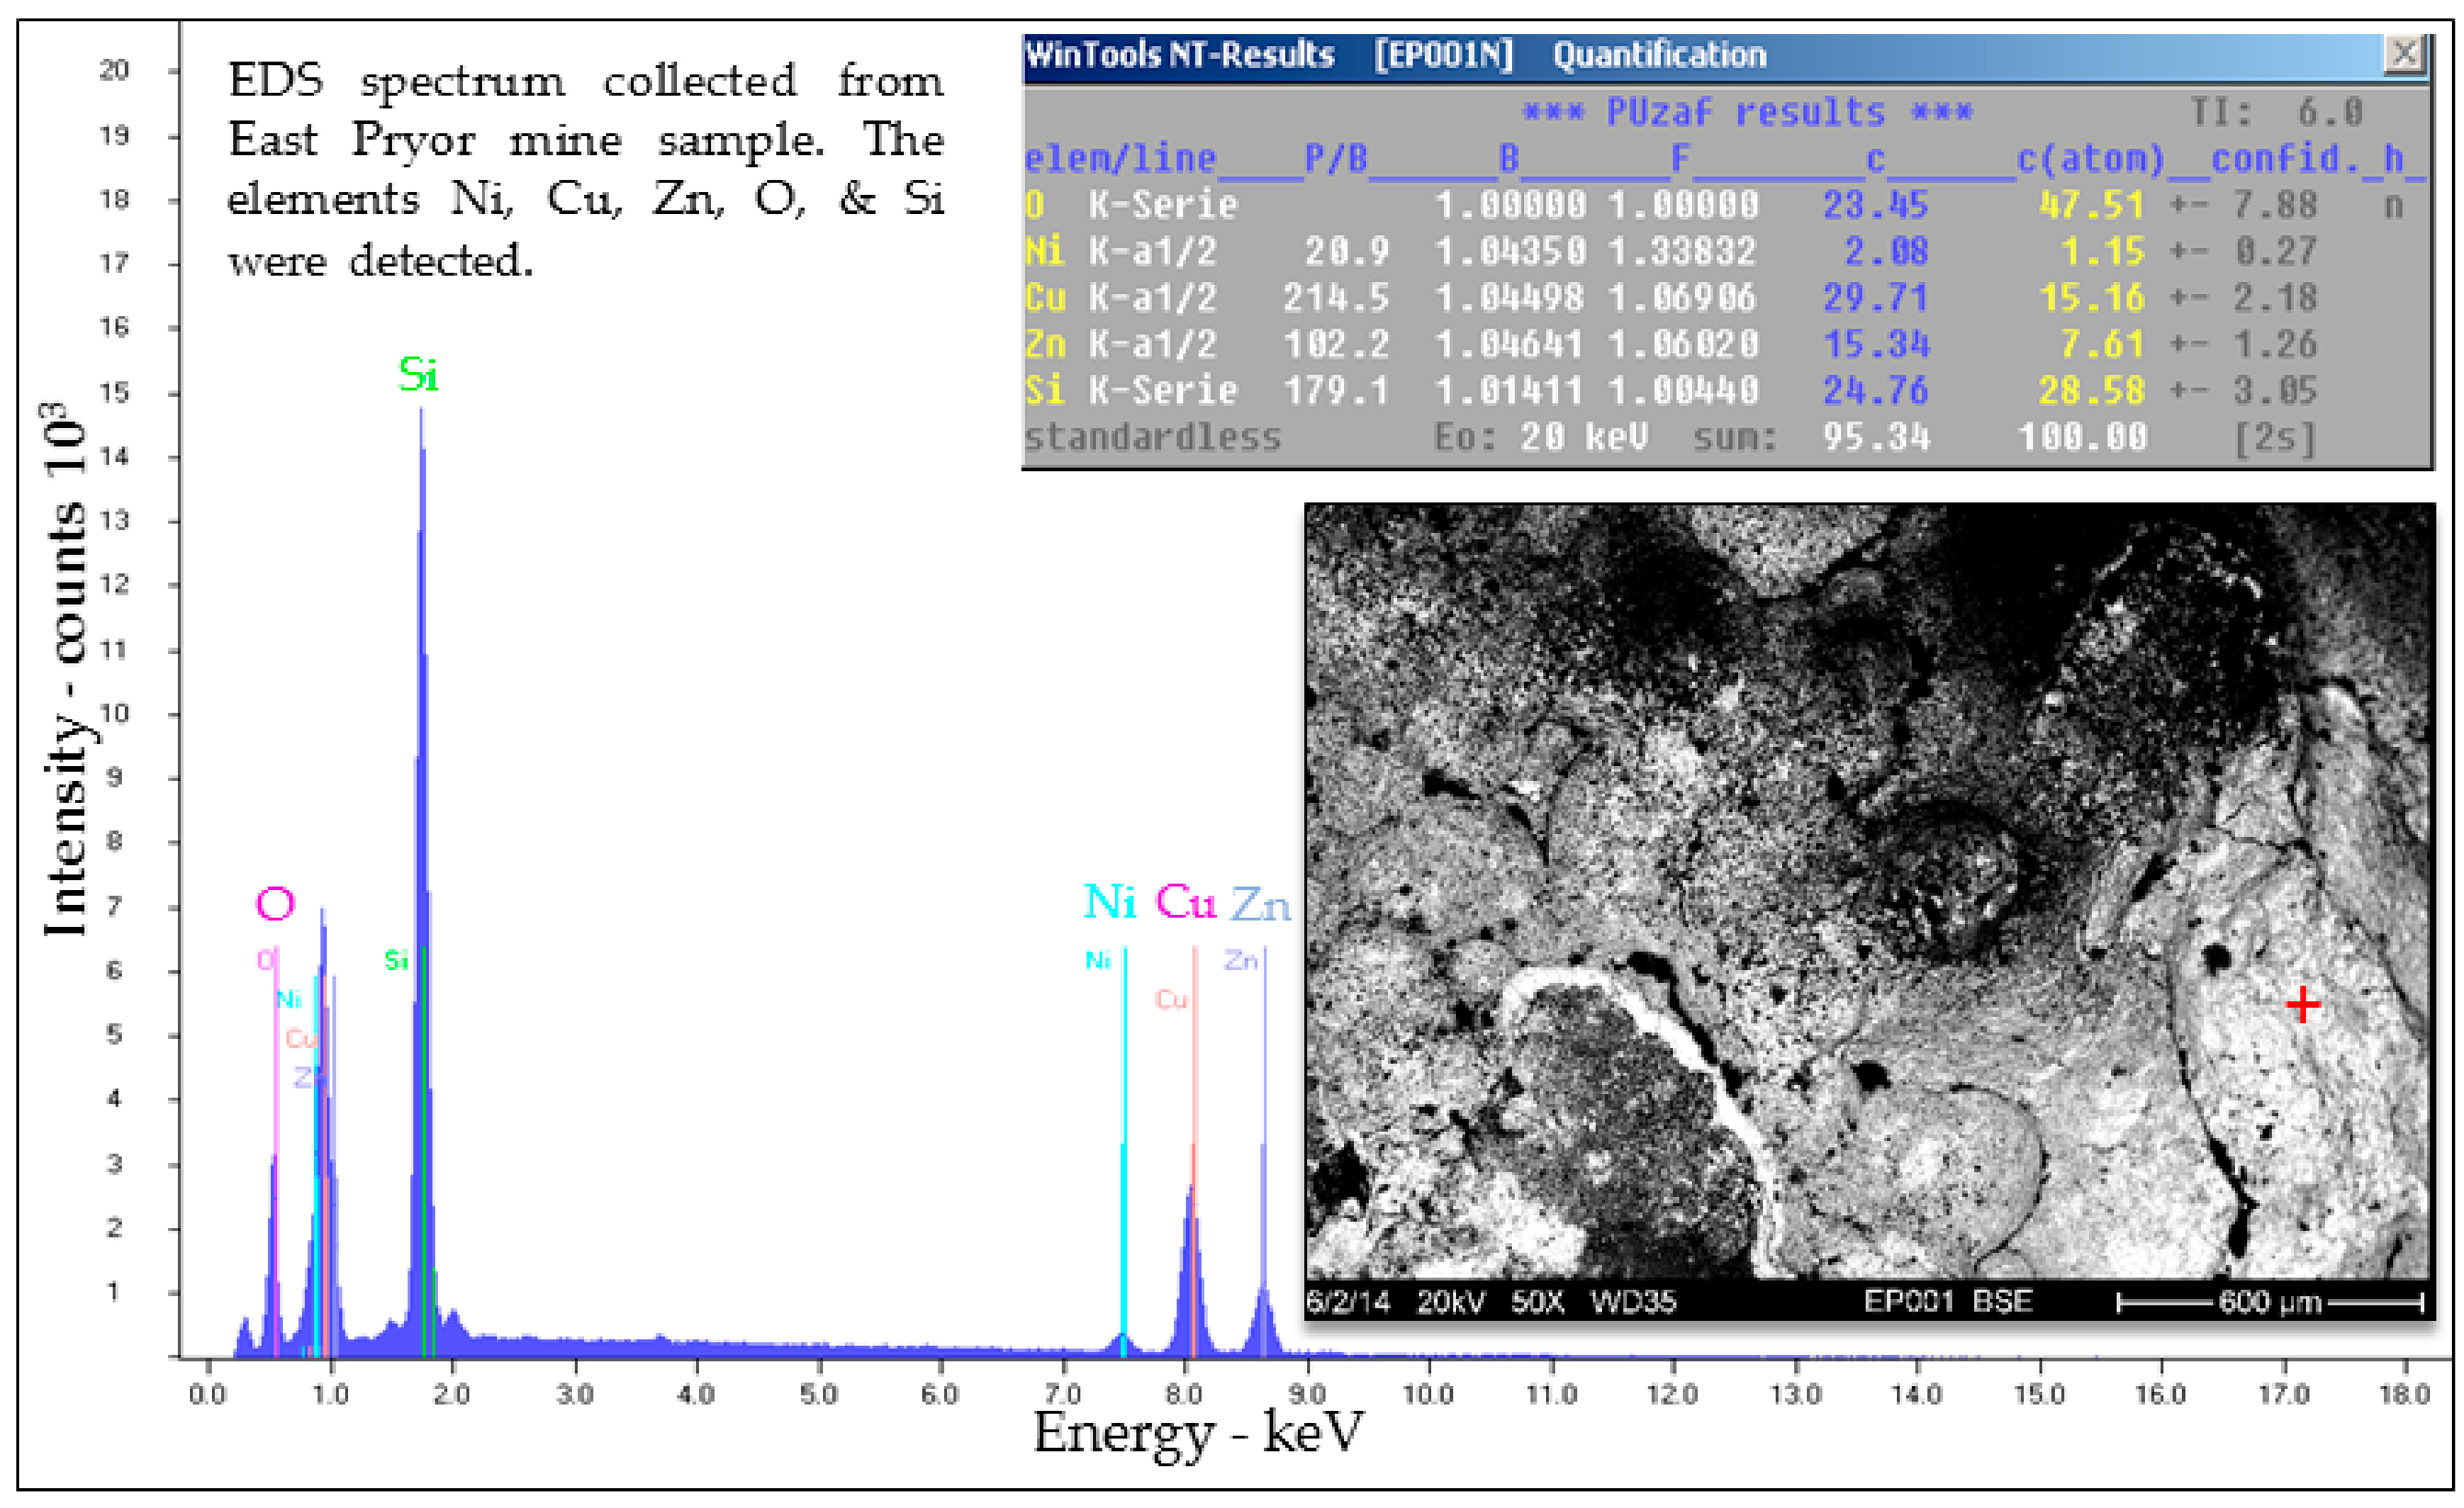
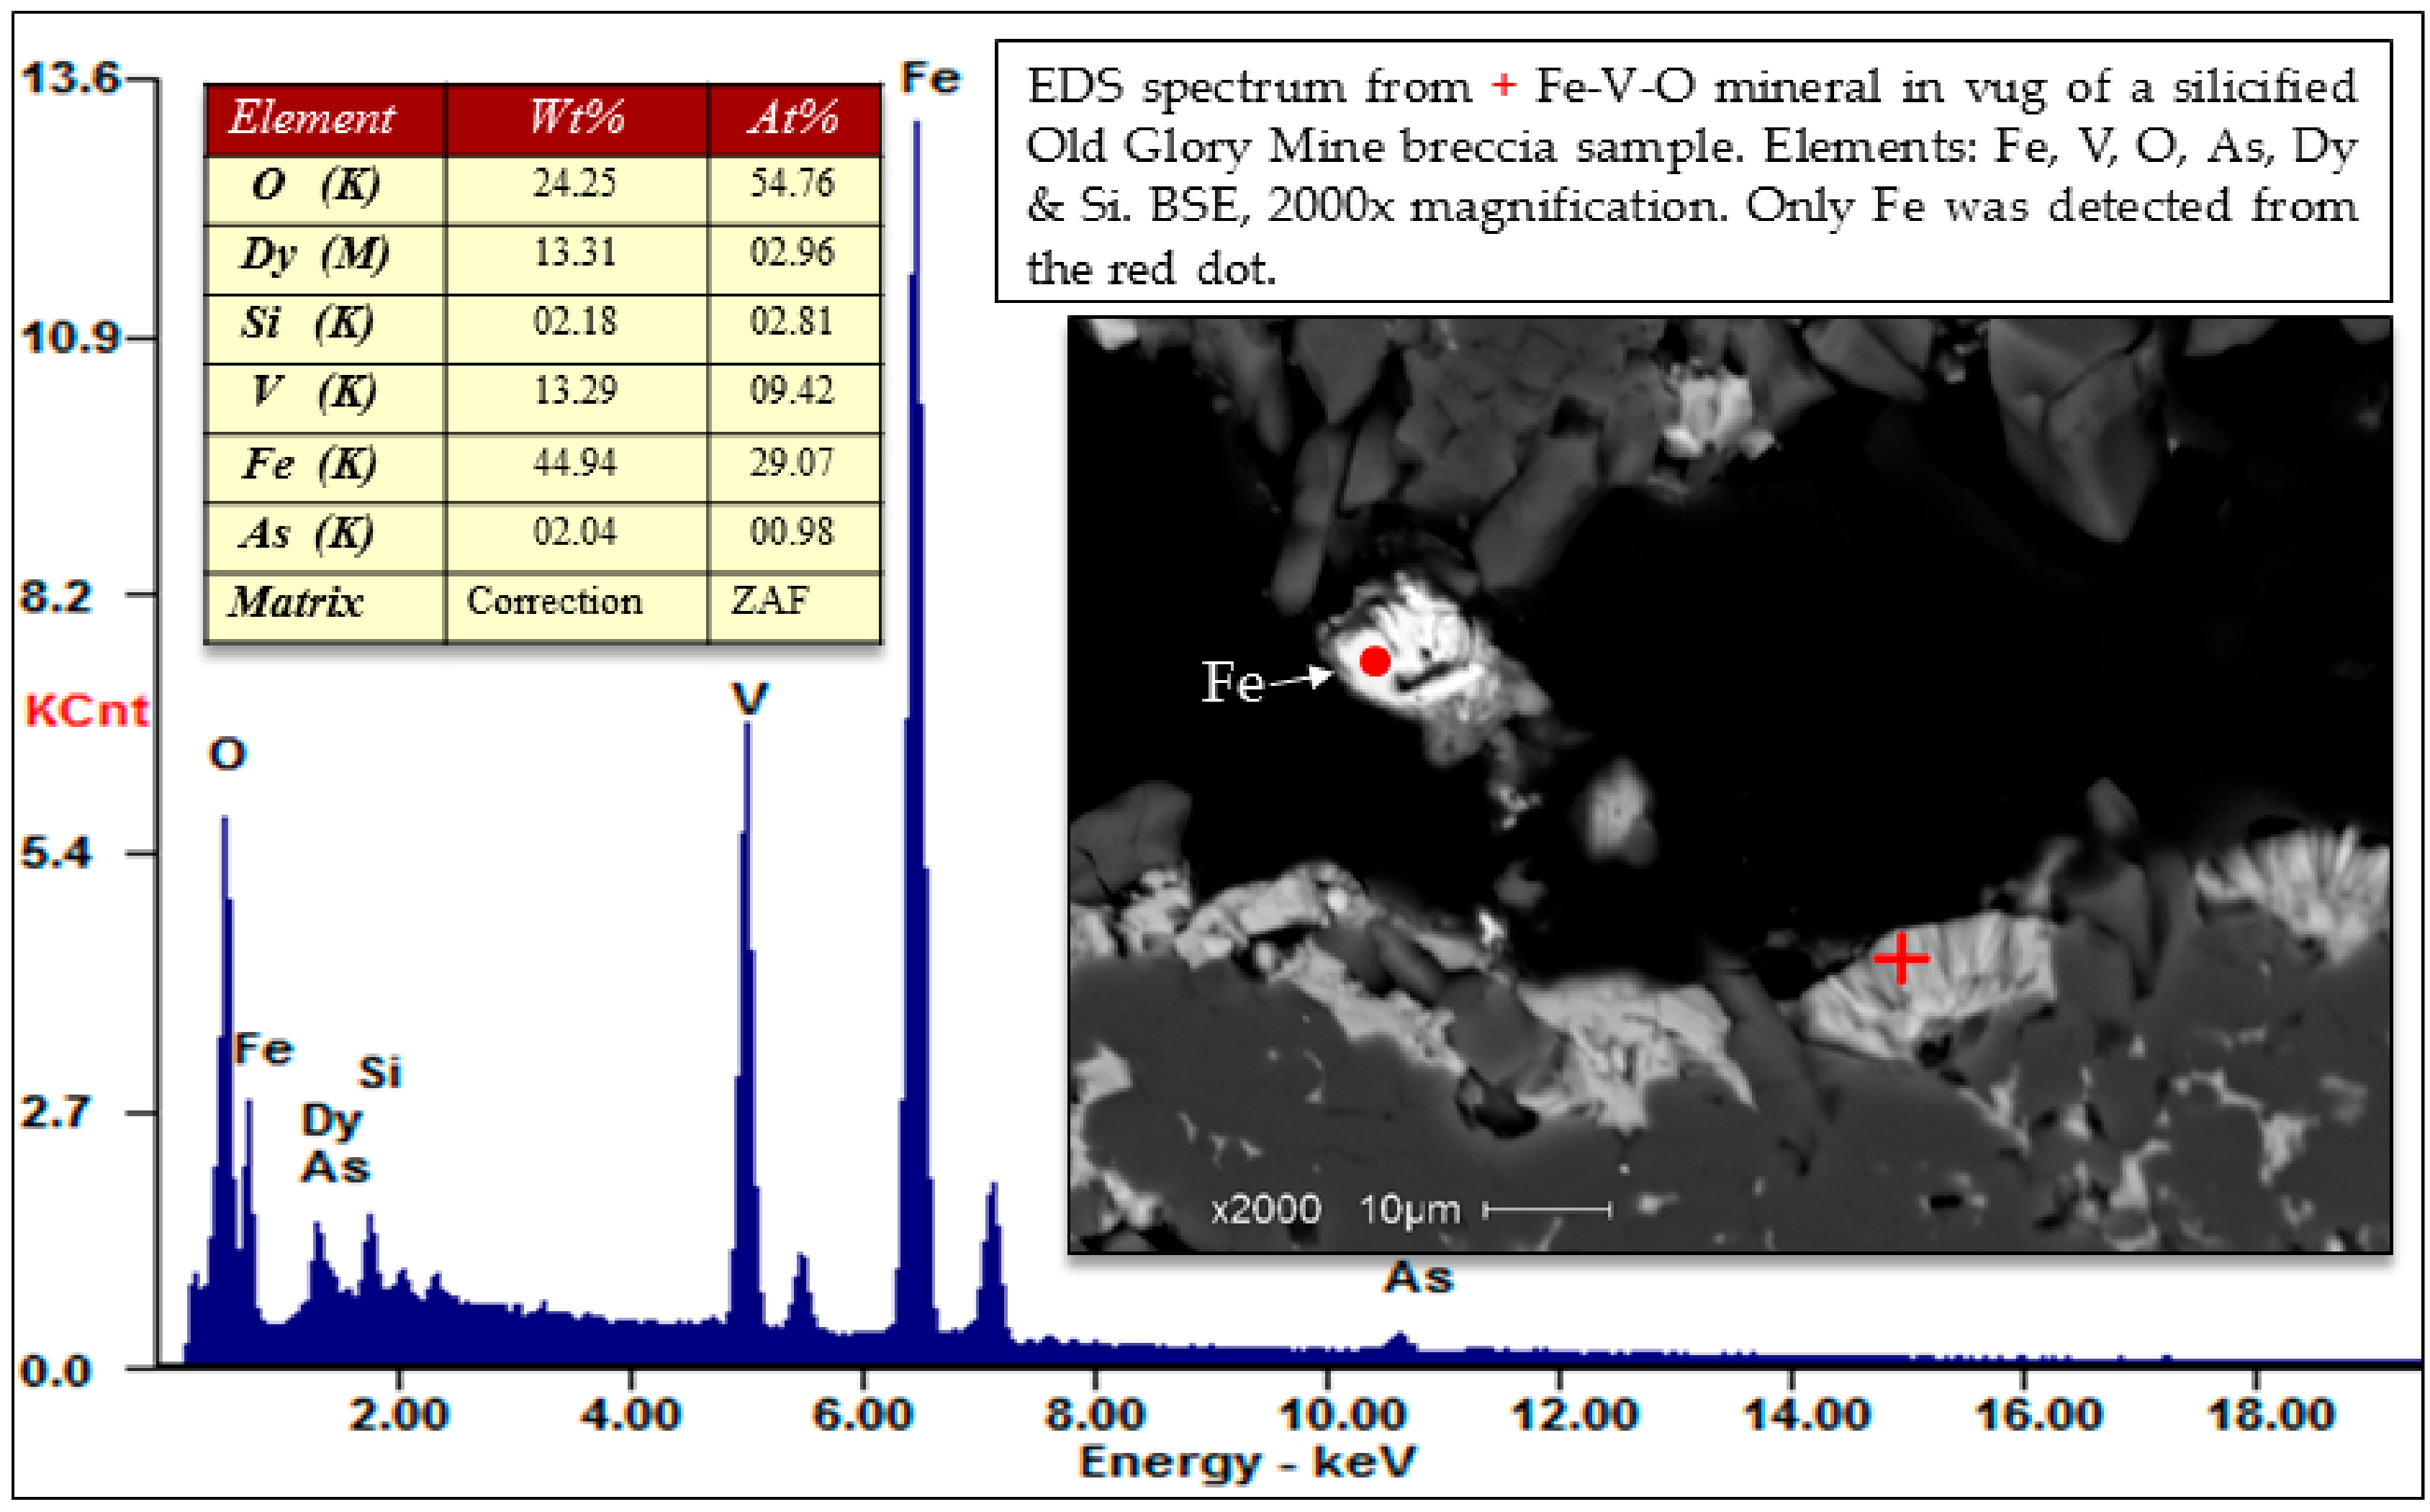
Selected EDS Analyses and Figures from This Study


References
- Montana’s Clean Water Act Information Center (MCWAC). Available online: http://deq.mt.gov/Water/WQPB/cwaic/reports (accessed on 15 May 2017).
- Barnhart, E. Differentiating natural vs. anthropogenic mercury inputs and subsequent Se/Hg interactions and biogeochemical cycling in Bighorn Lake, Bighorn Canyon National Recreation Area, Montana and Wyoming. Presented at U.S. Geological Survey NOROCK EcoLunch and Webinar, Montana State University, Bozeman, MT, USA, 24 March 2016. [Google Scholar]
- Eggers, M.J.; Moore-Nall, A.L.; Doyle, J.T.; Lefthand, M.J.; Young, S.L.; Bends, A.L.; Committee, C.E.H.S.; Camper, A.K. Potential Health Risks from Uranium in Home Well Water: An Investigation by the Apsaalooke (Crow) Tribal Research Group. Geosciences 2015, 5, 67–94. [Google Scholar] [CrossRef]
- Cummins, C.; Eggers, M.; Hamner, S.; Camper, A.; Ford, T.E. Mercury levels detected in fish from rivers of the Crow Reservation, Montana. In Proceedings of the SCREES National Water Conference, St. Louis, MO, USA, 8–11 February 2009. [Google Scholar]
- Van Gosen, B.S.; Wilson, A.B.; Hammarstrom, J.M. Mineral Resource Assessment of the Custer National Forest in the Pryor Mountains, Carbon County, South-Central Montana; U.S. Geological Survey Open-File Report 96-256; U.S. Geological Survey: Denver, CO, USA, 1996; 76p. Available online: https://pubs.er.usgs.gov/publication/ofr96256 (accessed on 13 December 2015).
- Patterson, C.G.; Toth, M.I.; Kulik, D.M.; Esparza, L.E.; Schmauch, S.W.; Benham, J.R. Mineral Resources of the Pryor Mountain, Burnt Timber Canyon, and Big Horn Tack-on Wilderness Study Areas, Carbon County, Montana and Big Horn County, Wyoming; U.S. Geological Survey Bulletin 1723; U.S. Geological Survey: Denver, CO, USA, 1988; pp. 1–15. Available online: https://pubs.er.usgs.gov/publication/b1723 (accessed on 13 December 2015).
- Hauptman, C.M. Uranium in the Pryor Mountain area of southern Montana and northern Wyoming. Uranium Mod. Min. 1956, 3, 14–21. [Google Scholar]
- Hart, O.M. Uranium deposits in the Pryor-Big Horn Mountains, Carbon County, Montana, and Big Horn County, Wyoming. In Proceedings of the United Nations 2nd International Conference on Peaceful Uses of Atomic Energy, Geneva, Switzerland, 1–13 September 1958; pp. 523–526. [Google Scholar]
- Harris, R.E. Uranium and thorium in the Bighorn Basin. In Wyoming Geological Association, 34th Annual Field Conference Guidebook, 1983, Geology of the Bighorn Basin; Boberg, W.W., Ed.; Wyoming Geological Association: Casper, WY, USA, 1983; pp. 171–177. ISBN 9789993362418. [Google Scholar]
- Hurley, G. Geology and Mineralogy of the Devil Canyon/Little Mountain Area, Northern Big Horn Mountains, Wyoming. In Wyoming Geological Association, 47th Annual Field Conference Guidebook, 1996, Resources of the Bighorn Basin; Bowen, C.E., Kirkwood, S.C., Miller, T.S., Eds.; Wyoming Geological Association: Casper, WY, USA, 1996; pp. 281–295. [Google Scholar]
- McEldowney, R.C.; Abshier, J.F.; Lootens, D.J. Geology of uranium deposits in the Madison Limestone, Little Mountain area, Big Horn County, Wyoming. In Exploration frontiers of the Central and Southern Rockies; Veal, H.K., Ed.; Rocky Mountain Association of Geologists: Denver, CO, USA, 1977; pp. 321–336. [Google Scholar]
- Wilson, W.H. Radioactive Mineral Deposits of Wyoming Geological Survey of Wyoming; Report of Investigations; Wyoming Geologic Survey: Laramie, WY, USA, 1960; Volume 7, 41p.
- Abandoned Mine Lands Portal. Available online: http://www.abandonedmines.gov/wbd_um.html (accessed on 20 December 2014).
- Warchola, R.J.; Stockton, T.J. National Uranium Resource Evaluation, Billings Quadrangle, Montana; Technical Report PGJ/F-015(82); U.S. Department of Energy: Grand Junction, CO, USA, 1982; 33p.
- Sahinen, U.M. Fluorspar deposits in Montana. MBMG Bull. 1962, 28, 34–35. [Google Scholar]
- U.S. Department of Energy. Billings Quadrangle-Residual Intensity Magnetic Anomaly Contour Map; Open-File Report GJM-096, pl.4; U.S. Department of Energy: Grand Junction, CO, USA, 1982.
- Schultz, R.L. Caves of the Bighorn-Pryor Mountains of Montana and Wyoming. JCKS 1969, 10, 1–28. [Google Scholar]
- Engel, A.S.; Stern, L.A.; Bennett, P.C. Microbial contributions to cave formation: New insight into sulfuric acid speleogenesis. Geology 2004, 32, 369–372. [Google Scholar] [CrossRef]
- Egemeier, S.J. Cavern Development by Thermal Waters with a Possible Bearing on Ore Deposition. Ph.D. Thesis, Stanford University, Stanford, CA, USA, 1973; 88p. [Google Scholar]
- Love, J.D. Vanadium and Associated Elements in the Phosphoria Formation in the Afton Area, Western Wyoming; U.S. Geological Survey Professional Paper 424C; U.S. Geological Survey: Denver, CO, USA, 1961; pp. C279–C282.
- Love, J.D.; Smith, D.G.; Browne, D.G.; Carter, L.M. Vanadium Deposits in the Lower Permian Phosphoria Formation, Afton Area, Lincoln County, Western Wyoming; U.S. Geological Survey Professional Paper 1637; U.S. Geological Survey: Denver, CO, USA, 2004; 28p, ISBN 9780607916898.
- Rubey, W.W. Vanadiferous shale in the Phosphoria Formation, Wyoming and Idaho. (Abstract). Econ. Geol. 1943, 38, 87. [Google Scholar]
- Stone, D.S. Theory of Paleozoic Oil and Gas Accumulation Bighorn Basin Wyoming. AAPG Bull. 1967, 51, 2056–2114. [Google Scholar]
- Sheldon, R.P. Long distance migration of oil in Wyoming. Mt. Geol. 1967, 4, 53–65. [Google Scholar]
- Blackstone, D.L., Jr. Foreland deformation, compression as a cause. Rocky Mt. Geol. 1980, 18, 83–100. [Google Scholar]
- Blackstone, D.L., Jr. Foreland Compressional Tectonics: Southern Bighorn Basin and Adjacent Areas, Wyoming; Geological Survey of Wyoming Report of Investigations; Wyoming Geological Survey: Laramie, WY, USA, 1986; Volume 34, pp. 1–27.
- Richards, P.W. Geology of the Bighorn Canyon-Hardin Area, Montana and Wyoming; U.S. Geological Survey Bulletin 1026; USGS: Helena, MT, USA, 1955; pp. 1–93. Available online: http://pubs.usgs.gov/bul/1026/report.pdf (accessed on 13 December 2015).
- Sando, W.J. Madison Limestone (Mississippian) paleokarst: A geologic synthesis. In Paleokarst; James, N.P., Choquette, P.W., Eds.; Springer: New York, NY, USA, 1988; pp. 256–277. [Google Scholar]
- Sando, W.J. Ancient solution phenomena in the Madison Limestone (Mississippian) of north-central Wyoming. USGS J. Res. 1974, 2, 133–141. [Google Scholar]
- Lopez, D.A. Field Guide to the Northern Pryor Bighorn Structural Block, South Central Montana; Open-File Report 330; Montana Bureau of Mines and Geology: Butte, MT, USA, 1995. [Google Scholar]
- Bird, P. Stress direction history of the western United States and Mexico since 85 Ma. Tectonics 2002, 21, 1–12. [Google Scholar] [CrossRef]
- Neely, T.G.; Erslev, E.A. The interplay of fold mechanisms and basement weaknesses at the transition between Laramide basement-involved arches, north-central Wyoming, USA. J. Struct. Geol. 2009, 31, 1012–1027. [Google Scholar] [CrossRef]
- Brown, W.G. Structural style of Laramide basement-cored uplifts and associated folds. In Geology of Wyoming; Snoke, A., Steidtmann, J., Roberts, S., Eds.; Geological Survey of Wyoming Memoir No. 5; The Geological Survey of Wyoming: Laramie, WY, USA, 1993; pp. 312–371. [Google Scholar]
- Dickinson, W.R.; Klute, M.A.; Hayes, M.J.; Janecke, S.U.; Lundin, E.R.; McKittrick, M.A.; Olivares, M.D. Paleogeographic and paleotectonic setting of Laramide sedimentary basins in the central Rocky Mountain region. Geol. Soc. Am. Bull. 1988, 100, 1023–1039. [Google Scholar] [CrossRef]
- Erslev, E.A. Thrusts, back-thrusts, and detachment of the Rocky Mountain foreland arches. In Laramide Basement Deformation in the Rocky Mountain Foreland of the Western United States; Schmidt, C.J., Chase, R.B., Erslev, E.A., Eds.; Geological Society of America Special Papers 280: Boulder, Colorado, USA, 1993; pp. 339–358. [Google Scholar]
- Stahl, J. Fracture Analysis of Circum-Bighorn Basin Anticlines, Wyoming-Montana. Master’s Thesis, Montana State University, Bozeman, MT, USA, 2015; 152p. [Google Scholar]
- Moore-Nall, A.L.; Lageson, D.R. Uranium Vanadium Mineralization in Mississippian Aged Paleokarst, Northern Bighorn Basin, Montana and Wyoming, Indicates a Hydrothermal Permian Phosphoria Formation Source of Metals Including REE and Tl. Presented at the the GSA Annual Meeting, Denver, Colorado, USA, 9–12 October 2016; Available online: https://gsa.confex.com/gsa/2016AM/webprogram/Paper287959.html (accessed on 13 December 2016).
- Dickson, J.A.D. A modified technique for carbonates in thin section. Nature 1965, 205, 587. [Google Scholar] [CrossRef]
- Folk, R.L. Detection of organic matter in thin sections of carbonate rock using a white card. Sediment. Geol. 1987, 54, 193–200. [Google Scholar] [CrossRef]
- Serc.Carleton Website. Available online: http://serc.carleton.edu/research_education/geochemsheets/bse.html (accessed on 17 November 2015).
- Moore-Nall, A.L.; Lageson, D.R. Francevillite [(Ba,Pb)(UO2)2(V2O8)·5H2O] identified in the Uranium Vanadium deposits in the Pryor Mountain Mining District, Montana and the Little Mountain Mining District, Wyoming may provide a link to the elevated lead in the Bighorn River and be related to fluid migration of the Lower Kane Cave, Wyoming. Presented at the GSA Annual Meeting, Denver, CO, USA, 27–30 October 2013; Available online: https://gsa.confex.com/gsa/2013AM/webprogram/Paper225217.html (accessed on 10 December 2015).
- Francevillite. Available online: http://www.handbookofmineralogy.org/pdfs/francevillite.pdf (accessed on 21 December 2015).
- Carnotite Group. Available online: http://www.mindat.org/min-32551.html (accessed on 21 December 2015).
- Thallian Carnotite. Available online: http://www.mindat.org/min-32379.html (accessed on 21 December 2015).
- Burns, P.C.; Finch, R. (Eds.) Reviews in Mineralogy, Uranium: Mineralogy, Geochemistry and the Environment; Mineralogical Society of America: Washington, DC, USA, 1999; Volume 38, 680p. [Google Scholar]
- Davies, G.R.; Smith, L.B., Jr. Structurally controlled hydrothermal dolomite reservoir facies: An Overview. AAPG Bull. 2006, 90, 1641–1690. [Google Scholar] [CrossRef]
- Katz, D.A.; Eberli, G.P.; Swart, P.K.; Smith, L.B. Tectonic-hydrothermal brecciation associated with calcite precipitation and permeability destruction in Mississippian carbonate reservoirs Montana and Wyoming. AAPG Bull. 2006, 90, 1803–1841. [Google Scholar] [CrossRef]
- Smith, L.B., Jr.; Eberli, G.P.; Sonnenfeld, M.D. Sequence stratigraphic and paleogeographic distribution of reservoir quality dolomite, Madison Formation, Wyoming and Montana. In Integration of Outcrop and Modern Analogues in Reservoir Modeling; AAPG Memoir; Grammer, G.M., Eberli, G.P., Harris, P.M., Eds.; American Association of Petroleum Geologists: Tulsa, OK, USA, 2004; Volume 80, pp. 94–118. [Google Scholar]
- Westphal, H.; Eberli, G.P.; Smith, L.B.; Grammer, G.M.; Kislak, J. Reservoir characterization of the Mississippian Madison Formation, Wind River Basin, Wyoming. AAPG Bull. 2004, 88, 405–432. [Google Scholar] [CrossRef]
- Kislak, J.; Smith, L.; Peacock, D.; Eberli, G.; Swart, P. Classification, Distribution and Origin of Hydrothermal Breccias, Madison Formation, Wyoming. In Proceedings of the AAPG Annual Meeting Program; American Association of Petroleum Geologists: Denver, CO, USA, 2001. [Google Scholar]
- Beaudoin, N.; Bellahsen, N.; Lacombe, O.; Emmanuel, L. Fracture-controlled paleohydrogeology in a basement-cored, fault-related fold: Sheep Mountain Anticline, Wyoming, United States. Geochem. Geophys. Geosyst. 2011, 12, 1–15. [Google Scholar] [CrossRef]
- Spötl, C.; Pitman, J.K. Saddle (Baroque) Dolomite in Carbonates and Sandstones: A Reappraisal of a Burial-Diagenetic Concept. In Carbonate Cementation in Sandstones: Distribution Patterns and Geochemical Evolution; Morad, S., Ed.; Blackwell Publishing Ltd.: Oxford, UK, 1998; Chapter 19. [Google Scholar]
- Moore-Nall, A.L.; Lageson, D.R. Herkimer diamonds in the Pennsylvanian Tensleep Formation may indicate hydrothermal influences for mineralization of the Red Pryor Mountain uranium/vanadium deposits. Presented at the GSA Annual Meeting, Minneapolis, MN, USA, 9–12 October 2011; Available online: https://gsa.confex.com/gsa/2011AM/finalprogram/abstract_198138.htm (accessed on 10 December 2015).
- Witherite. Available online: http://www.mindat.org/min-4299.html (accessed on 17 February 2016).
- Halloysite. Available online: http://www.mindat.org/min-1808.html (accessed on 17 February 2016).
- Mariano, A.N. Some further geological applications of cathodoluminescence. In Cathodoluminescence of Geological Materials; Marshall, D.J., Ed.; Unwin Hyman: Boston, MA, USA, 1988; 146p. [Google Scholar]
- Cherniak, D.J.; Zhang, X.Y.; Wayne, N.K.; Watson, E.B. Sr, Y, and REE diffusion in fluorite. Chem. Geol. 2001, 181, 99–111. [Google Scholar] [CrossRef]
- Marshall, D.J. Cathodoluminescence of Geological Materials; Unwin Hyman: Boston, MA, USA, 1988; 146p. [Google Scholar]
- Habermann, D.; Neuser, R.D.; Richter, D.K. REE-activated cathodoluminescence of calcite and dolomite: High-resolution spectrometric analysis of CL emission (HRS-CL). Sediment. Geol. 1996, 101, 1–7. [Google Scholar] [CrossRef]
- Summa, L.; Senior Technical Consultant, ExxonMobile Upstream Research Company, Houston, TX, USA Results of fluid inclusion work from Pryor Mountains performed at Fluid Inc., Denver, CO, USA. Personal communication, 6 December 2011.
- Reynolds, J.A.; Scientist, Fluid Inc., Denver, CO, USA Description of Fluid Inclusion Work of Pryor Mountain Samples at Fluid Inc. Personal communication, 2 December 2011.
- Gromet, P.L.; Dymek, R.F.; Haskin, L.A.; Korotev, R.L. The “North American shale composite”—Its compilation, major and trace element characteristics. Geochim. Cosmochim. Acta 1984, 48, 2469–2482. [Google Scholar] [CrossRef]
- Taylor, S.R.; McLennan, S.M. Rare Earth Elements in Sedimentary Rocks: Influence of Provenance and Sedimentary Processes. In Geochemistry and Mineralogy of Rare Earth Elements; Lipin, R.R., McKay, G.A., Eds.; Mineralogical Society of America: Washington, DC, USA, 1989; Volume 21, pp. 169–200. [Google Scholar]
- McKelvey, V.E.; Williams, J.S.; Sheldon, R.P.; Cressman, E.R.; Cheney, T.M.; Swanson, R.W. The Phosphoria, Park City, and Shedhorn Formations in the Western Phosphate Field; U.S. Geological Survey Professional Paper 313-A; U.S. Geological Survey: Denver, CO, USA, 1959; 47p.
- Sheldon, R.P. Physical Stratigraphy and Mineral Resources of Permian Rocks in Western Wyoming; U.S. Geological Survey, Professional Paper 313-B; U.S. Geological Survey: Denver, CO, USA, 1963; 273p.
- Gulbrandsen, R.A.; Reeser, D.W. An occurrence of Permian manganese nodules near Dillon, Montana; U.S. Geological Survey Professional Paper 650-C; U.S. Geological Survey: Denver, CO, USA, 1969; pp. C49–C57.
- Gulbrandsen, R.A. Analytical Data on the Phosphoria Formation Western United States; U.S. Geological Survey Open-File Report 75-554; U.S. Geological Survey: Washington, DC, USA, 1975; 45p. Available online: http://pubs.usgs.gov/of/1975/0554/report.pdf (accessed on 17 February 2016).
- McKelvey, V.E.; Strobell, J.D., Jr.; Slaughter, A.L. The Vanadiferous Zone of the Phosphoria Formation in Western Wyoming and Southeastern Idaho; U.S. Geological Survey, Professional Paper 1465; U.S. Geological Survey: Denver, CO, USA, 1986; 27p.
- Medrano, M.D.; Piper, D.Z. Partition of Minor Elements and Major-Element Oxides between Rock Components and Calculation of the Marine-Derived Fraction of the Minor Elements in Rocks of the Phosphoria Formation, Idaho and Wyoming; U.S. Geological Survey Open-File Report 95-270; U.S. Geological Survey: Denver, CO, USA, 1995; 79p.
- Piper, D.Z. Trace Elements and Major-Element Oxides in the Phosphoria Formation at Enoch Valley, Idaho; Permian Sources and Current Reactivity; U.S. Geological Survey Open File Report 99-0163; U.S. Geological Survey: Denver, CO, USA, 1999; 66p. Available online: https://pubs.er.usgs.gov/publication/ofr99163 (accessed on 17 February 2016).
- Piper, D.Z.; Skorupa, J.P.; Presser, T.S.; Hardy, M.A.; Hamilton, S.J.; Huebner, M.; Gulbrandsen, R.A. The Phosphoria Formation at the Hot Springs Mine in Southeast Idaho: A Source of Selenium and other Trace Elements to Surface Water, Ground Water, Vegetation, and Biota; U.S. Geological Survey Open-File Report 00-050; U.S. Geological Survey: Denver, CO, USA, 2000; 73p.
- Moyle, P.R.; Causey, D.J. Chemical Composition of Samples Collected from Waste Rock Dumps and Other Mining-Related Features at Selected Phosphate Mines in Southeastern Idaho, Western Wyoming, and Northern Utah; U.S. Geological Survey Open-File Report 01-411; U.S. Geological Survey: Denver, CO, USA, 2001; 46p.
- Hein, J.R.; McIntyre, B.; Perkins, R.B.; Piper, D.Z.; Evans, J. Composition of the Rex Chert and Associated Rocks of the Permian Phosphoria Formation: Soda Springs Area, SE Idaho; U.S. Geological Survey Open File Report 02-345; U.S. Geological Survey: Denver, CO, USA, 2002; 30p.
- Perkins, R.B.; McIntyre, B.; Hein, J.R.; Piper, D.Z. Geochemistry of Permian rocks from the Margins of the Phosphoria Basin: Lakeridge Core, Western Wyoming; U.S. Geological Survey Open File Report 03-21; U.S. Geological Survey: Denver, CO, USA, 2003; 60p.
- Emsbo, P.; McLaughlin, P.I.; Breit, G.N.; Du Bray, E.A.; Koenig, A.E. Rare earth elements in sedimentary phosphate deposits: Solution to the global REE crisis? Gondwana Res. 2015, 27, 776–785. Available online: http://www.sciencedirect.com/science/article/pii/S1342937X14003128 (accessed on 27 March 2016). [CrossRef]
- Jasinski, S.M. Phosphate Rock; U.S. Geological Survey Mineral Commodity Summaries; U.S. Geological Survey: Denver, CO, USA, 2011; pp. 118–119.
- Carnes, J.D. Phosphate Rock in Wyoming; Wyoming State Geological Survey Report of Investigations No. 68; U.S. Geological Survey: Denver, CO, USA, 2015; 34p.
- Goldberg, E.D. Chemistry in the Oceans. In Oceanography; Sears, M., Ed.; American Association for the Advancement of Science: Washington, DC, USA, 1961; Volume 67, pp. 583–597. [Google Scholar]
- Elderfield, H.; Greaves, M. The rare earth elements in seawater. Nature 1982, 296, 214–219. [Google Scholar] [CrossRef]
- Sholkovitz, E.R. Ocean particle chemistry: The fractionation of rare earth elements between suspended particles and seawater. Geochim. Cosmochim. Acta 1994, 58, 1567–1579. [Google Scholar] [CrossRef]
- Lillis, P.G.; Selby, D. Evaluation of the rhenium–osmium geochronometer in the Phosphoria petroleum system, Bighorn Basin of Wyoming and Montana, USA. Geochim. Cosmochim. Acta 2013, 118, 312–330. [Google Scholar] [CrossRef] [Green Version]
- Wyoming State Geological Survey Website, Oil and Gas Map. Available online: http://www.wsgs.wyo.gov/products/wsgs-2016-ms-103.pdf (accessed on 8 October 2016).
- Meyer, R.F.; Attanasi, E.D.; Freeman, P.A. Heavy Oil and Natural Bitumen Resources in Geological Basins of the World; U.S. Geological Survey Open-File Report 2007-1084; U.S. Geological Survey: Denver, CO, USA, 2007. Available online: http://pubs.usgs.gov/of/2007/1084/ (accessed on 10 October 2016).
- Hollerbach, A. Influence of Biodegradation on the Chemical Composition of Heavy Oil and Bitumen: Characterization, Maturation, and Degradation. In Exploration for Heavy Crude Oil and Natural Bitumen; Section II; Meyer, R.F., Ed.; AAPG Studies in Geology: Tulsa, OK, USA, 1997; pp. 243–247. [Google Scholar]
- Langmuir, D. Uranium solution-mineral equilibria at low temperatures with applications to sedimentary ore deposits. Geochim. Cosmochim. Acta 1978, 42, 547–569. [Google Scholar] [CrossRef]
- Finch, R.; Murakami, T. Systematics and Paragenesis of Uranium Minerals. In Reviews in Mineralogy, Uranium: Mineralogy, Geochemistry and the Environment; Burns, P.C., Finch, R., Eds.; Mineralogical Society of America: Washington, DC, USA, 1999; Volume 38, pp. 91–179. [Google Scholar]
- Garrels, R.M.; Christ, C.L. Behavior of uranium minerals during oxidation. In Geochemistry and Mineralogy of the Colorado Plateau Uranium Ores; U.S. Geological Survey Professional Paper 320; Garrels, R.M., Larsen, E.S., Eds.; U.S. Geological Survey: Washington, DC, USA, 1959; pp. 81–90. [Google Scholar]
- Phillips, W.J. Hydraulic fracturing and mineralization. J. Geol. Soc. 1972, 128, 337–359. [Google Scholar] [CrossRef]
- Sibson, R.H.; Moore, J.M.M.; Rankin, A.H. Seismic pumping—A hydrothermal fluid transport mechanism. J. Geol. Soc. Lond. 1975, 131, 653–659. [Google Scholar] [CrossRef]
- Du Bray, E.A.; Harlan, S.S. Geology and Tectonic Setting of the Cretaceous Sliderock Mountain volcano, Montana; U.S. Geological Survey Professional Paper 1602; U.S. Geological Survey: Denver, CO, USA, 1998; 19p. Available online: http://pubs.er.usgs.gov/publication/pp1602 (accessed on 10 December 2015).
- Brozdowski, R.A. Geologic Setting and Xenoliths of the Lodgepole Intrusive Area—Implications for the Northern Extent of the Stillwater Complex. Ph.D. Thesis, Temple University, Philadelphia, PA, USA, 1983; 322p. [Google Scholar]
- Stock, G.M.; Riihimaki, C.A.; Anderson, R.S. Age constraints on cave development and landscape evolution in the Bighorn Basin of Wyoming, USA. J. Cave Karst Stud. 2006, 68, 76–84. [Google Scholar]
- Sadeghi, S.; Sheikhzadeh, E. Solid phase extraction using silica gel modified with murexide for preconcentration of uranium (VI) ions from water samples. J. Hazard. Mater. 2009, 163, 861–868. [Google Scholar] [CrossRef] [PubMed]
- Allen, J.; Berlin, M.; Hughes, M.; Johnston, E.; Kailasam, V.; Rosenberg, E.; Sardot, T.; Wood, J.; Hart, C. Structural design at the polymer surface interface in nanoporous silica polyamine composites. Mater. Chem. Phys. 2011, 126, 973–982. [Google Scholar] [CrossRef]
- Rosenberg, E.; Pang, D. System for Extracting Soluble Heavy Metals from Liquid Solutions: Assigned to UM, licensed to Purity Systems, Inc. U.S. Patent No. 5,997,748, 1999. [Google Scholar]
- System for Extracting Soluble Heavy Metals from Liquid Solutions: With David Pang, assigned to UM, licensed to Purity Systems, Inc. U.S. Patent 5,695,882, 1997.
- Allen, J.J.; Rosenberg, E.; Johnston, E.; Hart, C. Sol-gel synthesis and characterization of silica polyamine composites: Applications to metal ion capture. ACS Appl. Mater. Interfaces 2012, 4, 1573–1584. [Google Scholar] [CrossRef] [PubMed]
- Hughes, M.A.; Nielsen, D.; Rosenberg, E.; Gobetto, R.; Viale, A.; Burton, S.D.; Ferel, J. Structural investigations of silica polyamine composites: Surface coverage, metal ion coordination, and ligand modification. Ind. Eng. Chem. Res. 2006, 45, 6538–6547. [Google Scholar] [CrossRef]
- Kailasam, V.; Rosenberg, E.; Nielsen, D. Characterization of surface-bound Zr(IV) and its application to removal of As(V) and As(III) from aqueous systems using phosphonic acid modified nanoporous silica polyamine composites. Ind. Eng. Chem. Res. 2009, 48, 3991–4001. [Google Scholar] [CrossRef]
- Hughes, M.A.; Rosenberg, E. Characterization and applications of poly-acetate modified silica polyamine composites. Sep. Sci. Technol. 2007, 42, 261–283. [Google Scholar] [CrossRef]
- Kailasam, V. The Removal and Recovery of Oxo-Anions from Aqueous Systems Using Nano-Porous Silica Polyamine Composites. Ph.D. Thesis, University of Montana, Missoula, MT, USA, 2009. [Google Scholar]
- Hughes, M.; Miranda, P.; Nielsen, D.; Edward Rosenberg, E.; Gobetto, R.; Alessandra Viale, A.; Burton, S. Silica polyamine composites: New supramolecular materials for cation and anion recovery and remediation. Macromol. Symp. 2006, 235, 161–178. [Google Scholar] [CrossRef]
- Taylor, S.R.; McLennan, S.M. The Continental Crust: Its Composition and Evolution; Blackwell Scientific Publishing: Oxford, UK, 1985; p. 312. [Google Scholar]
- Mulkey, J.P.; Oehme, F.W. A review of thallium toxicity. Vet. Hum. Toxicol. 1993, 35, 445–453. [Google Scholar] [PubMed]
- Thallium Element Information. Available online: http://www.rsc.org/periodic-table/element/81/thallium (accessed on 17 February 2016).
- Ikramuddin, M.; Asmeron, Y.; Nordstrom, P.M.; Kinart, K.P.; Martin, W.M.; Digby, S.J.M.; Elder, D.D.; Nijak, W.F.; Afemari, A.A. Thallium: A potential guide to mineral deposits. J. Geochem. Explor. 1983, 19, 465–490. [Google Scholar] [CrossRef]
- De Albuquerque, C.A.R.; Shaw, D.M. Thallium. In Handbook of Geochemistry; Wedepohl, K.H., Ed.; Springer: Berlin, Germany, 1972; Volume 2, Section 81. [Google Scholar]
- Berger, B.R. Descriptive model of carbonate-hosted Au-Ag. In Mineral Deposit Models; Cox, D.P., Singer, D.A., Eds.; U.S. Geological Survey Bulletin 1693; U.S. Geological Survey: Denver, CO, USA, 1986; p. 175. [Google Scholar]
- Berger, B.R.; Bagby, W.C. The geology and origin of Carlin-type gold deposits. In Gold Metallogeny and Exploration; Foster, R.P., Ed.; Blackie and Son Ltd.: Glasgow, UK, 1990; pp. 210–248. [Google Scholar]
- Xiao, T.; Yang, F.; Li, S.; Zheng, B.; Ning, Z. Thallium pollution in China: A geo-environmental perspective. Sci. Total Environ. 2012, 421–422, 51–58. [Google Scholar] [CrossRef] [PubMed]
- Haynes, W.M. (Ed.) CRC Handbook of Chemistry and Physics, 95th ed.; CRC Press/Taylor and Francis: Boca Raton, FL, USA, 2012; 2664p. [Google Scholar]
- Eggers, M.; Research Scientist, Center for BioFilm Engineering, Montana State University, Bozeman, MT, USA, Results of Tl MS-ICP Analyses of Drinking Water Well Samples from the Crow Reservation Performed at University of New Mexico, Albuquerque, NM. Personal communication, 2 May 2016.
- Carnotite Mineral Data. Available online: http://webmineral.com/data/Carnotite.shtml#.WdGTZltSxdg (accessed on 26 September 2017).
- Francevillite Mineral Data. Available online: http://webmineral.com/data/Francevillite.shtml#.WdHTsFtSxdg (accessed on 10 October 2016).


| Ore Minerals Reported in the Districts, *PMD Only | |||
|---|---|---|---|
| uranyl-vanadates | uranyl (silicate, carbonate, phosphate) | ||
| metatyuyamunite Ca(UO2)2(VO4)2·3-5H2O [5,6,7,10,11,14] | *uranophane Ca(UO2)2Si2O7·6H2O [5,6] | ||
| tyuyamunite Ca(UO2)2(VO4)2·5-8H2O [5,6,7,10,11,14] | *green liebigite Ca2(UO2)(CO3)3·11H2O [6] | ||
| *francevillite Ba(UO2)2(VO4)2·5H2O [this study] | *autunite Ca(UO2)2(PO4)2·10-12H2O [6] | ||
| *francevillite (Ba,Pb)(UO2)2(VO4)2·5H2O [this study [37]] | Crichtonite Group | ||
| *carnotite K2(UO2)2(VO4)2·3H2O [this study] | *davidite (Fe+2,La,U,Ca)6 (Ti,Fe+3)15(O,OH)36 [14] | ||
| *Unidentified Tl uranyl-vanadates [this study] | |||
| Gangue minerals reported in the districts [5], *PMD only [5,6,8,14,15] | |||
| hematite | iron-oxides | green radioactive calcite | *celestite |
| limonite | iron-hydroxides | dogtooth calcite | *dark purple fluorite |
| pyrite | clay minerals | dolomite | *golden and white barite |
| marcasite | gypsum | quartz | *opal |
| Gangue minerals identified in this study | *PMD only | ||
| *witherite BaCO3 | saddle dolomite | *halloysite Al2(Si2O5)(OH)4 | herkimer style quartz |
| pyrobitumen and or bitumen found as inclusions in minerals and coating fractures and bedding planes | |||
| District Sample | As | Ba | Hg | Mo | Ni | Pb | Tl | U | V | W | Zn | |
|---|---|---|---|---|---|---|---|---|---|---|---|---|
| Avg. crustal abund. | 0.8–1.5 | 150–500 | 0.067 | 0.8–1.5 | 44–156 | 5–17 | 0.2–0.8 | 0.5–3 | 107–271 | 0.7–2 | 71–83 | |
| PMD | FS131A | 262 | 1230 | 2.84 | 53 | <1 | <2 | 180 | 86,800 | 18,900 | 94 | 16 |
| PMD | Sandra713B | 99 | 6550 | 1.485 | 29 | 167 | 44 | 20 | 21,400 | 8730 | 24 | 804 |
| PMD | SBRX Sandra | 49 | 5460 | 0.333 | 11 | 38 | 7 | 10 | 2600 | 1950 | 71 | 136 |
| PMD | Perc Group | 329 | 5170 | 1.21 | 52 | 19 | 51 | 170 | 20,700 | 6700 | 30 | 95 |
| PMD | OGM04 | 1295 | 2310 | 0.354 | 152 | 2 | 13 | 100 | 10,600 | 4410 | 105 | 26 |
| PMD | P005 | 1080 | 1305 | 1.255 | 386 | 80 | 18 | 340 | 9000 | 6010 | 19 | 165 |
| PMD | Swamp Frog | 556 | 1320 | 0.396 | 791 | 11 | <2 | 340 | 6100 | 4160 | 81 | 44 |
| PMD | DandyMSP | 94 | 2470 | na | 20 | <1 | 35 | 490 | 8600 | 2220 | 382 | 9 |
| PMD | MarieMine | 87 | 533 | 1.715 | 319 | 15 | <2 | 30 | 2100 | 6740 | 40 | 57 |
| PMD | D2001 | 87 | 79.5 | 6.32 | 9 | 2 | 35 | 50 | 17,700 | 6310 | 16 | 849 |
| PMD | DandyMSPF | 30 | 39.6 | 3.4 | 4 | 21 | 8 | 10 | 3000 | 3320 | 12 | 76 |
| PMD | DandyMBr | 130 | 61.3 | 12.8 | 28 | 102 | 55 | 20 | 28,100 | 10500 | 26 | 1110 |
| LMD | Lisbon | 89 | 42.6 | 0.197 | 25 | 421 | 146 | 30 | 31,100 | 8520 | 11 | 1300 |
| LMD | LeoIncline02 | 726 | 255 | 0.179 | 137 | 517 | 57 | 230 | 16,000 | 10,300 | 11 | 2230 |
| PMD | OGM UV blk | 46 | 1530 | na | 21 | <1 | 2 | 50 | 4900 | 1240 | 107 | 7 |
| PMD | EP001 | 50 | 27.6 | na | 2 | 63 | 11 | 10 | 907 | 25 | 6 | 143 |
| LMD | LeoIncline | 116 | 183 | na | 98 | 191 | 28 | 20 | >1000 | 4330 | 13 | 970 |
| LMD | LisbonBX | 212 | 140 | na | 93 | 122 | 4 | 10 | 1300 | 1850 | 12 | 569 |
| LSM | Mm hosted bit. | 0.2 | 10 | 0.01 | 1.63 | 14.1 | 0.9 | 0.02 | 6.8 | 73 | 8.6 | 5 |
| LSM | Mm breccia bit | <0.1 | 20 | <0.01 | 0.12 | 1.5 | 0.5 | <0.02 | 4.04 | 7 | 2.4 | 2 |
| LSM | GooseEgg bit. | 1 | 630 | 0.01 | 0.46 | 3.2 | 1.5 | 0.03 | 11.6 | 8 | 21 | 9 |
© 2017 by the authors. Licensee MDPI, Basel, Switzerland. This article is an open access article distributed under the terms and conditions of the Creative Commons Attribution (CC BY) license (http://creativecommons.org/licenses/by/4.0/).
Share and Cite
Moore-Nall, A.L.; Tsosie, R.L. Possible Involvement of Permian Phosphoria Formation Oil as a Source of REE and Other Metals Associated with Complex U-V Mineralization in the Northern Bighorn Basin? Minerals 2017, 7, 232. https://doi.org/10.3390/min7120232
Moore-Nall AL, Tsosie RL. Possible Involvement of Permian Phosphoria Formation Oil as a Source of REE and Other Metals Associated with Complex U-V Mineralization in the Northern Bighorn Basin? Minerals. 2017; 7(12):232. https://doi.org/10.3390/min7120232
Chicago/Turabian StyleMoore-Nall, Anita L., and Ranalda L. Tsosie. 2017. "Possible Involvement of Permian Phosphoria Formation Oil as a Source of REE and Other Metals Associated with Complex U-V Mineralization in the Northern Bighorn Basin?" Minerals 7, no. 12: 232. https://doi.org/10.3390/min7120232
APA StyleMoore-Nall, A. L., & Tsosie, R. L. (2017). Possible Involvement of Permian Phosphoria Formation Oil as a Source of REE and Other Metals Associated with Complex U-V Mineralization in the Northern Bighorn Basin? Minerals, 7(12), 232. https://doi.org/10.3390/min7120232