Article

A Computer-Controlled SEM-EDX Routine for Characterizing Respirable Coal Mine Dust

Department of Mining and Minerals Engineering, Virginia Tech, Blacksburg, VA 24061, USA
*
Author to whom correspondence should be addressed.
Minerals 2017, 7(1), 15; https://doi.org/10.3390/min7010015
Submission received: 18 November 2016 / Revised: 4 January 2017 / Accepted: 16 January 2017 / Published: 23 January 2017

Abstract

:
A recent resurgence in coal workers’ pneumoconiosis (or “black lung”) and concerns over other related respiratory illnesses have highlighted the need to elucidate characteristics of airborne particulates in occupational environments. A better understanding of particle size, aspect ratio, or chemical composition may offer new insights regarding causal factors of such illnesses. Scanning electron microscopy analysis using energy dispersive X-ray (SEM-EDX) can be used to estimate these particle characteristics. If conducted manually, such work can be very time intensive, limiting the number of particles that can be analyzed. Moreover, potential exists for user bias in interpretation of EDX spectra. A computer-controlled (CC) routine, on the other hand, can allow similar analysis at a much faster rate, increasing total particle counts and reproducibility of results. This paper describes a CCSEM-EDX routine specifically developed for analysis of respirable dust samples from coal mines. The routine is verified based on reliability of results obtained on samples of known materials, and reproducibility of results obtained on a set of 10 dust samples collected in the field. The characteristics of the field samples are also discussed with respect to mine occupational environments.

1. Introduction

Respirable dust in underground coal mining environments has long been recognized as an occupational health hazard [1]. Particulates with an aerodynamic diameter less than 10 μm are generally considered respirable [2,3,4,5]. Coal workers’ pneumoconiosis (CWP, commonly referred to as “black lung”) and silicosis are the most prevalent occupational respiratory illnesses affecting coal miners, usually after chronic exposures to respirable dust [1]. These illnesses generally cause scarring of lung tissue, resulting in difficulty breathing amongst other symptoms, and can eventually lead to premature death [6,7]. Across the USA and elsewhere, dramatic reductions in CWP and silicosis cases have been achieved via a combination of regulatory dust exposure limits, improved ventilation, and development of dust abatement technologies [5,8,9,10,11,12].
In the USA, after passage of the Coal Mine Health and Safety Act in 1969, the Coal Workers’ Health Surveillance Program (CWHSP) was established in 1970 to detect early stages of CWP and prevent development of progressive massive fibrosis (PMF) [13]. This program collects and reports the results from miner chest X-rays in the CWHSP Data Query System [13]. Between 1970 and 1999, a decreasing trend in CWP incidence rates was generally observed amongst CWHSP participants across the US. However, since 1999, trends in some regions have unexpectedly reversed [8,14,15,16]. As shown in Figure 1, mid-central and south-central Appalachia, in particular, appear to have dramatically increased incidence rates—nearing or exceeding the 1970 rates in these regions [13]. Moreover, CWP and progressive massive fibrosis (PMF, the most severe and rapidly progressing form of lung fibrosis) appear to be affecting relatively younger miners than before [8,10,13,14,15]. While these alarming trends have not been fully explained, a number of causal factors have been suggested (e.g., see [14,15,16,17,18,19,20,21,22,23]), including exposure conditions and specific dust characteristics.
Several researchers have noted that underground mines in the most severely affected regions are extracting increasingly thinner coal seams, and thus also cutting more roof and floor rock (e.g., [17,20,22,23]). The roof rock (e.g., sandstone) in many of these mines includes significant silica content, and so higher concentrations of crystalline silica (quartz) may be expected in dust [19,23]. Many mines in parts of central Appalachia are also relatively small and accordingly have small labor forces. This means that some miners may be working longer hours and/or in a variety of job roles. In this case, individuals may be exposed to relatively high or variable dust concentrations and a range of dust characteristics [5,8,22]. Further, advances in mining equipment have yielded more powerful cutting machines for production activities, which are likely to generate relatively smaller dust particle sizes; and it has been suggested that small particles can be more harmful to health than larger respirable dust particles [21]. Indeed, particle size as well as shape (e.g., elongation, angularity, roughness) can affect the degree of dust particle deposition in the lungs [24]. Considering all of these, a more thorough understanding of specific dust particle characteristics and occupational exposures may assist in better understanding health outcomes.
Prior work in the authors’ research group led to the development of a standardized routine for characterizing respirable coal mine dust samples by particle size, shape, and chemistry distributions. It involves manual analysis with a scanning electron microscope equipped with energy dispersive X-ray (SEM-EDX), and has been described in detail elsewhere [25,26,27,28]. SEM-EDX is a very powerful tool for particulate characterization, and is well established for chemical identification of particles (e.g., see [29,30,31,32,33,34,35]) and determination of size and shape parameters (e.g., see [33,36]). The US Environmental Protection Agency (EPA) has produced detailed guidance on the use of SEM-EDX for analysis of particulate samples [37]. On a limited basis, SEM-EDX has been used specifically to investigate mine dust mineralogy and particle size in the context of occupational health (e.g., see [38,39,40,41]); however, it has not seen widespread use in this domain—probably due to the fact that it is relatively time and cost intensive.
With the previously developed manual SEM-EDX routine, analysis is generally limited to about 100 particles per sample, which requires up to 90 min of user time. The potential for user bias and/or error in interpretation of EDX chemical spectra also represent limitations for manual analysis [25,42]. A computer-controlled (CC) routine, on the other hand, could allow for more efficient, unbiased sample analysis. CCSEM-EDX has the ability to analyze on a frame-by-frame basis and gather particle size, shape (e.g., aspect ratio), and elemental (i.e., chemical) characteristics for individual particles [37]. Such analysis of particulates has been developing since the mid-1970s (e.g., see [43,44]), and significant progress has been made over the years to increase the rate, reliability, and level of data collection achievable per particle (e.g., see [45,46,47]). The ability to characterize many more particles with CCSEM (vs. manual SEM) generally improves reproducibility of results and statistical confidence in the data collected [45,46,47]. As such, CCSEM has seen increasing use for particulate analysis in a range of environmental applications, including identification of respiratory hazards like crystalline silica in specific dust sources (e.g., [48,49]). However, again, application to mine dust characterization has been scarce.
The objectives of the work described in this paper were to establish a CCSEM-EDX routine for specifically characterization of respirable coal mine dust particles; and verify the routine based on reliability of results obtained on known samples, and reproducibility of results between multiple scans of the same field samples. Particular dust characteristics determined for the fields samples are also discussed with respect to the mine environments where they were collected.

2. Materials and Methods

2.1. Dust Samples

A total of six laboratory-generated samples and ten field samples were used in this study to verify the CCSEM-EDX routine.

2.1.1. Lab-Generated Dust Samples

To evaluate the reliability of the CCSEM-EDX routine with respect to classifying particles into the correct chemistry category, a set of six respirable dust samples were generated in the laboratory from six known materials: washed coal, raw shale, a real rock dust product, high-grade quartz sand (Ward’s Science, Rochester, NY, USA) and kaolinite (Ward’s Science, Rochester, NY, USA), and calcite (Fisher Scientific, Fair Lawn, NJ, USA) powders. These materials were chosen because their primary constituents should represent the predominant chemical compositions of dust particles found in Appalachian coal mines (i.e., coal, alumino-silicates, quartz, carbonates, and heavy minerals such as pyrite).
The washed coal sample was obtained from a float sink test to ensure that it was relatively clean. Raw shale pieces were handpicked from a run-of-mine coal sample cut from the Peerless seam in mid-central Appalachia, which were expected to be dominated by aluminosilicate minerals. The rock dust sample was generated from a rock dust product provided by a partner mine; it is known to contain approximately 92% carbonates (i.e., calcite and dolomite) per separate X-ray diffraction (XRD) analysis commissioned by the mine operator. Because these are not pure materials, it was expected that the coal would contain a minor fraction of non-carbonaceous material; the shale would have some coal content, and likely minor fractions of other materials such as carbonates; and the rock dust would contain some non-carbonate minerals. For samples with minimal expected impurities, kaolinite was chosen to represent a “pure” alumino-silicate sample, and calcite was chosen to represent a “pure” carbonate sample. Finally, the quartz sample was prepared to verify that particles in this category are reliably classified.
To collect respirable particles of each material, a procedure was established similar to the EPA’s procedure for dry dust sample preparation from bulk powders [37], but using the same equipment as required for respirable dust sampling in underground coal mines and incorporating material pulverization (i.e., dust generation, except for the kaolinite and calcite, which were already fine enough to contain significant respirable particles). Samples were pulverized in a fume hood and aerosolized using compressed air. At the same time, Escort ELF dust sampling pumps (calibrated to 1.7 L/min) were operated in the fume hood with nylon Dorr-Oliver. The ELF pumps provide constant flow control, and are the same equipment certified for dust sampling in US underground coal mines [50,51]; The cyclones are also identical to those used for dust sampling in coal mines and ensure collection of only particles in the respirable range. Dust was collected directly onto 37-mm diameter polycarbonate (PC) filters in new, two-piece cassettes. PC media is ideal for SEM-EDX analysis of fine particulates because it provides a smooth background with consistently-sized pores and very low impurities [37]. Sample collection times ranged from approximately 3–5 min. In order to minimize contamination, the pulverizer (when used) and sampling pumps were thoroughly cleaned between collection of each sample material (i.e., using compressed air, wiping with moist towels, and then using compressed air again).
To prepare the dust samples for SEM-EDX analysis, clean tweezers were used to remove the filters from the cassettes, and then a circular sub-section (9-mm diameter) was carefully cut from the center of each filter using a stainless-steel trephine. Each subsection was mounted to an aluminum SEM stub using double-sided tape. The stubs were sputter coated with gold/palladium (Au/Pd) to render the surface of the sample electrically conductive.

2.1.2. Field Samples

The field samples (Table 1) were used to evaluate the reproducibility of the CCSEM-EDX routine, and were collected in five underground mines in mid-central and south-central Appalachia. All mines can be characterized as conventional room and pillar operations, meaning coal is directly cut on advance by continuous miner machines, loaded into shuttle cars and transported to a conveyor belt feeder to take it out of the mine. These mines were all working in relatively thin seams during the dust sampling, and thus cutting significant roof and floor rock. The mines were also actively roof bolting and, in some instances, rock dusting (i.e., applying high purity carbonate dust to coal surfaces in order to mitigate explosibility hazards). Some mines were known to generally have high respirable quartz content (i.e., >5% by mass at times). Sampling locations in the mines varied, but can be classified into one of four primary categories: in the ventilation intake, near the coal feeder or conveyor belt, near production activities (e.g., active coal cutting or roof bolting), and in the ventilation return. All field samples were collected using the ELF sampling pumps and cyclones, and prepared for SEM-EDX analysis as described above. Sample collection times ranged from about 2–4 h.

2.2. Automated Dust Characterization Routine

Based on the manual method previously described by Sellaro et al. (2015) [28], a CCSEM-EDX routine was developed to estimate particle size, aspect ratio, and chemistry classification distributions. It analyzes approximately 500 particles per sample, scanning multiple frames of view to cover a relatively wide sample area. The routine was developed using an FEI Quanta 600 FEG environmental scanning electron microscope (ESEM) (Hillsboro, OR, USA), equipped with a backscatter electron detector (BSD) and a Bruker Quantax 400 EDX spectroscope (Ewing, NJ, USA). The BSD (i.e., rather than a secondary electron, SE, detector) is generally preferred for CCSEM due to its relatively low susceptibility to charging effects, and better background image uniformity and particle detectability [37]. Bruker’s Esprit software version 1.9.4 (complete with DriftCorr, ImageStitch, Feature, StageControl, and Jobs tools) was used to program and run the routine. All automated work was conducted at a magnification of 1000× (vs. 10,000× used for the manual method). Other key instrument settings for the automated routine were: high vacuum mode, voltage of 15 kV, working distance of 12.5 mm, and spot size of 6.5 μm.

2.2.1. Particle Characteristics

Particle size and shape characteristics are determined from SEM image analysis, and are therefore dependent on image quality. The relatively low magnification level used for the automated dust characterization routine allows for efficient analysis (i.e., more particles are visible in a single frame), but limits image resolution. Therefore, only particles greater than about 1 μm (longest visible dimension) are selected for analysis (i.e., resulting in a total particle size range of about 1–10 μm given the cut size of the sampling cyclone); and only basic size and shape parameters are currently considered. For particle sizing, the long and intermediate (i.e., perpendicular to the long) dimensions are reported, and the cross-sectional diameter can be calculated (i.e., average value of the long and intermediate dimensions). For particle shape, the aspect ratio (i.e., ratio of long to intermediate dimensions) is determined.
Regarding particle chemistry, the classification criteria for the CCSEM-EDX routine were adapted from those previously reported for the manual routine [28]. In that earlier work, detailed manual SEM-EDX analysis of respirable dust samples representative of Appalachian coal mines was used to define six distinct classification categories: carbonaceous, mixed carbonaceous, alumino-silicate, quartz, carbonate, and heavy mineral. These are shown in Table 2, and are based on the EDX elemental spectra associated with a given particle. For the manual routine, raw spectral peak heights were used to set classification criteria, but the Esprit automation software uses atomic percentages derived from peak ratios. Moreover, due to the lower magnification and increased spot size in the automated routine (vs. the manual routine), carbon and oxygen generally appear more abundant in EDX spectra as they are more frequently picked up from the filter background. To account for these differences, the atomic percentage limits for the CCSEM routine were gradually refined until automated and manual results agreed across a wide range of individual particles (i.e., between about 1–10 μm, and representing all defined chemical composition categories shown in Table 2). It should also be noted that observations during this process, along with previous observations [27,28], indicated that particles classified in the “mixed carbonaceous” category are most often small and/or thin alumino-silicate particles [27,28]. Therefore, the mixed carbonaceous and alumino-silicate categories have been combined (i.e., to a total alumino-silicate, TAS, category) for reporting CCSEM-EDX results in this paper. A category called “other” is also used for any particle that does not fit into the defined categories shown in Table 2.

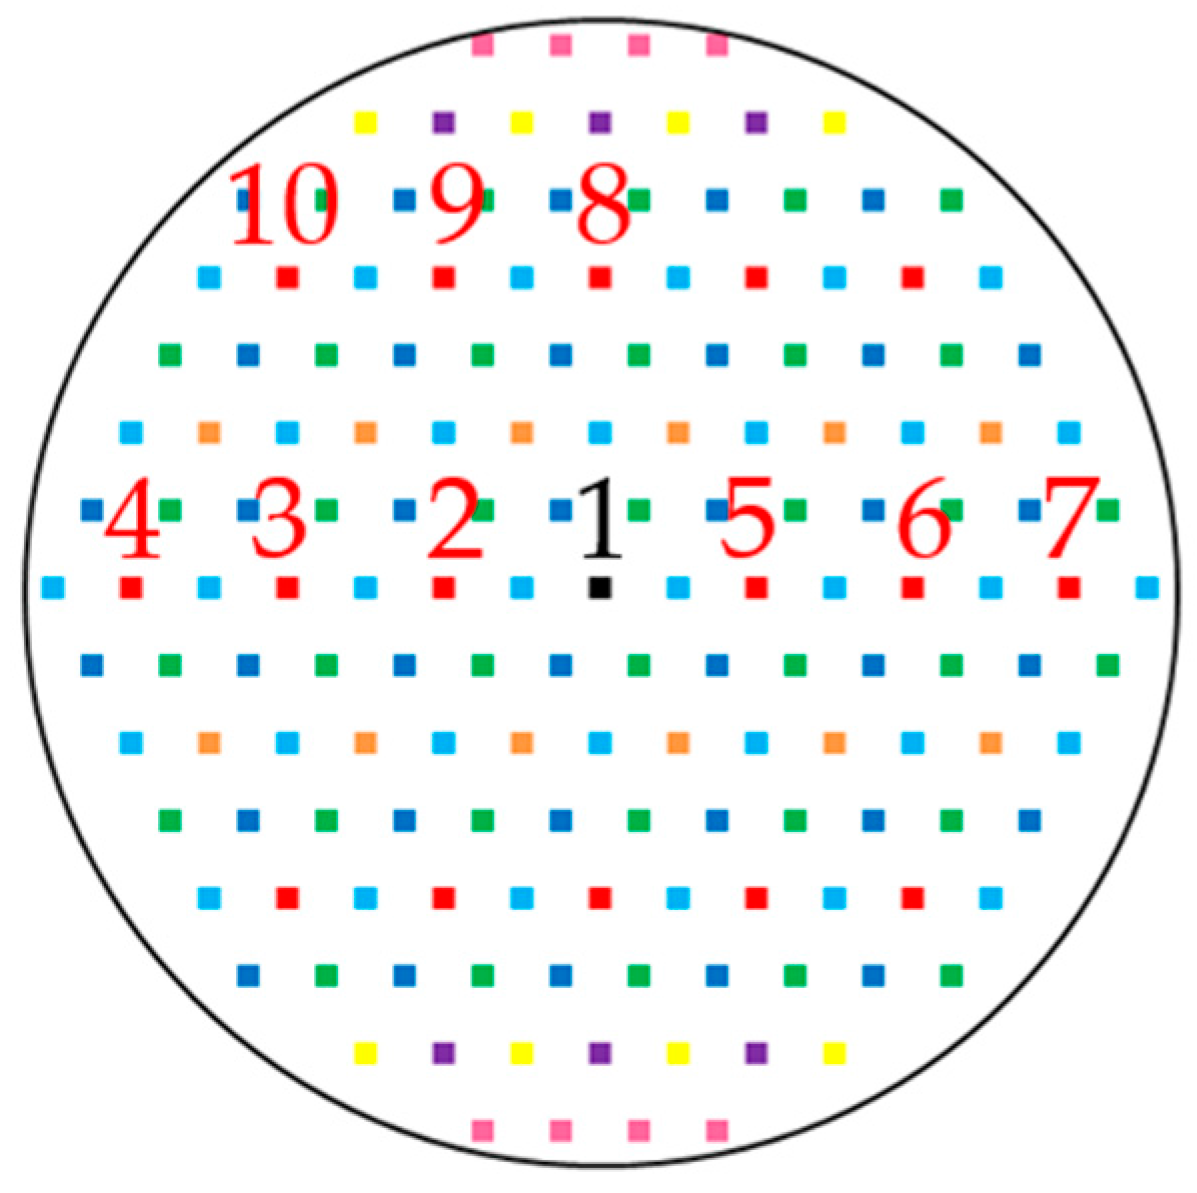
2.2.2. Particle Selection and Multi-Frame Sequencing

In order to ensure that particles are analyzed across a relatively large portion of the filter sub-sample and increase the probability of obtaining representative results, the automated routine was programmed to scan at least ten frames located relatively far from one another. At 1000× magnification, each frame is approximately 15,048 μm2 (132 μm × 114 μm). Within each frame, particles must be consistently detected (i.e., discriminated from the filter background. A benefit of the Esprit software is that it can be programmed to run consecutive jobs, comprised of individual tasks within a single-frame. A multi-frame routine was created by sequencing multiple single-frame jobs.
An array of 157 frame locations is shown in Figure 2, and the first 10 frames are numbered to illustrate the sequence of analysis. The black square represents the center frame where the automated routine begins. From there, analysis proceeds through the red frames as shown, following the same pattern for the top and bottom rows. The analysis then proceeds in the same fashion through the orange, yellow, green, dark blue, light blue, purple, and finally pink frames. This sequence ensures that analysis is spatially dispersed across the sample. All jobs are programmed with respect to the x and y coordinates in reference to the center frame position.
Within each frame, the software was programmed to perform the previously described particle size, aspect ratio, and chemical analyses on up to 50 particles, export the data to an MS Excel file, and then navigate to the coordinates of the next frame. This process is repeated until at least 500 particles have been analyzed; the routine does not stop until it finishes all programmed tasks in a frame. On respirable mine dust samples such as those used in this study, analysis time has been observed to be between about 15–60 min per sample depending on the relative particle density. Examples of very high, very low, and typical particle densities are illustrated in Figure 3a–c respectively.

3. Results and Discussion

3.1. Evaluation of Chemical Classification Reliability

In order to verify the CCSEM-EDX routine, it was first used to characterize the six known dust samples previously described above. A total of 500 particles were analyzed in each sample, and the chemistry classification results are presented in Table 3.
Results for the kaolinite and calcite analysis confirmed that respirable-sized particles from these samples are reliably classified by the CCSEM-EDX routine. For the calcite sample, of the 500 particles analyzed, 99% were classified as carbonates and the other 1% were categorized as carbonaceous. This may indicate that a small number of particles were either misclassified—perhaps due to filter background interference for very thin particles—or that very minor contamination occurred during dust collection. For the kaolinite sample, in which all particles were expected to be alumino-silicates, 100% of the particles were indeed classified as alumino-silicates (It should be noted that, per an earlier classification scheme that still included a “mixed carbonaceous” category, 89% of particles in this sample were classified as alumino-silicate and 11% were mixed carbonaceous. Consistent with prior work [27,28], this provides further evidence that the mixed carbonaceous particles are actually thin and/or small alumino-silicate particles in many instances.).
For the quartz sample, 92% of the particles were classified as quartz with minor fractions of carbonaceous (4%) and alumino-silicate (4%). Unlike the kaolinite and calcite materials, which required no size reduction prior to collection of respirable particles, the quartz material had to be pulverized. While care was taken to thoroughly clean the pulverizer prior to the introduction of each new material, it is possible that some contamination of the quartz sample occurred due to carry over of dust particles from other samples previously prepared in the apparatus (e.g., coal or shale). It is also quite possible that the source material itself contained impurities.
As mentioned above, the coal, shale, and rock dust product samples were all generated from raw materials, and thus were expected to contain some impurities. For the coal sample, 92% of particles were classified as carbonaceous, with minor fractions (3% or less) showing up in all other defined compositional categories. For the shale sample, 88% of the particles were classified as alumino-silicates, with another 6% as coal, 1% as carbonates, 3% as quartz, and 2% as heavy minerals. The presence of carbonaceous and carbonate constituents in this material is consistent with separate thermogravimetric analysis (TGA) of several samples. The TGA results showed roughly 5% coal and 2% carbonate by mass [52]. For the rock dust sample, 88% of particles were classified as carbonates, and another 7% were classified as alumino-silicates. These results are also in good agreement with separate analyses. XRD results on this material (donated by the mine partner that supplied it) showed 91% carbonate minerals and 5% alumino-silicate minerals by mass [52].

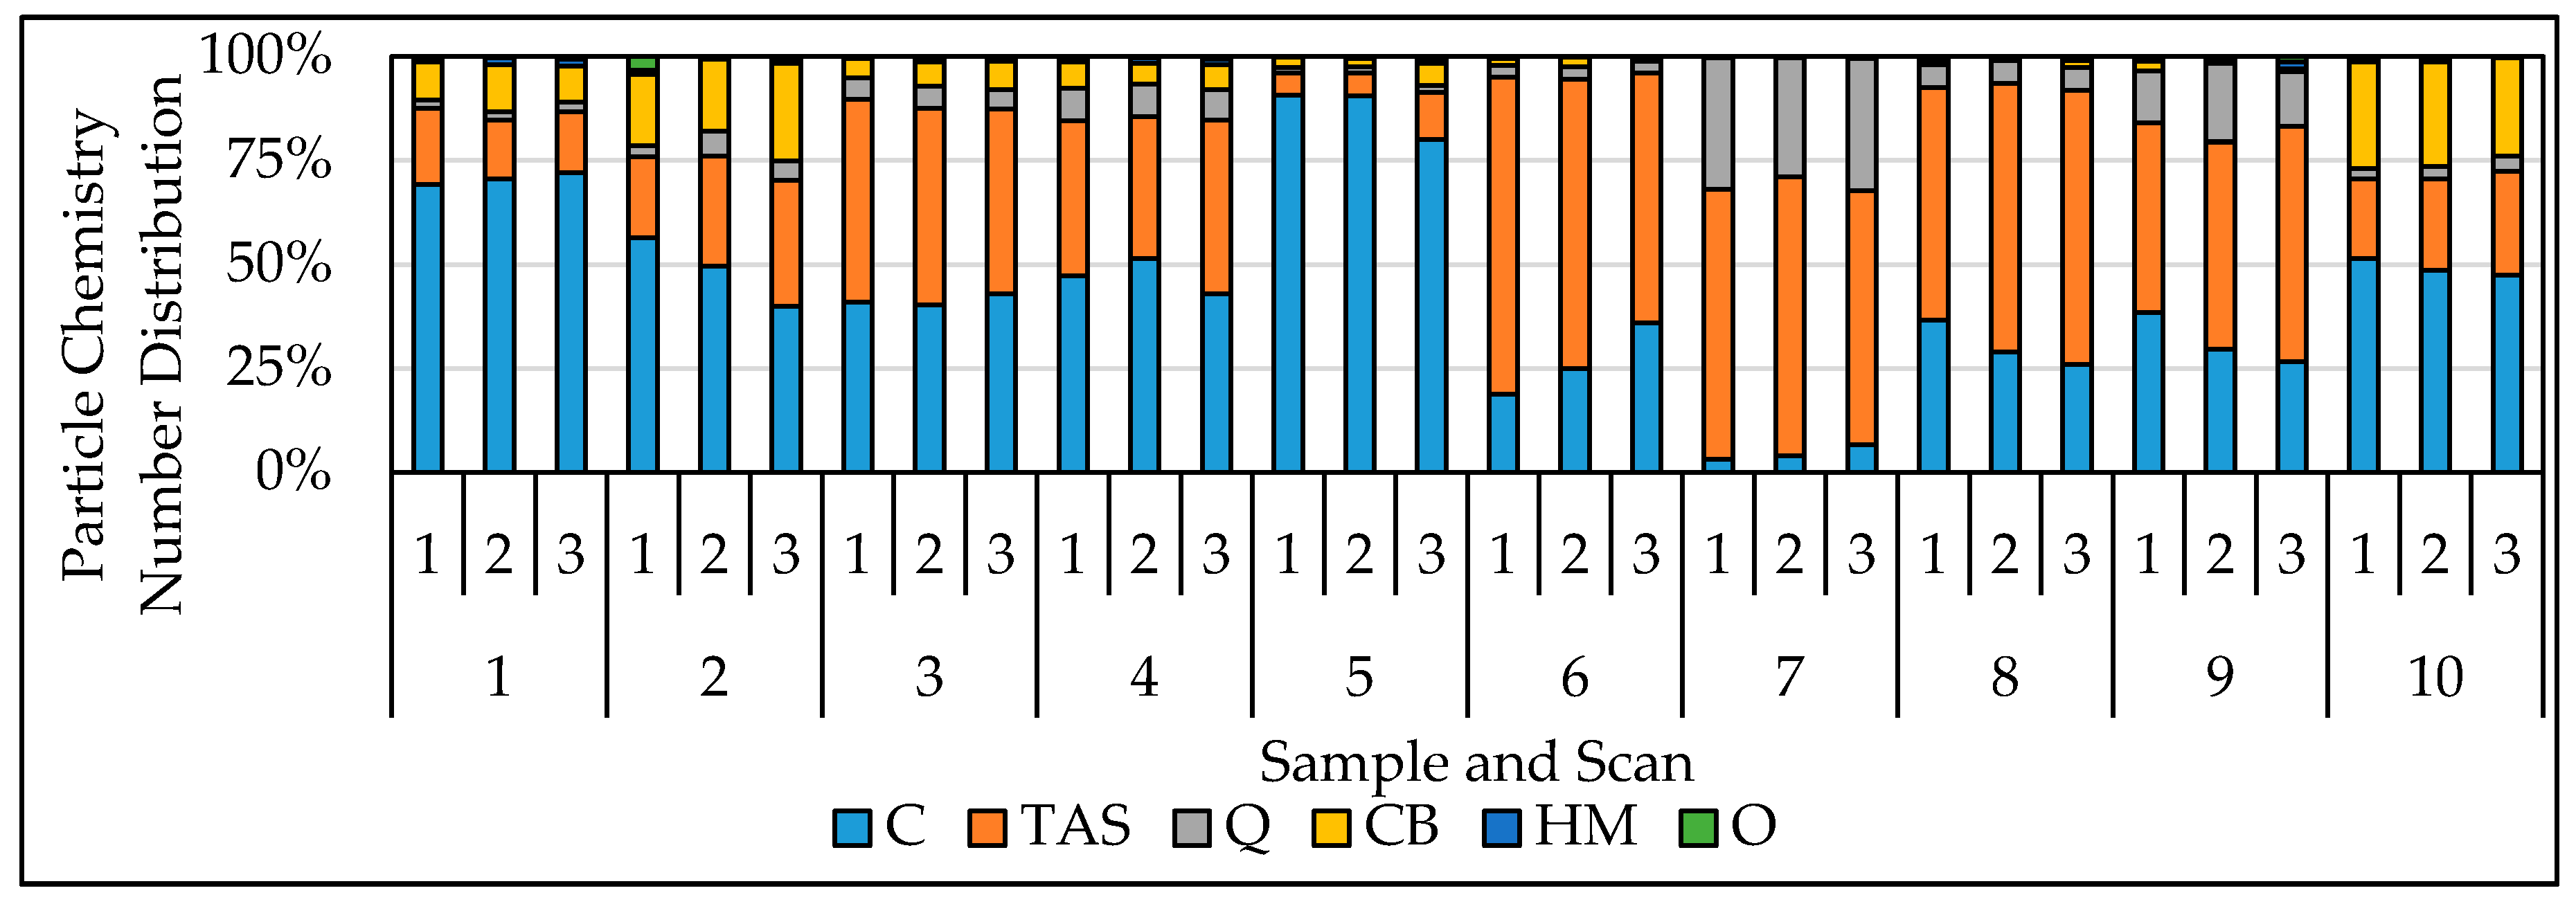
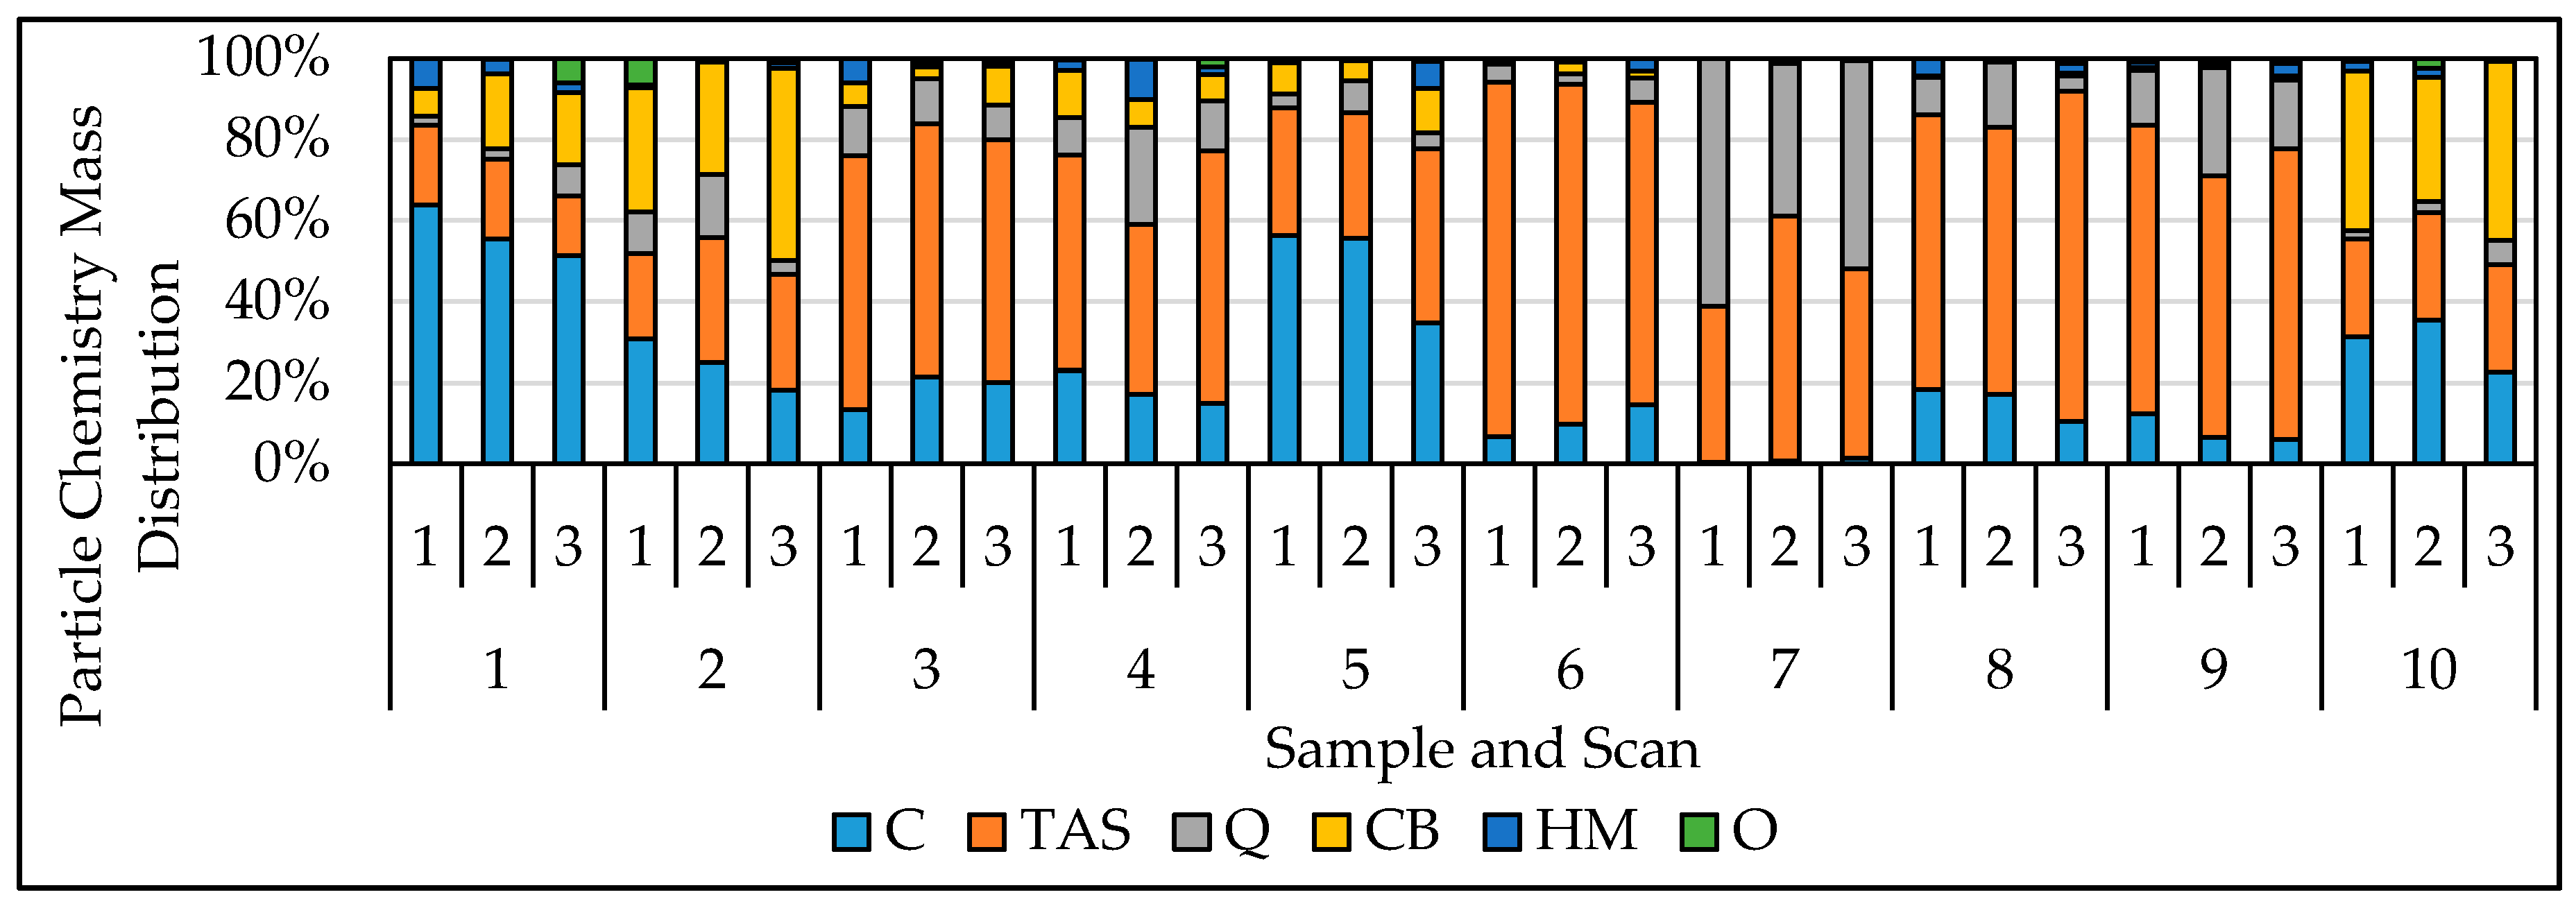
3.2. Evaluation of Reproducibility

Following verification that the CCSEM routine can accurately classify particles into the chemical composition categories of interest, reproducibility of results was also evaluated. For this, the automated routine was run three separate times on each of the ten field samples shown in Table 1. In each case, the sample orientation within the SEM instrument was different during each scan (i.e., the sample was either removed from the SEM or rotated between scans). This ensured that different areas of the sample were analyzed during each scan, and thus agreement of results between scans should indicate that enough particles across enough of the sample area were analyzed to adequately represent the sample characteristics. For all samples and all scans, a total of 500 particles were analyzed, and most scans were completed in less than 20 min, which equates to an analysis rate nearly 25× faster than the manual dust characterization method (i.e., about 25 vs. 1 particle per minute).
Results were compared with respect to particle cross-sectional diameter, aspect ratio, and chemistry number distributions (Figure 4, Figure 5 and Figure 6). For most of the samples, very little difference is seen between diameter (Figure 4) and aspect ratio (Figure 5) results from the three different scans. The chemistry distribution results (Figure 6) exhibit some slight variability (e.g., percentage of carbonaceous particles varies somewhat in Sample 6).
Figure 7 shows the estimated mass (as opposed to number) distribution of particles in each chemistry category. For this, the spherical diameter, and then volume, of each particle was calculated using an assumed short to intermediate dimension ratio (S:I) value for each respective category. (The short dimension is theoretically the length of the particle in the direction perpendicular to the plane in which the long and intermediate dimensions are observed, with different mineral types tending to have characteristic S:I values.) Then, using the particles spherical volume and an assumed specific gravity (SG) value for its category, the mass was calculated. The basis for these calculations, along with assumed values for each chemistry category, is provided in Sellaro et al. [28]; For the total alumino-silicate category, the SG and S:I values given for alumino-silicates in [28] were used; For particles in the HM category, SG values of 7.9, 2.5 and 4.5 were used for particles that were observed to be dominated by iron, aluminum and titanium, respectively. Figure 7 illustrates that carbonaceous particles make up much less of the total dust by mass than by number, which is due to the relatively low specific gravity of coal compared to other primary dust constituents. On the other hand, the abundances of quartz and carbonate, and often alumino-silicate, particles by mass appear relatively higher than by number. The quartz and carbonate categories have relatively high specific gravity and S:I values, whereas the specific gravity is high but the S:I value is low for the total alumino-silicate category.
To determine whether the data collected during different scans of the same sample were statistically different, the Freeman-Halton test was performed on each pairwise data set for a given sample with respect to particle diameter, aspect ratio, and chemistry number distribution results. This test is a two-sided exact test of independence, which outputs a p-value representing the likelihood of the dependence of two data sets [53]. Resulting p-values can be used to determine if, for example, the particle diameter distribution found for Sample 1 by Scan 1 agrees with that of Scan 3. The null hypothesis of each test is that the pair in question agrees (i.e., is statistically similar), and the alternative is that the pair disagrees. At a 95% confidence level, p-values > 0.05 indicate pair agreement, while p-values < 0.05 indicate disagreement.
The results of all Freeman-Halton tests and chemistry are displayed in Table 4. All comparisons of particle diameter and aspect ratio distributions from different scans on the same sample were found to be in agreement, and all except one comparison of particle chemistry distributions (Sample 6, Scan 1 vs. Scan 3) were found to be in agreement. This suggests that the automated routine generally analyzes a sufficient number of particles across a sufficient sample area to yield reproducible results, meaning that they are representative of the entire filter area prepared for analysis. This is consistent with observations in other studies of CCSEM-EDX (e.g., see [37]), which have shown very good reproducibility of particle chemistry classification results—particularly for major category classes—when a relatively large number of particles across a relatively large number of fields are analyzed. While repeatability of the automated routine (i.e., the ability to consistently reproduce results for the same particles, or a large number of particles in the same fields) was not investigated here, others using CCSEM-EDX for fine dust analysis have evaluated this and generally found that repeatability is quite good (i.e., given consistent operating conditions and classification criteria) [37,54].
Beyond verifying that the CCSEM-EDX routine produces reproducible results on respirable coal mine dust samples, Figure 4, Figure 5, Figure 6 and Figure 7 underscore the usefulness of such results by illustrating how dust collected in different mine environments can vary. For example, Samples 7 and 9 exhibited relatively high percentages of quartz particles (on a number- and mass-basis), and these samples were both collected in a mine with predominantly sandstone roof rock, which is known to frequently have relatively high respirable quartz concentrations (by mass). Samples 3 and 6–9 all had relatively high percentages of alumino-silicate particles, and these were taken near cutting (i.e., at the continuous miner machine or just downstream in the return entry) or drilling (i.e., roof bolting) activities, where significant dust from rock strata can be generated. Schatzel, using bulk analytical techniques including X-ray fluorescence (XRF), XRD, and Fourier transform infrared spectroscopy (FTIR), has previously reported that roof and floor rock can be major sources of respirable silica and alumino-silicates [55,56]. Samples 6-8 also had slightly higher aspect ratios than other samples, which is generally consistent with expectations for platy minerals, but the observed differences here are fairly subtle.
Further, Samples 1, 2 and 10 were found to have relatively high percentages of carbonates. These samples were taken in areas where significant rock dusting activities were occurring. While little information is currently available on the relative contribution of rock dust products to the total airborne respirable dust concentration in underground coal mines, Colinet and Listak have shown that the respirable fraction of particles in these products can be more than 30% (by volume) [57]. Assuming that rock dust is the primary source of carbonate particles in the mines represented in the current study, the results presented here indicate that enough respirable rock dust particles may become airborne to contribute significantly to the total respirable dust concentration. Although rock dust products are not generally considered to pose health hazards, from an operational perspective, this issue is of increasing importance given that the total respirable dust concentration limit in US coal mines has just been reduced [58]. Moreover, recent research has suggested that finer rock dust products, which presumably contain even higher respirable fractions, should be more effective in reducing explosibility hazards [59].
Notably, most samples were not observed to be dominated by carbonaceous (i.e., coal dust) particles. This may seem somewhat counterintuitive, though historical studies have shown that the “ash” or total mineral (i.e., non-coal) fraction of dust in coal mines can be relatively high (i.e., 30% or more by mass) [2]. Understanding the actual composition of the non-coal respirable dust fraction may well be important for advancing the understanding of health outcomes associated with mine dust exposures. For instance, recent work by Cohen et al. has identified both silica and silicate particles in the lung tissues of severely diseased coal miners [60], but casual links between specific exposure characteristics and such disease pathology has yet to be established.
The fact that relatively small particles (i.e., less than 3 µm in cross-sectional diameter) appeared to dominate the field samples analyzed here is not surprising necessarily. The Dorr Oliver cyclones used for sample collection are designed to discard particles with aerodynamic diameters greater than about 10 µm; and they have a penetration efficiency of about 50% around 4 µm at the 1.7 L/min sampling flow rate used. Though cross-sectional and aerodynamic diameters are not equivalent for most particles, this does mean that the results in Figure 4 likely underestimate the relative proportions of large particles (i.e., greater than 3 µm in cross-sectional diameter). Nonetheless, the difference between the abundance of particles in the 0.95–2.0 µm and 2.0–3.0 µm size classes shown in Figure 4 should provide a good comparison of particles in these narrow ranges.
In the context of health implications, a better understanding of the abundance and characteristics of very small particles, including those below the effective analysis limit set by the 1000× magnification utilized here, would be highly valuable. Adaptation of the CCSEM-EDX routine outlined in the current work to analyze sub-micron particles is the focus of ongoing work by the authors. This will require analysis at higher magnification (reducing data acquisition rate), and further modification of the chemistry classification criteria. While the practical limit for particle sizing by SEM is about 0.1 µm, chemical analysis may be limited well above this due to interference by the sample (i.e., filter) background. For samples on PC filters, discrimination between high-carbon particles (i.e., those in the carbonaceous and carbonate categories) is anticipated to be particularly challenging. The challenges of SEM-EDX work (including CC work) on sub-micron particles has been reviewed in detail by the EPA [37].

4. Conclusions

Respirable dust analysis by SEM-EDX can provide new insights into occupational exposure characteristics and, potentially, health outcomes for mine workers. Based on a previously developed manual routine, a CCSEM-EDX routine was established for analysis of coal mine dust samples. Operating at just 1000× magnification, it can reliably classify particles greater than about 1 μm into defined chemical composition categories, as well as capture particle dimensions that can be used to characterize size and basic shape parameters. Compared to manual analysis, the automated routine greatly increases the data acquisition rate, and it also provides reproducible, representative results. This is attributed to both the increased number of particles analyzed per sample and the fact that the routine guarantees that particles selected for analysis are distributed across a large area of the filter. When applied to a limited set of field samples, the CCSEM-EDX routine demonstrated that respirable coal mine dust can vary widely, particularly with respect to chemical composition. Results were generally consistent with observed conditions in the sampled mine environments. Analysis of larger and/or targeted sample sets may yield specific information of practical importance to health researchers, mine personnel, and the regulatory community.

Acknowledgments

The authors would like to acknowledge the Alpha Foundation for the Improvement of Mine Safety and Health for funding this work. We thank Rachel Sellaro and Meredith Scaggs for their efforts to collect mine dust samples, and our mine partners for their cooperation and support. We would also like to extend thanks to Steve McCartney of Virginia Tech ICTAS-NCFL for operational assistance with SEM-EDX analysis, Ted Juzwak of Bruker Corporation for assistance in learning the Esprit software capabilities, and Dan Baxter of Environmental Analysis Associates for assistance in optimizing the automated routine. Finally, we thank Mohammad Rezaee for his assistance with statistical analysis.

Author Contributions

Victoria Johann-Essex conceived and developed the CCSEM-EDX routine, and performed statistical analysis of results. Cigdem Keles assisted sample preparation, analysis, and synthesis of results. Emily Sarver guided the study and interpretation of results. All authors participated in writing the manuscript.

Conflicts of Interest

The authors declare no conflict of interest.

References

  1. Castranova, V.; Vallyathan, V. Silicosis and coal workers’ pneumoconiosis. Environ. Health Perspect. 2000, 108, 675–684. [Google Scholar] [CrossRef] [PubMed]
  2. International Agency for Research on Cancer (IARC). IARC Monographs on the Evaluation of Carcinogenic Risks to Humans: Silica, Some Silicates, Coal Dust and Para-Aramid Fibrils; IARC Press: Lyon, France, 1997; Volume 68. [Google Scholar]
  3. International Organization for Standardization (ISO). Air Quality-Particle Size Fraction Definitions for Health Related Sampling; ISO Standard 7708; ISO: Geneva, Switzerland, 1995. [Google Scholar]
  4. Occupational Safety and Health Administration (OSHA). Occupational Exposure to Respirable Crystalline Silica—Review of Health Effects Literature and Preliminary Quantitative Risk Assessment; OSHA: Washington, DC, USA, 2010.
  5. World Health Organization (WHO). Hazard Prevention and Control in the Work Environment: Airborne Dust; Report No. WHO/SDE/OEH/99.14; World Health Organization (WHO): Geneva, Switzerland, 1999; pp. 1–246. [Google Scholar]
  6. Merchant, J.A.; Taylor, G.; Hodous, T.K. Coal workers’ pneumoconiosis and exposure to other carbonaceous dusts. In Occupational Respiratory Diseases; Merchant, J.A., Ed.; U.S. Goverment Printing Office: Washington, DC, USA, 1986; pp. 329–384. [Google Scholar]
  7. Peters, J.M. Silicosis. In Occupational Respiratory Diseases; Merchant, J.A., Ed.; U.S. Goverment Printing Office: Washington, DC, USA, 1986; pp. 219–237. [Google Scholar]
  8. Antao, V.C.; Petsonk, E.L.; Attfield, M.D. Advanced Cases of Coal Workers’ Pneumoconiosis—Two Counties, Virginia. MMWR 2006, 55, 909–913. Available online: https://www.cdc.gov/mmwr/preview/mmwrhtml/mm5533a1 (accessed on 25 August 2006). [Google Scholar]
  9. National Institute of Occupational Safety and Health (NIOSH). Criteria for a Recommended Standard—Occupational Exposure to Respirable Coal Mine Dust; DHHS (NIOSH) Publication No. 95-106; NIOSH: Cincinnati, OH, USA, 1995. [Google Scholar]
  10. Suarthana, E.; Laney, A.S.; Storey, E.; Hale, J.M.; Attfield, M.D. Coal workers’ pneumoconiosis in the United States: Regional differences 40 years after implementation of the 1969 Federal coal mine health and safety act. Occup. Environ. Med. 2011, 68, 908–913. [Google Scholar] [CrossRef] [PubMed]
  11. Gibson, P. Australian Mining. Available online: https://www.australianmining.com.au/features/black-lungs-back-how-we-became-complacent-with-coal-miners-pneumoconiosis/ (accessed on 26 October 2016).
  12. Zosky, G.R.; Hoy, R.F.; Silverstone, E.J.; Brims, F.J.; Miles, S.; Johnson, A.R.; Gibson, P.G.; Yates, D.H. Coal workers’ pneumoconiosis: An Australian perspective. Med. J. Aust. 2016, 204, 414–418. [Google Scholar] [CrossRef] [PubMed]
  13. National Institute of Occupational Safety and Health (NIOSH). Coal Workers’ Health Surveillance Program (CWHSP) Data Query System; NIOSH: Morgantown, WV, USA, 2016. [Google Scholar]
  14. Antao, V.C.; Petsonk, E.L.; Sokolow, L.Z.; Wolfe, A.L.; Pinheiro, G.A.; Hale, J.M.; Attfield, M.D. Rapidly progressive coal workers’ pneumoconiosis in the United States: Geographic clustering and other factors. J. Occup. Environ. Med. 2005, 62, 670–674. [Google Scholar] [CrossRef] [PubMed]
  15. Laney, A.S.; Attfield, M.D. Coal workers’ pneumoconiosis and progressive massive fibrosis are increasingly more prevalent among workers in small underground coal mines in the United States. J. Occup. Environ. Med. 2010, 67, 428–431. [Google Scholar] [CrossRef] [PubMed]
  16. Mine Safety and Health Administration (MSHA). All coal mining data table 01. In Number of Coal Operations in the United States, by Primary Activity, 1978–2006, Mining Industry Accident, Injuries, Employment, and Production Statistics; US Department of Labor: Arlington, VA, USA, 2008. [Google Scholar]
  17. Bennett, J.G.; Dick, J.A.; Kaplan, Y.S.; Shand, P.A.; Shennan, D.H.; Thomas, D.J.; Washington, J.S. The relationship between coal rank and the prevalence of pneumoconiosis. Br. J. Ind. Med. 1979, 36, 206–210. [Google Scholar] [CrossRef] [PubMed]
  18. Colinet, J.F.; Rider, J.P.; Listak, J.M.; Organiscak, J.A.; Wolfe, A.L. Best Practices for Dust Control in Coal Mining; DHHS (NIOSH) Publication No. 2010-110; NIOSH: Cincinnati, OH, USA, 2010. [Google Scholar]
  19. Joy, G.J. Evaluation of the approach to respirable quartz exposure control in U.S. Coal mines. J. Occup. Environ. Hyg. 2012, 9, 65–68. [Google Scholar] [CrossRef] [PubMed]
  20. Landen, D.D.; Wassell, J.T.; McWilliams, L.; Patel, A. Coal dust exposure and mortality from ischemic heart disease among a cohort of U.S. Coal miners. Am. J. Ind. Med. 2011, 54, 727–733. [Google Scholar] [CrossRef] [PubMed]
  21. Mischler, S.E.; Cauda, E.G.; Di Giuseppe, M.; Ortiz, L.A. A multi-cyclone sampling array for the collection of size-segregated occupational aerosols. J. Occup. Environ. Hyg. 2013, 10, 685–693. [Google Scholar] [CrossRef] [PubMed]
  22. Page, S.J.; Organiscak, J.A. Suggestion of a cause-and-effect relationship among coal rank, airborne dust, and incidence of workers’ pneumoconiosis. Am. Ind. Hyg. Assoc. J. 2000, 61, 785–787. [Google Scholar]
  23. Pollock, D.E.; Potts, J.D.; Joy, G.J. Investigation into dust exposures and mining practices in mines in the southern Appalachian region. In Proceedings of the 2009 SME Annual Meeting and Exhibit, Denver, CO, USA, 22–25 February 2009; Society for Mining, Metallurgy, and Exploration, Inc.: Denver, CO, USA, 2009; pp. 1–5. [Google Scholar]
  24. Agius, R. Occupational and Environmental Lung Disease. Available online: http://www.agius.com/hew/resource/lung.htm (accessed on 1 November 2016).
  25. Johann, V.; Sarver, E. Considerations for an automated SEM-EDX routine for characterizing respirable coal mine dust. In Proceedings of the 15th North American Mine Ventilation Symposium, Blacksburg, VA, USA, 20–25 June 2015.
  26. Sellaro, R.; Sarver, E. Preliminary investigation of SEM-EDX as a tool for characterization of coal mine dusts. Miner. Eng. 2014, 66, 16–40. [Google Scholar]
  27. Sellaro, R.; Sarver, E. Characterization of respirable dust in an underground coal mine in Central Appalachia. Trans. SME 2014, 336, 457–466. [Google Scholar]
  28. Sellaro, R.; Sarver, E.; Baxter, D. A standard characterization methodology for respirable coal mine dust using SEM-EDX. Resources 2015, 4, 939–957. [Google Scholar] [CrossRef]
  29. Carpenter, M.; Lifshin, E.; Gauvin, R. SEM-EDS quantative analysis of aerosols ≥80 nm: Impact on atmospheric aerosol characterization campaigns. Microsc. Microanal. 2002, 8, 1482CD–1483CD. [Google Scholar]
  30. Cvetković, Ž.; Logar, M.; Rosić, A.; Ćirić, A. Mineral composition of the airborne particles in the coal dust and fly ash of the Kolubara basin (Serbia). Period. Mineral. 2012, 81, 205–223. [Google Scholar]
  31. Deboudt, K.; Flament, P.; Choël, M.; Gloter, A.; Sobanska, S.; Colliex, C. Mixing state of aerosols and direct observation of carbonaceous and marine coatings on African dust by individual particle analysis. J. Geophys. Res. Atmos. 2010, 115, D24207. [Google Scholar] [CrossRef]
  32. Kasahara, M.; Shinoda, K.; Yoshida, K.; Takahashi, K. Characterization of atmospheric aerosol based on SEM-EDX analysis of individual particles. J. Aerosol Sci. 1993, 24, S585–S586. [Google Scholar] [CrossRef]
  33. Kasparian, J.; Frejafon, E.; Rambaldi, P.; Yu, J.; Vezin, B.; Wolf, J.P.; Ritter, P.; Viscardi, P. Characterization of urban aerosols using SEM-microscopy, X-ray analysis and lidar measurements. Atmos. Environ. 1998, 32, 2957–2967. [Google Scholar] [CrossRef]
  34. Micheletti, M.I.; Murruni, L.G.; Debray, M.E.; Rosenbusch, M.; Graf, M.; Ávila Cadena, G.; Vitale, P.; Davidson, J.; Somacal, H. Elemental analysis of aerosols collected at the Pierre Auger cosmic ray observatory with pixe technique complemented with SEM/EDX. Nucl. Instrum. Methods Phys. Res. Sect. B Beam Interact. Mater. Atoms 2012, 288, 10–17. [Google Scholar] [CrossRef]
  35. Suzuki, K. Characterisation of airborne particulates and associated trace metals deposited on tree bark by ICP-OES, ICP-MS, SEM-EDX and laser ablation ICP-MS. Atmos. Environ. 2006, 40, 2626–2634. [Google Scholar] [CrossRef]
  36. Wang, A.; Luo, B. Application SEM to analysis formation characteristic of soot aerosol emitted from lump-coal combustion in fixed-bed. In Proceedings of the Asia-Pasific Power and Energy Engineering Conference (APPEEC), Wuhan, China, 28–31 March 2009.
  37. United States Environmental Protection Agency (US EPA). Guidelines for the Application of SEM/EDX Analytical Techniques to Particulate Matter Samples; US EPA: Washington, DC, USA, 2002.
  38. Denee, P.B. Mine dust characterization using the scanning electron microscope. Am. Ind. Hyg. Assoc. J. 1972, 33, 654–660. [Google Scholar] [CrossRef] [PubMed]
  39. Huggins, C.W.; Meyers, G.T. Particle Size Distribution of Quartz and Other Respirable Dust Particles Collected at Metal Mines, Nonmetal Mines, and Processing Plants; U.S. Department of the Interior, Bureau of Mines: Pittsburgh, PA, USA, 1986.
  40. Terry, K. Particle size distribution of airborne dusts using a scanning electron microscope. Aerosol Sci. Technol. 1995, 23, 475–478. [Google Scholar] [CrossRef]
  41. White, E.W.; DeNee, P.B. Characterization of coal mine dust by computer processing of scanning electron microscope information. Ann. N. Y. Acad. Sci. 1972, 200, 666–675. [Google Scholar] [CrossRef] [PubMed]
  42. Johann, V. Development and Implementation of an Automated Sem-Edx Routine for Characterizing Respirable Coal Mine Dust. Master’s Thesis, Virginia Polytechnic Institute and State University, Blacksburg, VA, USA, 2016. [Google Scholar]
  43. Ekelund, S.; Werlefors, T. A system for the quantitative characterization of microstructures by combined image analysis and X-ray discrimination in the scanning electron microscope. In Proceedings of the 9th Annual SEM Symposium, Chicago, IL, USA, 5–9 April 1976; IITRI: Chicago, IL, USA, 1976; pp. 419–424. [Google Scholar]
  44. Hoover, M.F.; White, E.; Lebiedzik, N.J.; Johnson, G.G., Jr. Automated characterization of particulates and inclusions by computer-controlled sem/probe. In Proceedings of the Tenth Annual Conference on Microbeam Analysis Society, Las Vegas, NV, USA, 11–15 August 1975; pp. 54A–54B.
  45. Fritz, G.; Camus, P.; Rohde, D. Considerations for automated multi-frame particle sizing in the SEM. Microsc. Microanal. 2006, 12, 210–211. [Google Scholar] [CrossRef]
  46. Ritchie, N.; Filip, V. Semantics for high speed automated particle analysis by SEM/EDX. Microsc. Microanal. 2011, 17, 896–897. [Google Scholar] [CrossRef]
  47. Worobiec, A.; Potgieter-Vermaak, S.; Brooker, A.; Darchuk, L.; Stefaniak, E.; Van Grieken, R. Interfaced SEM/EDX and micro-raman spectrometry for characterisation of heterogeneous environmental particles—Fundamental and practical challenges. Microchem. J. 2010, 94, 65–72. [Google Scholar] [CrossRef]
  48. Huffman, G.P.; Shah, N.; Cprek, N.; Huggins, F.E.; Casuccio, G.; Ramer, E.; Hicks, J.B. CCSEM Investigation of Respirable Quartz in Air Samples Collected during Power Plant Maintenance Activities. Fuel 2011, 95, 365–370. [Google Scholar] [CrossRef]
  49. Cprek, N.; Shah, N.; Huggins, F.E.; Huffman, G.P. Computer-controlled scanning electron microscopy (CCSEM) investigation of quartz in coal fly ash. Fuel Process. Technol. 2007, 88, 1017–1020. [Google Scholar] [CrossRef]
  50. Code of Federal Regulations (CFR). Title 30—Mineral Resources, Part 70—Mandatory Health Standards-Underground Coal Mines; Office of the Federal Register: Washington, DC, USA, 2014.
  51. Mine Safety and Health Administration (MSHA). MSHA Handbook Series—Coal Mine Health Inspection Procedures; Mine Safety and Health Administration (MSHA): Washington, DC, USA, 2016.
  52. Scaggs, M. Development and Implementation of a Standard Methodology for Respirable Coal Mine Dust Characterization with Thermogravimetric Analysis. Master’s Thesis, Virginia Polytechnic Institute and State University, Blacksburg, VA, USA, 2016. [Google Scholar]
  53. Agresti, A. A survey of exact inference for contingency tables. Stat. Sci. 1992, 7, 131–153. [Google Scholar] [CrossRef]
  54. Pietrodangelo, A.; Salzano, R.; Bassani, C.; Pareti, S.; Perrino, C. Composition, size distribution, optical properties, and radiative effects of laboratory-resuspended PM10 from geological dust of the Rome area, by electron microscopy and radiative transfer modelling. Atmos. Chem. Phys. 2015, 15, 13177–13194. [Google Scholar] [CrossRef]
  55. Schatzel, S.J. Identifying sources of respirable quartz and silica dust in underground coal mines in southern west Virginia, western Virginia, and eastern Kentucky. Int. J. Coal Geol. 2009, 78, 110–118. [Google Scholar] [CrossRef]
  56. Schatzel, S.J. Characterization of source rocks producing respirable quartz and aluminosilicate dust in underground US coal mines. In Proceedings of the 23rd Annual International Pittsburgh Coal Conference, Pittsburgh, PA, USA, 25–28 September 2006; pp. 38–39.
  57. Colinet, J.F.; Listak, J.M. Silica and Respirable Content in Rock Dust Samples. Coal Age 2012, 117, 48–52. [Google Scholar]
  58. Mine Safety and Health Administration (MSHA). Lowering Miners’ Exposure to Respirable Coal Mine Dust, Including Continuous Personal Dust Monitors (Final Rule). Fed. Reg. 2014, 79, 24813. [Google Scholar]
  59. Harris, M.L.; Sapko, M.J.; Zlochower, I.A.; Perera, I.E.; Weiss, E.S. Particle size and surface area effects on explosibility using a 20-L chamber. J. Loss Prev. Process Ind. 2015, 37, 33–38. [Google Scholar] [CrossRef] [PubMed]
  60. Cohen, R.A.; Petsonk, E.L.; Rose, C.; Young, B.; Regier, M.; Najmuddin, A.; Abraham, J.L.; Churg, A.; Green, F.H.Y. Lung Pathology in U.S. Coal Workers with Rapidly Progressive Pneumoconiosis Implicates Silica and Silicates. Am. J. Respir. Crit. Care Med. 2016, 193, 673–680. [Google Scholar] [CrossRef] [PubMed]
Figure 1. Coal workers’ pneumoconiosis (CWP) prevalence in mid-central (District 4) and south-central Appalachia (District 12) underground coal miners between 1970 and 2014. Data acquired from the Coal Workers’ Health Surveillance Program (CWHSP) Data Query System [13], and includes all reported categories of CWP (i.e., severity categories 1, 2, and 3, and progressive massive fibrosis (PMF)).
Minerals 07 00015 g001
Figure 2. Individual analysis frames for a computer controlled energy dispersive X-ray (CCSEM-EDX) routine. The entire circle represents a 9-mm diameter subsample taken from the center of a 37-mm filter sample. The routine begins in the black (center) frame and then proceeds through the other frames by color (beginning with red) to ensure analysis across a wide area of the subsample. The analysis sequence is numbered for the first 10 frames to illustrate the sequence of analysis.
Minerals 07 00015 g002
Figure 3. Examples of respirable mine dust samples with (a) very high; (b) very low; (c) typical particle densities. The images were collected at 1000× magnification.
Minerals 07 00015 g003
Figure 4. Comparison of particle cross-sectional diameter number distributions determined by three independent automated scans of ten dust samples.
Minerals 07 00015 g004
Figure 5. Comparison of particle aspect ratio number distributions determined by three independent automated scans of ten dust samples. An aspect ratio of 1.0 indicates a particle has equal long and intermediate dimensions.
Minerals 07 00015 g005
Figure 6. Comparison of chemistry particle number distributions determined by three independent automated scans of ten dust samples. Chemical composition categories were: Carbonaceous (C), Total Alumino-silicate (TAS), Quartz (Q), Carbonate (CB), Heavy Mineral (HM), and Other (O).
Minerals 07 00015 g006
Figure 7. Comparison of chemistry mass distributions estimated from particle data collected by three independent automated scans of ten dust samples. Chemical composition categories were: Carbonaceous (C), Total Alumino-silicate (TAS), Quartz (Q), Carbonate (CB), Heavy Mineral (HM), and Other (O).
Minerals 07 00015 g007
Table 1. Description of mining conditions and sampling locations for field samples.
Sample No.Mine RegionRoof and/or Floor RockAverageAverageSampling Location
SeamMining
Thickness (m) Height (m)
1South-central Appalachia(District 12)Shale0.61.0Belt Drive
2Tram
3C. Miner 1
4Behind Feeder
5Tram
6Mid-central Appalachia(District 4)Sandstone0.9–1.51.5Roof Bolter
7Sandstone 20.9–1.21.7Return Entry
8Shale/sandstone1.41.8C. Miner 1
9Sandstone 20.9–1.21.7C. Miner 1
10Sandstone0.9–1.51.5Behind Feeder
1 C. Miner: Continuous Miner; 2 Mine is known to frequently have high silica content (i.e., >5% by mass) in respirable dust samples.
Table 2. Classification criteria for dust particle chemical composition categories (modified from [28]). Categories are abbreviated as C: Carbonaceous (i.e., coal), MC: Mixed Carbonaceous (i.e., very small or thin alumino-silicates), AS: Alumino-Silicates (e.g., clays and feldspars), Q: Quartz (i.e., crystalline silica), CB: Carbonate (e.g., calcite, dolomite), HM: Heavy Minerals (e.g., pyrite, titanium dioxide).
ElementsManual Method Criteria (Raw Peak Heights, Cps/eV)Automated Method Criteria (Elemental Atomic, %)
CMCASQCBHMCMCASQCBHM
Carbon≥80≥80--<80->74>78<85<85<85-
Oxygen≤20≤20>20≥20>20>20<29>13, <20>15>15>15>12
Aluminum-≥10, <20≥20≥20--<0.3>0.2, <0.4>0.3>0.3--
Silica-≥10, <20≥20≥20--<0.3>0.2, <0.4>0.4>0.4--
Ca/Mg 1----≥20-<0.3<0.4-->0.5-
Fe/Ti/Al 2-----≥20----->0.5
1 Ca/Mg: calcium or magnesium meets criteria; 2 Fe/Ti/Al: iron, titanium, or aluminum meets criteria.
Table 3. Chemical composition distribution resulting from the CCSEM-EDX analysis of six known respirable dust samples.
Sample TypeChemical Composition Categories
CTAS 1QCBHMOther
Coal92%4%1%2%1%-
Shale6%88%3%1%2%-
Rock Dust3%7%1%88%1%-
Quartz4%4%92%---
Kaolinite-100%----
Calcite1%--99%--
1 Results reported in the TAS (total alumnio-silicates) category include those classified as and MC per the criteria shown in Table 2.
Table 4. Freeman-Halton Test results for automated scans in terms of size, aspect ratio, and chemistry number distribution comparisons.
SampleSize ComparisonAspect Ratio ComparisonChemistry Comparison
1 vs. 21 vs. 32 vs. 31 vs. 21 vs. 32 vs. 31 vs. 21 vs. 32 vs. 3
10.8311.0000.8470.2230.2120.9640.9220.9550.992
20.4790.5130.6060.8021.0000.5460.2760.1450.504
31.0000.8670.9400.7830.7371.0000.9950.8960.984
40.3090.8400.6130.6570.8880.6570.9780.9770.803
50.7610.1520.3670.9560.9120.7431.0000.2560.317
60.8150.8340.8960.5921.0000.5920.7540.038 10.427
70.4980.7050.9531.0000.8820.8670.8650.4700.533
80.8870.7940.9111.0000.8820.8670.7140.5220.951
90.9290.9440.7420.8330.5340.3740.4010.5580.482
100.9691.0000.9690.8311.0000.8310.9270.6440.937
1 p-Value lower than 0.05, which shows disagreement between particular scans.

