Article

Adsorption Behavior of Cd2+ and Zn2+ onto Natural Egyptian Bentonitic Clay

Chemistry department, Faculty of science, Fayoum University, Fayoum 63514, Egypt
*
Author to whom correspondence should be addressed.
Minerals 2016, 6(4), 129; https://doi.org/10.3390/min6040129
Submission received: 31 October 2016 / Revised: 1 December 2016 / Accepted: 1 December 2016 / Published: 8 December 2016

Abstract

:
In the present work, an Egyptian bentonitic clay sample has been structurally characterized using different techniques such as XRD, IR, SEM, and EDX analyses then evaluated as a sorbent for heavy metal ions removal. The characterization results showed that the clay sample is in the bentonite form with montmorillonite and kaolinite as mixed-clay minerals. The specific surface area (SSA) and cation exchange capacity (CEC) were determined using methylene blue test and they were found to be 367 m2/g and of 85 meq/100 g, respectively. The applicability of this clay sample for Cd (II) and Zn (II) removal from aqueous media was tested using batch procedures. Experimental parameters affecting the removal process were analyzed to get optimum conditions for the process. The experimental kinetic data were fitted very well to pseudo-second order with very high correlation coefficients. The Freundlich model appeared to correlate the adsorption data much better than Langmuir model with maximum adsorption capacities of 8.2 and 9.45 mg/g for Cd2+ and Zn2+, respectively. Successful application of the studied adsorbent for the removal of Cd2+ and Zn2+ ions from natural water samples greatly supports its potential for practical application.

Graphical Abstract

1. Introduction

An enormous amount of toxic heavy metals is being discharged into the environment as a waste product from batteries, tanneries, electroplating, pesticides, fertilizers, mining and ore refining industries [1]. Unlike other water pollutants, heavy metals tend to accumulate in bio-organisms resulting in potential risks to human and environmental health [2]. Among other heavy metals, cadmium and zinc have attracted great attention due to their hazardous nature. For humans, cadmium is a carcinogen. It can also cause kidney damage and renal disorder, while zinc may result in depression, lethargy, neurological symptoms and retardation of children’s growth [3]. The United States Environmental Protection Agency (USEPA) recommended that the maximum contamination level for cadmium and zinc in drinking water should not exceed 0.01 and 0.8 mg/L, respectively [4]. Therefore, the process of cadmium and zinc removal from bodies of water is very important and so it attracts the interest of many researchers.
Several methods and techniques have been proposed for cadmium and zinc ion removal including adsorption [5], precipitation [6], bioremediation [7], membrane filtration [8], ion-exchange [9] and solvent extraction [10]. Among these techniques, adsorption was considered superior due to its high efficient removal, easy operation, cost effectiveness and availability of efficient adsorbents [11]. Many adsorbents have been evaluated for cadmium and zinc ions uptake including clay minerals [12], activated carbon [13], zeolites [14], metal oxides [15], composites [16], functionalized polymers [17] and carbon nanotubes [18]. Due to their natural abundance, high sorption capacity and chemical and mechanical stability, clay minerals are considered substantial adsorbents. The sorption capacity of clays is imparted from a relatively high specific surface area and a net negative charge on their structures [19].
Bentonite is a clay belonging to the smectite clay group that characterized by a 2:1 structure with one octahedral sheet sandwiched between two tetrahedral sheets. Isomorphic substitutions within the octahedral sheets produce a net negative surface charge [20]. In recent decades, the applicability of bentonite from different regions for heavy metals removal has been studied extensively [19,20,21,22]. Bentonite depositions have been spread over the Egyptian deserts with excessive abundance within the Western Desert [23]. This study was therefore conducted to evaluate the capability of some Egyptian bentonitic clay, which mined from Fayoum depression in the Western Desert, as an adsorbent for the removal of cadmium and zinc ions from aqueous systems. The adsorption efficiency of this clay sample was evaluated through studying the experimental parameters affecting the removal process such as initial solution pH, sorbent dosage, contact time and initial metal ion concentration. The experimental data were fitted using Langmuir and Freundlich isotherm models to determine the adsorption isotherm. Also, the mechanism of the adsorption was studied by fitting the experimental kinetic data using pseudo-first order and pseudo-second order kinetic models. Application of the studied clay sample for removal of Cd and Zn ions from natural water samples was also tested.

2. Materials and Methods

2.1. Adsorbent

The raw clay was collected from Qalamshah, Fayoum, Western Desert, Egypt, where massive bentonite deposits are located and they are low-grade smectite [23]. Conventional purification of the raw clay was done (including clay dispersion through water then separation of the upper portion of the suspension followed by centrifugation and drying the solid content) [24] to reduce the impurities and increase the clay fraction for better adsorption efficiency. The purified clay was sodium exchanged using 3% wt anhydrous sodium carbonate, oven dried at 80 °C for 8 h, then ground in a porcelain mortar and finally passed through a 140-sieve. The final product was denoted Na–B.

2.2. Chemicals

All the chemicals used were of analytical reagent grade and used without further purification. Stock solutions of cadmium and zinc ions (1000 mg/L) were prepared by dissolving an appropriate amount of Cd (NO3)2·4H2O and ZnCl2·6H2O (Panreac, Barcelona, Spain) in doubly distilled water (DDW) then acidified by 2 mL HNO3 or HCl, respectively. Working solutions of Cd (II) and Zn (II) ions were prepared daily from the stock solutions by appropriate dilution. HCl or NaOH solutions were used for pH adjustment.

2.3. Characterization

The specific surface area (SSA) and cation exchange capacity of the Na–B sample were determined by methylene blue titration and spot methods, respectively [25]. X-ray diffraction (XRD) pattern of Na–B sample was recorded using PAN analytical X-ray diffractometer model X′Pert PRO with Cu-radiation (λ = 1.542 Å) source operated at 45 kV and 35 mA. The scanning speed 0.02°/s was used and the diffraction peaks between 2θ = 0° and 60° were recorded. Also, the basal spacing of the Na–B sample was calculated using Bragg’s equation nλ = 2dsinθ from the position of the 001 peak. The surface functional groups of the Na–B sample were shown by Fourier Transform Infrared (FTIR) spectroscopy analysis using Satellite FTIR spectrometer model 2000 (Mattson Instruments Inc., Madison, WI, USA) in the wavenumber range of 4000–400 cm−1. The Na–B sample was compressed into a pellet with KBr powder and the background spectrum was subtracted to obtain the clay sample FTIR spectrum. The morphology and the elemental composition of the dried sample were analyzed using a field emission scanning electron microscope (SEM. Quanta 250 FEG, FEI company, Eindhoven, The Netherlands) equipped with an EDX unit operated at 30 kV (magnification up to 1,000,000), the sample was coated with gold before SEM analysis.

2.4. Adsorption Experiments

The adsorption measurements were performed using batch equilibrium technique at ambient temperature (26 °C with range 25–27 °C). For this purpose, 25 mL working solutions of cadmium or zinc ions were placed in 250 mL polyethylene plastic bottles after pH adjustment together with 0.05 g adsorbent. Solid-liquid mixing was done using orbital shaker at a speed of 200 rpm for 60 min then the suspension was centrifuged at 10,000 rpm (8944× g) for 15 min to separate the solid phase. Residual Cd (II) or Zn (II) ions concentrations were measured using atomic absorption spectrophotometer AA-7000 (SHIMADZU, Koyto, Japan). The adsorption process was optimized by studying the parameters affecting the removal process including initial solution pH, adsorbent content, uptake time, and initial metal ions concentration. The pH dependence of the adsorption process was studied over the pH range 3–10 ( ± 0.04 ) where the pH was measured using BOECO pH meter (Boeckel Co., Hamburg, Germany) and adjusted by adding HCl or NaOH. The optimum sorbent content was determined by mixing different adsorbent dosages 10, 20, 30, 50, 100, and 200 mg with 25 mL working solutions whose initial concentration is 0.8 ppm using an orbital shaker operated at 200 rpm for 60 min. The effect of uptake time on the adsorption process was studied by varying the shaking time over an interval of 2–90 min. The experimental kinetic results were fitted according to pseudo-first order and pseudo-second order kinetic models to understand the mechanism of adsorption. Also, the adsorption isotherms were evaluated by varying the initial metal ions concentration over 0.6–8 ppm while identical amounts of 0.02 g from Na–B were added to each solution and the suspensions were agitated at a speed of 200 rpm for 30 min in an orbital shaker at initial solution pH 6.5. The obtained results were simulated according to Langmuir and Freundlich isotherm models. All the experiments were repeated three times and averages of them are reported. The amount of Cd (II) or Zn (II) retained on the adsorbent was calculated using Equation (1):
q e = ( C o C e q ) V m
where qe (mg/g) is the amount of Cd (II) or Zn (II) retained on the adsorbent, Co (mg/L) is the initial metal ion concentration, Ceq (mg/L) is the equilibrium concentration of Cd (II) or Zn (II) after the adsorption process, m (g) is the mass of the adsorbent, and V (L) is the volume of the solution. The removal efficiency of Cd (II) and Zn (II) is calculated from the difference between initial and final Cd (II) or Zn (II) concentrations, respectively, according to Equation (2):
%   Removal = ( C o C e q ) C o   × 100

2.5. Application for Real Samples

To assess the practical application of the studied Na–B adsorbent, two real samples—Qaroun Lake water and regional Nile river water (Bahr Youssef)—were collected from Fayoum governorate and treated by Na–B sample using batch procedures. Firstly, the water samples were filtered using Whatman filter paper No. 42 to remove suspended particulates. Secondly, each water sample was placed in a clean glass bottle and spiked with 0, 50, or 200 μg from Cd2+ or Zn2+ ions. Afterward, each sample was mixed with the clay adsorbent at a 0.8 g/L ratio for 1 h by orbital shaker operated at 200 rpm. Finally, the Cd or Zn-laden Na–B samples were separated from the water samples by centrifugation eluted by 25 mL 0.1 M HCl acid and the concentration of the eluted metal ions was determined by ICP-OES.

3. Results and Discussion

3.1. Characterization

3.1.1. Specific Surface Area (SSA) and Cation Exchange Capacity (CEC)

Surface area and cation exchange capacity measurements of clay minerals are important for characterizing their bonding and swelling power, adsorptivity for polar compounds, and plasticity. Methylene blue (MB) spot and titration methods are widely used for SSA and CEC determination where they estimate them more accurately than other conventional methods [26]. Equations (3) and (4) are used to calculate SSA and CEC, respectively:
S S A = m M B 319.87 A v A M B 1 m s
C E C = 100 m s V c c N m b
where m M B is the mass of the adsorbed MB at the point of complete replacement, m s is the mass of the clay specimen, 319.87 is the molecular weight of MB dye, A v is Avogadro’s number (6.02 × 10²³/mol.), A M B is the area covered by one MB molecule, V c c is the volume of the MB titrant, and N m b is the normality of the MB (meq/mL). By substitution in Equations (3) and (4), it was found that the SSA and CEC of the Na–B sample are 367 m2/g and 85 meq/100 g, respectively. For comparison purposes, SSA is also measured by N2 adsorption method (BET specific surface area) using a Quantachrome Monosorb® device (Quantachrome Instruments, Boynton Beach, Florida, USA) and it was found to be 75.5 m2/g. This value is very small compared to that estimated by MB test due to the N2 adsorption only technique estimating the external surface area rather than total surface area for swelling silicates [26].

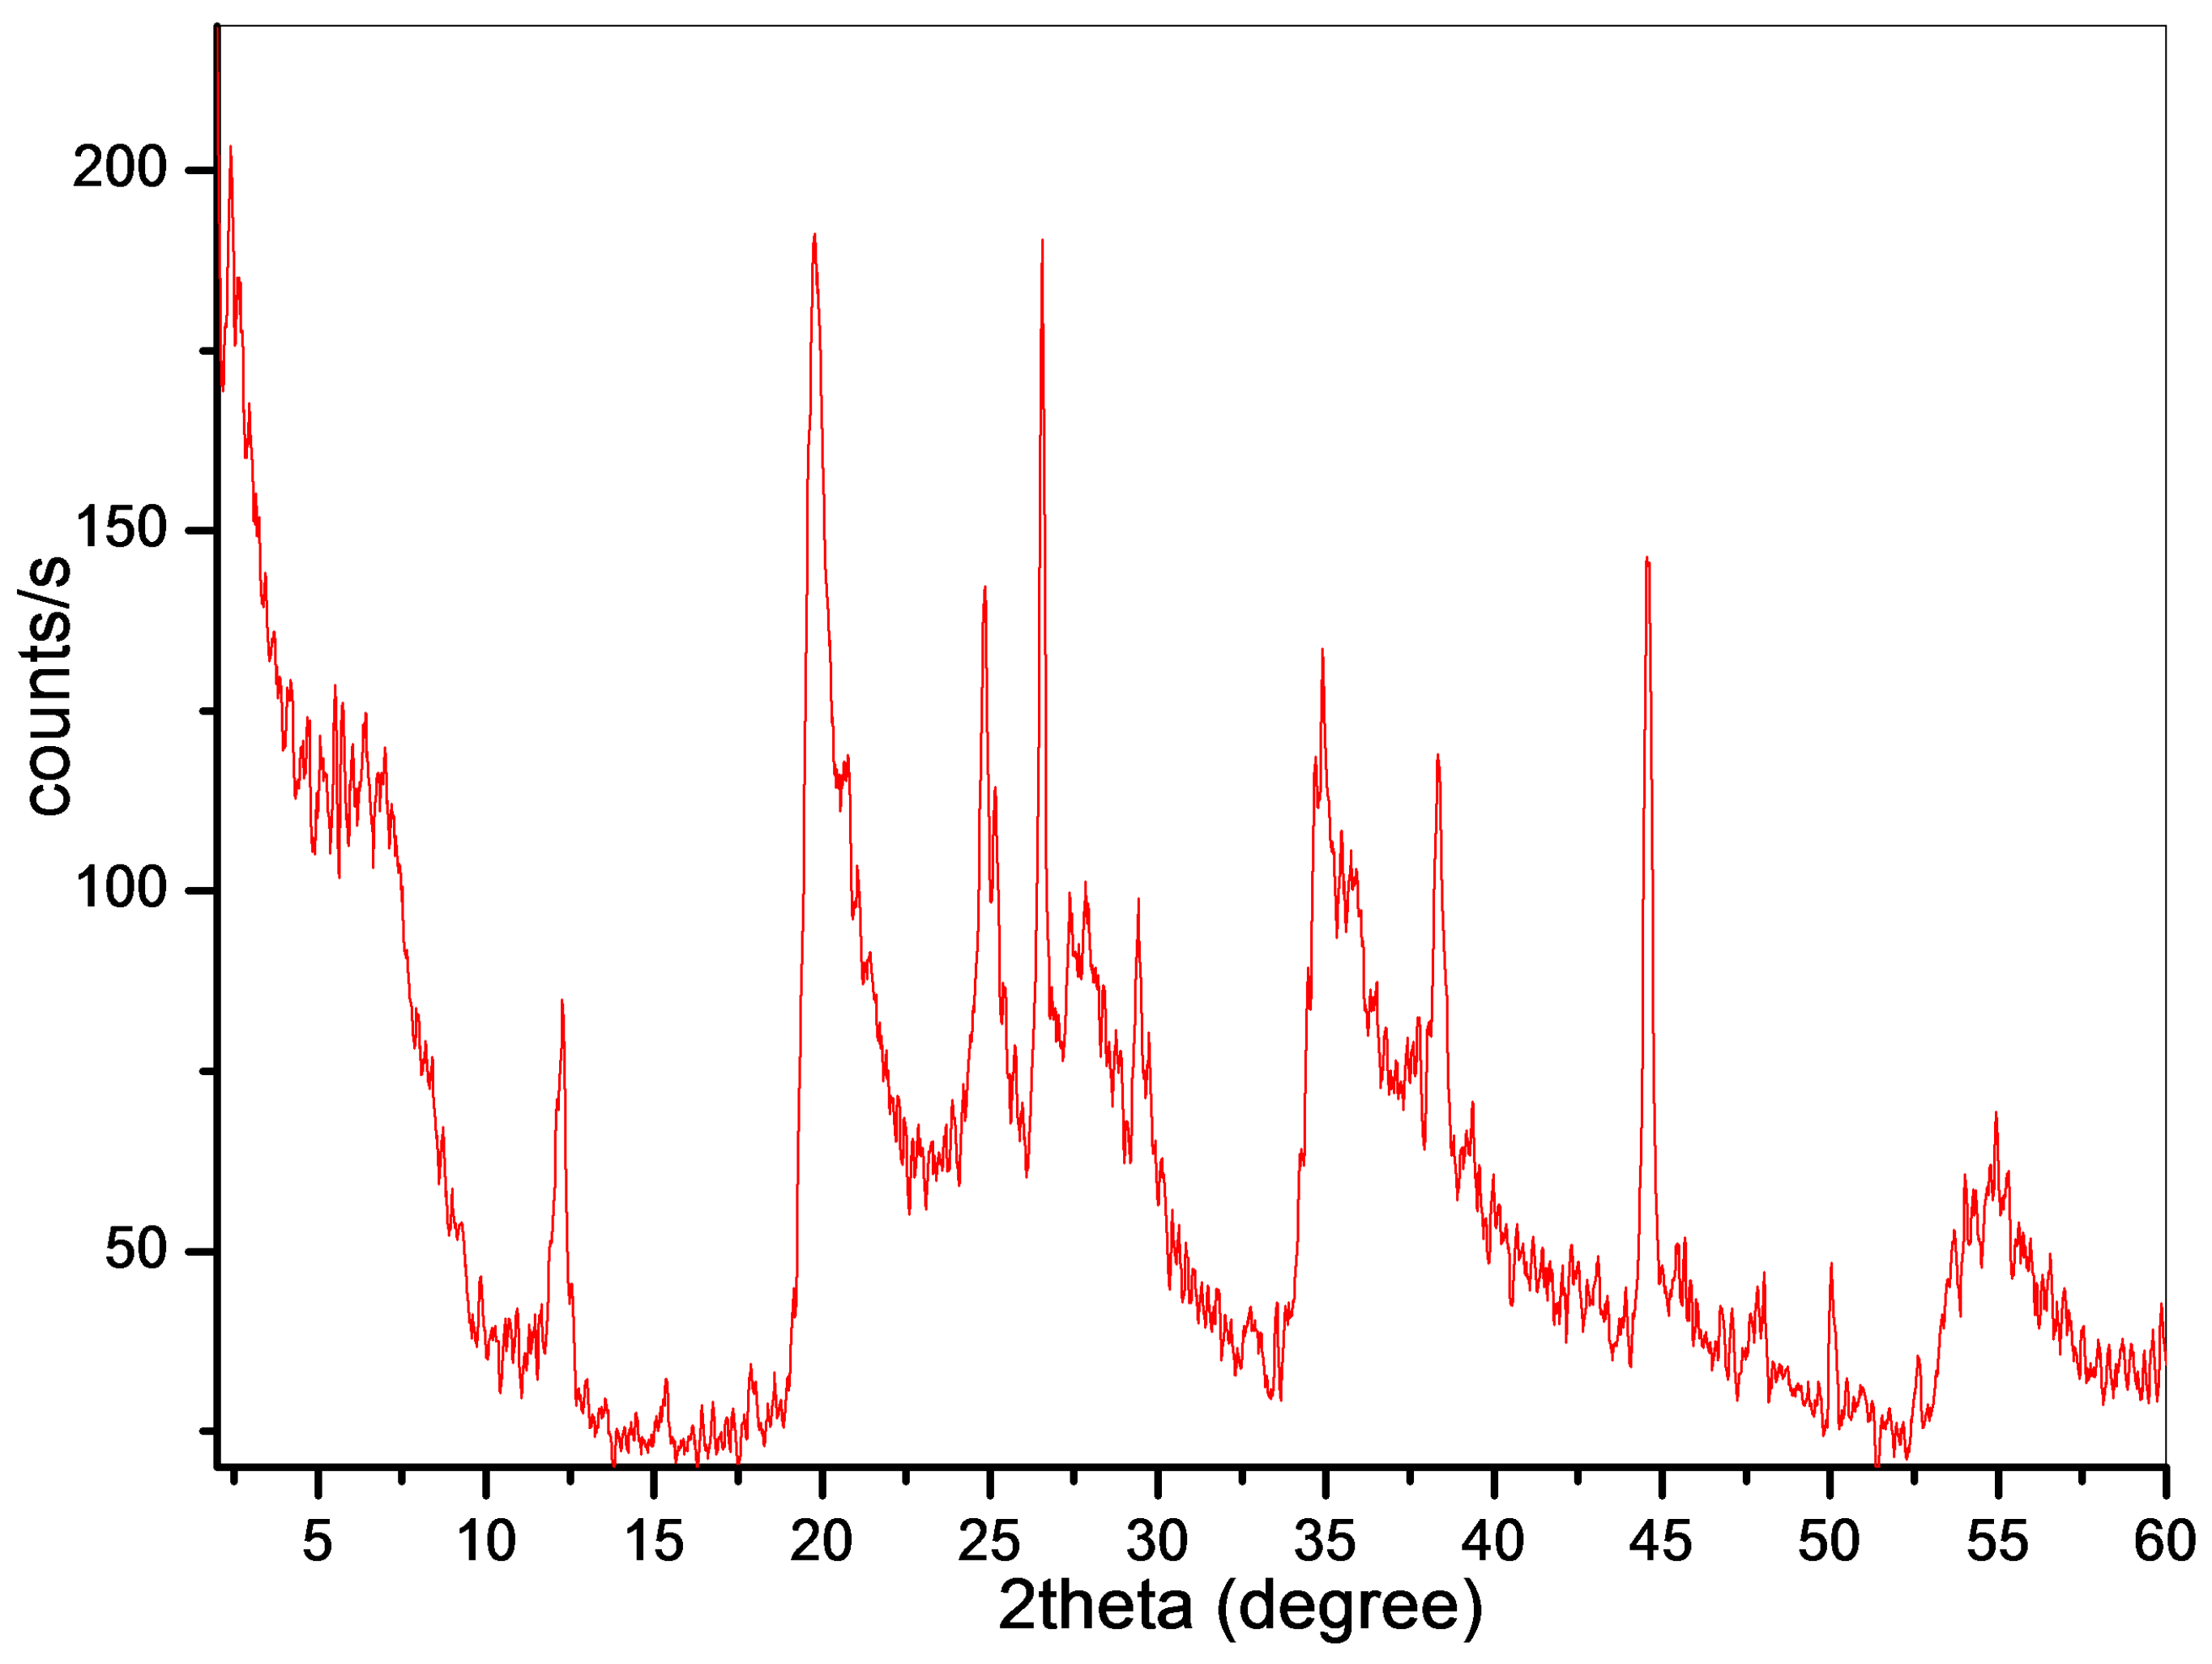
3.1.2. X-ray Diffraction Analysis

XRD analysis is widely used to investigate the mineralogical composition of clay minerals which deeply affects their physiochemical properties. For this purpose, the Na–B powder sample was subjected to XRD analysis and the result is shown in Figure 1.
The Na–B sample consists mainly of montmorillonite (with its characteristic peaks at 2θ = 7.3°, 19.84°, 27.9°, 36°, and 50° [27]) and kaolinite (with its diffraction peak at 2θ = 12.23° [28]) as mixed clay minerals with few impurities of quartz with reflection peak at 2θ = 26.55°. The 001 peak at 2θ = 7.23° with d-spacing = 1.22 nm indicates that the bentonite clay is of the sodium type [29] as a result of the activation process which is also confirmed by the SEM results.

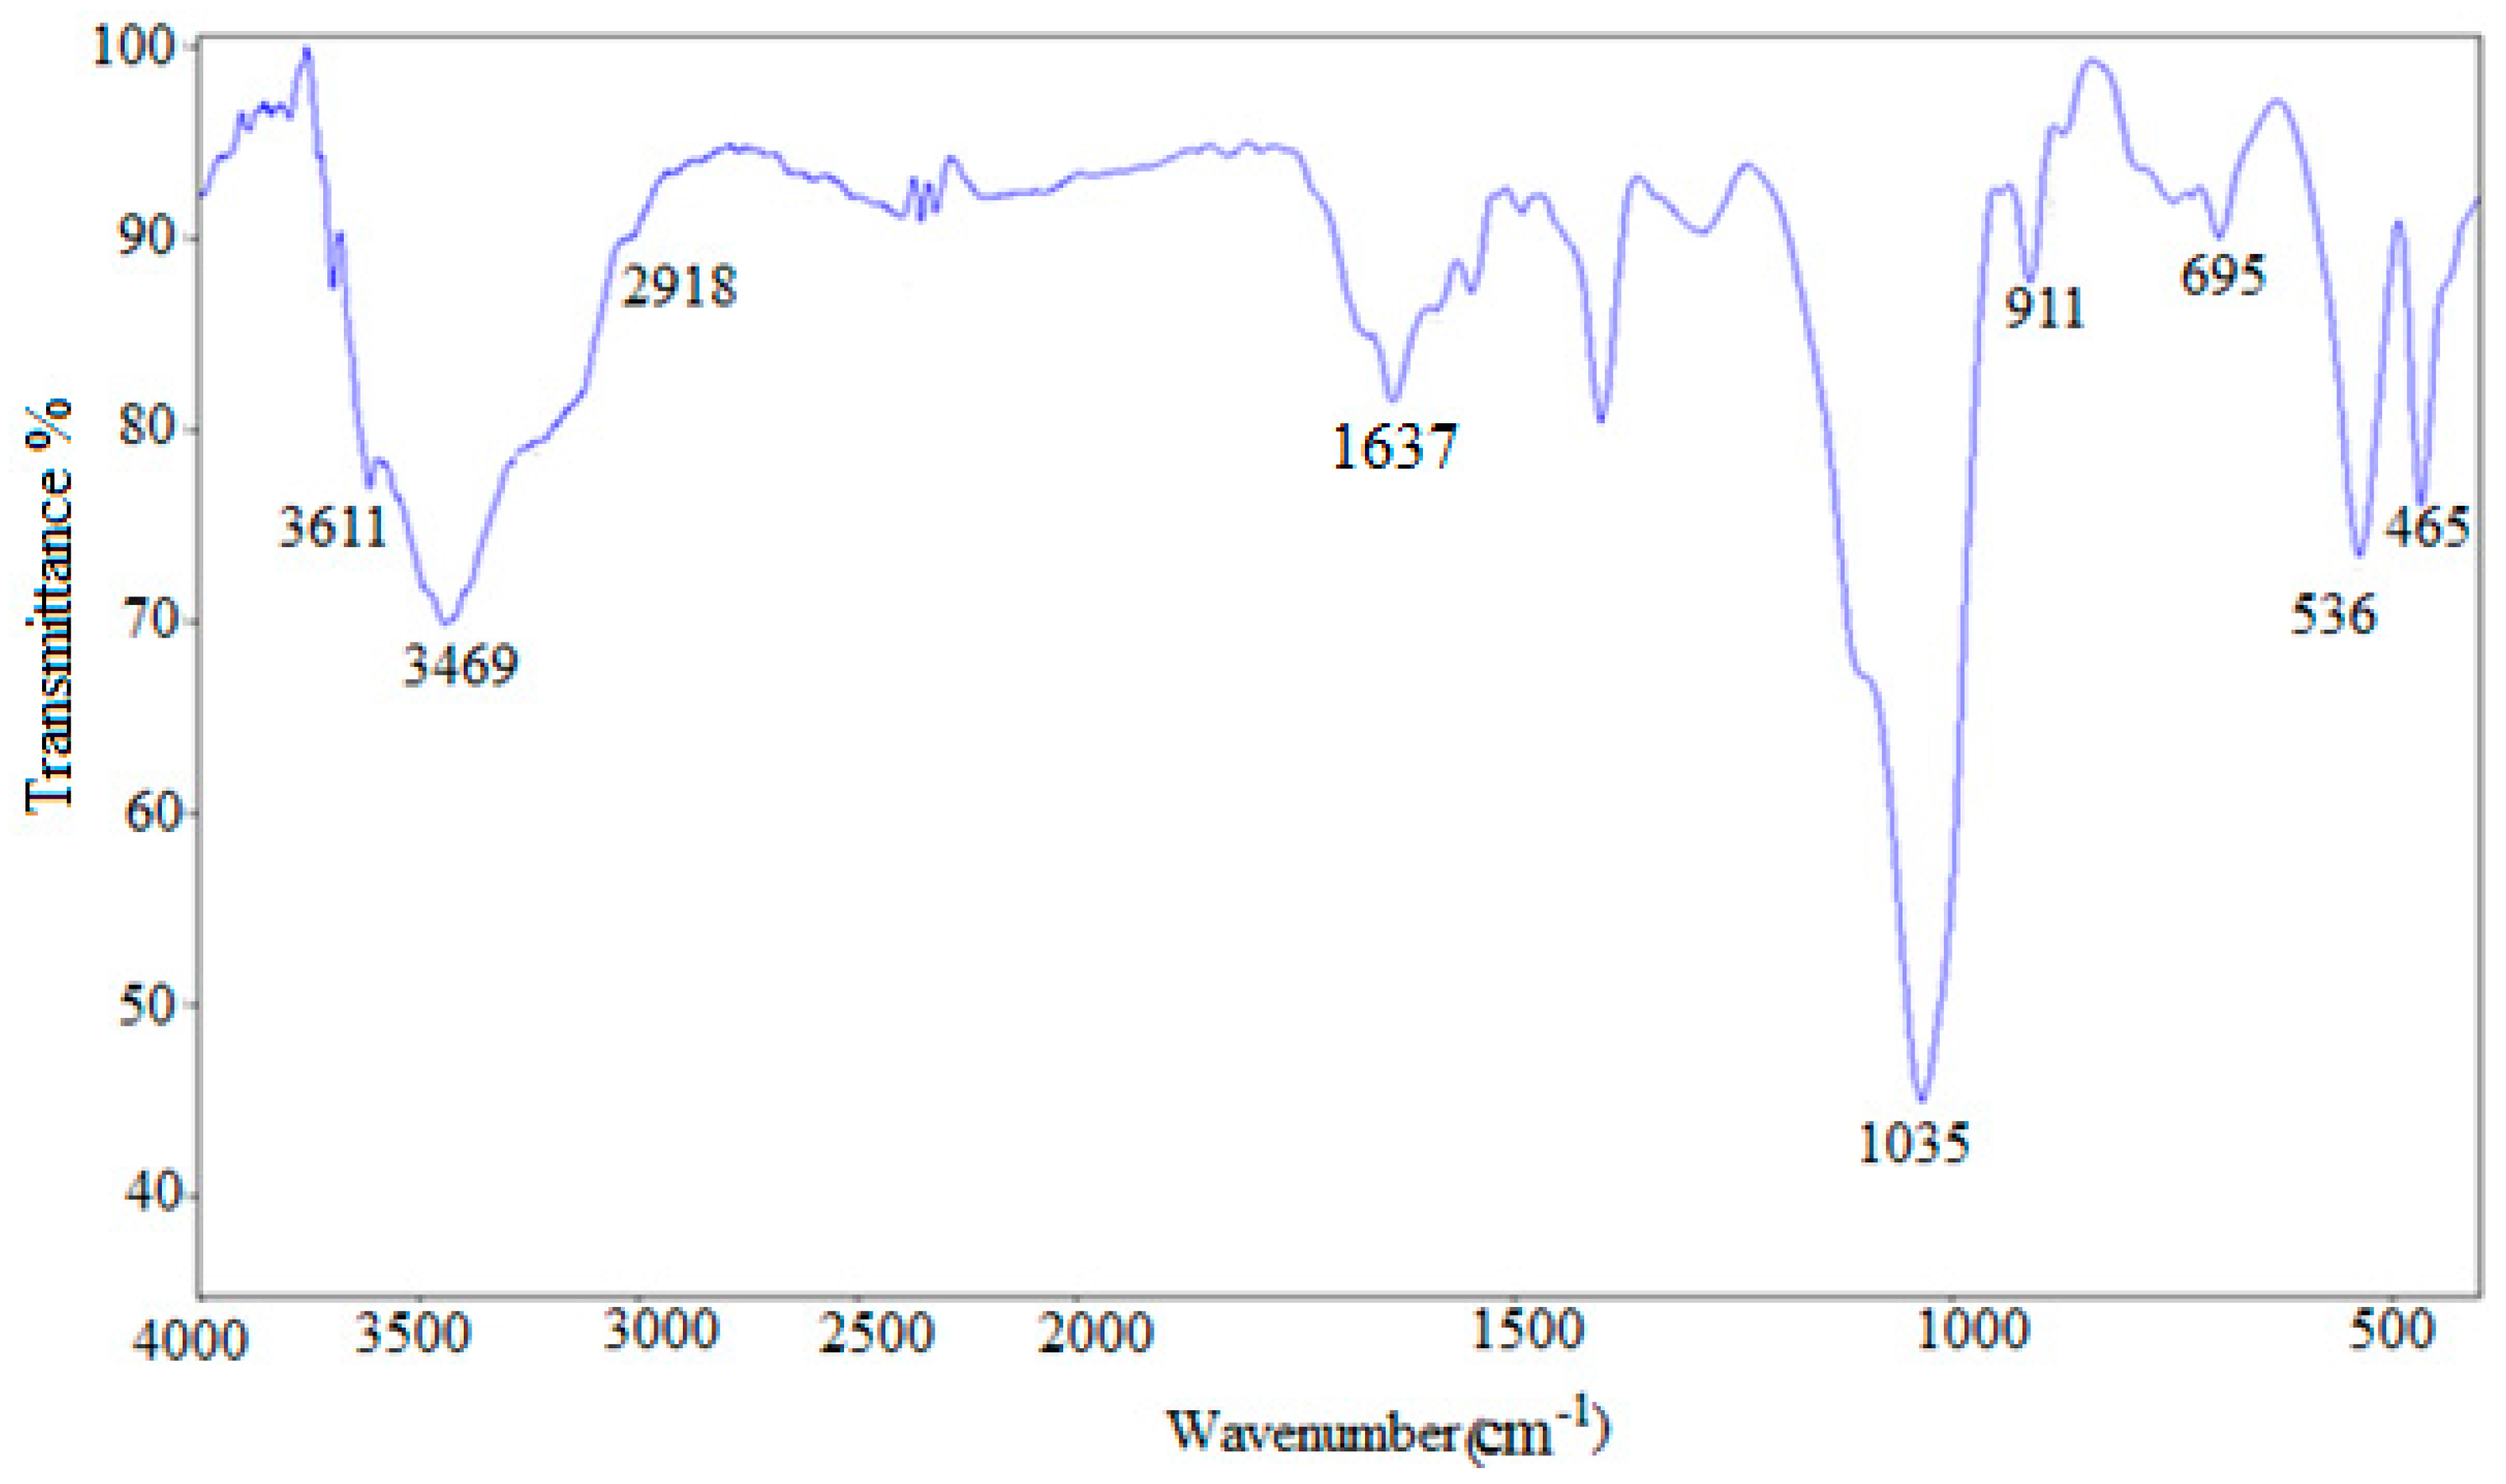
3.1.3. FT-IR Analysis

FT-IR spectra provide useful information about the surface functional groups which to a great extent affects the adsorption process of contaminants to an adsorbent surface. For this reason, the FT-IR spectrum of the bentonite clay was recorded as shown in Figure 2.
As shown in Figure 2, the broad band at 3200–3600 cm−1 is due to stretching vibration of surface –OH groups and adsorbed water molecules which have a bending vibration mode at 1637 cm−1 [28]. The band at 2918 cm−1 is assigned to –CH2 group indicating the presence of organic materials within the clay structure as confirmed by the elemental analysis. A strong absorption band at 1035 cm−1 is evidence for silicate (Si-O-Si) structure. Also, Si-O-Si, Al-Al-O, and Al-O-Si bending vibration appeared at 465, 536, and 911 cm−1, respectively [27]. The presence of iron oxide can be seen by the combined band at 465 cm−1 [30]. The absence of a typical peak of calcite (i.e., at 1109 cm−1) is an indication that the clay sample is free from carbonate [27].

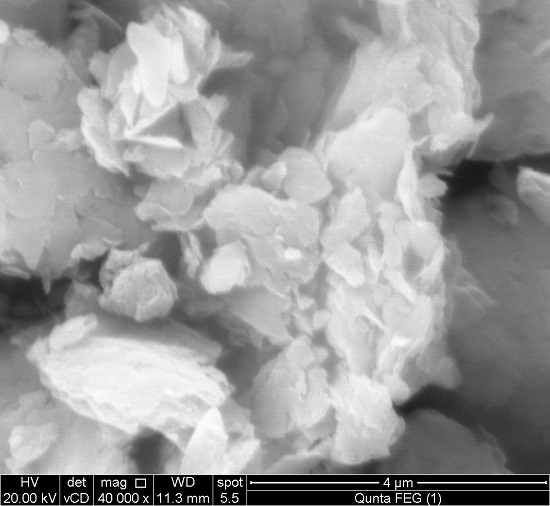
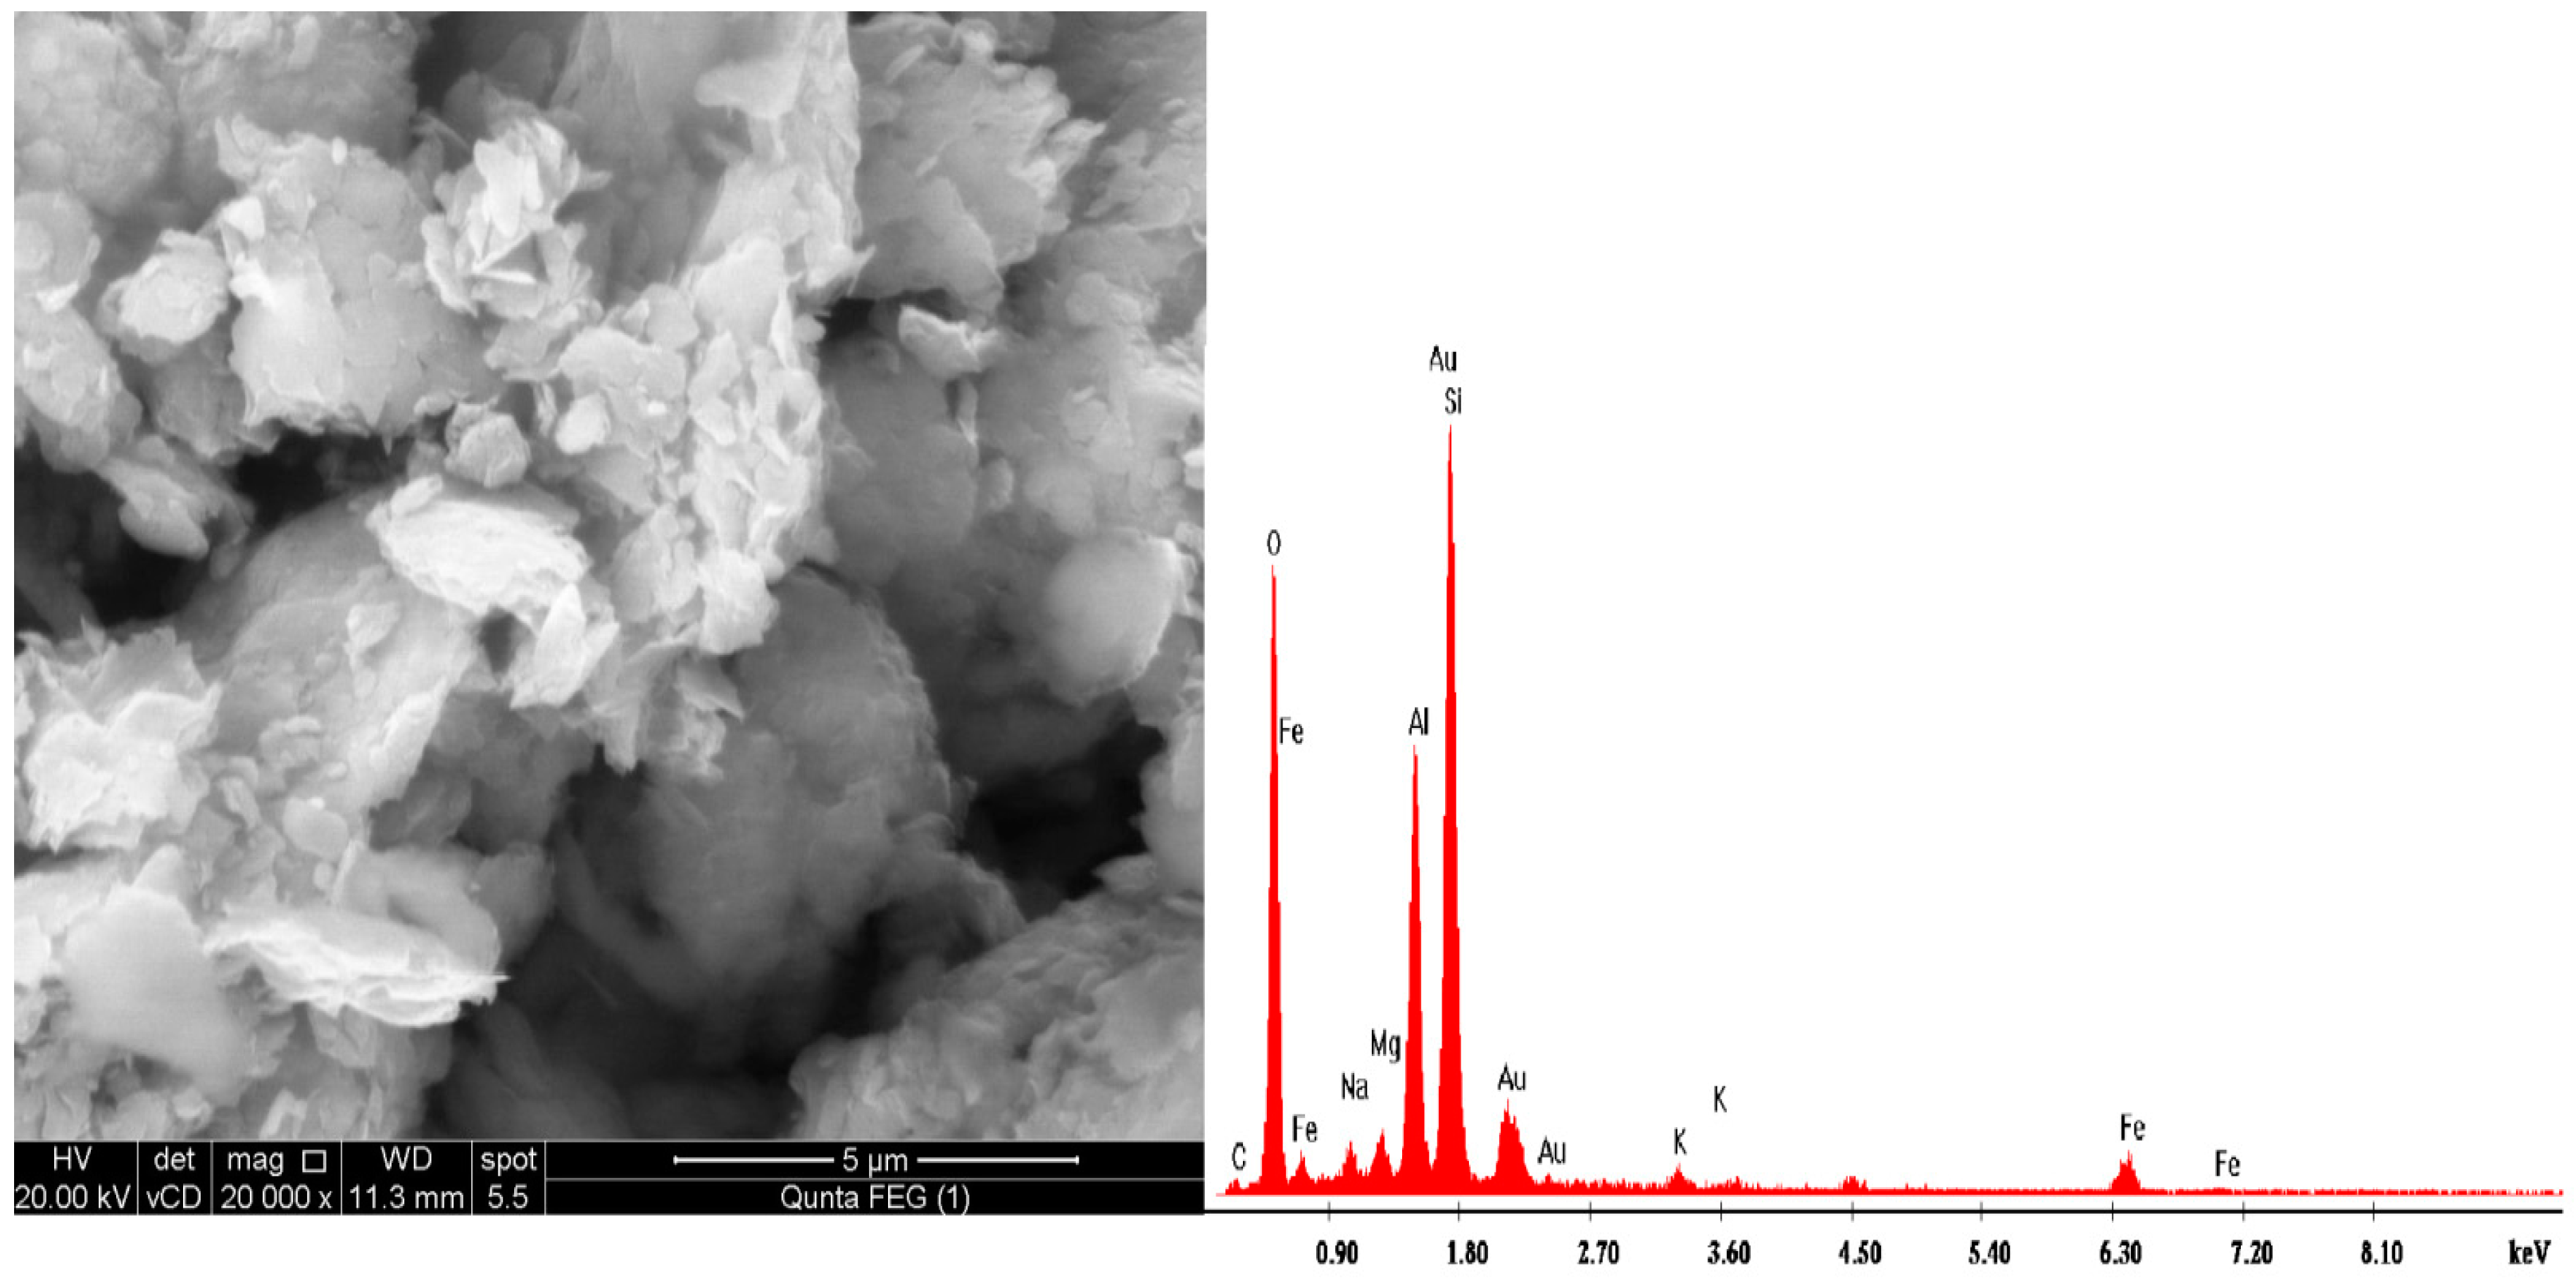
3.1.4. SEM-EDX Analysis

The morphology and elemental composition of the Na–B sample were studied and the representative results are shown in Figure 3 and Table 1. The perfect edge to layer sheet-like structure of the Na–B sample is clearly shown in Figure 3. The sheet-like substance within a clay sample should belong to montmorillonite [31]. The elemental analysis reveals the aluminosilicate structure of the bentonite sample with sodium as the predominant exchangeable cation. Also, this finding demonstrates the presence of organic matter (represented by carbon atom) and iron oxide (represented by iron atom) within the microstructure of the Na–B sample. These whole results confirm the aluminosilicate structure of the studied sample that boosts its application as a sorbent for heavy metal ions.

3.2. Adsorption Experiments
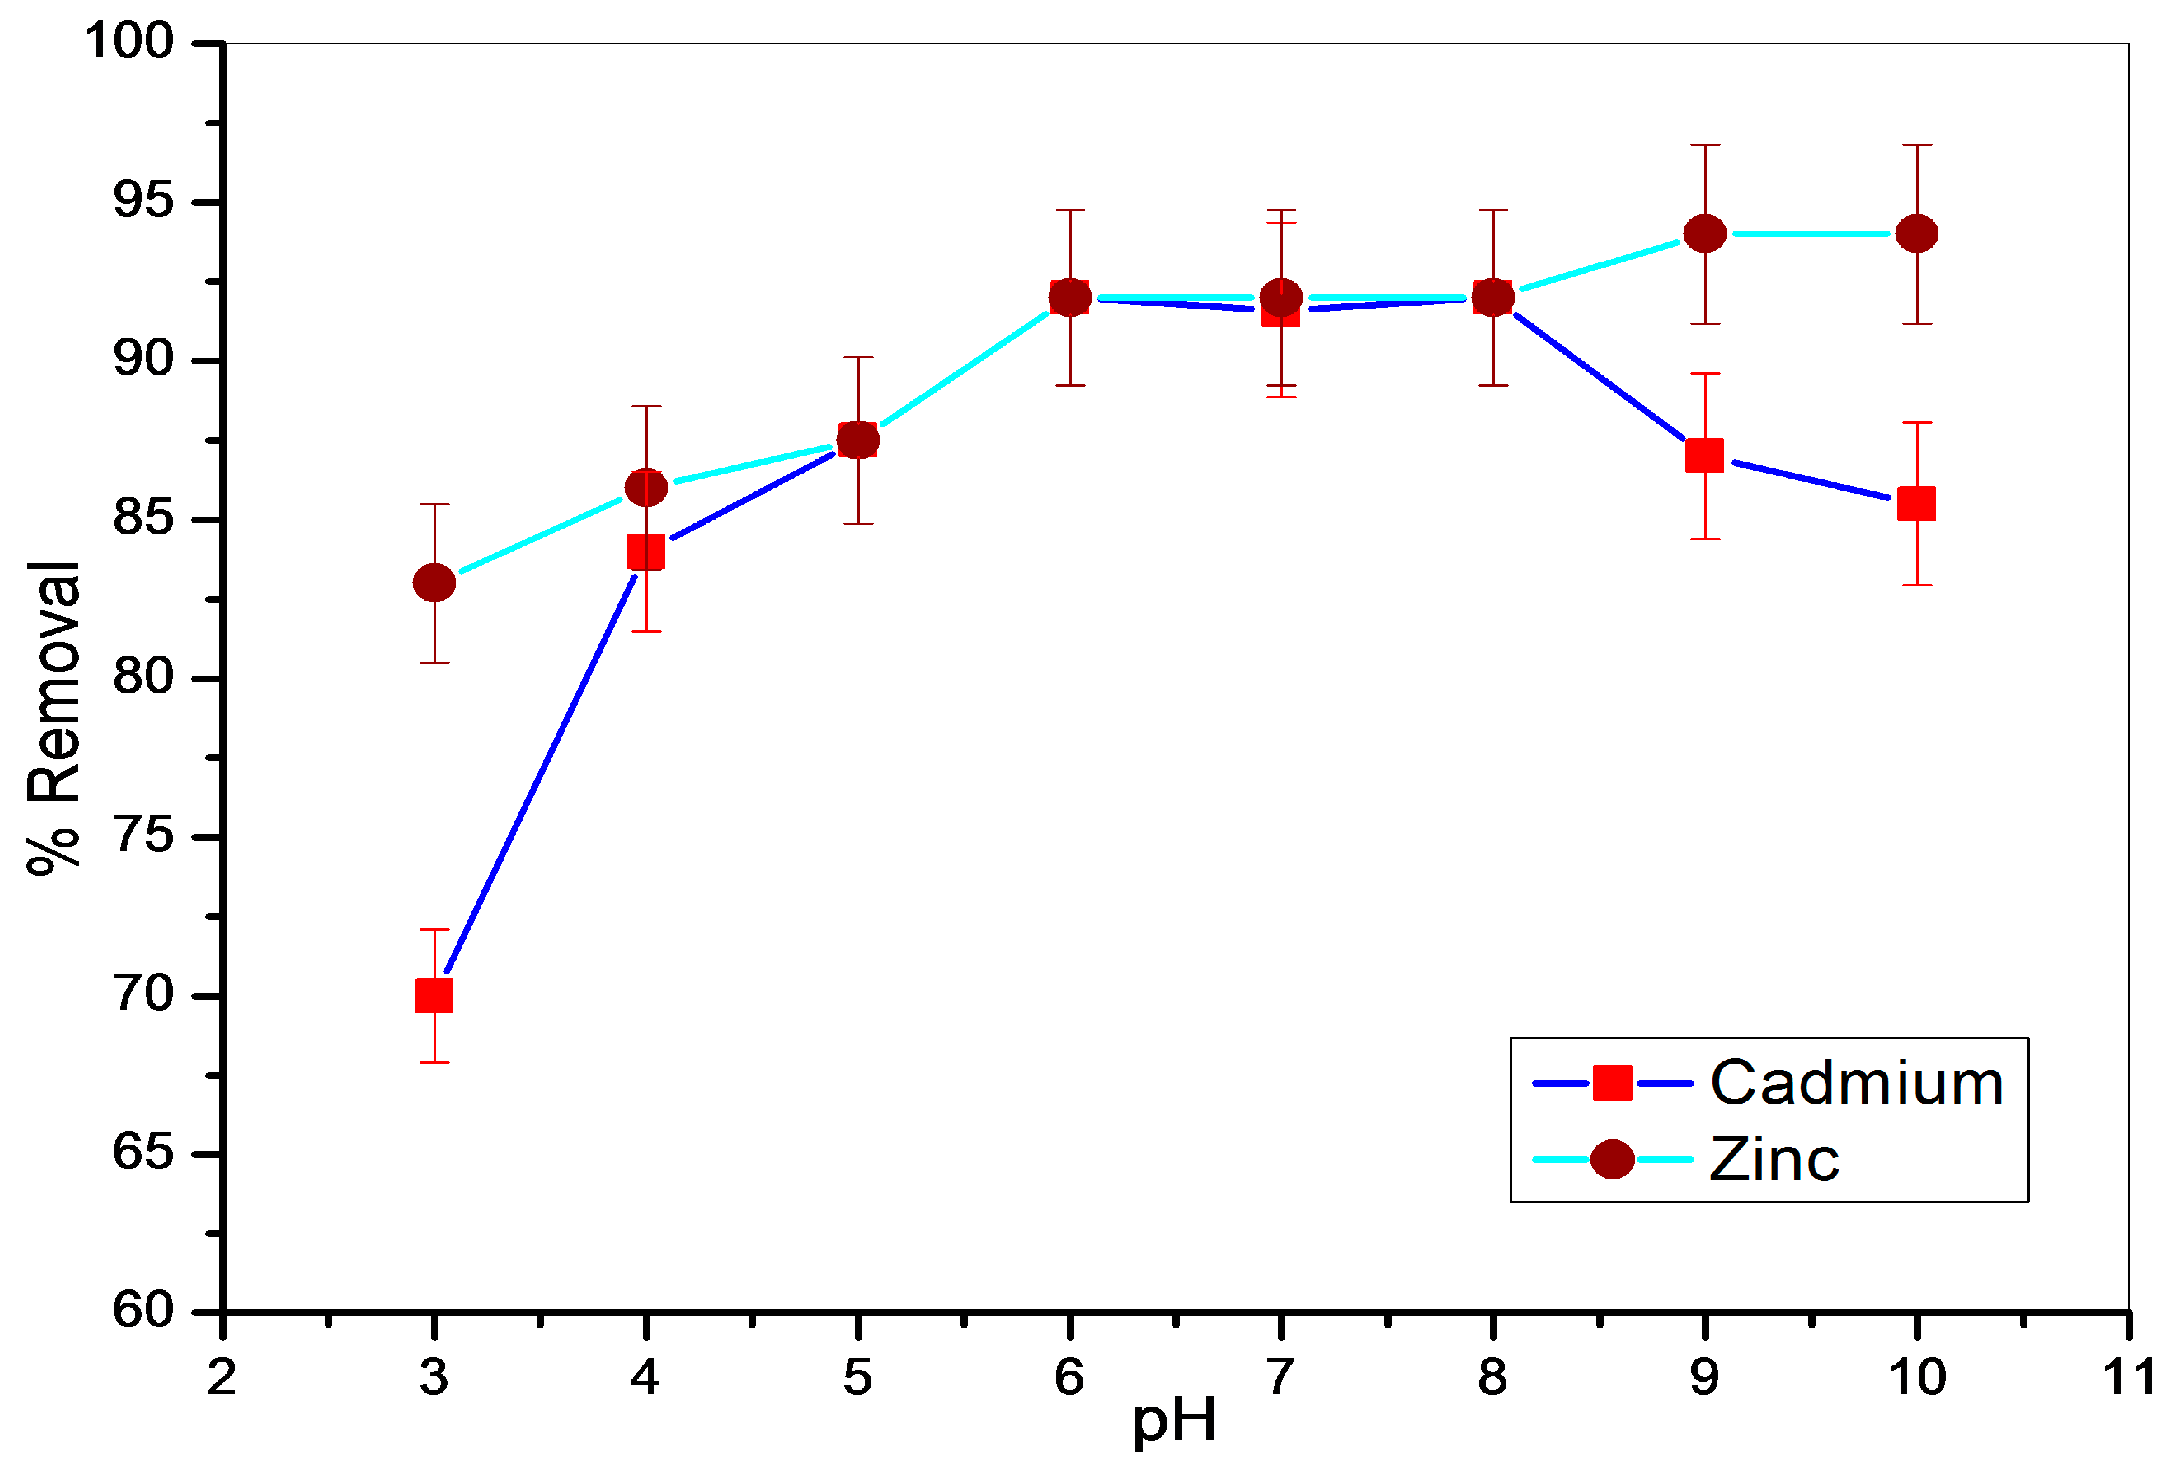
3.2.1. Effect of pH

The initial solution pH deeply affects the adsorption of heavy metal ions onto an adsorbent surface which in principle is related to both the surface functional groups on the adsorbent as well as the chemical speciation of metal ions in the solution [19]. The pH dependence of Cd (II) and Zn (II) uptake onto the Na–B sample was studied and the results are presented in Figure 4.
From this figure, we noticed the great tendency of Cd (II) and Zn (II) towards adsorption onto the bentonite surface and this tendency is in the order of Zn (II) > Cd (II) due to a smaller ionic size of zinc ions resulting in facile adsorption to active sites [32]. Maximum removal takes place at pH = 6–8 for both metal ions as a result of minimizing the competition between these metal ions and H+ ions [21,33]. At pH values < 8, 90% of cadmium will remain as Cd2+ [34] and 80% of zinc will remain as Zn2+ [35], thus the adsorption process is largely governed by the cation exchange reaction [36] as presented in Equation (5):
[ S H ] ( s ) +   M ( a q ) 2 + [ ( S ) 2 M ] ( s ) + 2 H ( a q ) +
where [ S H ] and M 2 + represent the surface of bentonite and the metal ions, respectively. Besides, surface complexation is also another possible mechanism for Cd2+ and Zn2+ ion removal onto Na–B adsorbent as it largely affects heavy metal ion removal onto clay adsorbents [21]. Beyond pH 8, precipitation, electrostatic attraction, and/or surface complexation are the predominant mechanisms for removal of the studied metal ions [37]. Zn ions are precipitated, complexed, or adsorbed easier than cadmium ions resulting in removal enhancement of zinc rather than cadmium as reported before [38]. Because the clay sample is free from carbonate and the adsorption experiments were conducted using DDW, hydroxide precipitation is the expected form of precipitation. Based on the above results, pH 6.5 was chosen as the optimal pH for further studies for both metal ions.

3.2.2. Effect of Sorbent Dosage

The effect of adsorbent content on the removal of Cd (II) and Zn (II) onto Na–B was tested over 0.4–4 g/L under the experimental conditions of pH = 6.5 ±   (0.03), shaking time = 60 min, and initial metal ion concentration = 0.8 ppm and the results are presented in Figure 5.
These results suggest the high effectiveness of Na–B for the removal of Cd (II) and Zn (II) ions from aqueous solutions even at very small loading as more than 85% removal of both metal ions being achieved with 0.5 g/L sorbent content. As the adsorbent dosage increased to 0.8 g/L, the % removal increased to 92% which can be correlated to more active sites being available for adsorption when increasing the adsorbent content. This, in turn, agrees with previously reported results [21] for adsorption of Cd (II) onto bentonite. Therefore, 0.8 g/L adsorbent content was chosen as the optimal dosage for further investigations.

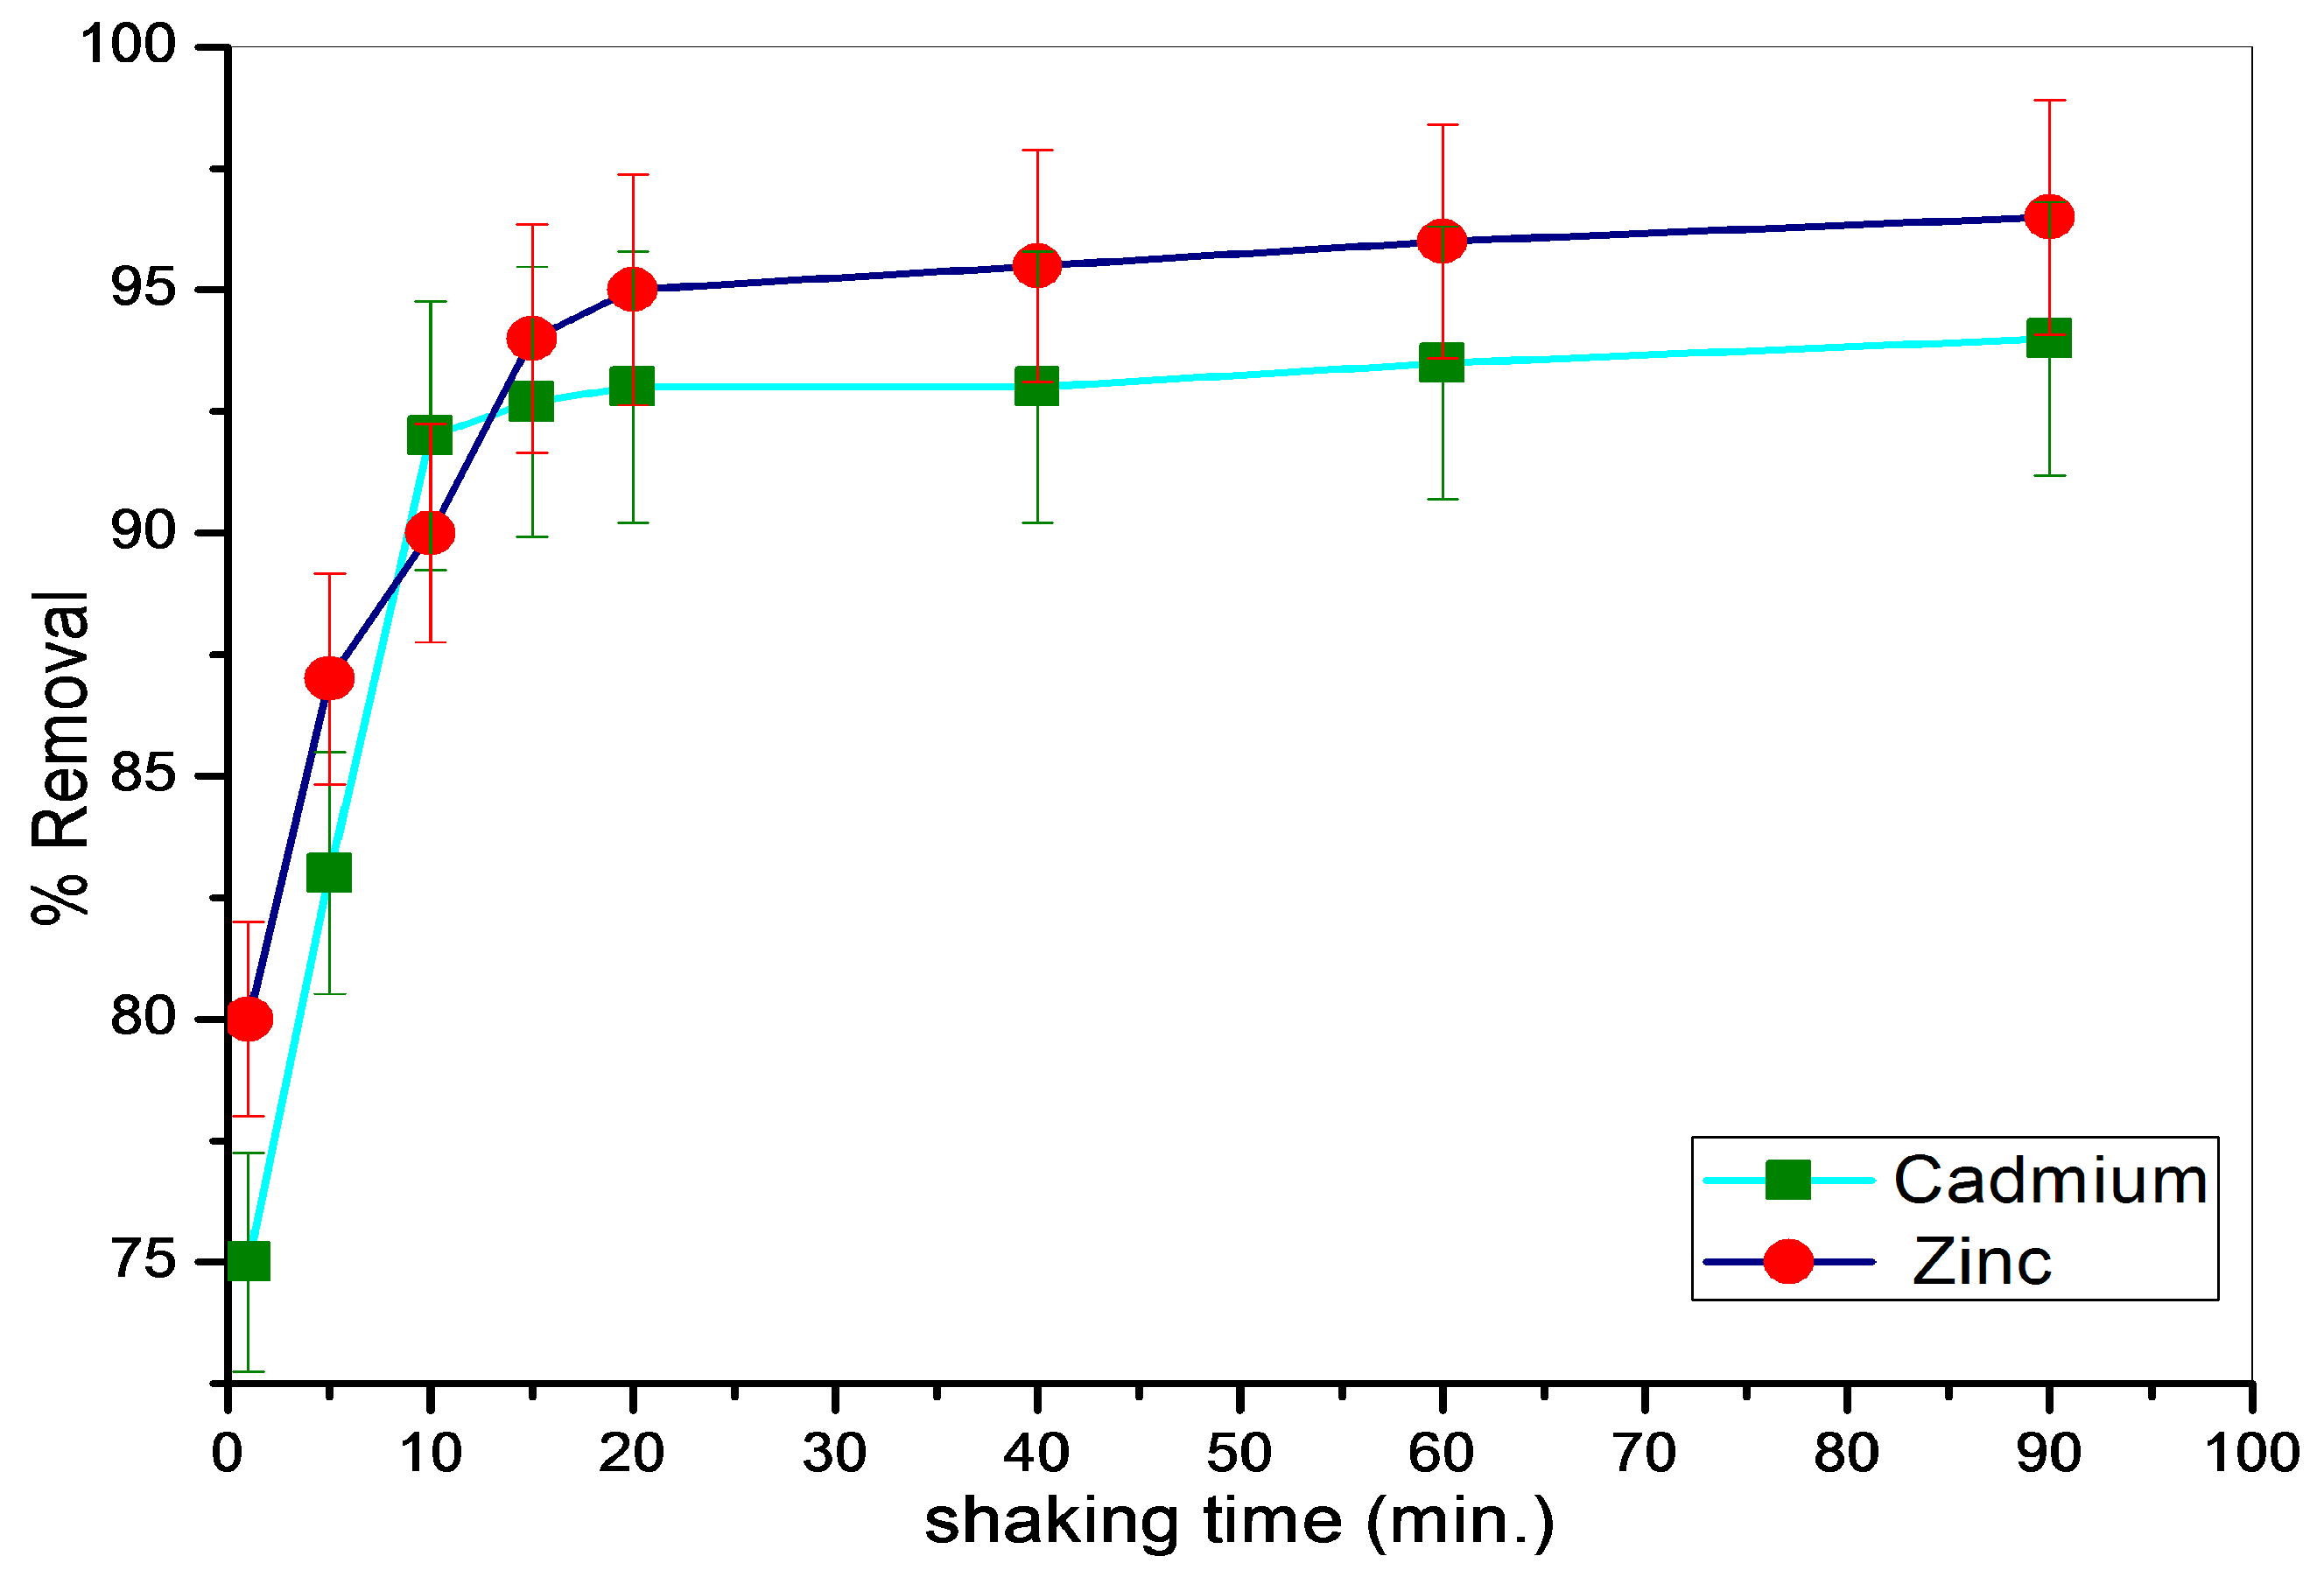
3.2.3. Effect of Shaking Time

To investigate the time required for maximum removal, the solid-liquid mixtures were shaken together using an orbital shaker over different shaking times and the remaining metal ions were determined in the supernatants to determine the removal efficiency as presented in Figure 6.
The process of Cd (II) and Zn (II) uptake to Na–B is very rapid at the beginning with removal enhancement over time (Figure 6). A slight increase in the % removal after 20 min shaking time occurred, suggesting that the adsorption of Cd (II) and Zn (II) onto Na–B is a multi-stage process i.e., bulk diffusion, film diffusion, intraparticle diffusion and adsorption onto the interior active sites. The removal efficiency shows a plateau after shaking times more than 20 min, therefore; 30 min was chosen as a sufficient time to attain equilibrium.

3.3. Adsorption Kinetics

Adsorption kinetics is one of the most important criteria describing the efficiency of an adsorbent for practical uses. It shows the solute uptake rate that controls the diffusion and the residence time of adsorbate at the solid–solution interface [37]. To determine the metal ion uptake rate and explain the mechanism of adsorption, the experimental data were fitted using pseudo-first order and pseudo-second order kinetic models.

3.3.1. Pseudo-First Order Model

The model is based on the assumption that the rate of adsorption is proportional to the number of free active sites.
The model can by expressed by the Lagergren equation (Equation (6)):
ln ( q e q t ) = ln q e k 1 t
where qe and qt represent the amount of Cd (II) or Zn (II) ions adsorbed (mg/g) at equilibrium and at any time t and k 1 (min−1) is the first order rate constant. Values of adsorption rate constant (k1) and equilibrium adsorption capacity (qe) for adsorption of Cd (II) or Zn (II) onto Na–B were calculated (Table 2) from the slope and intercept for plots of ln (qeqt) versus t (Figure 7). The data were fitted with poor correlation coefficients and very small adsorption capacity compared to the experimental one indicating that adsorption of cadmium and zinc ions onto Na–B does not follow the pseudo-first order kinetic model.

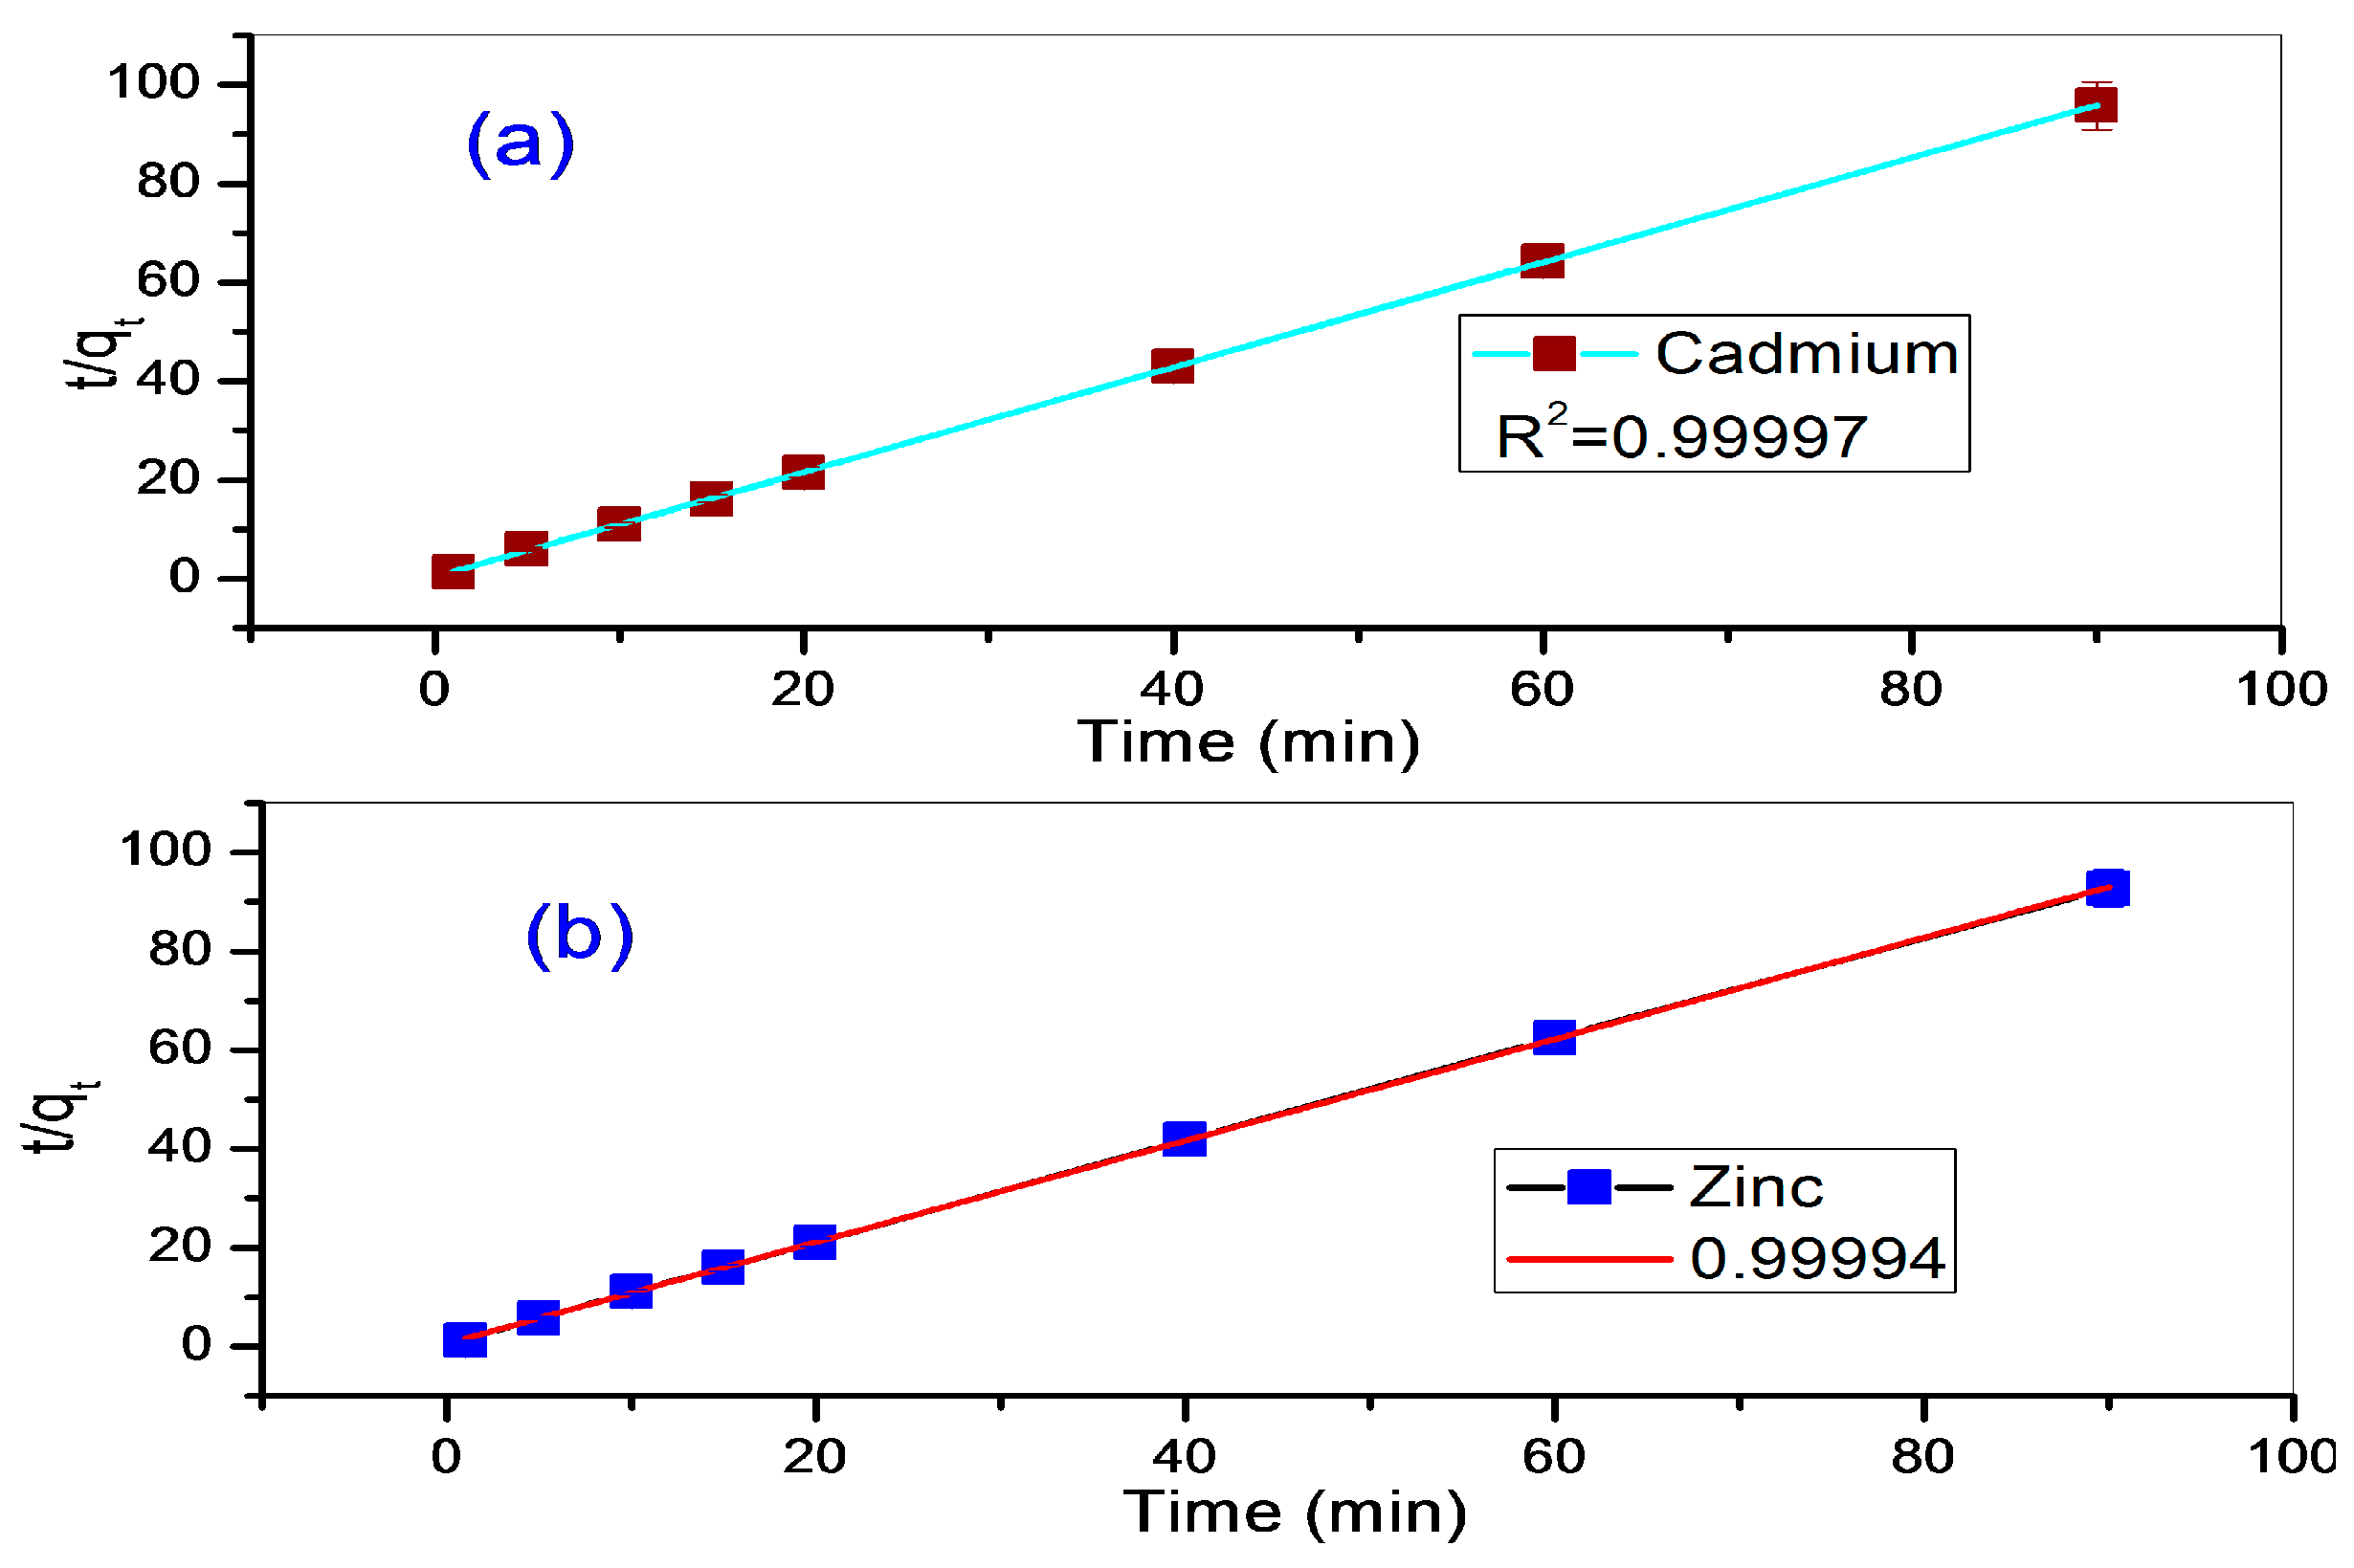
3.3.2. Pseudo-Second Order Model

This model is based on the assumption that the rate of adsorption process is proportional to the square of the number of unoccupied sites.
The linearized form of the equation is expressed as follows:
t q t = 1 k 2   q e 2 + t q e
where k2 (g·mg−1·min−1) is the second-order rate constant, qe and qt (mg/g) represent the amount of Cd (II) or Zn (II) adsorbed (mg/g) at equilibrium and at time t (min.), respectively. The values of the second order rate constant (k2) and the equilibrium adsorption capacity (qe) can be calculated from the intercept and slope of a plot between t/qt and time t (Table 2). A typical experimental data fit of the pseudo-second order model for initial metal ion concentration 0.8 mg/L is shown in Figure 8. The experimental data fit very well to this model with very high correlation coefficients, R2 = 0.99997 for cadmium and 0.99994 for zinc. The calculated qe values are very close to the experimental ones. These suggest that the adsorption of both Cd (II) and Zn (II) onto Na–B follows the pseudo-second order kinetic model.

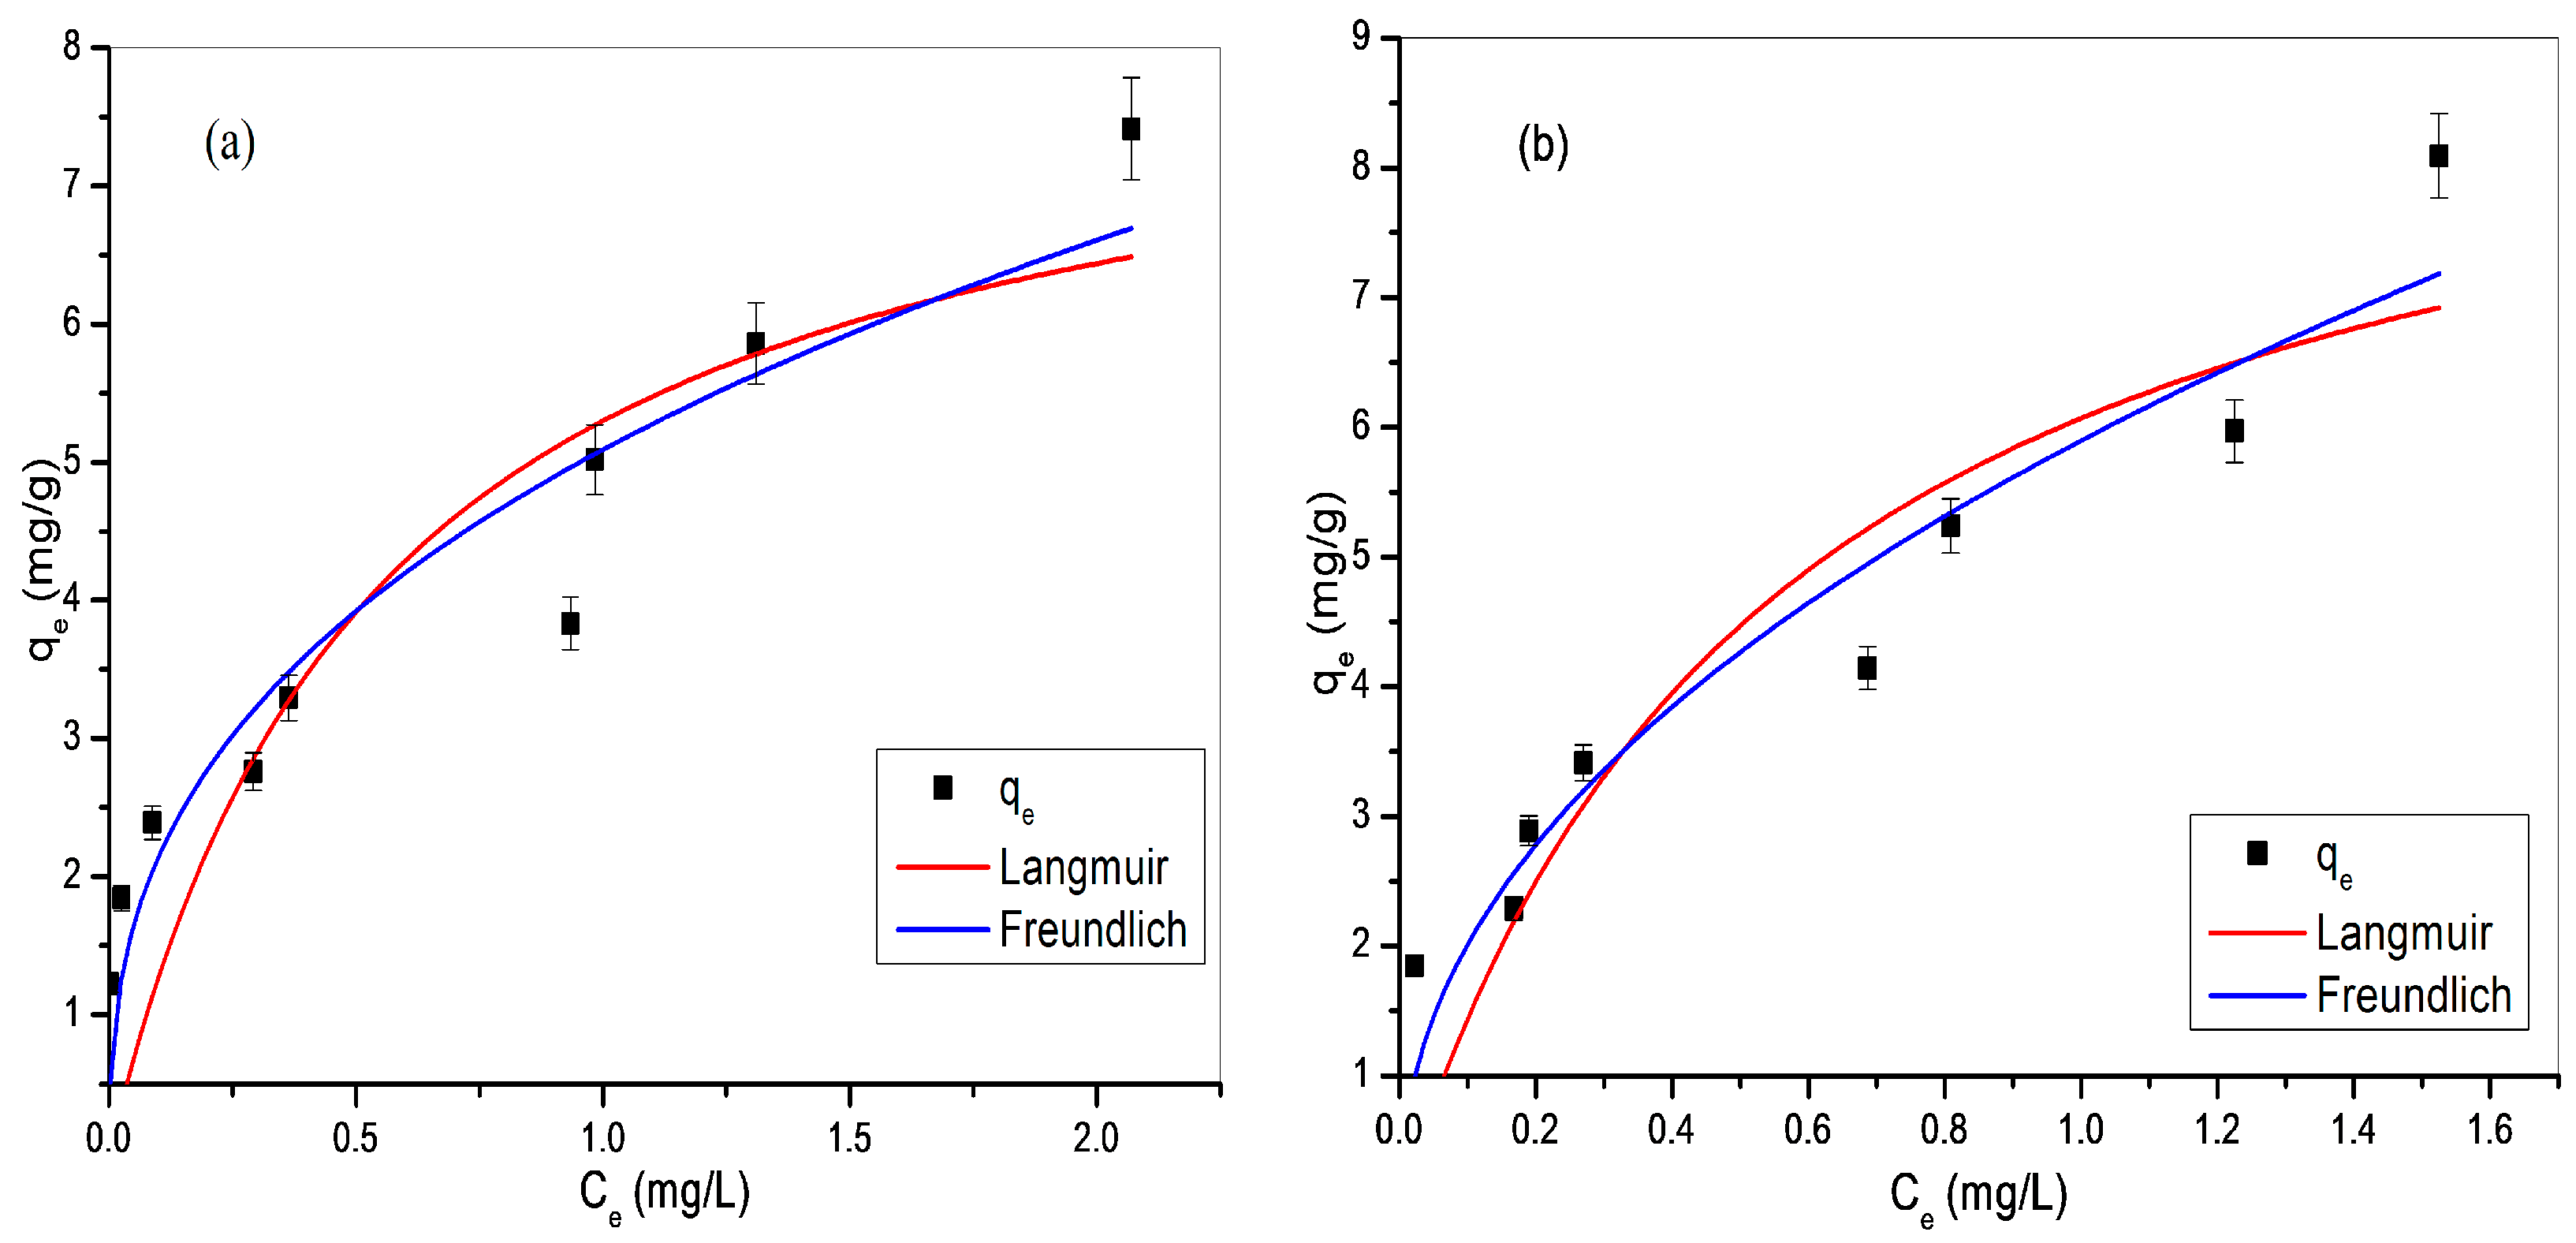
3.4. Adsorption Isotherm

In order to investigate the adsorptive performance and surface properties of the Na–B sample and its affinities for Zn2+ and Cd2+ uptake, the equilibrium data were fitted to Langmuir and Freundlich isotherm models.

3.4.1. Langmuir Isotherm

This isotherm is based on uniform and a finite number of adsorption sites assumptions where the maximum adsorption occurs when a saturated monolayer of solute molecules is present on the adsorbent surface. From a statistical point of view, this model assumes that there is no lateral interaction between adsorbed molecules [39,40]. The non-linear form of the Langmuir equation is given as:
q e =   q m K L C e 1 +   K L C e
where q e , q m , k L , and c e are equilibrium adsorption capacity (mg/g), maximum monolayer coverage capacity (mg/g), enthalpy of adsorption (L/mg), and metal ions equilibrium concentration (mg/L), respectively. The unique characteristics of Langmuir isotherm can be expressed in terms of a dimensionless constant called equilibrium parameter or separation factor (RL) which is defined by Equation (9):
R L = 1 1 + K L C o
where KL is the Langmuir constant and C o is the initial metal ion concentration (mg/L). The value of RL indicates the type of isotherm to be either favorable (0 < RL < 1), linear (RL = 1), unfavorable (RL > 1), or irreversible (RL = 0). The linear fitting of the experimental data to the Langmuir model and the corresponding sorption parameters are presented in Figure 9 and Table 3, respectively.

3.4.2. Freundlich Isotherm

The Freundlich isotherm is an empirical model based on assuming that the adsorption process takes place on energetically heterogeneous active sites with the stronger binding sites being occupied first together with an exponential decrease in the energy of adsorption upon the progress of the adsorption process [40]. This model is successfully applied to multilayer adsorption as it takes into account the lateral interactions between adsorbate molecules on the adsorbent surface [41]. The non-linear form of the Freundlich isotherm is written as:
q e =   K F C e 1 n
where K F is the unit capacity coefficient related to extent of adsorption and 1 n is the Freundlich constant related to the system heterogeneity [40,42]. The non-linear fit of the equilibrium data to Freundlich isotherm and the related parameters are shown in Figure 9 and Table 3, respectively.
The experimental data are fitted much better to the Freundlich isotherm model than to the Langmuir isotherm model (Figure 9). This is confirmed by the greater convergence between the calculated adsorption capacity values (qm) and the experimental ones and the higher correlation coefficients (Table 3). This suggests that the adsorption of cadmium and zinc ions to Na–B is a multilayer sorption that, in turns, agreed with that reported in the literature for the removal of heavy metals by clay minerals [5,43]. It has been found that the ranges of RL are 0.064 to 0.47 and 0.065 to 0.48 for the initial metal ion concentration ranges of 0.6 to 8 ppm for Cd (II) and Zn (II), respectively, indicating favorable adsorption over the studied concentrations [19]. Also, the values of the Freundlich parameter 1 n were found to be less than unity for adsorption of both metal ions suggesting that the adsorption intensity is favorable over the entire range of studied concentrations [43]. The adsorption capacities of the studied clay sample for Cd2+ and Zn2+ as derived from the Langmuir model were found 8.2 mg/g and 9.45 mg/g, respectively. These values showed the great potential of the studied Egyptian bentonitic clay as an alternative for heavy metal ions removal from aqueous solutions. For comparison, adsorption capacities of different studied adsorbents are listed in Table 4.

3.5. Application to Real Samples

Practical application of an adsorbent to real samples is the end goal of adsorption studies for wastewater remediation. Successful application of the studied adsorbents to real samples largely guarantees their effective performance within practical wastewater treatment procedures. To test the analytical applicability of the studied Na–B clay sample for cadmium and zinc ions recovery from real samples, two natural water samples—Qaroun lake water and regional Nile river water (Bahr Youssef)—were collected from Fayoum governorate and used. The two water samples were spiked with different amounts of each metal ion and mixed together with Na–B adsorbent using an orbital shaker. Desorption of metal ions from the spent clay adsorbent was done using 25 mL 0.1 M HCl acid. Results of the practical application for real samples are depicted in Table 5.
The recovery values show that the studied Na–B clay sample could be efficiently used as a solid phase extraction material for the preconcentration of cadmium and zinc ions from real samples. Also, this effective recovery of both metal ions from spiked natural water samples strongly recommends the practical application of the Na–B adsorbent as an alternative for the wastewater treatment field.

4. Conclusions

The results of the physicochemical characterizations have shown that the studied clay sample is bentonite with interstratified montmorillonite-kaolinite clay fraction with 85 meq/100 g CEC and 367 m2/g SSA. It was found that the adsorption of Cd (II) and Zn (II) to Na–B is greatly influenced by the solution pH, contact time, sorbent dose, and initial metal ions concentration. The adsorption studies indicated the high potential of the Na–B sample for Cd (II) and Zn (II) removal from aqueous media where 95% removal was achieved at optimum conditions. Application of the studied clay sample for extraction of cadmium and zinc ions from natural water samples greatly supports its practical application for wastewater remediation applications. The present study has shown the value of the Na–B sample as an efficient, readily available, and cost-effective adsorbent for heavy metal ion removal from aqueous solutions.

Author Contributions

This work is part of the MSc studies of the second author mentioned in the author’s list, Mahmoud Sayed, under the supervision of the first author, Nagwa Burham. Nagwa Burham has suggested the study plan, participated in data analysis, results discussion, and reviewing the written manuscript. Mahmoud Sayed has done the experimental work, participated in results interpretation, and written the manuscript.

Conflicts of Interest

The authors declare no conflict of interest.

References

  1. Nguyen, T.; Ngo, H.; Guo, W.; Zhang, J.; Liang, S.; Yue, Q.; Li, Q.; Nguyen, T. Applicability of agricultural waste and by-products for adsorptive removal of heavy metals from wastewater. Bioresour. Technol. 2013, 148, 574–585. [Google Scholar] [CrossRef] [PubMed]
  2. Kumar, P.S.; Ramalingam, S.; Sathyaselvabala, V.; Kirupha, S.D.; Murugesan, A.; Sivanesan, S. Removal of cadmium (II) from aqueous solution by agricultural waste cashew nut shell. Korean J. Chem. Eng. 2012, 29, 756–768. [Google Scholar] [CrossRef]
  3. Galbeiro, R.; Garcia, S.; Gaubeur, I. A green and efficient procedure for the preconcentration and determination of cadmium, nickel and zinc from freshwater, hemodialysis solutions and tuna fish samples by cloud point extraction and flame atomic absorption spectrometry. J. Trace Elem. Med. Biol. 2014, 28, 160–165. [Google Scholar] [CrossRef] [PubMed]
  4. Barakat, M. New trends in removing heavy metals from industrial wastewater. Arab. J. Chem. 2011, 4, 361–377. [Google Scholar] [CrossRef]
  5. Glatstein, D.A.; Francisca, F.M. Influence of pH and ionic strength on Cd, Cu and Pb removal from water by adsorption in Na–Bentonite. Appl. Clay Sci. 2015, 118, 61–67. [Google Scholar] [CrossRef]
  6. Charerntanyarak, L. Heavy metals removal by chemical coagulation and precipitation. Water Sci. Technol. 1999, 39, 135–138. [Google Scholar] [CrossRef]
  7. Amini, M.; Younesi, H.; Bahramifar, N. Statistical modeling and optimization of the cadmium biosorption process in an aqueous solution using Aspergillus niger. Colloids Surf. A Physicochem. Eng. Asp. 2009, 337, 67–73. [Google Scholar] [CrossRef]
  8. Qdais, H.A.; Moussa, H. Removal of heavy metals from wastewater by membrane processes: A comparative study. Desalination 2004, 164, 105–110. [Google Scholar] [CrossRef]
  9. Alyüz, B.; Veli, S. Kinetics and equilibrium studies for the removal of nickel and zinc from aqueous solutions by ion exchange resins. J. Hazard. Mater. 2009, 167, 482–488. [Google Scholar] [CrossRef] [PubMed]
  10. Ahluwalia, S.S.; Goyal, D. Microbial and plant derived biomass for removal of heavy metals from wastewater. Bioresour. Technol. 2007, 98, 2243–2257. [Google Scholar] [CrossRef] [PubMed]
  11. Kurko, S.V.; Matović, L.L. Simultaneous removal of Pb2+, Cu2+, Zn2+ and Cd2+ from highly acidic solutions using mechanochemically synthesized montmorillonite–kaolinite/TiO2 composite. Appl. Clay Sci. 2015, 103, 20–27. [Google Scholar]
  12. Bhattacharyya, K.G.; Gupta, S.S. Adsorption of a few heavy metals on natural and modified kaolinite and montmorillonite: A review. Adv. Colloid Interface Sci. 2008, 140, 114–131. [Google Scholar] [CrossRef] [PubMed]
  13. Ghaedi, M.; Shokrollahi, A.; Kianfar, A.; Pourfarokhi, A.; Khanjari, N.; Mirsadeghi, A.; Soylak, M. Preconcentration and separation of trace amount of heavy metal ions on bis (2-hydroxy acetophenone) ethylendiimine loaded on activated carbon. J. Hazard. Mater. 2009, 162, 1408–1414. [Google Scholar] [CrossRef] [PubMed]
  14. Fu, F.; Wang, Q. Removal of heavy metal ions from wastewaters: A review. J. Environ. Manag. 2011, 92, 407–418. [Google Scholar] [CrossRef] [PubMed]
  15. Hashim, M.; Mukhopadhyay, S.; Sahu, J.N.; Sengupta, B. Remediation technologies for heavy metal contaminated groundwater. J. Environ. Manag. 2011, 92, 2355–2388. [Google Scholar] [CrossRef] [PubMed]
  16. Oliveira, L.C.; Rios, R.V.; Fabris, J.D.; Sapag, K.; Garg, V.K.; Lago, R.M. Clay–iron oxide magnetic composites for the adsorption of contaminants in water. Appl. Clay Sci. 2003, 22, 169–177. [Google Scholar] [CrossRef]
  17. Burham, N.; Abdel-Azeem, S.; El-Shahat, M. Separation and determination of trace amounts of zinc, lead, cadmium and mercury in tap and Qaroun lake water using polyurethane foam functionalized with 4-hydroxytoluene and 4-hydroxyacetophenone. Anal. Chim. Acta 2006, 579, 193–201. [Google Scholar] [CrossRef] [PubMed]
  18. Sitko, R.; Zawisza, B.; Malicka, E. Modification of carbon nanotubes for preconcentration, separation and determination of trace-metal ions. TrAC Trends Anal. Chem. 2012, 37, 22–31. [Google Scholar] [CrossRef]
  19. Sen, T.K.; Gomez, D. Adsorption of zinc (Zn2+) from aqueous solution on natural bentonite. Desalination 2011, 267, 286–294. [Google Scholar] [CrossRef]
  20. Guerra, D.; Mello, I.; Resende, R.; Silva, R. Application as absorbents of natural and functionalized Brazilian bentonite in Pb2+ adsorption: Equilibrium, kinetic, pH, and thermodynamic effects. Water Resour. Ind. 2013, 4, 32–50. [Google Scholar] [CrossRef]
  21. Chen, Y.-G.; Ye, W.-M.; Yang, X.-M.; Deng, F.-Y.; He, Y. Effect of contact time, pH, and ionic strength on Cd (II) adsorption from aqueous solution onto bentonite from Gaomiaozi, China. Environ. Earth Sci. 2011, 64, 329–336. [Google Scholar] [CrossRef]
  22. Sdiri, A.; Higashi, T.; Hatta, T.; Jamoussi, F.; Tase, N. Evaluating the adsorptive capacity of montmorillonitic and calcareous clays on the removal of several heavy metals in aqueous systems. Chem. Eng. J. 2011, 172, 37–46. [Google Scholar] [CrossRef]
  23. Agha, M.A.; Ferrell, R.E.; Hart, G.F.; El Ghar, M.S.A.; Abdel-Motelib, A. Mineralogy of Egyptian Bentonitic Clays II: Geologic Origin. Clays Clay Miner. 2013, 61, 551–565. [Google Scholar] [CrossRef]
  24. Shah, L.A.; Silva-Valenzuela, M.G.; Ehsan, A.M.; Díaz, F.R.V.; Khattak, N.S. Characterization of Pakistani purified bentonite suitable for possible pharmaceutical application. Appl. Clay Sci. 2013, 83, 50–55. [Google Scholar] [CrossRef]
  25. Birand, A.; Cokca, E. Determination of cation exchange capacity of clayey soils by the methylene blue test. Geotech. Test. J. 1993, 16, 518–524. [Google Scholar]
  26. Yukselen, Y.; Kaya, A. Suitability of the methylene blue test for surface area, cation exchange capacity and swell potential determination of clayey soils. Eng. Geol. 2008, 102, 38–45. [Google Scholar] [CrossRef]
  27. Mohammed-Azizi, F.; Dib, S.; Boufatit, M. Removal of heavy metals from aqueous solutions by Algerian bentonite. Desalin. Water Treat. 2013, 51, 4447–4458. [Google Scholar] [CrossRef]
  28. Sdiri, A.; Khairy, M.; Bouaziz, S.; El-Safty, S. A natural clayey adsorbent for selective removal of lead from aqueous solutions. Appl. Clay Sci. 2016, 126, 89–97. [Google Scholar] [CrossRef]
  29. Shah, L.; Khattak, N.; Silva-Valenzuela, M.G.; Manan, A.; Díaz, F.V. Preparation and characterization of purified Na-activated bentonite from Karak (Pakistan) for pharmaceutical use. Clay Miner. 2013, 48, 595–603. [Google Scholar] [CrossRef]
  30. Lou, Z.; Zhou, Z.; Zhang, W.; Zhang, X.; Hu, X.; Liu, P.; Zhang, H. Magnetized bentonite by Fe3O4 nanoparticles treated as adsorbent for methylene blue removal from aqueous solution: Synthesis, characterization, mechanism, kinetics and regeneration. J. Taiwan Inst. Chem. Eng. 2015, 49, 199–205. [Google Scholar] [CrossRef]
  31. Chen, C.; Liu, H.; Chen, T.; Chen, D.; Frost, R.L. An insight into the removal of Pb (II), Cu (II), Co (II), Cd (II), Zn (II), Ag (I), Hg (I), Cr (VI) by Na (I)-montmorillonite and Ca (II)-montmorillonite. Appl. Clay Sci. 2015, 118, 239–247. [Google Scholar] [CrossRef]
  32. Izidoro, J.D.C.; Fungaro, D.A.; Abbott, J.E.; Wang, S. Synthesis of zeolites X and A from fly ashes for cadmium and zinc removal from aqueous solutions in single and binary ion systems. Fuel 2013, 103, 827–834. [Google Scholar] [CrossRef]
  33. Liu, X.; Hicher, P.; Muresan, B.; Saiyouri, N.; Hicher, P.-Y. Heavy metal retention properties of kaolin and bentonite in a wide range of concentration and different pH conditions. Appl. Clay Sci. 2016, 119, 365–374. [Google Scholar] [CrossRef]
  34. Machida, M.; Fotoohi, B.; Amamo, Y.; Mercier, L. Cadmium (II) and lead (II) adsorption onto hetero-atom functional mesoporous silica and activated carbon. Appl. Surf. Sci. 2012, 258, 7389–7394. [Google Scholar] [CrossRef]
  35. Malamis, S.; Katsou, E. A review on zinc and nickel adsorption on natural and modified zeolite, bentonite and vermiculite: Examination of process parameters, kinetics and isotherms. J. Hazard. Mater. 2013, 252, 428–461. [Google Scholar] [CrossRef] [PubMed]
  36. Wu, S.; Zhang, K.; Wang, X.; Jia, Y.; Sun, B.; Luo, T.; Meng, F.; Jin, Z.; Lin, D.; Shen, W. Enhanced adsorption of cadmium ions by 3D sulfonated reduced graphene oxide. Chem. Eng. J. 2015, 262, 1292–1302. [Google Scholar] [CrossRef]
  37. Bellir, K.; Lehocine, M.B.; Meniai, A.-H. Zinc removal from aqueous solutions by adsorption onto bentonite. Desalin. Water Treat. 2013, 51, 5035–5048. [Google Scholar] [CrossRef]
  38. Sdiri, A.; Higashi, T.; Chaabouni, R.; Jamoussi, F. Competitive removal of heavy metals from aqueous solutions by montmorillonitic and calcareous clays. Water Air Soil Pollut. 2012, 223, 1191–1204. [Google Scholar] [CrossRef]
  39. Kim, E.-J.; Lee, C.-S.; Chang, Y.-Y.; Chang, Y.-S. Hierarchically structured manganese oxide-coated magnetic nanocomposites for the efficient removal of heavy metal ions from aqueous systems. ACS Appl. Mater. Interfaces 2013, 5, 9628–9634. [Google Scholar] [CrossRef] [PubMed]
  40. Foo, K.; Hameed, B. Insights into the modeling of adsorption isotherm systems. Chem. Eng. J. 2010, 156, 2–10. [Google Scholar] [CrossRef]
  41. Al-Shahrani, S. Treatment of wastewater contaminated with cobalt using Saudi activated bentonite. Alex. Eng. J. 2014, 53, 205–211. [Google Scholar] [CrossRef]
  42. Do Nascimento, F.H.; de Souza Costa, D.M.; Masini, J.C. Evaluation of thiol-modified vermiculite for removal of Hg (II) from aqueous solutions. Appl. Clay Sci. 2016, 124, 227–235. [Google Scholar] [CrossRef]
  43. Eren, E.; Tabak, A.; Eren, B. Performance of magnesium oxide-coated bentonite in removal process of copper ions from aqueous solution. Desalination 2010, 257, 163–169. [Google Scholar] [CrossRef]
  44. Kocaoba, S. Comparison of Amberlite IR 120 and dolomite’s performances for removal of heavy metals. J. Hazard. Mater. 2007, 147, 488–496. [Google Scholar] [CrossRef] [PubMed]
  45. Chantawong, V.; Harvey, N.; Bashkin, V. Comparison of heavy metal adsorptions by Thai kaolin and ballclay. Water Air Soil Pollut. 2003, 148, 111–125. [Google Scholar] [CrossRef]
  46. Gupta, V.K.; Jain, C.; Ali, I.; Sharma, M.; Saini, V. Removal of cadmium and nickel from wastewater using bagasse fly ash—A sugar industry waste. Water Res. 2003, 37, 4038–4044. [Google Scholar] [CrossRef]
  47. Azeem, S.A.; Attaf, S.M.; El-Shahat, M. Acetylacetone phenylhydrazone functionalized polyurethane foam: Determination of copper, zinc and manganese in environmental samples and pharmaceutics using flame atomic absorption spectrometry. React. Funct. Polym. 2013, 73, 182–191. [Google Scholar] [CrossRef]
Figure 1. XRD pattern of the Na–B sample.
Minerals 06 00129 g001
Figure 2. FT-IR spectrum of the Na–B sample.
Minerals 06 00129 g002
Figure 3. SEM-EDX analysis of the Na–B sample.
Minerals 06 00129 g003
Figure 4. Effect of pH on the removal of Cd (II) and Zn (II) onto Na–B at initial metal ion concentration = 0.8 ppm, shaking time = 60 min., sorbent dose = 0.05 g/25 mL.
Minerals 06 00129 g004
Figure 5. Effect of sorbent dosage on the removal of Cd (II) and Zn (II) onto Na–B at (initial metal ion concentration = 0.8 ppm, shaking time = 60 min., pH = 6.5).
Minerals 06 00129 g005
Figure 6. Effect of shaking time on the removal of Cd (II) and Zn (II) onto Na–B at (initial metal ion concentration = 0.8 ppm, sorbent content = 0.02 g/25 mL, pH = 6.5).
Minerals 06 00129 g006
Figure 7. Linear fitting of experimental data to pseudo-first order kinetic model with (a) Cadmium and (b) Zinc.
Minerals 06 00129 g007
Figure 8. Linear fitting of experimental data to pseudo-second order kinetic model with (a) Cadmium and (b) Zinc.
Minerals 06 00129 g008
Figure 9. Non-linear fitting of experimental data to Langmuir and Freundlich adsorption isotherms with (a) Cadmium and (b) Zinc.
Minerals 06 00129 g009
Table 1. A semi-quantitative elemental analysis of an Na–B sample.
ElementWt %
C2.32
O38.79
Na1.36
Mg1.25
Al13.26
Si26.50
K0.88
Fe4.79
Table 2. Kinetic parameter for pseudo-first order and pseudo-second order models for adsorption of Zn (II) and Cd (II) onto Na–B.
Metal Ionqe exp.Pseudo-First Order ParametersPseudo-Second Order Parameters
k1 = 0.0445 min−1k2 = 1.77 g·mg−1·min−1
Zn (II)0.97 mg/gqe = 0.099 mg/gqe = 0.98 mg/g
R2 = 0.76R2 = 0.9994
k1 = 0.0508 min−1k2 = 2.83 g·mg−1·min−1
Cd (II)0.935 mg/gqe = 0.066 mg/gqe = 0.94 mg/g
R2 = 0.56R2 = 0.9997
Table 3. Langmuir and Freundlich isotherm parameters for adsorption of Cd (II) and Zn (II) onto Na–B.
Langmuir ModelFreundlich Model
Cd (II)R2 = 0.72
qm = 8.2 mg/g
KL = 1.83 L/mg
R2 = 0.89
1 n   = 0.38
K F = 5.09 mg/g
Zn (II)R2 = 0.79
qm = 9.45 mg/g
KL = 1.79 L/mg
R2 = 0.9
1 n   =   0.47
K F = 5.89 mg/g
Table 4. Adsorption capacities of various adsorbents studied for heavy metal ion removal.
AdsorbentMetal IonAdsorption Capacity (mg/g)Reference
Na–BentoniteCd2+8.20This study
Na–BentoniteZn2+9.45This study
AmberliteCd2+0.640[44]
KaoliniteCd2+0.750[45]
KaoliniteZn2+1.80[45]
Bagasse fly ashCd2+2.00[46]
Acetylacetone phenylhydrazone-PUFZn2+0.490[47]
Table 5. Addition–recovery tests for Cd (II) and Zn (II) in different real samples (mean ± s.d., n = 3).
Metal IonSampleAdded (μg/L)Found (μg/L)Recovery %
Cd2+Qaroun lake water041 ±   0.0001 -
5080 ±   0.0001 88.0
200225 ±   0.0003 93.4
Nile river water018 ±   0.0001 -
5062 ±   0.0000 91.2
200203 ±   0.0001 93.1
Zn2+Qaroun lake water0153 ±   0.0010 -
50194 ±   0.0002 95.5
200343 ±   0.0001 97.0
Nile river water0209 ±   0.0012 -
50246 ±   0.0005 95.0
200400 ±   0.0005 97.8

