Article

Effect of Particle Size and Grinding Time on Gold Dissolution in Cyanide Solution

1
Produits Chimiques Magnus, Boucherville, QC J4B 5Z5, Canada
2
Department of Mining, Metallurgical and Materials Engineering, Laval University, Quebec, QC G1V 0A6, Canada
*
Author to whom correspondence should be addressed.
Minerals 2016, 6(3), 68; https://doi.org/10.3390/min6030068
Submission received: 15 May 2016 / Revised: 18 June 2016 / Accepted: 30 June 2016 / Published: 7 July 2016

Abstract

:
The recovery of gold by ore leaching is influenced by the size of the particles and the chemical environment. The effect of particle size on the dissolution of gold is usually studied using mono-size particles as the gold in solution comes from the ore of a unique leached particle size. This paper proposes a method to estimate the gold dissolution as a function of particle size using a bulk ore sample, i.e., with the dissolved gold coming from the various sizes of particles carried by the ore. The results are consistent with the fact that gold dissolution increases with the decreasing particle size but results also indicate that gold dissolution of the ore within a size interval is not significantly affected by the grinding time used for the ore size reduction. Results also show a good dissolution of the gold contained in the fine-size fractions without oxidation and lead nitrate pre-treatment for an ore that is known to require such pre-treatment.

Graphical Abstract

1. Introduction

More than 75% of the gold produced in the world is extracted by the cyanide leaching of gold ores. The ore is ground to expose the surface of the gold and the ground material is reacted with cyanide in oxygen-enriched slurry. Under these conditions gold is dissolved and recovered from the pregnant solution by adsorption on carbon or cementation on zinc powder [1]. The barren solids are disposed in tailings ponds or returned as paste fill into underground mines.
The effect of ore particle size on gold recovery is usually studied using mono-size particles and experimental results indicate that gold recovery increases with the increasing fineness of the grind [2,3]. Other studies report similar results from leaching bulk coarse ore samples without referring to the individual ore size fractions [4]. The first objective of the paper is to evaluate the dissolution of gold from various particle size intervals using bulk ground ore samples rather than mono-size particles. The second objective of the paper is to determine whether the gold contained within a given size interval responds differently if it belongs to a coarsely or a finely ground ore.

2. Objective and Experimental Procedure

The objective of the test work is first discussed, followed by a description of the ore characteristics and of the experimental procedure.

2.1. Objective of the Test Work

The objective of the test work is to assess if gold dissolution as a function of particle size can be assessed from a natural ground ore rather than by using single-size ore particles [2,5]. The second objective is to determine if gold dissolution from the ore within a given size interval is affected by the history of the production of that size interval, i.e., for instance, if the gold within a size fraction, say 0.150/0.106 mm in size, dissolves differently when the size fraction belongs to a coarsely or a finely ground ore. Such independence may facilitate the development of an integrated grinding-leaching simulator [6].

2.2. Ore Characteristics

The ore sample used for the tests comes from a gold mine located 80 km north of Amos in Québec, Canada. The ore composition is given in Table 1. The mine extracts a gold-rich vein-type ore body. The main gangue minerals are silicates and carbonates. Because of the presence of sulfide minerals, particularly pyrrhotite, the plant uses an aeration and lead nitrate pre-treatment of the ore before cyanidation in order to achieve gold recovery above 90% [7].

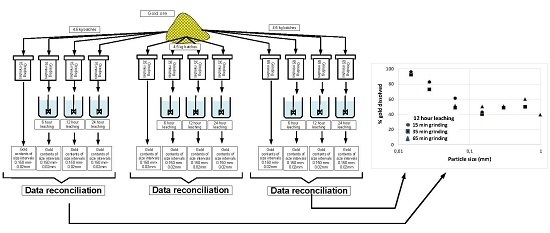
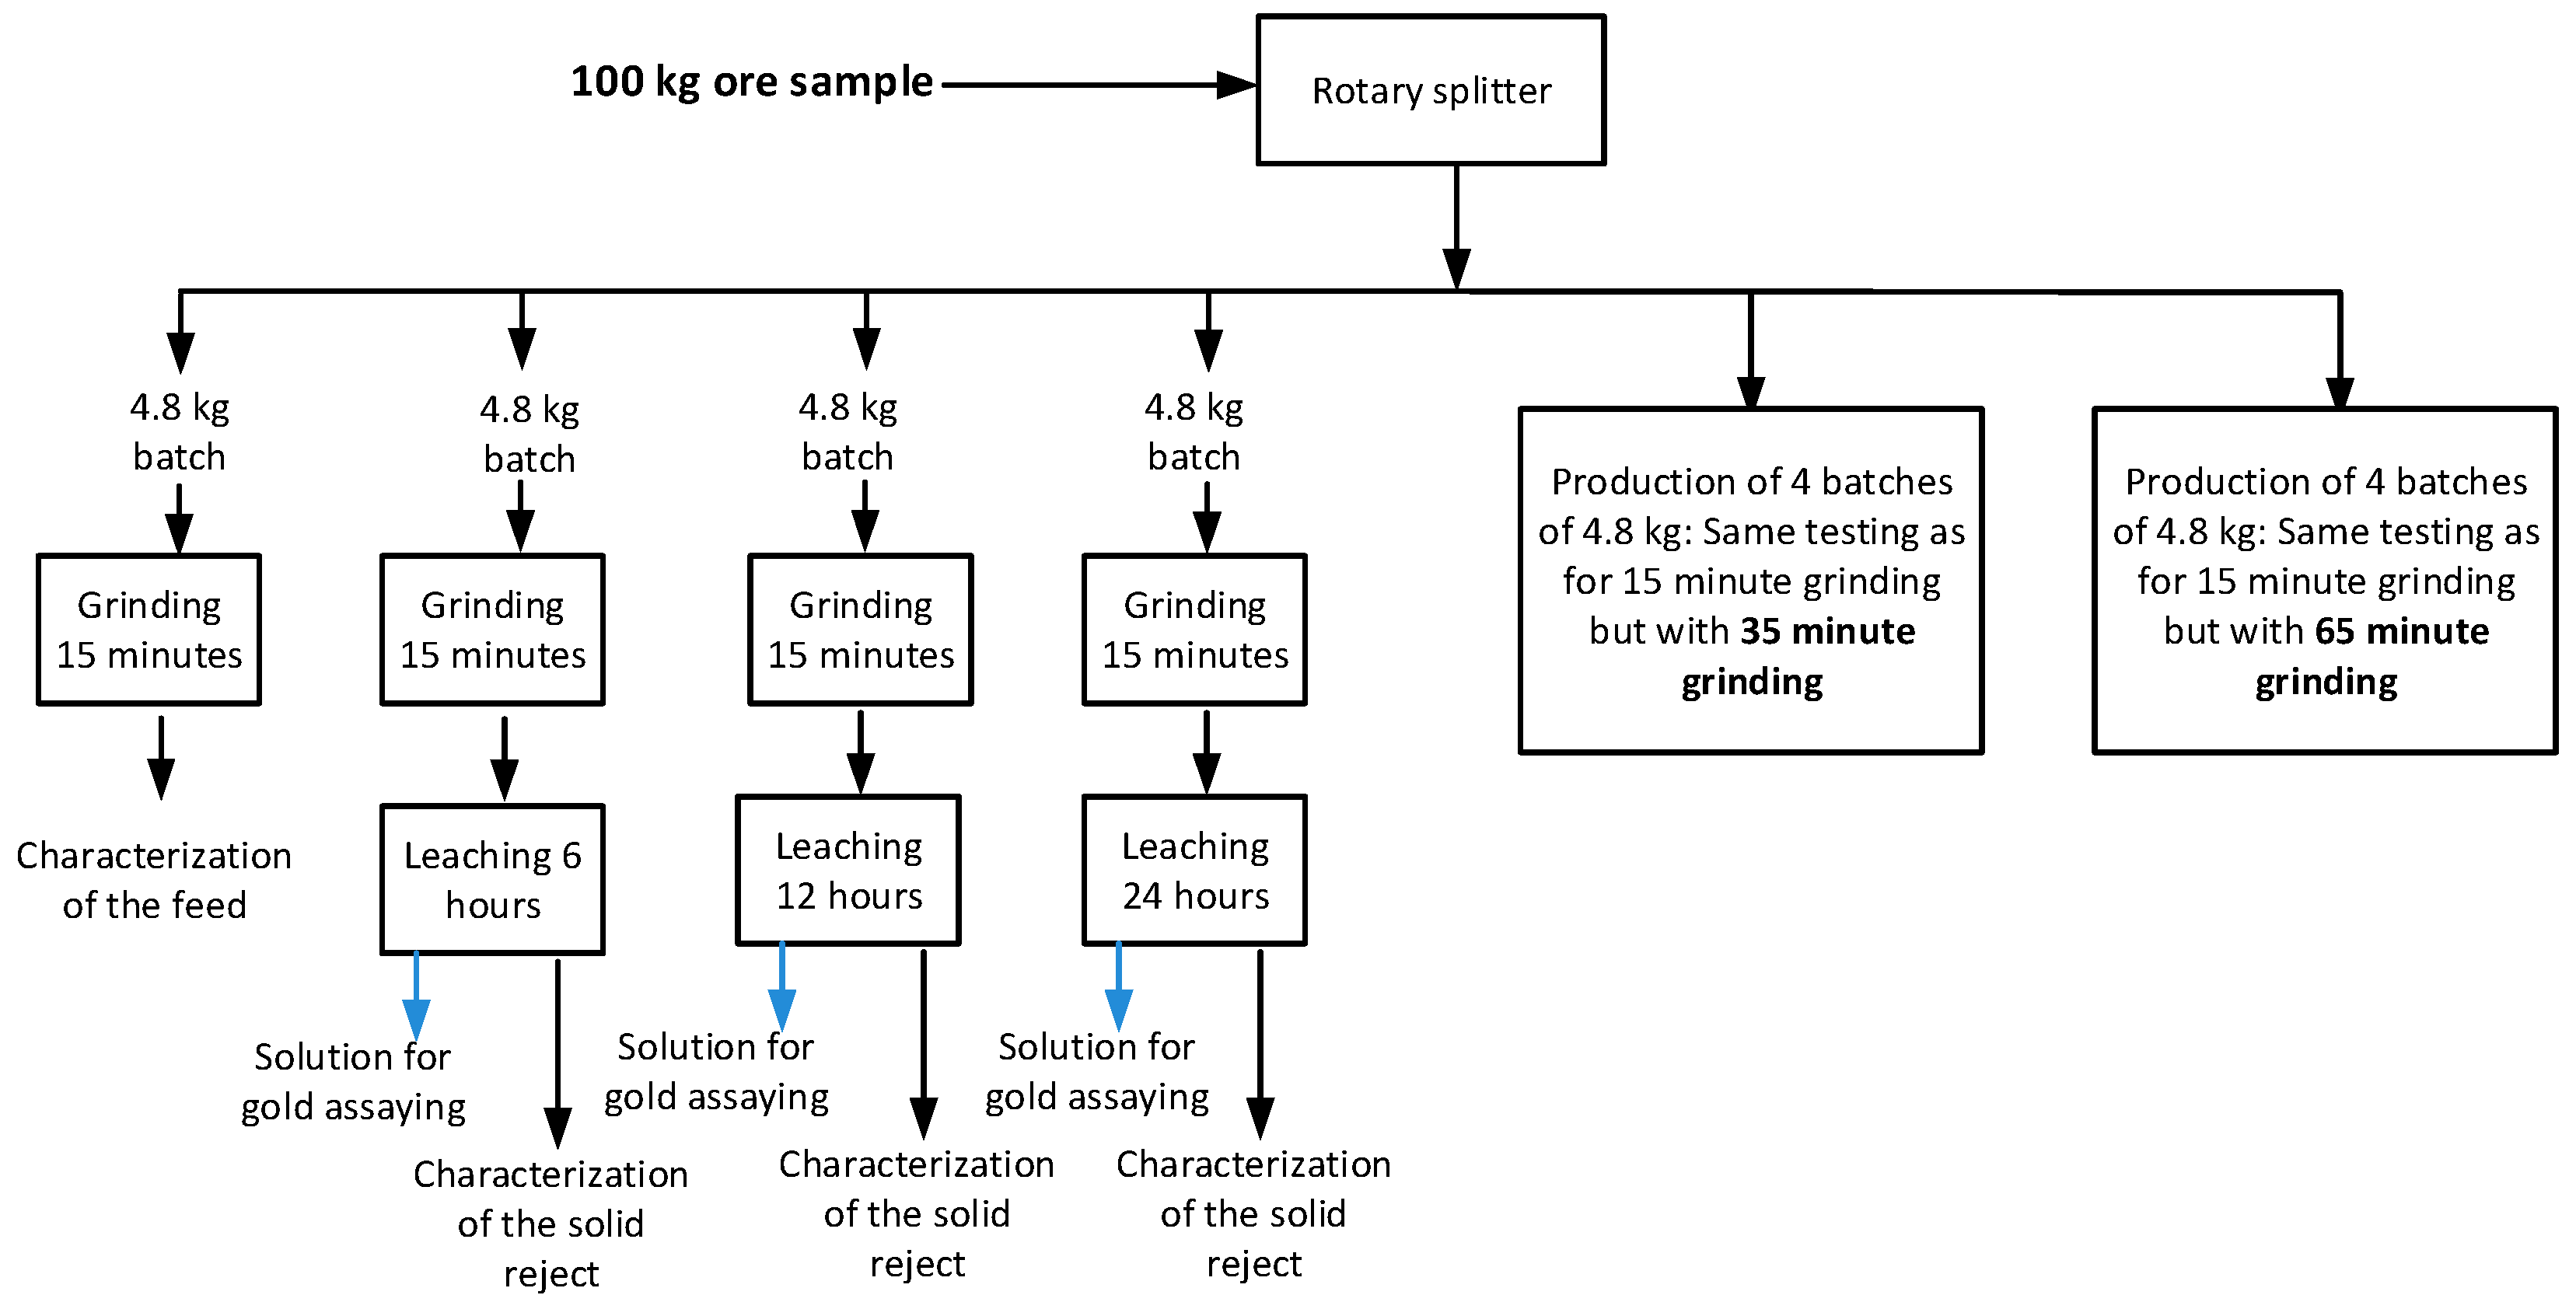
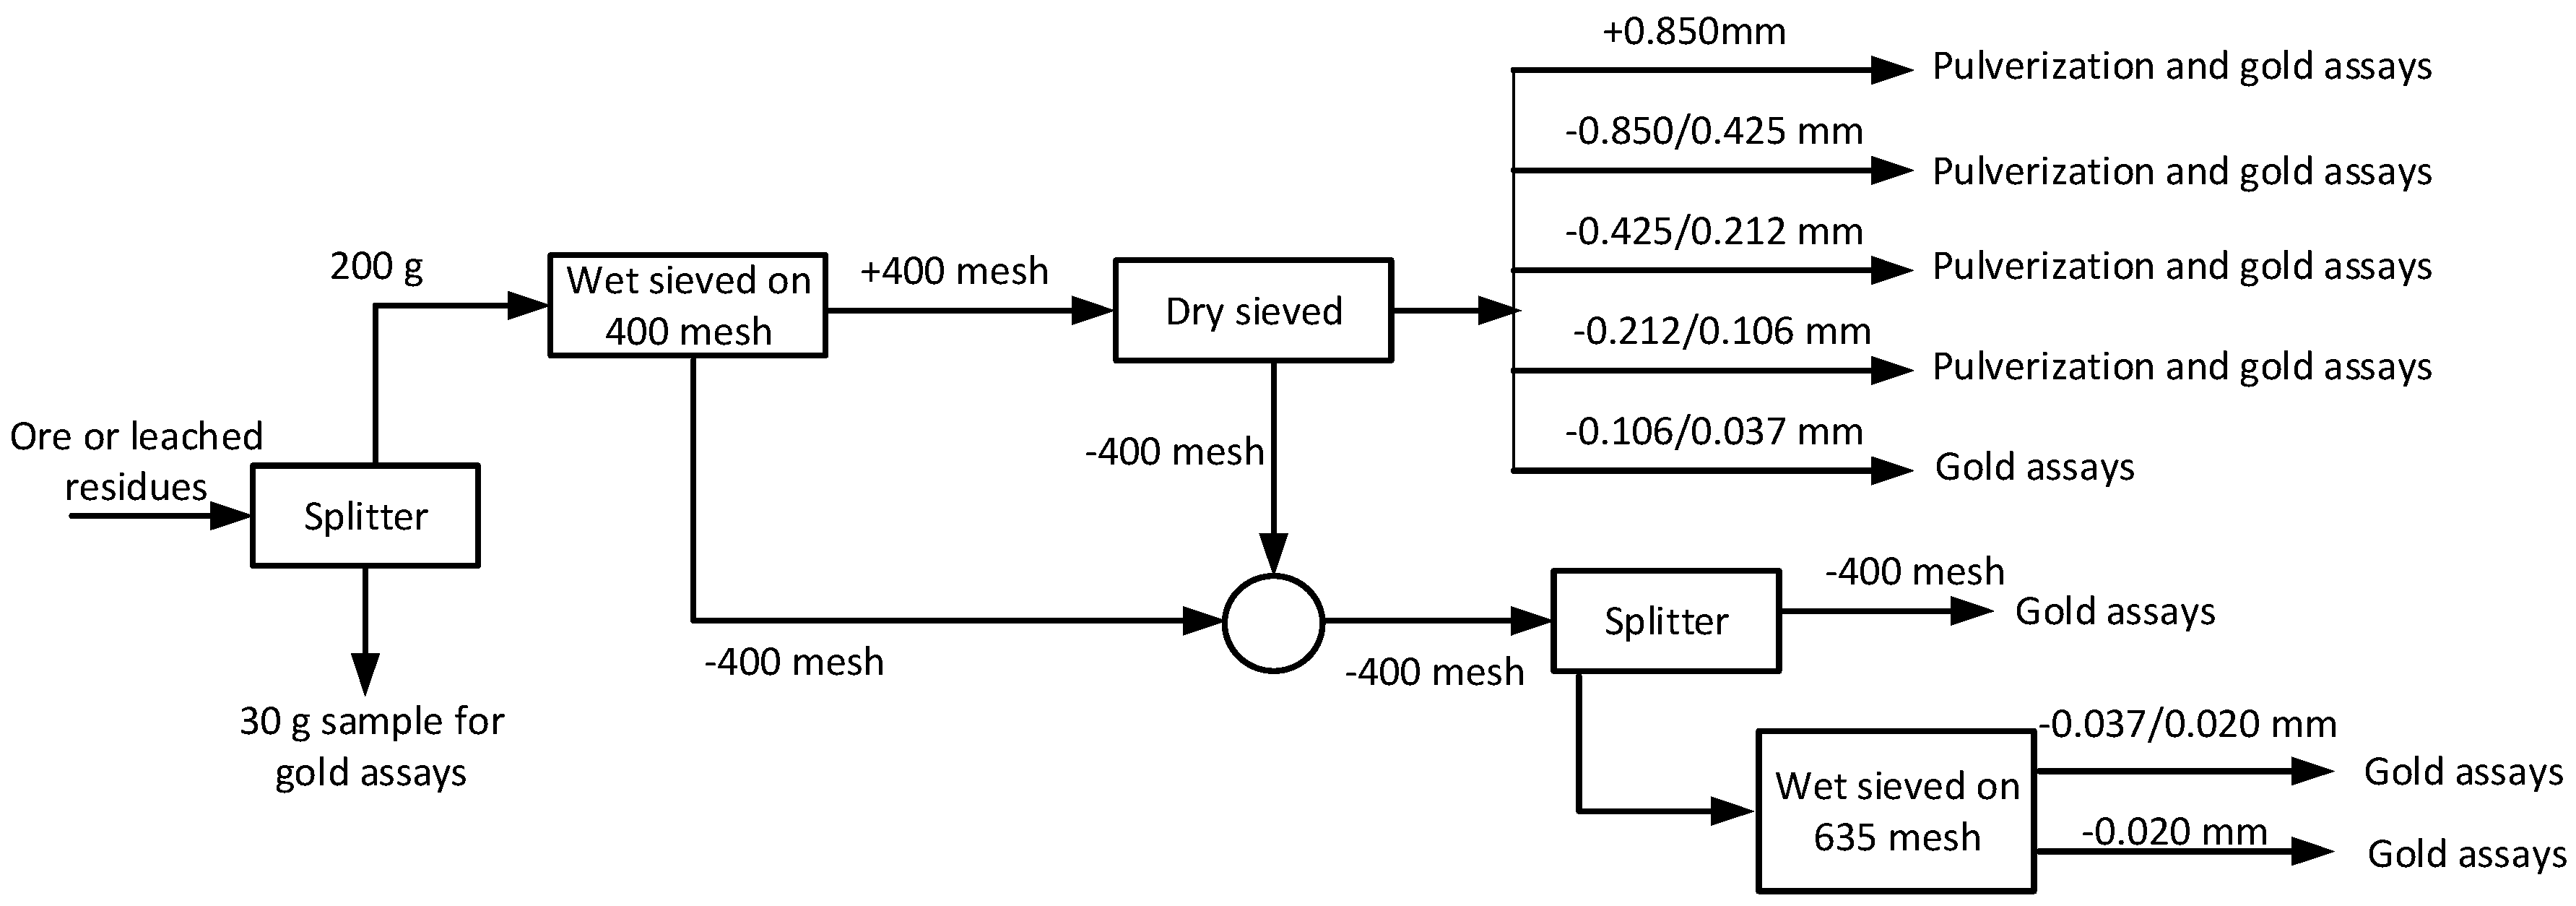
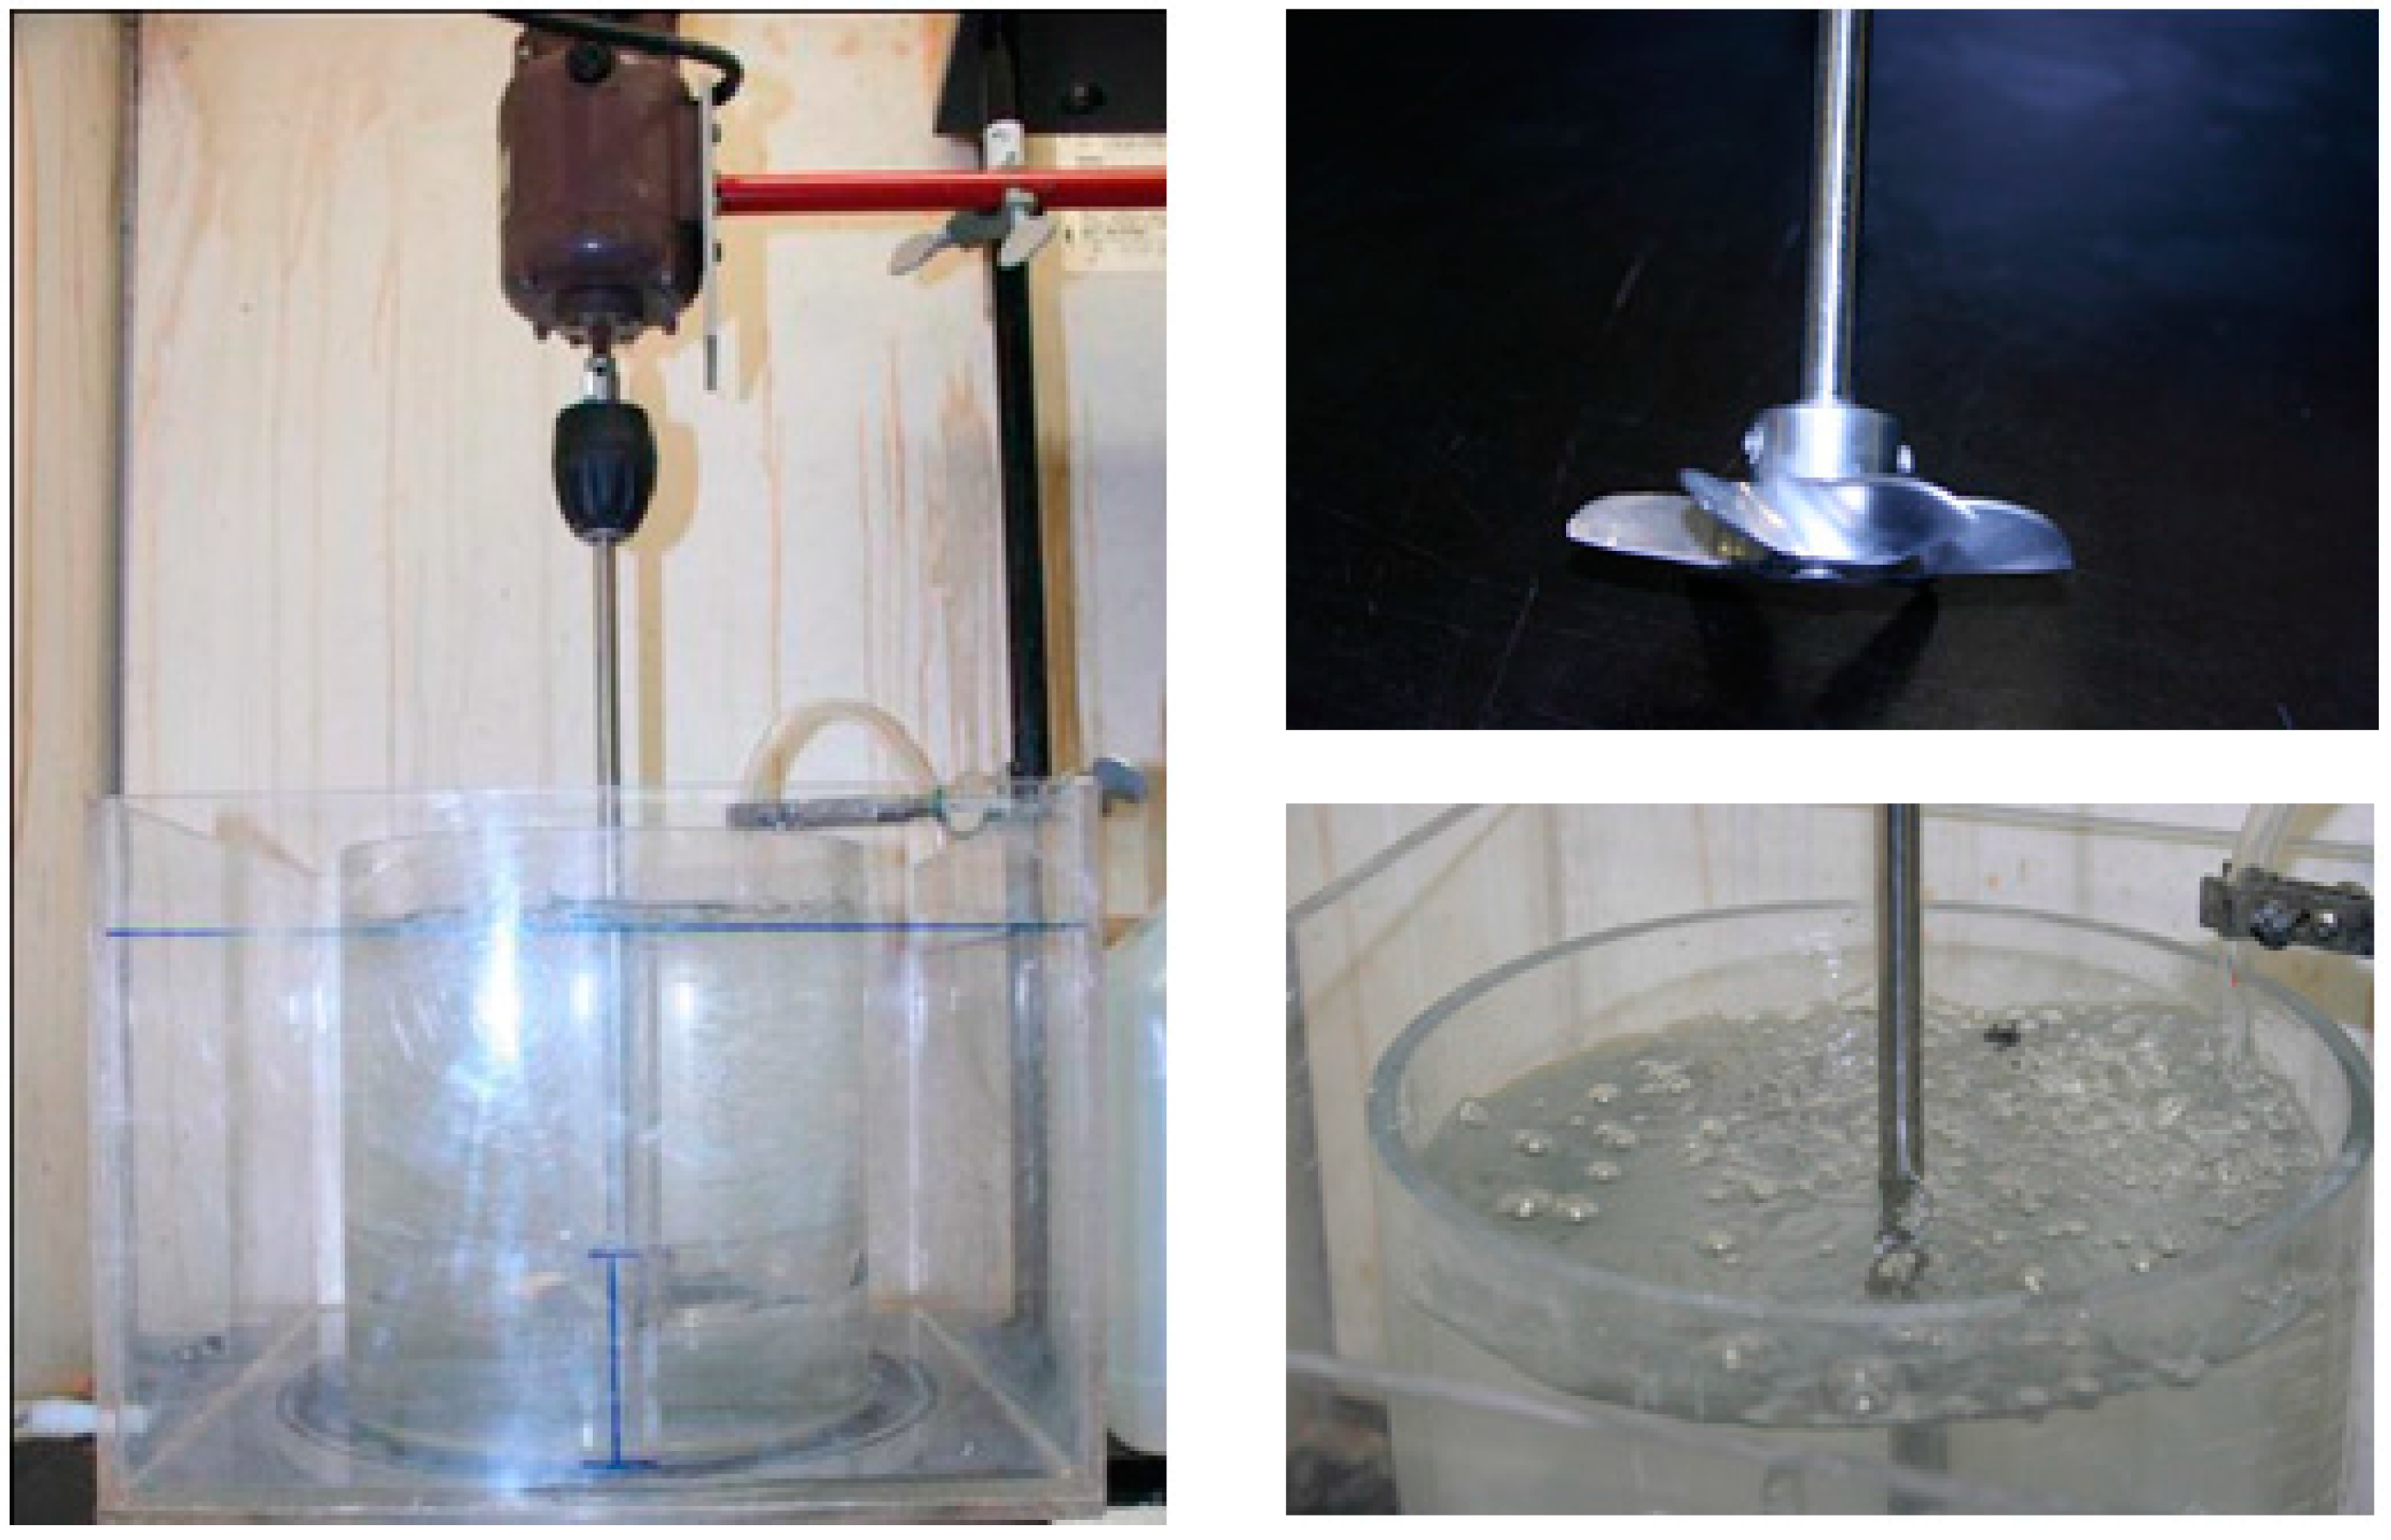
2.3. Experimental Procedure

A 100 kg ore sample was collected from the rod mill feed conveyor of the concentrator, crushed down to <2.0 mm and split into 4.8 kg samples. Four <2 mm samples are individually dry-ground for 15 min; four other ones are ground for 35 min and four other samples for 65 min as shown in Figure 1. The ground samples are kept in a freezer to minimize the oxidation of the sulphides. The size distributions of the ground products are given in Table 2. A coarse grind is used here to have sufficient material for measuring the gold content of the ore within the conventional sieves used to characterize the ore size distribution. The plant uses a finer grind of the ore.
One sample of the four batches ground for a given time is used to characterize the size distribution of gold in the feed while the three other samples are leached for three different periods of time, as illustrated in Figure 1. The solids samples from the fresh feed and leached residues are processed the same way to obtain the chemical composition and the size distribution of the ore as well as the gold content of the size intervals. The procedure is shown in Figure 2. Each ore sample is divided using a conventional splitter to extract a 30 g and a 200 g sample. The 30 g sample is fire-assayed for gold. The 200 g sample is washed onto the 400 mesh (0.038 mm) screen. The +400 mesh is dry-sieved on a column using the 14, 28, 48, 100 and 400 mesh sieves. The ore from each size interval is fire-assayed for gold. The −400 mesh from dry sieving is combined with the washed −400 mesh and the composite material is sampled and assayed for gold. Finally the −400 mesh is wet-sieved on the 635 mesh (0.020 mm) screen to produce the 0.037/0.020 mm and <0.020 mm fractions that are also assayed for gold. The cost of assaying all the ore samples is significant and no repetitive tests are conducted as only the general trends are examined in this paper.
One of the four samples ground for 15 min is used to characterize the ground ore while the three remaining samples are leached for 6, 12 and 24 h. The same procedure is used for the samples ground for 35 and 65 min (see Figure 1). Leaching is conducted in a covered 6.3 litre reactor equipped with a water jacket to maintain a constant slurry temperature during leaching. The reactor is shown in Figure 3. Water losses due to evaporation and sampling of the solution are replaced by additions of a cyanide solution during a test. The slurry for the leaching is made of 4.7 kg of water and 4.5 kg of ore (48.9% w solids). The use of 4.5 kg provides sufficient material for assaying gold in the ore within the coarse size intervals. The agitator is shown in Figure 3. The rotation speed is adjusted to 150 RPM. The reactor is equipped with baffles to produce the turbulent mixing required to ensure the suspension of the coarsest ore particles; the suspension that can be verified through the Plexiglas wall of the reactor. The pH is adjusted to 11.7 with lime and the temperature is controlled between 22 and 25 °C. Aeration of the slurry is started and sodium cyanide is added to have 650 ppm total CN in the solution. The cyanide concentration of the solution is regularly measured by titration and maintained at the target by cyanide additions. Dissolved oxygen is continuously monitored with a probe immersed in the slurry and remains constant at 8 ppm during the leaching tests. The dispersion of air in the reactor charged with water is shown in Figure 3.
At the end of the leaching, a sample of the solution is taken prior to stopping the agitator. The collected solution is filtered and assayed for gold. The solid residues are filtered, re-pulped with fresh water and filtered again to ensure a complete removal of dissolved gold from the leached ore. The solids residues are sieved and assayed following the procedure shown in Figure 2.

3. Analysis of the Results

The raw and mass-balanced data obtained from one test are presented as an example of the preliminary data-processing stage. The global gold dissolution is firstly assessed and then followed by the evaluation of the gold dissolution as a function of the particle size.

3.1. Measurements

An example of the measurements obtained following the test procedure is shown in Table 3. The standard deviations of the measurements are calculated using the equation for the fundamental error from sampling gold [8] as well as the assaying reproducibility provided by the laboratory. The measured gold content of the solution and leached solids residues are used to calculate the gold content of the feed sample from the leaching. While the calculated values should be equal, differences are observed for the four samples. Indeed, the measured gold content of the ore is 12.38 g/t compared to calculated values of 12.05, 12.64 and 11.44 g/t for the leached ore. The deviations come from many sources such as the division into 4.8 kg batches [9], the sampling for the ore for the chemical assays and the assaying of the solution. The measurement of the gold content in the ore is particularly sensitive to the fundamental error of sampling heterogeneous materials [9]. Such critical comparison of measurements is possible because redundant data is collected during a test. Data redundancy is also created by assaying the bulk ore and the size fractions as shown in Table 3. The measured and calculated solids composition for a solids sample should be the same while deviations are observed between each solids sample. Redundancy also exists for the <0.038 mm that is assayed as well as the 0.038/0.020 mm and <0.020 mm size fractions from which it is possible to recalculate the gold content of the <0.038 mm fraction. However, in this case the measured and calculated values are close because the sampling of fine particles for gold assaying is less sensitive to sampling errors [9]. The importance of the measurement errors is also observed for the gold assays in the coarse size intervals. For instance, the gold content in the 0.850/0.425 mm size interval is 11.54 g/t in the feed compared to 14.52 g/t after 6 h of leaching, which is physically not possible unless gold could be transferred from other sizes of intervals. A similar behavior is observed for the same size interval in the 12 and 24 h leaching results. Such a behaviour can only be observed by collecting redundant data which allows us to highlight the importance of the measurement errors for the processing of gold ore samples. These problems are not detectable while testing with mono-size feed samples. The data of Table 3 highlights the difficulty of obtaining reproducible results while testing metallurgical gold samples.
The measured size distributions and gold assays are balanced [10] in order to have data that verifies gold mass conservation between the ore sample, the size intervals and the solution. The data reconciliation procedure estimates gold assays in the solids and solution that verify the mass conservation but also minimize a weighted least squares criterion of the distance between the estimated and measured values. The inverses of the measurement standard deviations as given in Table 3 are used as the weighting factors in the data reconciliation criterion. The measured and reconciled data for the tests conducted on the samples ground for 35 min are presented in Table 4. The main advantage of using reconciled data for subsequent analysis is related to the fact that the reconciled estimates are coherent so it is not required to select which measurements should be used to calculate the gold dissolution. This can be readily verified with the data of Table 4.
The reconciled assays of Table 4 are close to the measured values for most of the head samples, solution and size intervals. The reconciled gold content of the four feed samples are close, although different, despite the samples coming from the same 100 kg sample (see Figure 1). These differences are physically possible considering that the feed and the 6, 12 and 24 h leaching products come from different batches of a given ore sample and that the division into batches may lead to significant differences in the gold composition of the tested batches [9]. Some significant deviations are observed for the 0.425/0.212 mm and −0.037 mm size fractions in the 6 h leaching products but these adjustments are not significant to question of the quality of the assays. However, the data reconciliation does not correct the anomalies previously reported for the gold content in the 0.850/0.425 mm size fraction in the feed sample that is 11.36 g/t but increases to 14.29 g/t after 6 h of leaching. These anomalies are not observed for the finer size intervals, probably due to the fact that the sampling error is less important for the fine particles.
The reconciled gold contents are used to calculate the gold dissolution presented in the following discussion. The standard deviations of the gold dissolution are estimated using an error propagation algorithm [11]. The procedure implies generating fictitious measurements that belong to the probability distribution of the actual measurements and processing them with the data reconciliation algorithm. By repeating the generation and data reconciliation procedures it is possible to obtain sufficient data to calculate the standard deviation of the gold dissolutions calculated from the reconciled assays.

3.2. Global Gold Dissolution

The estimated gold dissolutions are given in Table 5. The gold dissolutions are low compared to what is observed in the plant (>90%) due to the coarse size distributions used for the tests and the absence of pre-treatment with air and lead nitrate [7]. However, as indicated earlier, the purpose of the study is not to optimize gold recovery but to assess if gold dissolution in a size interval varies if the size interval is produced from a finely ground ore or a coarser one. The main effect of the ore size reduction is observed for the gold extraction after 6 h of leaching. The low recovery observed following the 24 h leaching of the ore ground for 35 min is attributed to the higher pH of 12.2 compared to the target of 11.7 due to a control problem at the beginning of one leaching test [10]. The relative standard deviation for the gold dissolution varies between 10% and 15%. The least reproducible estimates are observed for the dissolution values close to 50% and this behaviour is also observed for mineral processing separators [11].

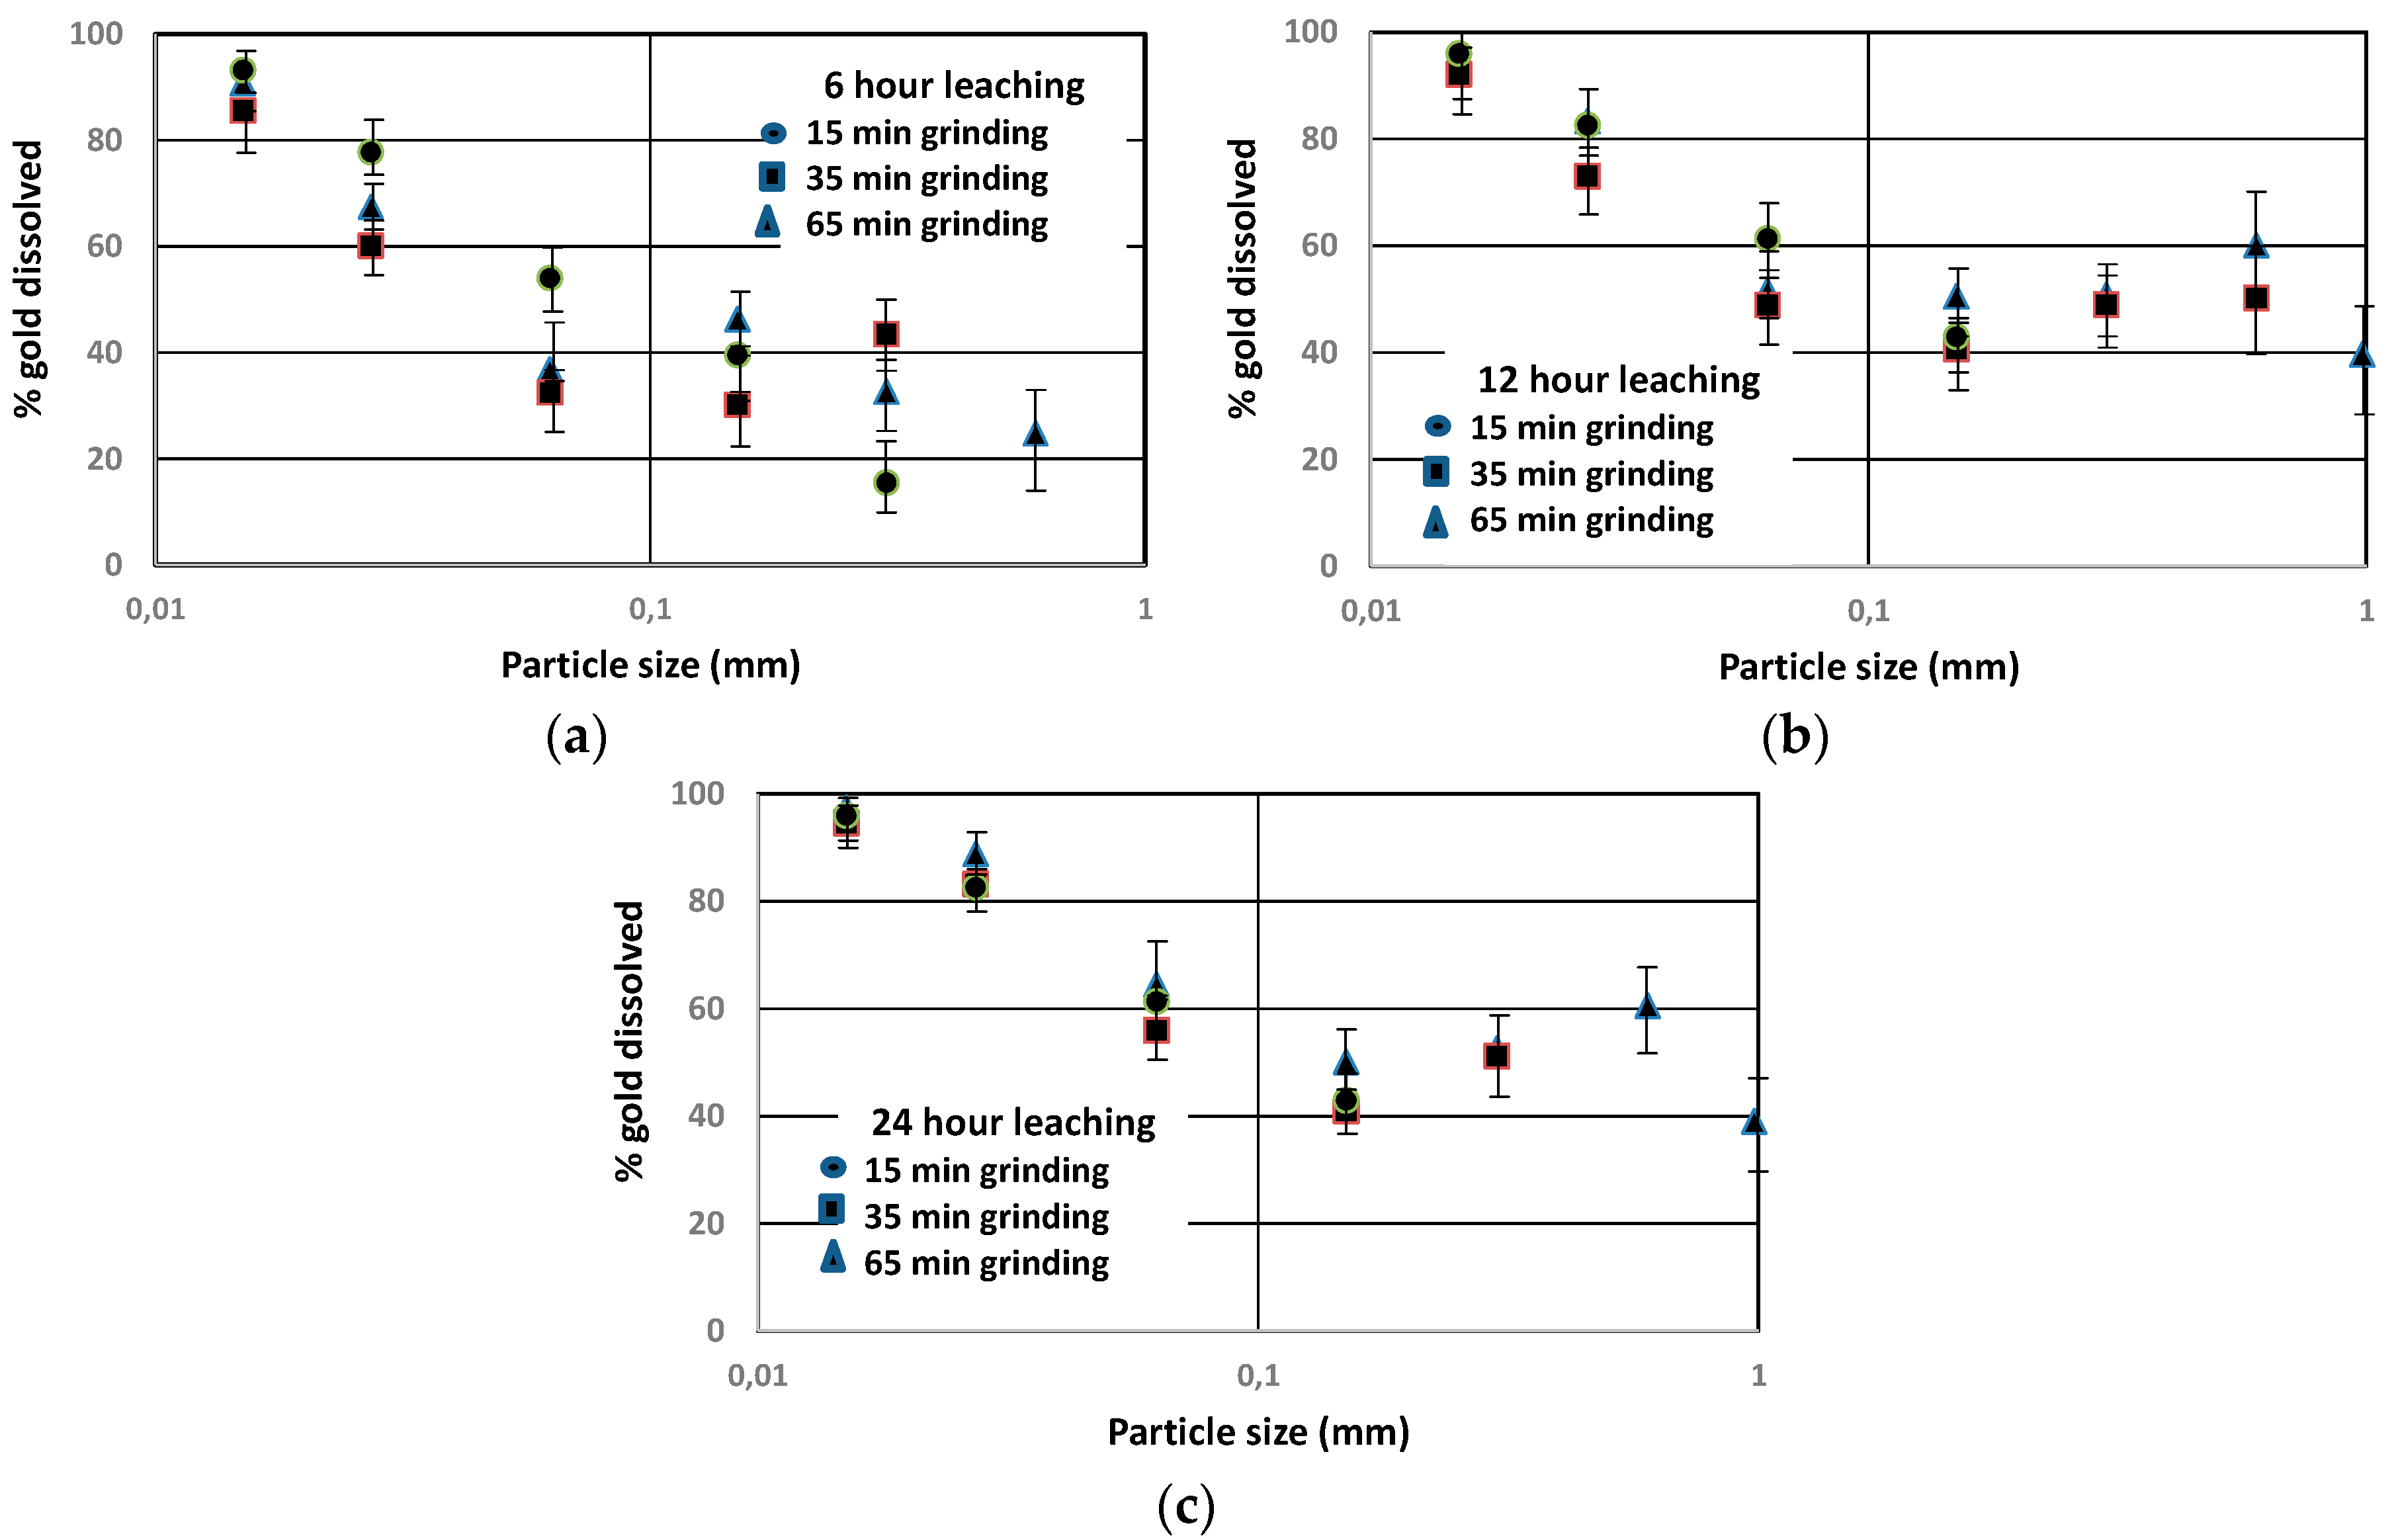
3.3. Gold Dissolution as a Function of Particle Size

An estimate of the gold dissolution within size interval i after a leaching time tL is calculated from the mass-balanced data [10] using:
R i ( t L ) = 1 x ^ A u ; i ( t L ) x ^ A u ; i ( 0 )
The reconciled gold contents of size interval i in the feed sample and leached ore for a time tL are respectively noted x ^ A u ; i ( 0 ) and x ^ A u ; i ( t L ) . The dissolution of gold calculated using Equation (1) does not account for the gold transfer from coarser particle sizes to finer ones by abrasion during leaching. The calculated size-dependent gold dissolutions are presented in Figure 4 as a function of particle size for the three considered grinding and leaching times.
Results of Figure 4 show that gold dissolution increases with a decreasing particle size. An average particle size of 0.015 mm is given to the <0.020 mm (−635 mesh) size fraction. These results are consistent with results reported by other authors [5] who assessed gold dissolution using mono-size samples. There is no systematic behaviour in Figure 4 that could provide grounds to consider that the production history of a size class of particles influences the gold dissolution within this size interval. In other words, the fact that a size fraction is produced from 15, 35 or 65 min grinding does not seem to lead to a systematic behaviour in the dissolution of gold from that size fraction. Indeed, the variation of the gold dissolution from a given particle size is within the experimental error defined by the error bracket in Figure 4. These brackets are calculated using the error propagation method described above. The uncertainty on the estimated gold dissolution becomes wider with the increasing particle size as the measurement of the gold content becomes less reproducible due to sampling error [8]. The fact that the rate of gold dissolution in a size interval is independent of that size interval is information that can be helpful for the development of an integrated grinding and gold leaching simulator. Indeed, since that is within the experimental error, results do not show that the intensity of grinding influences the recovery of gold from a particle size interval, and one can use a grinding simulator to predict the ore size distribution and simulate gold dissolution using a given set of leaching rate parameters for each size interval.
The good dissolution observed for the fine size intervals (0.037/0.020 and −0.020 mm) contrasts with the overall gold dissolution. The gold dissolution for these size intervals is above 90% and this result is obtained despite the absence of the oxidation/lead nitrate pre-treatment recommended for the studied ore [7]. This observation may be related to the large contact surface associated with the fine particle size which is favorable to a rapid dissolution of the fine gold, preventing, for instance, a passivation of the surface of the gold grains. This result may indicate that the effect of the pre-treatment could be size-dependent which would be worth studying and may suggest the use of a separated treatment of fine and coarse particles [12].

4. Conclusions

An experimental procedure is proposed to estimate the gold dissolution from ore within different size intervals using leaching tests carried out with bulk ore rather than mono-size ore samples. The procedure significantly reduces the experimental test work, but requires assaying of several samples and leads to results sensitive to sampling errors, particularly in the case of gold ore. The use of a bulk ore rather than mono-size particles eliminates the uncertainties concerning possible interactions between particles of different sizes during leaching. Results show that gold dissolution increases with the decreasing ore particle size, with an important gap between the +0.037 and −0.037 mm size fractions. Finally, it is not possible, within the experimental error, to conclude that gold dissolution within a size interval is affected by the fact that ore from the size interval is taken from a finely or coarsely ground ore sample.

Acknowledgments

The authors acknowledge the financial supports of NSERC (Natural Science and Engineering Research Council, Ottawa, ON, Canada) and of COREM (Ville de Québec, QC, Canada). The authors are also grateful to COREM for performing the gold assays of the solids and to Iamgold Geant Dormant mine for providing the ore sample for the test work.

Author Contributions

Jessica Egan and Claude Bazin conceived and designed the experiments; Jessica Egan performed the experiments; Jessica Egan and Claude Bazin analyzed the data; Jessica Egan and Claude Bazin wrote the paper and Daniel Hodouin provided the financial support for the scholarships and to purchase the reagents and the material for the tests.

Conflicts of Interest

The authors declare no conflict of interest.

References

  1. Marsden, J.O.; House, C.I. The Chemistry of Gold Extraction; Society for Mining, Metallurgy, and Exploration (SME): Englewood, CO, USA, 2006. [Google Scholar]
  2. Deschênes, G.; Fleming, C.; Zhou, J.; Hodouin, D.; Amankwah, R.; Ghali, E.; Choi, Y. Highlights of the Past Five Decades of Gold Ore Processing in Canada. In Proceedings of the 50th World Gold Conference, Montreal, QC, Canada, 2–5 October 2011; Deschênes, G., Ed.; Canadian Institute of Mining, Metallurgy and Petroleum (CIM): Montreal, QC, Canada, 2011; pp. 20–45. [Google Scholar]
  3. Free, M.L. Modelling of heterogeneous material performance. Can. Metall. Q. 2008, 47, 277–284. [Google Scholar] [CrossRef]
  4. Bouffard, S.C.; Dixon, D.G. Evaluation of kinetic and diffusion phenonmena in cyanide leaching of crushed and run-of-mine gold ores. Hydrometallurgy 2007, 86, 63–71. [Google Scholar] [CrossRef]
  5. De Andrade Lima, L.R.P.; Hodouin, D. A lumped kinetic model for gold ore cyanidation. Hydrometallurgy 2005, 3–4, 121–137. [Google Scholar] [CrossRef]
  6. Bellec, S.; Hodouin, D.; Bazin, C.; Khalesi, M.R.; Duchesne, C. Hydrocyclone classification modeling for gold ore grinding circuit simulation. In Proceedings of the 50th World Gold Conference, Montreal, QC, Canada, 2–5 October 2011; Deschênes, G., Ed.; Canadian Institute of Mining, Metallurgy and Petroleum (CIM): Montreal, QC, Canada, 2011; pp. 150–162. [Google Scholar]
  7. Deschênes, G.; Fulton, M.; Smith, C. A new tool to improve lead nitrate control in cyanidation. In Proceedings of the 39th Annual Meeting of the Canadian Mineral Processors, Ottawa, ON, Canada, 23–25 January 2007; pp. 231–248.
  8. Gy, P. Sampling of Particulate Materials: Theory and Practice; Elsevier: Amsterdam, The Netherlands, 1979. [Google Scholar]
  9. Bazin, C.; Hodouin, D.; Blondin, M.R. Estimation of the variance of the fundamental error associated to the sampling of low grade ores. Int. J. Miner. Process. 2013, 124, 117–123. [Google Scholar] [CrossRef]
  10. Egan, J.; Bazin, C.; Hodouin, D. Effect of ore particle size on gold dissolution in a cyanide solution. In Proceedings of the SME Annual Meeting, Denver, CO, USA, 24–27 February 2013.
  11. Hodouin, D.; Flament, F.; Bazin, C. Reliability of material balance calculations—A sensitivity approach. Miner. Eng. 1989, 2, 157–170. [Google Scholar] [CrossRef]
  12. Gagnon, C.; Landry, G.; Ourriban, M.; Pelletier, P.; Bouajila, A. Implementation of Cyanidation by Size Class at Sleeping Giant Mill. In Proceedings of the 41st Annual Meeting of the Canadian Mineral Processors, Ottawa, ON, Canada, 22 January 2009.
Figure 1. Test procedure for the leaching tests.
Minerals 06 00068 g001
Figure 2. Preparation of the solids samples for size distribution and assaying.
Minerals 06 00068 g002
Figure 3. Reactor used for the cyanide leaching of the samples.
Minerals 06 00068 g003
Figure 4. Gold dissolved as a function of particle size and leaching time: (a) 15 min grinding; (b) 35 min grinding; (c) 65 min grinding.
Minerals 06 00068 g004
Table 1. Gold ore composition [7].
ElementsMinerals
Au10.4 g/tQuartz, albite, phogopite58.5%
Ag10.5 g/tCalcite, chlinochlore31.1%
Si26.0%Pyrite3.2%
Fe8.0%Pyrrhotite0.8%
Al6.0%Chalcopyrite0.4%
Ca4.4%Sphalerite0.1%
Table 2. Size distributions of the ground samples.
Grinding Time (min)D80 (mm)% <0.037 mm (−400 mesh)% <0.106 mm (−150 mesh)% <0.212 mm (−65 mesh)
150.850212640
350.318253351
650.106354976
Table 3. Measurements obtained from the 35 min grinding samples (Meas. = Measurement; Std = Standard deviation).
MaterialNoteRetained %Non Leached Au(g/t)6 h Leach Au(g/t)12 h Leach Au(g/t)24 h Leach Au(g/t)
Meas.StdMeas.StdMeas.StdMeas.StdMeas.Std
Calculated Feeda--12.38-12.051.6012.641.7011.431.60
Solution---0.00-3.660.355.250.525.420.55
Measured Head (solids)---12.381.658.230.857.160.815.770.65
Calculated Head (solids)b--13.26-8.67-5.99-6.25-
+0.850 mm-1.00.20.410.140.470.160.550.191.290.45
0.850/0.425 mm-8.51.211.542.3114.522.905.671.1314.492.90
0.425/0.212 mm-21.50.611.641.758.781.325.800.875.670.85
0.212/0.106 mm-18.10.518.751.8813.161.3211.021.1011.311.13
0.106/0.037 mm-18.20.521.051.6814.271.1410.720.869.300.74
0.037/0.020 mm-8.60.414.900.755.920.304.040.202.580.13
−0.020 mm-24.11.24.100.160.580.020.320.010.220.01
Measured −0.037 mm---6.650.332.000.101.100.060.710.04
Calculated −0.037 mmc--7.37-2.02-1.25-0.77-
a: Calculated using the reject assays and the measured gold content of the solution. b: Calculated using the gold contents of the size intervals. c: Calculated using the 0.037/0.020 mm and −0.020 mm gold assays.
Table 4. Raw and mass-balanced data for the tests using the 35 min grinding samples (Obs. = Measured value; Rec. = Reconciled value).
MaterialOre RetainedGold Content (g/t)
0 h6 h12 h24 h
Obs.Rec.Obs.Rec.Obs.Rec.Obs.Rec.Obs.Rec.
Feed Sample---12.63-11.74-11.40-11.74
Solution--0.000.003.663.645.255.215.425.37
Residues--12.3812.638.237.947.165.965.776.13
+0.850 mm1.00.90.410.410.470.470.550.551.291.29
0.850/0.425 mm8.57.611.5411.3614.5214.295.675.6614.4914.13
0.425/0.212 mm21.521.311.6411.318.786.395.805.775.675.52
0.212/0.106 mm18.117.918.7518.4913.1612.9111.0210.9711.3110.92
0.106/0.037 mm18.217.921.0520.9514.2714.1510.7210.719.309.22
0.037/0.020 mm8.68.214.9014.895.925.944.044.012.582.50
−0.020 mm24.126.24.104.090.580.590.320.320.220.22
−0.037 mm--6.656.662.001.861.101.190.710.76
Table 5. Gold dissolutions and calculated standard deviations for the 12 leaching tests (Std = Standard deviation).
Grinding Time (min)Feed6 h Leaching12 h Leaching24 h Leaching
% DissolvedStd% DissolvedStd% DissolvedStd
150.026.32.747.55.350.85.5
350.032.43.447.75.147.84.8
650.045.85.146.85.264.55.1

