Article

Experimental Study on the Microstructure Evolution of Mixed Disposal Paste in Surface Subsidence Areas

1
Faculty of Land Resources Engineering, Kunming University of Science and Technology, Kunming 650093, China
2
School of Civil and Environment Engineering, University of Science and Technology Beijing, Beijing 100083, China
3
Faculty of Mining Industry, Kunming Metallurgy College, Kunming 650033, China
*
Author to whom correspondence should be addressed.
Minerals 2016, 6(2), 43; https://doi.org/10.3390/min6020043
Submission received: 17 November 2015 / Revised: 2 April 2016 / Accepted: 3 May 2016 / Published: 9 May 2016

Abstract

:
The integrated disposal of surface subsidence pits and surface solid waste can be realized by backfilling a surface subsidence area with a paste made from the solid wastes of mines, such as tailings and waste rock. The microstructures of these wastes determine the macroscopic properties of a paste backfill. This paper presents an experimental study on the internal structure evolution of pasty fluid mixed with different waste rock concentrations (10%, 30%, and 50%) and cement dosages (1% and 2%) under damage. To this end, a real-time computed tomography (CT) scan is conducted using medical CT and a small loading device. Results show that UCS (uniaxial compressive strength) increases when the amount of cement increases. Given a constant amount of cement, UCS increases first and then decreases as waste rock content increases. UCS is maximized at 551 kPa when the waste rock content is 30%. The paste body is a typical medium used to investigate initial damage, which mainly consists of microholes, pores, and microcracks. The initial damages also exhibit a high degree of random inhomogeneity. After loading, cracks are initiated and expand gradually from the original damage location until the overall damages are generated. The mesostructure evolution model of the paste body is divided into six categories, and this mesostructure is reasonable when the waste rock content is 30%.

1. Introduction

Surface subsidence is a sudden or sustained fall caused by mining, groundwater exploitation, and seismic activities. This type of geological disaster can induce serious damages [1,2]. Since 1949, the mining surface subsidence area in China has covered an area of 314,765 km2 and caused 535 deaths as well as economic losses worth 124.54 × 10⁸ Yuan [3]. Waste rock and other solid wastes are commonly used to backfill inactive surface collapse pits or open pits directly. At present, no safe and effective disposal method has been developed for surface subsidence in the active phase (the persistence of underground mining) [4,5,6]; that is, dozens of surface collapse pits are formed in the Tong-keng mine in Guangxi Province as a result of decades of underground mining, and these surface subsidence areas remain active. During the long-term production process, a large number of solid waste dumps, such as tailings and waste rock, accumulates on the mine surfaces. These mine tailings and waste rocks are mixed and formed into a paste to achieve the integrated disposal of surface subsidence pits and surface solid waste through backfilling. The process route is shown in Figure 1, and the expected forward backfill volume for the subsidence area is 5 × 10⁶ m3. The mixed disposal paste applied to the subsidence area is an artificial composite of a wide-grain granular material whose internal structure differs from that of rock and soil. Thus, an in-depth study must be conducted on microstructures to guide disposal preparation. This paste should possess good mechanical properties to satisfy the backfill requirements for active surface subsidence areas.
X-ray computed tomography (CT) is a radiological imaging system that was first developed by Hounsfield [7]. This system was initially employed only for medical use; however, it has been applied geologically since the 1980s [8,9,10]. Kawakata et al. [11] studied the faulting process in Westerly granite from 1995 to 1997 under uniaxial and triaxial conditions via an X-ray CT scan. Ma et al. [12] and Wu et al. [13] investigated the creep characteristics of frozen soil using CT test technology. In 2011, Cnudde et al. [14] investigated the damage features generated during the sandstone compression with CT. In 2012, Raynaud et al. [15] observed the evolution of internal porosity during limestone triaxial deformation with CT. In 2013, Sufian et al. [16] used CT to identify the changes and the energy distribution in pores before and after damage was incurred in the Gosford sandstone bore. In 1998, Büyüköztürk et al. [17] compared the heat infrared method, the acoustic method, and CT scanning, regarded CT as an effective way to study the internal structure of concrete. In 2005, Wong et al. [18] studied pore distribution variation in high-strength concrete in a uniaxial compression process. In 2011, Tian [19] adopted CT technology to conduct a real-time scan of the concrete mesofracture process under dynamic loads. According to the preceding analysis, CT scanning technology is currently used extensively in geotechnical engineering; this technology can effectively scan the primary structure of a specimen, microstructure evolution, and crack propagation during real-time loading damage. Nonetheless, relevant research has not been conducted on tailings, namely, waste rock-mixed backfill paste. Thus, the present study adopts CT scanning technology to investigate the microstructure evolution of mixed paste in the damage process.

2. Experimental

2.1. Materials

In response to the generation of 900,000 tons/year of tailings in Tong-keng mine, a tailing pond must be constructed on the surface for stockpiling. Tailing maintenance and management is expensive. The Tong-keng mine consists of a network of underground mines and generates large amounts of waste rock during mining. At present, 550,000 m3 of waste rock is stockpiled on the surface of the waste rock field. These mine tailings, waste rock, and other solid wastes should be formed into a paste to integrate the management of solid waste and surface subsidence areas through backfilling. The raw materials used in the test are obtained from Tong-keng mine and mainly include tailings, waste rock, cement, and water.

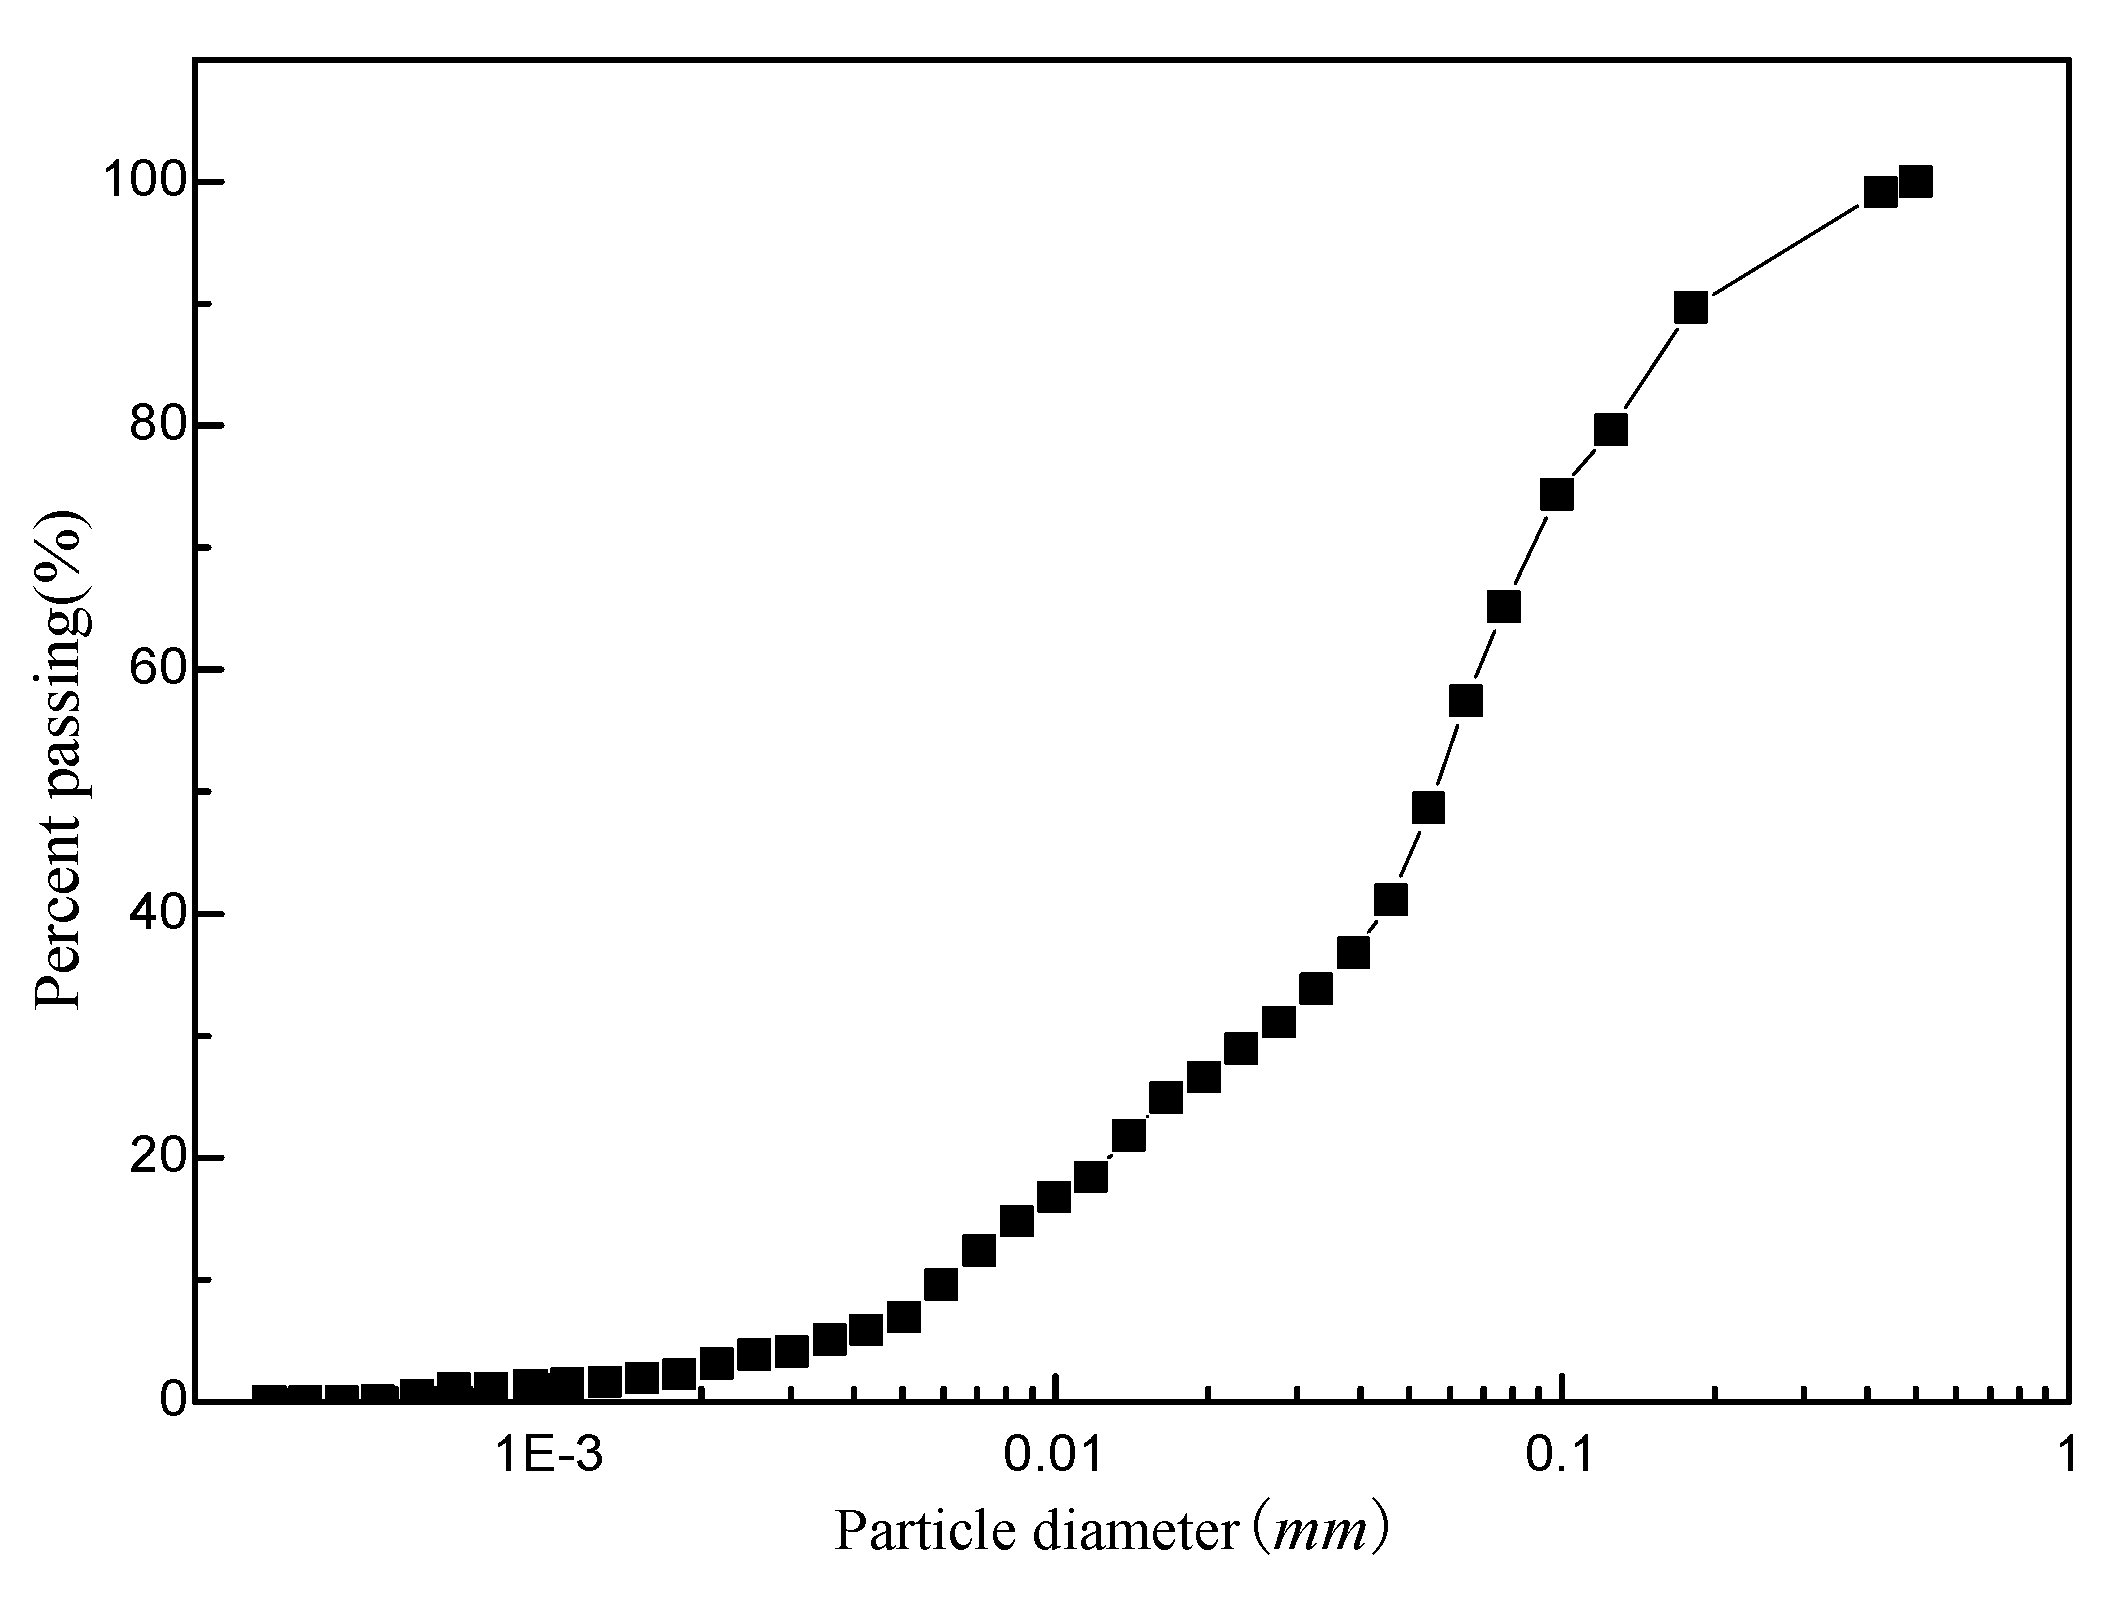
2.1.1. Mill Tailings

The specific gravity of the tailings in Tong-keng mine is 3.1. Tailing particles that measure −0.005, −0.01, −0.02, and −0.074 mm constitute 6.7%, 16.9%, 26.7%, and 64.15% of the total tailings, respectively. The particle size composition curve is depicted in Figure 2, and the particle characteristics are shown in Table 1. As generally agreed upon in international studies, the content of −0.02 mm particles should not be less than 15% in the paste. Nonetheless, an excessively high concentration also complicates paste dehydration and increases pipeline resistance [20,21]; thus, the content of −0.02 mm particles should not be too high. A concentration of 26.7% of fine −0.02 mm particles in the Tong-keng mine tailings is favorable for the preparation of the paste.
Tailings are composed of differently-sized particles, and the uniformity of particle size compositions can be characterized with the coefficient of uniformity Cu and the curvature coefficient Cc. The size distribution of tailing particles is usually wide, and a tailing is well graded when Cu ≥ 5. Cc reflects the continuous gradation of tailings; tailings exhibit good gradation and a high compaction rate when Cc = 1–3 [22,23]. The size distribution of the Tong-keng mine tailings is wide, and these tailings are well graded given that their Cu and Cc values are 11.37 and 1.48, respectively. Thus, these tailings benefit the paste preparation process.

2.1.2. Waste Rock

Waste rocks mainly consist of limestone and siliceous rock, with an average special gravity of 2.7 and a uniaxial compressive strength that ranges between 67.93 and 123.56 MPa. The waste rock samples are collected from the waste rock yard of the east auxiliary shaft in Tong-keng mine for testing, as the dimensions of the shear box did not allow the maximum particle size of waste rock to exceed 10 mm, waste rock particles larger than 10 mm in the samples were replaced by equal masses of smaller rock. In this way, the coarse particles could still act as the aggregate and the ratio of coarse particles to fine particles did not change. This method can also ensure the continuity and similarity in the gradation of coarse particles. After this, the waste rock and tailings were mixed in different ratios and the mixtures were then subject to a direct shear test.

2.1.3. Binders

Mining is still ongoing in the Tong-keng mine surface subsidence area. The annual precipitation in this area is 1100–1600 mm, and the rainy season ranges from April to September. Approximately 75% of the annual rainfall is produced in this season. Therefore, binders should be added to the backfill paste to avoid underground debris flow and other secondary disasters caused by the reaction between the backfilling in the collapse area and water. Binders also ensure underground mining safety; their addition enhances backfill body strength and improves its mechanical properties. P.O. 32.5 cement is selected as the backfill paste binder for the test. Therefore, the concentration of cement and the values of bulk density, porosity, and surface area are 3.1, 1.3 t/m3, 58.06%, and 582,000 m2/m3, respectively.

2.1.4. Water

Tap water is used to mix the binder, tailings, and waste rock. The amount of water is varied to generate backfill body mixtures with the desired consistency.

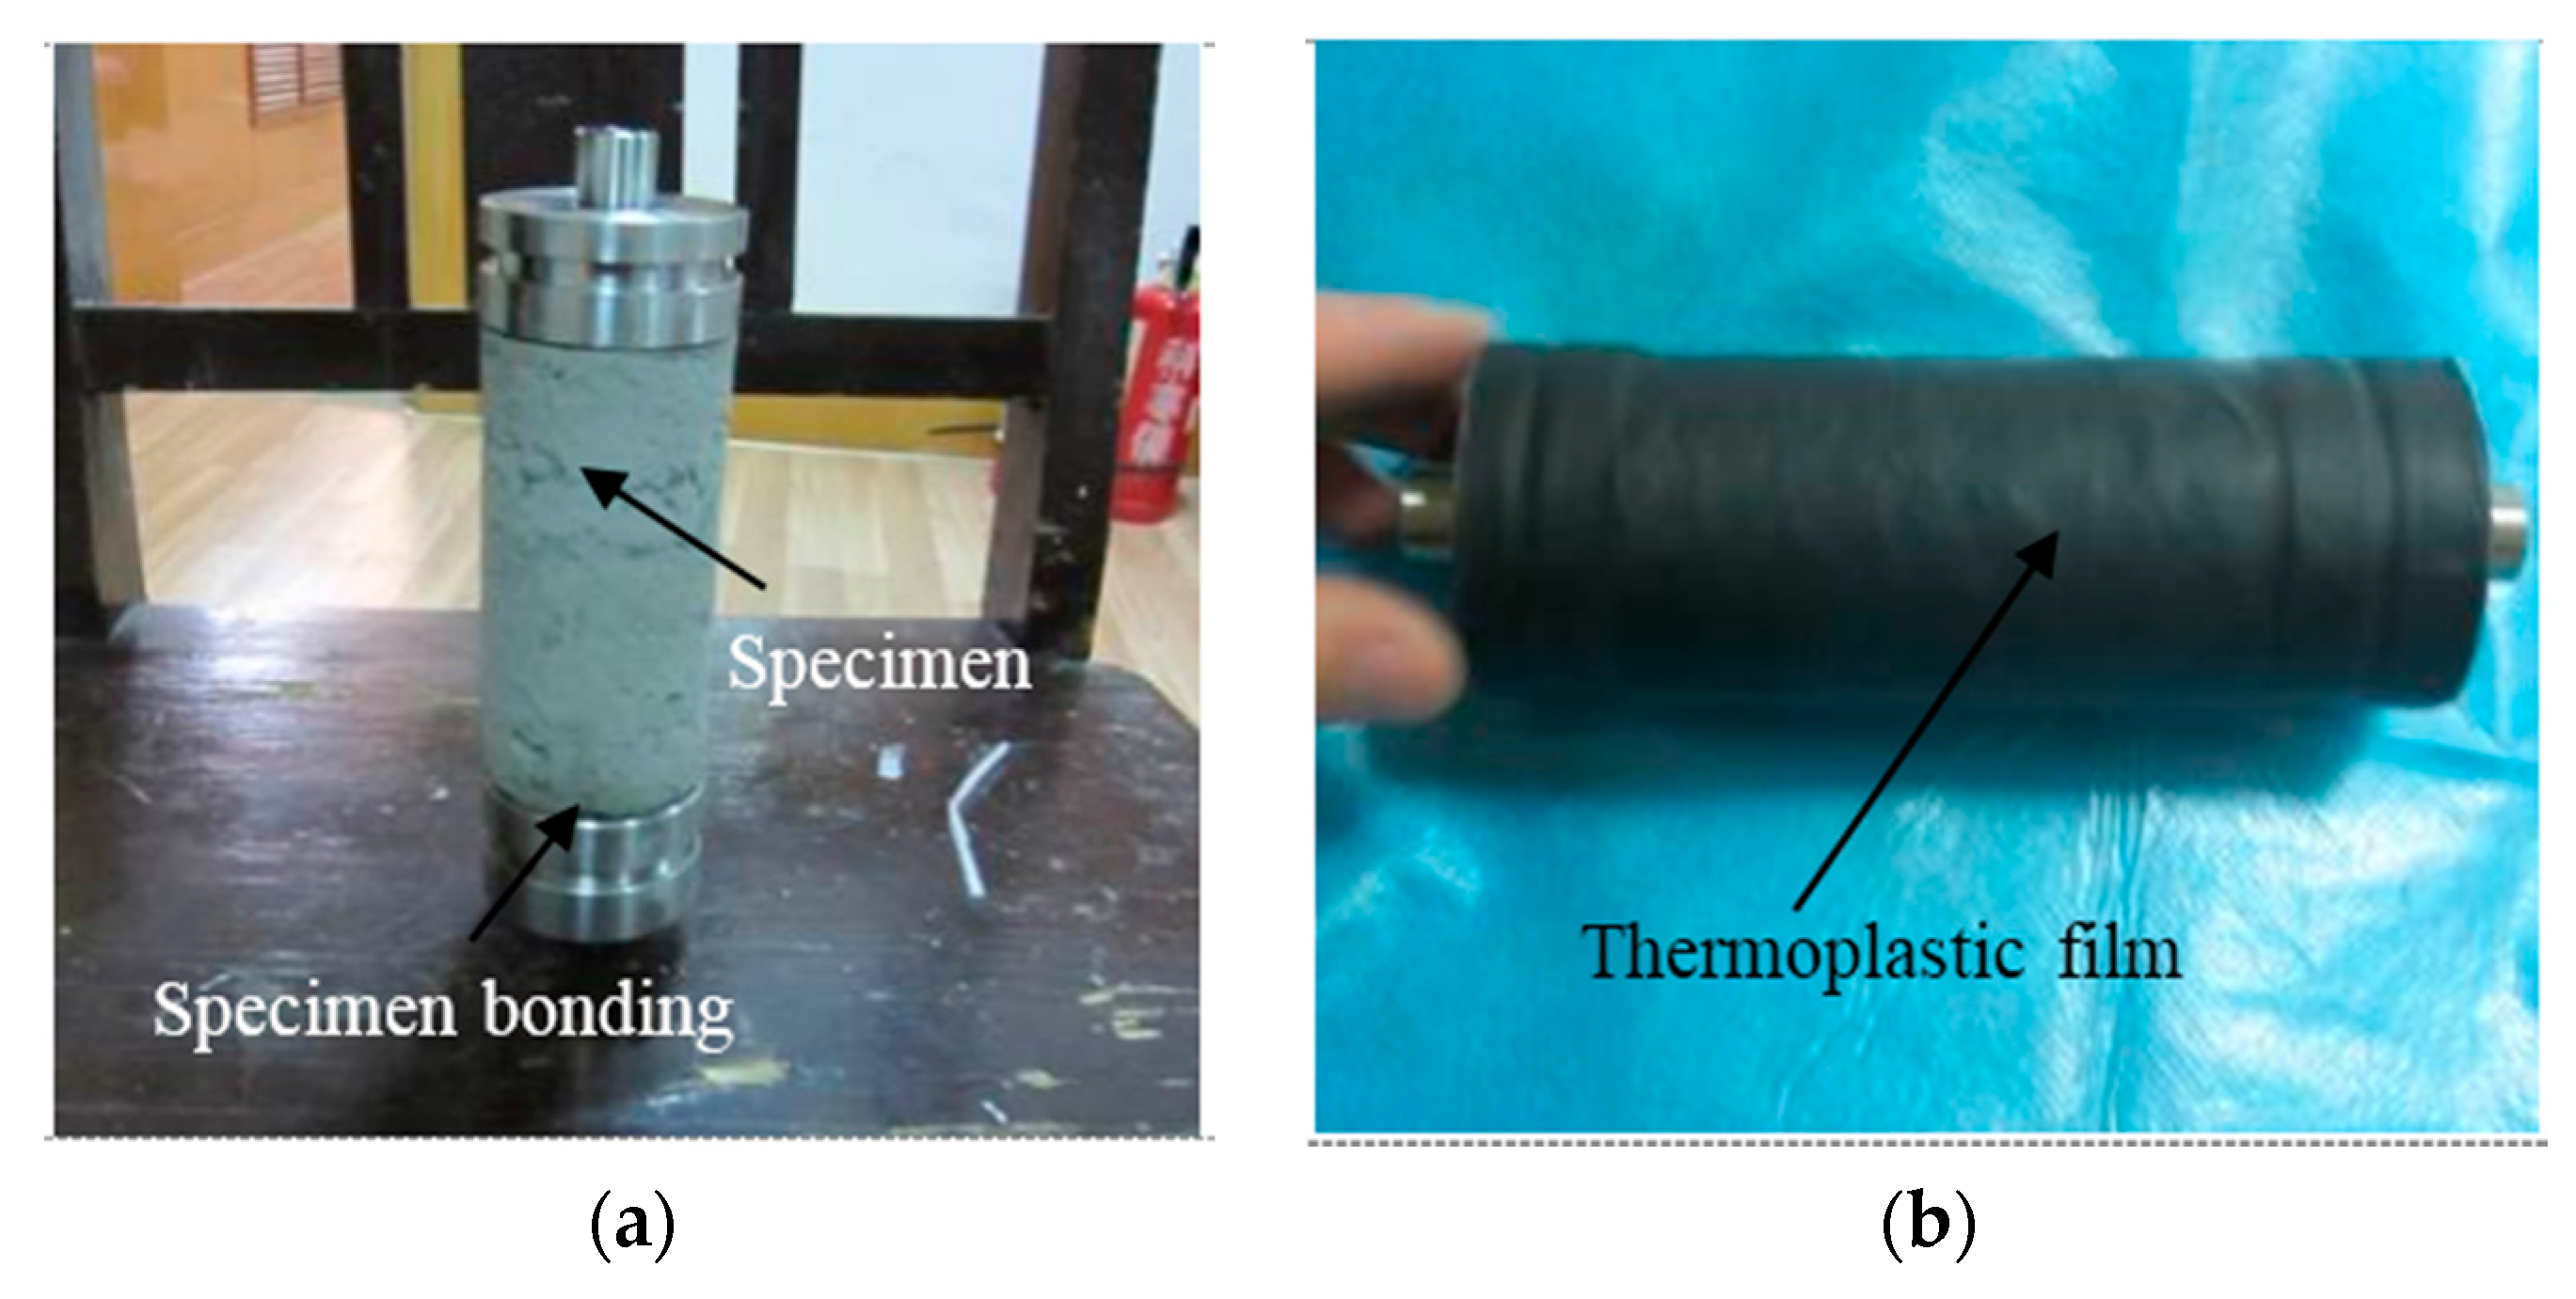
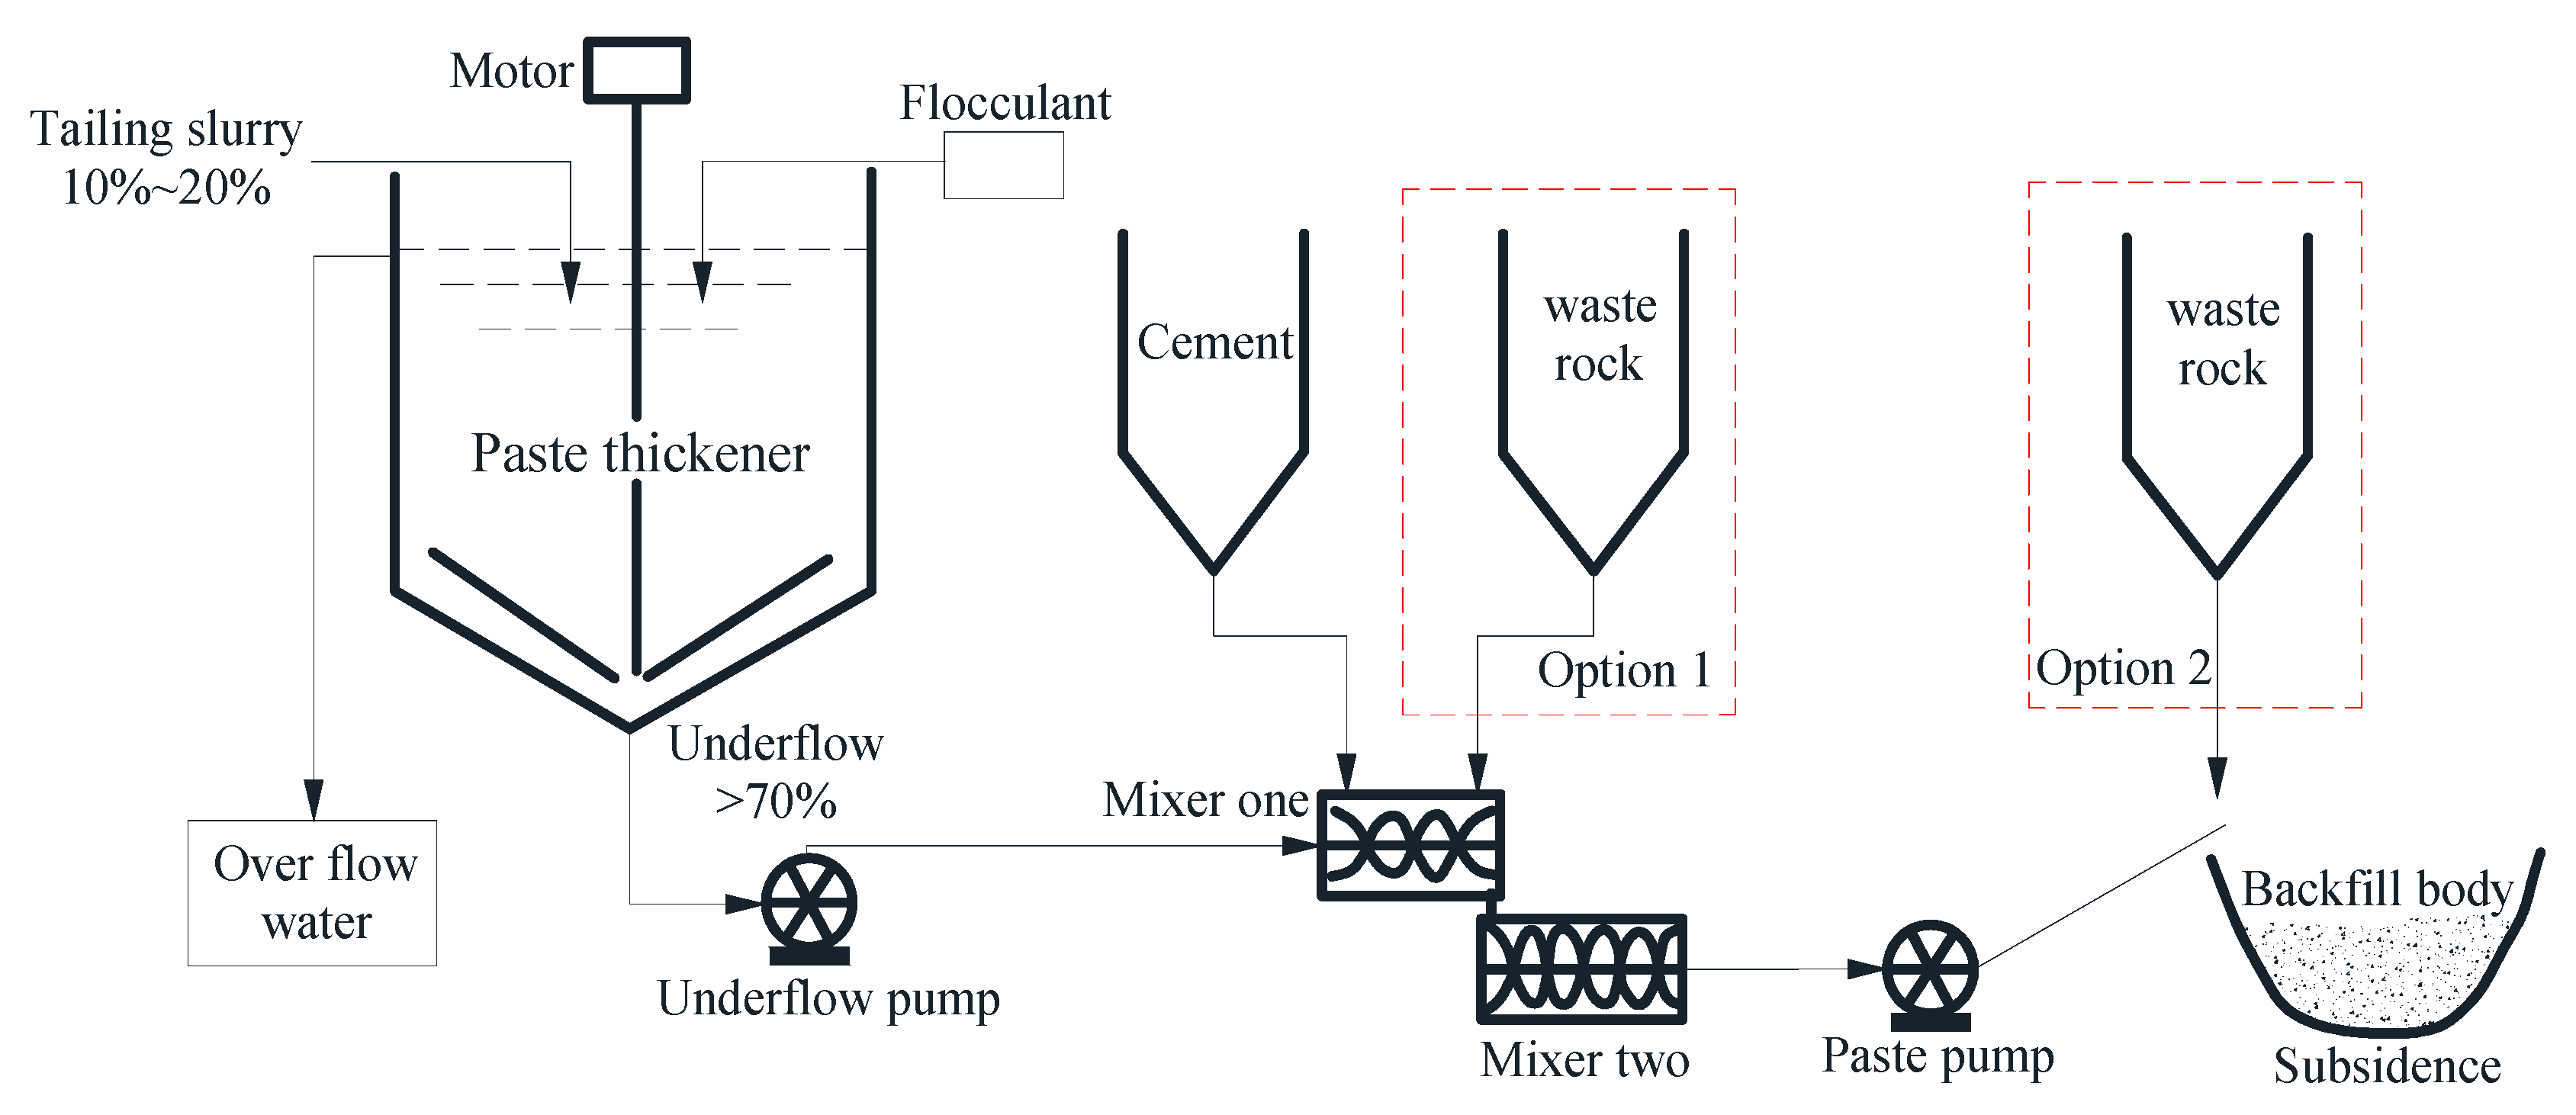
2.2. Preparation of the Specimens

The experiments mainly focus on the effect of the law of waste rock content on the micromechanics of the mixed disposal body (Table 2). The waste rock concentrations studied are 10%, 30%, and 50%, whereas the cement dosages are 1% and 2%. The specimens are prepared with the pouring method at a test mode size of Ф 50 mm × 100 mm. The mixed paste is prepared under a mass concentration of 82% in accordance with the ratio. The paste is then evenly poured into the test mold. The mixed paste is demolded 72 h later and should be conserved until it is aged for 28 day at room temperature for testing.

2.3. Testing Device and Process

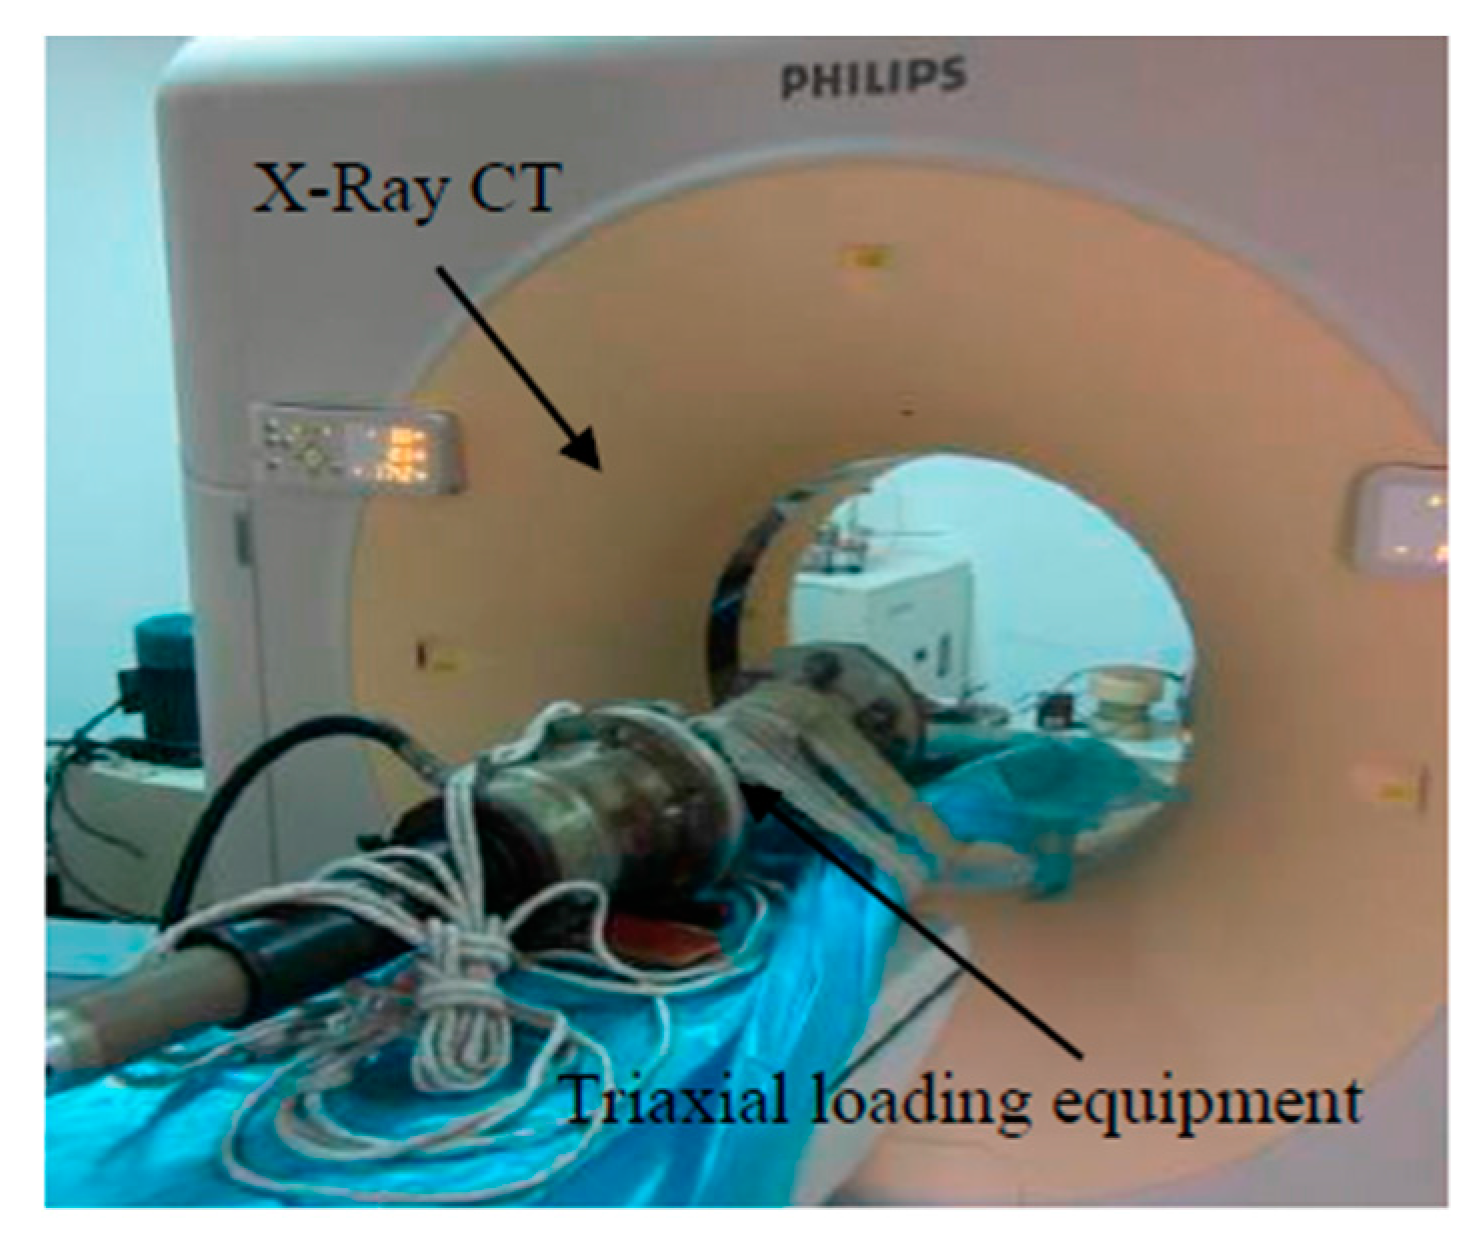
2.3.1. Testing Device

The tests are conducted at the CT laboratory in the Cold and Arid Region Environmental and Engineering Research Institute using an X-ray CT scanner, a PHILIPS Brilliance 16 instrument (Amsterdam, The Netherlands), and a triaxial loading system designed especially for the CT scanner (Figure 3). The spatial resolution of the CT scanner is 0.208 mm × 0.208 mm, and the volume resolution is 0.043 mm3 (1 mm slice). The density contrast resolution is 0.3% (3 Hu). Moreover, the configuration of the scanning equipment includes the DICOM standard image processing workstation (PHILIPS, Amsterdam, The Netherlands) to correct image artifacts. Thus, measuring the distribution of multiphase materials lays a solid technical foundation.
The configuration of the triaxial loading equipment that was specially developed for the CT machine is Ф 240 mm × 1000 mm (Ф, for diameter), and the interior diameter of axial pressure chamber is Ф 142 mm. The equipment can also be used to complete uniaxial compression on the international standard cylinder rock sample (Ф 50 mm × 100 mm) and to conclude the failure test on the soil sample (Ф 61.8 mm × 150 mm). The testing equipment is installed in the CT scan region during the test process. To reduce the influence on the test results, the triaxial loading chamber is composed of premium light metal material LY12 instead of heavy metal materials. The parameters of the triaxial loading equipment are as follows:
Displacement measurement range: 0–20 mm; measuring accuracy: ±1% FS; axial force measurement range: 0–100 kN; measuring accuracy: ±1% FS; strain rate: 0.002–4 mm/min; error: ±10% (strain control); confining pressure range: 2–18 MPa.

2.3.2. Testing Process

Before the test, the ends of a sample are bonded to a loading metal plate to prevent sample loss in the loading process. Given its low intensity, the sample is wrapped as a unified whole unit with thermoplastic film to observe crack development after damage during the scanning process (Figure 4).
The wrapped samples are placed and connected in the plastic sample cavity. Then, the sample chamber is loaded into a small test device, and a connection is fixed. The loading unit is placed on the CT bed, which is adjusted to locate the test equipment. The sensor line is connected to prepare for the uniaxial compression load test. The loading controller and the scan are initiated upon completing the preparatory work; the scan should be conducted in real-time after loading without uninstalling; when the sample approaches destruction and begins to deform rapidly, the throttle adjustment is discontinued until the sample is destroyed. The thickness of the CT test layer is 3 mm, and 40 layers are scanned in the sample. The voltage and current are 120 kV and 235 mA, respectively. Then, the scan is performed four times during the loading process, namely, at the beginning of the loading process, during the peak stress at 40%, during peak stress at 80%, and post peak (Figure 5). Given the amount of layers, the subsequent analysis focuses on the 10th, 20th, and 30th layers.

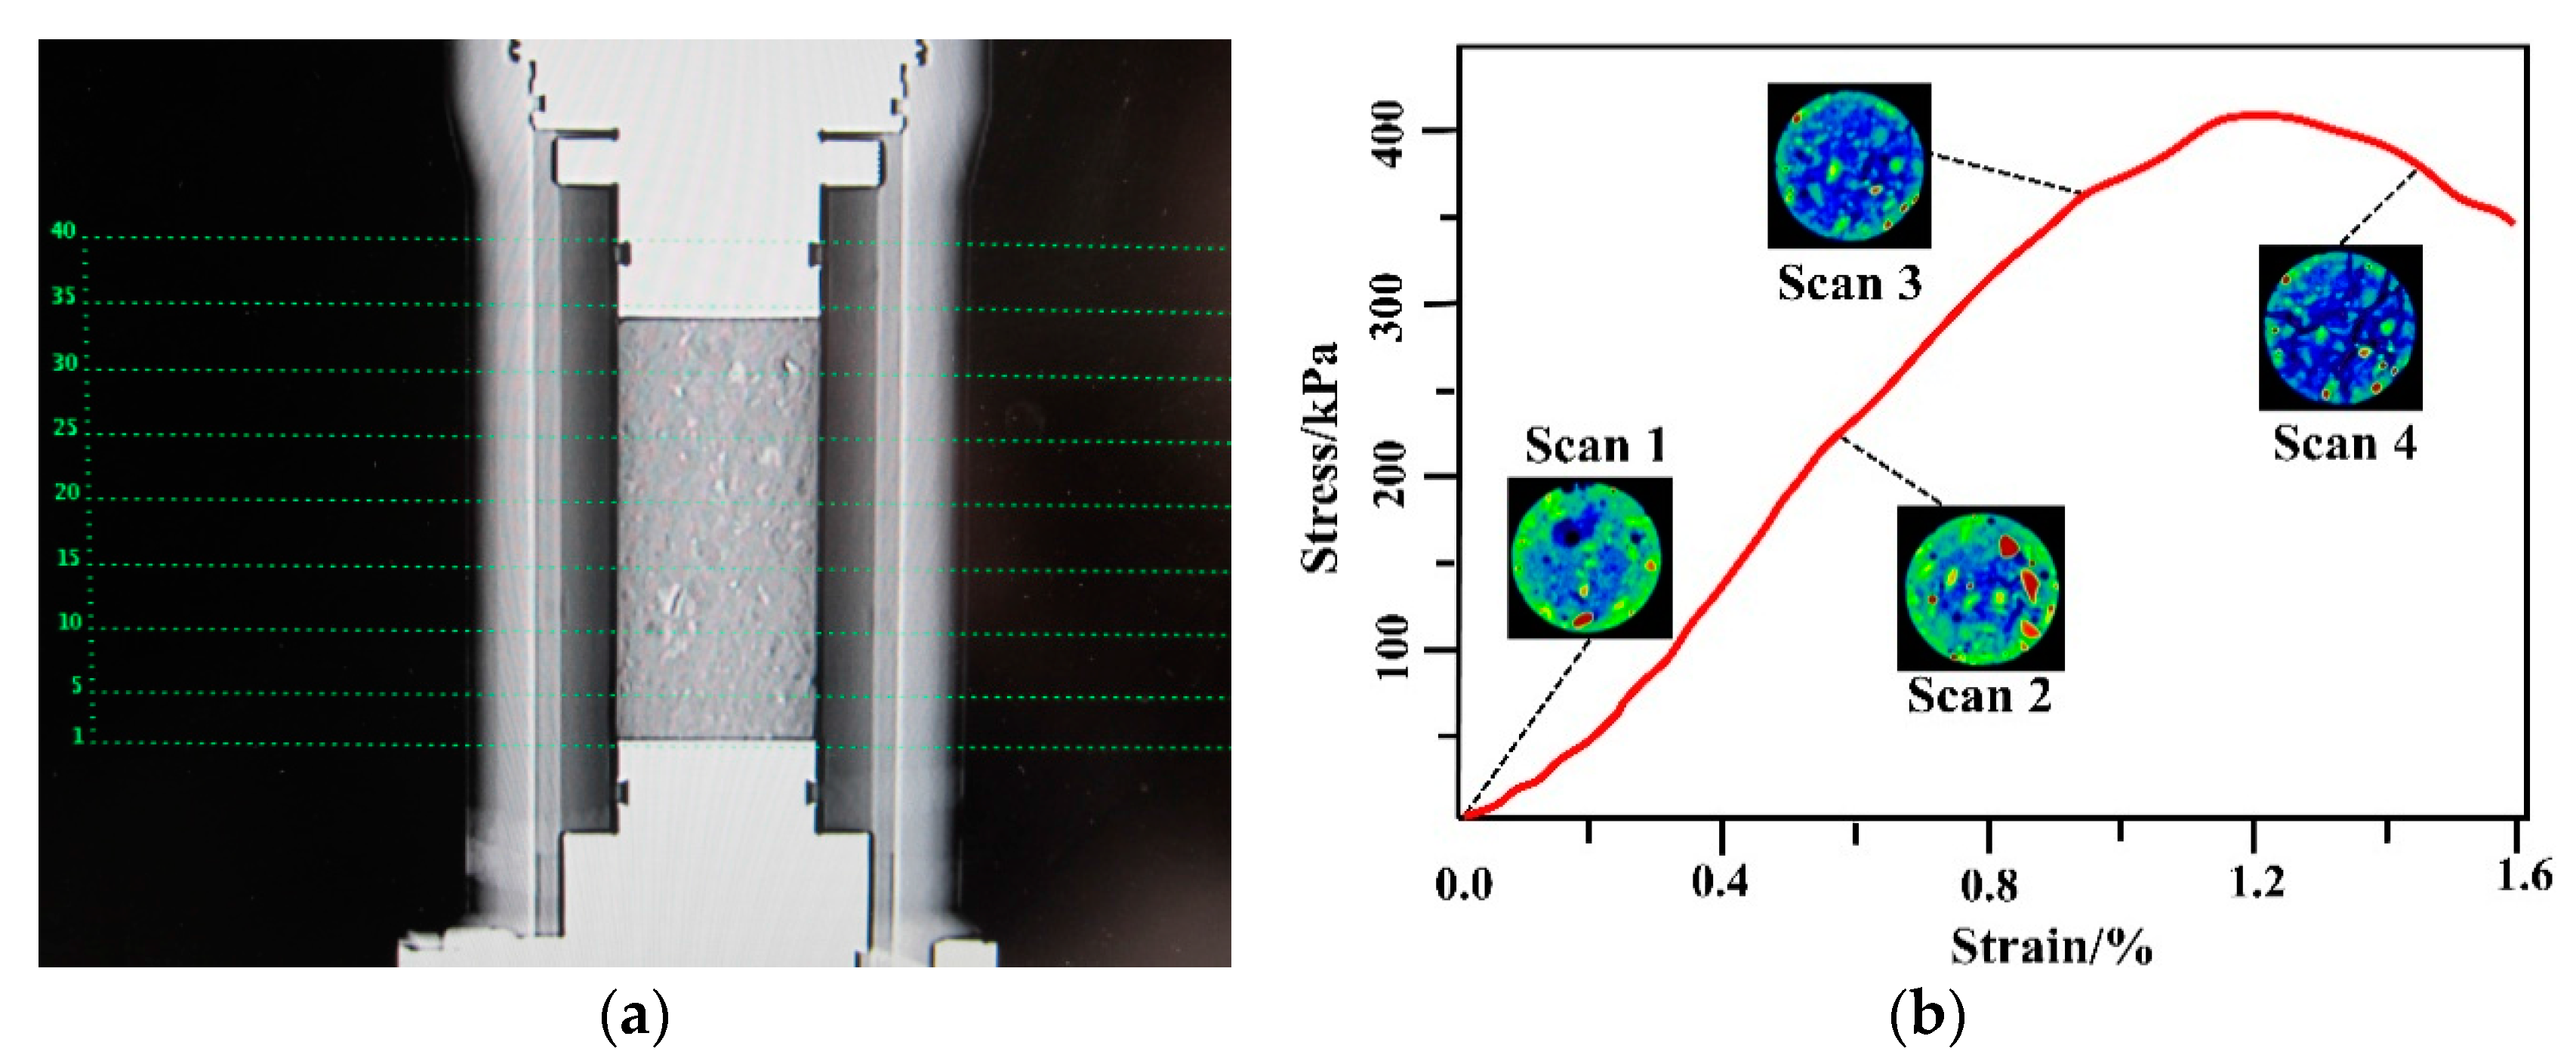
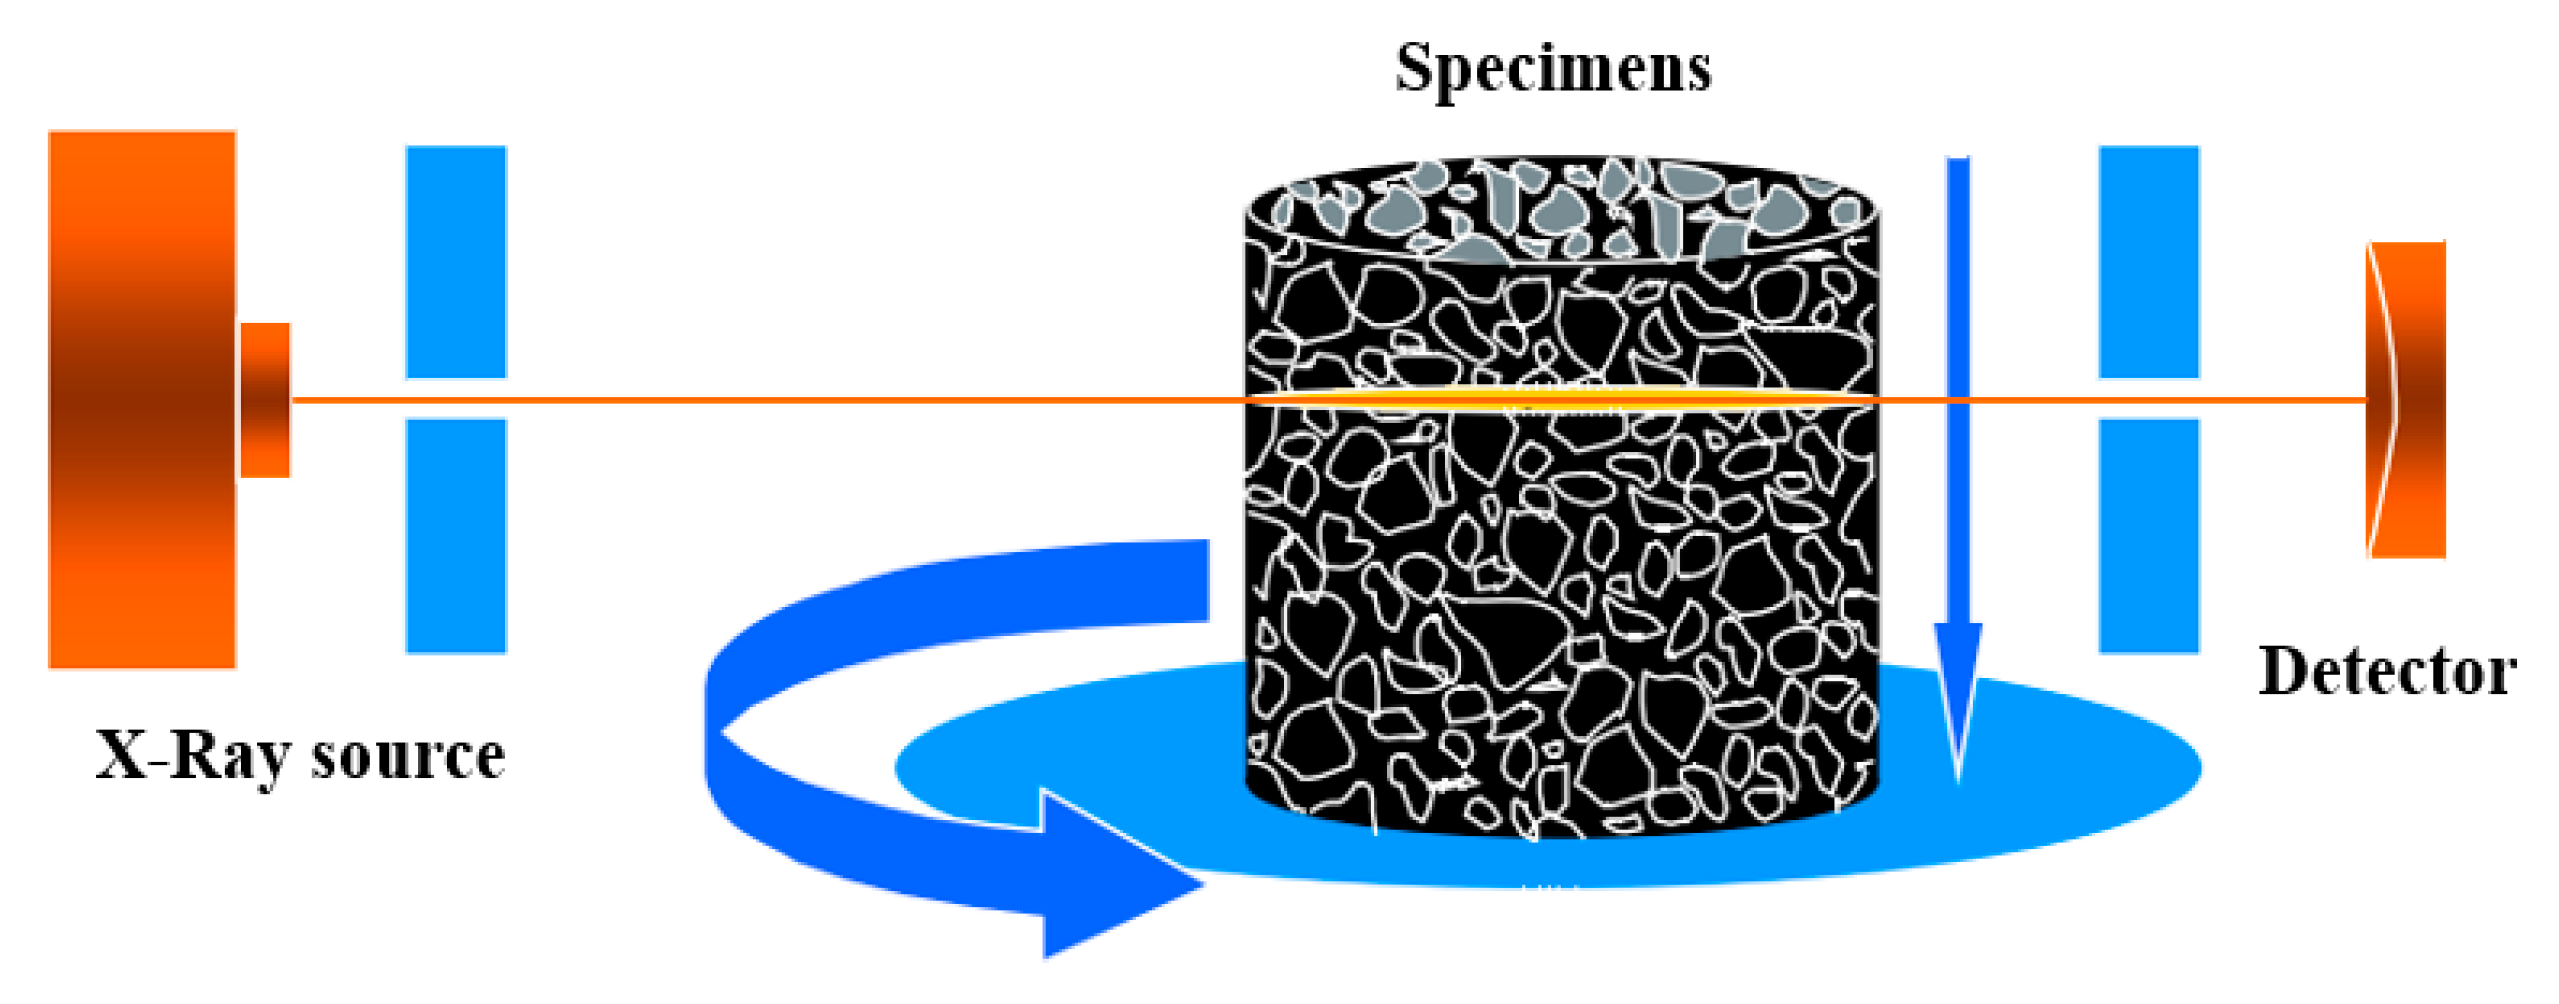
2.4. CT Analysis Principle

The following describes the basic CT principle: the X-ray beam from the X-ray tube scans the selected layer from multiple directions; then, the detector receives and measures the volume of X-rays. This volume is then converted into a digital image through an analog/digital converter. The computer stores and calculates this digital image; subsequently, the unit generates the X-ray absorption value of each unit in the layer. The image and the value are converted into CT images via computer back-projection reconstruction through a digital/analog converter. Finally, the images are displayed via the display [24] (Figure 6).
CT value is the key parameter in CT test analysis [25] and is defined as:
H = k ( μ r m μ b z ) / μ b z
where H refers to the CT number for a pixel, μrm is the X-ray absorption coefficient for the test substance, μbz is the X-ray absorption coefficient of the standard substance, and k is the indexing k-factor.
In the standard equation for a medical CT machine, the following formula is generated when k = 1000 and water is considered a standard substance, namely, μbz = μw:
H = 1000 × ( μ r m μ b z ) / μ b z
At this point, the unit name of the CT value is Hounsfield unit (HU). Therefore, the CT values of water and air are measured as 0 and −1000 HU, respectively. According to Equations (1) and (2), the X-ray absorption capacity of some points can be represented by CT value. CT value magnitude is denoted by the gray scale on the CT image; the brightly colored part of the CT image refers to the part of the measured object that has a large absorption coefficient, and the dark-colored region represents the part of the measured object with a small absorption coefficient. The CT images are the two-dimensional distribution diagrams of the X-ray absorption coefficient of a scanning layer in the measured object. The X-ray absorption coefficient of the test substance can be expressed as:
μ r m = μ m ρ
where μm refers to the mass absorption coefficient of a substance and ρ is the density of a substance. Equation (3) is substituted into Equation (1) to generate the following:
ρ = μ b z ( 1 + H k ) μ m
Equation (3) is substituted into Equation (2) to yield:
ρ = μ w ( 1 + H 1000 ) μ m
Equations (4) and (5) indicate that the density and the X-ray mass absorption coefficient are inversely proportional to each other and are in direct proportion to the CT value. Therefore, CT images can be characterized as the density map of a scanning layer. The shifts in CT value can be quantitatively described by the density changes in the measured substance during the test based on the absorption coefficient of the measured substance.

3. Results and Discussion

The uniaxial compressive stress-strain curves of the samples are tested and obtained under waste rock contents of 10%, 30%, and 50%. Furthermore, the CT numbers of the samples change in the process of loading because of the microstructures and density change. The specific analysis process is described as follows.

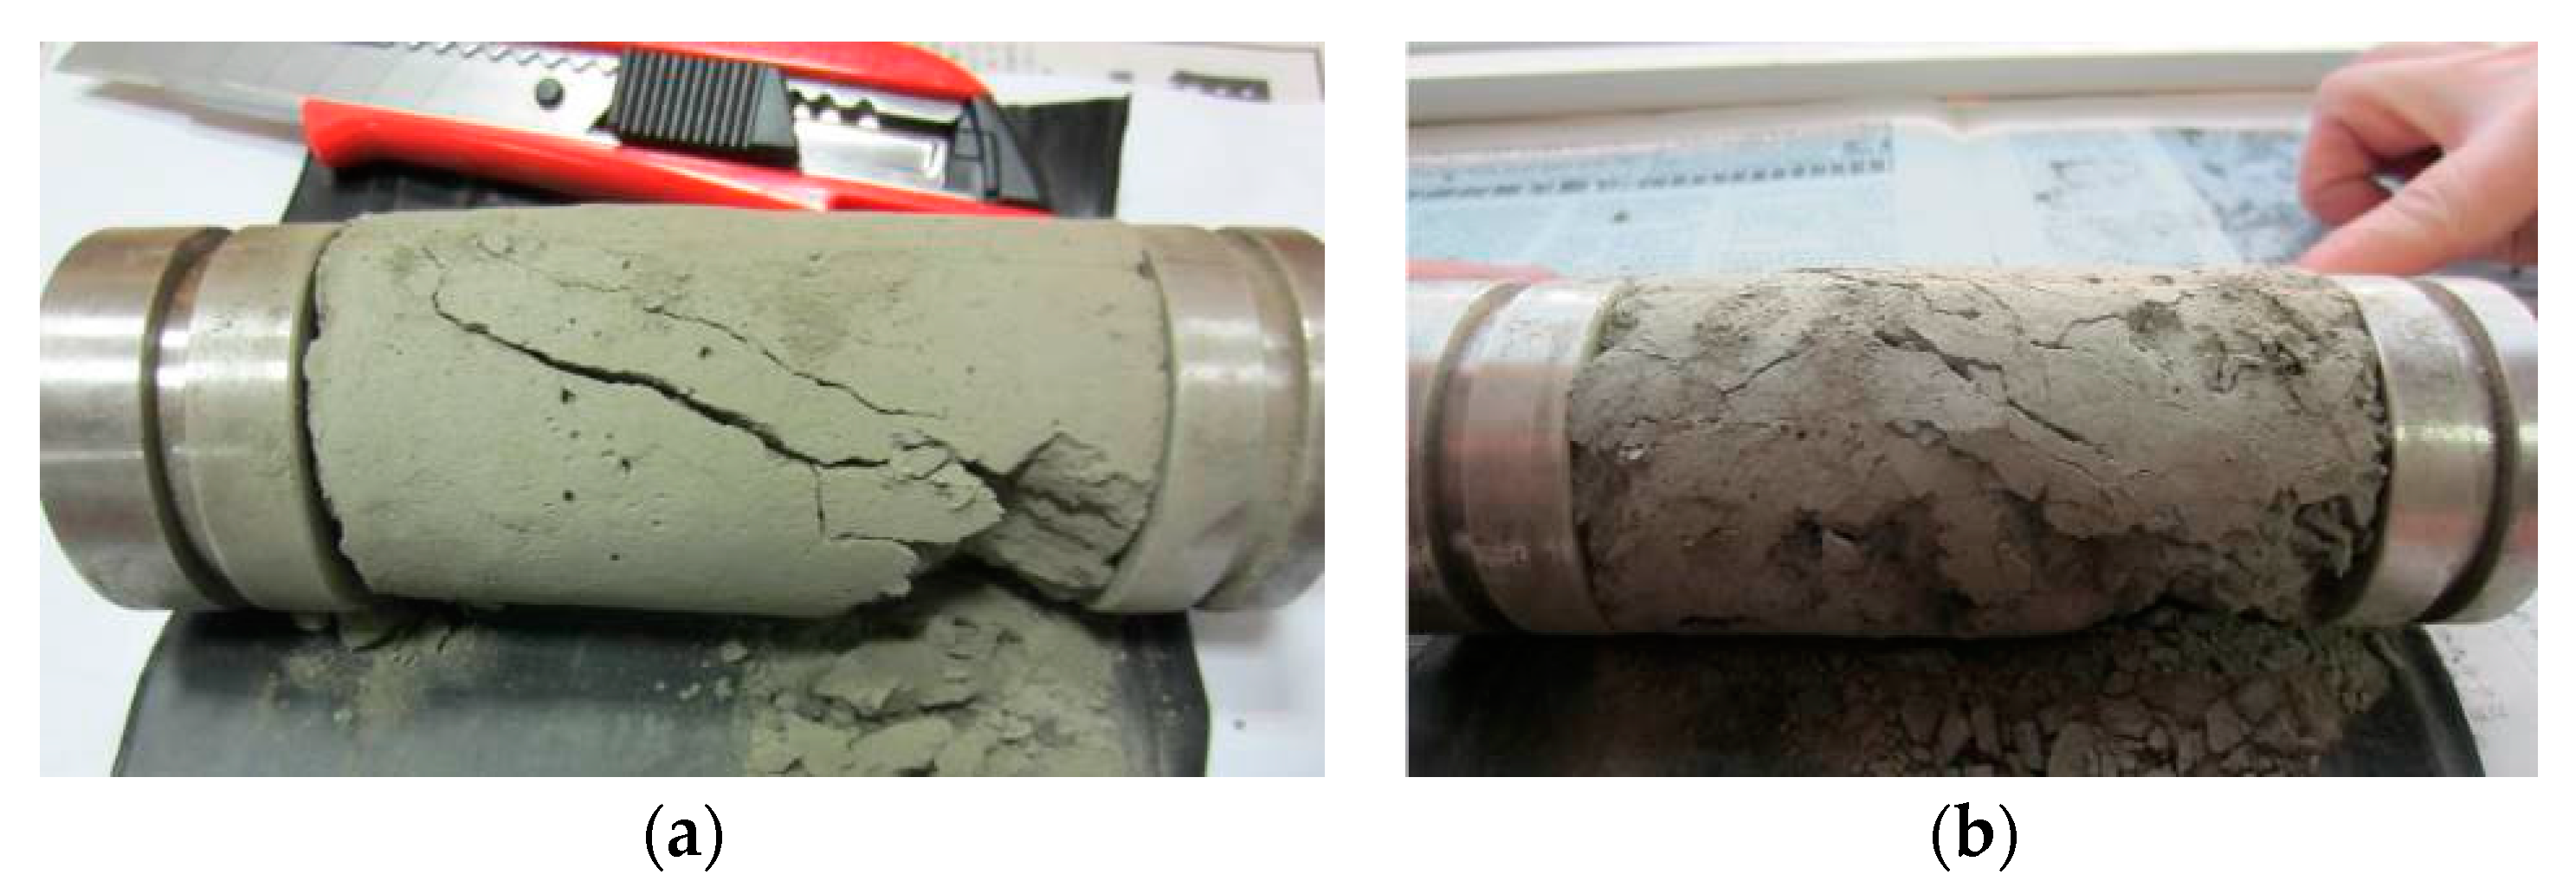
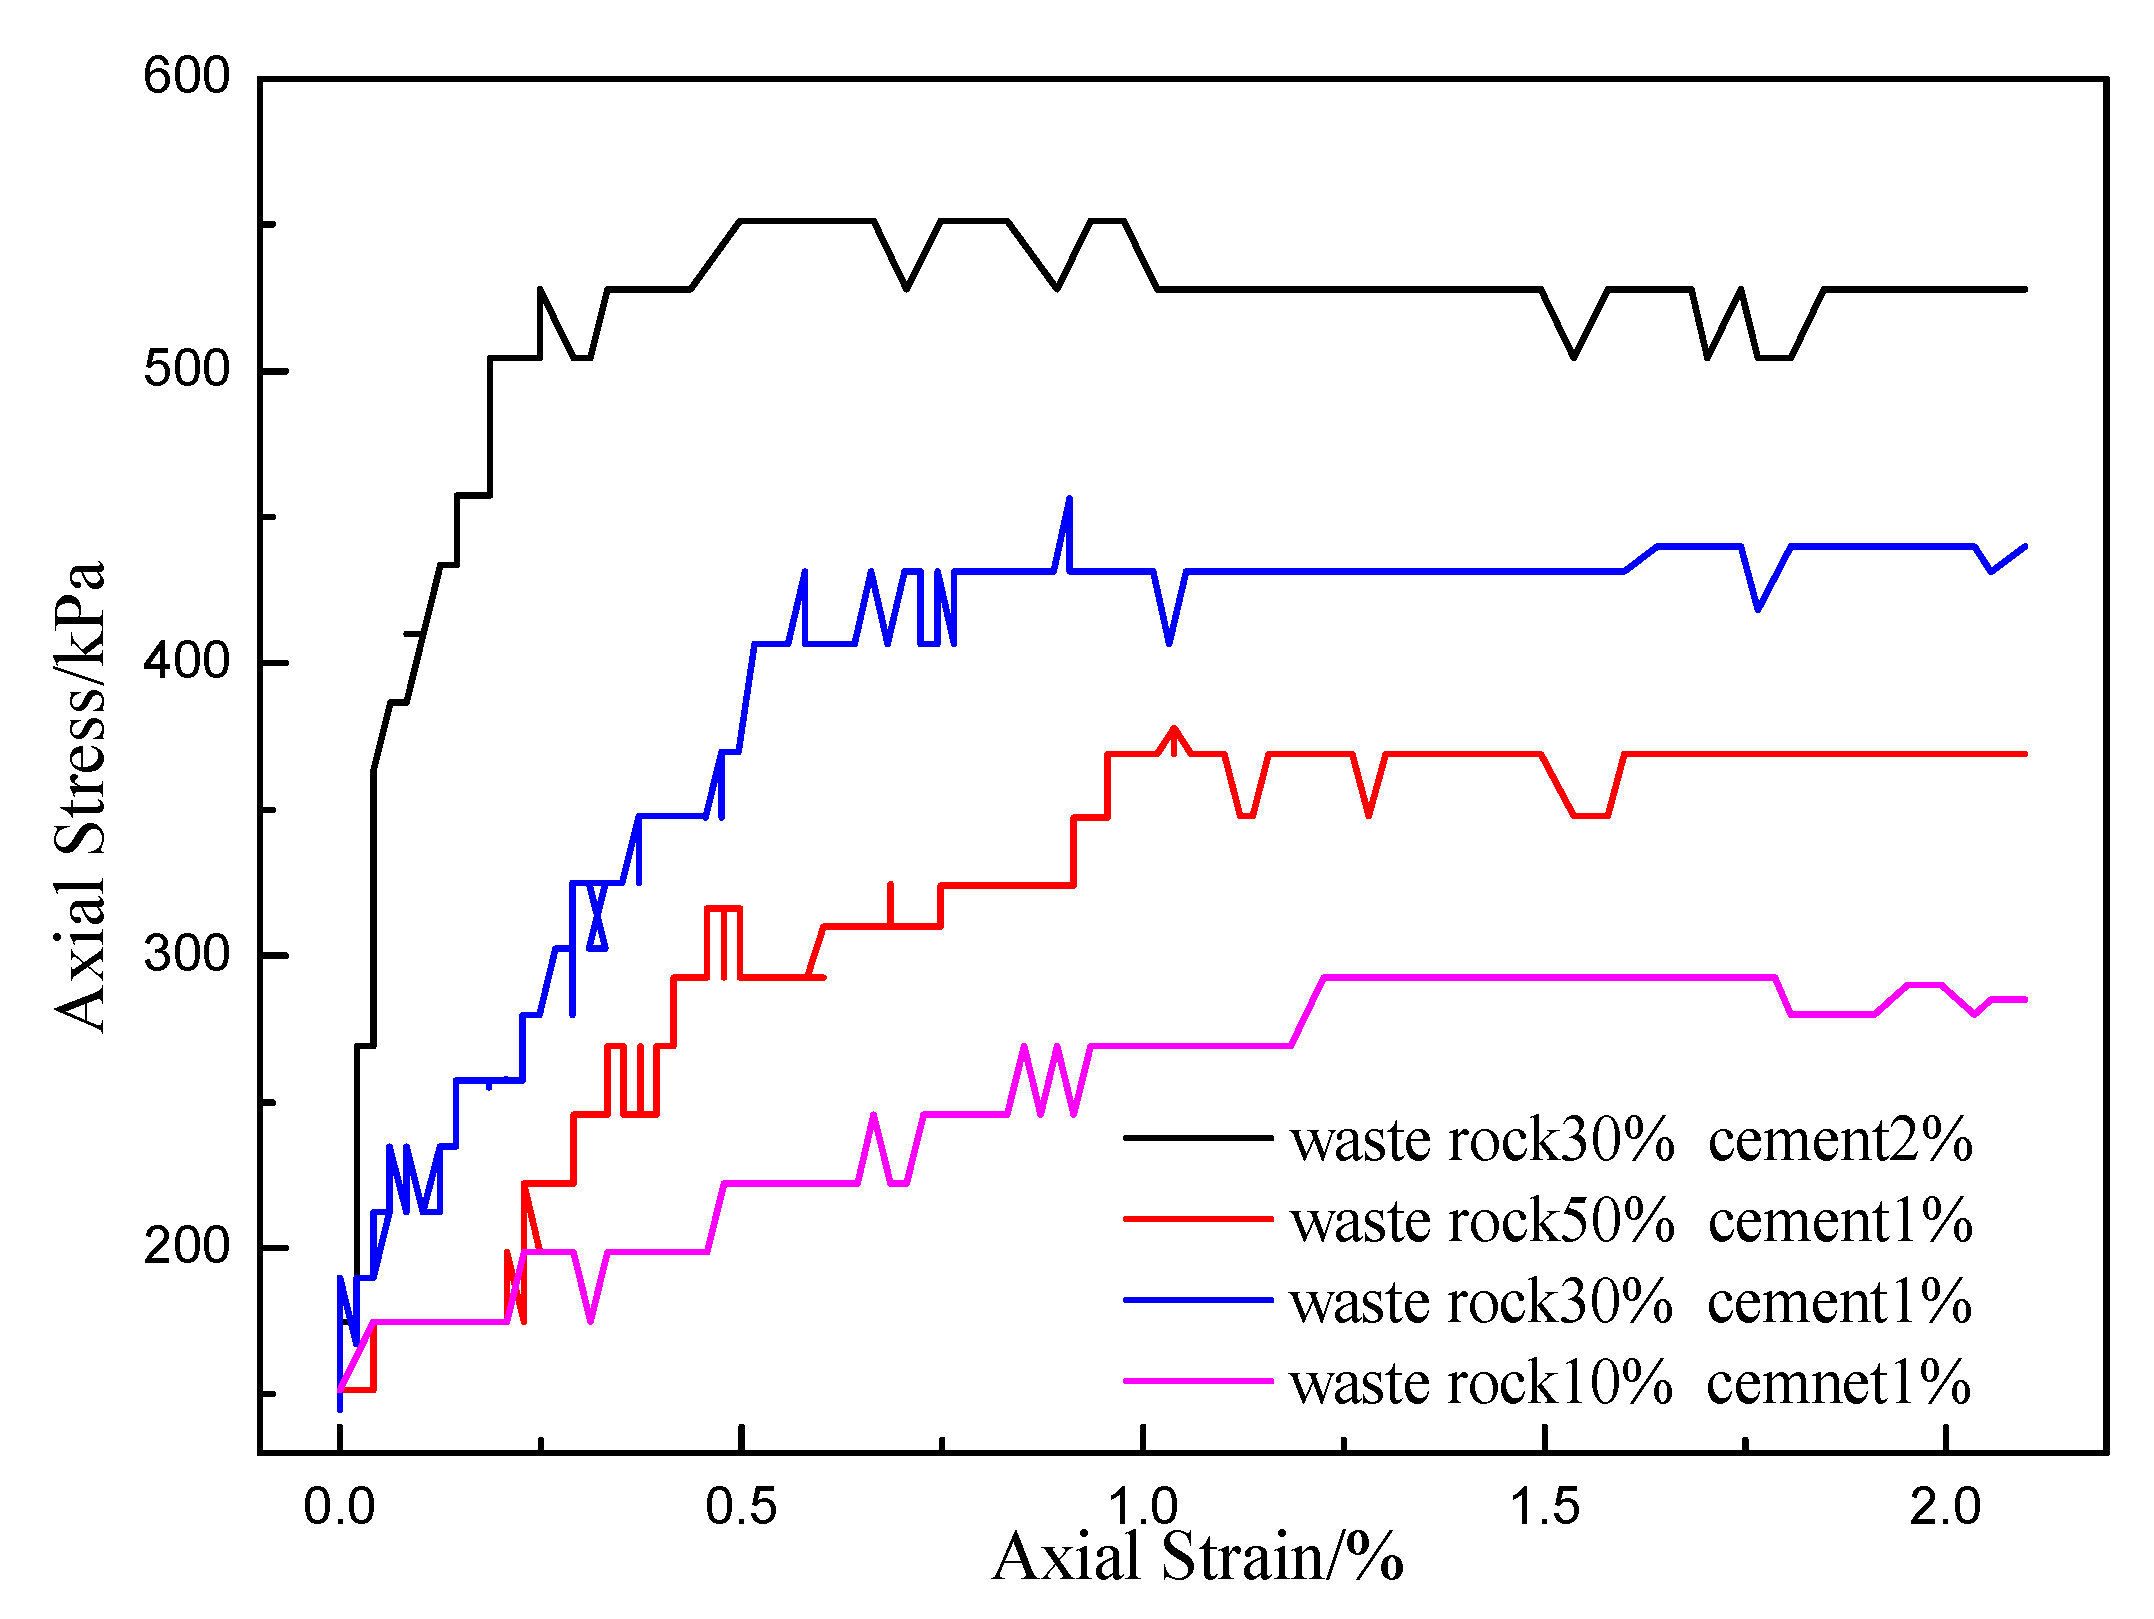
3.1. Uniaxial Compression Test Results

Figure 7 illustrates the uniaxial compressive stress–strain curve of the disposal body. This curve can be derived from the following test results: the peak axial stress of the disposal increases first and then decreases with the same dosage of cement as waste rock content increases. When waste rock is 10%, the cement amount is 1% and the peak axial stress is 292 kPa. When waste rock content is 30%, the amount of cement is 1% and the peak axial stress is 431 kPa. When waste rock content is 50%, the amount of cement is 1% and the peak axial stress is 369 kPa. Therefore, the uniaxial compressive strength of the disposal body does not increase continuously as waste rock concentration increases. The peak axial stress of this test specimen increases to 551 kPa when cement content is 2% and waste rock concentration is 30%. The stress–strain curve of the mixed disposal differs from the conventional rock stress–strain curve, the stress of which is not reduced significantly after damage. This phenomenon is mainly attributed to the fact that the disposal body is not a typical brittle material that may exhibit significant plastic deformation under stress. In addition, the samples, which are wrapped with thermoplastic tubes, consistently experience external confining pressures.

3.2. Microstructure Evolution

A pseudocolor-enhanced image analysis is conducted on the CT images of the mixed disposal with a waste rock content of 30% and a cement content of 2% as well as with a waste rock concentration of 10% and a cement dosage of 1% under various stress conditions. The results of the CT scan are depicted in Figure 8 and Figure 9.
In the pseudocolor-enhanced image of the mixed disposal, mass density increases by a degree from dark to light colored (black blue green yellow red); that is, the CT value of the dark area is low, and that of the bright area is high. The yellow and red colors represent waste rock particles, whereas blue and green represent low-density tailing and pore structure. The crack propagation in the mesostructure of the disposal body can be clearly identified in the enhanced image after the original black and white CT image processing, and the structural features of this body are as follows:
The bright area in the image indicates the waste rock aggregate area with a high density of waste rock particles. The particle shape and distribution of waste rocks in the scanning layers can be observed from the CT image, and the boundary of the waste rock particle area can be significantly distinguished following pseudocolor enhancement. In these layers, the luminance of the tailing area is lower than that of the waste rock particle region. Moreover, the presence of small regions with high luminance are attributed to the high-density tailing coarse particles. The area with minimal luminance contains pores and cracks, and the micropores observed in the sample preparation process are irregularly distributed.
As shown in Figure 10, the density values vary significantly within the scanning area when waste rock content is 50%. The green transitional area is reduced; moreover, many pores and other discontinuous weak structures surround the waste rock particles. The waste rock and tailing particles are distributed evenly when waste rock content is 30%. Nonetheless, many internal porosities and other original interstices are still detected. Only a few waste rock particles can be observed on the scanned images when waste rock content is 10%; the remaining structures are tailings and micropores. Given this structural heterogeneity, breakdown initially occurs in the primary pores, thus diversifying the macromechanic and micromechanic characteristics of the mixed disposal body during loading.
The cracks in the disposal are gradually initiated, expand, and integrate slowly before the axial stress peak is reached. The brittle characteristic of the disposal body becomes significant when cement content increases, as indicated in Figure 7. According to the CT image analysis results, the disposal mesostructure evolution model can be divided into the following categories:
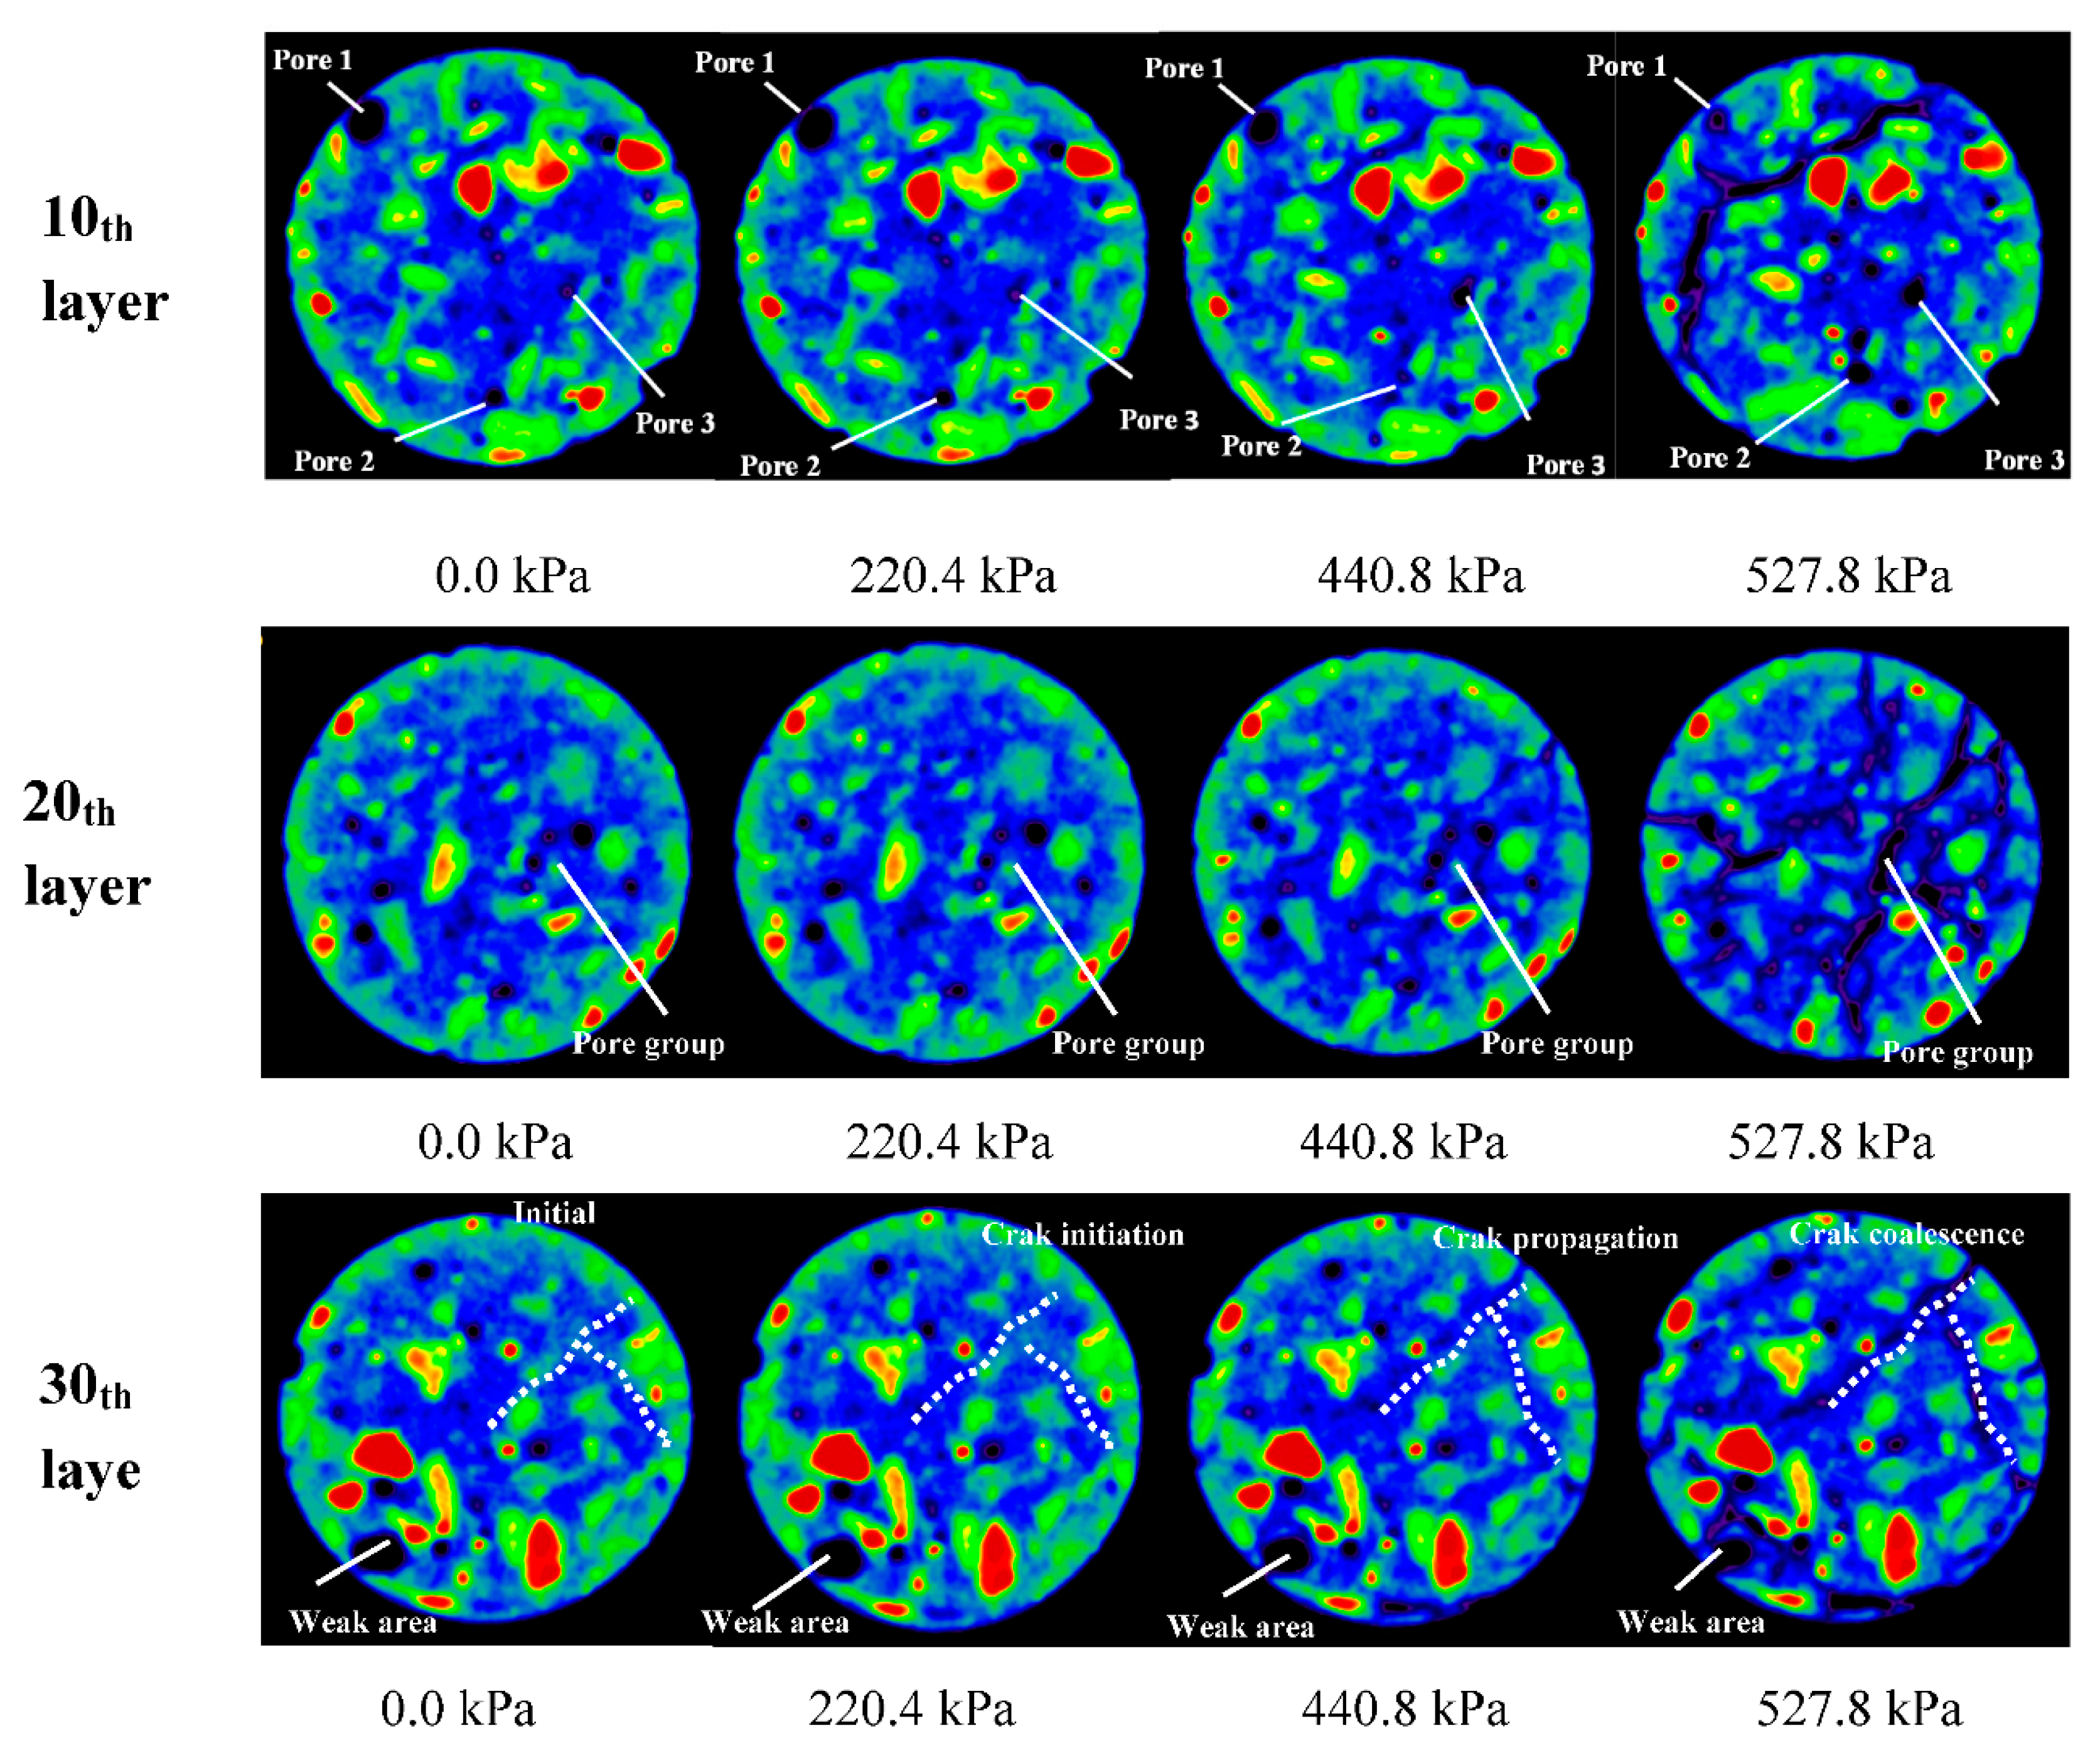
  • Continuous compaction of pores: as depicted in the first 10th layer (the CT image in Figure 8), the volume of pore number 1 decreases under axial stress. Furthermore, the pore shrinks and declines from the initial 0.3475 to 0.2324 cm2 after peaking.
  • Pore expansion after compaction: as displayed in Figure 8, which illustrates the 10th layer of pore number 2, the pore decreases from the initial state of 0.707 to 0.201 cm2 before peaking under the axial stress, in accordance with evolution law. Moreover, the pore size increases to 0.762 cm2 following the intensity peak.
  • Continuous expansion of pores: as shown in the image of the 10th layer of pore number 3 in Figure 8, the pore continuously expands under axial stress, in accordance with evolution law. Pore number 3 also increases from the initial 0.523 to 0.950 cm2 after peaking.
  • Integration and expansion of pore groups: as depicted in Figure 8, the pore group in the 20th layer consists of three tiny pores in close proximity. Stress is gradually concentrated in the three micro pores under axial stress, and the low pore under maximum stress continues to expand, eventually inducing the integration of the three holes and the formation of new cracks.
  • Integration of adjacent microcracks: as presented in the microcrack stress path of the 30th layer (Figure 8), no significant pores and cracks are observed in the original path. Fine cracks and pore structures are initiated in the stress path when axial stress increases. Penetrative cracks eventually form with the expansion of these cracks and structures. This model was mainly developed to address the expansion of pore structures in the adjacent layers under stress.
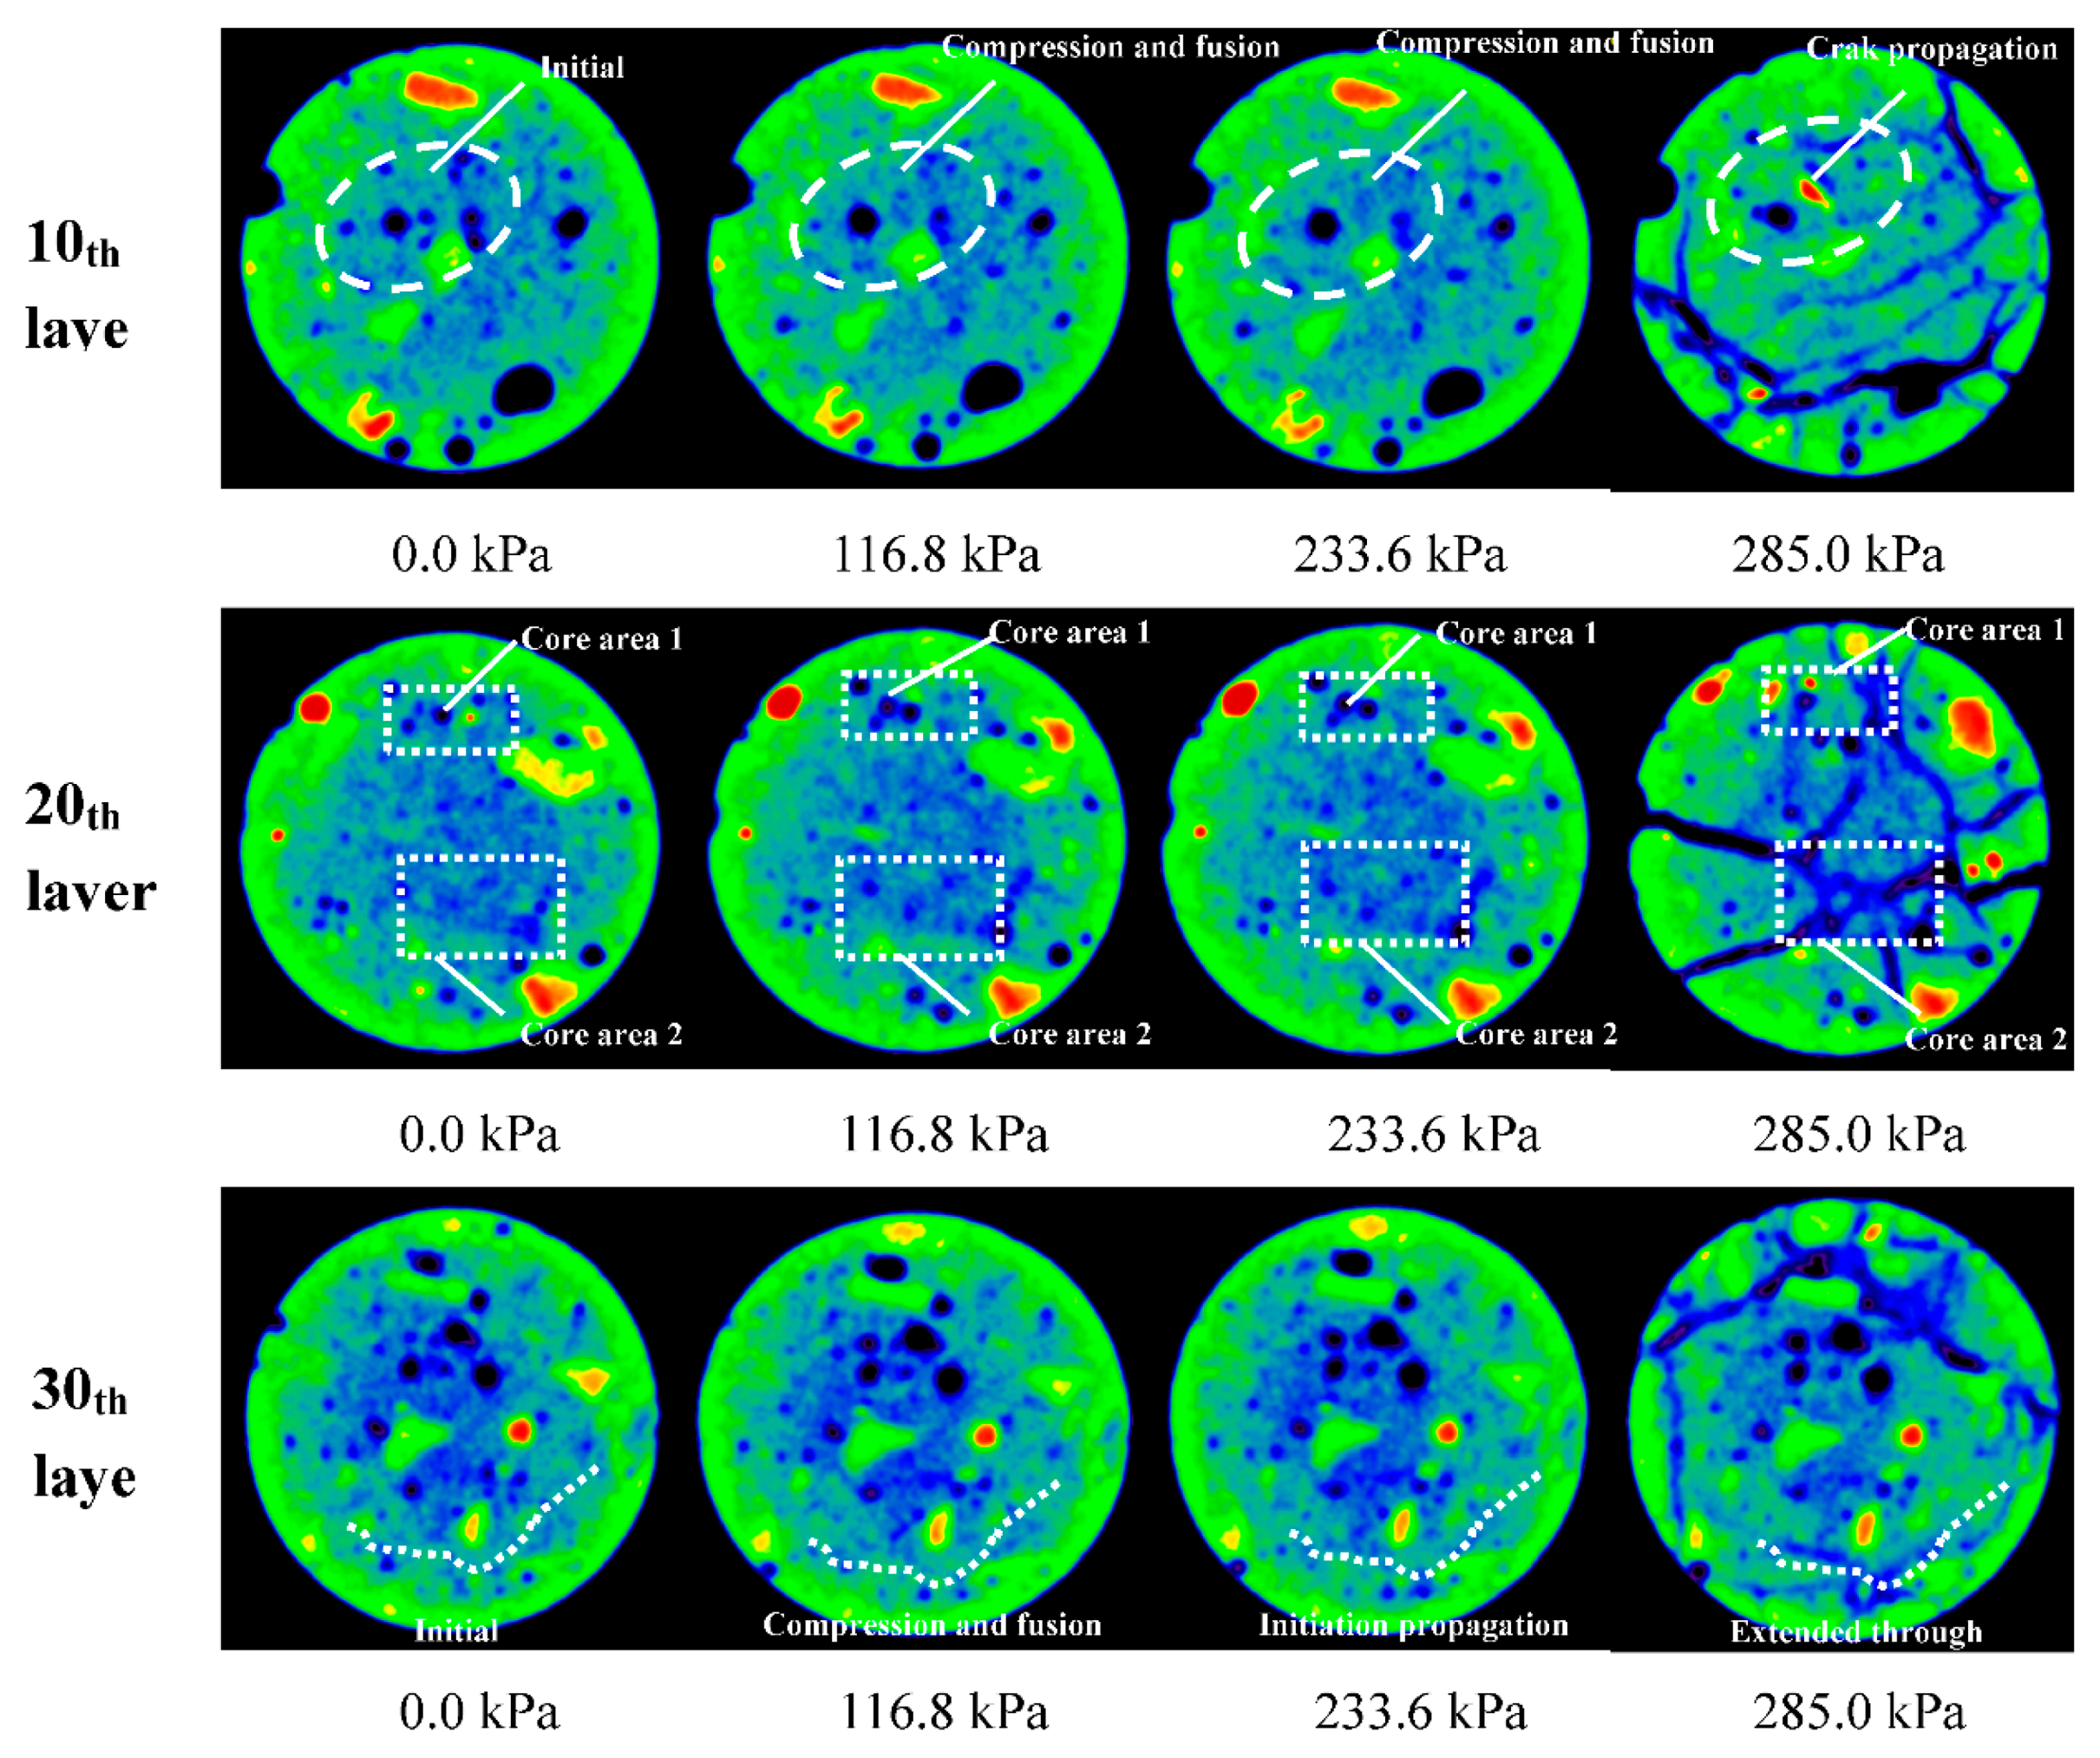
  • Pore expansion in heterogeneous areas: the microstructures rupture in the areas that display local heterogeneity in terms of coarse material, pores, and tailings. As exhibited in Figure 8, the pores are first generated in the 30th layer of the inhomogeneous weak area when axial stress increases. These pores mainly appear in the area that is subject to the composite effect of porosity, aggregation, and tailings; this observation is consistent with the core area extension mechanism shown in Figure 9.
Thus, the loading process of the disposal body is dissimilar to that of a rock that follows a significant compaction phase and linear elastic stage. In the former, primary pore compression and expansion co-exist, while the secondary pores are generated and propagated, and a process is followed for mutual fusion and gradual expansion.
The disposal specimen initially ruptures at both ends, and the rupture gradually evolves into a tapered form under axial force. The number of regions in the center of the sample with a rupture increases with load. The failure forms at different waste rock concentrations differ; when waste rock content is 10%, the annular cracks dominate both ends of the specimen (Figure 9, 10th and 20th layers). The center of the specimens suffers radioactive damage from the interior to the exterior (Figure 9, 10th and 20th layers), and the sample after failure is depicted in Figure 11a. When waste rock content increases to 30%, the rupture is still mainly observed outside both ends of the specimen. However, the rupture degree is significant, and penetrative cracks are detected through the middle of the disposal body from the interior to the exterior. When the waste rock content is 50%, most of the specimens are crushed. The cracks also develop significantly and adequately, and the radial expansion is large.
Figure 12 shows a rupture in the center of a specimen at different waste rock concentrations and indicates that the cracks in the disposal body generally expand around the waste rock particles and the pores in tailings. This observation reflects the controlling influence of waste rocks and pores on porosity. The forward extension of the waste rock particle is cut when cracks and waste rock particles intersect at a large angle. This phenomenon is mainly reflected in the mixed disposal body with a waste rock content of 50%. This finding shows that the cement face of waste rock particles and tailing areas is of low intensity; this face is the key area for the initiation of cracks that destroy the disposal body. The CT image suggests that the microscopic structure is reasonable when waste rock content is 30%. Moreover, porosity expansion level is low, and macrostrength is high under axial force.

4. Conclusions

(1) This research adopts the geotechnical CT and loading equipment of the Cold and Arid Region Environmental and Engineering Research Institute to perform a uniaxial compression test on mixed disposal samples with waste rock contents of 10%, 30%, and 50%, as well as additional cement dosages of 1% and 2%. The peak compressive strength of the disposal body increases at the same cement dosage and then declines as waste rock content increases. This strength is maximized at 551 kPa when the waste rock content is 30%. The CT image shows that the disposal body is a typical medium by which to examine initial damages, such as microholes, pores, and microcracks; moreover, these damages exhibit a high degree of random inhomogeneity. After loading, cracks are gradually initiated from the original damages and propagated until integral damage is inflicted.
(2) According to the real-time CT scan analysis results, the evolution pattern of the disposal body mesostructure can be divided into six categories, namely, the continuous compaction of holes, the expansion and compaction of holes, the continuous expansion of pores, the integration and expansion of pore groups, the integration of adjacent microcracks, and the pore expansion in heterogeneous areas. The loading process of the disposal body is a process in which the compression and expansion processes for the primary pores co-exist. The secondary pores are generated and propagate while the primary pores evolve, in accordance with the procedure for mutual fusion and gradual expansion. The disposal specimen initially ruptures at both ends under axial force, and the rupture gradually evolves into a tapered form. The number of regions in the center of the sample with a rupture increases with load. The failure forms differ at different waste rock concentrations; furthermore, the cracks in the disposal body generally expand around the waste rock particles and pores. These rocks and pores exert a controlling influence on porosity expansion. The cement face of the waste rock particles and tailing areas is also of low intensity and is a sensitive area for most cracks and disposal body damages.
(3) The disposal body microstructure is reasonable when the waste rock content is 30%, with a low porosity expansion level and a high macro strength level under axial force.

Acknowledgments

This work was financially supported by the National Natural Science Foundation of China (51374034, 51374035, 51304011), the Program for Changjiang Scholars and Innovative Research Team in University (IRT0950), the “12th Five-Year Plan” national science and technology support program (2012BAB08B02).

Author Contributions

Wei Sun conceived the overall experimental strategy, analyzed testing data and wrote the paper. Aixiang Wu guided all experiments. Yi Yang and Kepeng Hou were involved in the data analysis process. Yiming Wen and Lei Liu reviewed, edited, and added in data interpretation in the manuscript. All authors participated in writing the manuscript.

Conflicts of Interest

The authors declare no conflict of interest.

References

  1. Inhye, P.; Jaewon, C.; Jin, L.M.; Saro, L. Application of an adaptive neuro-fuzzy inference system to ground subsidence hazard mapping. Comput. Geosci. 2012, 48, 1–11. [Google Scholar]
  2. He, G.Q.; Yang, L.; Ling, G.D. Mining Subsidence Science; China University of Mining and Technology Press: Beijing, China, 1991. (In Chinese) [Google Scholar]
  3. He, F.; Xu, Y.N.; Qiao, G. Distribution characteristics of mine geological hazards in China. Geol. Bull. Chin. 2012, 31, 476–485. [Google Scholar]
  4. Liu, Q.; Liu, Z.X.; Li, D.Y. Knowledge bank model to predict motion angle of terrane in metal deposit and its application in engineering. J. Cent. South. Univ. Technol. 2011, 2, 2446–2452. [Google Scholar]
  5. Gray, R.E. Mining subsidence—Past, present, future. Geotech. Geol. Eng. 1990, 4, 400–408. [Google Scholar] [CrossRef]
  6. Fall, M.; Célestin, J.; Sen, H.F. Potential use of densified polymer-pastefill mixture as waste containment barrier materials. Waste Manag. 2010, 30, 2570–2578. [Google Scholar] [CrossRef] [PubMed]
  7. Hounsfield, G.N. Computerized transverse axial scanning (tomography). Part 1. Description of system. Br. J. Radiol. 1973, 46, 1016–1022. [Google Scholar] [CrossRef] [PubMed]
  8. Wellington, S.L.; Vinegar, H.J. X-ray computerized tomography. J. Pet. Technol. 1987, 8, 885–898. [Google Scholar] [CrossRef]
  9. Colletta, B.; Letouzey, J. Thin-skinned thrust systems. Geology 1991, 19, 1063–1067. [Google Scholar] [CrossRef]
  10. Nakashima, Y. The use of X-ray CT to measure diffusion coefficients of heavy ions in water-saturated porous media. Eng. Geol. 2000, 56, 11–17. [Google Scholar] [CrossRef]
  11. Kawakata, H.; Cho, A.; Kiyama, T. Three-dimensional observations of faulting process in Westerly granite under uniaxial and triaxial conditions by X-ray CT scan. Tectonophysics 1999, 313, 293–305. [Google Scholar] [CrossRef]
  12. Ma, W.; Wu, Z.W.; Pu, Y.B. Monitoring the change of structures in frozen soil in triaxial creep process by CT. J. Glaciol. Geocryol. 1997, 19, 52–55. [Google Scholar]
  13. Wu, Z.W.; Ma, W.; Pu, Y.B.; Chang, X.X. Submicroscopic analysis on deformation characteristics in creep process of frozen soil. Chin. J. Geotech. Eng. 1997, 19, 1–8. [Google Scholar]
  14. Cnudde, V.; Boone, M.; Dewanckele, J. 3D characterization of sandstone by means of X-ray computed tomography. Geosphere 2011, 7, 54–61. [Google Scholar] [CrossRef]
  15. Raynaud, S.; Vasseur, G.; Soliva, R. In vivo CT X-ray observations of porosity evolution during triaxial deformation of a calcarenite. Int. J. Rock Mech. Min. 2012, 56, 161–170. [Google Scholar] [CrossRef]
  16. Sufian, A.; Russell, A.R. Microstructural pore changes and energy dissipation in Gosford sandstone during pre-failure loading using X-ray CT. Int. J. Rock Mech. Min. 2013, 57, 119–131. [Google Scholar] [CrossRef]
  17. Büyüköztürk, O. Imaging of concrete structures. NDT E Int. 1998, 31, 233–243. [Google Scholar] [CrossRef]
  18. Wong, R.C.K.; Chau, K.T. Estimation of air void and aggregate spatial distributions in concrete under uniaxial compression using computer tomography scanning. Cement Concrete Res. 2005, 35, 1566–1576. [Google Scholar] [CrossRef]
  19. Tian, W.; Dang, F.N.; Chen, H.Q. CT experimentl study on failure characteristics of concrete under dynamic loading. J. Earthq. Eng. Vib. 2011, 31, 30–34. [Google Scholar]
  20. Landriault, D. Paste backfill mix design for Canadian underground hard rock mining. In Proceedings of the 97th Annual General Meeting of CIM, Rock Mechanics and Strata Control Session, Halifax, NS, Canada, 14–18 May 1995; pp. 229–238.
  21. Brackebusch, F.; Shillabeer, J. Use of paste for tailings disposal. In Proceedings of the Sixth International Symposium on Mining with Backfill, Brisbane, Australia, 14–16 April 1998; pp. 53–58.
  22. Sun, W.; Wu, A.X.; Wang, H.J. The change laws of flow characteristics of backfill paste mixed by unclassified tailings and waste rock. Rock. Soil. Mech. 2013, 4, 3464–3470. [Google Scholar]
  23. Wu, A.X.; Sun, W.; Wang, H.J. Experiment research on shear behavior of subsidence backfill body mixed by unclassified tailings and waste rocks. Chin. J. Rock. Mech. Eng. 2013, 32, 917–925. [Google Scholar]
  24. Ge, X.R.; Ren, J.X.; Pu, Y.B. Damage Mechanics of Rock and Soil and Macro-Meso Test Research; Science Press: Beijing, China, 2004. (In Chinese) [Google Scholar]
  25. Chen, S.J.; Zhao, S.P.; Ma, W. Studying frozen soil with CT technology: Present studies and prospects. J. Glaciol. Geocryol. 2013, 35, 193–200. [Google Scholar]
Figure 1. Technological process of subsidence control using paste backfill.
Minerals 06 00043 g001
Figure 2. Grain-size distributions of the tailings.
Minerals 06 00043 g002
Figure 3. X-ray CT scanner.
Minerals 06 00043 g003
Figure 4. Test sample preparation. (a) The specimen bonding; and (b) the sample to be tested.
Minerals 06 00043 g004
Figure 5. Determination of scanning layers and scanning points. (a) Determination of scanning layers; and (b) determination of the scanning spots.
Minerals 06 00043 g005
Figure 6. CT test principle.
Minerals 06 00043 g006
Figure 7. Stress-strain curves of the disposal in different ratios.
Minerals 06 00043 g007
Figure 8. CT scan images for different layers given a waste rock content of 30% and a cement dosage of 2%.
Minerals 06 00043 g008
Figure 9. CT scan images for different layers given a waste rock content of 10% and a cement dosage of 1%.
Minerals 06 00043 g009
Figure 10. Initial CT image of the mixed disposal body at different waste rock contents. (a) The waste rock of 50%; (b) the waste rock of 30%; and (c) the waste rock of 10%.
Minerals 06 00043 g010
Figure 11. Specimen form after the failure of the mixed disposal with different waste rock contents. (a) Waste rock content of 10%; and (b) waste rock content of 50%.
Minerals 06 00043 g011
Figure 12. CT images after the rupture of the mixed disposal body at different waste rock concentrations. (a) Waste rock of 50%; (b) waste rock of 30%; and (c) waste rock of 10%.
Minerals 06 00043 g012
Table 1. Physical properties of the tailings used.
ElementGsD10 (mm)D30 (mm)D50 (mm)D60 (mm)D90 (mm)CuCc
Tailings3.16.2 × 10−325.43 × 10−358.31 × 10−370.5 × 10−3192 × 10−311.371.48
Table 2. The component of specimens.
No.Tailing/RockCement wt %Mass Concentration %
17:3282
25:5182
37:3182
49:1182

