
Restraining Sodium Volatilization in the Ferric Bauxite Direct Reduction System

Abstract
:1. Introduction
2. Experimental
2.1. Experimental Materials
2.2. Experimental Instruments
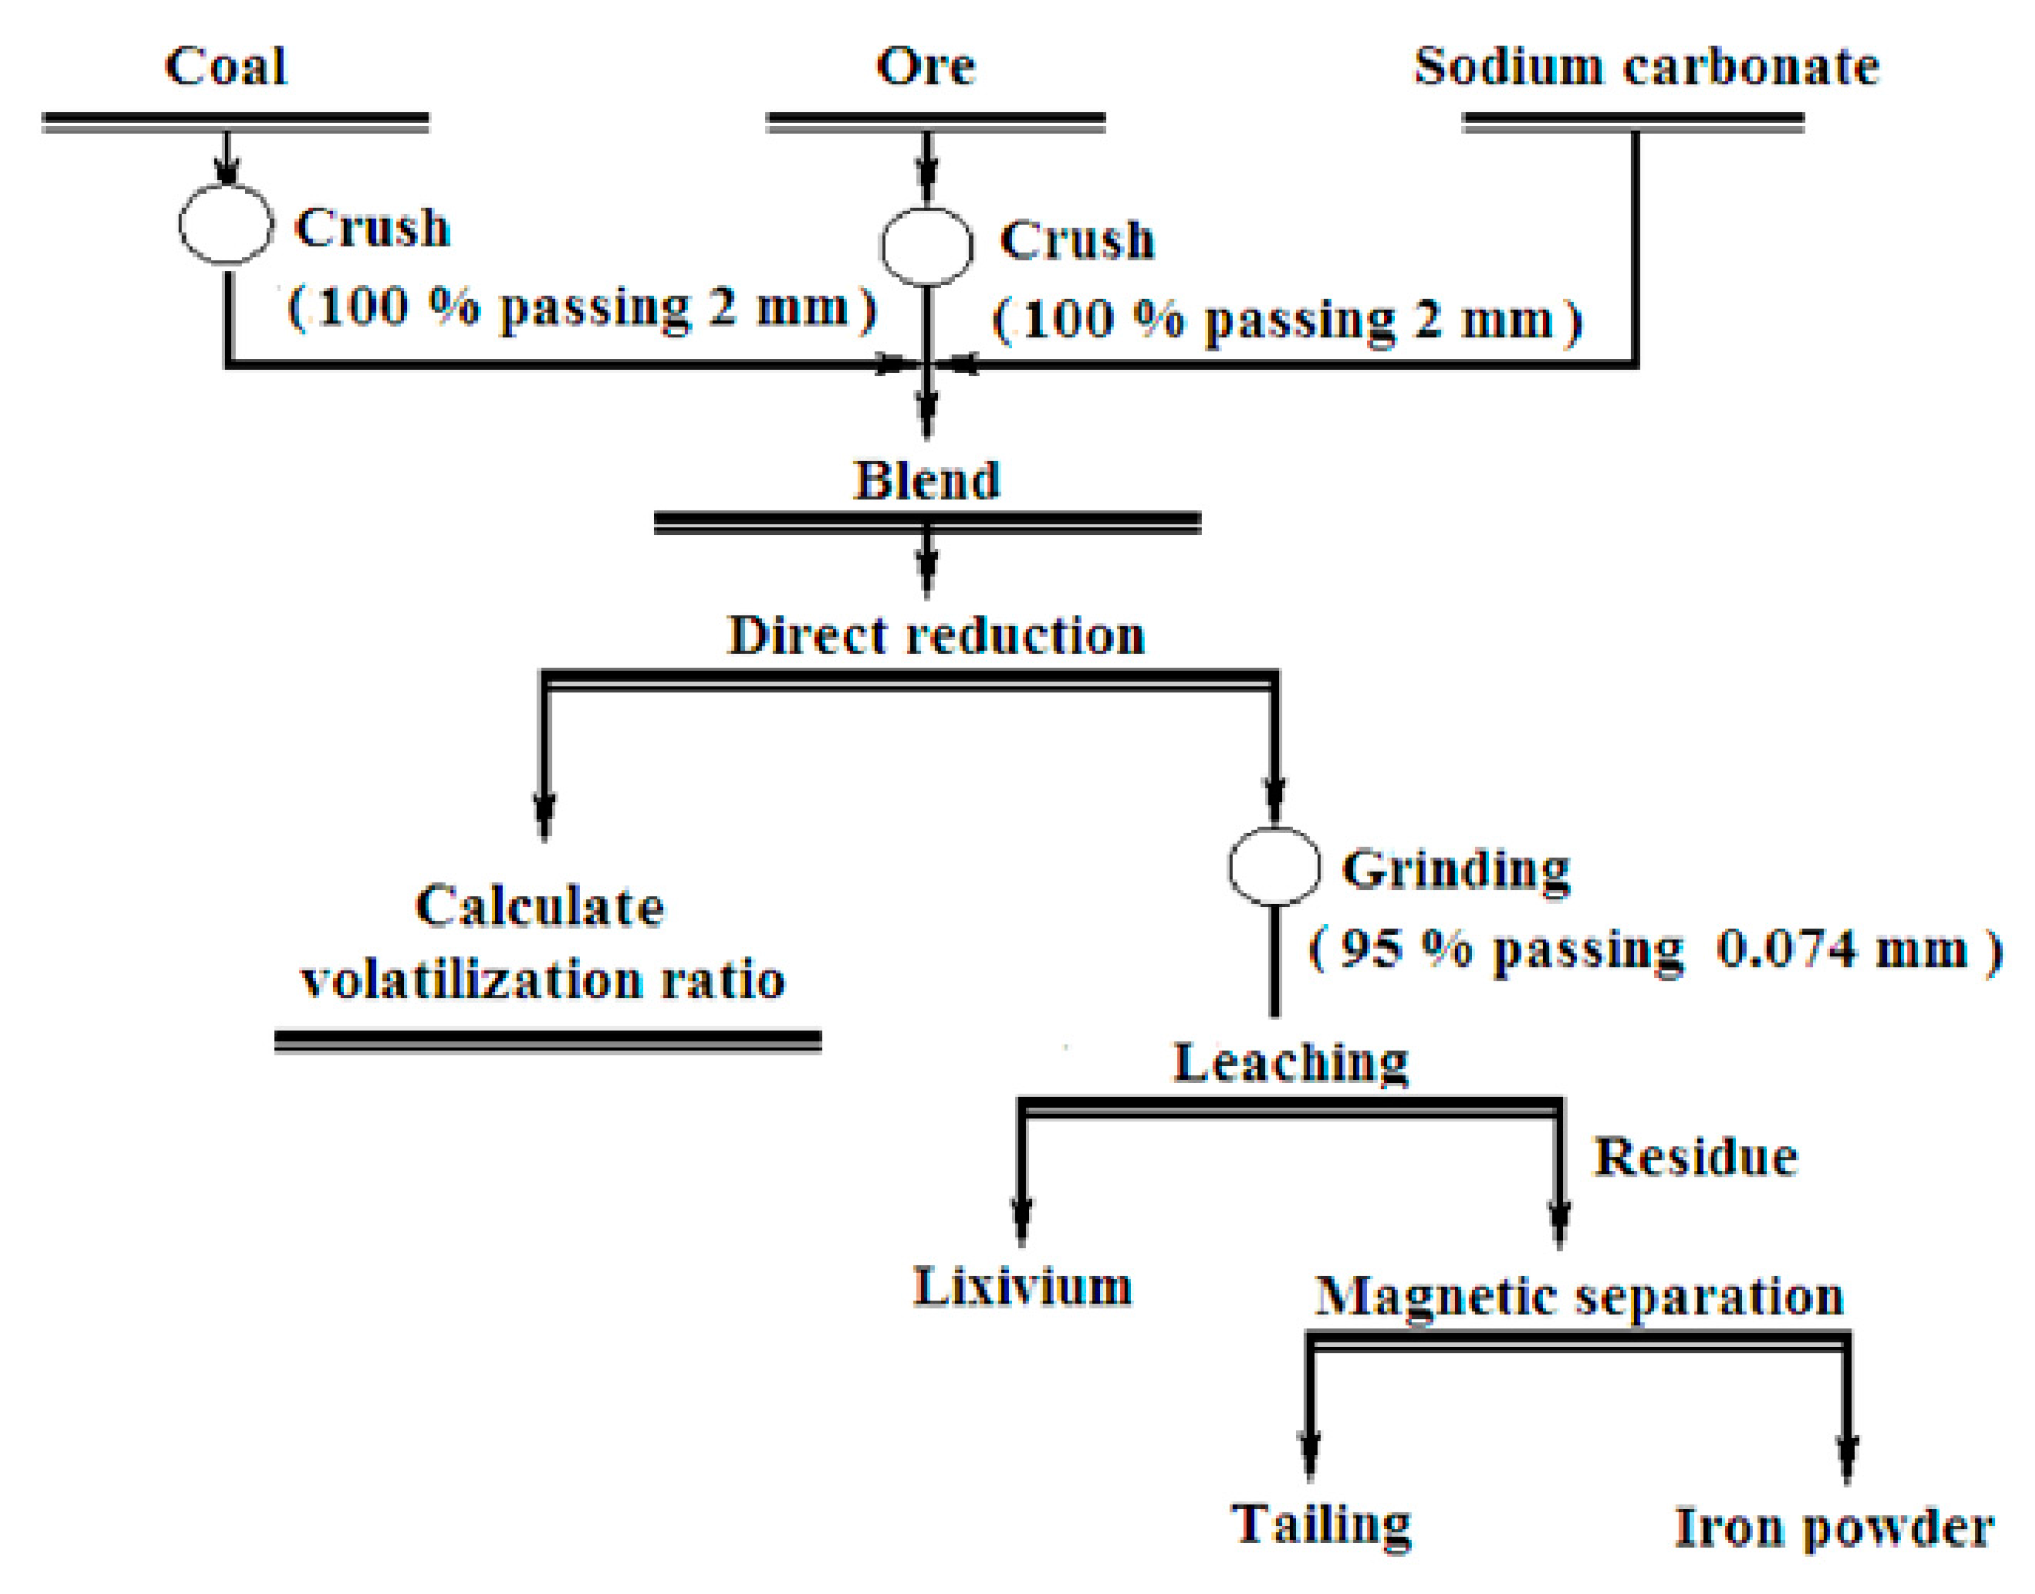
2.3. Experimental Methods
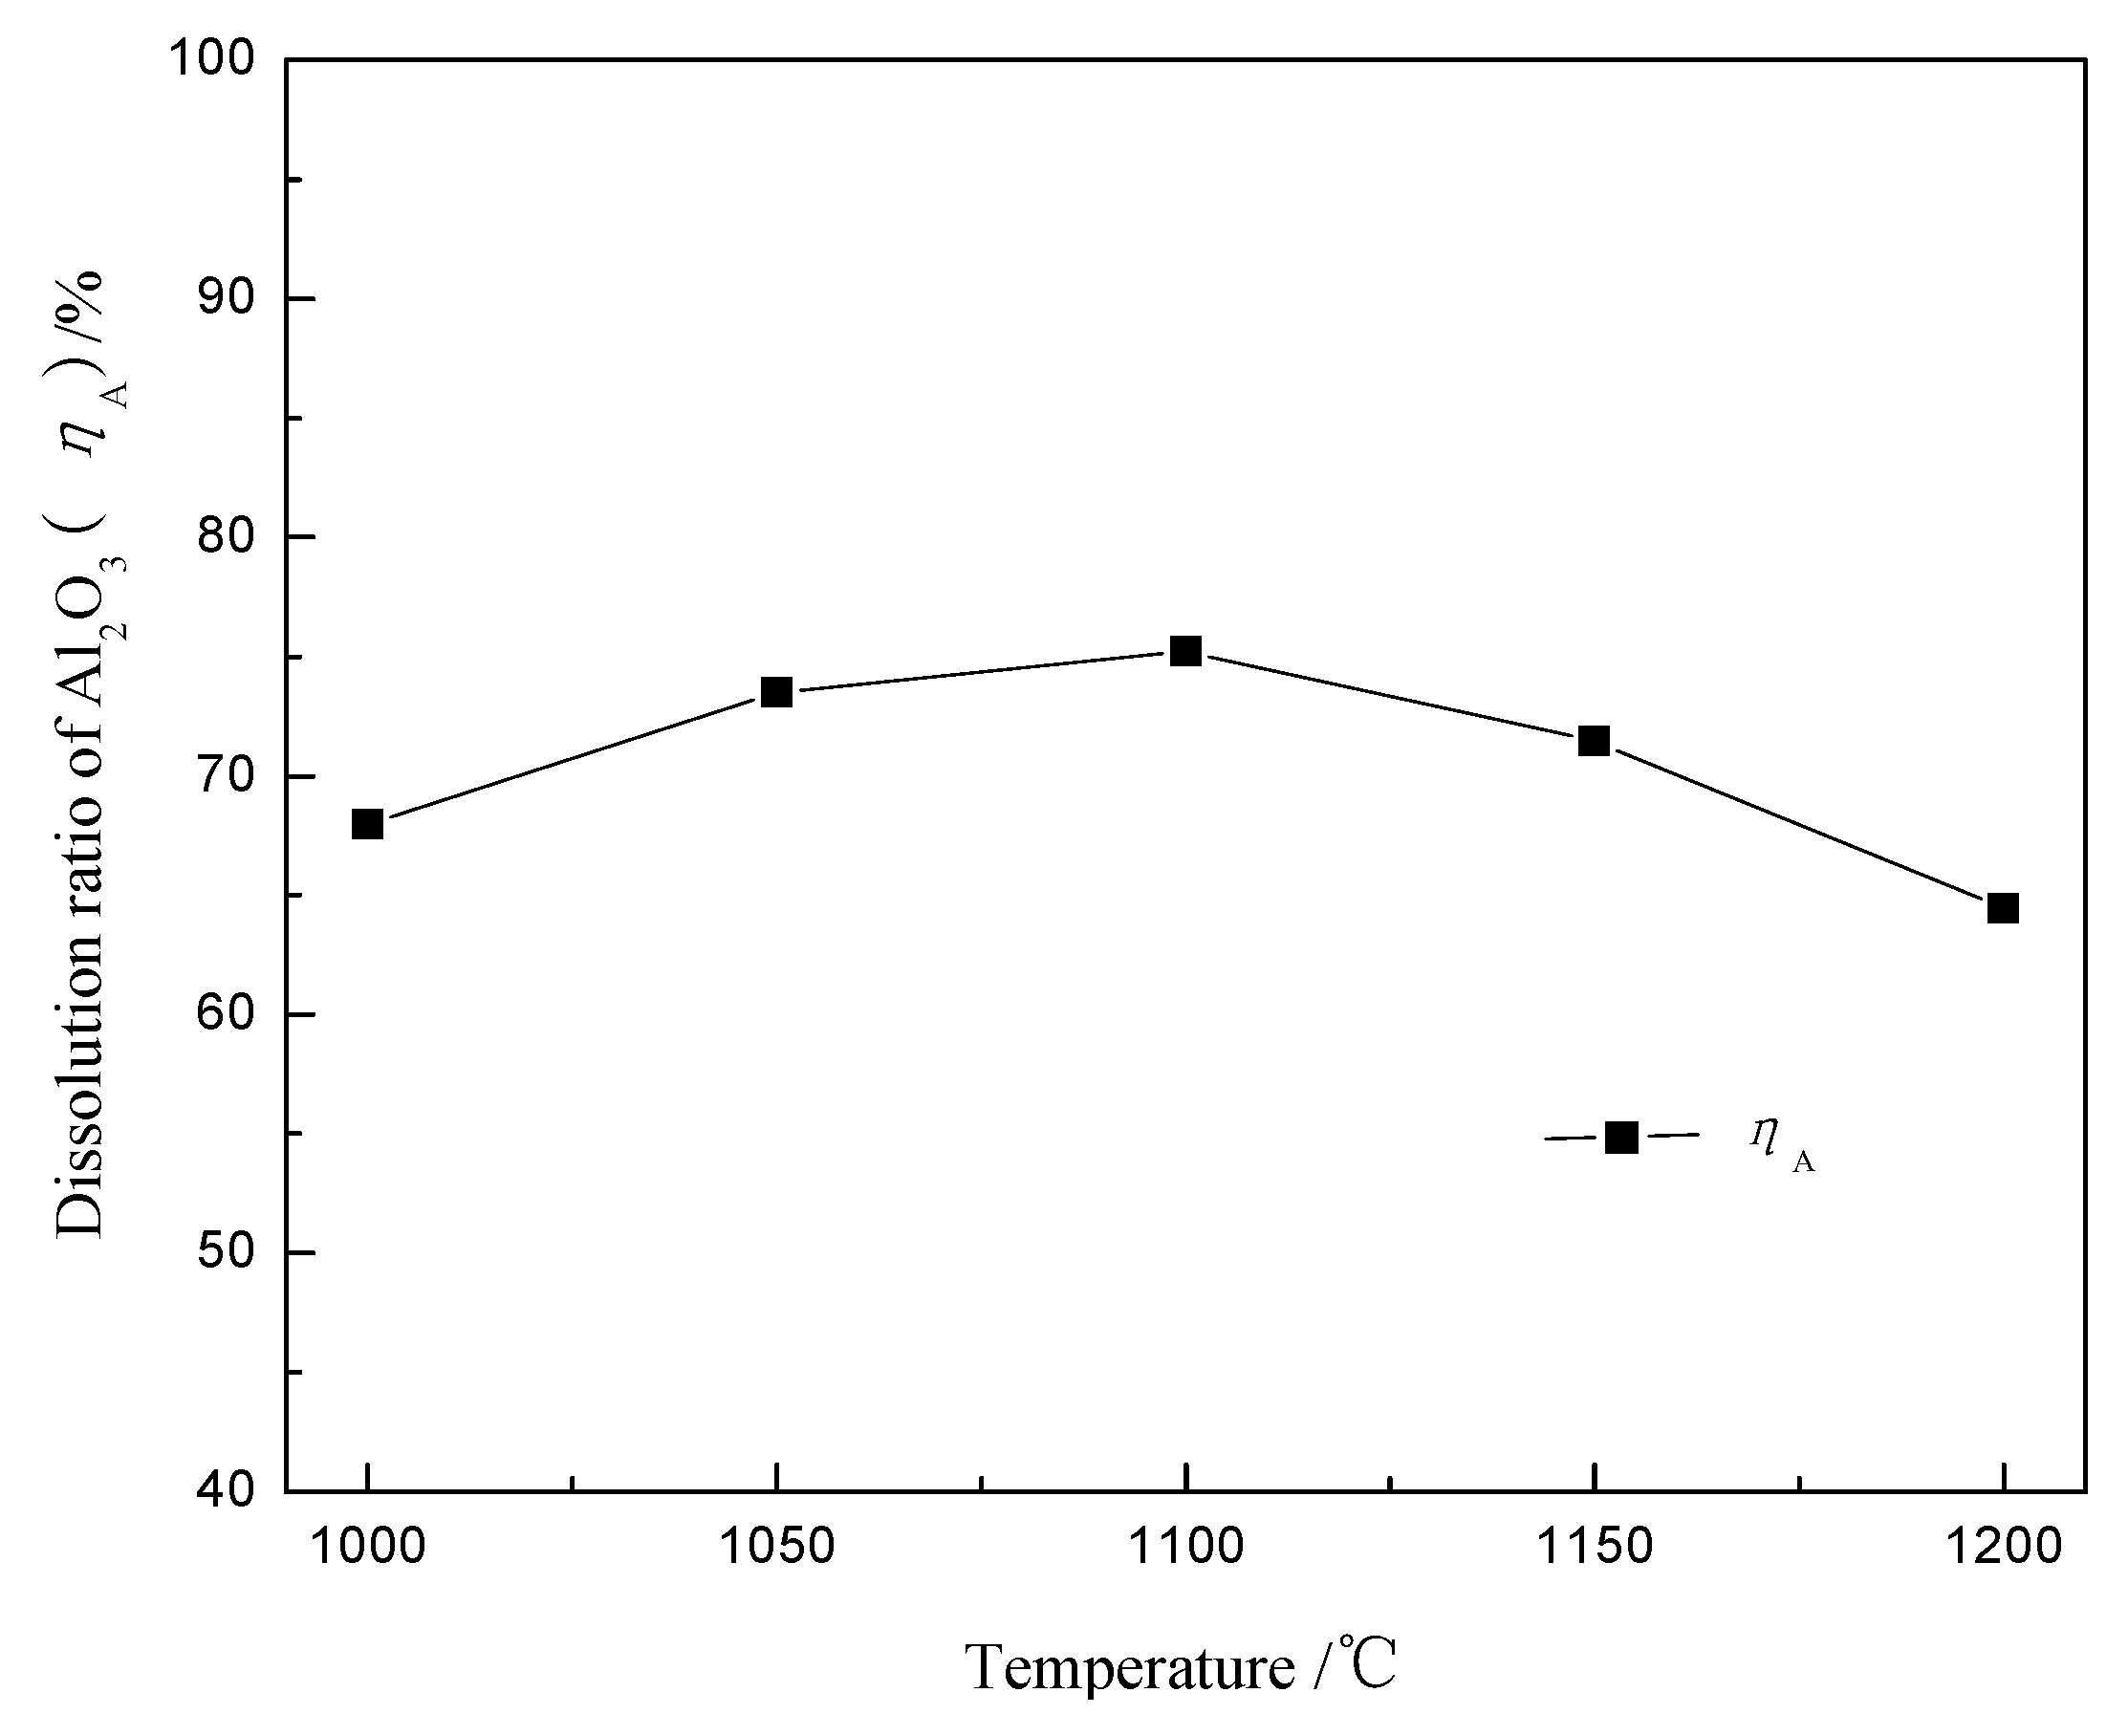
- ηA, the leaching yield of alumina, %;
- c, the aluminum oxide concentration of pregnant leach solution, g/L;
- Vol, the volume of pregnant leach solution, L;
- M, the mass of ferric bauxite adopted in each unit experiment, g;
- ω, the mass fraction of Al2O3 in ferric bauxite, %.
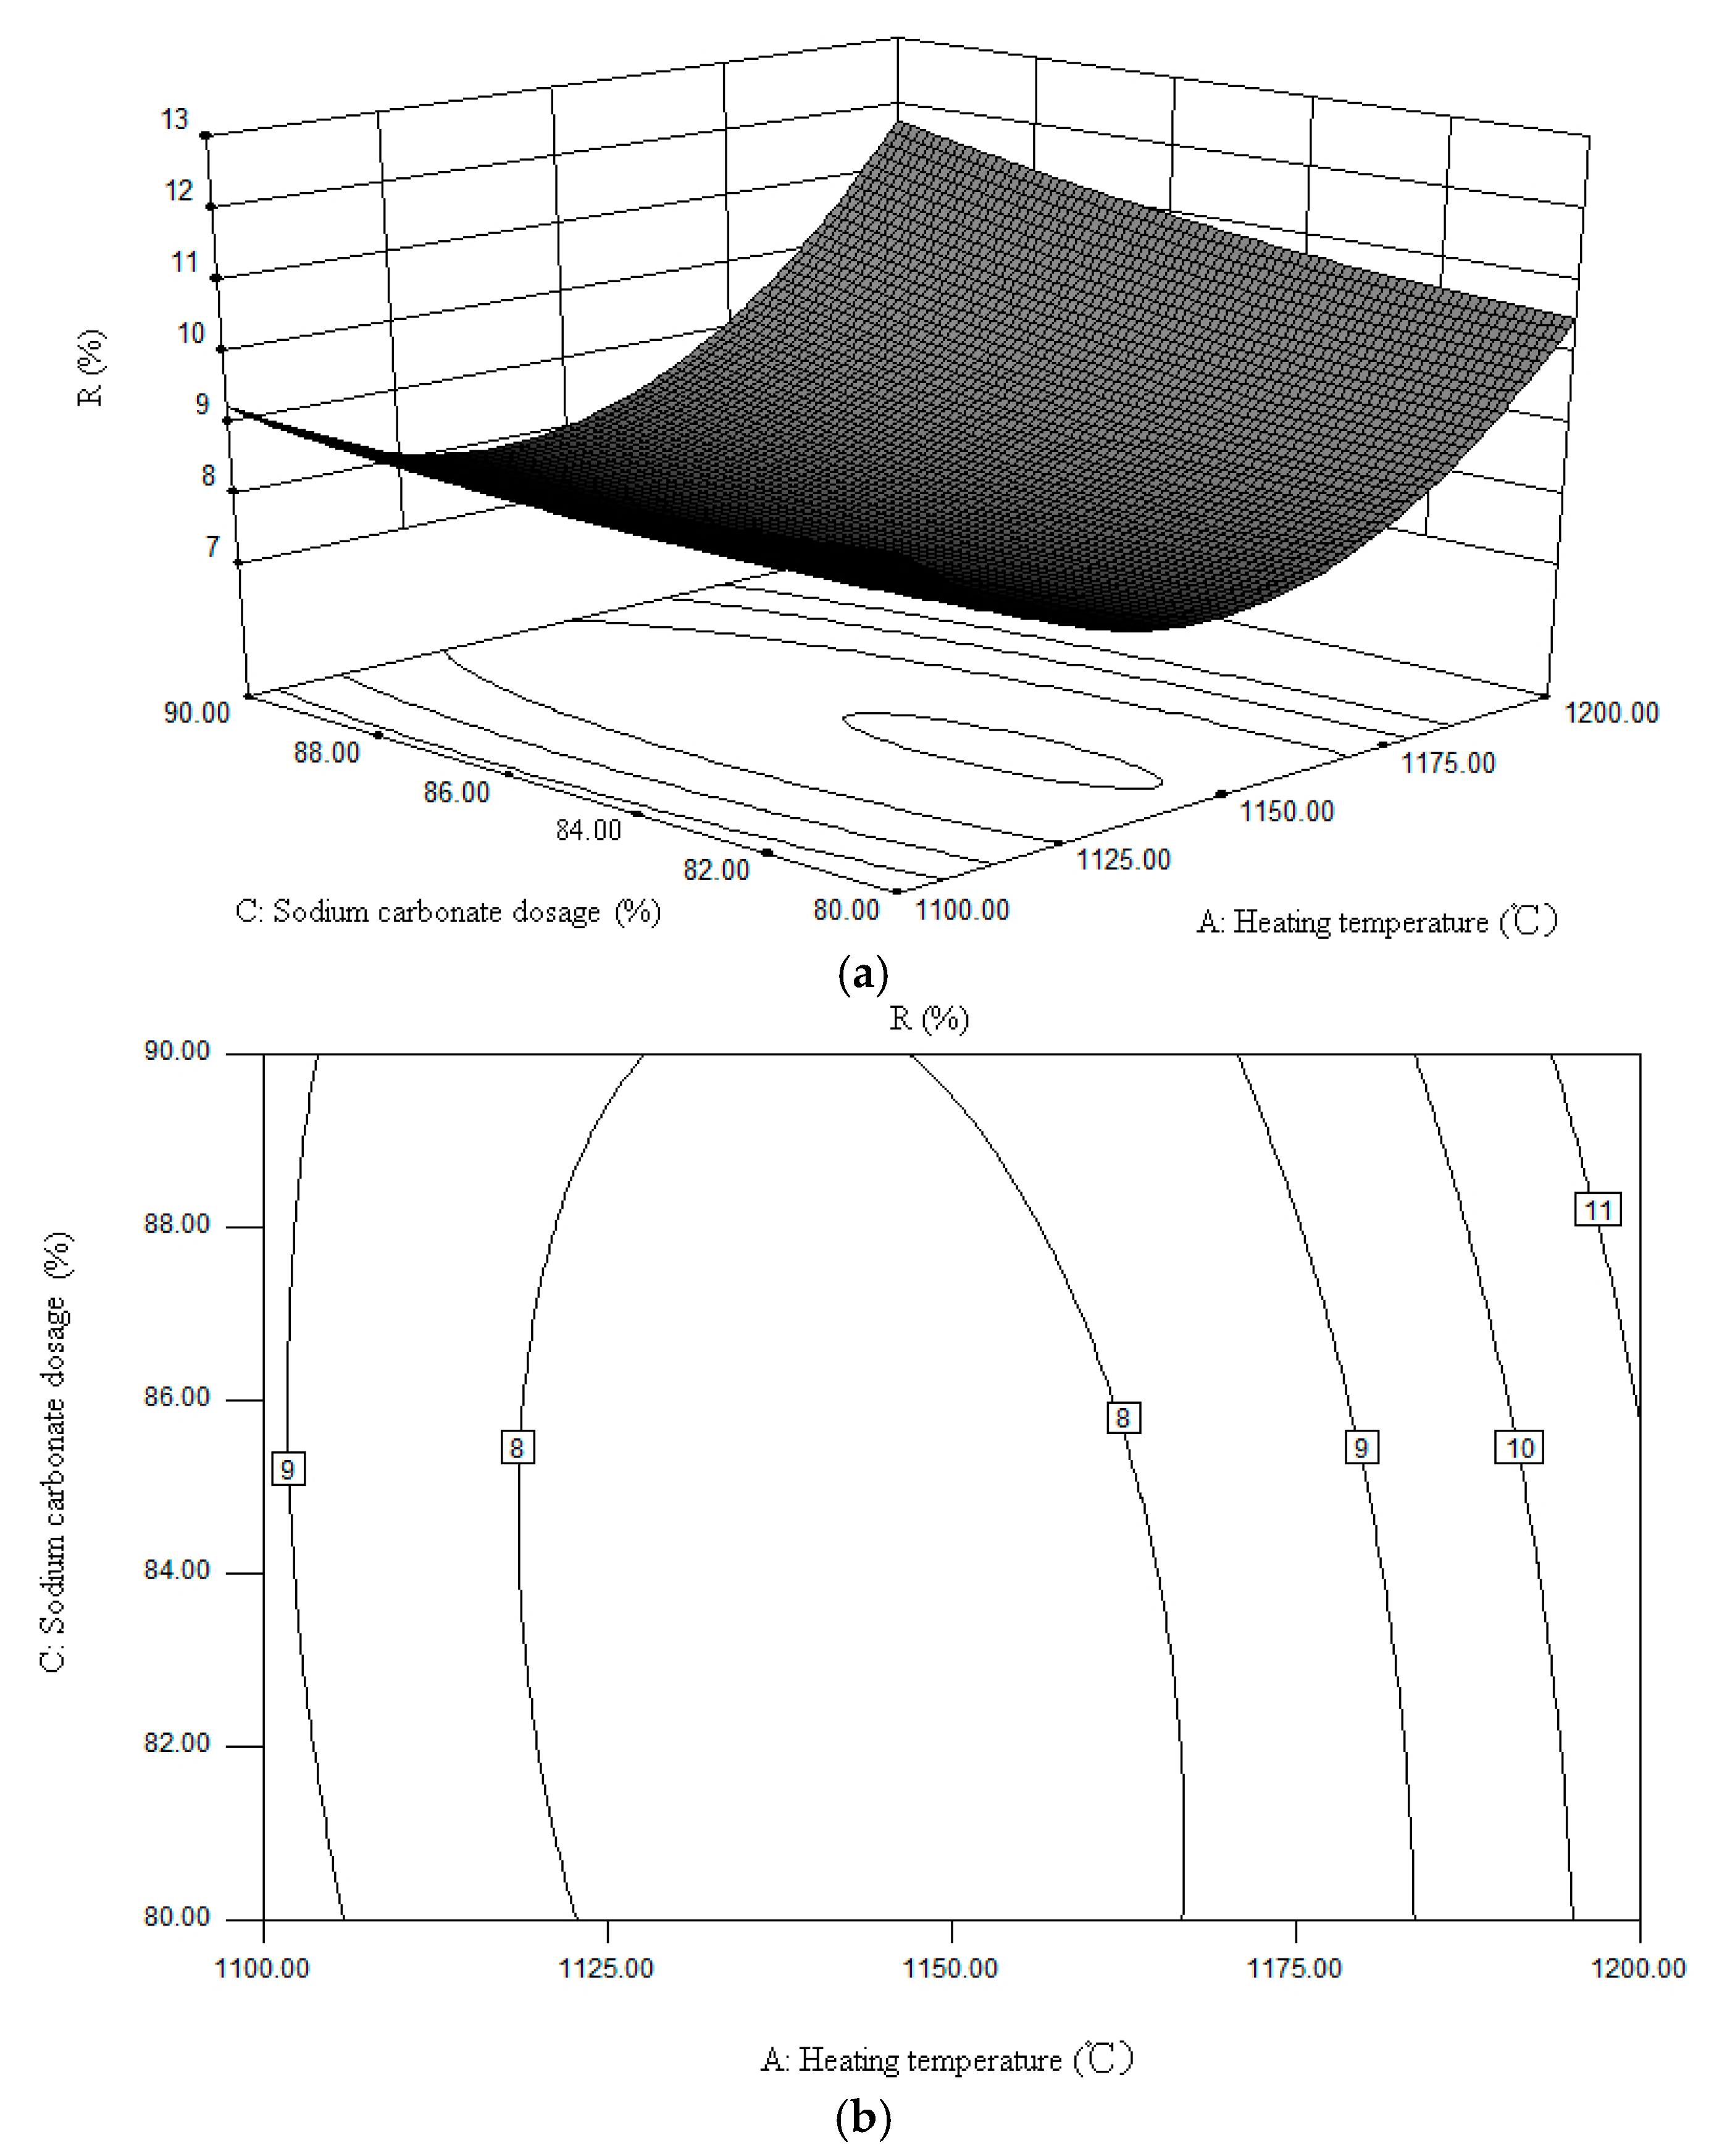
- R, the sodium volatilization ratio, %;
- Q1, the evaporated sodium infiltrated into crucible, g;
- Q, the sodium content in material mixture, g;
- S1, the area of crucible inside surfaces contacted with the material, cm2;
- S2, the area of crucible inside surfaces non-direct contacted with the material, cm2.
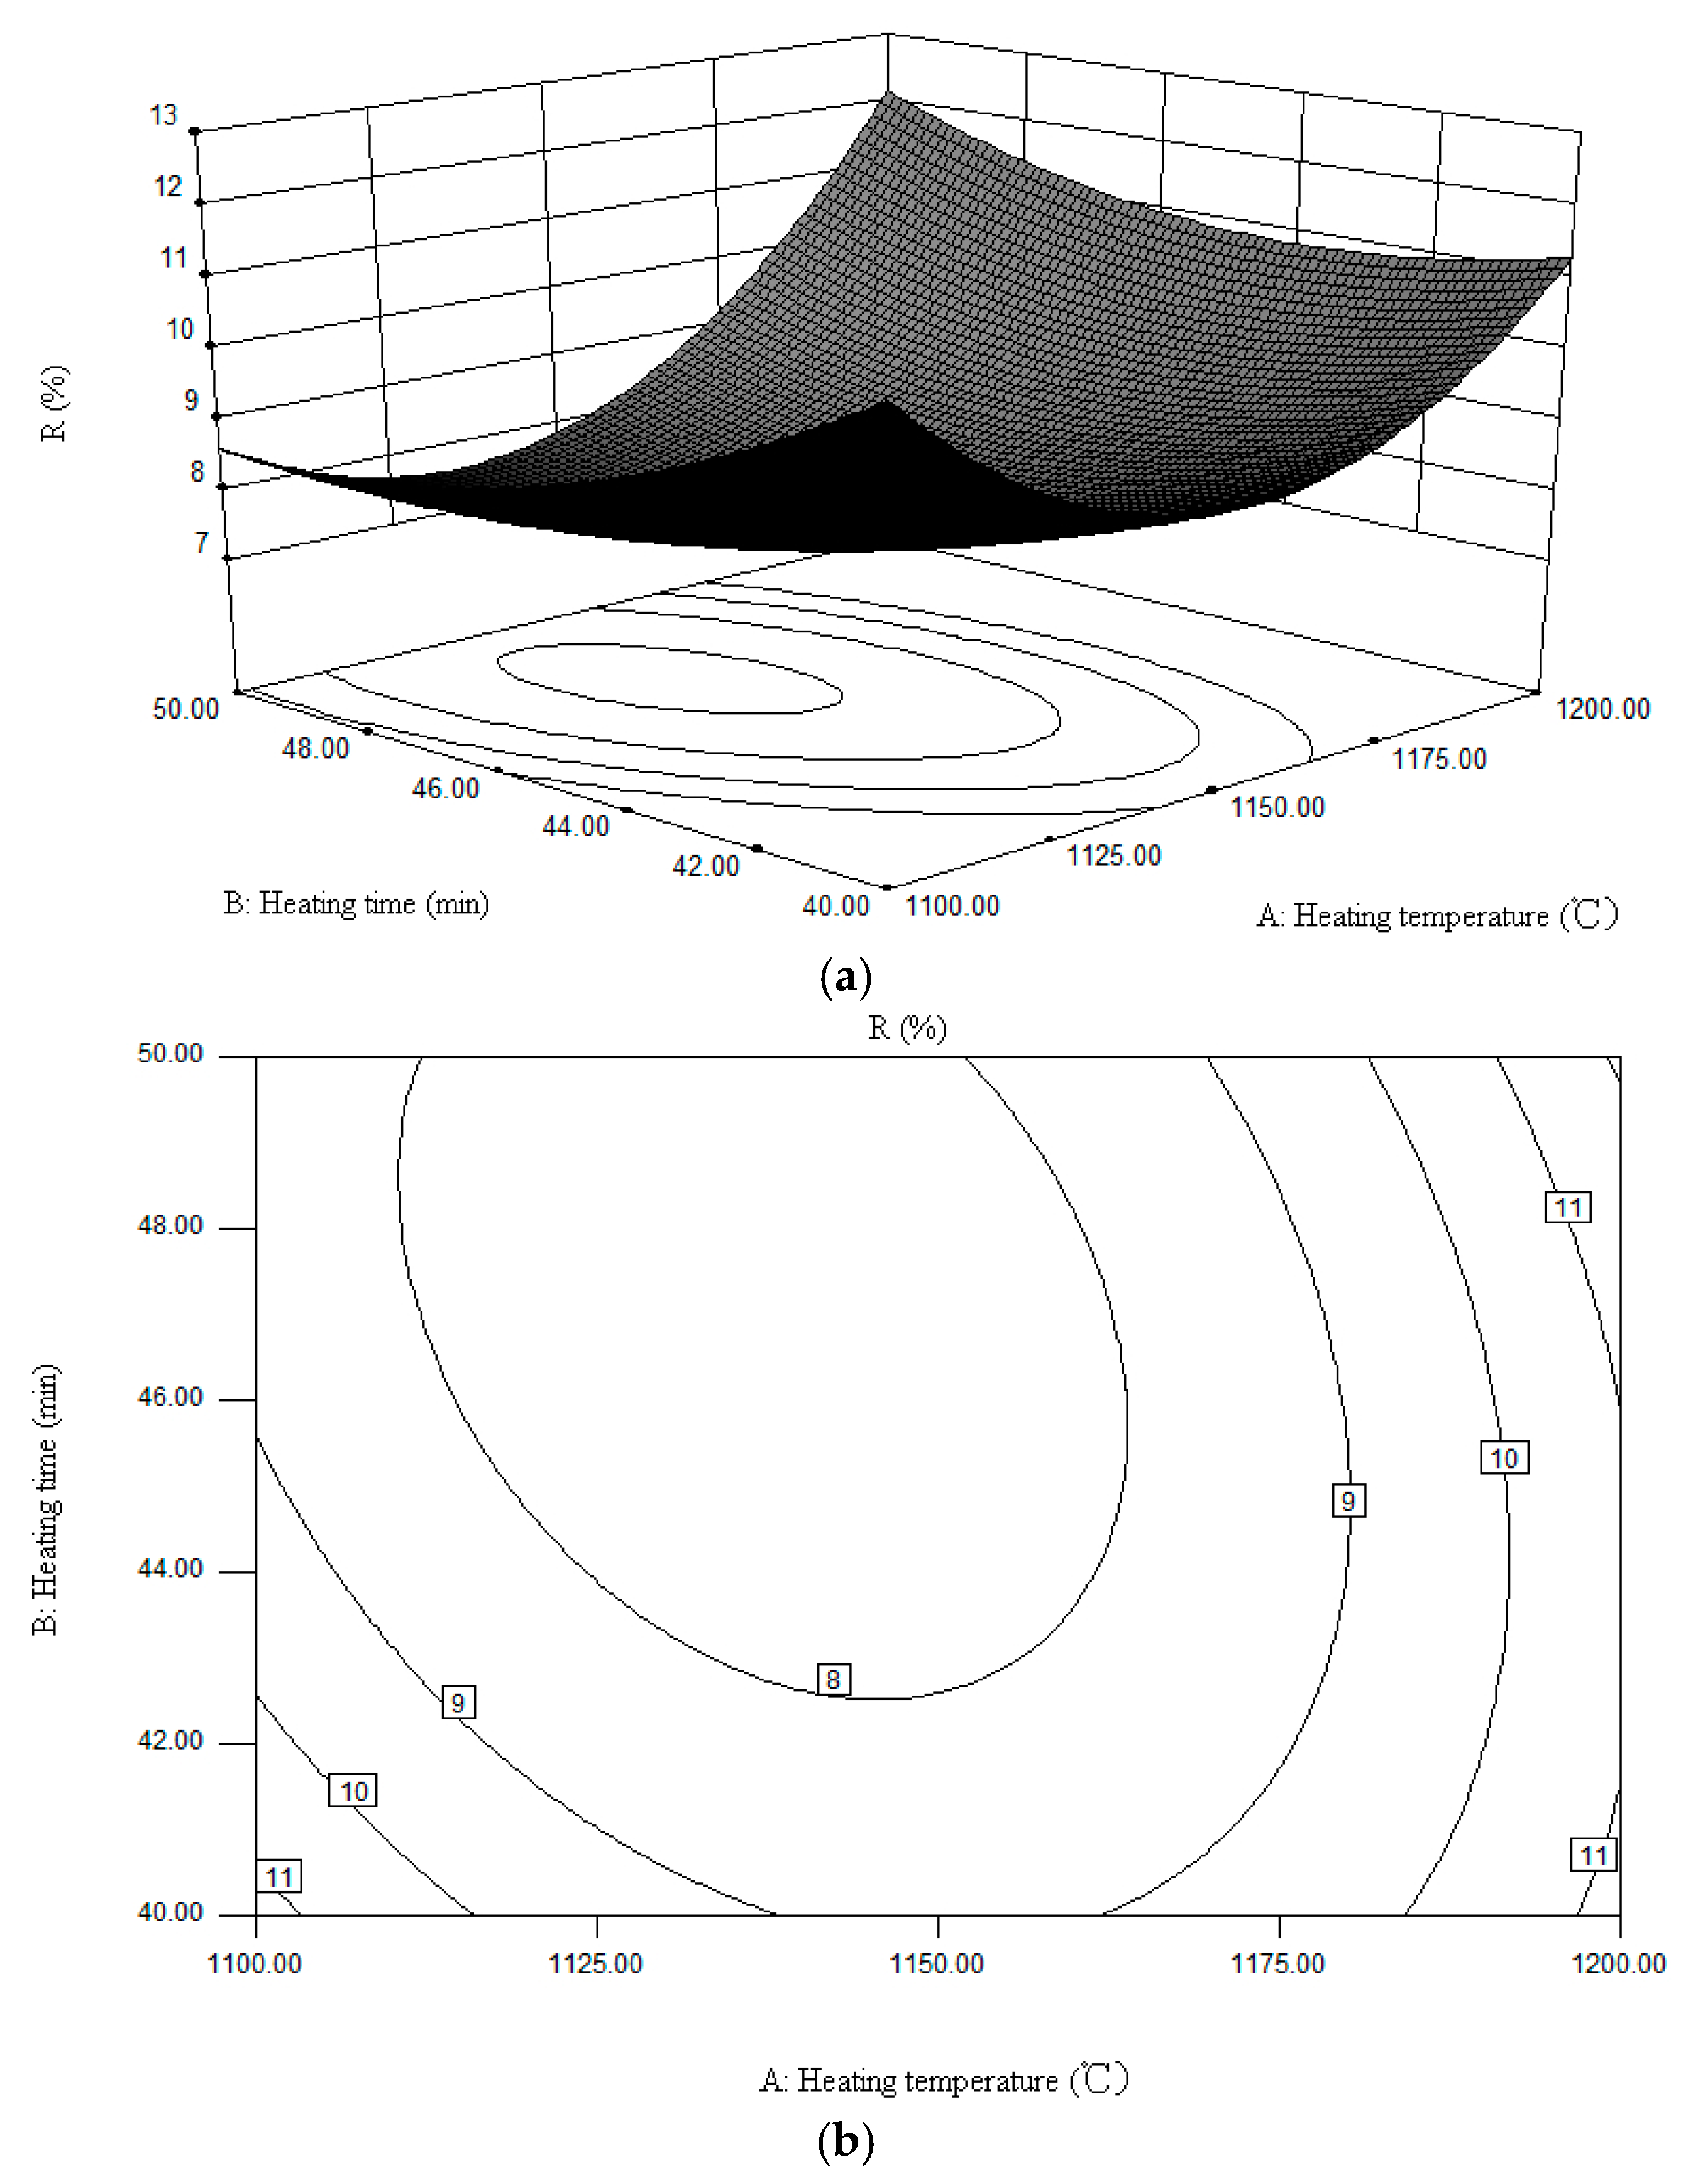
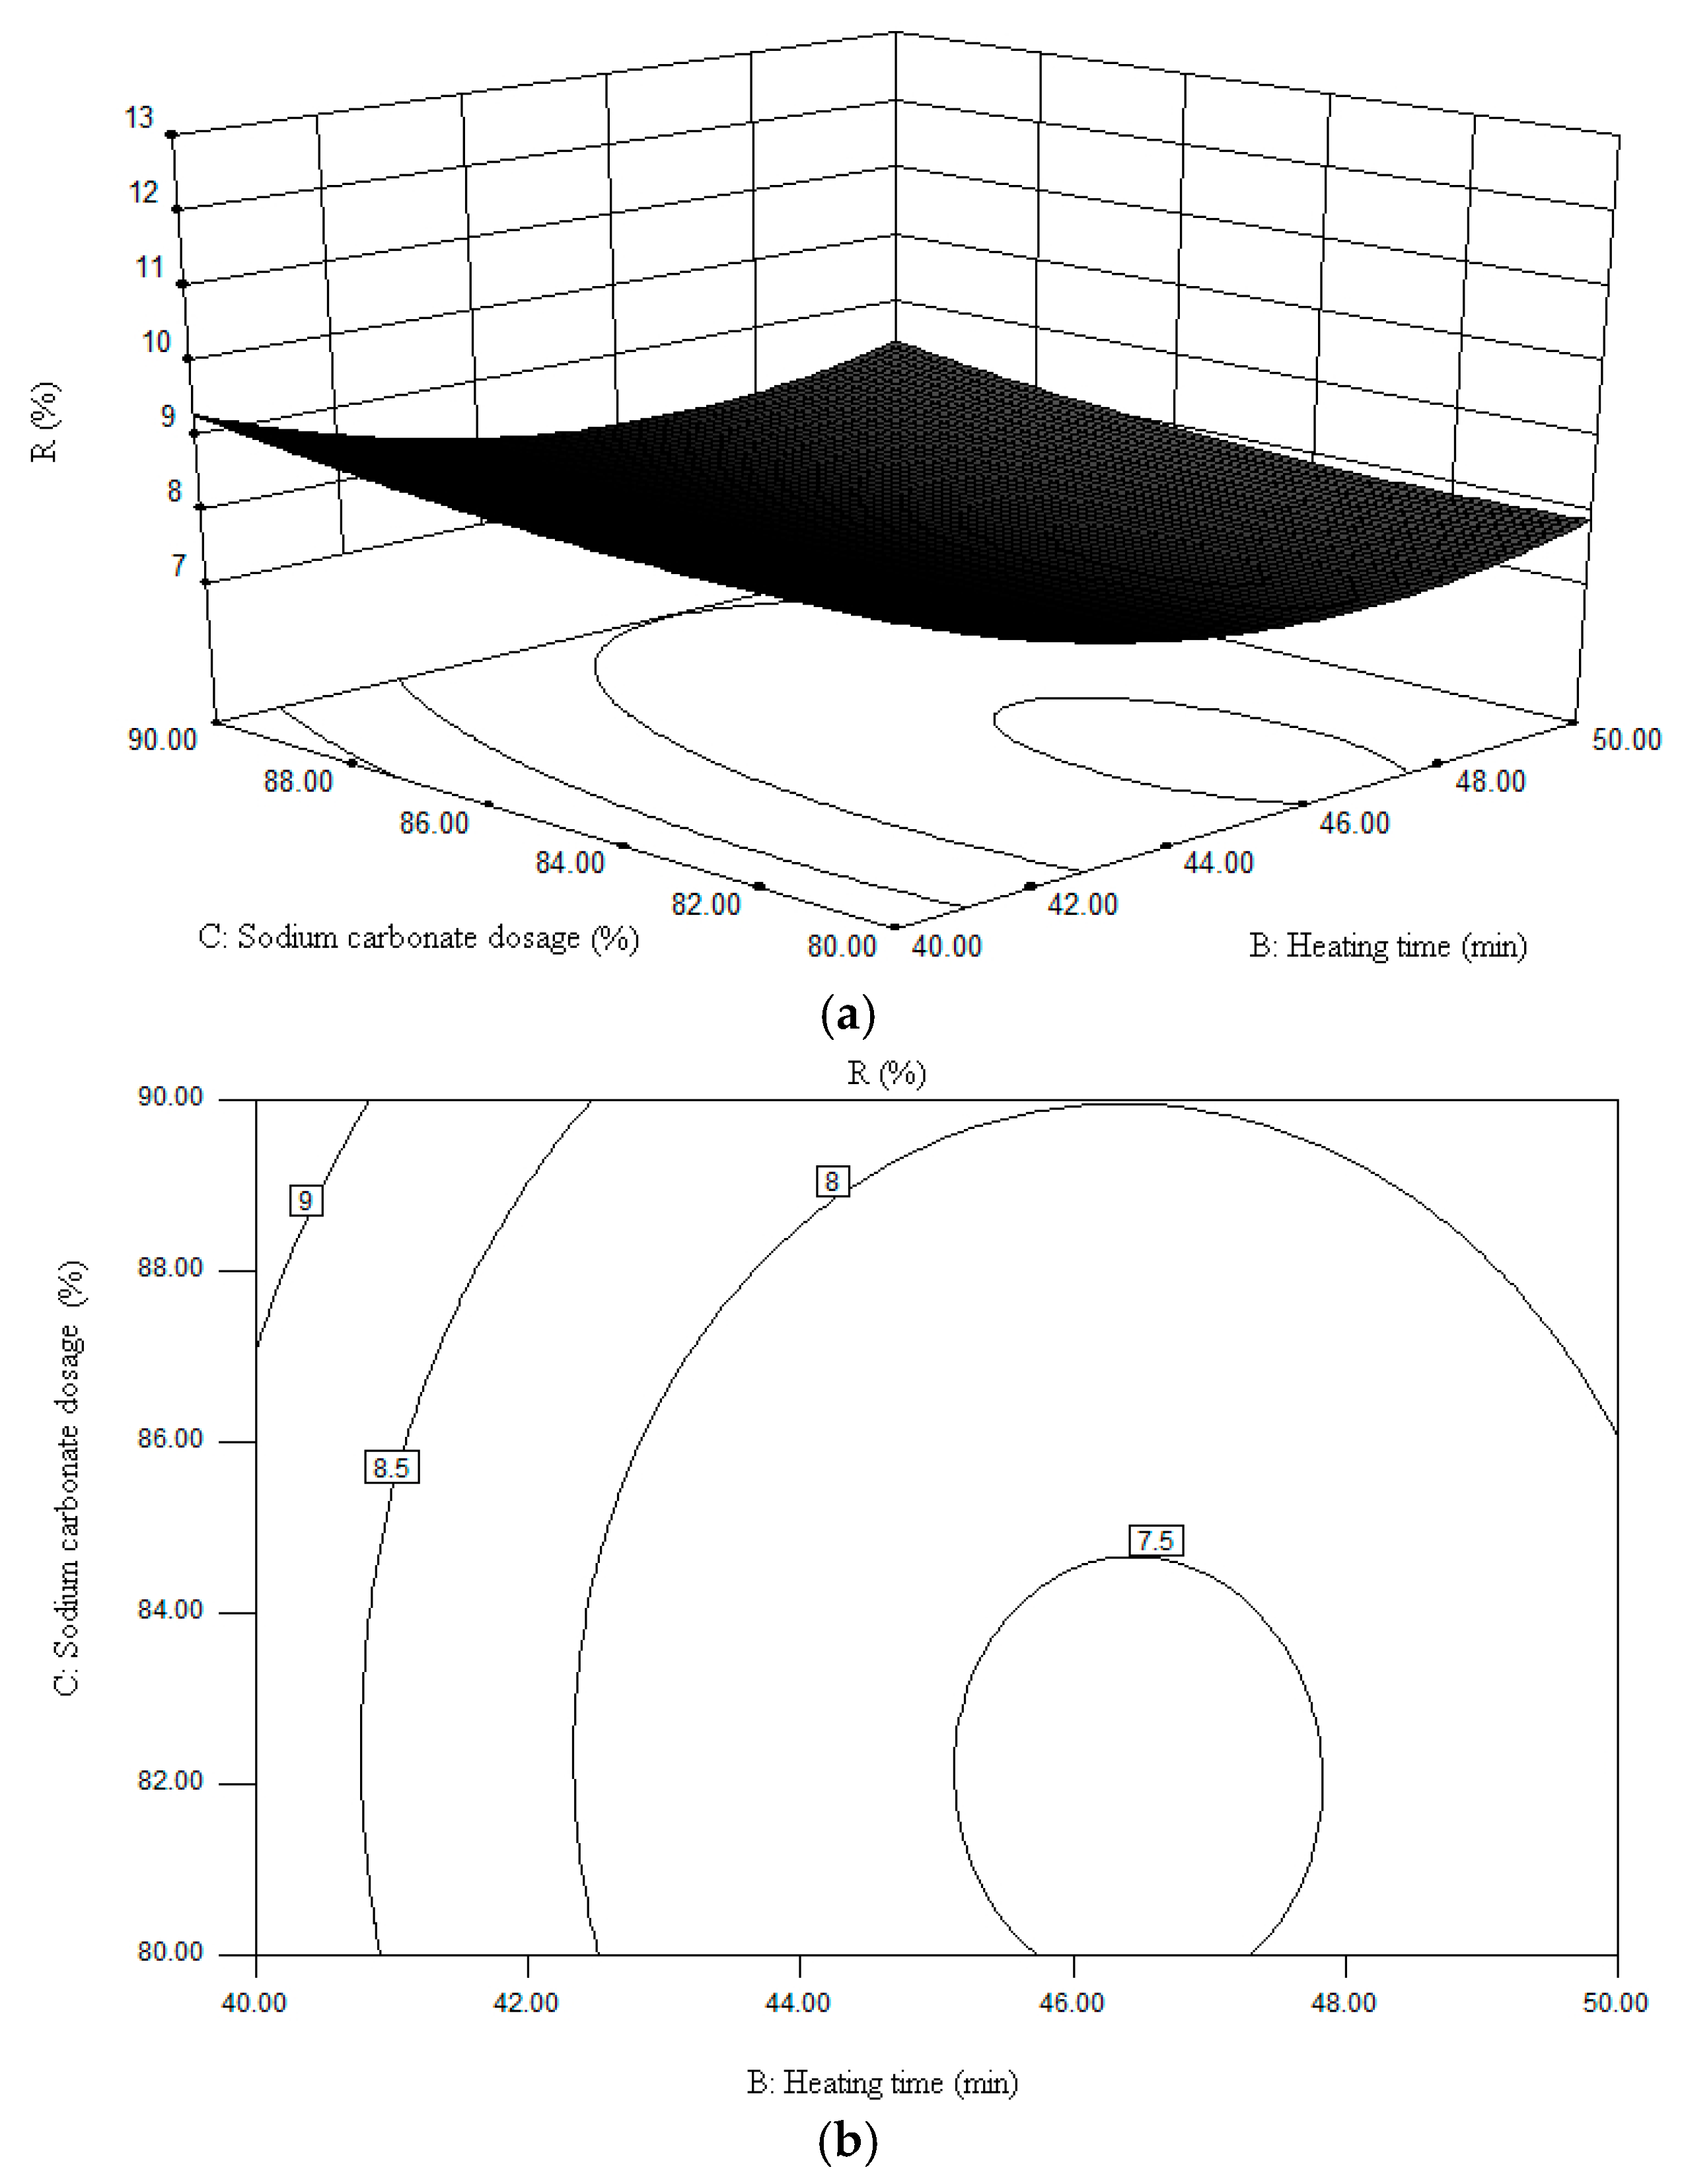
3. Factors Affecting Sodium Volatilization
4. The Verification Test and the Possibility of Separation of Iron
4.1. Alumina Leaching and Sodium Volatilization
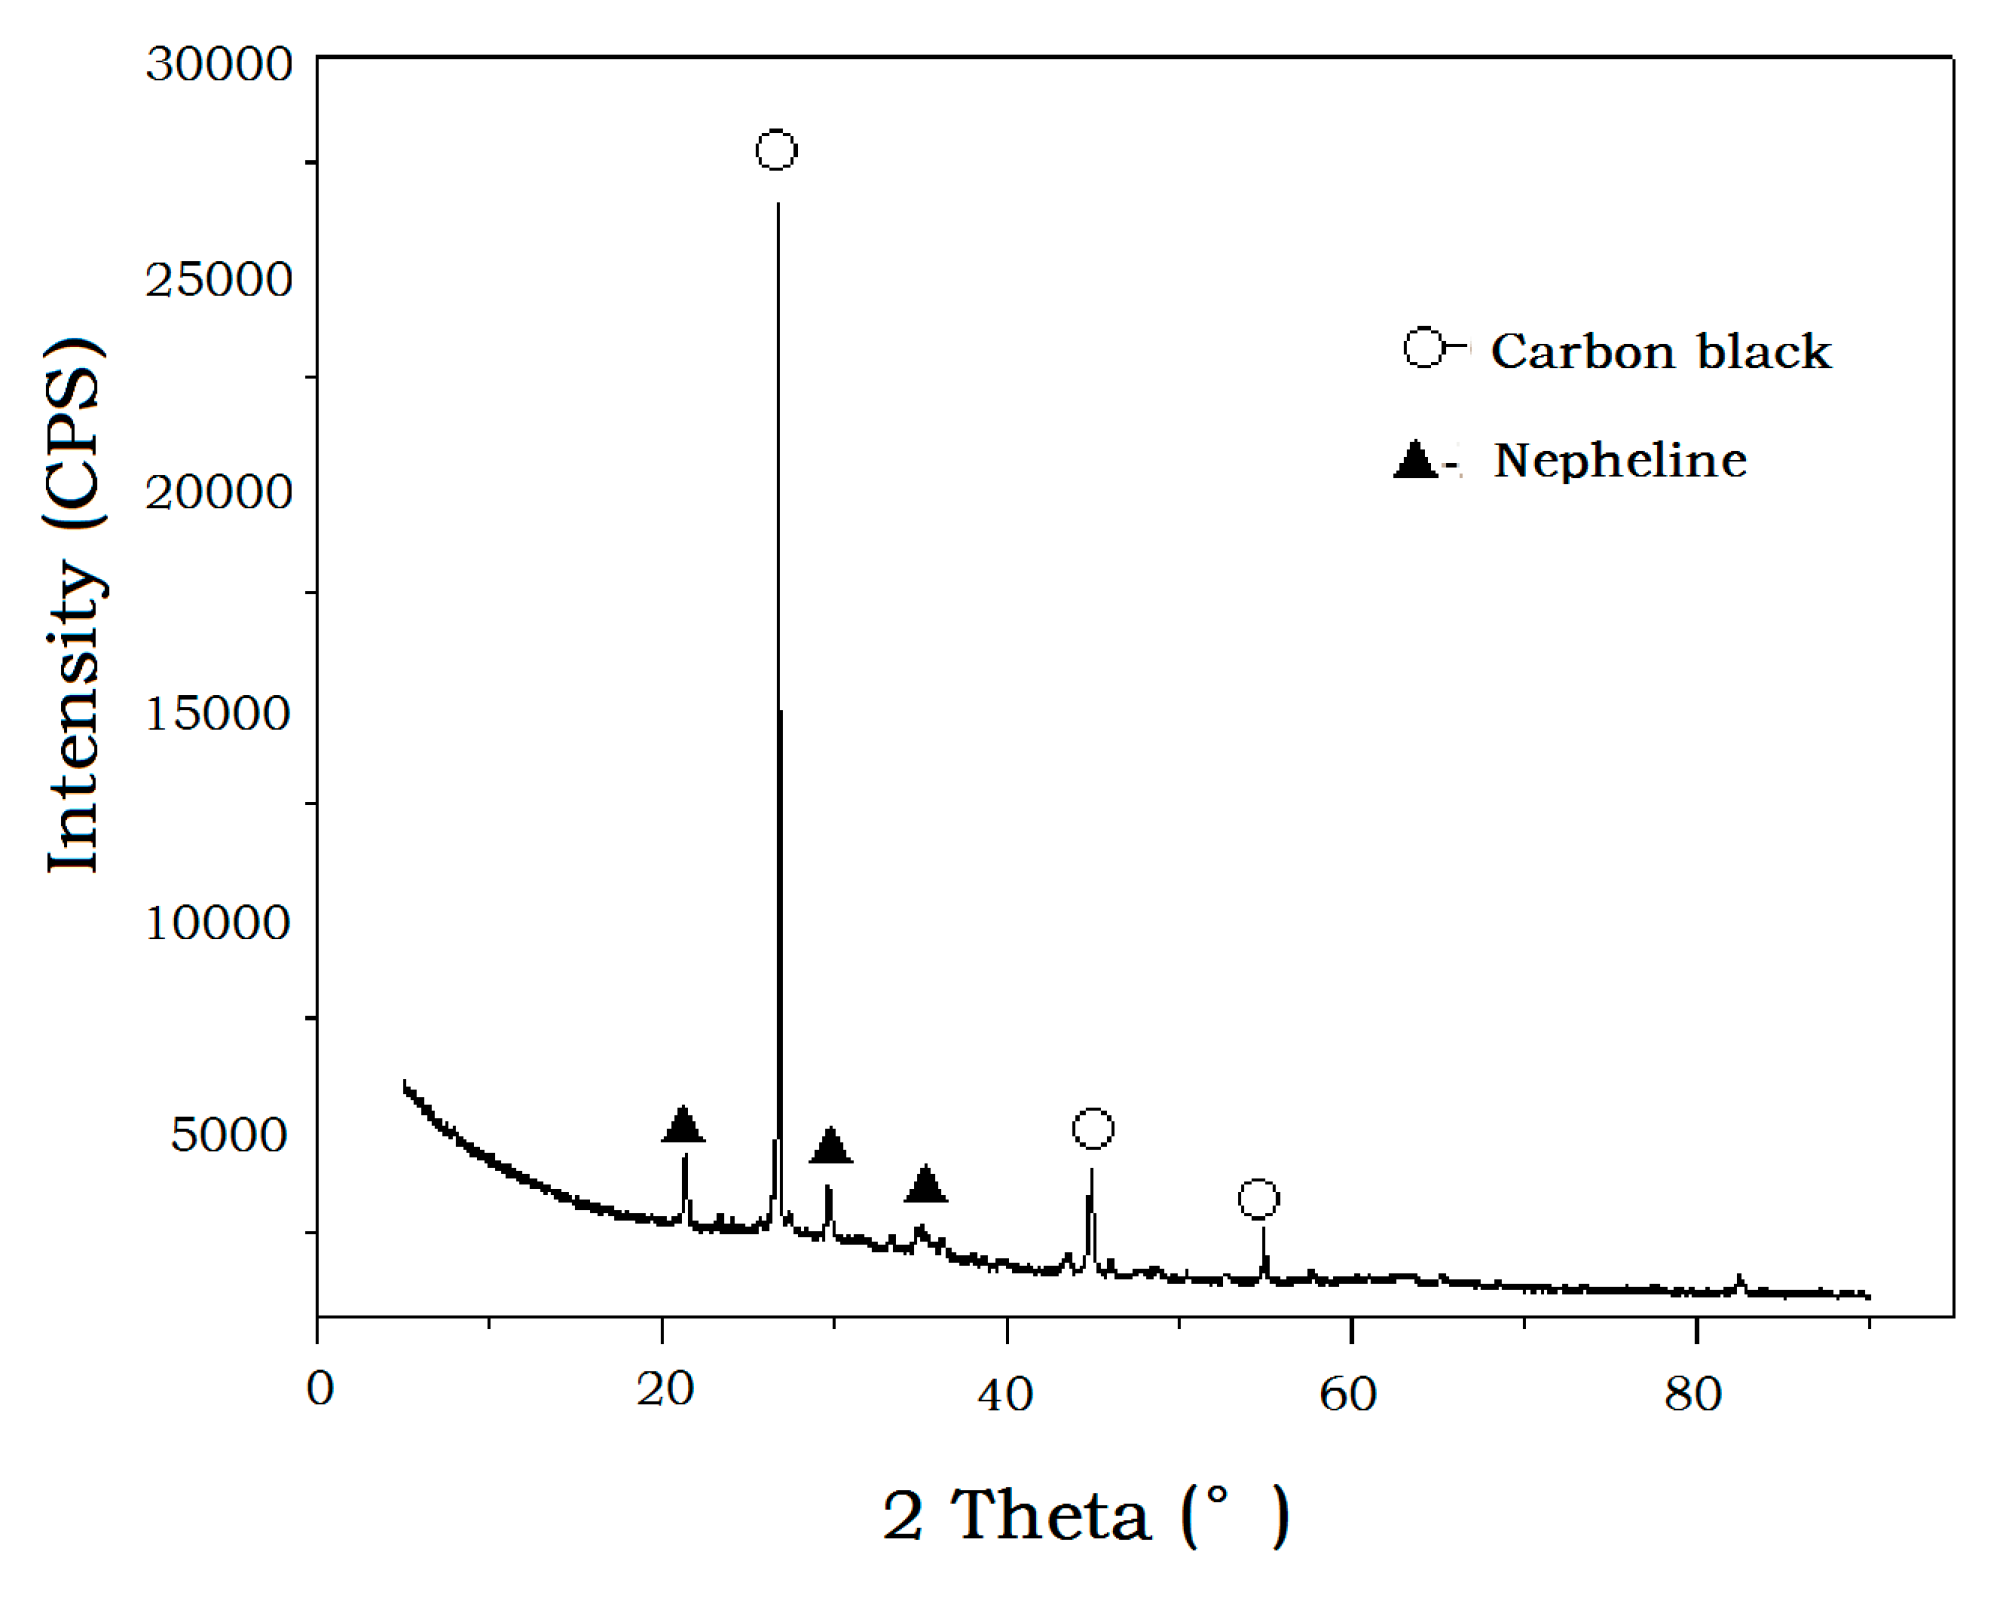
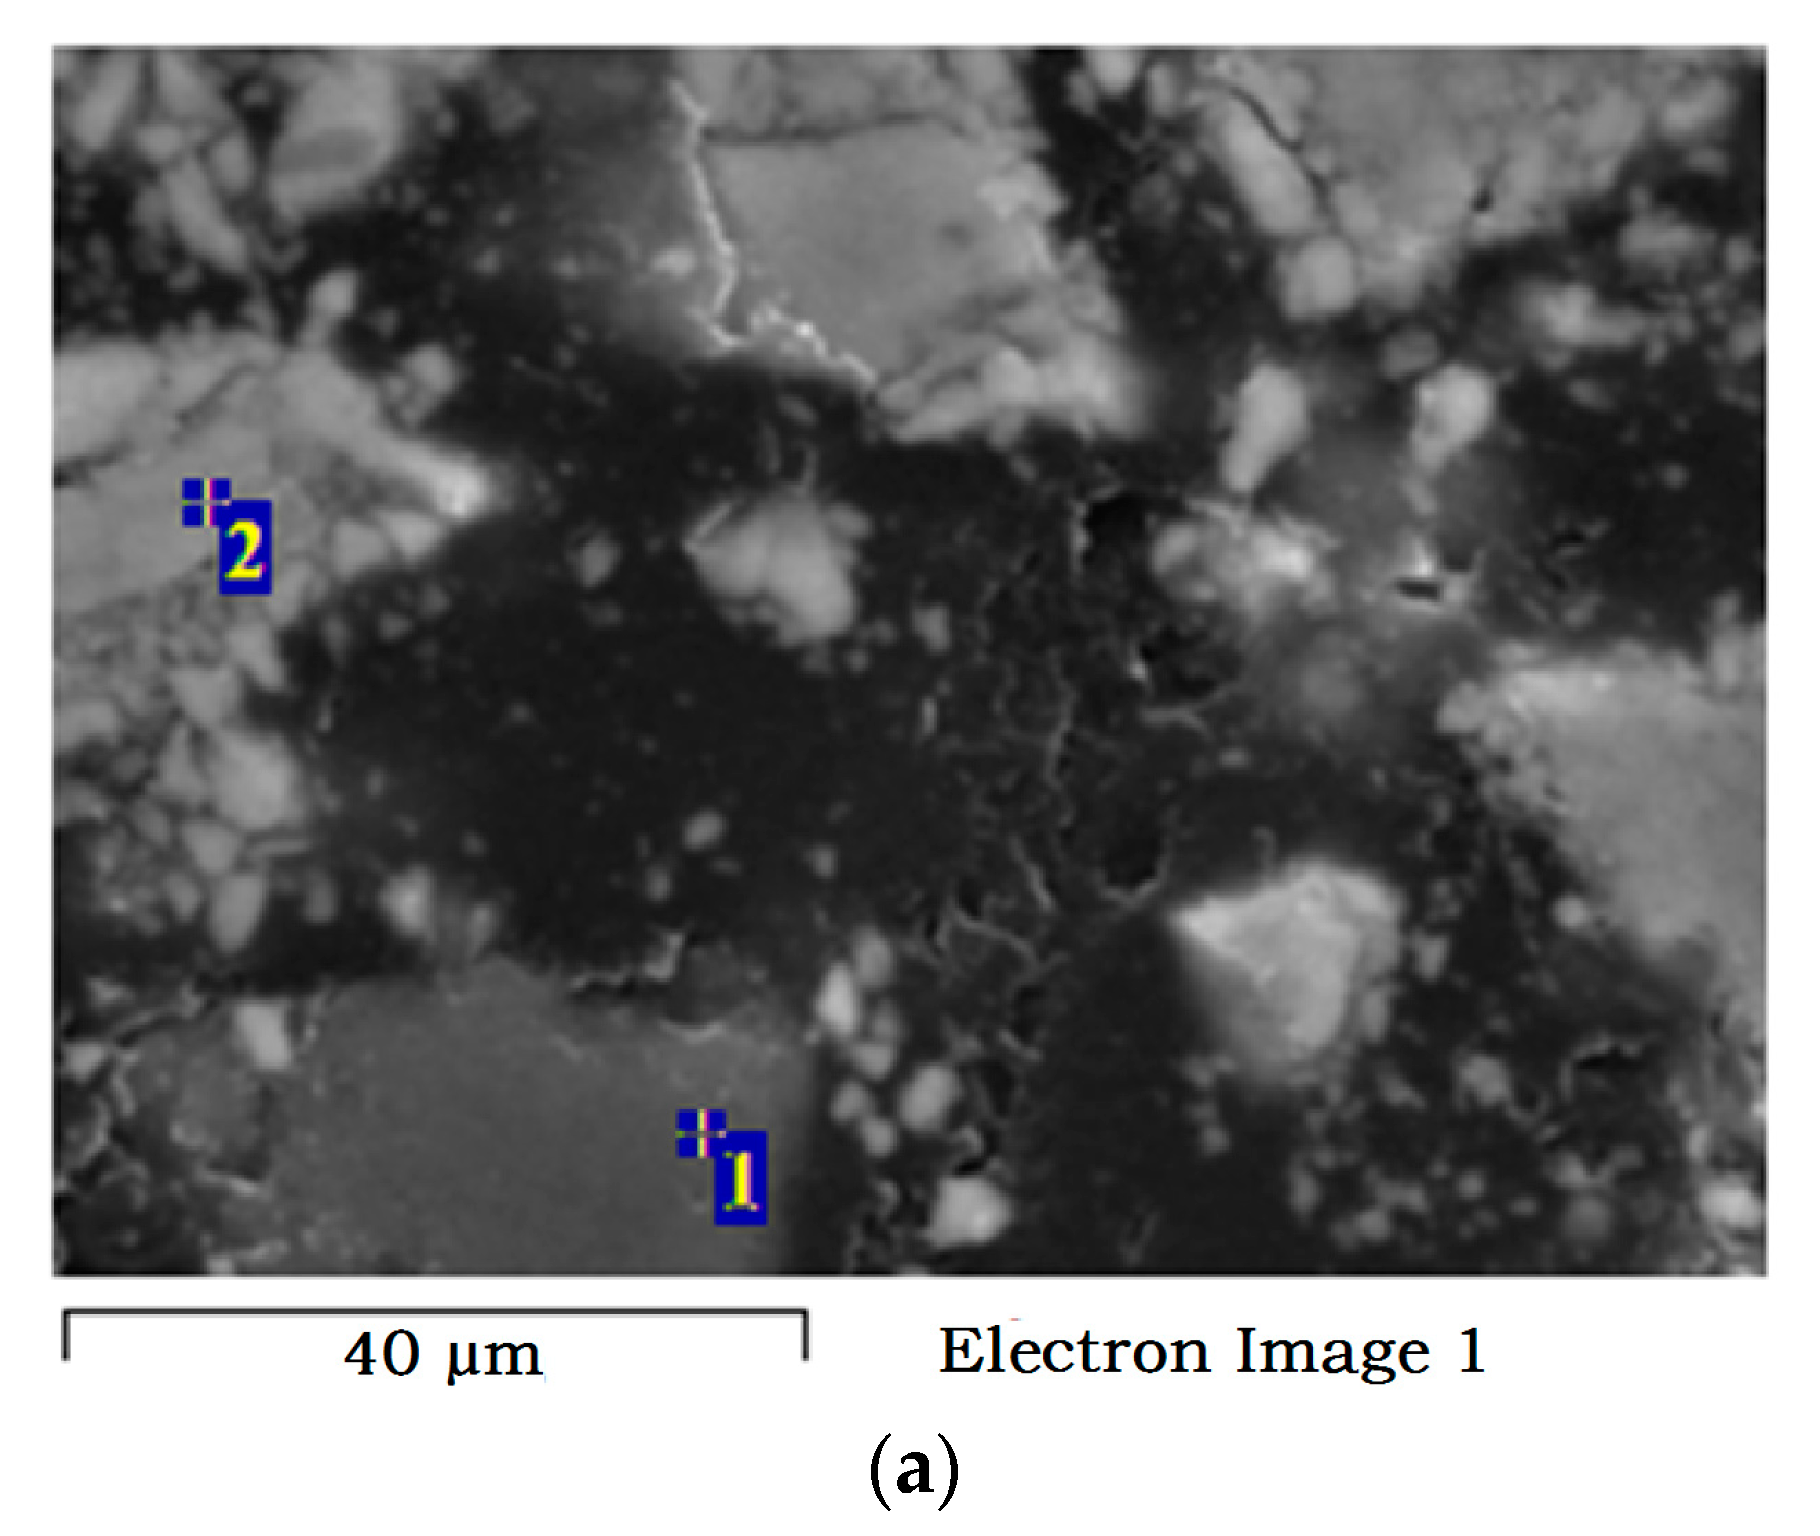
4.2. Tailing
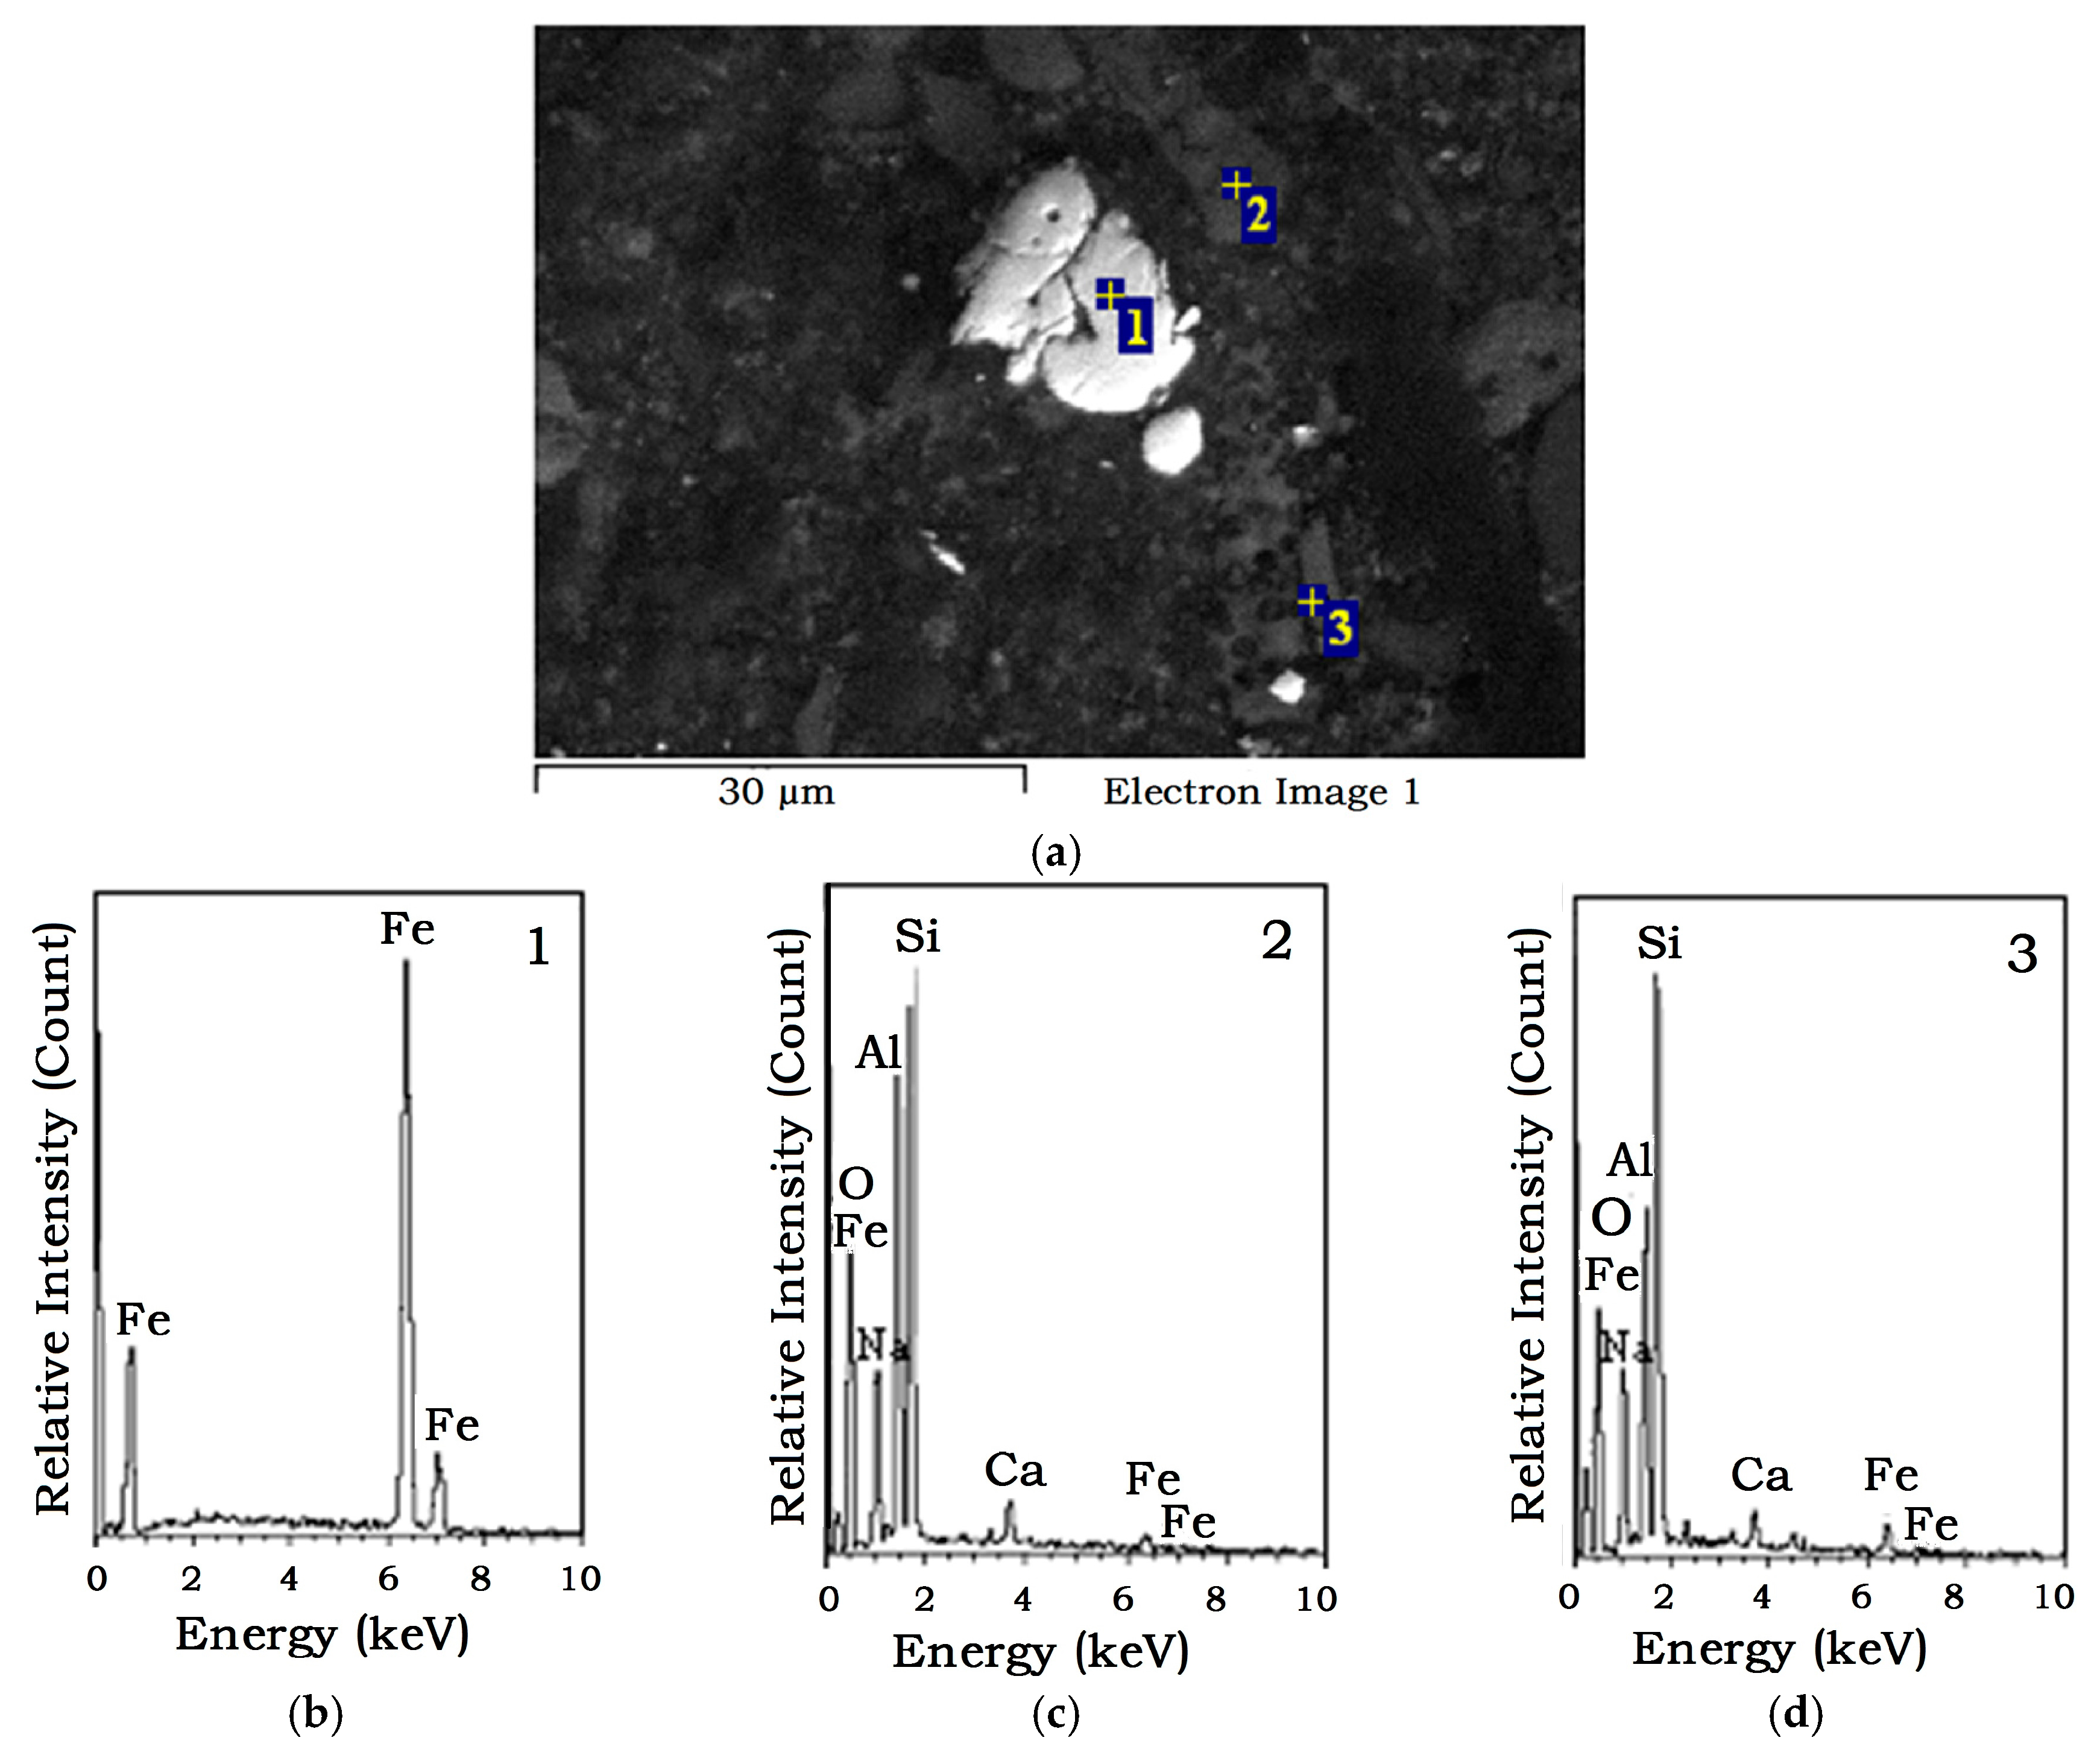
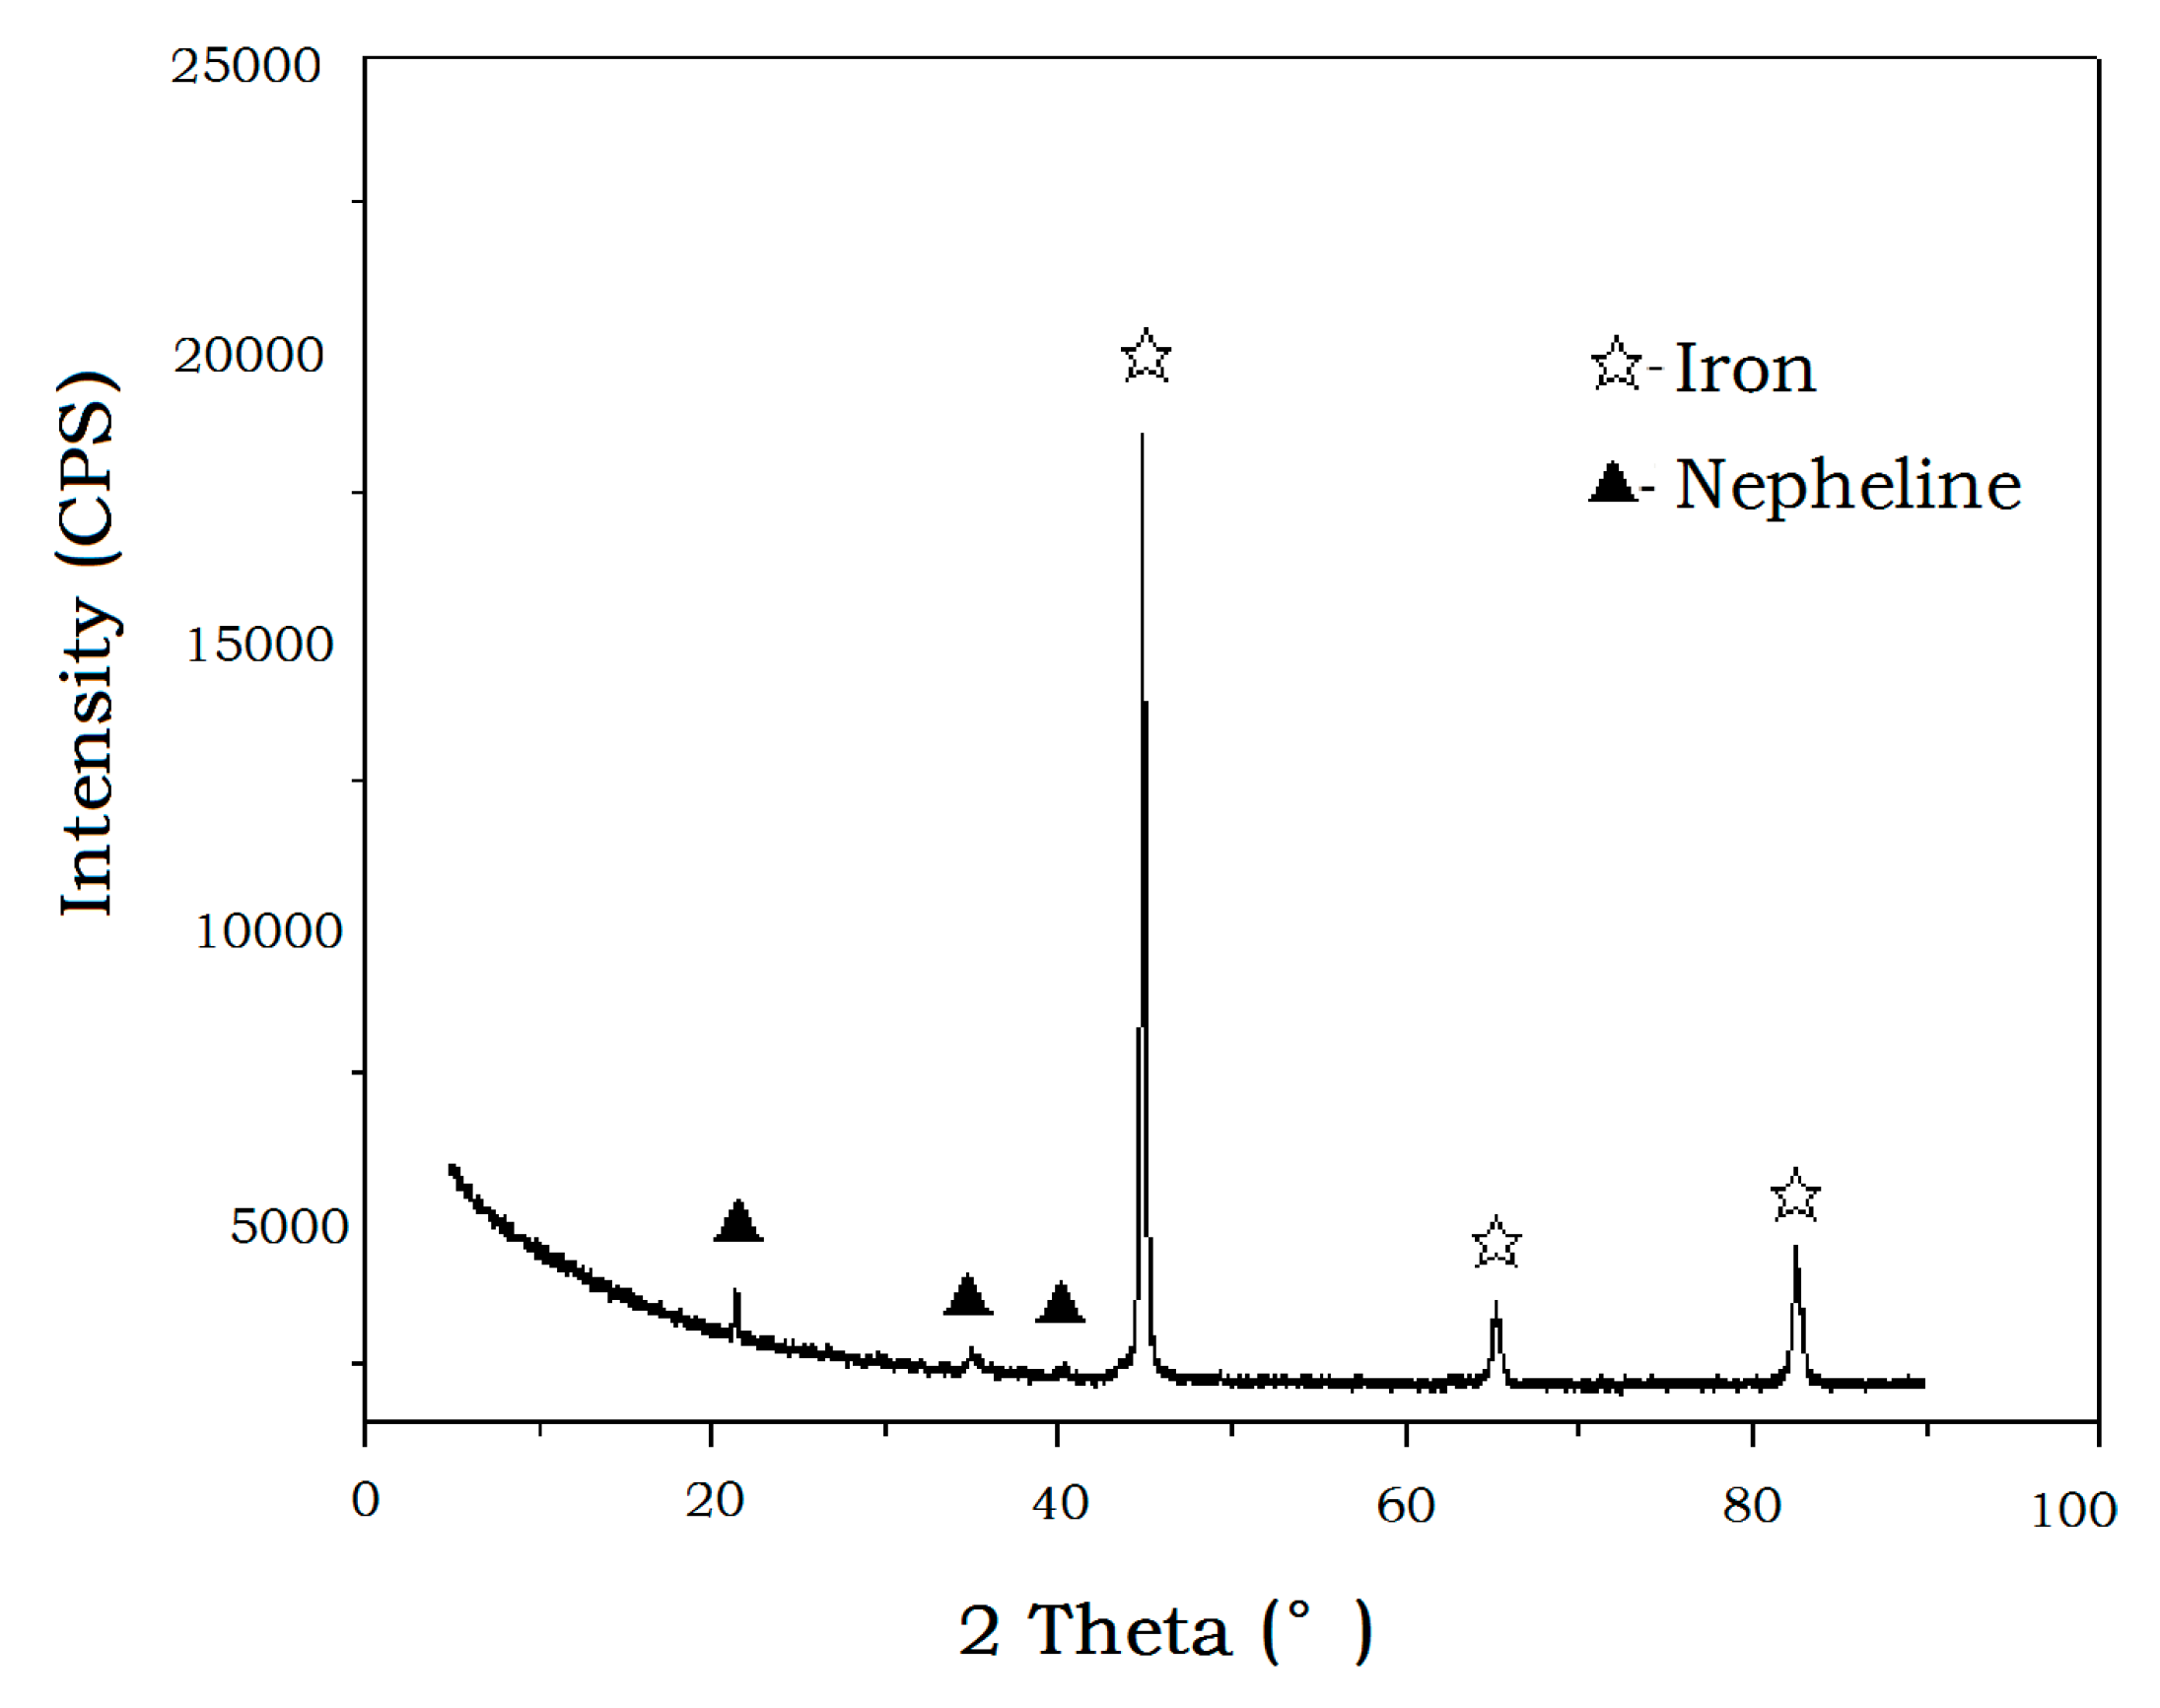
4.3. Iron Powder
5. Conclusions
Acknowledgments
Author Contributions
Conflicts of Interest
References
- Deng, J.; Wang, Q.F.; Yang, S.J.; Liu, X.F.; Zhang, Q.Z.; Yang, L.Q.; Yang, Y.H. Genetic relationship between the Emeishan plume and the bauxite deposits in Western Guangxi, China: Constraints from U-Pb and Lu-Hf isotopes of the detrital zircons in bauxite ores. J. Asian Earth Sci. 2010, 37, 412–424. [Google Scholar] [CrossRef]
- Zhang, Z.W.; Zhou, L.J.; Li, Y.J.; Wu, C.Q.; Zheng, C.F. The “coal-bauxite-iron” structure in the ore-bearing rock series as a prospecting indicator for southeastern Guizhou bauxite mines. Ore Geol. Rev. 2013, 53, 145–158. [Google Scholar] [CrossRef]
- Cheng, G.; Gao, G.M.; Chen, S.L. Geological characteristics and mineralization regularity of bauxite in Boloven Plateau Laos. J. Central South Univ. Nat. Sci. Ed. 2008, 39, 380–386. [Google Scholar]
- Zwingmann, N.; Jones, A.J.; Dye, S.; Swash, P.M.; Gilkes, R.J. A method to concentrate boehmite in bauxite by dissolution of gibbsite and iron oxides. Hydrometallurgy 2009, 97, 80–85. [Google Scholar] [CrossRef]
- Jiang, T.; Li, G.H.; Fan, X.H. Desilication from diasporic bauxite by roasting-alkali leaching process. Chin. J. Nonf. Met. 2000, 10, 534–538. [Google Scholar]
- Zhu, Z.P.; Jiang, T.; Li, G.H.; Huang, Z.C. Thermodynamics of reaction of alumina during sintering process of high-iron gibbsite-type bauxite. Chin. J. Nonf. Met. 2009, 19, 2243–2250. [Google Scholar]
- Shi, G.S.; Fang, J.; Yang, G.Y.; Xin, H.Y.; Gao, Y.J. Feasibility study of Guangxi high-Fe bauxite sintering. J. Hebei Polyt. Univ. Nat. Sci. Ed. 2013, 33, 11–13. [Google Scholar]
- Kahn, H.; Ml, M.; Tassinari, G.; Ratti, G. Characterization of bauxite fines aiming to minimine their iron content. Min. Eng. 2003, 16, 1313–1315. [Google Scholar] [CrossRef]
- Natayauan, K.A. Some microbiological aspects of banxite mineralization and benefieiation. Min. Metall. Process. 1997, 14, 47–50. [Google Scholar]
- Papassiopi, N.; Vaxevanidou, K.; Paspaliaris, I. Effectiveness of iron reducing bacteria for the removal of iron from bauxite ores. Min. Eng. 2010, 23, 25–31. [Google Scholar] [CrossRef]
- Yeh, C.H.; Zhang, G.Q. Stepwise carbothermal reduction of bauxite ores. Int. J. Min. Process. 2013, 124, 1–7. [Google Scholar] [CrossRef]
- Hu, W.T.; Wang, H.J.; Liu, X.W.; Sun, C.Y. Effect of nonmetallic additives on iron grain grindability. Int. J. Min. Process. 2014, 130, 108–113. [Google Scholar] [CrossRef]
- Hu, W.T.; Wang, H.J.; Liu, X.W.; Sun, C.Y. Correlation between aggregation structure and tailing mineral crystallinity. Int. J. Min. Metall. Mater. 2014, 21, 845–850. [Google Scholar] [CrossRef]
- Hu, W.T.; Wang, H.J.; Sun, C.Y.; Ji, C.L.; He, Y.; Wang, C.L. Alkali consumption mechanism on ferrous bauxite reduction process. J. Central South Univ. Sci. Technol. 2015, 45, 1595–1603. [Google Scholar]
- Hu, W.T.; Wang, H.J.; Sun, C.Y.; Tong, G.K.; Ji, C.L. Effects of minerals in ferric bauxite on sodium carbonate decomposition and volatilization. J. Central South Univ. 2015, 5, 2413–2427. [Google Scholar] [CrossRef]
- Jo, H.; Jo, H.Y.; Rha, S.; Lee, P.K. Direct aqueous mineral carbonation of waste slate using ammonium salt solutions. Metals 2015, 5, 2413–2427. [Google Scholar] [CrossRef]
- Santos, R.M.; Audenaerde, A.V.; Chiang, Y.W.; Iacobescu, R.I.; Knops, P.; Gerven, T.V. Nickel extraction from olivine: Effect of carbonation pre-treatment. Metals 2015, 5, 1620–1644. [Google Scholar] [CrossRef]
- Hu, W.T.; Wang, H.J.; Sun, C.Y.; Tong, G.K.; Ji, C.L. Direct reduction-leaching process for high ferric bauxite. J. Univ. Sci. Technol. Beijing 2012, 34, 506–511. [Google Scholar]


| Composition | Fe2O3 | Al2O3 | SiO2 | TiO2 | MgO | CaO | Na2O | K2O | P2O5 | LOI |
|---|---|---|---|---|---|---|---|---|---|---|
| Content/% | 41.13 | 33.02 | 12.22 | 1.49 | 0.68 | 0.63 | 0.32 | 0.06 | 0.04 | 8.97 |
| Component | Total Moisture (Mt) | Volatile Matter (Vad) | Ash (Aad) | Fixed Carbon (FCad) |
|---|---|---|---|---|
| Content/% | 9.16 | 39.42 | 5.07 | 46.35 |
| Component | SiO2 | Fe2O3 | Al2O3 | CaO | MgO | K2O | TiO2 | Na2O | P2O5 |
|---|---|---|---|---|---|---|---|---|---|
| Content/% | 38.00 | 36.19 | 21.37 | 7.15 | 1.90 | 1.38 | 0.84 | 0.43 | 0.41 |
| No. | Factors | R (%) | ||
|---|---|---|---|---|
| Heating Temperature (°C) | Heating Time (min) | Sodium Carbonate Dosage (%) | ||
| 1 | 1100 | 50 | 85 | 7.63 |
| 2 | 1100 | 40 | 85 | 10.44 |
| 3 | 1100 | 45 | 90 | 9.44 |
| 4 | 1100 | 45 | 80 | 11.17 |
| 5 | 1150 | 50 | 80 | 7.17 |
| 6 | 1150 | 50 | 90 | 9.25 |
| 7 | 1150 | 40 | 80 | 8.05 |
| 8 | 1150 | 40 | 90 | 10.03 |
| 9 | 1150 | 45 | 85 | 7.61 |
| 10 | 1150 | 45 | 85 | 7.59 |
| 11 | 1150 | 45 | 85 | 7.53 |
| 12 | 1150 | 45 | 85 | 7.64 |
| 13 | 1150 | 45 | 85 | 7.55 |
| 14 | 1200 | 45 | 80 | 10.34 |
| 15 | 1200 | 45 | 90 | 10.06 |
| 16 | 1200 | 40 | 85 | 12.28 |
| 17 | 1200 | 50 | 85 | 13.01 |
| Source | Sum of Squares | df | Mean Squares | F | p-Value Prob > F | Result |
|---|---|---|---|---|---|---|
| Linear | 44.75 | 9 | 4.97 | 2511.20 | 0.0001 | - |
| 2F1 | 41.09 | 6 | 6.85 | 3458.63 | 0.0001 | - |
| Quadratic | 11.53 | 3 | 3.84 | 1940.79 | 0.0001 | suggested |
| Cubic | 0.00 | 0 | - | - | - | - |
| Pure Error | 7.92 × 10⁻³ | 4.00 | 1.98 × 10⁻³ | - | - | - |
| Factor | Coefficient Estimate | df | Standard Error | 95% Cl Low | 95% Cl High | VIF |
|---|---|---|---|---|---|---|
| Intercept | 7.58 | 1 | 0.57 | 6.23 | 8.94 | - |
| A-Temperature | 0.88 | 1 | 0.45 | −0.20 | 1.95 | 1.00 |
| B-Time | −0.47 | 1 | 0.45 | −1.54 | 0.61 | 1.00 |
| C-Sodium Carbonate | 0.26 | 1 | 0.45 | −0.82 | 1.33 | 1.00 |
| AB | 0.89 | 1 | 0.64 | −0.63 | 2.4 | 1.00 |
| AC | 0.36 | 1 | 0.64 | −1.16 | 1.88 | 1.00 |
| BC | 0.025 | 1 | 0.64 | −1.49 | 1.54 | 1.00 |
| A2 | 2.44 | 1 | 0.63 | 0.96 | 3.92 | 1.01 |
| B2 | 0.81 | 1 | 0.63 | −0.67 | 2.29 | 1.01 |
| C2 | 0.23 | 1 | 0.63 | −1.25 | 1.71 | 1.01 |
| Items | Sodium Carbonate Dosage/% | Temperature/°C | Time/min | ηA/% | R/% | V/(g/kg Ferric Bauxite) |
|---|---|---|---|---|---|---|
| Optimum conditions | 85 | 1150 | 45 | 75.92 | 7.59 | 64.50 |
| Verification tests | 100 | 1100 | 35 | 73.53 | 7.44 | 74.50 |
| 110 | 1100 | 35 | 74.91 | 6.38 | 70.00 | |
| 120 | 1100 | 35 | 76.02 | 5.22 | 62.50 |
© 2016 by the authors; licensee MDPI, Basel, Switzerland. This article is an open access article distributed under the terms and conditions of the Creative Commons by Attribution (CC-BY) license (http://creativecommons.org/licenses/by/4.0/).
Share and Cite
Hu, W.; Wang, H.; Liu, X.; Sun, C.; Duan, X. Restraining Sodium Volatilization in the Ferric Bauxite Direct Reduction System. Minerals 2016, 6, 31. https://doi.org/10.3390/min6020031
Hu W, Wang H, Liu X, Sun C, Duan X. Restraining Sodium Volatilization in the Ferric Bauxite Direct Reduction System. Minerals. 2016; 6(2):31. https://doi.org/10.3390/min6020031
Chicago/Turabian StyleHu, Wentao, Huajun Wang, Xinwei Liu, Chuanyao Sun, and Xuqin Duan. 2016. "Restraining Sodium Volatilization in the Ferric Bauxite Direct Reduction System" Minerals 6, no. 2: 31. https://doi.org/10.3390/min6020031