3.1. The Model Equations and Statistical Evaluation
A total of 32 tests including five control experiments (center points) were conducted during the experimental study. The actual data collected from the tests were used to construct the empirical models representing concentrate grade and recovery as process responds to the variables. The results obtained from the tests are presented in
Table 3.
Table 3.
Design matrix and the results of the three-level and three-factor factor full factorial design.
Table 3.
Design matrix and the results of the three-level and three-factor factor full factorial design.
| Run Number | Conditions | Grade, Cr2O3 % | Recovery, Cr2O3 % |
|---|
| A | B | C | Actual | Predicted | Actual | Predicted |
|---|
| 1 | 12 | 60 | 24 | 42.3 | 42.8 | 68.1 | 68.7 |
| 2 | 12 | 90 | 24 | 41.3 | 40.1 | 70.8 | 69.4 |
| 3 | 8 | 90 | 24 | 37.9 | 37.6 | 66.1 | 66.8 |
| 4 | 8 | 90 | 24 | 36.5 | 37.6 | 64.7 | 66.8 |
| 5 | 12 | 90 | 12 | 40.3 | 39.9 | 71.7 | 71.9 |
| 6 | 4 | 60 | 12 | 33.3 | 33.6 | 61.0 | 61.8 |
| 7 | 4 | 90 | 36 | 30.3 | 30.1 | 53.2 | 54.6 |
| 8 | 12 | 120 | 12 | 37.0 | 37.4 | 71.9 | 71.8 |
| 9 | 12 | 120 | 24 | 37.8 | 37.8 | 68.5 | 69.2 |
| 10 | 4 | 120 | 36 | 28.2 | 28.3 | 50.3 | 49.4 |
| 11 | 4 | 120 | 12 | 29.1 | 28.8 | 52.9 | 52.4 |
| 12 | 4 | 60 | 36 | 32.2 | 32.2 | 59.7 | 59.0 |
| 13 | 4 | 90 | 24 | 30.0 | 30.4 | 54.4 | 55.3 |
| 14 | 8 | 90 | 24 | 37.1 | 37.6 | 66.4 | 66.8 |
| 15 | 8 | 120 | 36 | 35.5 | 35.8 | 63.2 | 63.3 |
| 16 | 8 | 120 | 24 | 35.7 | 35.5 | 64.2 | 64.2 |
| 17 | 8 | 90 | 12 | 38.8 | 37.9 | 69.9 | 69.2 |
| 18 | 8 | 60 | 36 | 40.5 | 40.0 | 67.2 | 67.9 |
| 19 | 4 | 90 | 12 | 30.6 | 31.0 | 57.2 | 57.5 |
| 20 | 12 | 60 | 12 | 42.2 | 42.8 | 70.9 | 71.1 |
| 21 | 8 | 60 | 24 | 40.9 | 40.1 | 68.6 | 68.7 |
| 22 | 8 | 60 | 12 | 41.2 | 40.6 | 71.5 | 71.0 |
| 23 | 12 | 120 | 36 | 38.5 | 38.5 | 68.0 | 68.2 |
| 24 | 8 | 90 | 24 | 36.9 | 37.6 | 68.0 | 66.8 |
| 25 | 12 | 90 | 36 | 41.1 | 40.7 | 69.0 | 68.4 |
| 26 | 8 | 120 | 12 | 34.9 | 35.5 | 66.1 | 66.6 |
| 27 | 4 | 120 | 24 | 29.2 | 28.4 | 50.1 | 50.1 |
| 28 | 8 | 90 | 24 | 37.9 | 37.6 | 66.9 | 66.8 |
| 29 | 8 | 90 | 24 | 37.5 | 37.6 | 68.6 | 66.8 |
| 30 | 8 | 90 | 36 | 37.5 | 37.7 | 66.6 | 66.0 |
| 31 | 12 | 60 | 36 | 42.7 | 43.1 | 67.7 | 67.8 |
| 32 | 4 | 60 | 24 | 32.8 | 32.7 | 60.9 | 59.6 |
Table 3 also shows the predicted responses of the process to the variables considered. The actual model equation for grade (
Y1) and recovery (
Y2) of the chromite concentrates is given in Equations (2) and (3) respectively.
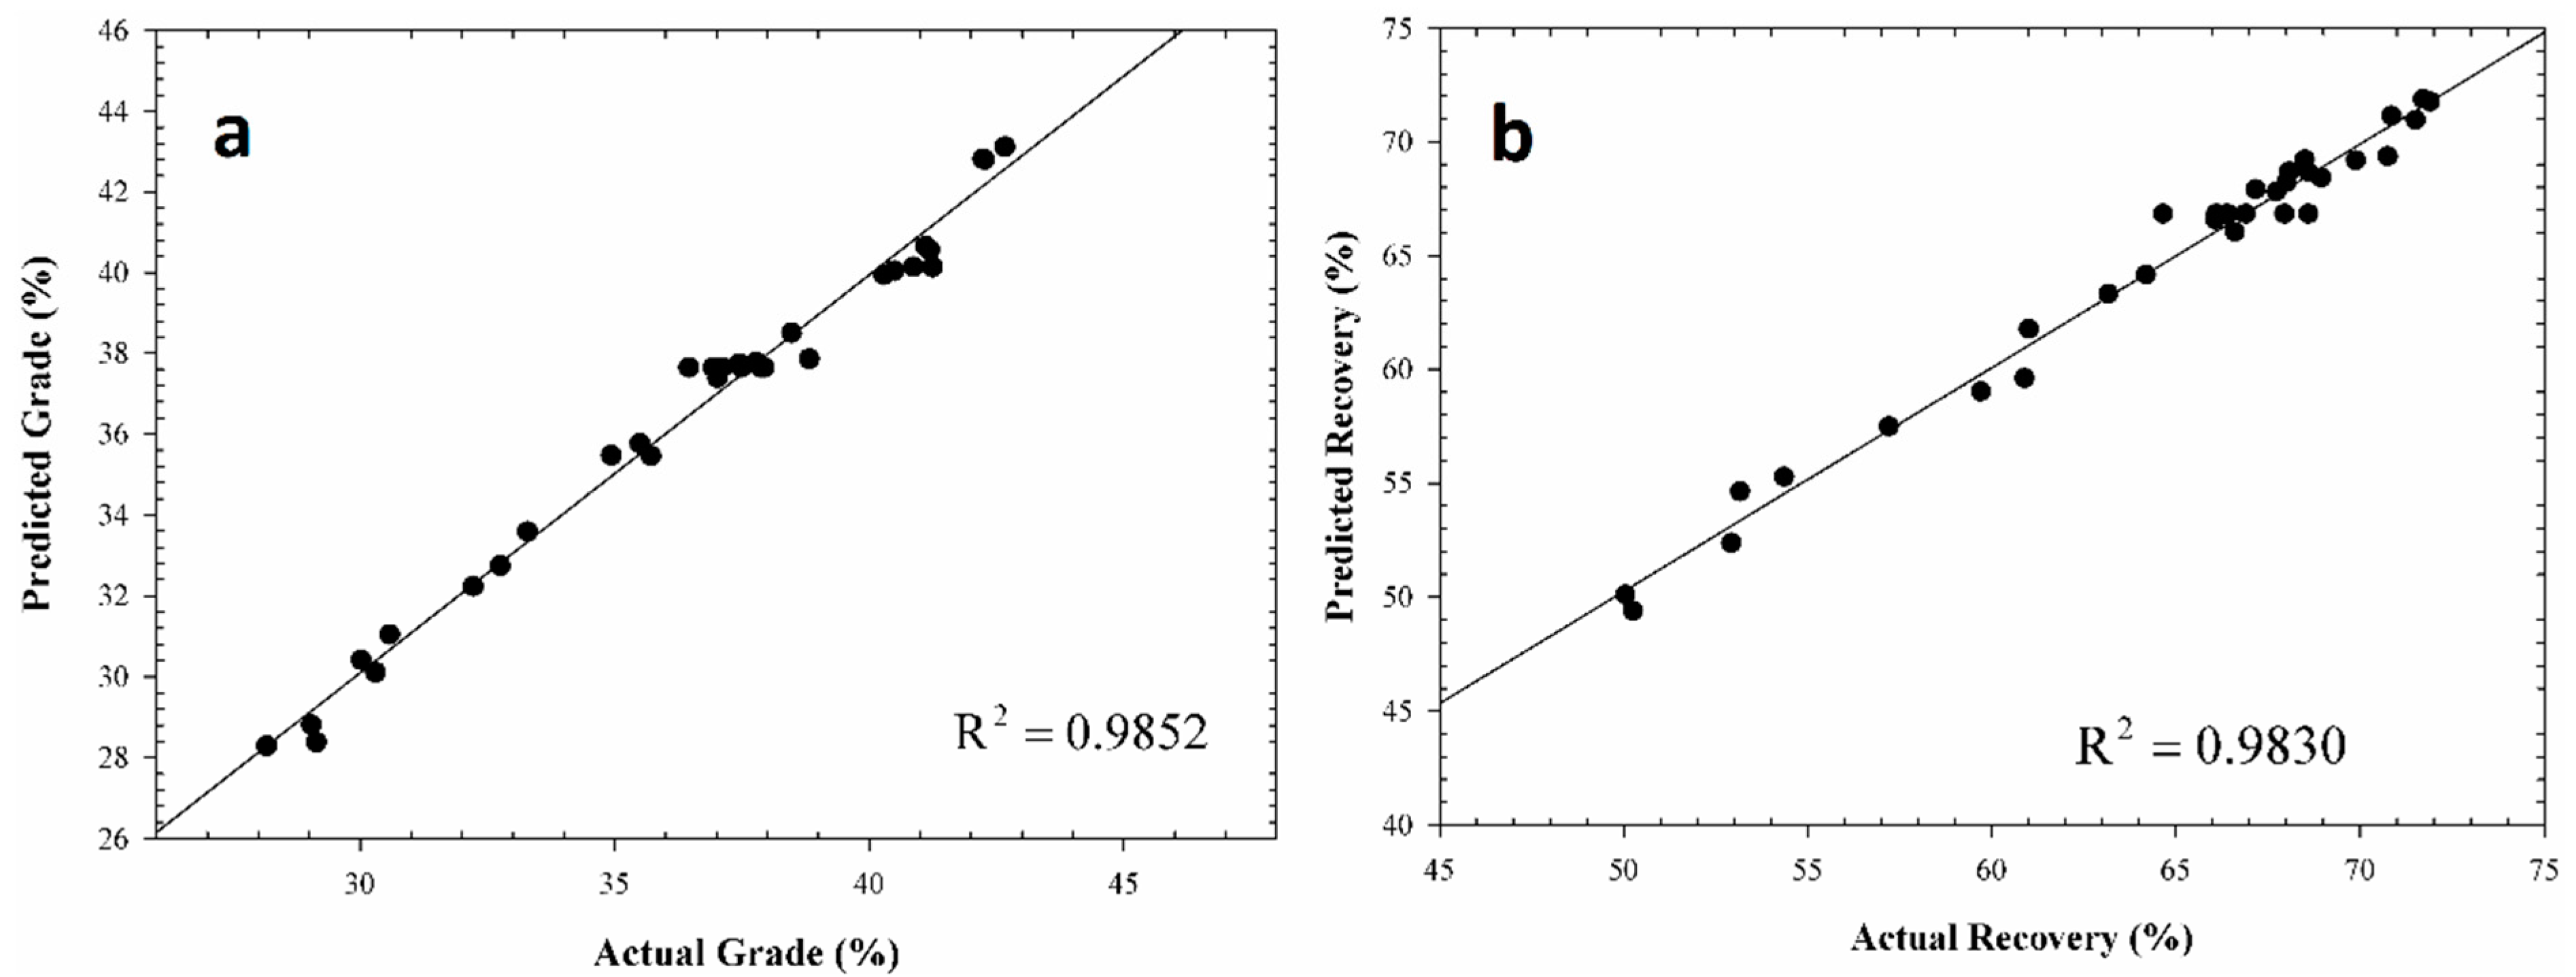
The models fit the data well and the differences between the observed values and the model's predicted values are relatively small and unbiased. The predicted values are in consistent with the experimental results. The coefficients of determination (
R2) obtained for the grade and recovery are 0.9852 and 0.9830 respectively, indicating that the regression is significant as illustrated in
Figure 1.
Figure 1.
Relationship between observed and predicted values ((a) Grade; (b) Recovery).
Figure 1.
Relationship between observed and predicted values ((a) Grade; (b) Recovery).
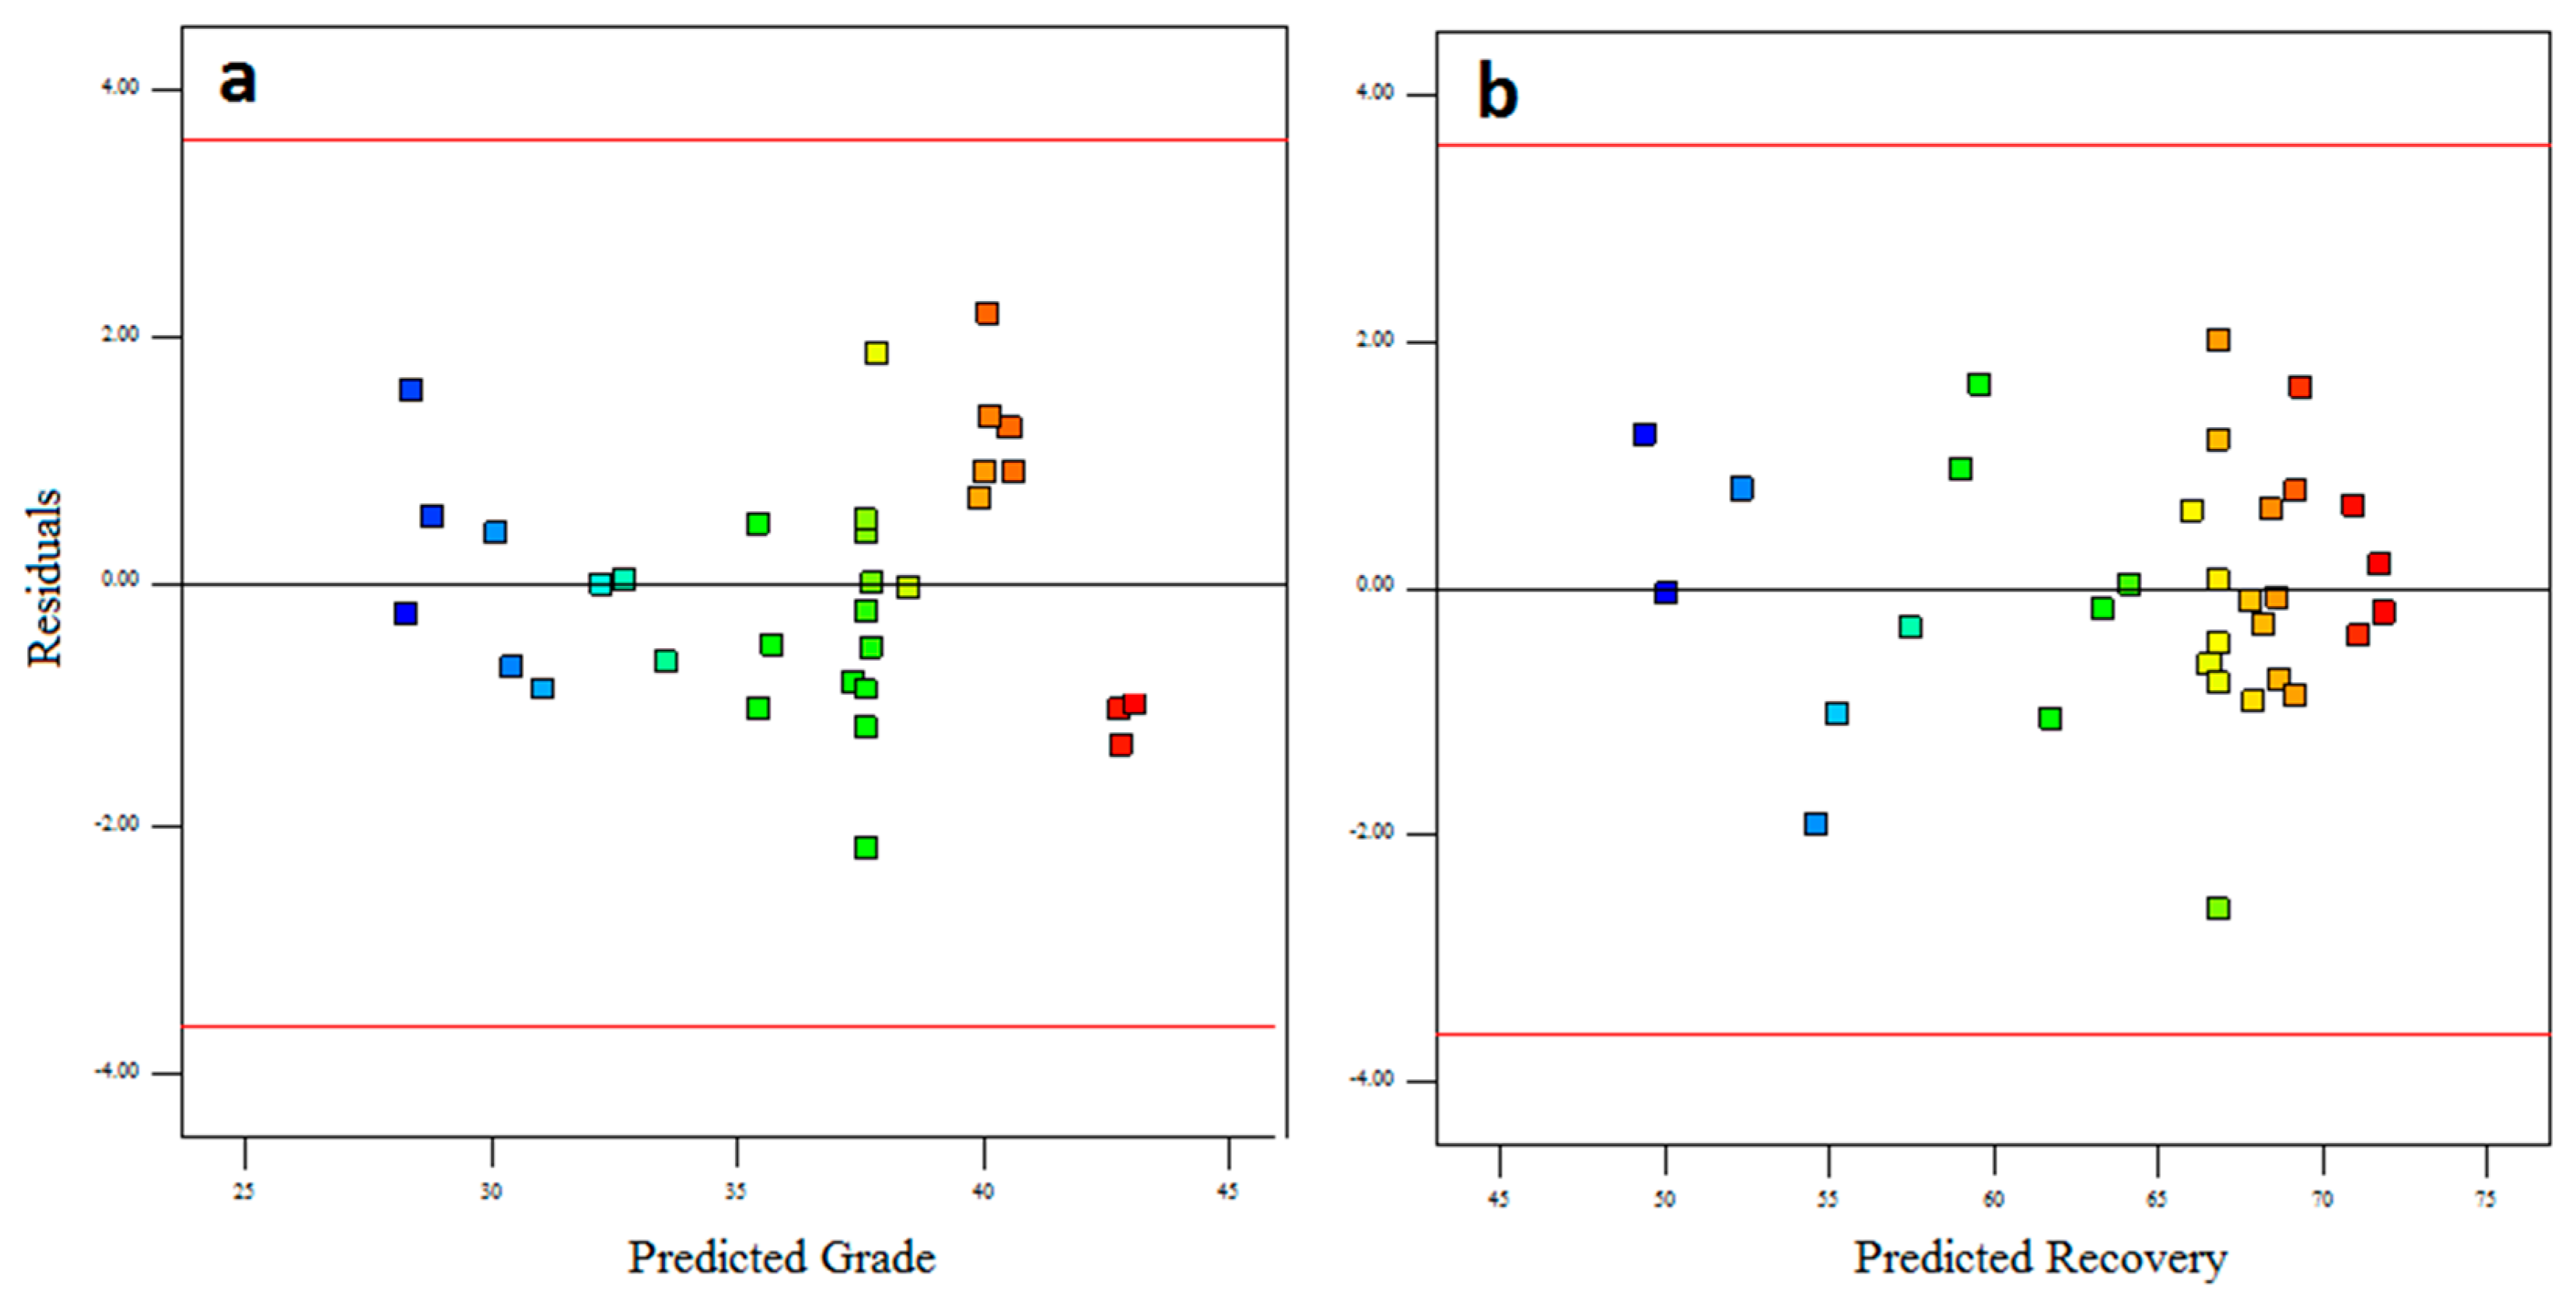
Figure 2 shows graphically the residuals for predicted values of grade and recovery. As can be seen from these figures that the residual values are uniformly distributed.
The significance test of model fit for grade and recovery of the concentrates were performed using Design Expert software version 9.0.3.1 based on analysis of variance (ANOVA). The results showed that the models are significant as the
F value is high and the Prob >
F value is less than 0.05 (
Table 4). The standard deviations of the predicted models were found 0.62 and 1.0 for grade and recovery respectively. Lack of Fit
F-values were found as 1.23 for grade and 0.36 for recovery models implying that the Lack of Fit is not significant relative to the pure error for both models. The predicted
R2 values of grade and recovery models (0.9714 and 0.9678 respectively) are in reasonable consistency with the adjusted
R2 values (0.9791 and 0.9761), the difference between these two values are less than 0.2 for both models.
The significance level of the parameters, the coefficient estimates and parameter interactions of the empirical models are tabulated in
Table 5. Values of “Prob >
F” less than 0.05 for the models suggest that the model terms are significant.
Figure 2.
Residual plots for predicted grade and recovery values ((a) Grade; (b) Recovery).
Figure 2.
Residual plots for predicted grade and recovery values ((a) Grade; (b) Recovery).
Table 4.
Analysis of variance (ANOVA) table derived for the grade and recovery models.
Table 4.
Analysis of variance (ANOVA) table derived for the grade and recovery models.
| Statistics | Source |
|---|
| Cr2O3 (%) Grade Model | Cr2O3 (%) Recovery Model |
|---|
| Sum of square | 569.35 | 1265.55 |
| Degree of freedom | 9 | 9 |
| Mean square | 63.26 | 140.62 |
| F-Value | 162.72 | 141.39 |
| Prob > F | <0.0001 | <0.0001 |
| Standard deviation | 0.62 | 1.00 |
| Adjusted R2 | 0.9791 | 0.9761 |
| Predicted R2 | 0.9714 | 0.9678 |
| R2 | 0.9852 | 0.9830 |
Table 5.
Estimated coefficient values for the parameter and parameter interaction effects.
Table 5.
Estimated coefficient values for the parameter and parameter interaction effects.
| Factor | Cr2O3 (%) Grade | Cr2O3 (%) Recovery |
|---|
| Coefficient Estimate | F-Value | Prob > F | Coefficient Estimate | F-Value | Prob > F |
|---|
| A—FWFR | 4.86 | 1095.08 | <0.0001 | 07.05 | 899.85 | <0.0001 |
| B—G Force | −2.34 | 254.362 | <0.0001 | −2.25 | 91.40 | <0.0001 |
| C—Feed | −0.057 | 0.145 | 0.70 | −1.58 | 44.96 | <0.0001 |
| AB | −0.16 | 0.83 | 0.37 | 2.51 | 75.97 | <0.0001 |
| AC | 0.41 | 5.21 | 0.03 | −0.15 | 0.27 | 0.6115 |
| BC | 0.20 | 1.28 | 0.27 | −0.057 | 0.04 | 0.8435 |
| A2 | −2.37 | 103.18 | <0.0001 | −4.51 | 146.43 | <0.0001 |
| B2 | 0.16 | 0.45 | 0.51 | −0.42 | 1.27 | 0.2719 |
| C2 | 0.16 | 0.48 | 0.49 | 0.78 | 4.41 | 0.0474 |
3.2. The Effect of Process Variables on Grade of the Knelson Separator Concentrate
The estimated coefficient values calculated for main effects of the process variables from the Equation 2 (
Table 5) indicate that fluidization water flow rate (
A) has a positive effect and
G force (
B) has a negative effect on the Cr
2O
3 content of the concentrate. It was also observed that feed rate (
C) has no significant effect on the grade of the concentrate in the range of the parameter levels tested.
The Equation 2 dictates that the interaction of variables, fluidization water flow rate (A)—G force (B) has a negative effect on the Cr2O3 content of the concentrate whereas interactions of fluidization water flow rate (A)—feed rate (C) and G force (B)—feed rate (C) have a positive effect. On the other hand, fluidization water flow rate (A) has the highest quadratic effect on the concentrate Cr2O3 grade.
The predicted response (
Y1) of the process to the independent variables are presented graphically in three dimensional (3D) space to help to visualize the shape of the response surface in
Figure 3,
Figure 4 and
Figure 5.
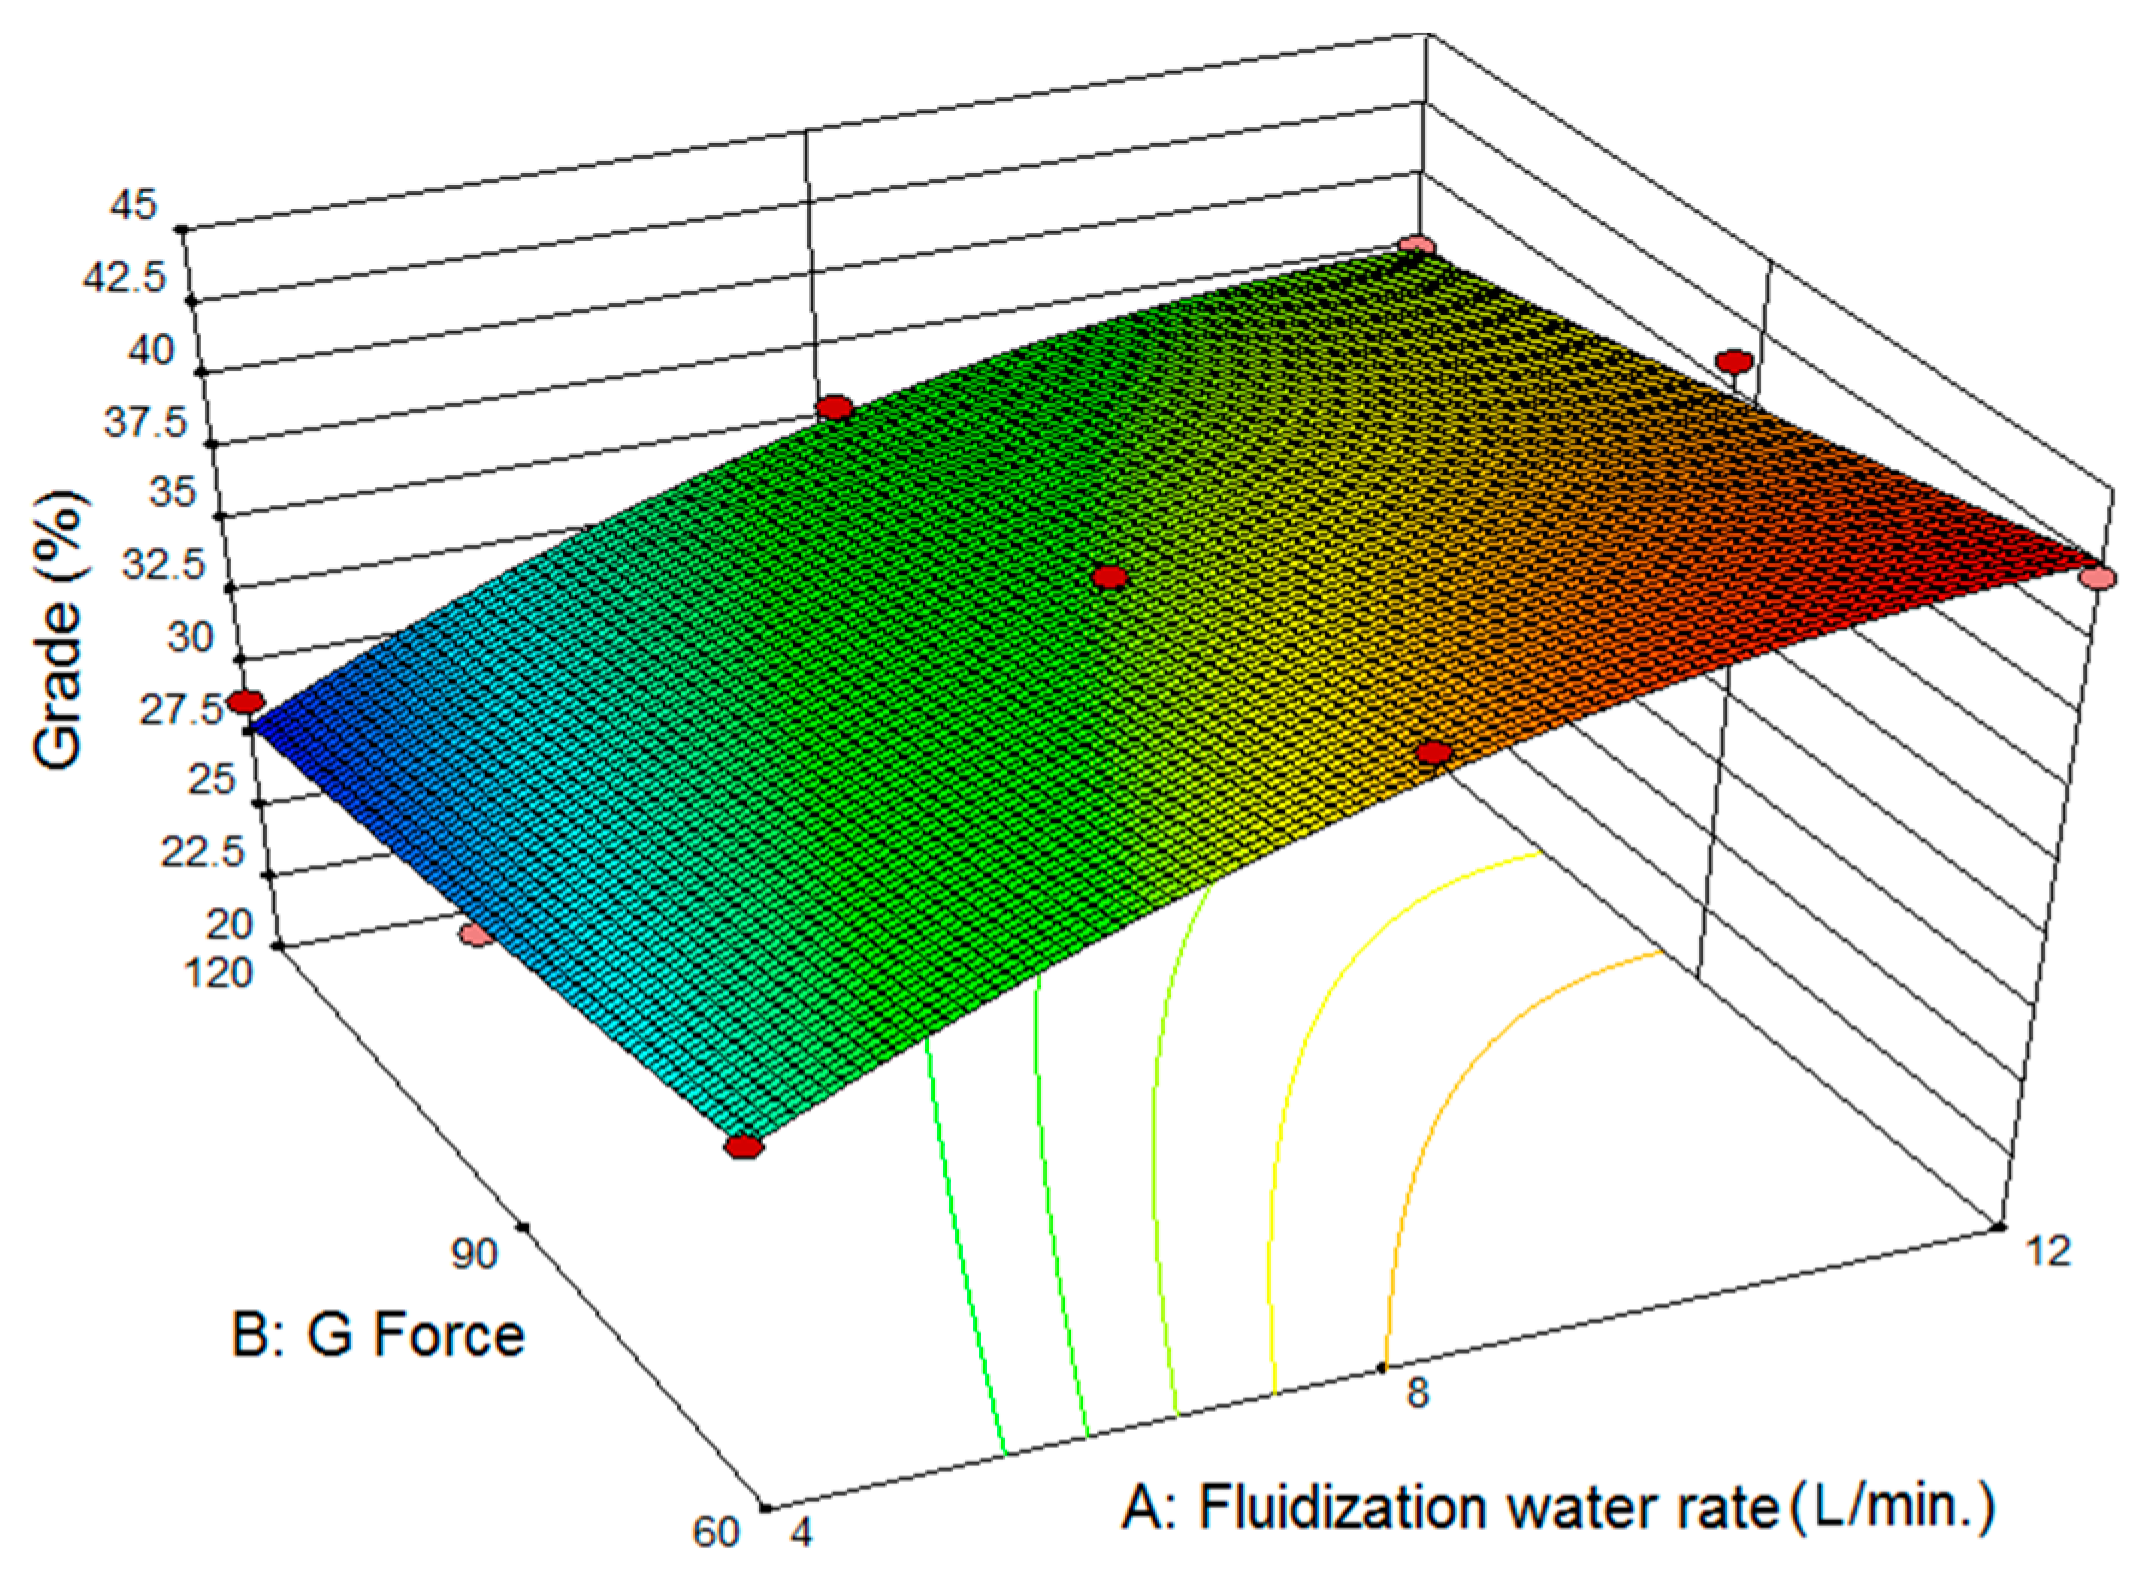
The effect of the
G force and fluidization water flow rate on grade (Cr
2O
3 %) of the concentrate at the center level of feed rate is shown in
Figure 3. As can be seen from
Figure 3, a higher grade concentrate is obtained at higher fluidization water flow rate and at lower
G force. The grade of the concentrate tends to decrease as the applied
G force increases. This can be explained by the fact that the cut-density of the separation is reduced with increasing
G force which in turn allows the lower grade composite particles to enter the concentrate product and decrease the Cr
2O
3 grade.
Figure 3.
The response surface plot representing the effect of fluidization water flow rate and applied G force on the Cr2O3 content of the concentrate.
Figure 3.
The response surface plot representing the effect of fluidization water flow rate and applied G force on the Cr2O3 content of the concentrate.
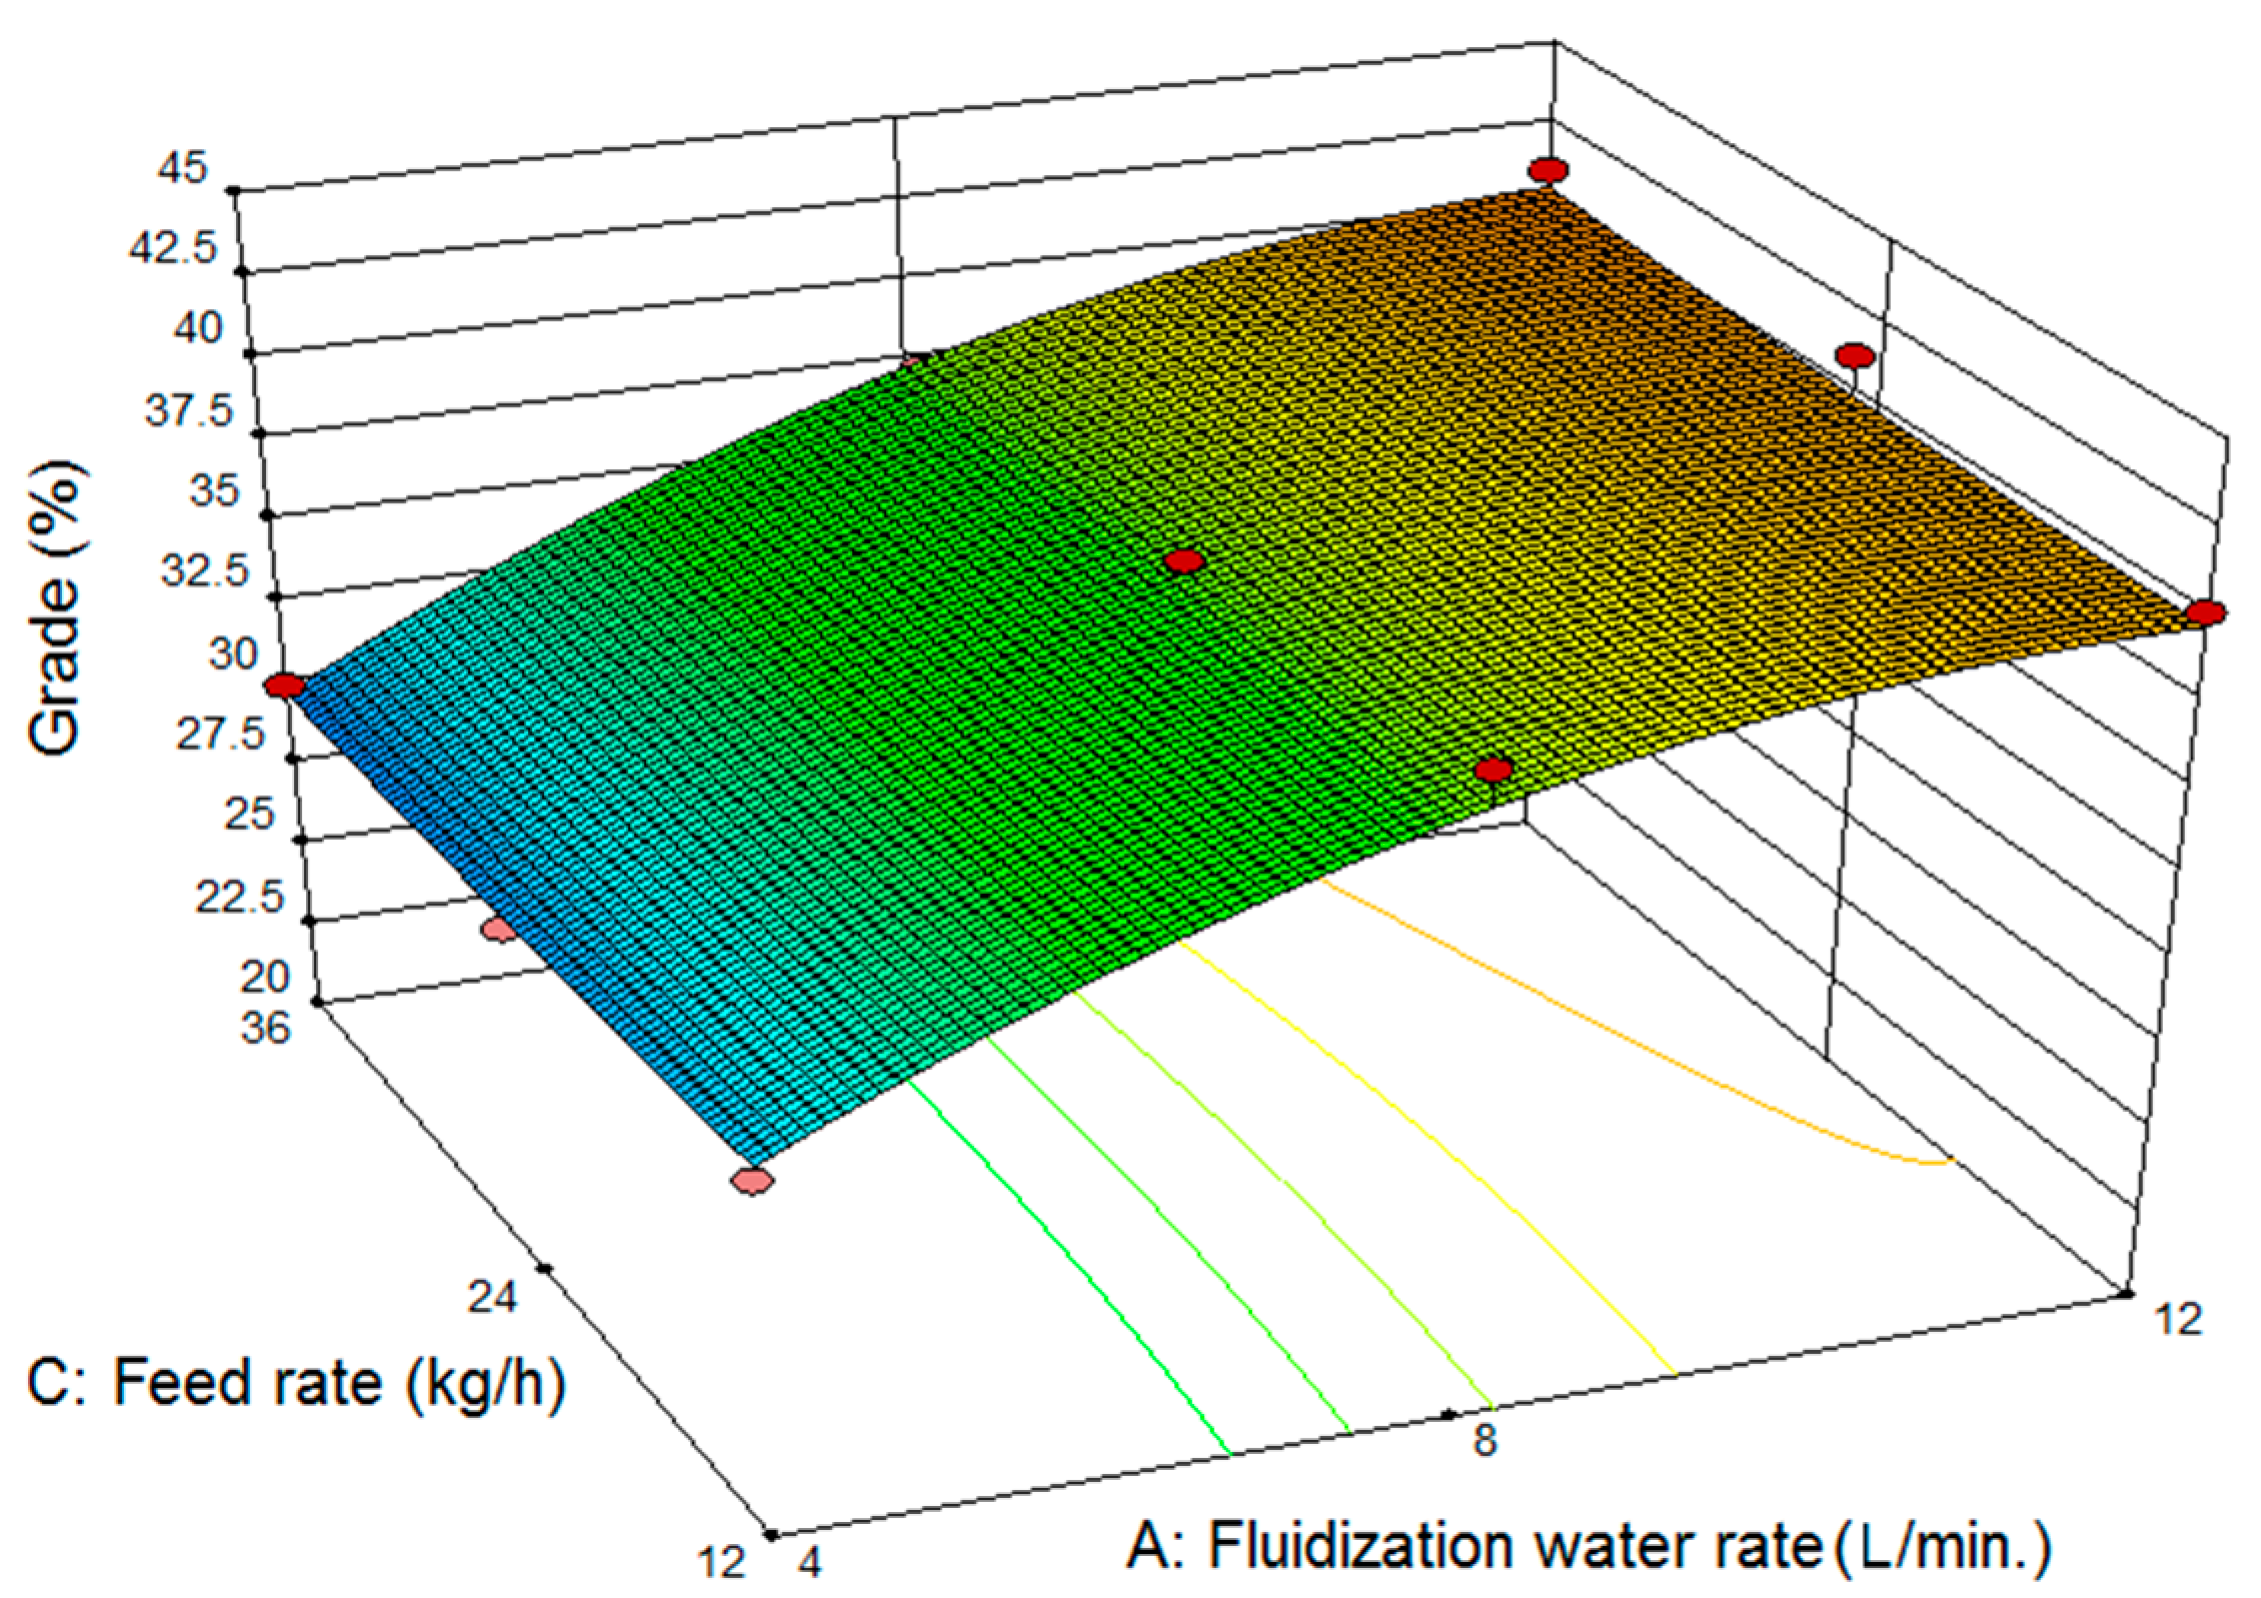
Figure 4 illustrates the effect of feed rate and fluidization water flow rate on grade (Cr
2O
3 %) of the concentrate at the center level of
G force. It is seen from
Figure 4 that there is not any significant effect of feed rate on the grade of the concentrate at a constant water flow rate in the range of the parameter levels tested. However, increasing the fluidization water flow rate leads to obtaining higher grade concentrate due to the increased number of light particles transported to the outside of separation cone.
Figure 4.
The response surface plot representing the effect of fluidization water flow rate and feed rate on the Cr2O3 content of the concentrate.
Figure 4.
The response surface plot representing the effect of fluidization water flow rate and feed rate on the Cr2O3 content of the concentrate.
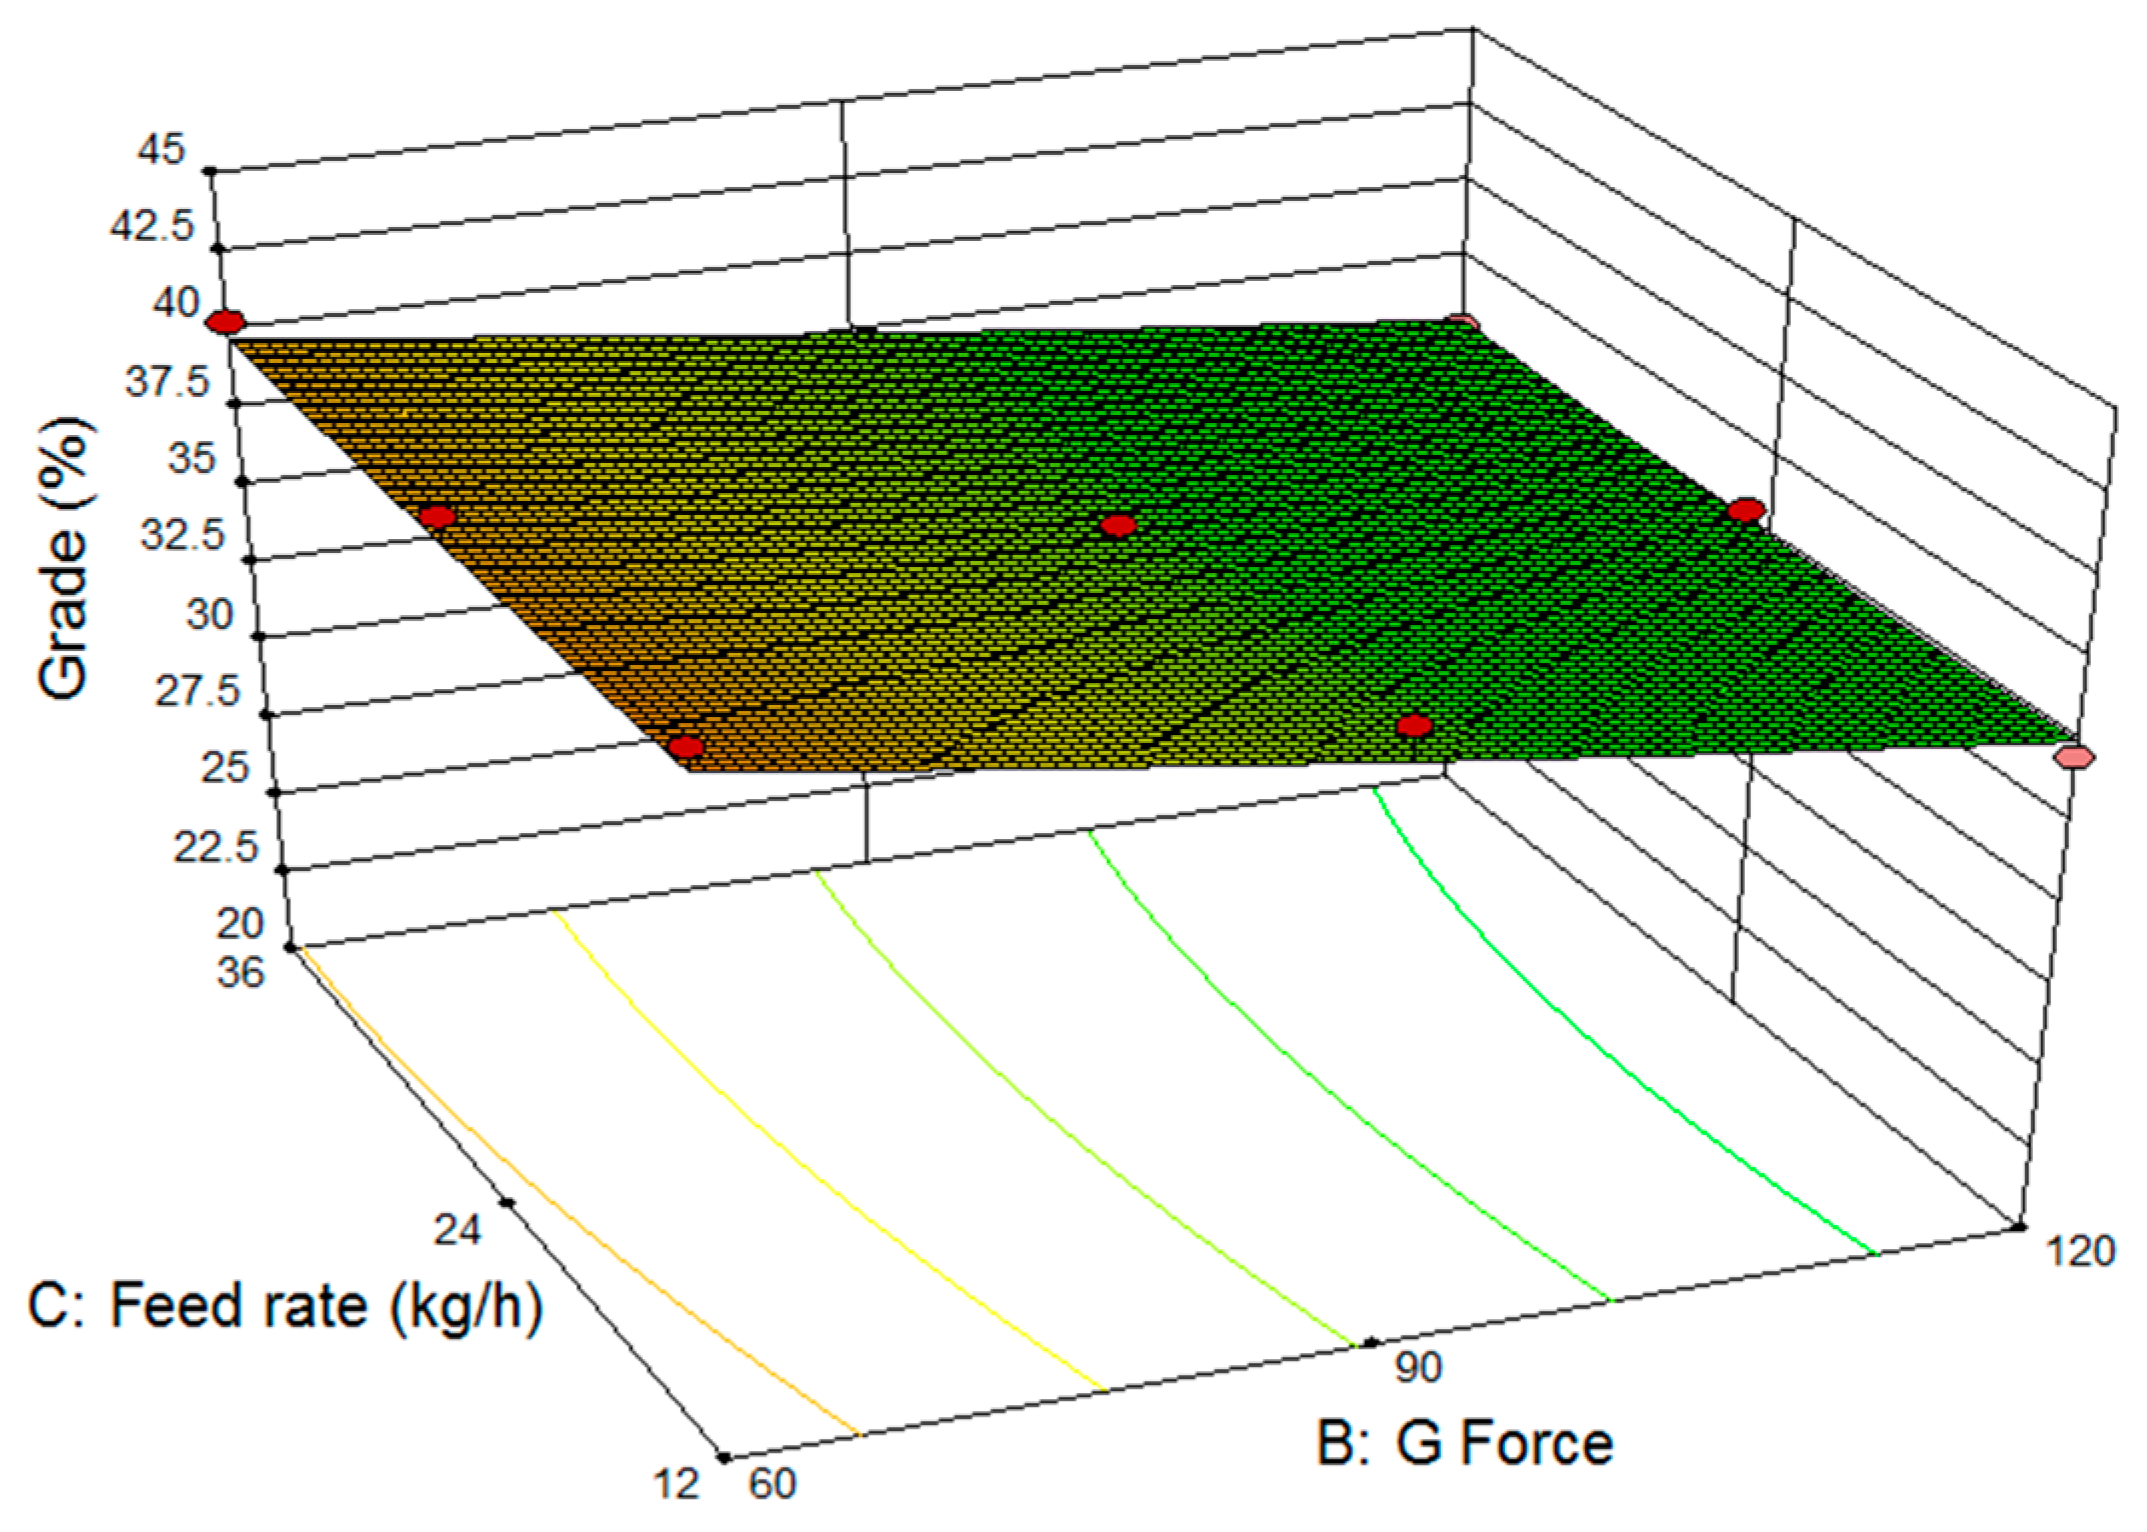
Figure 5 represents the effect of
G force and feed rate on grade (Cr
2O
3 %) of the Knelson concentrate at the center level of fluidization water flow rate. It is observed from
Figure 5 that changing feed rate has no significant effect on the concentrate grade in the range of the parameter levels tested. On the other hand, the use of higher
G force at a constant feed rate results in a decrease in concentrate Cr
2O
3 grade.
Figure 5.
The response surface plot representing the effect of G force and feed rate on the Cr2O3 content of the concentrate.
Figure 5.
The response surface plot representing the effect of G force and feed rate on the Cr2O3 content of the concentrate.
3.3. Effect of KC-MD3 Knelson Concentrator Variables on Concentrate Recovery
The estimated coefficient and Prob > F values obtained for main effects of the independent variables from Equation 3 indicate that water flow rate (A) has a positive effect on the Cr2O3 recovery of the concentrate, whereas, G force (B) and feed rate (C) negatively affect the Cr2O3 recovery.
The interaction of variables fluidization water flow rate (A)—G force (B) has a significant positive effect on the Cr2O3 recovery of the concentrate, while interactions of fluidization water flow rate (A)—feed rate (C) and G force (B)—feed rate (C) have a negative effect. It is also important to note that fluidization water flow rate (A) has a significant quadratic effect on the concentrate Cr2O3 recovery compared to the other independent variables.
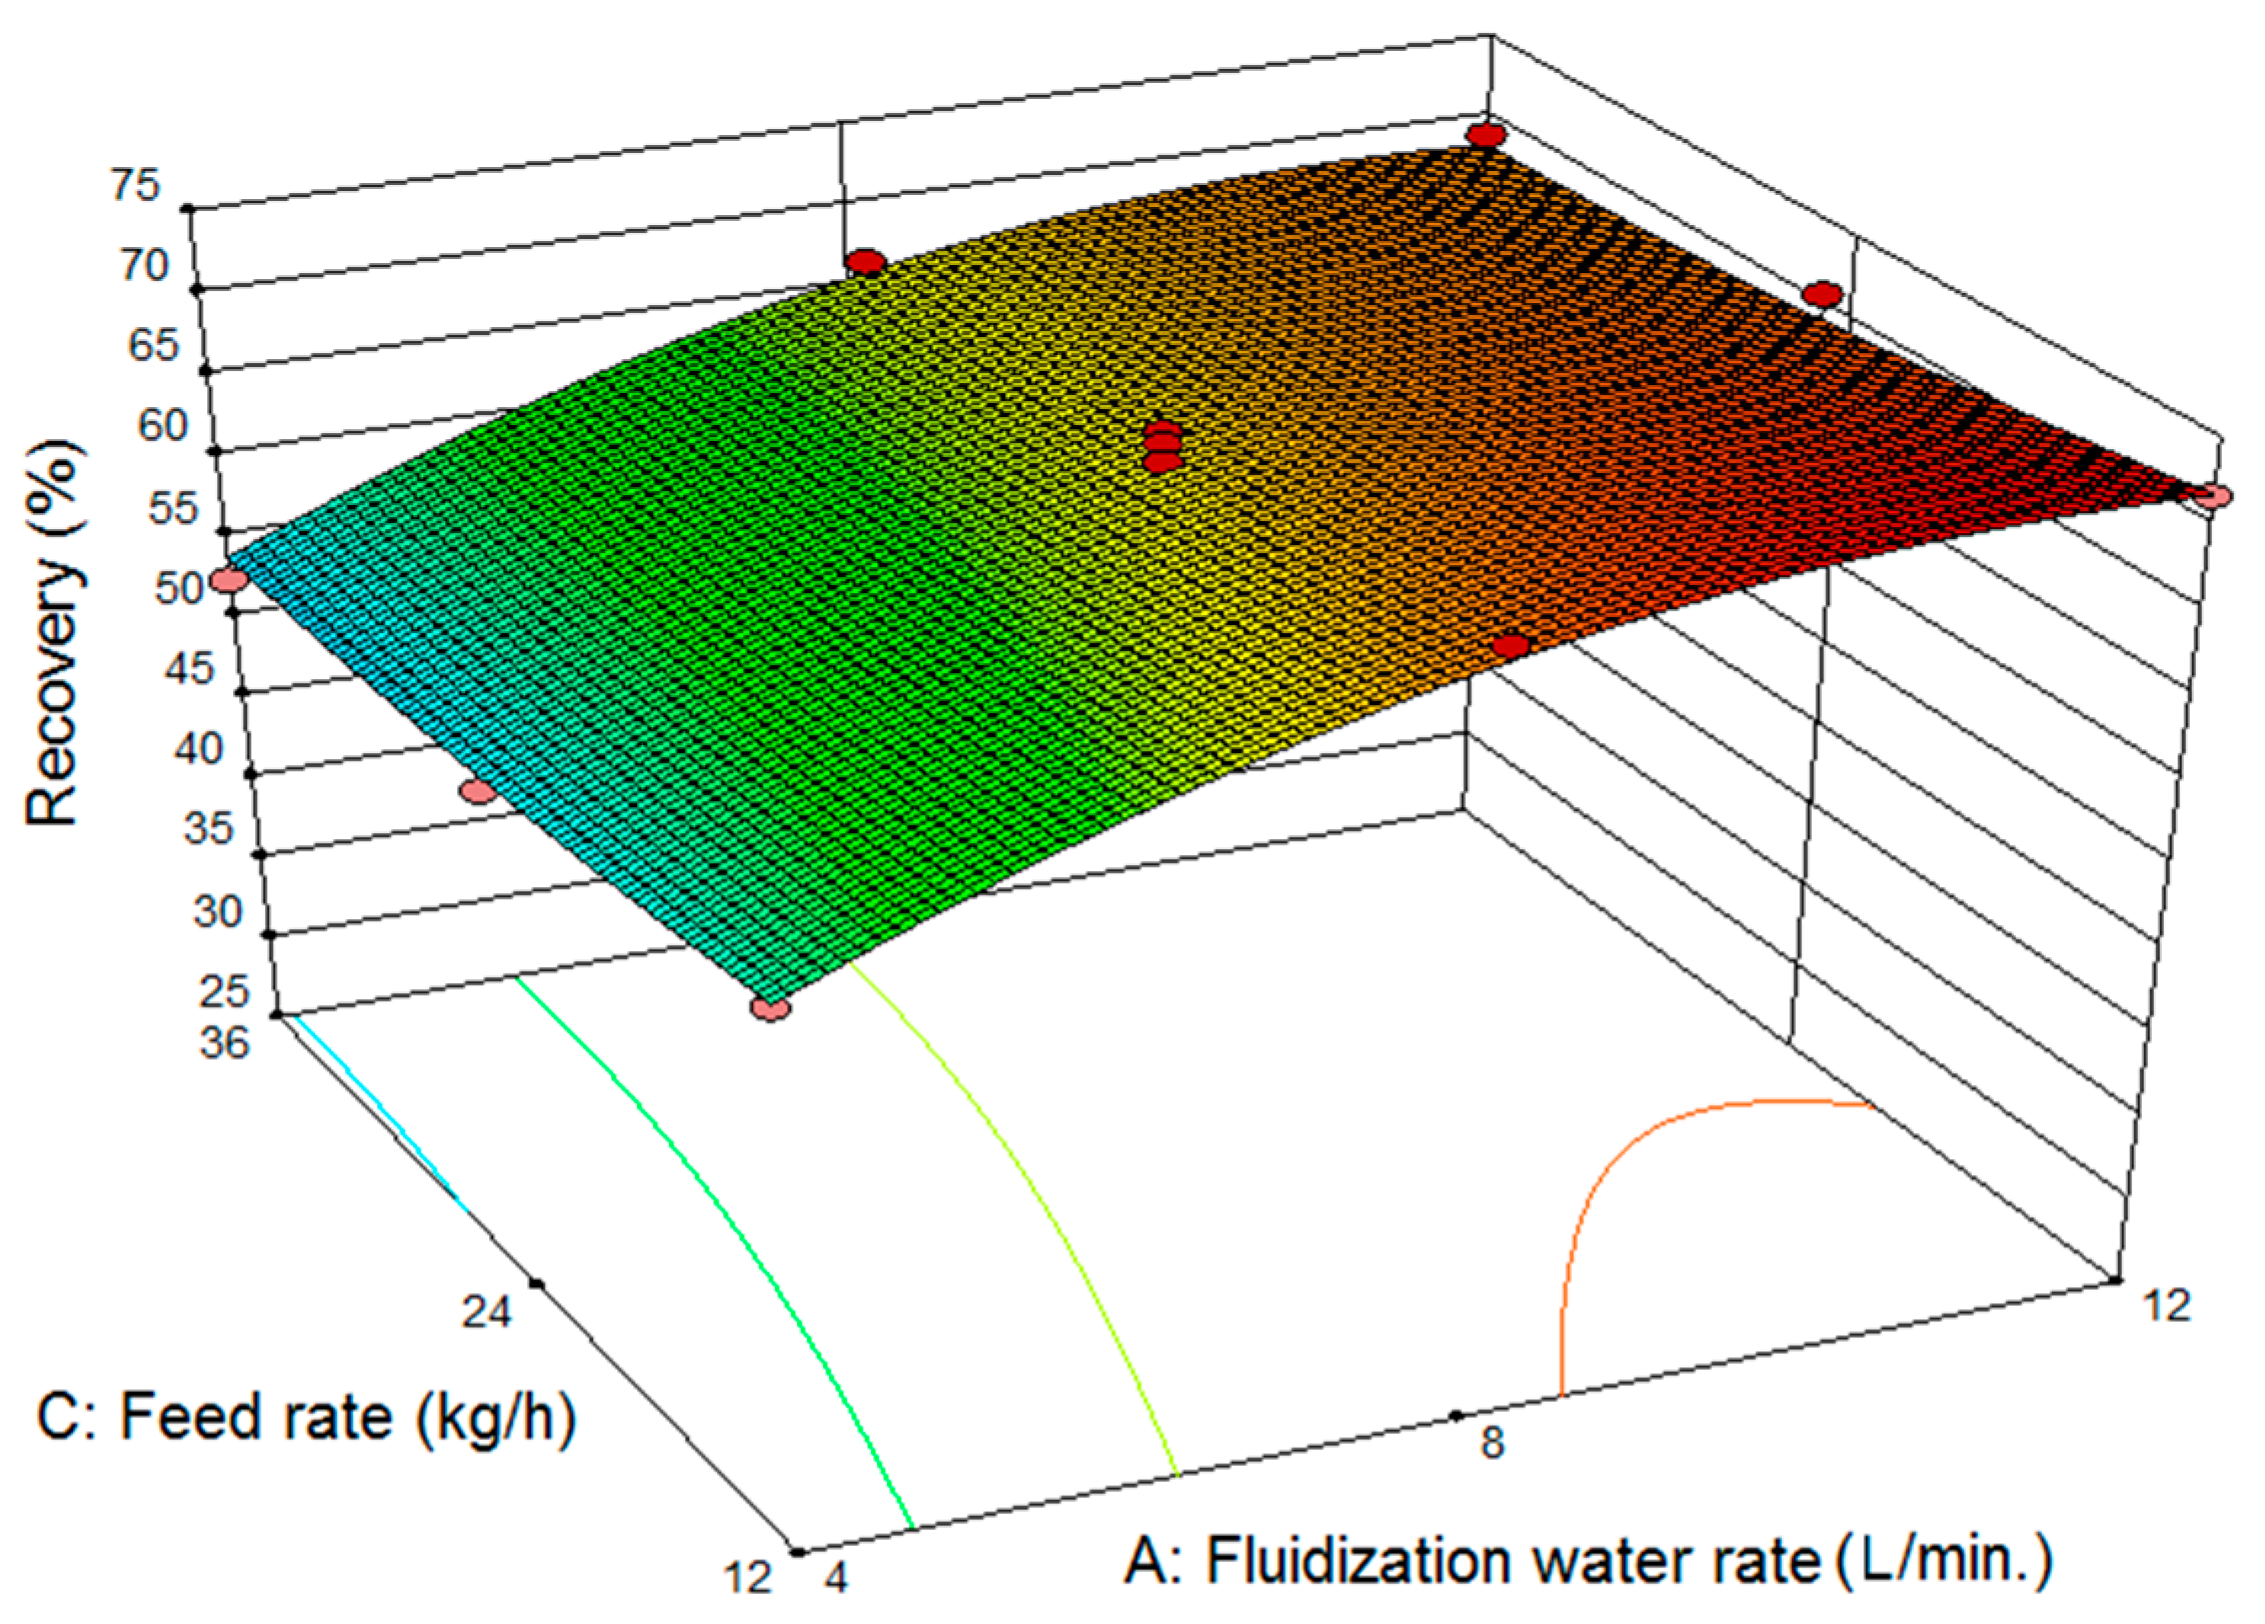
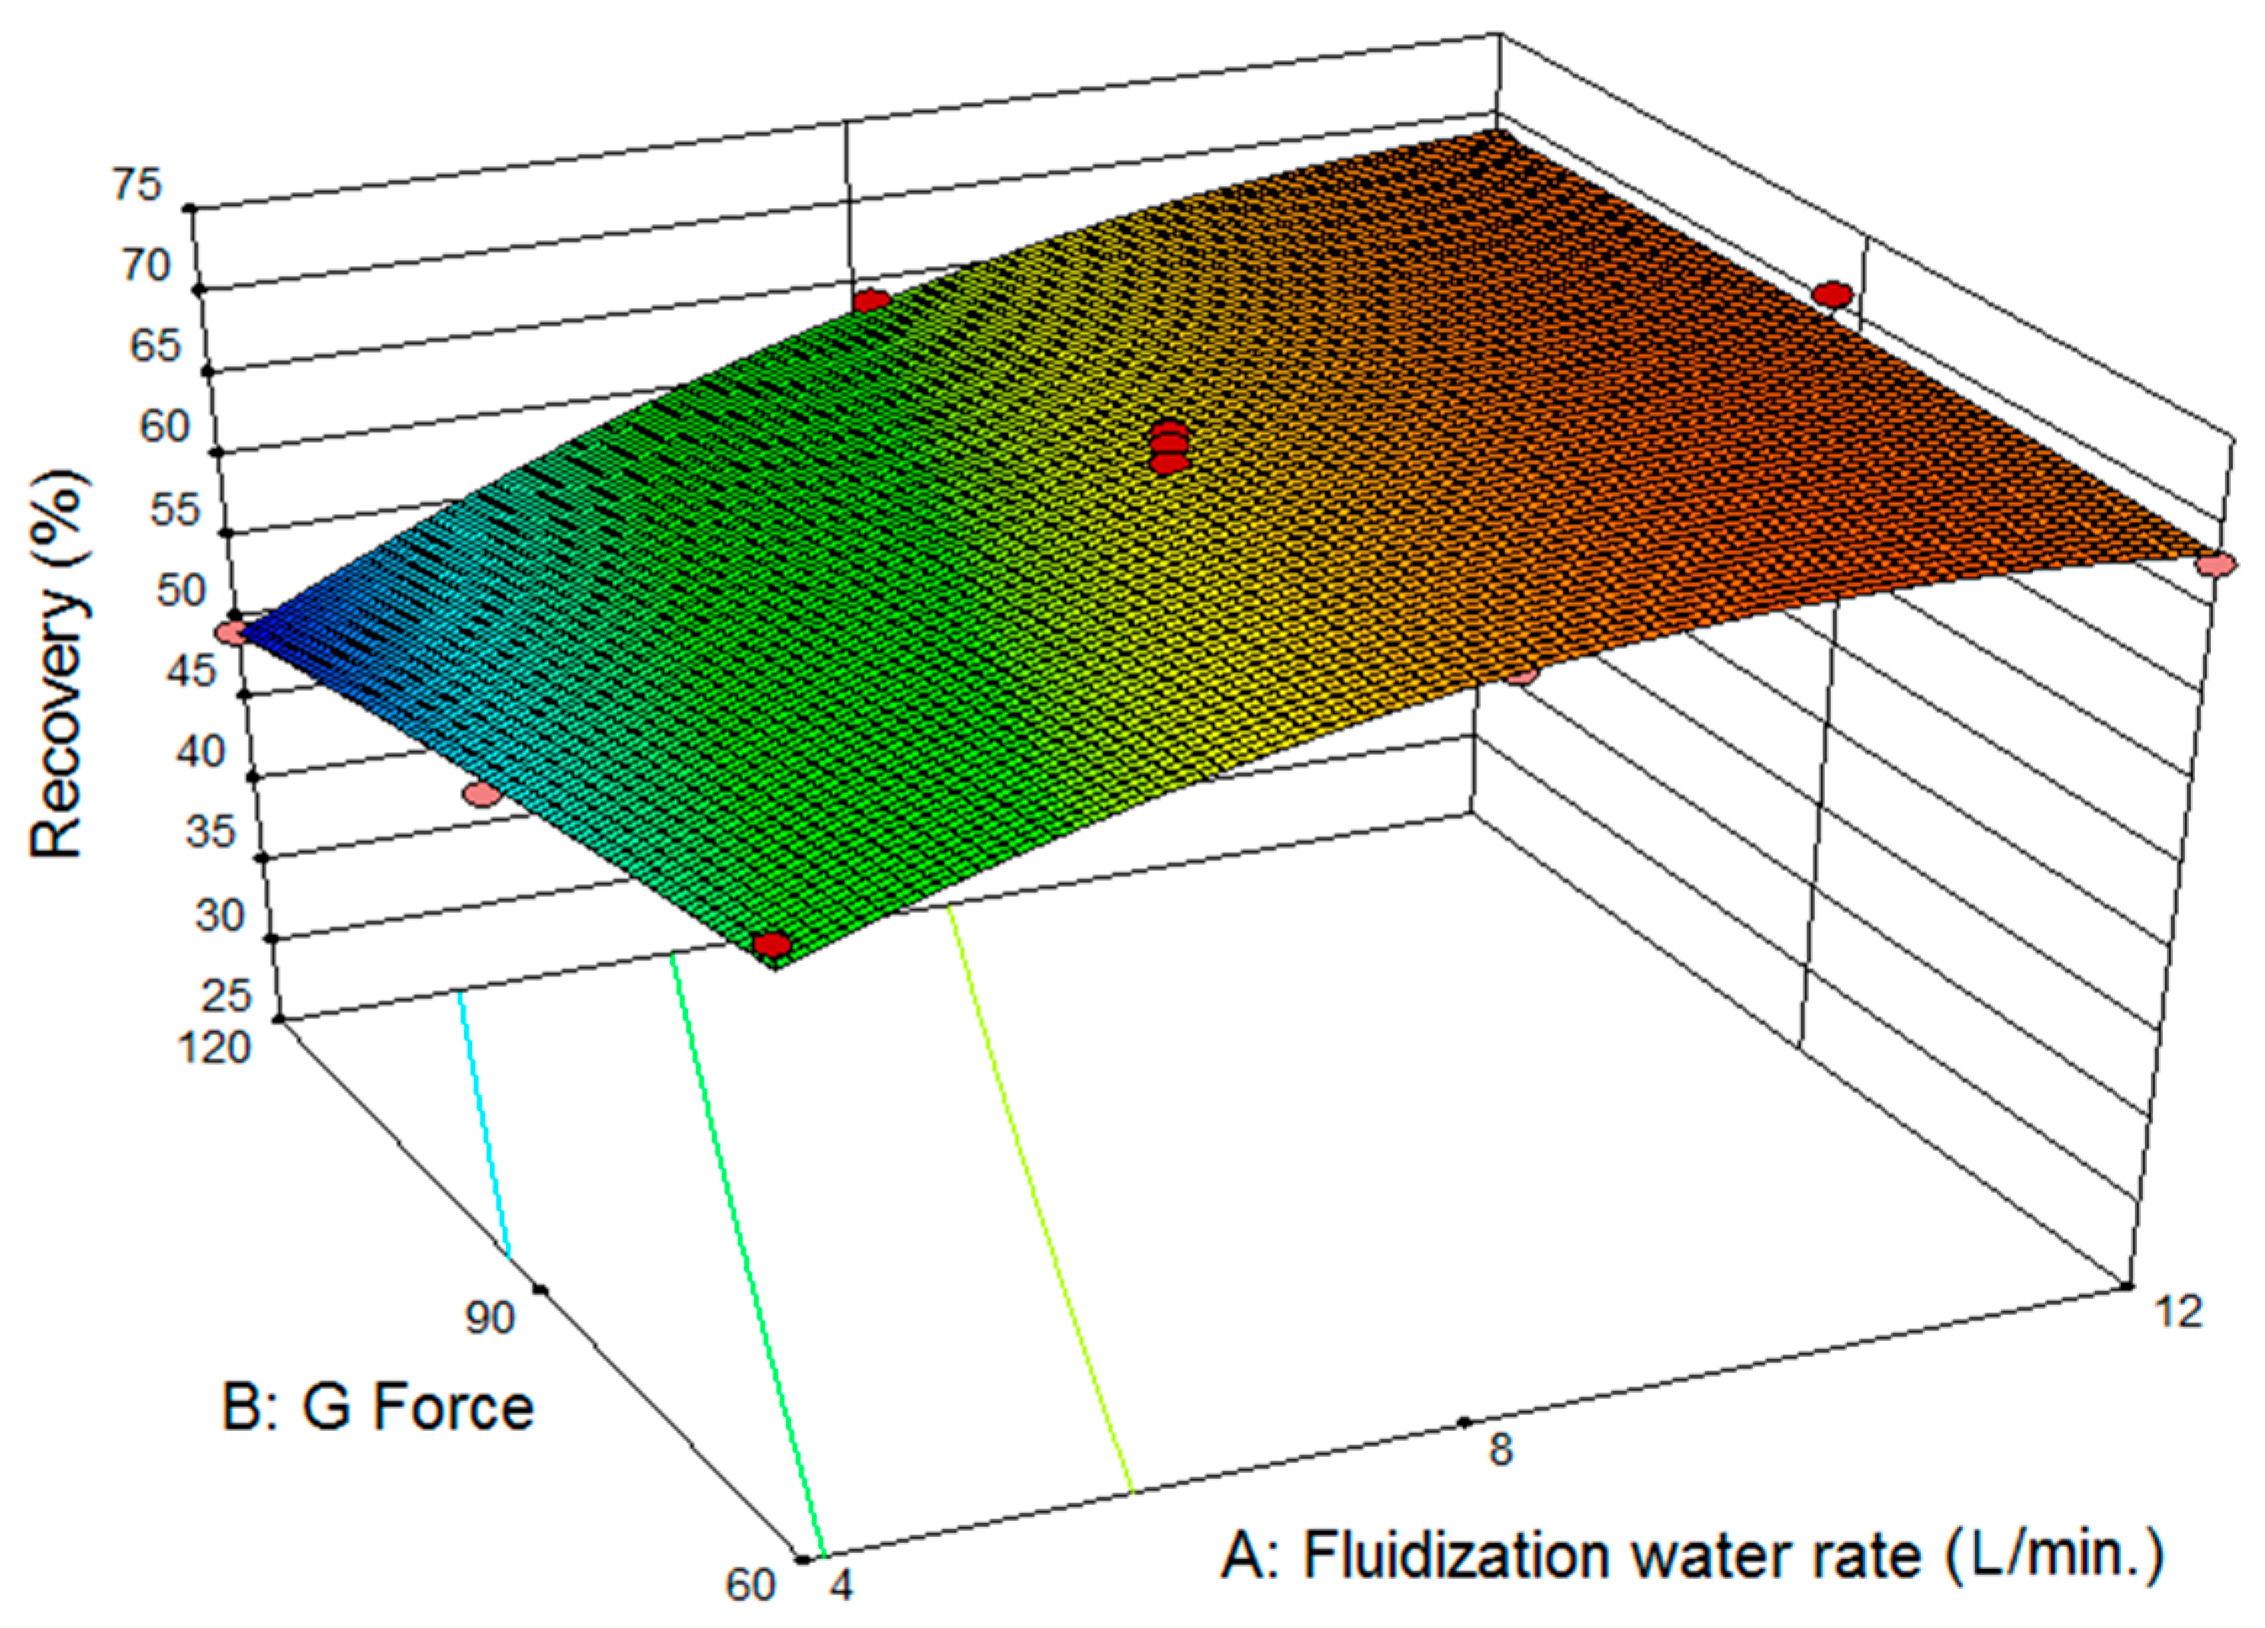
Figure 6 illustrates the effect of
G force and fluidization water flow rate on the recovery of Cr
2O
3 in the Knelson concentrate. Feed rate was kept constant at the center level during this test. At low level of fluidization water rate, as the
G force increases, recovery of Cr
2O
3 decreases significantly due to inefficient fluidization of the separation layer inside the bowl. The highest recovery value was obtained by increasing fluidization water level to maximum for providing the appropriate conditions of fluidization.
Figure 7 shows the effect of fluidization water flow rate and feed rate on recovery of Cr
2O
3 in the concentrate of Knelson separator at the center level of
G force. As can be seen from
Figure 7, increasing fluidization water rate provides better fluidization conditions in the separation layer and helps to increase Cr
2O
3 recovery of concentrate. It should be noted that there is a significant decrease in the recovery of Cr
2O
3 at high feed rate when the fluidization water rate is low.
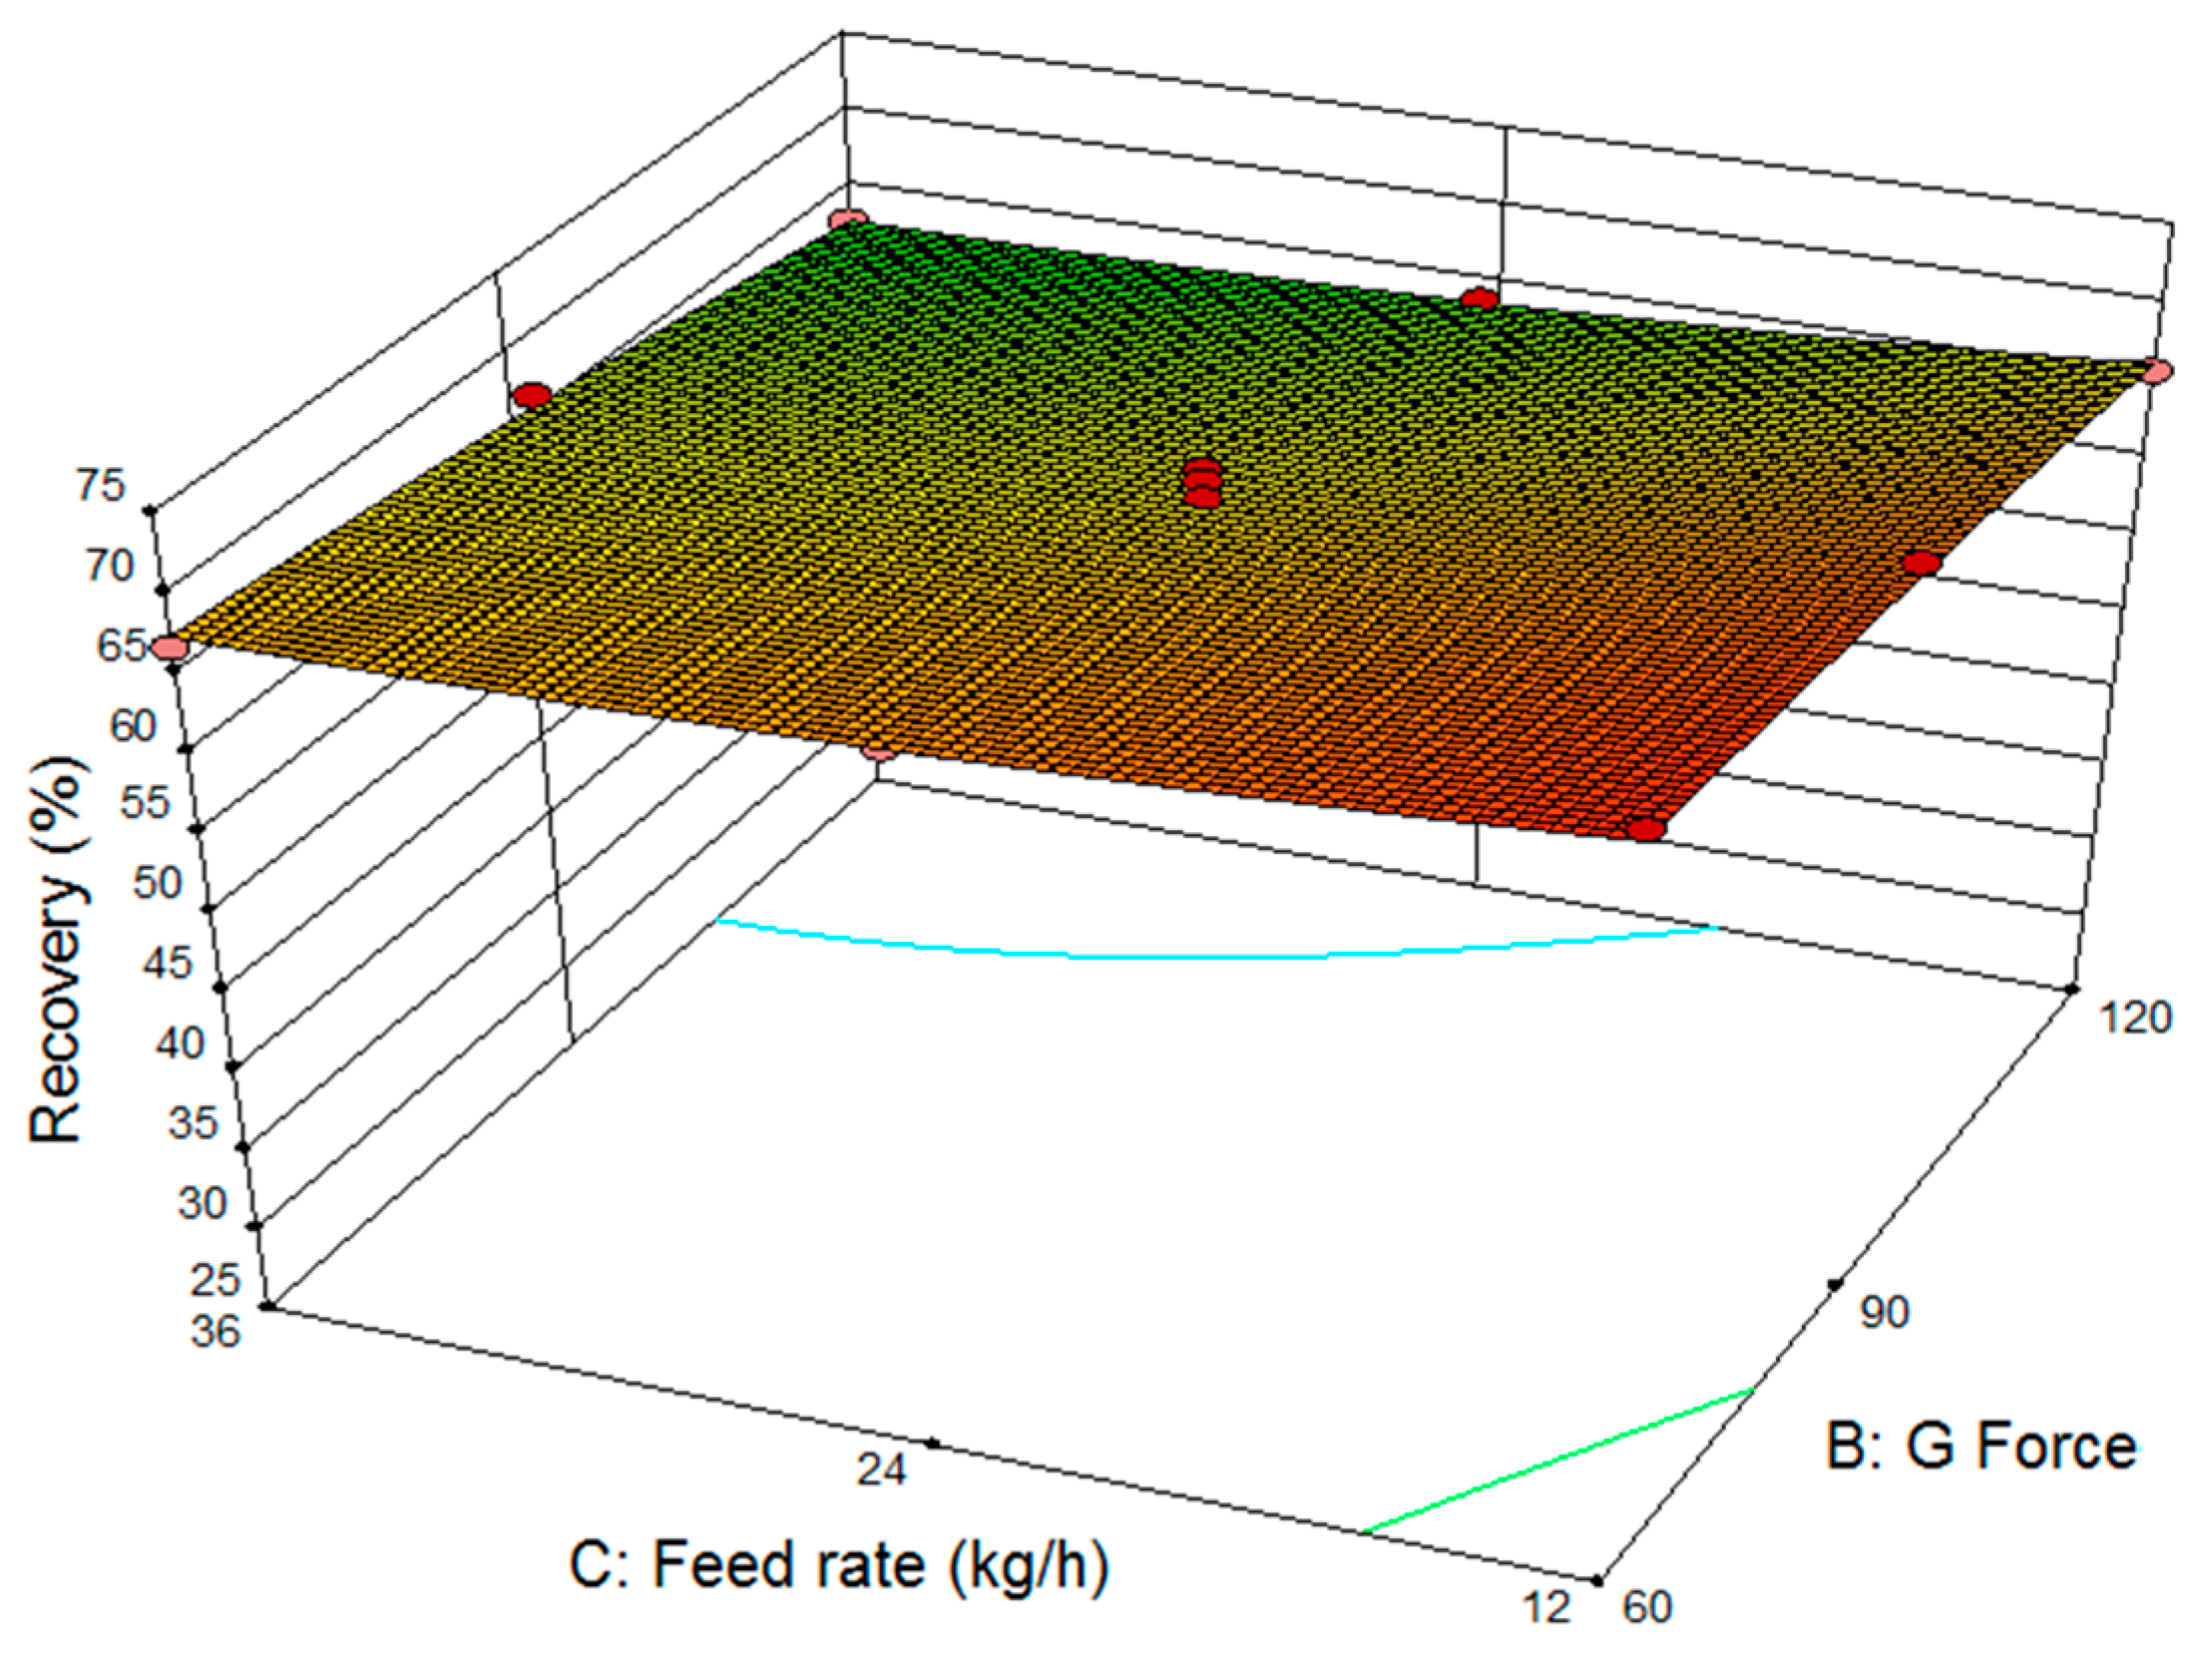
Figure 8 demonstrates the effect of feed rate and
G force on Cr
2O
3 recovery of the concentrate at the center level of fluidization water flow rate. As the
G force decreases the transport of the lighter particles to the tailing fraction degreases which in increases recovery of Cr
2O
3 to the concentrate fraction.
Figure 8 was plotted representing the recovery of Cr
2O
3 concentrate
vs. feed rate and
G force. The Cr
2O
3 recovery of the concentrate increases with decrease in feed rate and
G force. The lowest level of both independent variables appears to be providing favorable conditions for an efficient separation at this level of fluidization water flow. Increasing any of these variables to a higher level seems to change the fluidization conditions and lower the Cr
2O
3 recovery due to the disruption of the separation layer.
Figure 6.
The response surface plot representing the effect of fluidization water flow rate and applied G force on the Cr2O3 recovery of the concentrate.
Figure 6.
The response surface plot representing the effect of fluidization water flow rate and applied G force on the Cr2O3 recovery of the concentrate.
Figure 7.
The response surface plot representing the effect of fluidization water flow rate and feed rate on the Cr2O3 recovery of the concentrate.
Figure 7.
The response surface plot representing the effect of fluidization water flow rate and feed rate on the Cr2O3 recovery of the concentrate.
Figure 8.
The response surface plot representing the effect of G force and feed rate on the Cr2O3 recovery of the concentrate.
Figure 8.
The response surface plot representing the effect of G force and feed rate on the Cr2O3 recovery of the concentrate.
3.4. Validation of the Models
For validation of the obtained models for predicting the grade and recovery of Cr
2O
3 content in concentrate, nine additional tests were conducted using different levels of independent variables. The test conditions and results are presented in
Table 6.
Table 6.
The conditions and actual and predicted results of the validation tests.
Table 6.
The conditions and actual and predicted results of the validation tests.
| Run Number | Conditions | Grade, Cr2O3 % | Recovery, Cr2O3 % |
|---|
| A | B | C | Actual | Predicted | Actual | Predicted |
|---|
| 1 | 4 | 60 | 18 | 31.8 | 33.1 | 57.5 | 60.5 |
| 2 | 8 | 41.3 | 40.3 | 72.7 | 69.6 |
| 3 | 12 | 41.8 | 42.8 | 69.1 | 69.7 |
| 4 | 4 | 90 | 29.5 | 30.7 | 53.0 | 56.2 |
| 5 | 8 | 37.6 | 37.7 | 68.7 | 67.8 |
| 6 | 12 | 40.5 | 40.0 | 72.6 | 70.4 |
| 7 | 4 | 120 | 28.7 | 28.6 | 50.8 | 51.0 |
| 8 | 8 | 35.1 | 35.4 | 64.5 | 65.2 |
| 9 | 12 | 41.1 | 37.5 | 72.3 | 70.3 |
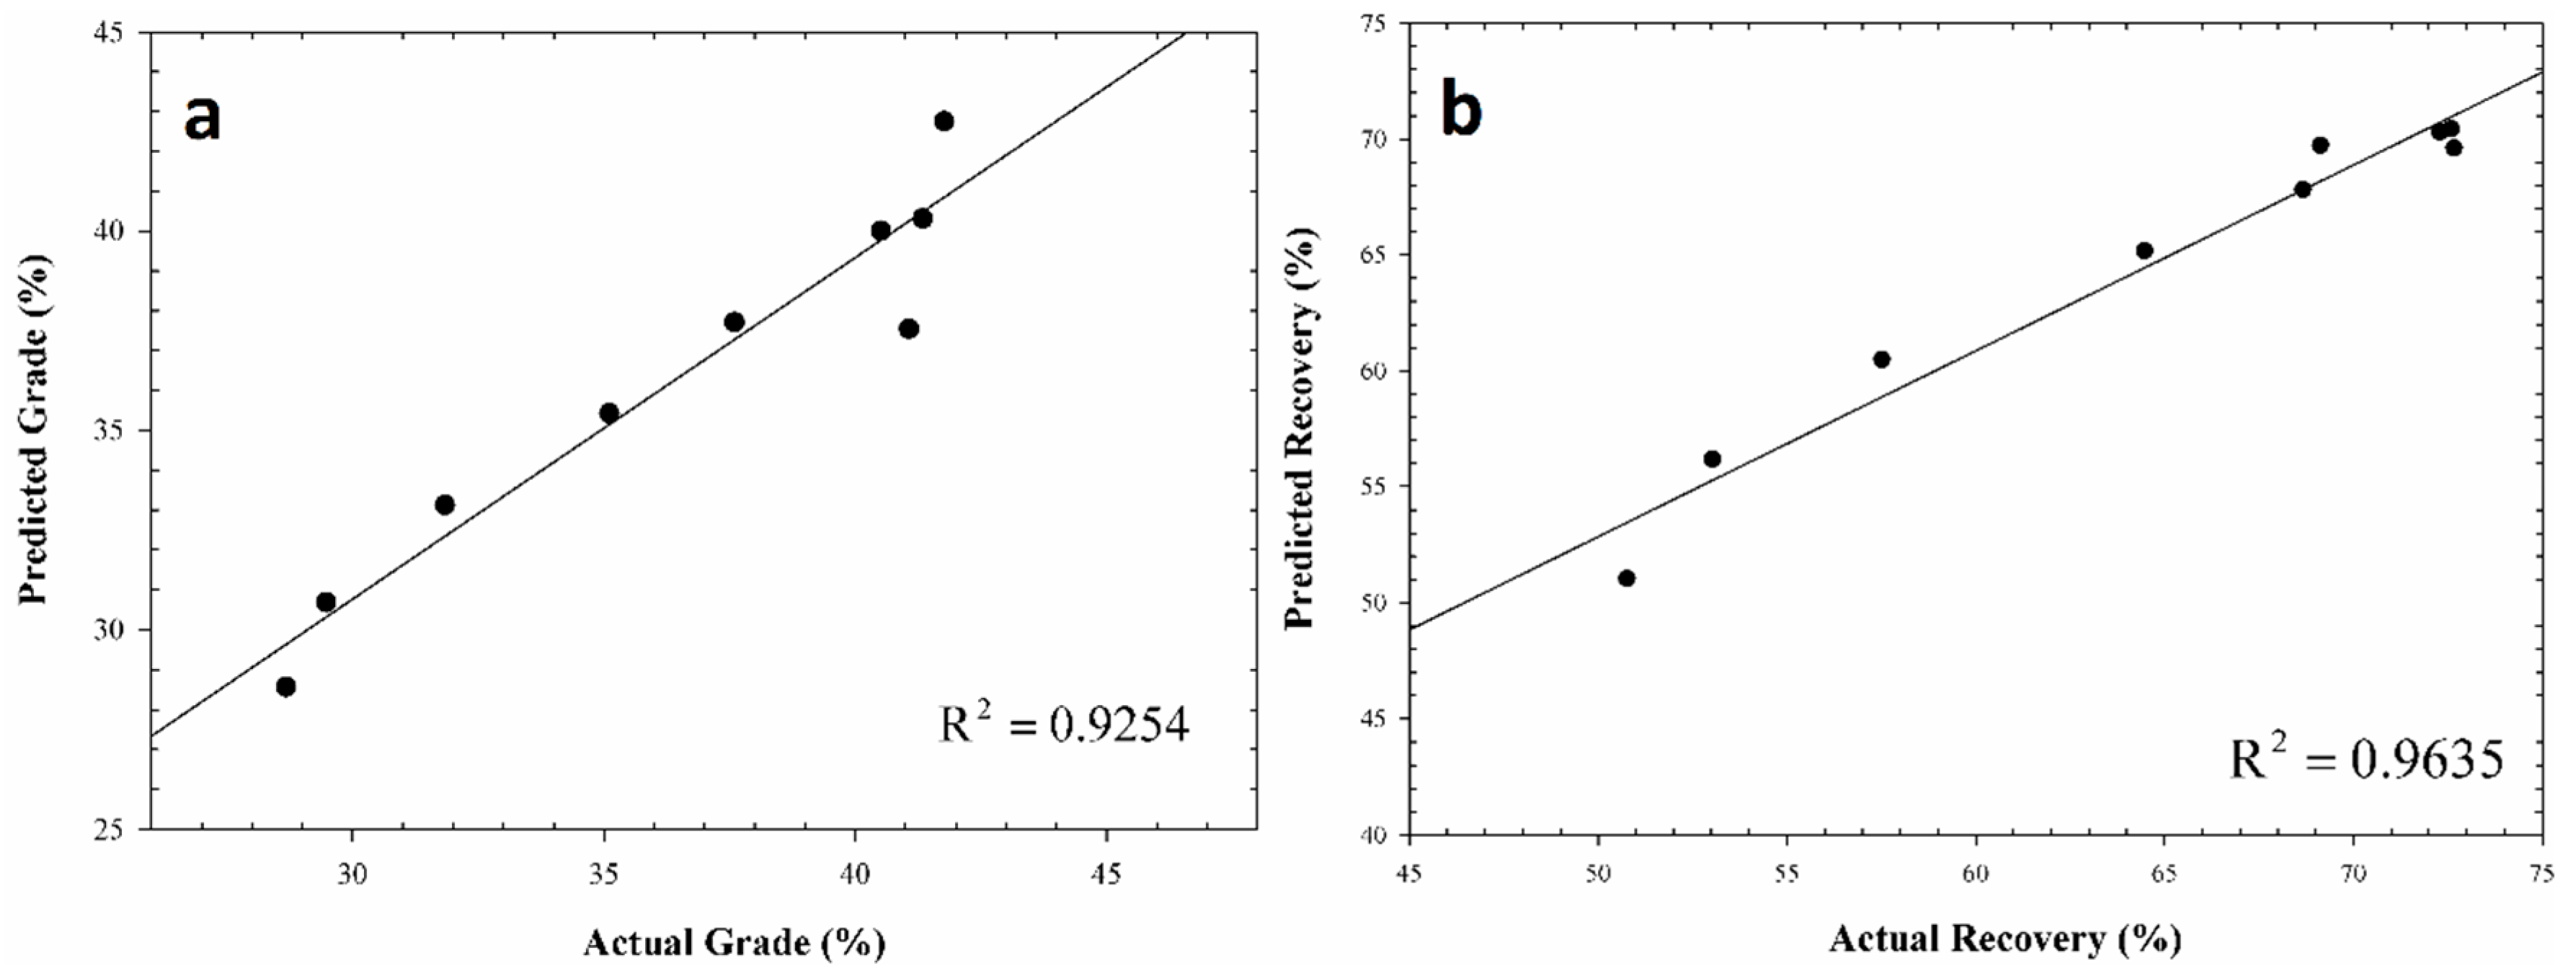
The observed results and the predicted results for both responses are illustrated in
Figure 9.
Figure 9 shows that the predicted values are consistent with the observed values, with
R2 of 0.9254 percent for grade and
R2 of 0.9635 percent for recovery of chromite concentrates.
Figure 9.
Relationship between actual and predicted results of the validation tests. ((a) Grade; (b) Recovery)
Figure 9.
Relationship between actual and predicted results of the validation tests. ((a) Grade; (b) Recovery)


