1. Background
Before concentration, metal ores have to be crushed and ground in order for the metal bearing minerals to be liberated. Sufficient size reduction by comminution is not only a prerequisite for any downstream physical separation, but is also the processing step within mineral processing that has the highest energy demand, and which, in practice, is often the limiting factor for plant capacity. Reliable testing of the ore’s comminution behavior that provides information about the particle size distribution after fracture identifies the achieved mineral liberation, and determines the comminution energy needed, therefore an integral step in the proper design of ore beneficiation plants.
In the past, the process design has usually been based on particular representative reference samples that were analyzed and tested at different scales but failed to describe all the mineralogical variations occurring in an ore body. The limited picture obtained from this method can lead to insufficient mineral liberation, or, on the flipside, to overgrinding, which leads to low recovery and selectivity in physical separation [
1], resulting in poor plant performance and limited production capacity.
During the last few years, geometallurgy has evolved as a new interdisciplinary approach to improving resource efficiency. Geometallurgy combines geological and metallurgical information to create a spatially-based predictive model for mineral processing to be used in production management [
2]. Within the geometallurgical approach, the entire ore body is explored in order to identify the variation within the resource and to establish spatial geometallurgical domains that show differential responses to mineral processing. Using these geometallurgical domains in the design of ore beneficiation plants and mine scheduling, allows for higher flexibility in response to changes in the plant feed when mining different parts of the ore [
3].
Setting up a geometallurgical program for an ore deposit requires extensive test work, particularly in comminution and physical separation. This can lead to economic benefits, owing to improved plant operation, yet is time consuming and correspondingly costly. The best possible utilization of the available sample material is crucial, since chemical and rock mechanical analyses require samples and thereby limit the available sample amount. Accordingly, the need for efficient geometallurgical testing provides a stimulus for developing new fast comminution test methods or for revising extant test procedures. Improved process models need to be conceived that subsequently make use of the additional information provided for by the geometallurgical approach [
4].
Particular requirements resulting from geometallurgical programs make it necessary to analyze the comminution test methods available. Based on published information, this paper provides an overview of standard test methods used for the investigation of ore comminution behavior and evaluates their applicability and potential in the geometallurgical context by defining the corresponding evaluation criteria. Besides the test work itself, the provision of suitable parameters for comminution process modeling is also considered.
2. Criteria of Evaluation
The term “comminution behavior” subsumes the complex interaction of material properties and process parameters. In practice, different comminution test methods are used for different applications.
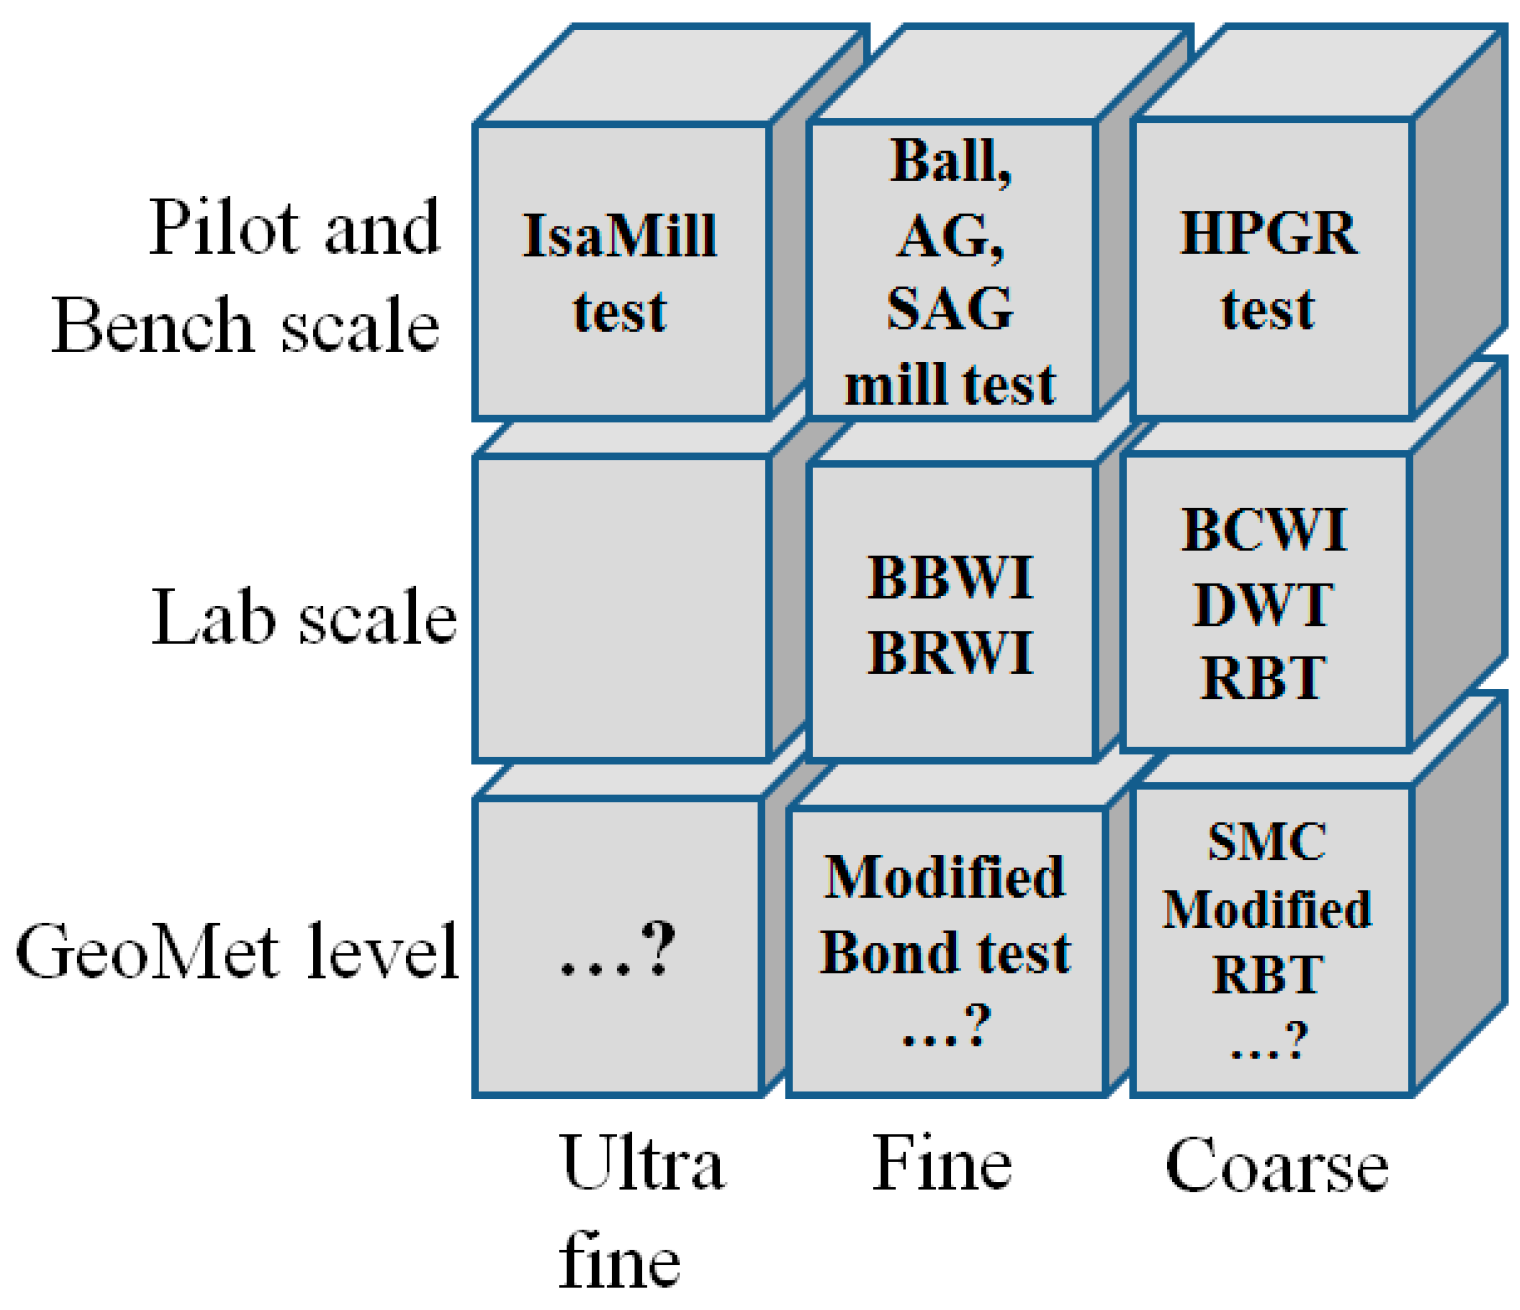
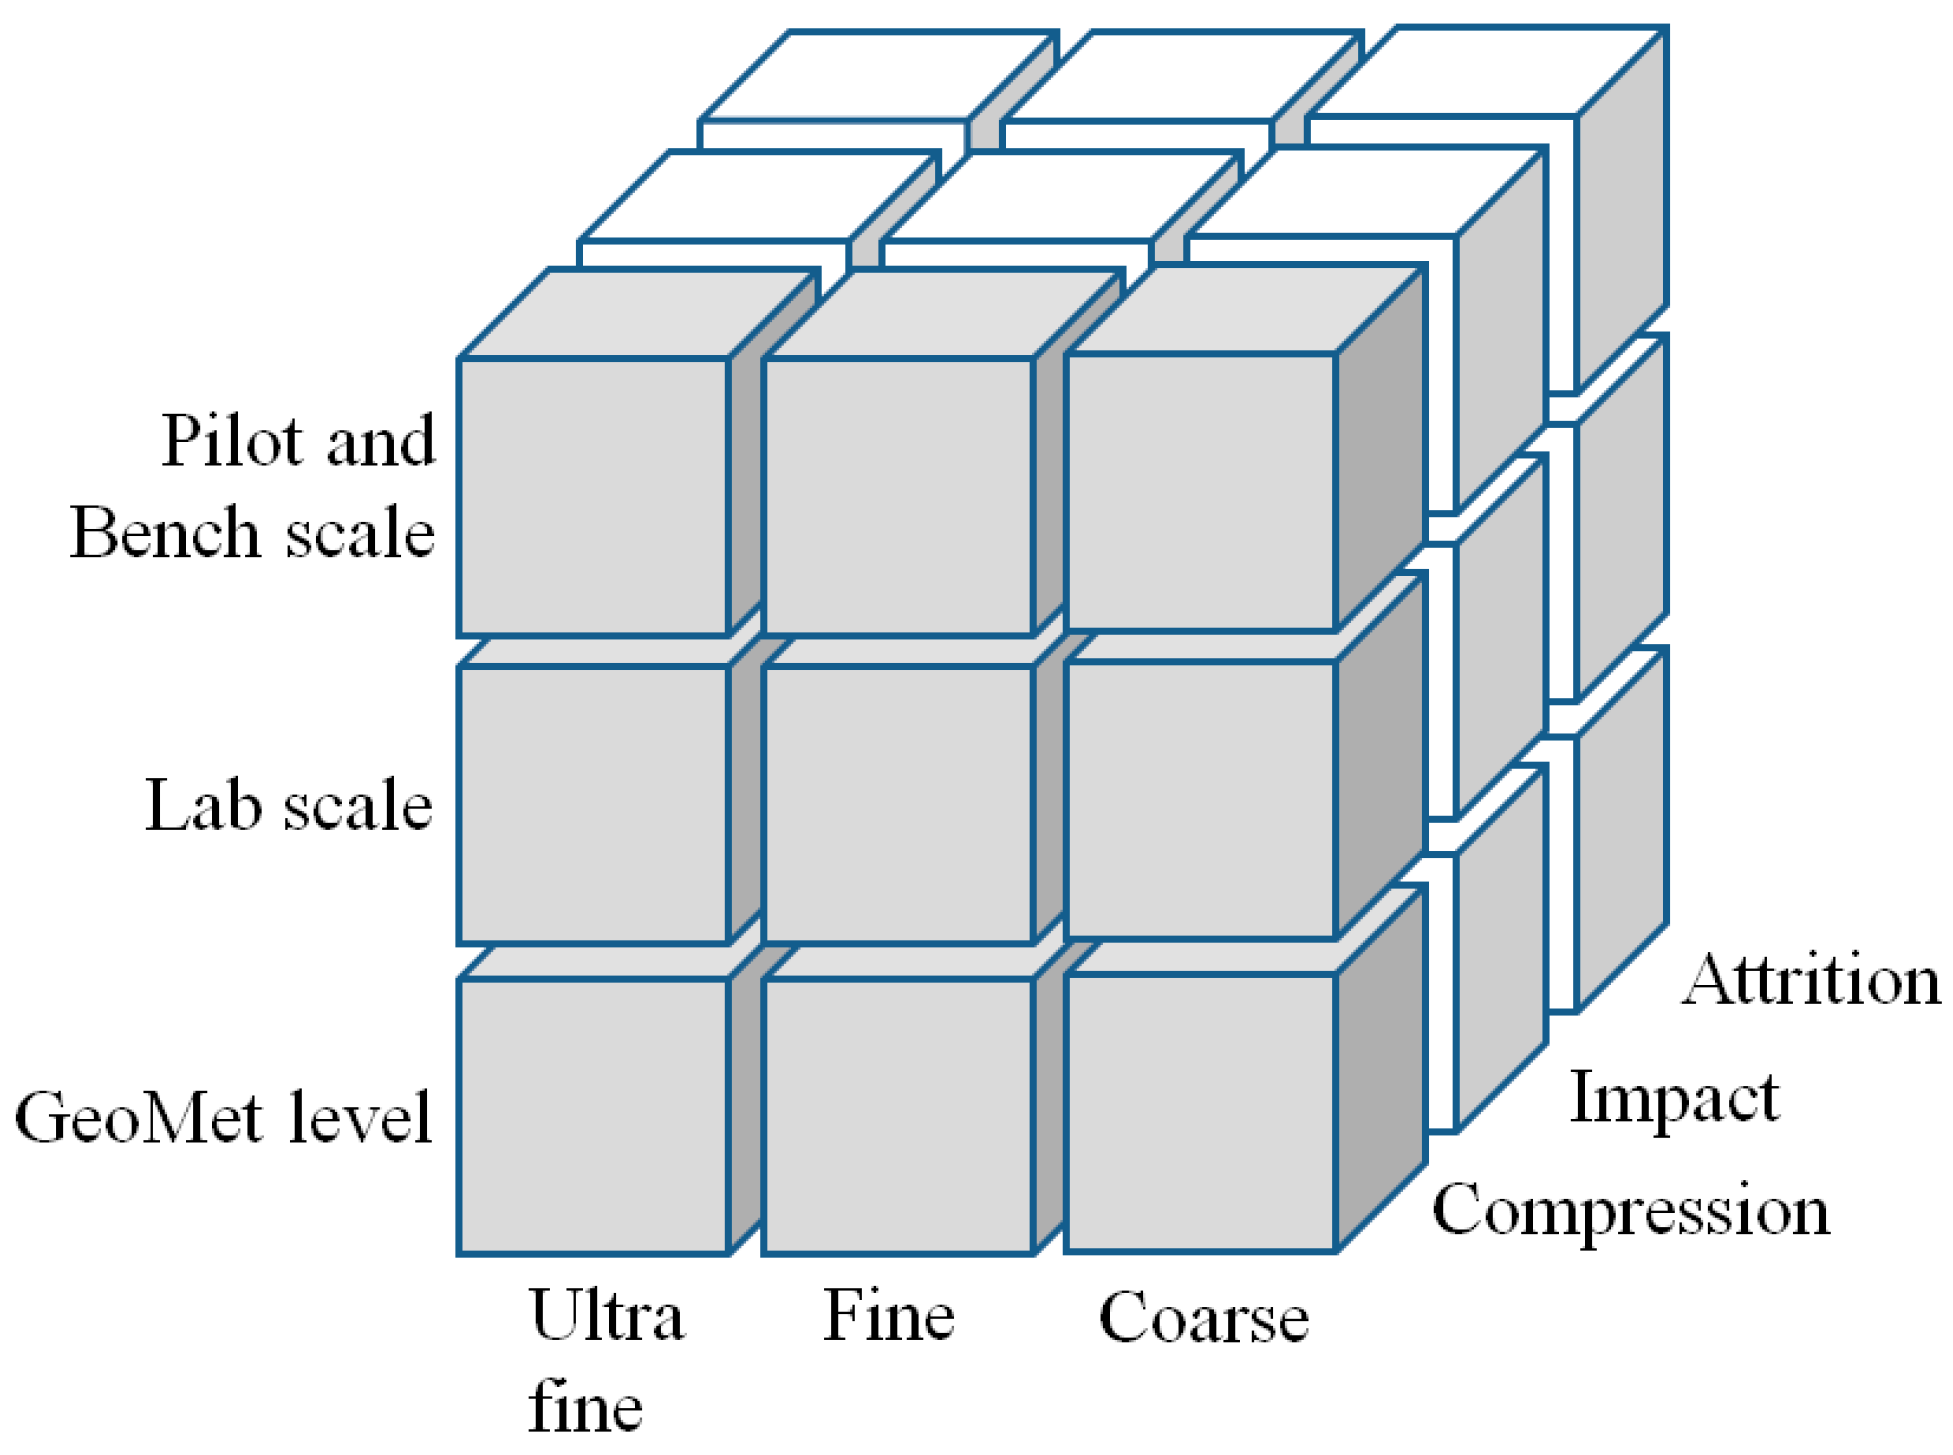
Figure 1 illustrates the dimensions for categorizing the existing comminution test methods. One of the most important dimensions is the particle size. As the comminution properties change with particle size, different tests ranging from crushing to grinding and very fine grinding are employed accordingly.
Furthermore the type of mechanical stress applied in a certain crusher or mill type, i.e., compressive or impact stress, as well as the stress intensity and rate, have to be taken into account in the context of selecting a suitable test method.
Figure 1.
Dimensions in test categorization (GeoMet level = geometallurgical level).
Figure 1.
Dimensions in test categorization (GeoMet level = geometallurgical level).
Another dimension is given by the scale of the test, ranging from pilot scale testing down to testing on the geometallurgical level that requires very small sample amounts. The applicability of a comminution test will therefore depend on the project stage and the available sample amount, ranging from drill core sections or hand-picked single particles used in the early stages of the resource evaluation, and at laboratory scale, to pilot scale tests where the metallurgical performance is verified using several tens or hundreds of kilograms of sample. With larger scales the effort in terms of time and cost per test increases. Particularly this third dimension of available sample material will limit the test work to certain methods, i.e., during the different stages of a project tests at different scales need to be considered.
For geometallurgical purposes, the outcome of the experimental work not only is used for resource characterization but has to serve as an input to process modeling,
i.e., comminution test results need to be linked to the parameters used in the comminution process models. Within process modeling, different levels of modeling depth and complexity are used. Simple approaches use defined size distribution functions based on single parameters such as energy for grinding or machine-specific size reduction ratios. More sophisticated, rigorous models apply population-balance methods. Here the entire breakage distribution function needs to be constructed based on experimental test work or sampling and back-calculation from continuous comminution tests at an even larger scale [
5]. In this context, it must be noted that a methodology that both comprises size reduction and energy for size reduction, and also incorporates mineral liberation within experimental work and process modeling, is still missing.
As discussed above, a geometallurgical program imposes particular requirements on the efficiency and manageability of test methods. Typically, the number of samples needed for realistic testing of the variability within a deposit is relatively large (number of samples > 1000) before an ore body can be divided into domains [
6]. A comminution test for geometallurgical purposes should therefore fulfill several technical and economical criteria:
Simplicity: The test should be relatively simple and easy to implement. It should use instruments that are readily available in conventional analytical and mineral processing laboratories.
Repeatability: The test should be repeatable and not depend on the individual person conducting the test work.
Sample preparation: Sample preparation should be possible with low effort and possible to undertake using basic skills or after a short training period.
Time exposure and costs: The test should be fast and inexpensive, i.e., for execution times of one hour it should be possible to conduct 1000 tests within half a year.
Sample amount: The amount of sample per test should be < 0.5 kg. Preferably rejects from chemical assays should be sufficient.
Link to modeling: Tests should provide parameters that can directly be used in process modeling and simulation.
Mineral liberation: Tests should be easy to extend in order to complement mineral liberation information.
Another criterion is the precision and the statistical quality of the test results. With respect to accuracy, a proper quantification is not an easy task, since the entire chain of sampling and sample preparation, in conjunction with the test and analysis method, needs to be considered. Statistical quality is a parameter that, from the perspective of geometallurgy, not only has to be judged with respect to the repetition of single tests but also in relation to generating a comprehensive data set for the entire geometallurgical program, i.e., a compromise between the quality of single measurements and the overall quantity of measured points must be reached.
3. Review of Existing Test Methods
In the following sections, commonly-used comminution test methods which are of potential use in the geometallurgical context are reviewed against the criteria listed above. The tests are categorized into three groups: (1) rock mechanical tests, (2) particle breakage tests, and (3) bench-scale grindability tests.
3.1. Rock Mechanical Testing
Rock mechanical tests for determining rock strength are usually conducted by means of compressive loading (universal test machines) or simplified instruments. Loading takes place at low velocities relative to other tests. The instrumentation of the test machine allows recording of the load applied to the sample and the displacement over time. Several standard test methods are used that differ in the loading conditions applied [
7]. These include uniaxial compressive test, triaxial test, point load test, indirect tensile strength test, and hardness tests.
Samples consist of drill core sections, parts of drill core sections and single particles (grab samples) that are cut to regular shape, and also irregularly-shaped particles. Measured strength parameters depend not only on the modal mineralogy but also on texture and anisotropy [
8].
3.1.1. Compression Tests
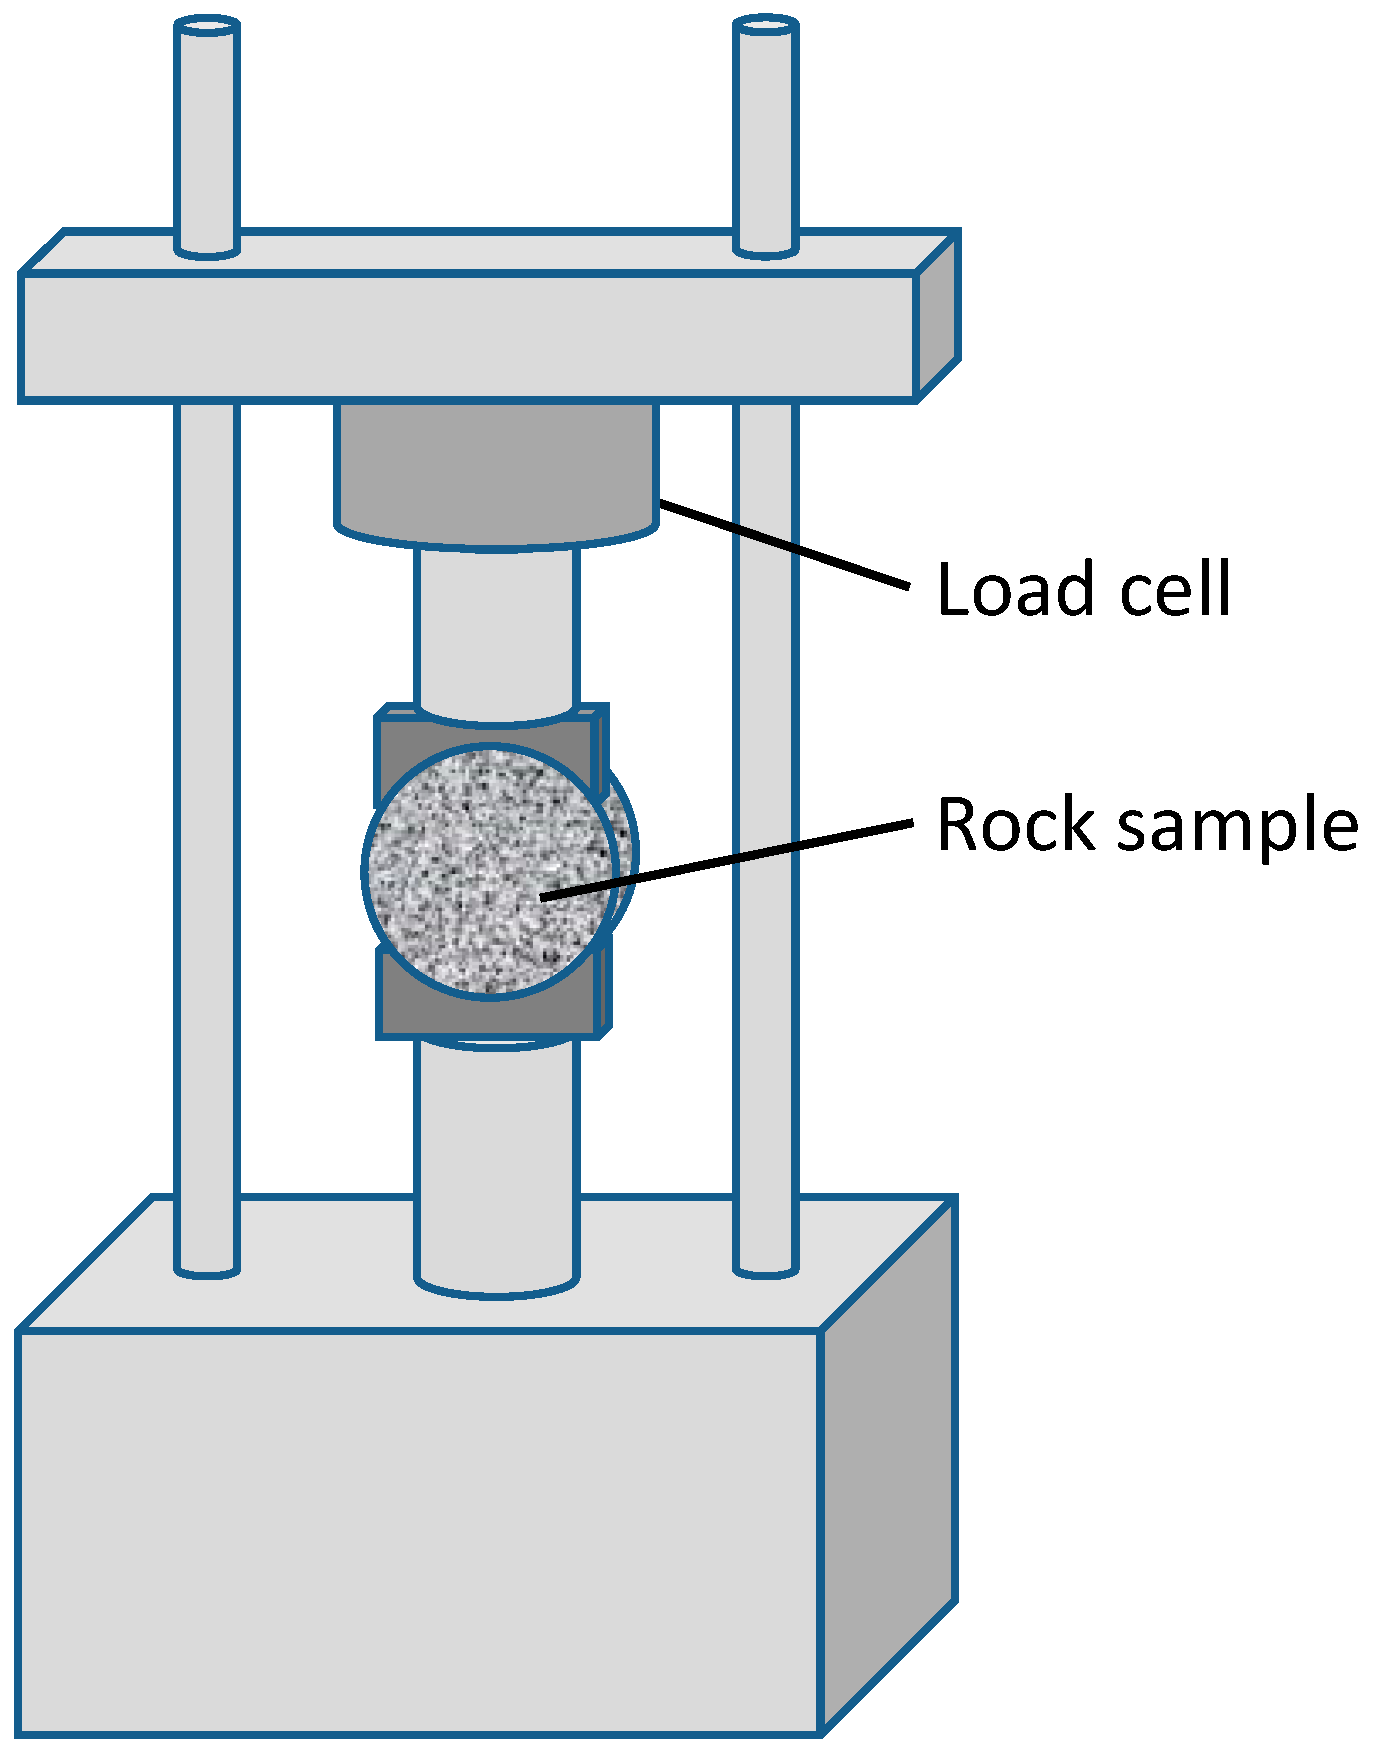
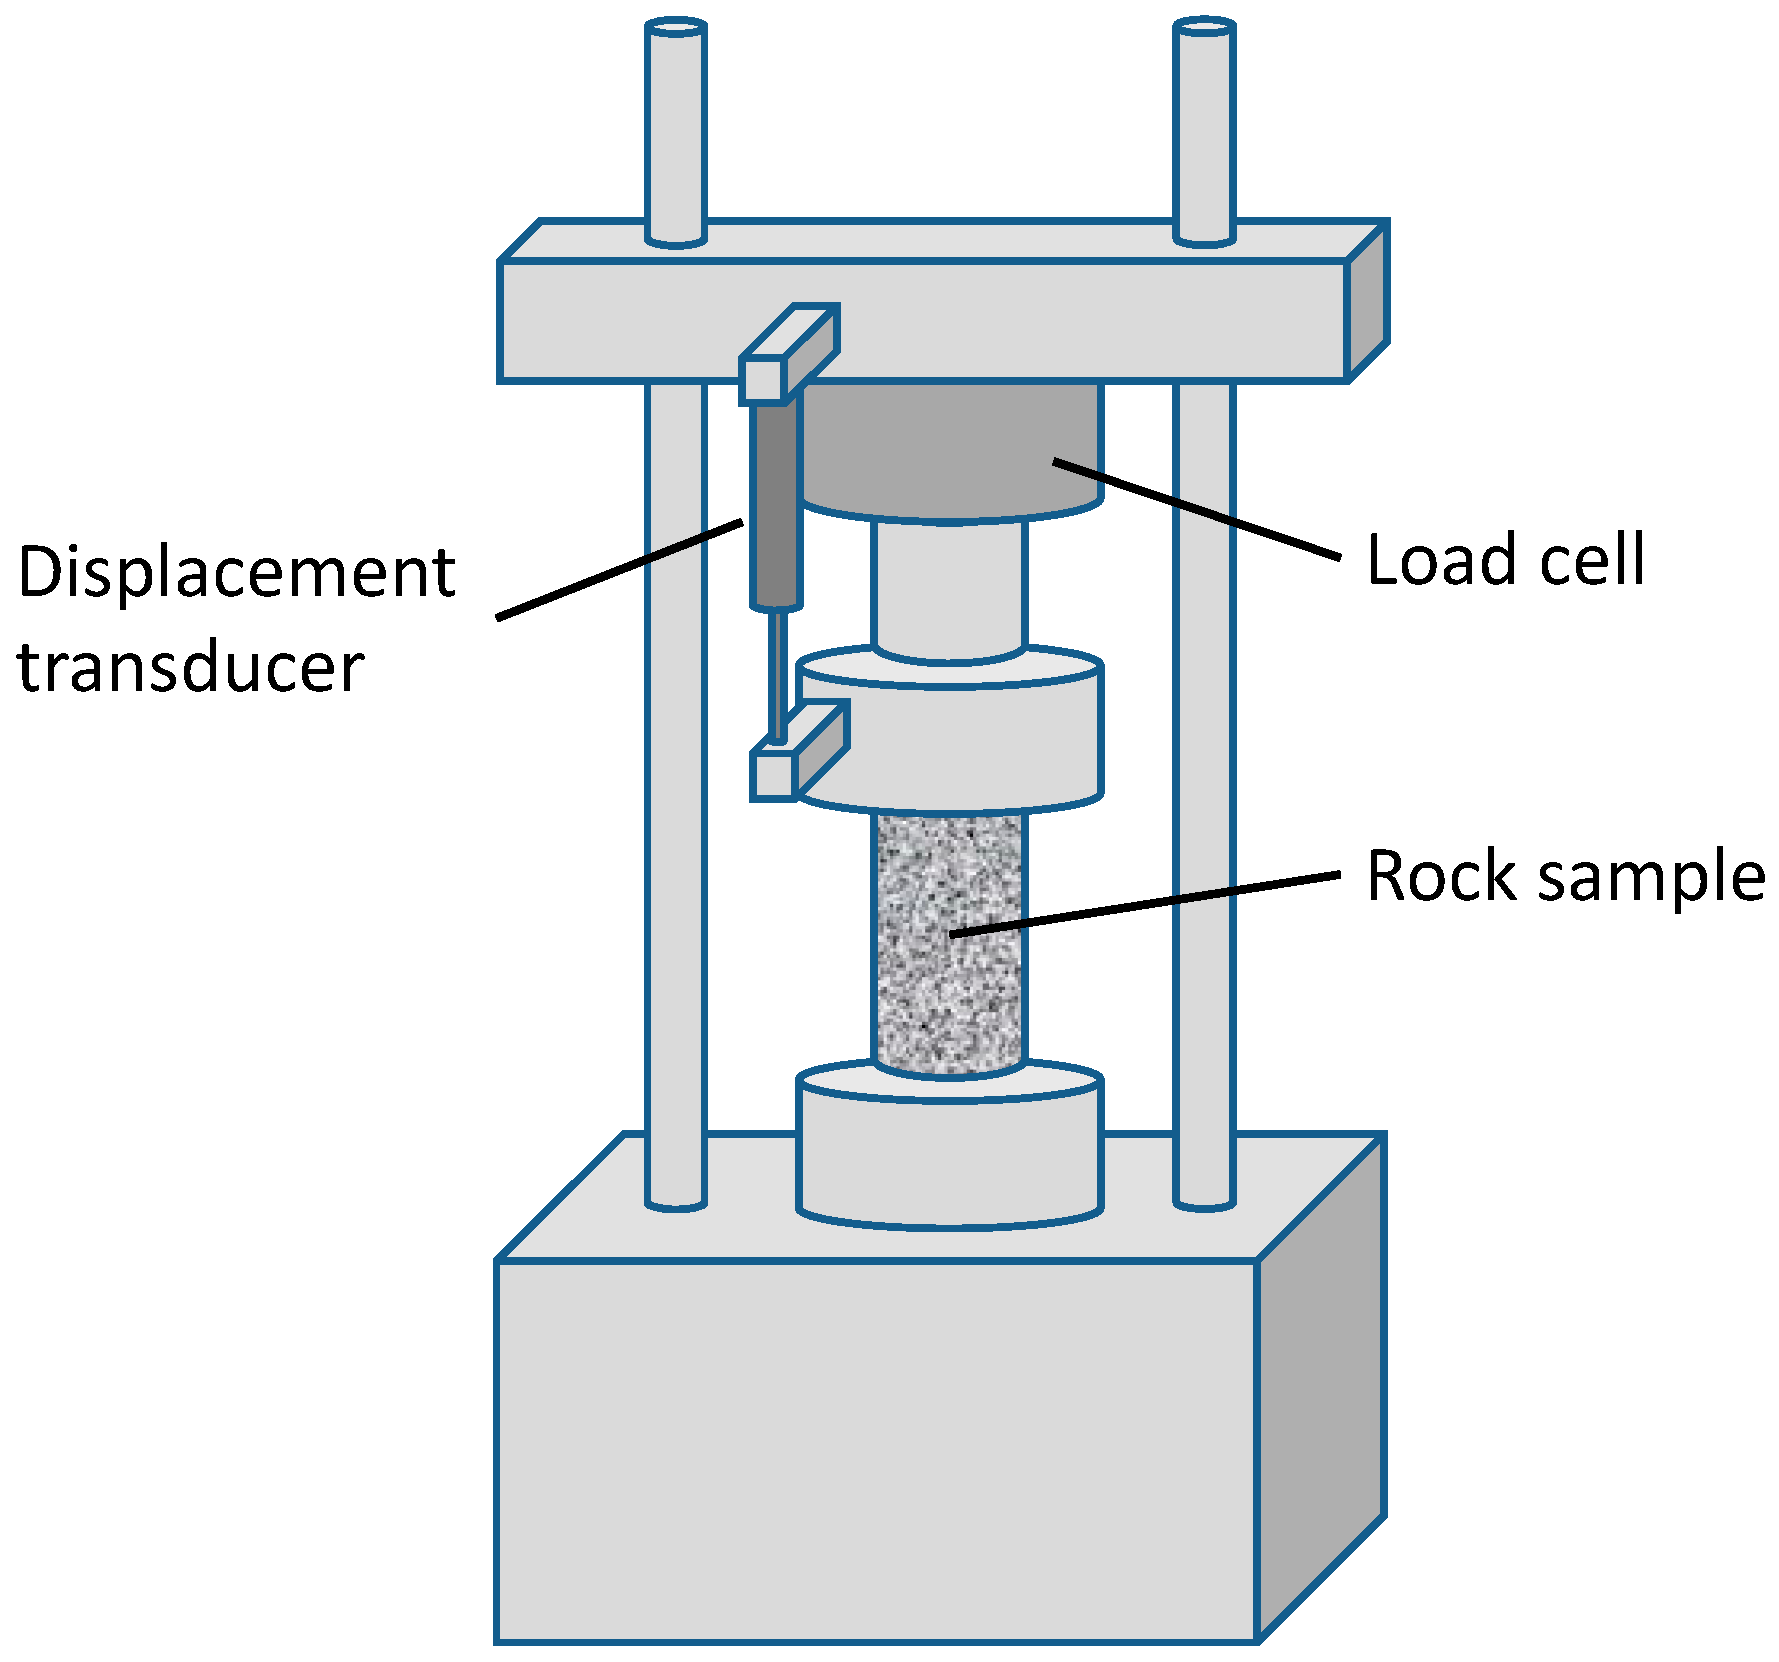
In compression tests, the drill core sample is pressed between the two parallel platens of the test machine, and is loaded until failure of the test specimen occurs. Data pairs of the applied load and the resulting displacement are recorded over time, yielding the maximum load for calculating the compressive strength. Sample preparation comprises careful cutting of the specimen’s top and bottom planes in order to prevent bending effects during the test.
In case the specimen is not further supported, the test is referred to as the
unconfined compressive strength (UCS)
test (
Figure 2). For triaxial compression tests, the drill core specimens are cut to the required length and then enveloped on the lateral surface by a membrane that seals the specimen from the surrounding pressure medium, usually oil, that provides the radial support. When increasing the axial compressive load, the oil pressure is likewise increased in parallel until failure of the specimen.
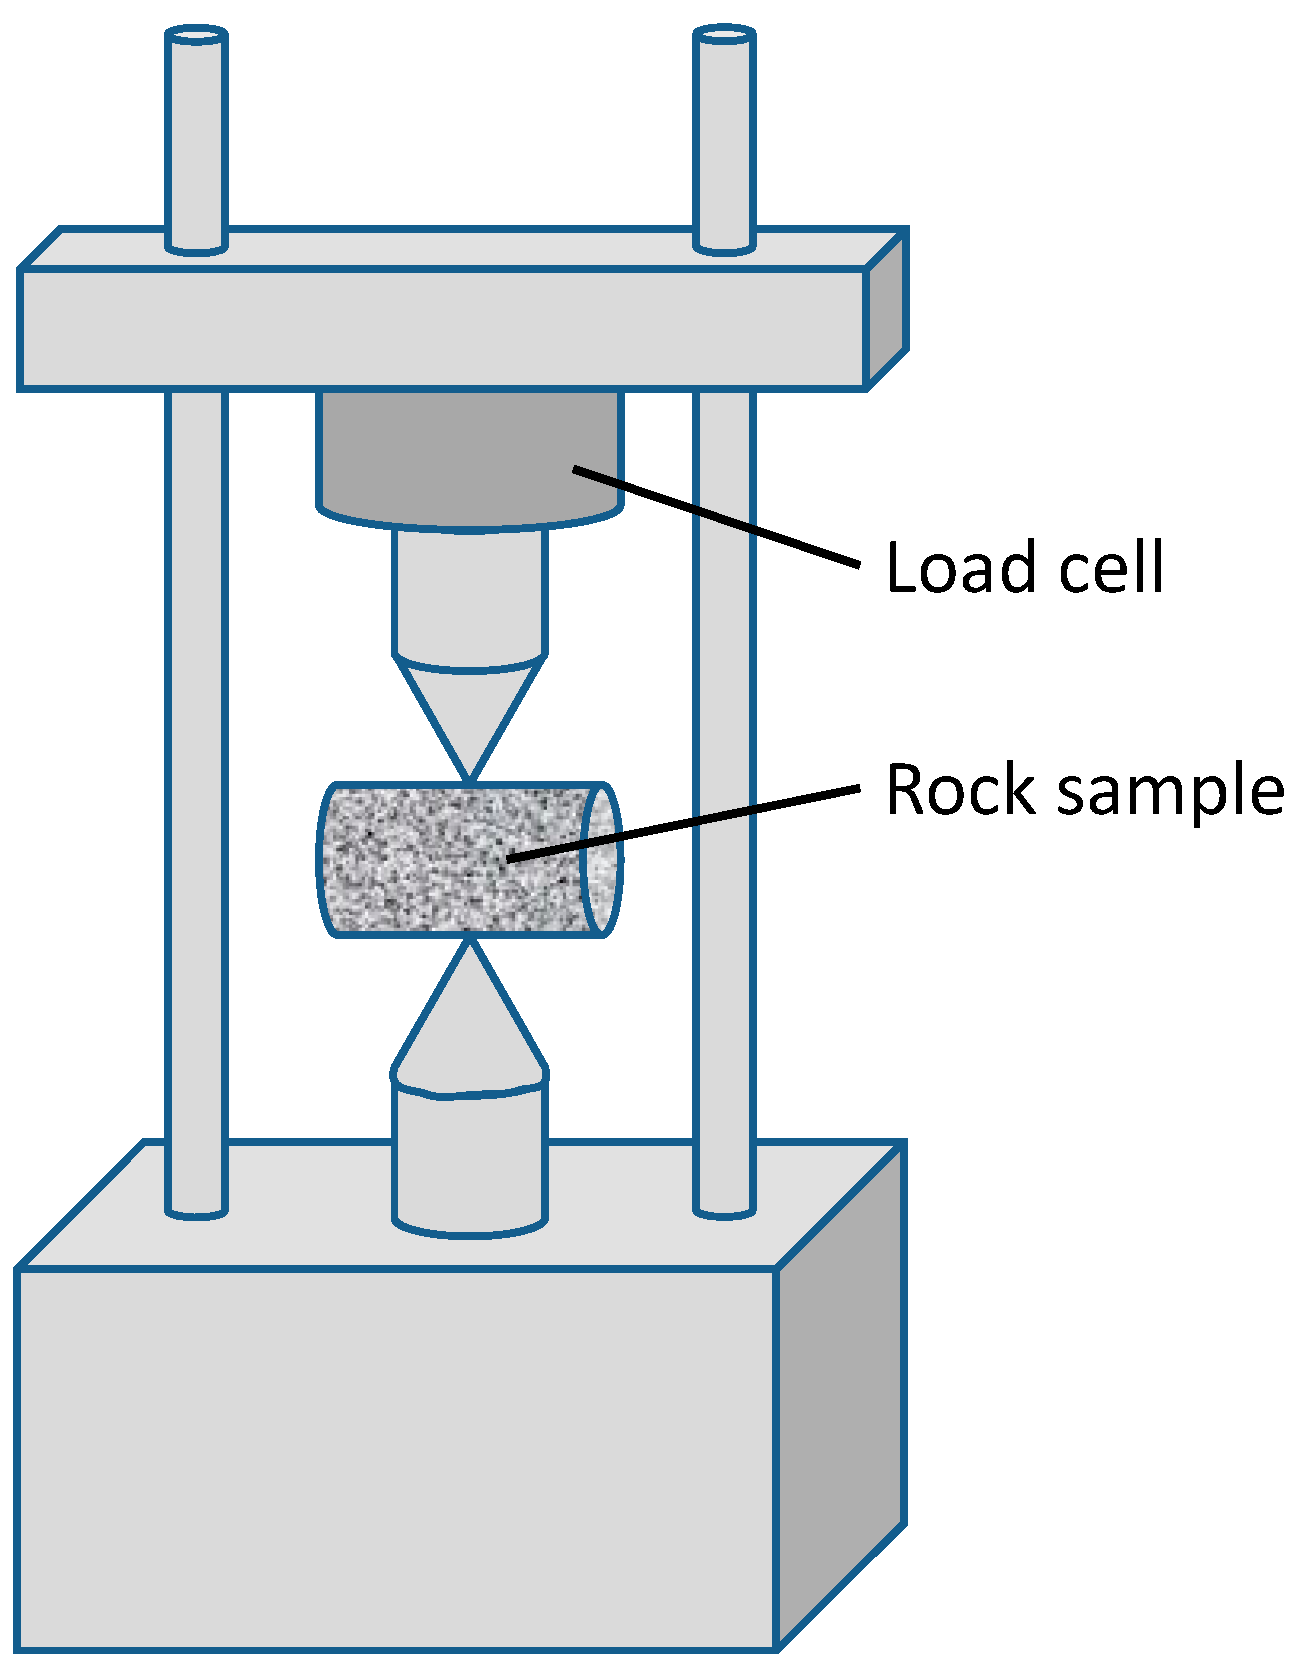
A similar experimental setup is used in the
point load test (PLT), see
Figure 3. Instead of using parallel planes, here the compressive load is applied between the tips of two cones, putting a point load on the specimen. These test instruments are quite compact and can even be used in the field.
Figure 2.
Uniaxial unconfined compression test.
Figure 2.
Uniaxial unconfined compression test.
Figure 3.
Point load test.
Figure 3.
Point load test.
The point load test gives the point load strength index
Is50 which needs to be corrected to the standard equivalent core diameter
De of 50 mm if other specimen sizes are used. The
Is50 is calculated by:
where
P is the failure load measured in Newton (N) and
De is in millimeter (mm). The point load strength index can be transferred into uniaxial compressive strength using a linear conversion factor that needs to be determined for a particular ore [
9]:
where
k is the ore -specific calibration constant.
3.1.2. Indirect Tensile Strength Test
Using cylindrical specimens, such as slices from drill cores, and loading them radially with compressive forces between two sockets (plates, cushioned plates, and curved clamps) gives an indirect tensile stress and a corresponding deformation in orthogonal direction. This experimental setup is also known as the
Brazilian test (
Figure 4).
The sample is stressed under a linear compressive load that induces tensile stress. Assuming that the material is homogeneous, isotropic, and linearly elastic before failure [
10], the failure is expected at the maximum tensile stress. The corresponding tensile strength σ
t (in N/mm
2) is then calculated by
where
P is the failure load (N),
D the specimen diameter (mm), and
t the thickness of the test specimen (mm).
Figure 4.
Brazilian test.
Figure 4.
Brazilian test.
3.1.3. Evaluation of Rock Mechanical Tests
Using results from rock mechanical tests to describe comminution behavior is an attractive approach, since no additional test work and sample material are needed. The necessary sample amounts are also small.
All the tests discussed above apply compressive stress in a well-defined way, meaning that the repeatability of the method is ensured, though the interpretation has to take into account the textural effects and the inhomogeneity of samples found in natural mineral resources. Implementation of the test is rather simple and can partly be done in the field. More effort has to be put into proper sample preparation, e.g., when sawing drill cores. Regarding mineral liberation analysis, the fragments generated are usually too coarse to be used in quantitative mineralogical analyses.
It has been shown that the mechanical parameters of rock samples can be used to describe and model comminution processes in the case of crushing [
11,
12,
13]. For this purpose, mechanical strength, expressed by the maximum load at the point of failure, needs to be transformed into quantities that can be used within the design of crushing stages, e.g., by linking the crusher reduction ratio or crushability index (CI) with compressive strength or impact strength index (ISI). For instance, Toraman
et al. [
14] suggest the following equation for calculating the CI:
The empirical correlations that are provided for calculating the crushing index or crusher reduction ratio from UCS or PLT strength values are then ore-specific.
Another application of indirect measurements to determine rock strength properties has been pursued by using non-destructive hardness testers, e.g., the EQUOtip hardness tester [
15,
16], which provide hardness indices received from drill core samples that can be empirically related to comminution behavior. The EQUOtip measures the impact and rebound velocities which are processed to determine the hardness value. The hardness values show correlation to unconfined compressive strength.
The evaluation of the different rock mechanical tests with respect to the criteria defined in
Section 2 is summarized in
Table 1. As the criteria are mainly of qualitative nature, the assessment has been based on the three different attributes
adverse,
acceptable and
advantageous.
Table 1.
Rock mechanical tests.
Table 1.
Rock mechanical tests.
| Adverse (−), Acceptable (O), Advantageous (+) | UCS | PLT | Brazilian | Hardness Tester |
|---|
| Simplicity | + | + | + | + |
| Repeatability | O | O | O | O |
| Sample preparation | − | O | − | + |
| Time exposure and costs | O | O | O | + |
| Sample amount | + | + | + | + |
| Link to modeling | O | O | O | O |
| Mineral liberation | − | − | − | − |
3.2. Particle Breakage Tests
3.2.1. Simple Drop Weight Test
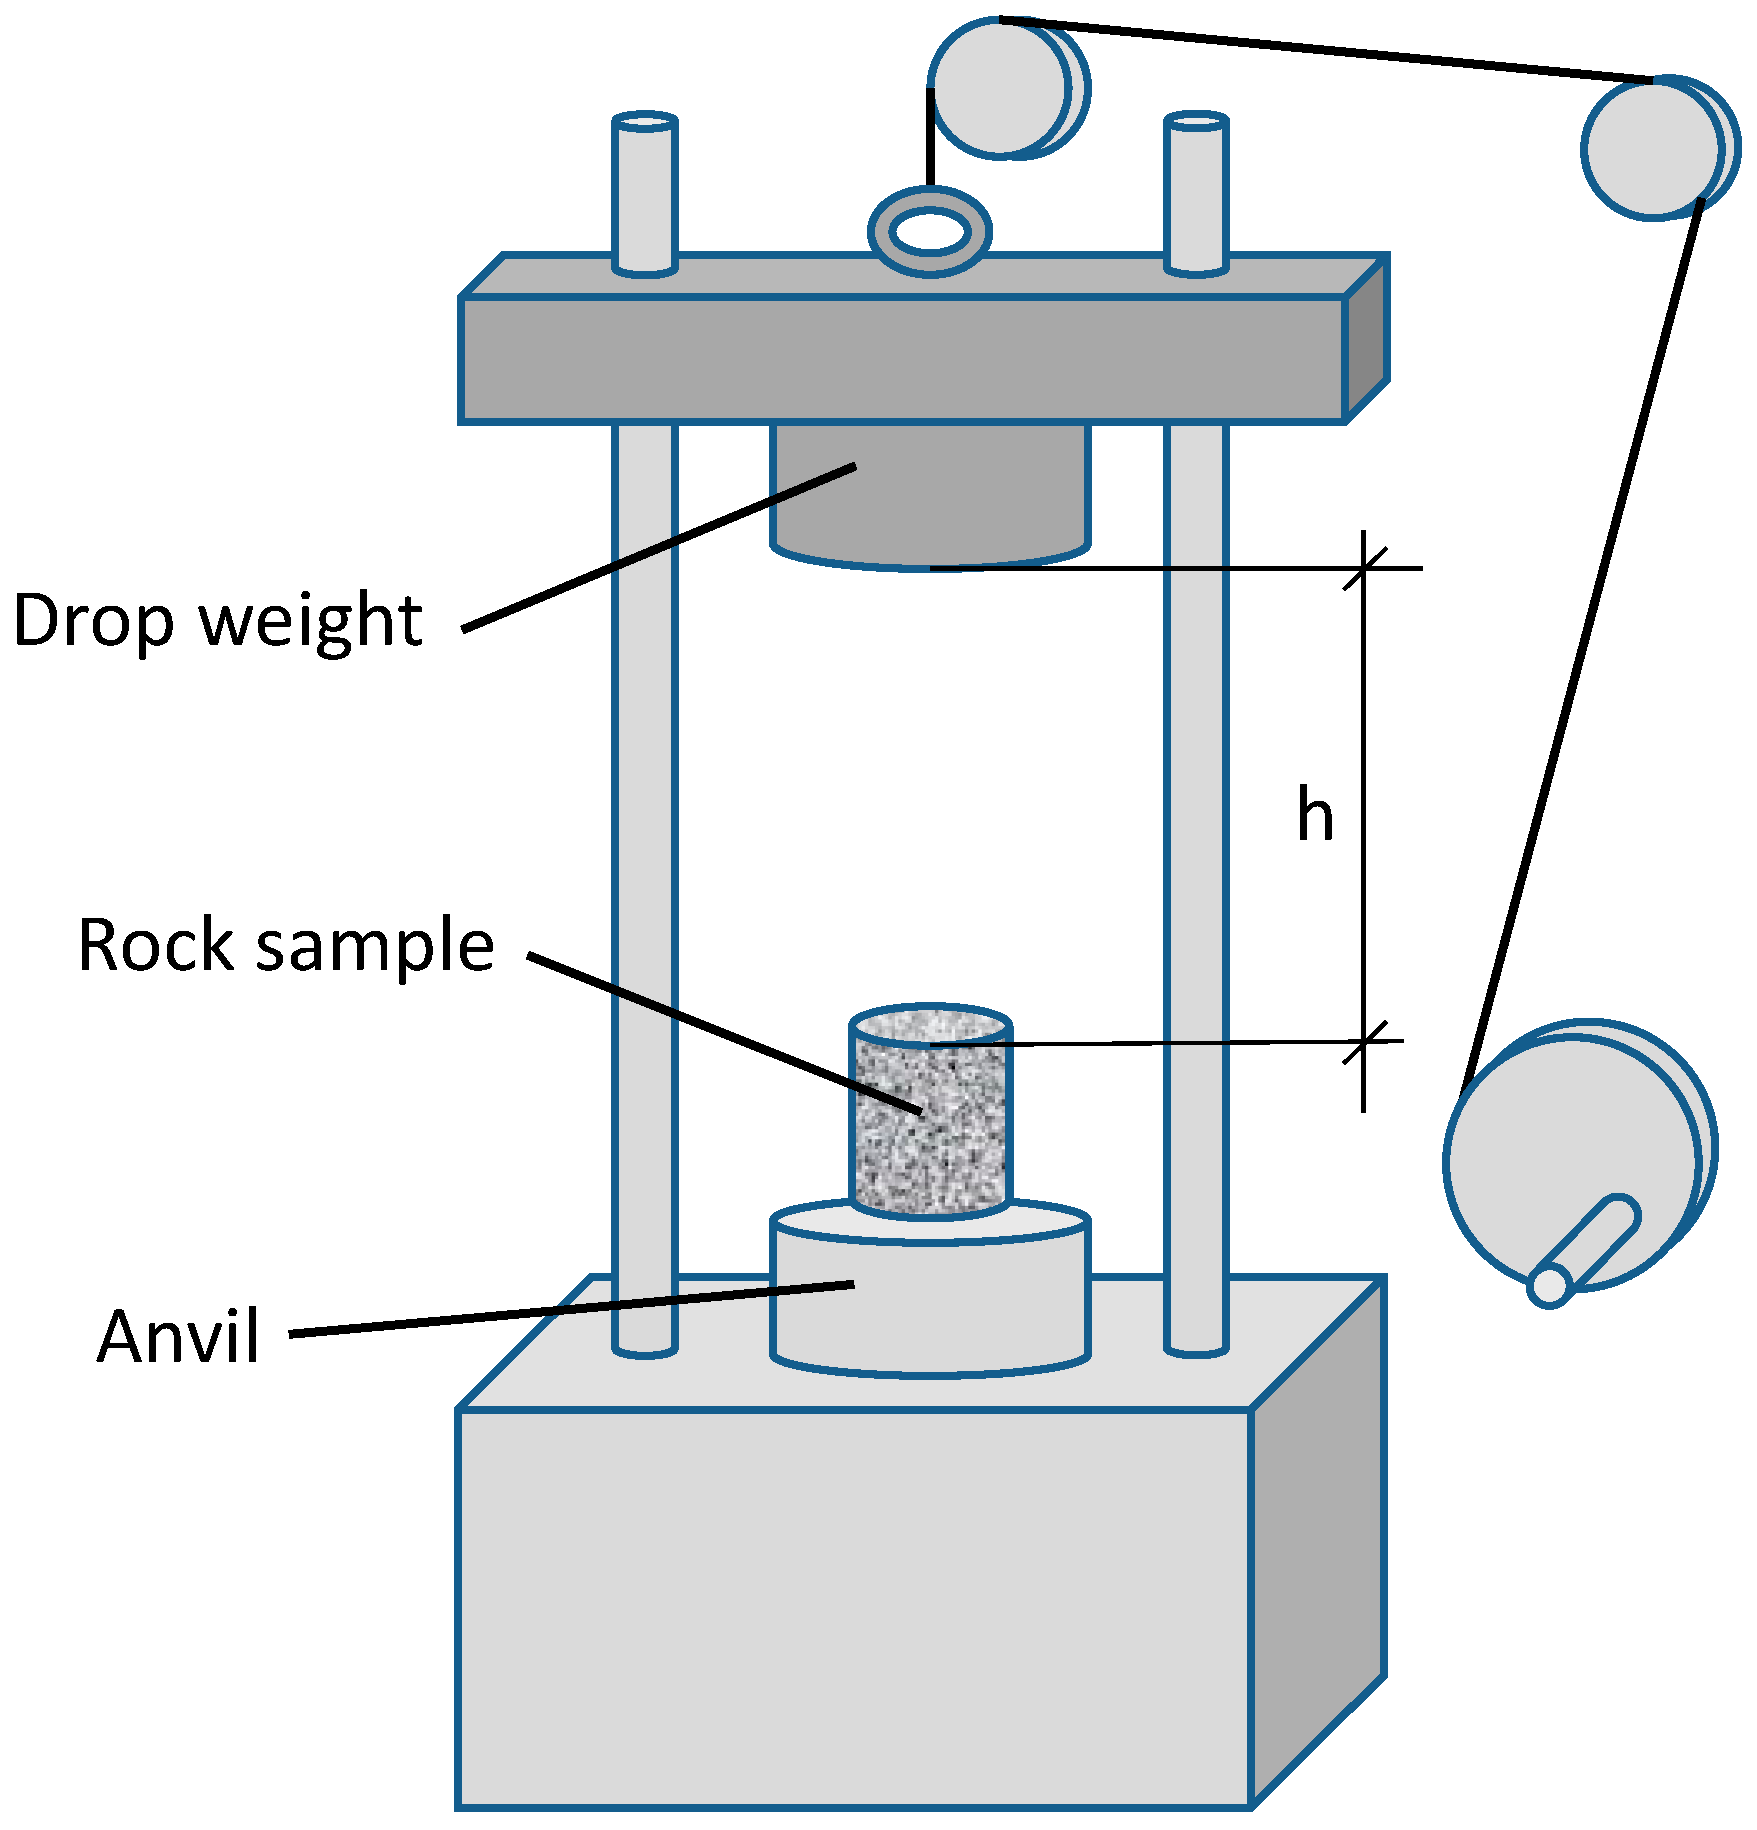
In the drop weight test, a weight is lifted to a certain height and then released to fall on an ore fragment that has been arranged on a rigid anvil underneath (
Figure 5).
The breakage product is collected and analyzed in terms of the particle size distribution to determine the breakage distribution. The test sample can comprise single particles, partial or complete drill core section or several coarser particles obtained from pre-crushing. Several test apparati have been conceived [
11,
17,
18], with the JK drop weight test being the most well-known. In order to conduct particle bed fracture tests with finer particles, the anvil is replaced by a die [
19].
Figure 5.
Drop weight tester.
Figure 5.
Drop weight tester.
Different impact levels and amounts of specific comminution energy can be obtained by varying the drop weight, the falling height or the fragment mass. The energy provided to the ore fragment can be described by the potential energy (in J/kg) of the drop weight at the initial height:
where
mdw is the mass of the drop weight (in kg),
g is gravitational acceleration (9.81 m/s
2) and
h the distance (meters) between the drop weight and the top of the specimen.
In order to evaluate the breakage distribution, a method has been developed by Narayanan
et al. that links the breakage distribution and comminution energy to the modeling of particle size reduction [
19,
20]. The percentage passing 1
/n of the starting particle size can be related to the comminution energy by:
where
Espec is the specific energy in kWh/t and
A and
b are ore-specific dimensionless parameters determined by fitting the model to the experimental data obtained from tests with different specific energies. Typically the
t10-value is used as a fineness index to characterize a certain ore sample. In process modeling and simulation an average set of A and b parameters are used assuming that particles of a different size will break in a similar way. For predicting the product size distribution at different grinding times or energy levels the
tn is related to
t10. The
t10 parameter is also known as a function input energy (
i.e., impact energy) and material characteristics (
i.e., A and b). Therefore, Axb is used to describe the hardness of the ore. A higher value of Axb corresponds to soft material and vice versa.
In order to determine the several
tn curves, five different initial particle sizes in the range of 13.2 to 63 mm and three energy levels need to be investigated, giving a total of 15 tests. The drop weight test as defined by the Julius Kruttschnitt Mineral Research Centre (JKMRC) therefore normally requires 75 to 100 kg of sample material [
20].
In order to reduce the sample amount and the number of particle size fractions, an abbreviated drop weight test, called
SAG Mill Comminution (SMC)
test, has been developed [
21]. Using only a single size fraction,
i.e., crushed particles or parts cut from drill cores in the size range 16.2 to 31.5 mm, the necessary sample amount can be reduced to less than 5 kg. The test provides the parameters A and b as well as a Drop Weight Index (
DWi in kWh) but not the
tn family curves.
More recently, a method has been suggested for estimating the ore hardness parameters A and b from the crushing of drill core sections (or naturally fragmented rock) fragments within assay sample preparation [
22]. The product size distribution generated from crushing in a laboratory jaw crusher are used to calculate two comminution indices Ci, that can be correlated to Axb and to the Bond ball mill work index (compare
Section 3.3), respectively.
3.2.2. Instrumented Drop Weight Test
The drop weight test has been extended by adding instrumentation for measurements during the conduct of the test. A well-established instrumented drop weight test is the
Ultra-fast load cell device (UFLC) developed at the University of Utah [
23,
24,
25] (
Figure 6).
A sample, consisting of individual particles or a bed of particles, is placed on a vertical steel bar and then impacted by the falling mass. As with the split Hopkinson pressure bar (see
Section 3.2.3), the steel bar is instrumented by a pair of strain gauges to detect the impact waves, which allow for the determination of the load actually applied to the sample. The load-time profiles and the calculated deformation are used to estimate the actual transferred energy instead of using the potential energy.
A portable impact load cell, using the same principles as in the Ultra-fast load cell, has been developed by Bourgeois
et al. [
26] for
in situ quantification of ore breakage properties. The so-called SILC—
Short Impact Load Cell—is reduced in height and weighs only 30 kg.
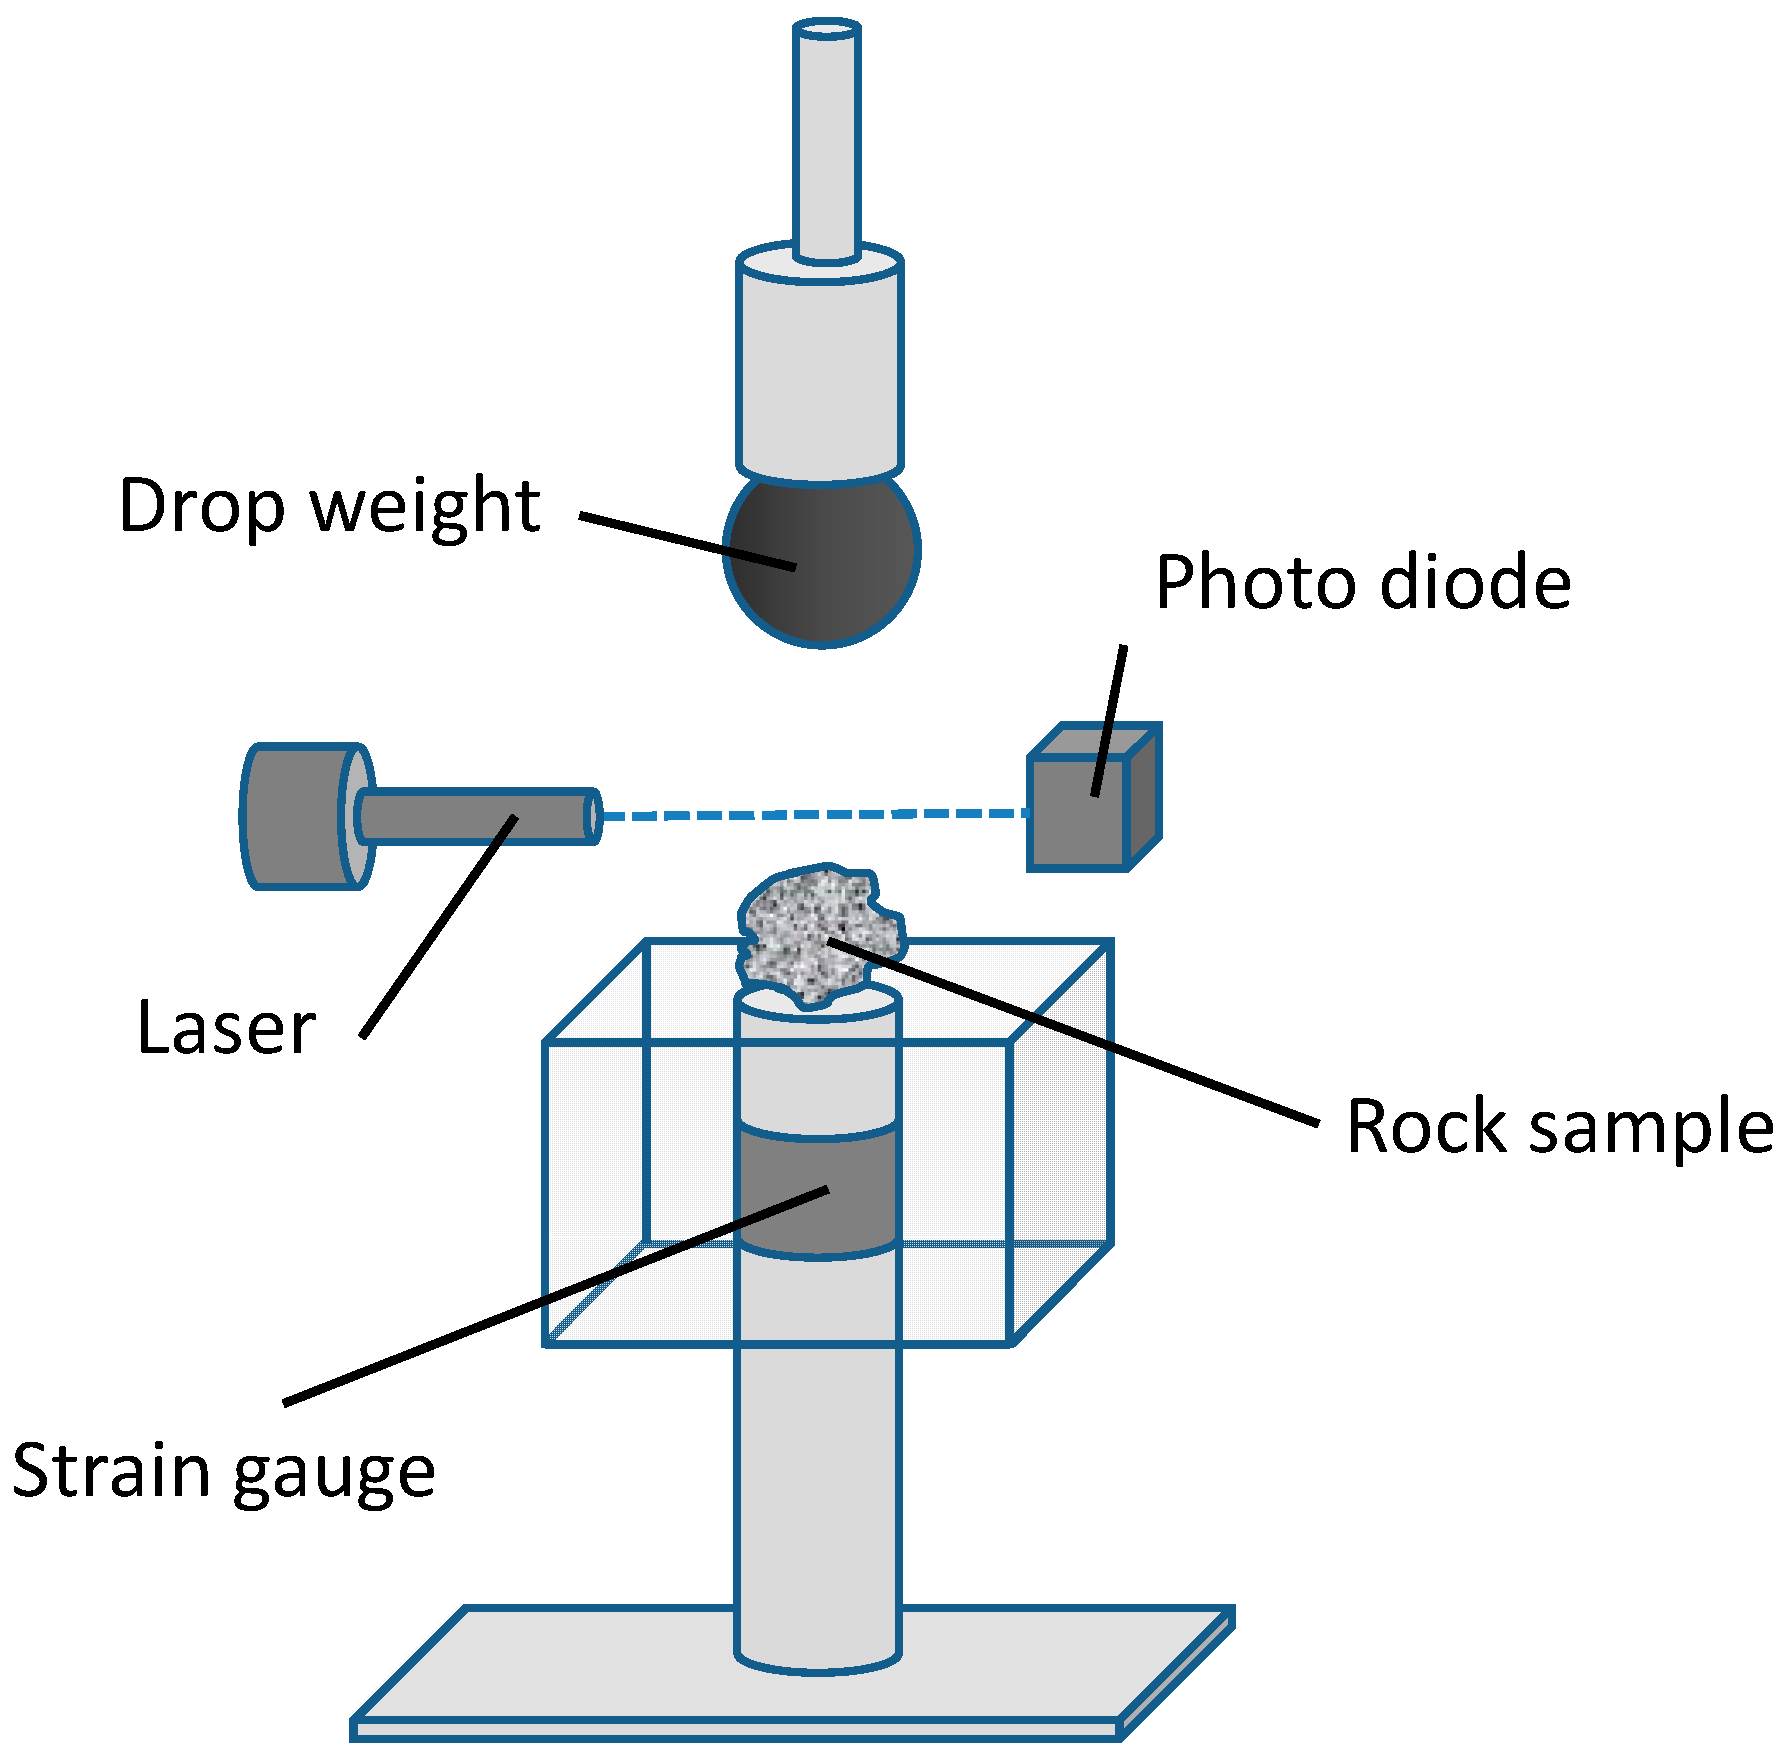
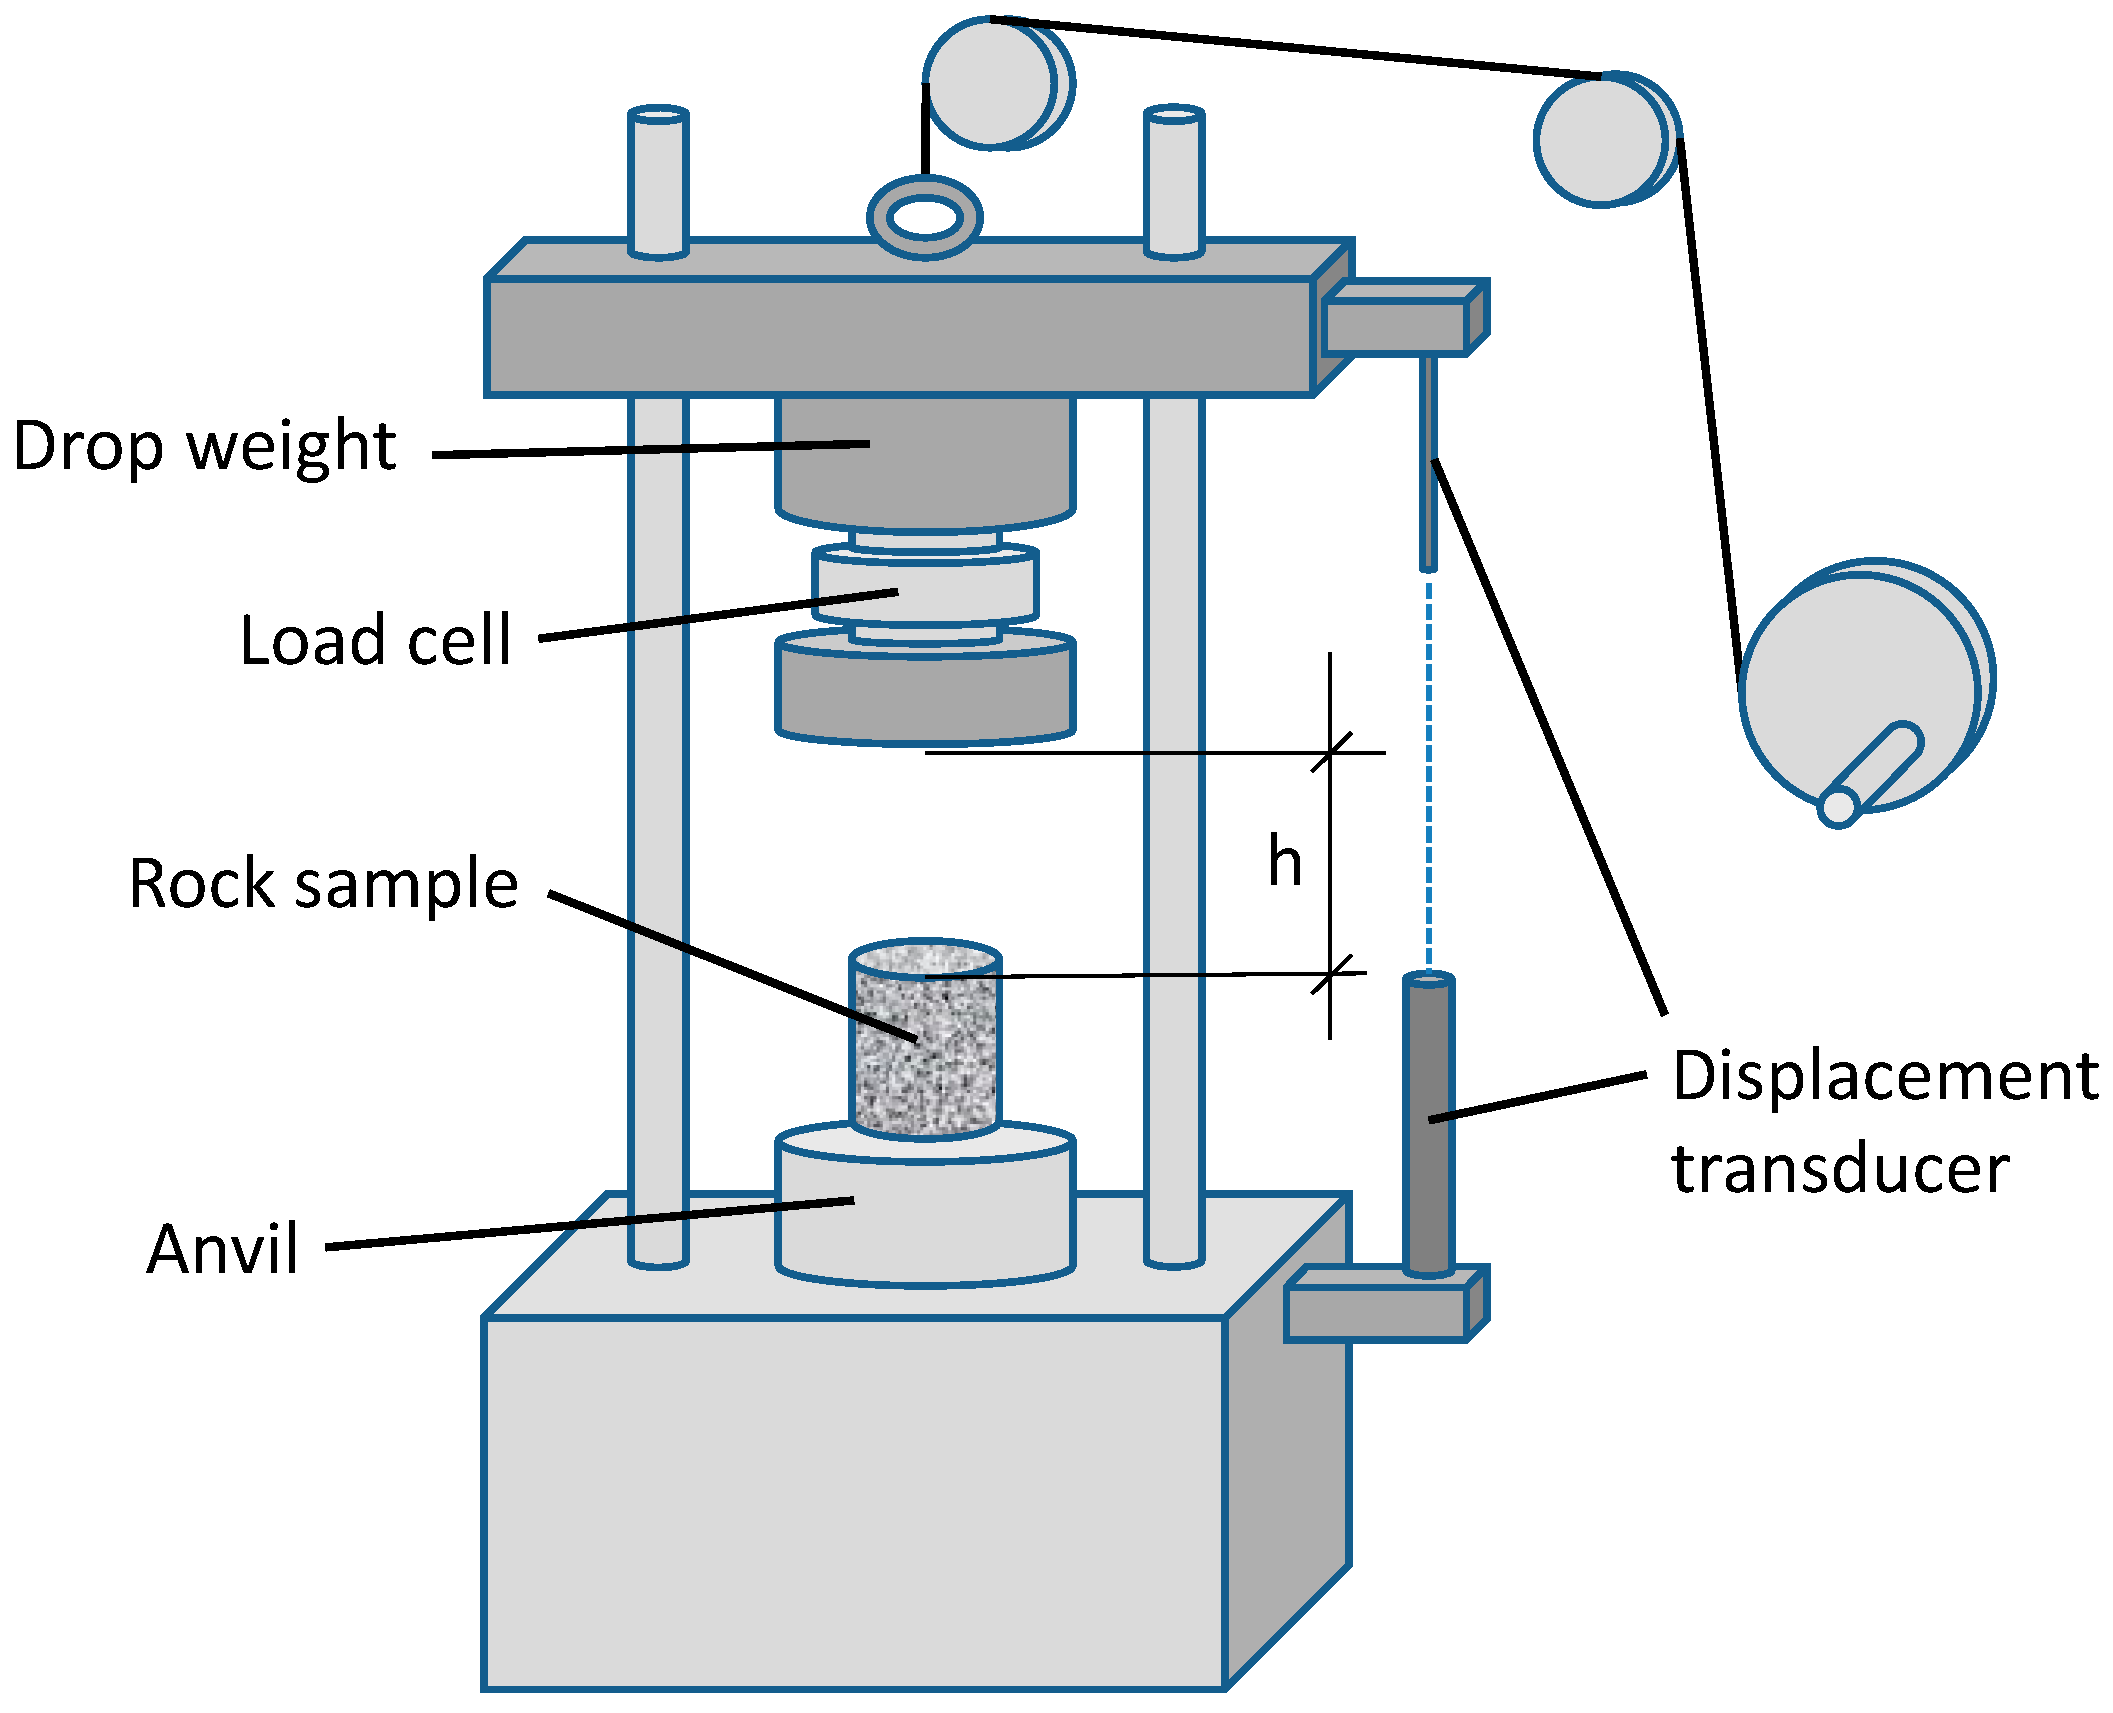
Based on the principle design of the simple drop weight test, another instrumented drop weight tester has been designed [
27] and has initially been used for the investigation of particle compaction processes. Here, the drop weight itself is instrumented by a load cell and an inductive displacement transducer that yields time-dependent measurement profiles for the entire sequence of primary impact and subsequent rebounds (
Figure 7). The comminution energy transferred to the sample is determined using integral calculus for the load-displacement relation.
Figure 6.
Ultra-fast load cell.
Figure 6.
Ultra-fast load cell.
Figure 7.
Micro-stamping device.
Figure 7.
Micro-stamping device.
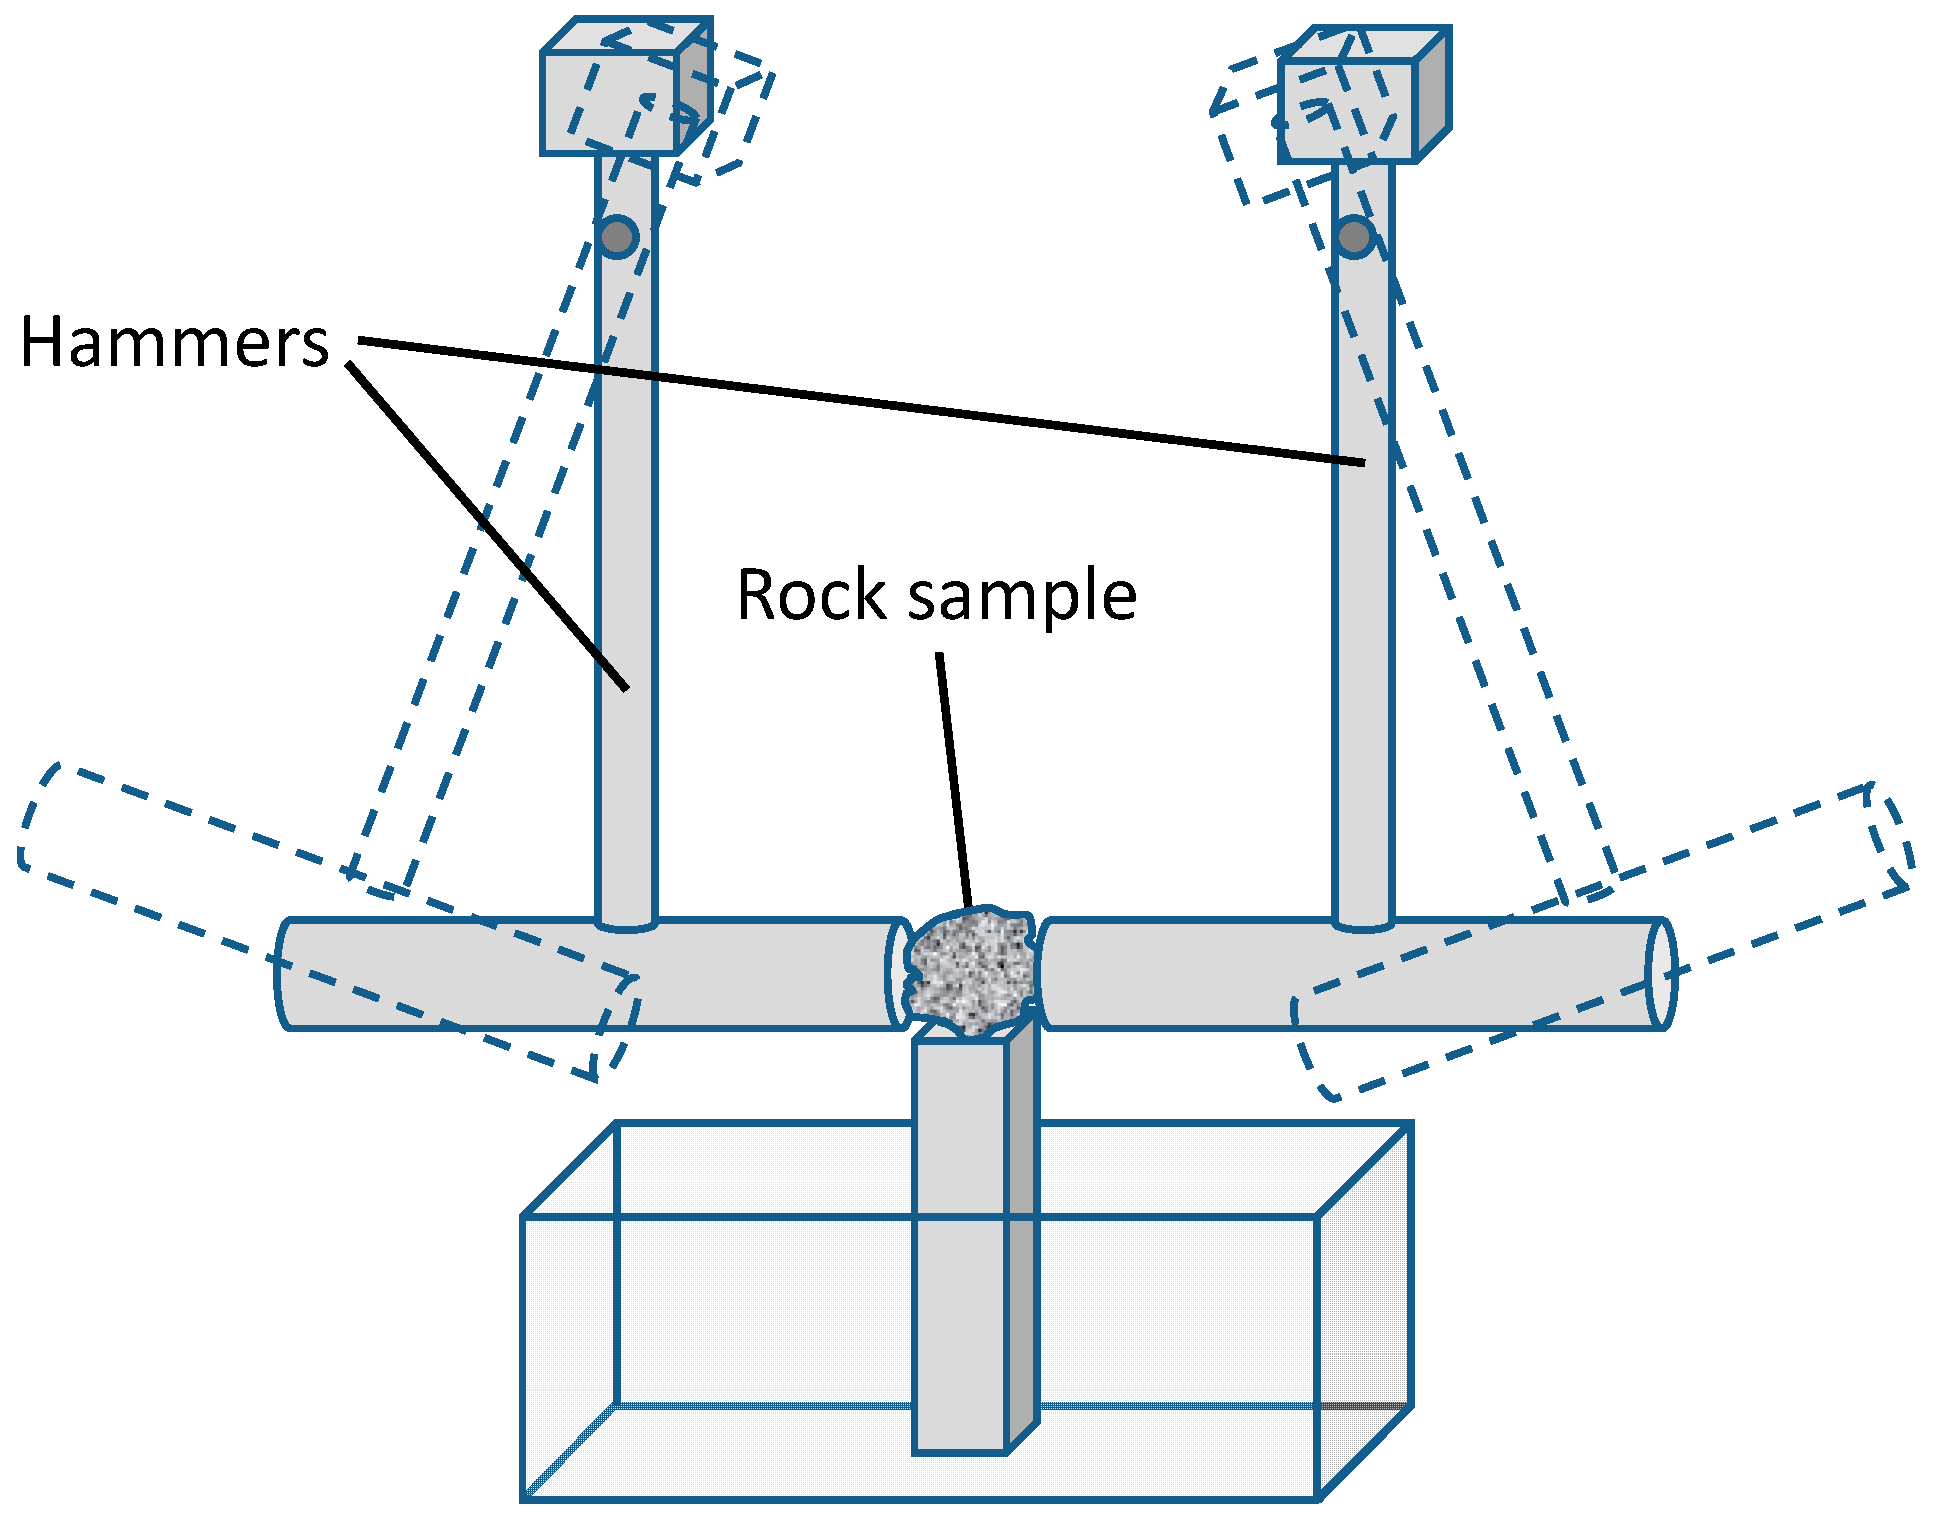
3.2.3. Twin Pendulum Tests
In twin pendulum tests, a single particle is fractured between two pendulum-mounted hammers that are released from a certain height.
Figure 8 shows the experimental setup for the Bond twin pendulum test [
28]. A single particle is mounted on a socket and then simultaneously hit by the hammers. The procedure is repeated until the particle breaks, thereby incrementally increasing the deflection angle of the hammers.
Figure 8.
Bond twin pendulum tester.
Figure 8.
Bond twin pendulum tester.
Bond defined a crushing work index (in kWh/t) by:
where ρ
p is the particle density in g/cm
3 and
CB the impact energy per particle thickness
dp in J/mm for the last pendulum deflection angle Θ (in degree):
The twin pendulum test has been extended by Narayanan by adding instrumentation that allows the recording of the pendulum motion [
28,
29,
30]. Lifting only one pendulum and mounting the particle on the other allows for determining the energy actually transferred to the sample by evaluating the rebound movements of the two pendulums after collision.
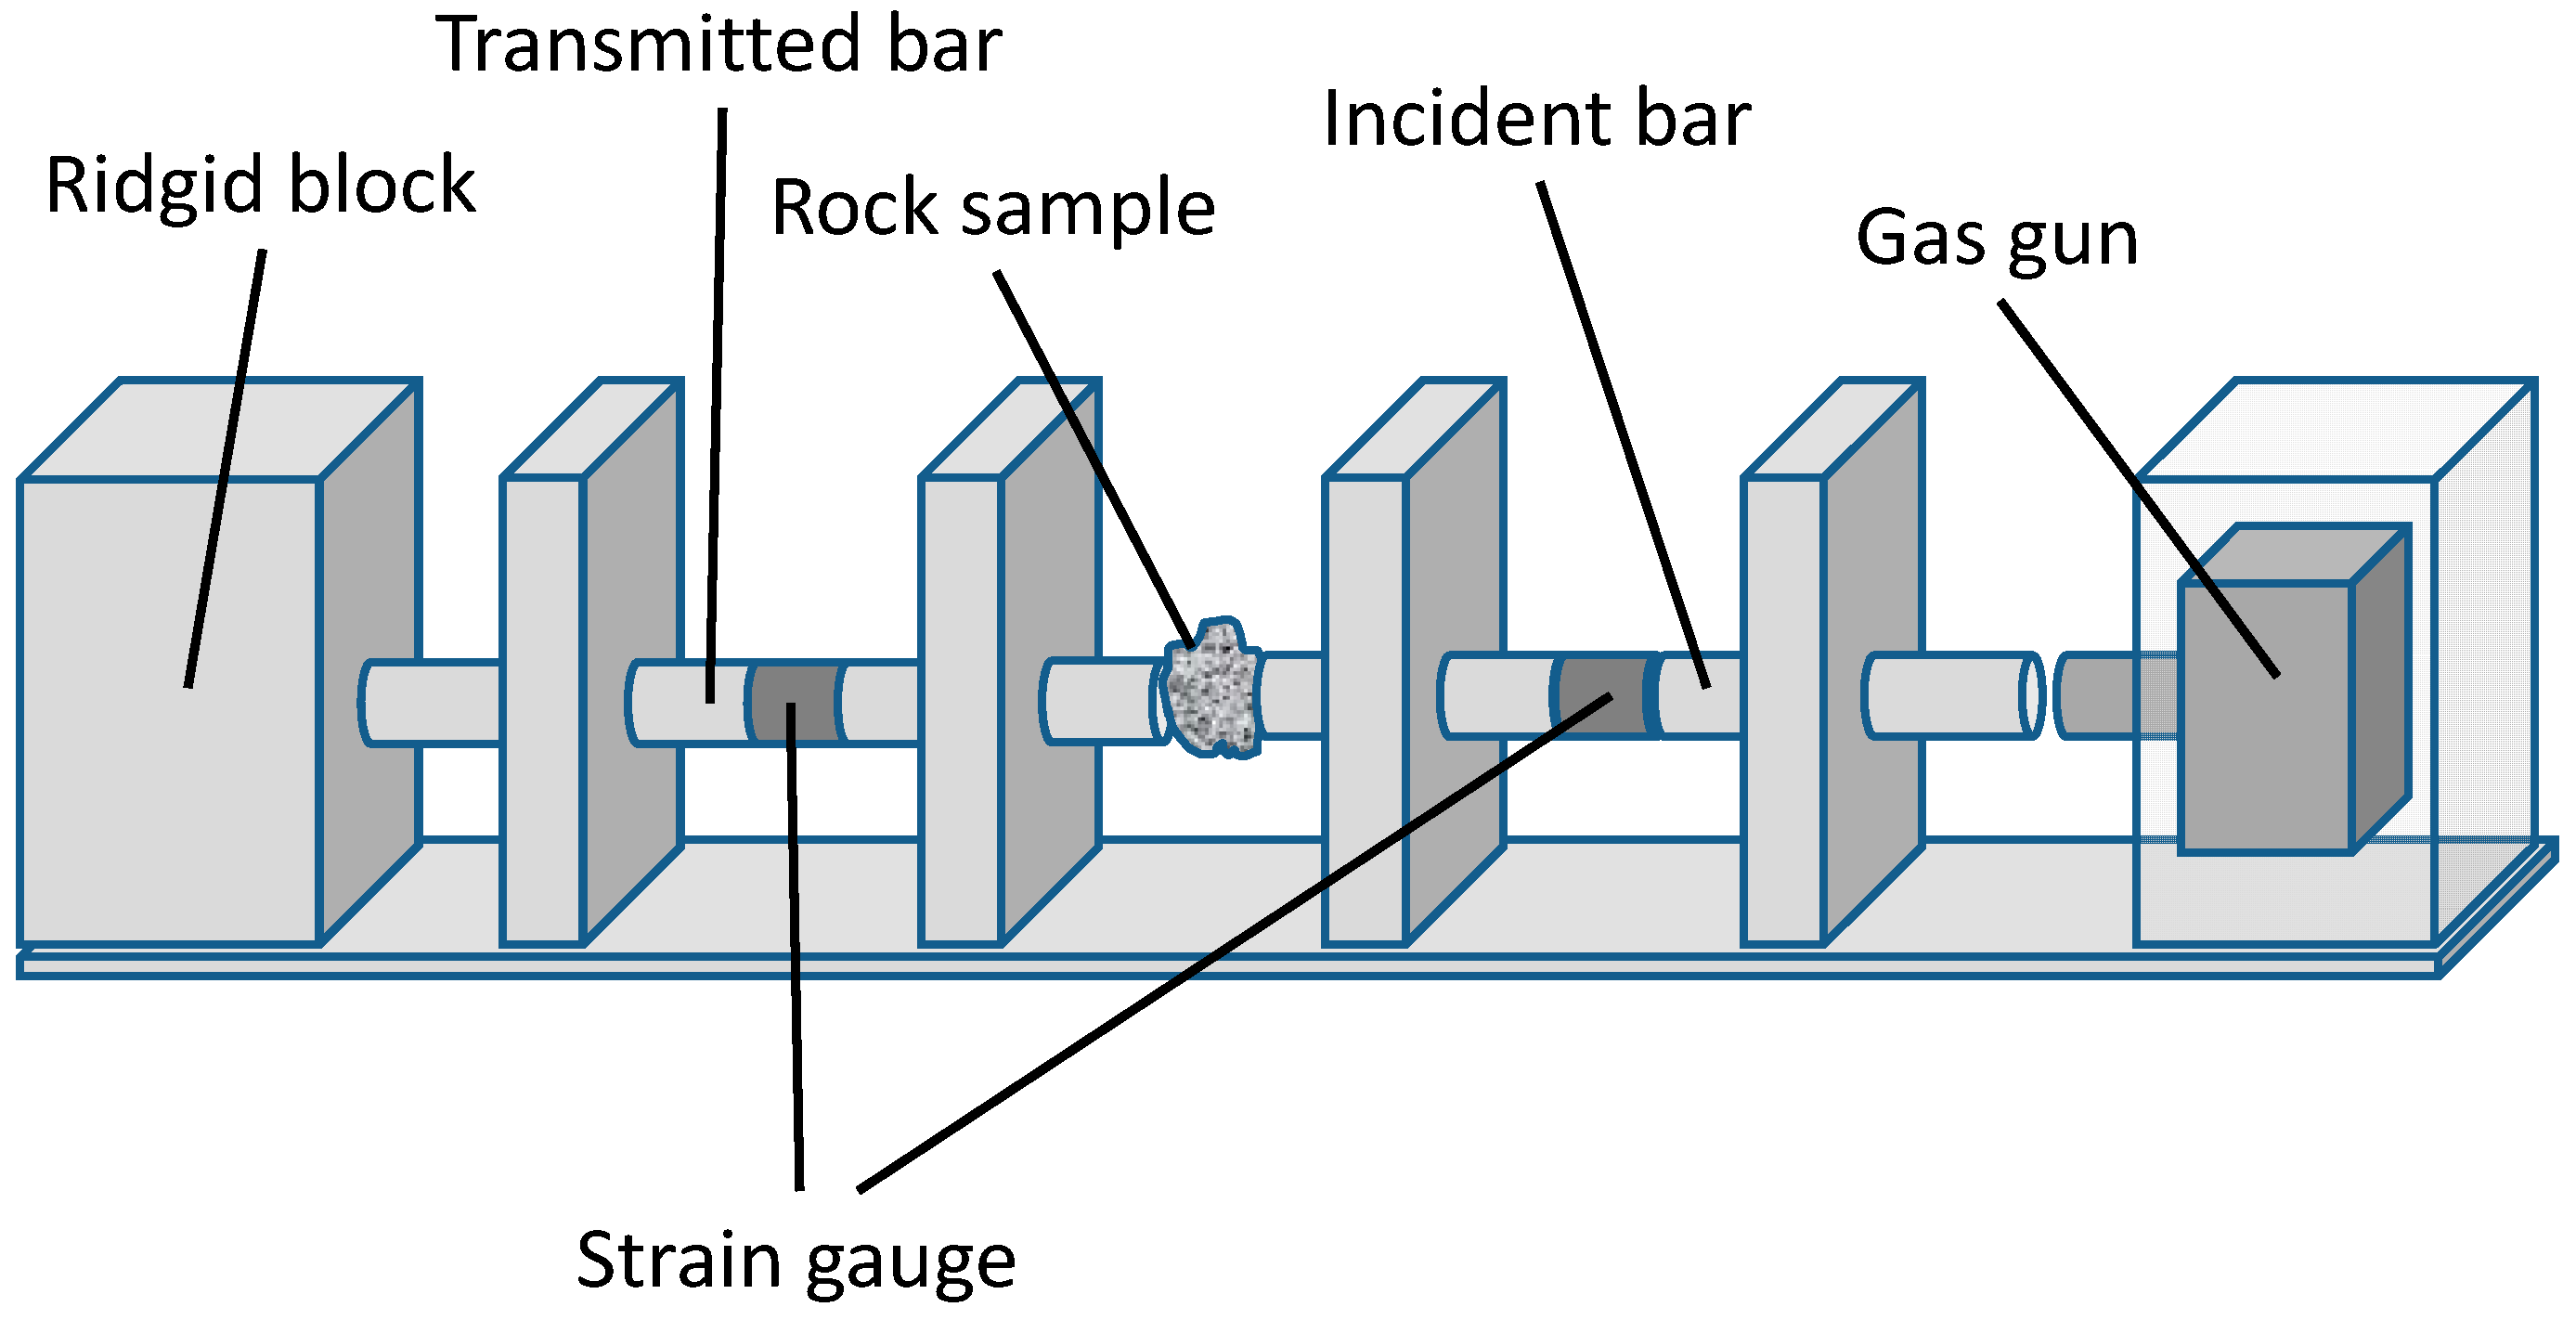
3.2.4. Split Hopkinson Pressure Bar Test
The split Hopkinson pressure bar, originally developed for testing the propagation of stress in materials from the detonation of explosives, has been used for fracturing a sample particle between two horizontally mounted steel bars, called the incident bar and the transmitted bar (
Figure 9). The mechanical stress is induced by a loading system,
i.e., a gas gun, and the travel of the deformation waves is recorded by means of strain gauges. The signals provide information about load-displacement profiles and allow for energy balancing.
Even though the experiments with the Hopkinson pressure bar are quite laborious, there has been a phase of intensive development of the test method, leading to the Modified Hopkinson Pressure Bar for higher resolution [
31] or the CSIRO Hopkinson pressure bar for larger specimen [
32] having a vertical assembly like the Ultrafast load cell.
Figure 9.
Split Hopkinson pressure bar.
Figure 9.
Split Hopkinson pressure bar.
3.2.5. Rotary Single Impact Tester
In single impact tests, the stress applied to a sample results from the collision with a single impact surface. This can be achieved either by accelerating the sample against a plate using gravitational forces or the acceleration forces from a gun, or by advancing the sample with a fast moving tool, commonly realized in a rotor-stator impact system.
Such a rotary impact tester design was first presented by Schönert
et al. [
33] and has meanwhile been commercially adapted also for ore testing by Kojovic
et al. [
34,
35,
36].
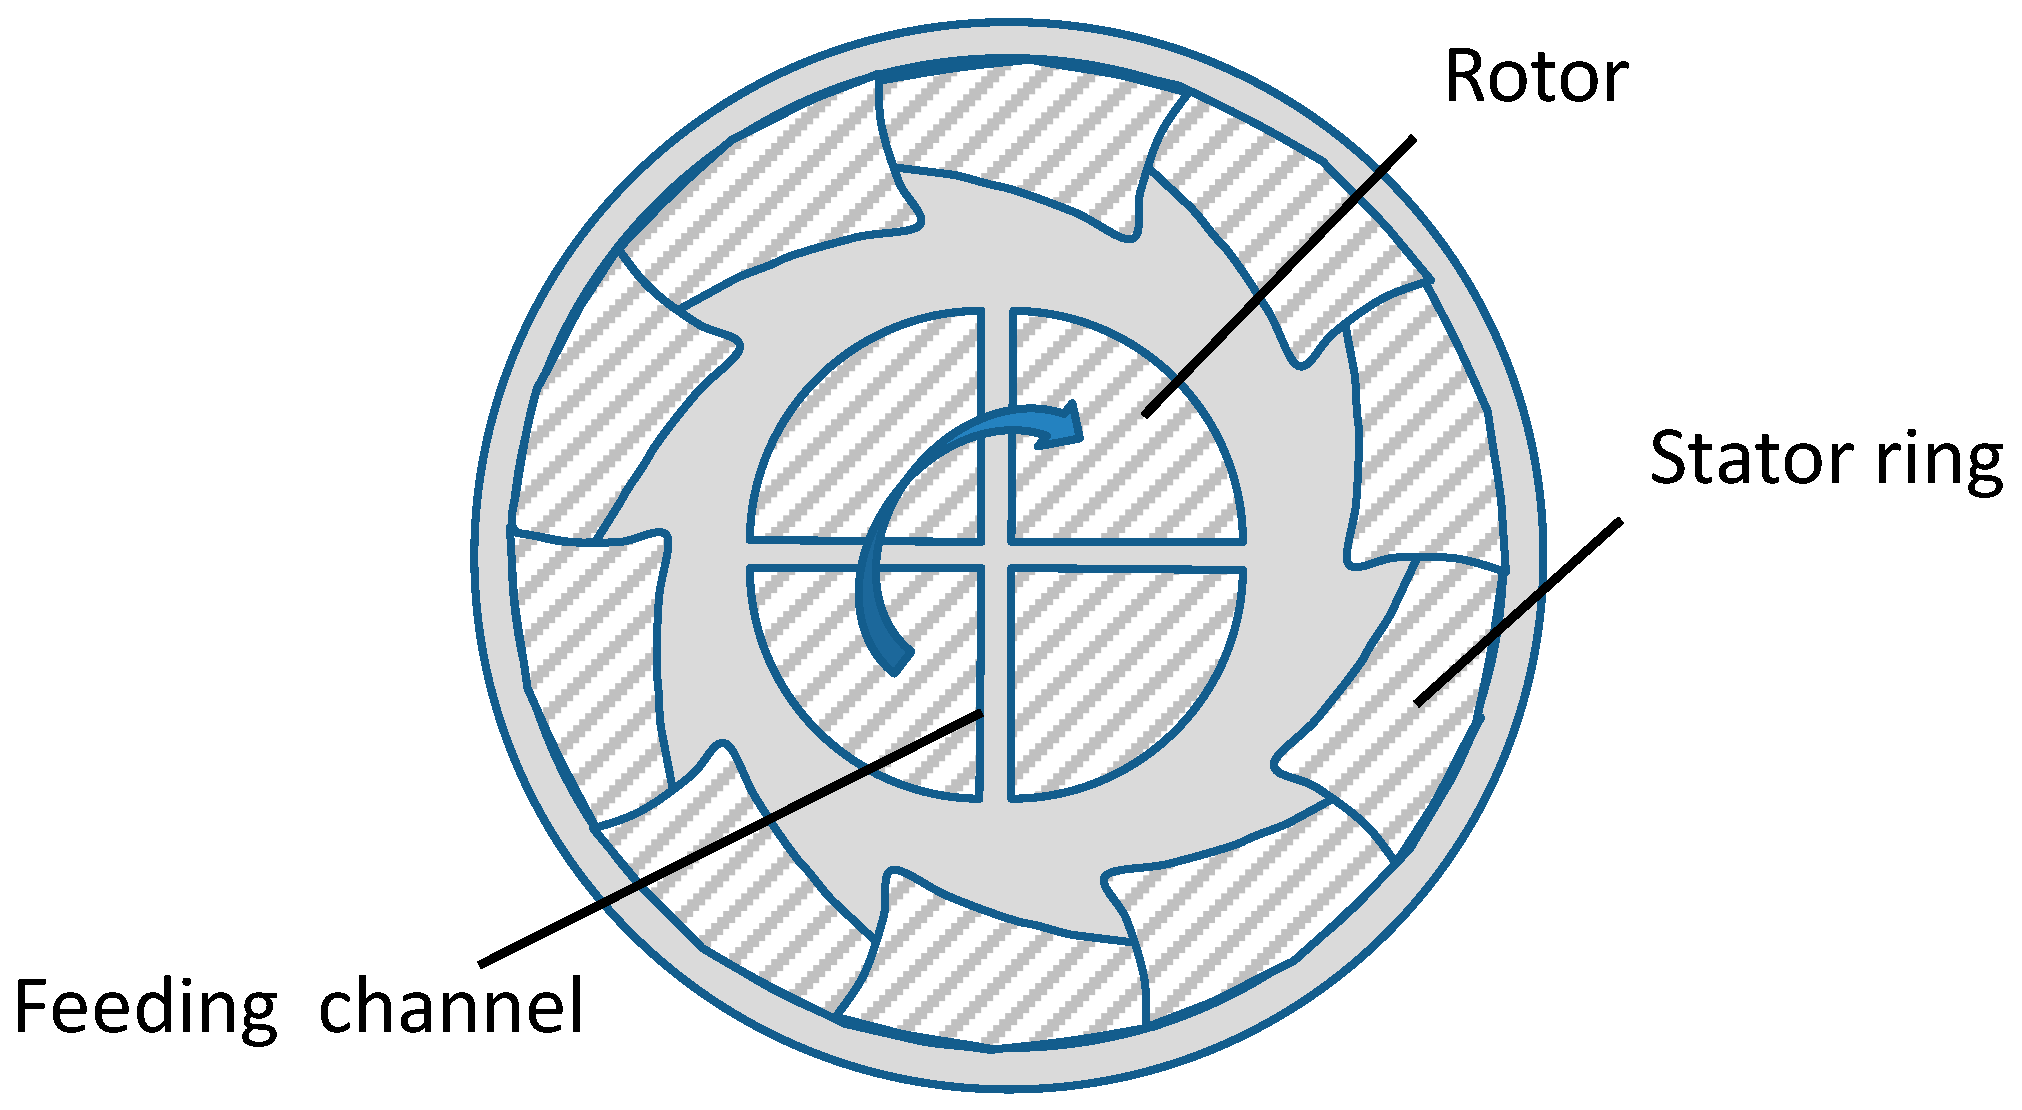
Figure 10 shows a schematic of the rotor–stator impacting system.
Figure 10.
Rotary impact tester.
Figure 10.
Rotary impact tester.
Particles are fed into the evacuated impact chamber by centrifugal action via several channels in the moving rotor. The surrounding stator has a saw tooth profile that allows for a perpendicular impact of the particles. Compared to other particle breakage tests, significantly more particles and samples can be tested in a given time using this method. The specific kinetic energy (J/kg) used in the comminution test is described by:
where
v is impact velocity in m/s and
m is the sample mass. Equation (9) shows that the specific breakage energy is independent of the sample mass, which is a unique characteristic of the rotary breakage test.
The results can be used for establishing energy–size reduction relationships within process modeling. One approach is to determine the parameters for population balance models, probability of breakage and breakage distributions. The probability of breakage can, for instance, be described as a function of the impact energy using a Weibull distribution [
37]:
where
fmat is a material constant,
x the initial particle size in mm,
k the number of impacts, and
Ekin and
Ekin,min (in joules) are the kinetic energy impact and the energy threshold without fracture, respectively.
3.2.6. Evaluation of Particle Breakage Tests
The evaluation of the different particle breakage tests with respect to the criteria defined in
Section 2 is summarized in
Table 2. Particle breakage tests rely on impact stress to break the sample. Except for the rotary breakage test, the mounting of the sample and the conduct of the tests are, in most cases, quite tedious. Repeatability is more affected by the sample characteristics than by the test method.
The necessary sample amounts are small, if using cut drill core samples or fragments. Testing fractionated material from crushing and screening requires significantly more material. This is particularly the case if not only the initial particle size is varied, but also if different energy levels are tested, e.g., when using the concept of tn-values for process modeling.
Based on the initial particle size, the fragments obtained after breakage are usually too coarse to be used in quantitative mineralogical analyses, i.e., only in the case of ultra-fast load cells, the rotary breakage tester or when using small bars with the split Hopkinson pressure bar test, are sufficiently small particles generated which are meaningful to investigate by mineral liberation analysis.
Table 2.
Particle breakage tests.
Table 2.
Particle breakage tests.
| Adverse (−), Acceptable (O), Advantageous (+) | Drop Weight | SMC | UFLC | Twin Pendulum | Split Hopkinson Bar | Rotary Breakage |
|---|
| Simplicity | O | O | − | − | − | O |
| Repeatability | O | O | O | − | O | + |
| Sample preparation | − 1 | O | O | O | − | O |
| Time exposure and costs | − 1 | O | O | O | − | + |
| Sample amount | − 1 | O | − | O | − | O |
| Link to modeling | + | + | + | + | O | + |
| Mineral liberation | − | − | O 2 | − | O 2 | O 2 |
3.3. Bench-Scale Grindability Tests
3.3.1. Bond Test
The Bond test is used to analyze the grindability of a material. The test applies a standardized ball mill of 305 mm (12 in.), both in diameter and length, with a grinding media charge of certain size distribution and operated at a defined speed [
38]. The sample amount is defined by the bulk volume of 0.7 L, consisting of particles smaller than 3.35 mm. The test is conducted as a dry locked-cycle test with sieving of the mill product after each stage. Fines are replaced by an equal amount of fresh feed material, and grinding times are varied in order to reach a simulated circulating load of 250%. Usually samples of up to 10 kg smaller 3.35 mm are required.
From the grinding test the Bond ball mill work index
Wi (in kWh/t) is determined [
38]:
where
xS is the screen aperture in microns,
G the grindability (in grams of product per mill revolution), and
x80,F and
x80,P are the 80% passing particle sizes in µm for the mill feed and product, respectively.
The test results are used to calculate the change in particle size during grinding based on the grinding work input
W (in kWh/t) and to size mills to achieve a desired size reduction using the Bond formula, also referred to as Bond’s law, as a process model [
39]:
3.3.2. Variations of the Bond Test
The Bond test was originally developed for determining ball mill grindability but has been adapted for other mill types. Bond also defined a test for rod mill grinding using a 305 mm × 610 mm standard mill requiring up to 20 kg samples. Test conditions differ, e.g., the circulating load is changed to 100%, and also the Bond equation for calculating the rod mill work index is slightly different. In order to describe comminution in autogenous and semi-autogenous mills (AG/SAG) mills and high pressure grinding rolls (HPGR), using the Bond test method requires model extensions by empirical relations. For instance, Barratt provided an empirical formula for a SAG circuit involving three work indices for crushing, rod mill and ball mill grinding [
40].
The SPI (SAG Power Index) is another related index used to determine the ore comminution behavior in AG/SAG mills. The index is obtained from a batch test in a mill of 305 mm × 102 mm operated with steel balls of 25 mm in diameter. The feed ore sample is crushed material <12.7 mm. The test was originally developed by Starkey
et al. in 1994 and reviewed by Amelunxen
et al. in 2014 [
41,
42,
43]. Time and power draw are measured for grinding the ore sample to an 80% passing product particle size of 1.7 mm. With respect to modeling, the SPI test has been extended to ore body profiling and the design of semi-autogenous-ball milling circuits (SABC) [
44,
45] and is used in the CEET software [
46].
In the past, several attempts have been made to simplify the Bond procedure. One approach has been to change the test from locked-cycle to a pure single-pass batch test in order to minimize the time, effort and sample amount needed, by developing new test mills, e.g., Outokumpu’s Mergan mill [
47] or the new size ball mill( NSBM) [
48], or by modifying the test procedure, such as by changing the test to wet grinding [
49], or by reducing the number of test cycles based on certain assumptions and complemented by simulations for ball mill and rod mill grindability, see [
50,
51] and JK Bond Ball Mill Lite test [
52]. In the
Modbond grindability test, an open circuit dry batch test run is used for estimating the work index after calibration against the standard Bond ball mill test [
53].
3.3.3. Evaluation of Grindability Tests
In grindability tests, a combination of impact and attrition is applied to a bulk of material. The original Bond test is quite tedious, as several grinding cycles are necessary to reach the steady state of the simulated closed circuit. Furthermore, the sample amount required in the test is large, and is more problematic when only drill cores are available. Sample preparation is limited to pre-crushing and screening.
The test is reliable and has a good repeatability if the procedure and test mill comply with the standard. One of the major advantages is surely the huge data base that has been developed during the last six decades. With respect to process modeling, the coupling between the work index and the particle size reduction can be used together with an approximation function for particle size distribution. Attention must be paid to the applicability of the function type for the individual case. The particle size range of the mill product is suitable to perform mineral liberation analyses.
Table 3 summarizes the characteristics of the different grindability test methods.
Table 3.
Grindability tests.
Table 3.
Grindability tests.
| Adverse (−), Acceptable (O), Advantageous (+) | Original Bond Ball Mill | Original Bond Rod Mill | Simplified Bond e.g., Mergan Mill |
|---|
| Simplicity | O | O | + |
| Repeatability | + | + | + |
| Sample preparation | O | O | O |
| Time exposure and costs | − | − | O |
| Sample amount | − | − | O |
| Link to modeling | + | + | + |
| Mineral liberation | + | + | + |
3.4. Pilot and Bench-Pilot Scale Tests
Comminution test work on bench-pilot or pilot scale is done by using different types of crushers and mills depending on the intended process design. Typically these tests include:
Cone crushers;
High pressure grinding rolls (HPGR);
Tumbling mills: ball mills, AG and SAG mills;
Stirred media mills, e.g., IsaMill or vertical stirred mills.
Stress type and stress rate are based upon the respective machine type.
The tests usually require preparing tens to hundreds of kilograms of sample material and are done in batch or continuous mode. Sample preparation normally comprises pre-crushing and screening to the initial size distribution, as well as sample splitting.
Sampling from the test mill or comminution circuit provides the data necessary for determining breakage probabilities and grinding rates, as well as breakage distributions received from back-calculation by applying population-balance methods. Using the data from liberation analyses allows for describing the particles based on their mineral composition [
54].
Pilot and bench-pilot scale tests are used to verify the metallurgical performance of a designed circuit. In the geometallurgical context, these results can be used in calibrating the small scale test results to full scale operation.
3.5. Indirect Methods for Determining Comminution Behavior
Another way of obtaining information about rock mechanical strength is to evaluate the core drilling process with corresponding instrumentation, also referred to as measurement while drilling (MWD). Alternatively, drill cuttings can be evaluated. Variations of the conditions at the drill bit, such as torque, normal or bending forces, result from changes in rock hardness.
Despite the huge data sets that are continuously collected in a large number of operations, the MWD data is seldom used for assessing the comminution properties of ore bodies. One of the obstacles is the lack of reliable on-line information about the condition of the drill bit, which is needed for correcting the recorded down-hole measurements by the dynamic process of drill bit wear.
Petrophysical data from multi-sensor drill core logging have also been used for calibration against measures of ore breakage parameters and grindability obtained from conventional destructive comminution tests [
55]. Using density, magnetic susceptibility and seismic wave parameters from Australian copper-gold deposits, the Bond mill work index and the crushability parameters obtained from drop weight testing, could be predicted with acceptable accuracy.
In conjunction with recent advances in quantitative mineralogical analyses, the development in geometallurgical characterization today tends towards the identification of correlations between ore comminution behavior and mineralogical properties. The strategy is to reduce the number of comminution tests necessary for characterizing a deposit and to arrive at a more generic description of mechanical properties based on the occurring minerals [
56].
4. Summary of Evaluation Findings
Table 4 summarizes the findings from the evaluation of the different test categories by summing up the attributes from
Table 1,
Table 2 and
Table 3. None of the tests fulfills all criteria. To best assess the potential of the individual methods for geometallurgical testing, a compromise set of weighting criteria is required to emphasize the most important attributes. The sample amount and testing effort (in terms of time and cost) are considered to be the most significant parameters. In association with known process modeling requirements, the weighting process can be used to identify several methods as relevant and promising for further development of geometallurgical comminution tests, as indicated by mark (ⱱ) or ⱱ (medium to high potential) in
Table 4.
Table 4.
Summary table, potential for geometallurgy.
Table 4.
Summary table, potential for geometallurgy.
| Adverse (−), Acceptable (O), Advantageous (+) | − | O | + | Potential |
|---|
| Unconfined compressive strength test | 2 | 3 | 2 | - |
| Point load test | 1 | 4 | 2 | (ⱱ) |
| Brazilian test | 2 | 3 | 2 | - |
| Hardness tester | 1 | 2 | 4 | (ⱱ) |
| Drop weight test 1 | 4 | 2 | 1 | (ⱱ) |
| SMC | 1 | 5 | 1 | ⱱ |
| Ultra-fast load cell test | 2 | 4 | 1 | - |
| Twin Pendulum test (Bond CWI) | 3 | 3 | 1 | - |
| Split Hopkinson bar test | 4 | 3 | 0 | - |
| Rotary breakage test | 0 | 4 | 3 | ⱱ |
| Bond ball mill test (Bond BWI) | 2 | 2 | 3 | (ⱱ) |
| Bond rod mill test (Bond RWI) | 2 | 2 | 3 | (ⱱ) |
| Simplified Bond test, e.g., Mergan mill | 0 | 3 | 4 | ⱱ |
Table 5 summarizes where the investigated test methods can be applied with respect to the required sample material. In addition, the test methods that have been derived by using the same basic principles as the above-listed tests, have been included. In most cases this refers to tests that are commercially available. The modifications and simplifications made have improved the applicability within the geometallurgical context given some of the defined criteria. In other respects, the shortcomings are more fundamental. Hence, from a more scientific perspective there is still a need and a potential for improvement and/or development of new tests. The authors are aware of recent developments that have not been published yet, as for instance an enhanced version of the rotary breakage test (JKMRC’s rotary breakage tester (RBT)“lite” test), which is based on a smaller device and reduced sample amounts.
Figure 11 shows the test methods existing today with their placement in the matrix as introduced in
Figure 1, while ignoring the dimension of
stress type. Considering the other two dimensions
particle size range and
type of mechanical stress alone, it can be concluded that it is practically impossible to develop a single universal method for determining ore comminution behavior at all test scales, including the geometallurgical level. Nevertheless, the objective of future research and development should be to reduce the variety of test methods by focusing more on the underlying breakage mechanisms and by linking these to mineral texture and mineral liberation information. The boxes that are not filled indicate directions for further development of geometallurgical comminution testing methods. Replacing the remaining interrogation marks can be done either by developing entirely new comminution test methods or by enhancing the existing methods.
Table 5.
Sample requirements
Table 5.
Sample requirements
| Test method | Drill core/parts | Drill chips | Crushed sample | Sample amount (kg) |
|---|
| Required | Consumed |
|---|
| Unconfined compressive strength test | X | - | - | n/a | <1 1 |
| Point load test | X | - | - | n/a | <1 1 |
| Brazilian test | X | - | - | n/a | <1 1 |
| Hardness tester, e.g., EQUOtip 2 | X | - | - | n/a | n/a |
| Drop weight test 3 | X | X | X | 75 | 25 |
| SMC test | X | X | X | 30 | 5 |
| Ultra-fast load cell test 4 | X | X | X | 2 | 1 |
| Twin Pendulum test (Bond CWI) | X | X | X | 25 | 10 |
| Split Hopkinson bar test 4 | X | X | X | 2 | 1 |
| Rotary breakage test | X | X | X | 100 5 | 15 |
| Bond ball mill test (Bond BWI) | - | X | X | 10 | 5 |
| Bond rod mill test (Bond RWI) | - | X | X | 15 | 10 |
| Simplified Bond test (Mergan mill) | - | X | X | 10 | 5 |
| Simplified Bond test (SGS Modbond) | - | X | X | 2 | 1.2 |
| Simplified Bond test (Magdalinovic) | - | X | X | 10 | 5 |
| Simplified Bond test (JK BB lite) | - | X | X | 6 | <5 |
| SPI grindability test | - | X | X | 10 | 2 |
| GeM comminution index 6 | - | X | X | 5 | 1 |
Figure 11.
Comminution tests classified according to test design specifications. HPGR = High pressure grinding rolls; BBWI = Bond ball mill test; BRWI = Bond rod mill test; BCWI = Bond crusher test; DWT = Drop weight test; RBT = Rotary breakage tester; Modified RBT = Variation of the RBT (e.g., RBT lite) tester; Modified Bond = Variations of the Bond test; SMC = SAG Mill Comminution test; GeoMet level = Geometallurgical level.
5. Conclusions
In the previous sections, different categories of comminution tests have been reviewed against the priorly defined evaluation criteria for geometallurgical testing. For the individual test categories it can be concluded:
Results from rock mechanical tests should only be used for geometallurgy where already available. As the results cannot be directly used, empirical correlations need to be found for linking mechanical strength or hardness to the description of ore crushing properties. Generally speaking, rock mechanical tests should not be part of a geometallurgical program as they do not provide information about grinding behavior down to the particle liberation level.
Particle breakage tests have the potential to be used within geometallurgy if they do not require too large sample amounts, or great effort. For instance, the SMC test, based on the standard drop weight test has potential, since only single-size samples are required. Also, the rotary breakage test is promising despite the need for the highly technical and expensive test machines.
Grindability tests are well established and provide a huge amount of reference data. The Bond equation links comminution energy and resulting particle size reduction, thus already providing a comminution process model. With respect to geometallurgical testing, a clear disadvantage lies in the timely effort needed for conducting the Bond test and the comparatively large sample amount. Steps have been undertaken to simplify the procedure. Future development should target modified Bond tests where the sample amount needed is significantly minimized.
For ultra-fine grinding new comminution tests need to be developed on geometallurgical level.
Pilot and bench-pilot scale tests are principally not suitable for mapping of the ore’s comminution variability but can be employed in the calibration of small scale tests and at a later stage of a mine development project. Here tumbling mills as well as tests with stirred media mills and HPGR are of relevance.
Indirect measurements have not been used to a large extent yet but are promising and further development is warranted.
Acknowledgements
The financial support of the Centre for Advanced Mining and Metallurgy (CAMM), a strategic research environment established at Luleå University of Technology funded by the Swedish government, is gratefully acknowledged.
Author Contributions
Abdul Mwanga conducted the literature review and developed the geometallurgy related criteria used in the evaluation. Jan Rosenkranz mainly contributed to the description and systematization of the different comminution test methods. Pertti Lamberg mainly contributed to the test evaluation and the conclusions section.
Conflicts of Interest
The authors declare no conflict of interest.
References
- Weedon, D.M.; Napier-Munn, T.J.; Evans, C.L. Studies of mineral liberation performance in sulphide comminution circuits. In Sulphide Deposits—Their Origin and Processing; Gray, M.J., Bowyer, G.J., Castle, J.F., Vaughan, D.J., Warner, N.A., Eds.; Springer: Berlin, Germany, 1990; pp. 135–154. [Google Scholar]
- Lamberg, P. Particles—The Bridge between Geology and Metallurgy. In Proceedings of the Conference in Minerals Engineering, Luleå, Sweden, 8–9 February 2011; pp. 1–16.
- Alruiz, O.M.; Morrell, S.; Suazo, C.J.; Naranjo, A. A novel approach to the geometallurgical modelling of the Collahuasi grinding circuit. Miner. Eng. 2009, 22, 1060–1067. [Google Scholar] [CrossRef]
- Walters, S.; Kojovic, T. Geometallurgical Mapping and Mine Modelling (GeMIII)—The Way of the Future. In Proceedings of the SAG2006 Conference, Vancouver, BC, Canada, 23–27 September 2006; Volume 4, pp. 411–425.
- Klimpel, R.R. The back-calculation of specific rates of breakage from continuous mill data. Powder Technol. 1984, 38, 77–91. [Google Scholar] [CrossRef]
- Williams, S.; Richardson, J. Geometallurgical Mapping: A new approach that reduces technical risk. In Proceedings of the 36th Annual Meeting of the Canadian Mineral Processors, Ottawa, ON, Canada, 20–22 January 2004; pp. 241–268.
- Russell, A.R.; Muir Wood, A. Point load tests and strength measurements for brittle spheres. Int. J. Rock Mech. Min. Sci. 2009, 46, 272–280. [Google Scholar] [CrossRef]
- Shea, W.T.; Kronenberg, A.K. Strength and anisotropy of foliated rocks with varied mica contents. J. Struct. Geol. 1993, 15, 1097–1121. [Google Scholar] [CrossRef]
- Rusnak, J.; Mark, C. Using the Point Load Test to Determine the Uniaxial Compressive Strength of Coal Measure Rock. In Proceedings of the 19th International Conference on Ground Control in Mining, Morgantown, WV, USA, 1–3 August 2000; pp. 362–371.
- Li, D.; Wong, L.N.Y. The Brazilian Disc Test for Rock Mechanics Applications: Review and New Insights. Rock Mech. Rock Eng. 2013, 46, 269–287. [Google Scholar] [CrossRef]
- Bearman, R.A.; Briggs, C.A.; Kojovic, T. The Application of Rock Mechanics Parameters to the Prediction of Comminution Behaviour. Miner. Eng. 1997, 10, 255–264. [Google Scholar] [CrossRef]
- Koch, P.H.; Mwanga, A.; Lamberg, P.; Pirard, E. Textural Variants of Iron Ore from Malmberget: Characterization, Comminution and Mineral Liberation. In Proceedings of the Exploration Resource and Mining Geology Conference 2013, Cardiff, UK, 21–22 October 2013; pp. 49–50.
- Olaleye, B.M. Influence of some rock strength properties on jaw crusher performance in granite quarry. Min. Sci. Technol. 2010, 20, 204–208. [Google Scholar]
- Toraman, O.Y.; Kahraman, S.; Cayirli, S. Predicting the crushability of rocks from the impact strength index. Tech. Note Miner. Eng. 2010, 23, 752–754. [Google Scholar] [CrossRef]
- Parbhakar-Fox, A.; Lottermoser, B.; Bradshaw, D.J. Cost-Effective Means for Identifying Acid Rock Drainage Risks—Integration of the Geochemistry-Mineralogy-Texture Approach and Geometallurgical Techniques. In Proceedings of the 25th International Mineral Processing Congress, Brisbane, Australia, 6–10 September 2010; pp. 143–154.
- Verwall, W.; Mulder, A. Estimating rock strength with the EQUOtip hardness tester. Int. J. Rock Mech. Min. Sci. Geomech. 1993, 30, 659–662. [Google Scholar] [CrossRef]
- Napier-Munn, T.J.; Morrell, S.; Morrison, R.D.; Kojovic, T. Mineral Comminution Circuits Their Operation and Optimization; JKMRC Monograph Series in Mining and Mineral Processing; Julius Kruttschnitt Mineral Research Centre: Brisbane, Australia, 1996; Volume 2. [Google Scholar]
- Genc, O.; Ergun, L.; Benzer, H. Single particle impact breakage characterization of materials by drop weight testing. Physicochem. Probl. Miner. Process. 2004, 38, 241–255. [Google Scholar]
- Narayanan, S.S.; Whiten, W.J. Breakage characterization of ores for ball mill modelling. Proc. AusIMM 1983, 286, 31–39. [Google Scholar]
- Narayanan, S.S.; Whiten, W.J. Determination of comminution characteristics from single particle breakage tests and its application to ball mill scale-up. Trans. Inst. Min. Metall. Sect. C Miner. Process. Extr. Metall. 1988, 97, C115–C124. [Google Scholar]
- Morrell, S. A method for predicting the specific energy requirement of comminution circuits and assessing their energy utilization efficiency. Miner. Eng. 2008, 21, 224–233. [Google Scholar] [CrossRef]
- Kojovic, T.; Michaux, S.; Walters, S. Development of New Comminution Testing Methodologies for Geometallurgical Mapping of Ore Hardness and Throughput. In Proceedings of the 25th International Mineral Processing Congress, Brisbane, Australia, 6–10 September 2010; pp. 891–899.
- King, R.P.; Bourgeois, F. Measurement of Fracture Energy during Single-Particle Fracture. Miner. Eng. 1993, 6, 353–367. [Google Scholar] [CrossRef]
- Tavares, L.M.; King, R.P. Single-particle fracture under impact loading. Int. J. Miner. Process. 1998, 54, 1–28. [Google Scholar] [CrossRef]
- Tavares, L.M. Energy Absorbed in Breakage of Single Particles in Drop Weight Testing. Miner. Eng. 1999, 12, 43–50. [Google Scholar] [CrossRef]
- Bourgeois, F.S.; Banini, G.A. A portable load cell for in-situ ore impact breakage testing. Int. J. Miner. Process. 2012, 65, 31–54. [Google Scholar] [CrossRef]
- Abel, F.; Rosenkranz, J.; Kuyumcu, H.Z. Stamped coal cakes in coke making technology Part 1—A parameter study on stampability. Iron Mak. Steelmak. 2009, 36, 321–326. [Google Scholar] [CrossRef]
- Narayanan, S.S. Development of a Laboratory Single Particle Breakage Technique and Its Application to Ball Mill Scale-Up. Ph.D. Thesis, University of Queensland, Queensland, Australia, 1985. [Google Scholar]
- Bond, F.C. Crushing Tests by Pressure and Impact. Trans. AIME 1946, 169, 58–65. [Google Scholar]
- Weedon, D.M.; Wilson, F. Modelling Iron Ore Degradation Using a Twin Pendulum Breakage Device. Int. J. Miner. Process. 2000, 59, 195–213. [Google Scholar] [CrossRef]
- Sahoo, R.K.; Weedon, D.M.; Roach, D. Single-Particle Breakage Tests of Gladstone Authority’s Coal by a Twin Pendulum Apparatus. Adv. Powder Technol. 2004, 15, 263–280. [Google Scholar] [CrossRef]
- Fandrich, R.G.; Clout, J.M.F.; Bourgeois, F.S. The CSIRO Hopkinson Bar Facility for Large Diameter Particle Breakage. Miner. Eng. 1998, 11, 861–869. [Google Scholar] [CrossRef]
- Schönert, K.; Marktscheffel, M. Liberation of composite particles by single particle compression, shear and impact loading. In Proceedings of the 6th European Symposium Comminution, Nürnberg, Germany, 16–18 April 1986; pp. 29–45.
- Shi, F.; Kojovic, T.; Larbi-Bram, S.; Manlapig, E. Development of a rapid particle breakage characterization device—The JKRBT. Miner. Eng. 2009, 22, 602–612. [Google Scholar] [CrossRef]
- Briggs, C.A.; Bearman, R.A. An Investigation of Rock Breakage and Damage in Comminution Equipment. Miner. Eng. 1996, 9, 489–497. [Google Scholar] [CrossRef]
- Kojovic, T.; Walters, P. Managing your geomet ore characterization needs with the JKRBT. In Proceedings of the GEOMET2012 International Seminar on Geometallurgy, Santiago, Chile, 1–3 December 2012; pp. 48–49.
- Vogel, L.; Peukert, W. Breakage behaviour of different materials—Construction of a master curve for the breakage probability. Powder Technol. 2003, 129, 101–110. [Google Scholar] [CrossRef]
- Bond, F.C. Crushing and grinding calculations. Br. Chem. Eng. 1961, 6, 378–385. [Google Scholar]
- Bond, F.C. The Third Theory of Comminution. Trans. AIME Min. Eng. 1952, 1983, 484–494. [Google Scholar]
- Barratt, D.J. An update on testing, scale up and sizing equipment for autogenous and semi-autogenous grinding circuits. In Proceedings of the International Autogenous and Semi-Autogenous Grinding Technology Conference, Vancouver, BC, Canada, 25–27 September 1989; pp. 25–46.
- Starkey, J.H.; Dobby, G.; Kosick, G. A New Tool for SAG Hardness Testing. In Proceedings of the 26th Canadian Mineral Processors Annual Meeting, Ottawa, ON, Canada, 18–20 January 1994.
- Starkey, J.H.; Hindstrom, S.; Nadasdy, G. SAGDesign testing—What is it and Why it Works. In Proceedings of the International Conference on Autogenous and Semi-Autogenous Grinding Technology (SAG 2006), Vancouver, BC, Canada, 23–27 September 2006; Volume 4, pp. 240–254.
- Amelunxen, P.; Berrios, P.; Rodriguez, E. The SAG grindability index test. Miner. Eng. 2014, 55, 42–51. [Google Scholar] [CrossRef]
- Bennett, C.; Dobby, G.S.; Kosick, G. Benchmarking and ore body profiling—The keys to effective production forecasting and SAG circuit optimization. In Proceedings of the International Conference on Autogenous and Semi-Autogenous Grinding Technology (SAG 2001), Vancouver, BC, Canada, 30 September–1 October 2001; Volume 1, pp. 289–300.
- Dobby, G.; Bennett, C.; Kosick, G. Advances in SAG Circuit Design and Simulation Applied to the Mine Block Model. In Proceedings of the International Conference on Autogenous and Semi-Autogenous Grinding Technology (SAG 2001), Vancouver, BC, Canada, 30 September–1 October 2001; Volume 4, pp. 221–234.
- Kosick, G.; Dobby, G.; Bennett, C. CEET (Comminution Economic Evaluation Tool) for Comminution Circuit Design and Production Planning. In Proceedings of 2001 SME Annual Meeting, Denver, CO, USA, 26–28 February 2001.
- Niitti, T. Rapid Evaluation of Grindability by a Simple Batch test. In Proceedings of the International Mineral Processing Congress, Prague, Czechoslovakia, 1–6 June 1970; pp. 41–46.
- Nematollahi, H. New Size Laboratory Ball Mill for Bond Work Index Determination. Min. Eng. 1994, 46, 352–353. [Google Scholar]
- Tüzün, M.A. Wet Bond Mill Test. Miner. Eng. 2001, 14, 369–373. [Google Scholar] [CrossRef]
- Magdalinovica, N. Procedure for Rapid Determination of the Bond Work Index. Int. J. Miner. Process. 1989, 27, 125–132. [Google Scholar] [CrossRef]
- Tavares, L.M.; de Carvalho, R.M.; Guerrero, J.C. Simulating the Bond rod mill grindability test. Miner. Eng. 2012, 26, 99–101. [Google Scholar] [CrossRef]
- Kojovic, T.; Walters, P. Development of the JK Bond Ball Lite Test (JK BBL). In Proceedings of the GEOMET2012 International Seminar on Geometallurgy, Santiago, Chile, 5–7 December 2012; pp. 46–47.
- Kosick, G.; Bennett, C. The Value of Orebody Power Requirement Profiles for SAG Circuit Design. In Proceedings of the 31st Annual Meeting of the Canadian Mineral Processors, Ottawa, ON, Canada, 19–21 January 1999; pp. 241–254.
- Lamberg, P.; Vianna, S.M.S. A technique for tracking multiphase mineral particles in flotation circuits. In Proceedings of the 7th Meeting of the Southern Hemisphere on Mineral Technology, Ouro Preto, Brazil, 20–24 November 2007; pp. 195–202.
- Vatandoost, A. Petrophysical Characterization of Comminution Behavior. Ph.D. Thesis, University of Tasmania, Tasmania, Australia, 2010. [Google Scholar]
- Mwanga, A.; Rosenkranz, J.; Lamberg, P.; Koch, P.-H. Simplified Comminution Test Method for Studying Small Amounts of Ore Samples for Geometallurgical Purposes. In Proceedings of the Exploration Resource and Mining Geology Conference 2013, Cardiff, UK, 21–22 October 2013; pp. 45–48.
© 2015 by the authors; licensee MDPI, Basel, Switzerland. This article is an open access article distributed under the terms and conditions of the Creative Commons Attribution license (http://creativecommons.org/licenses/by/4.0/).


