Forensic Assessment of Metal Contaminated Rivers in the 21st Century Using Geochemical and Isotopic Tracers

Abstract
:1. Introduction
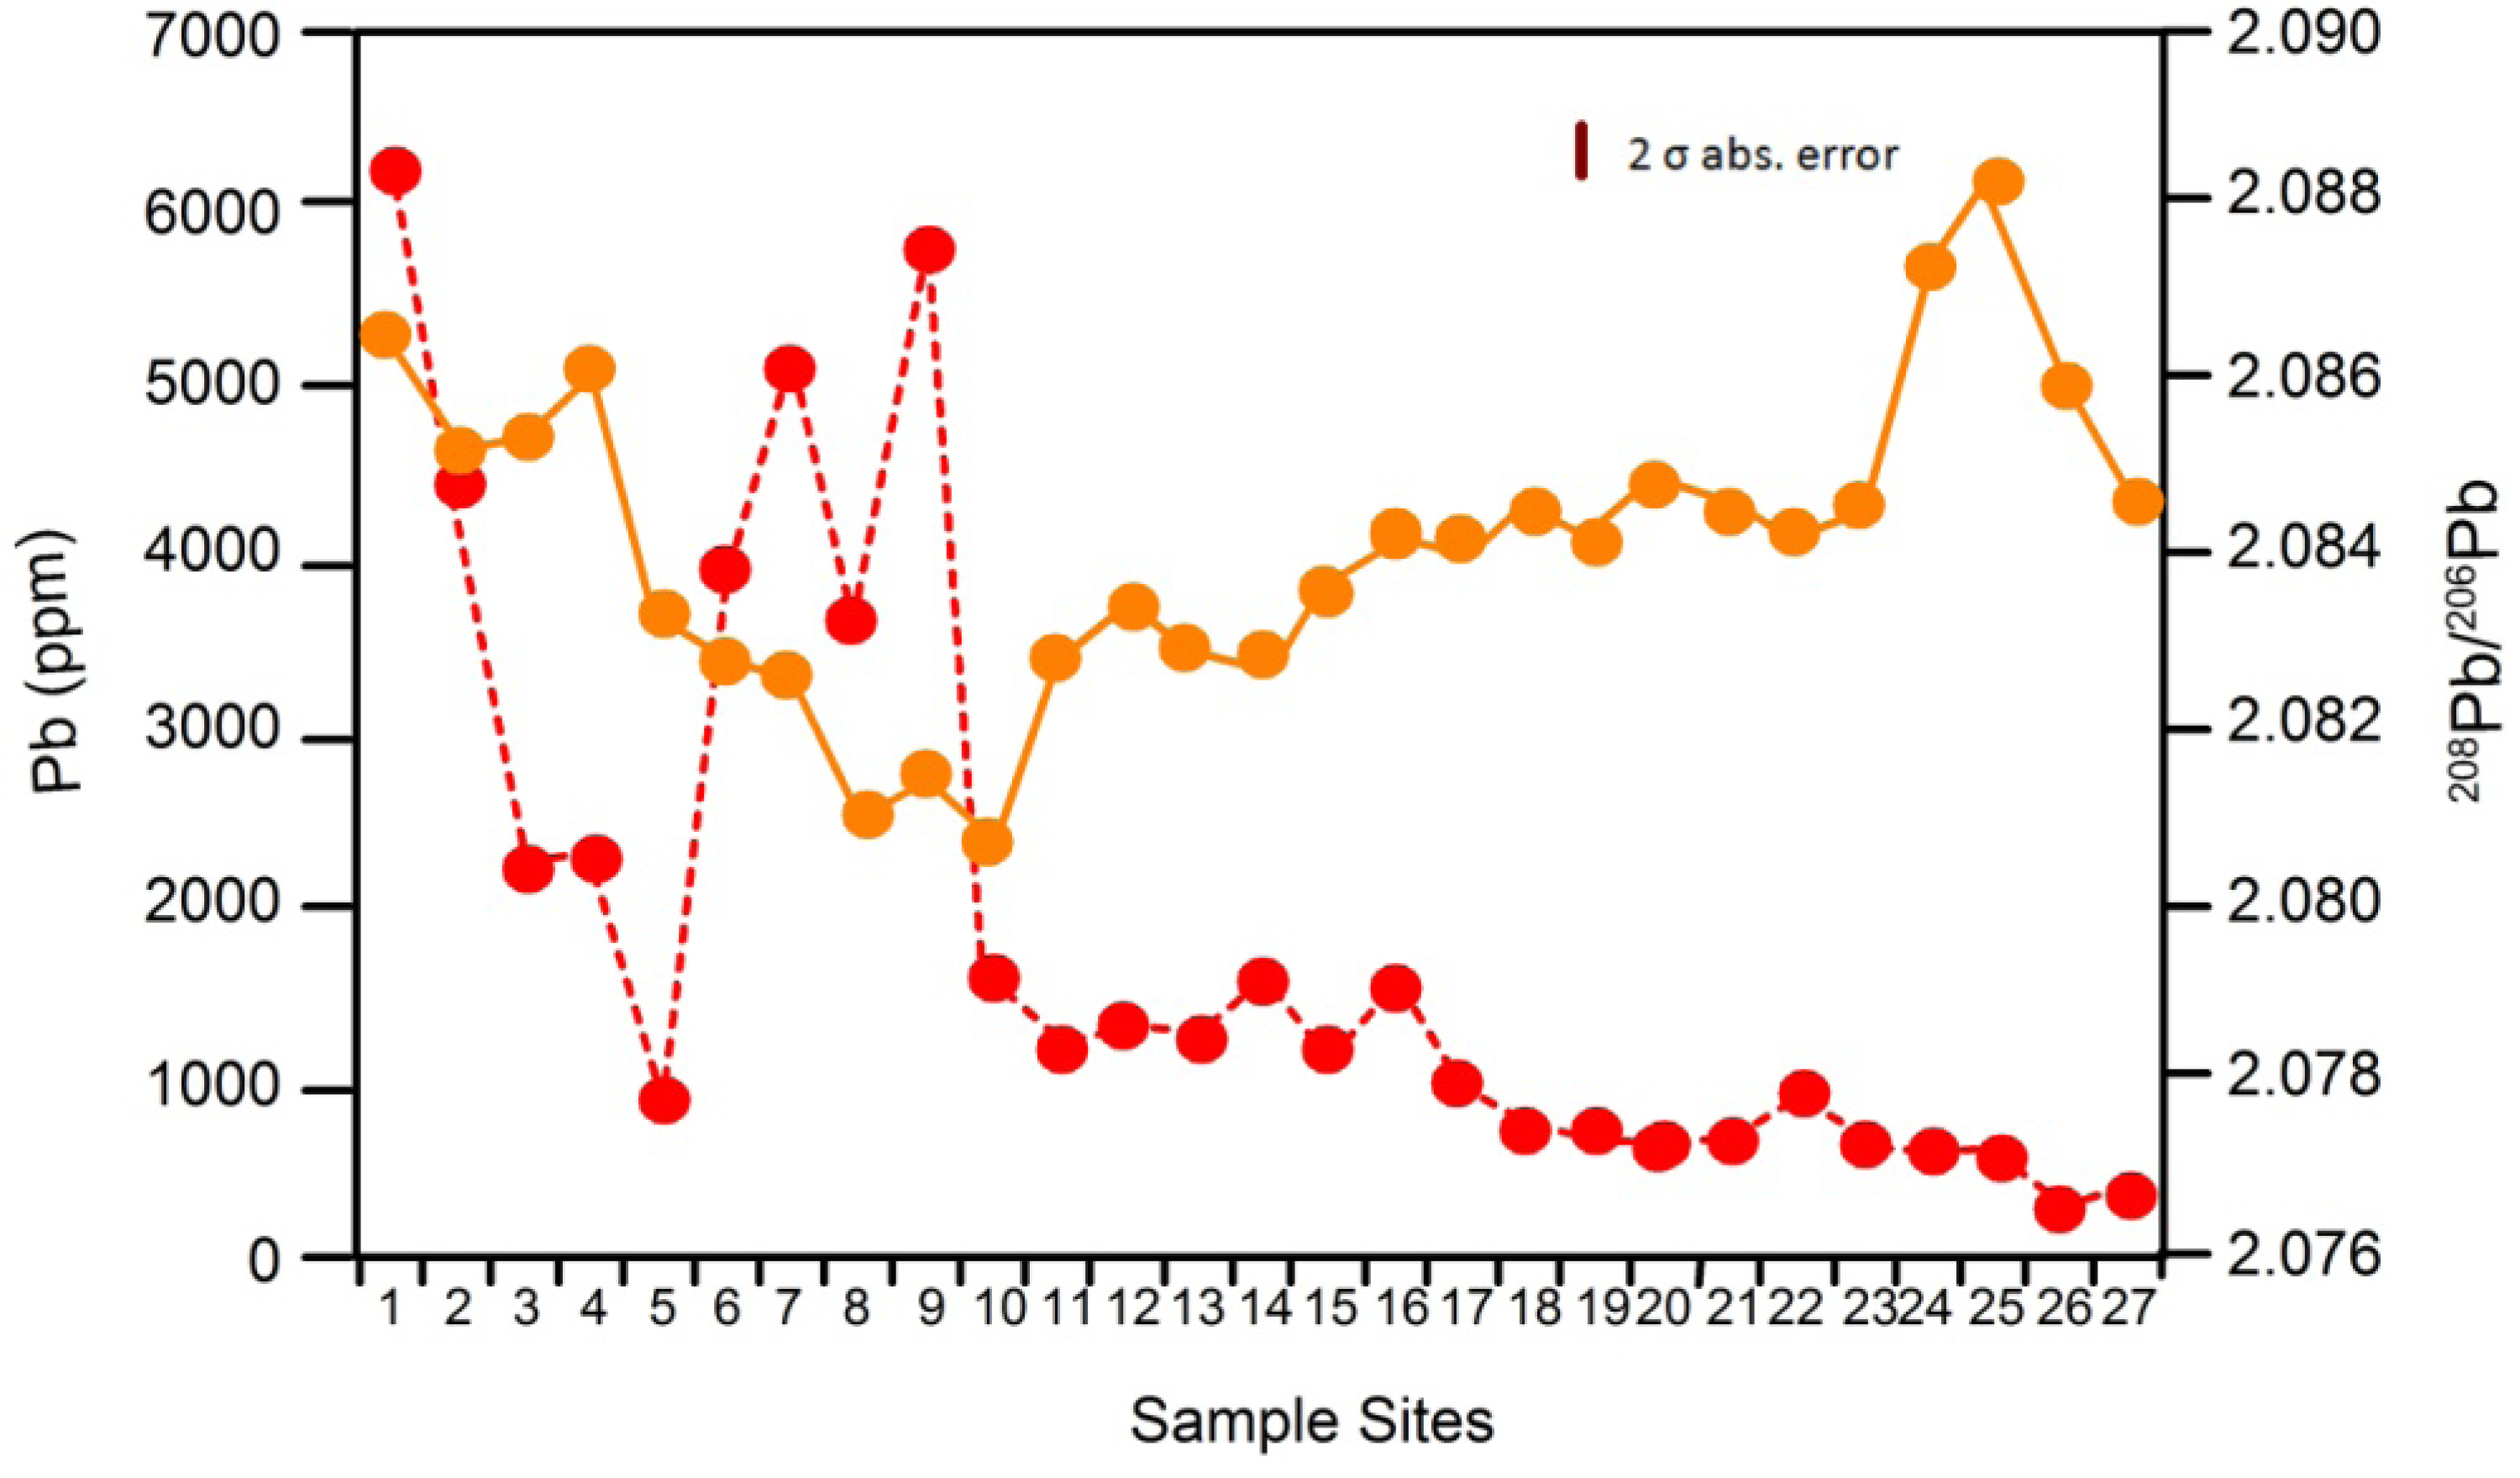
2. Identifying Contaminant Sources Using Spatial Patterns in Geochemical Tracers


Quantifying Relative Source Contributions


3. Use of Geochemical Tracers to Construct Pollution Histories
3.1. Pollution Histories Based on Overbank Deposits
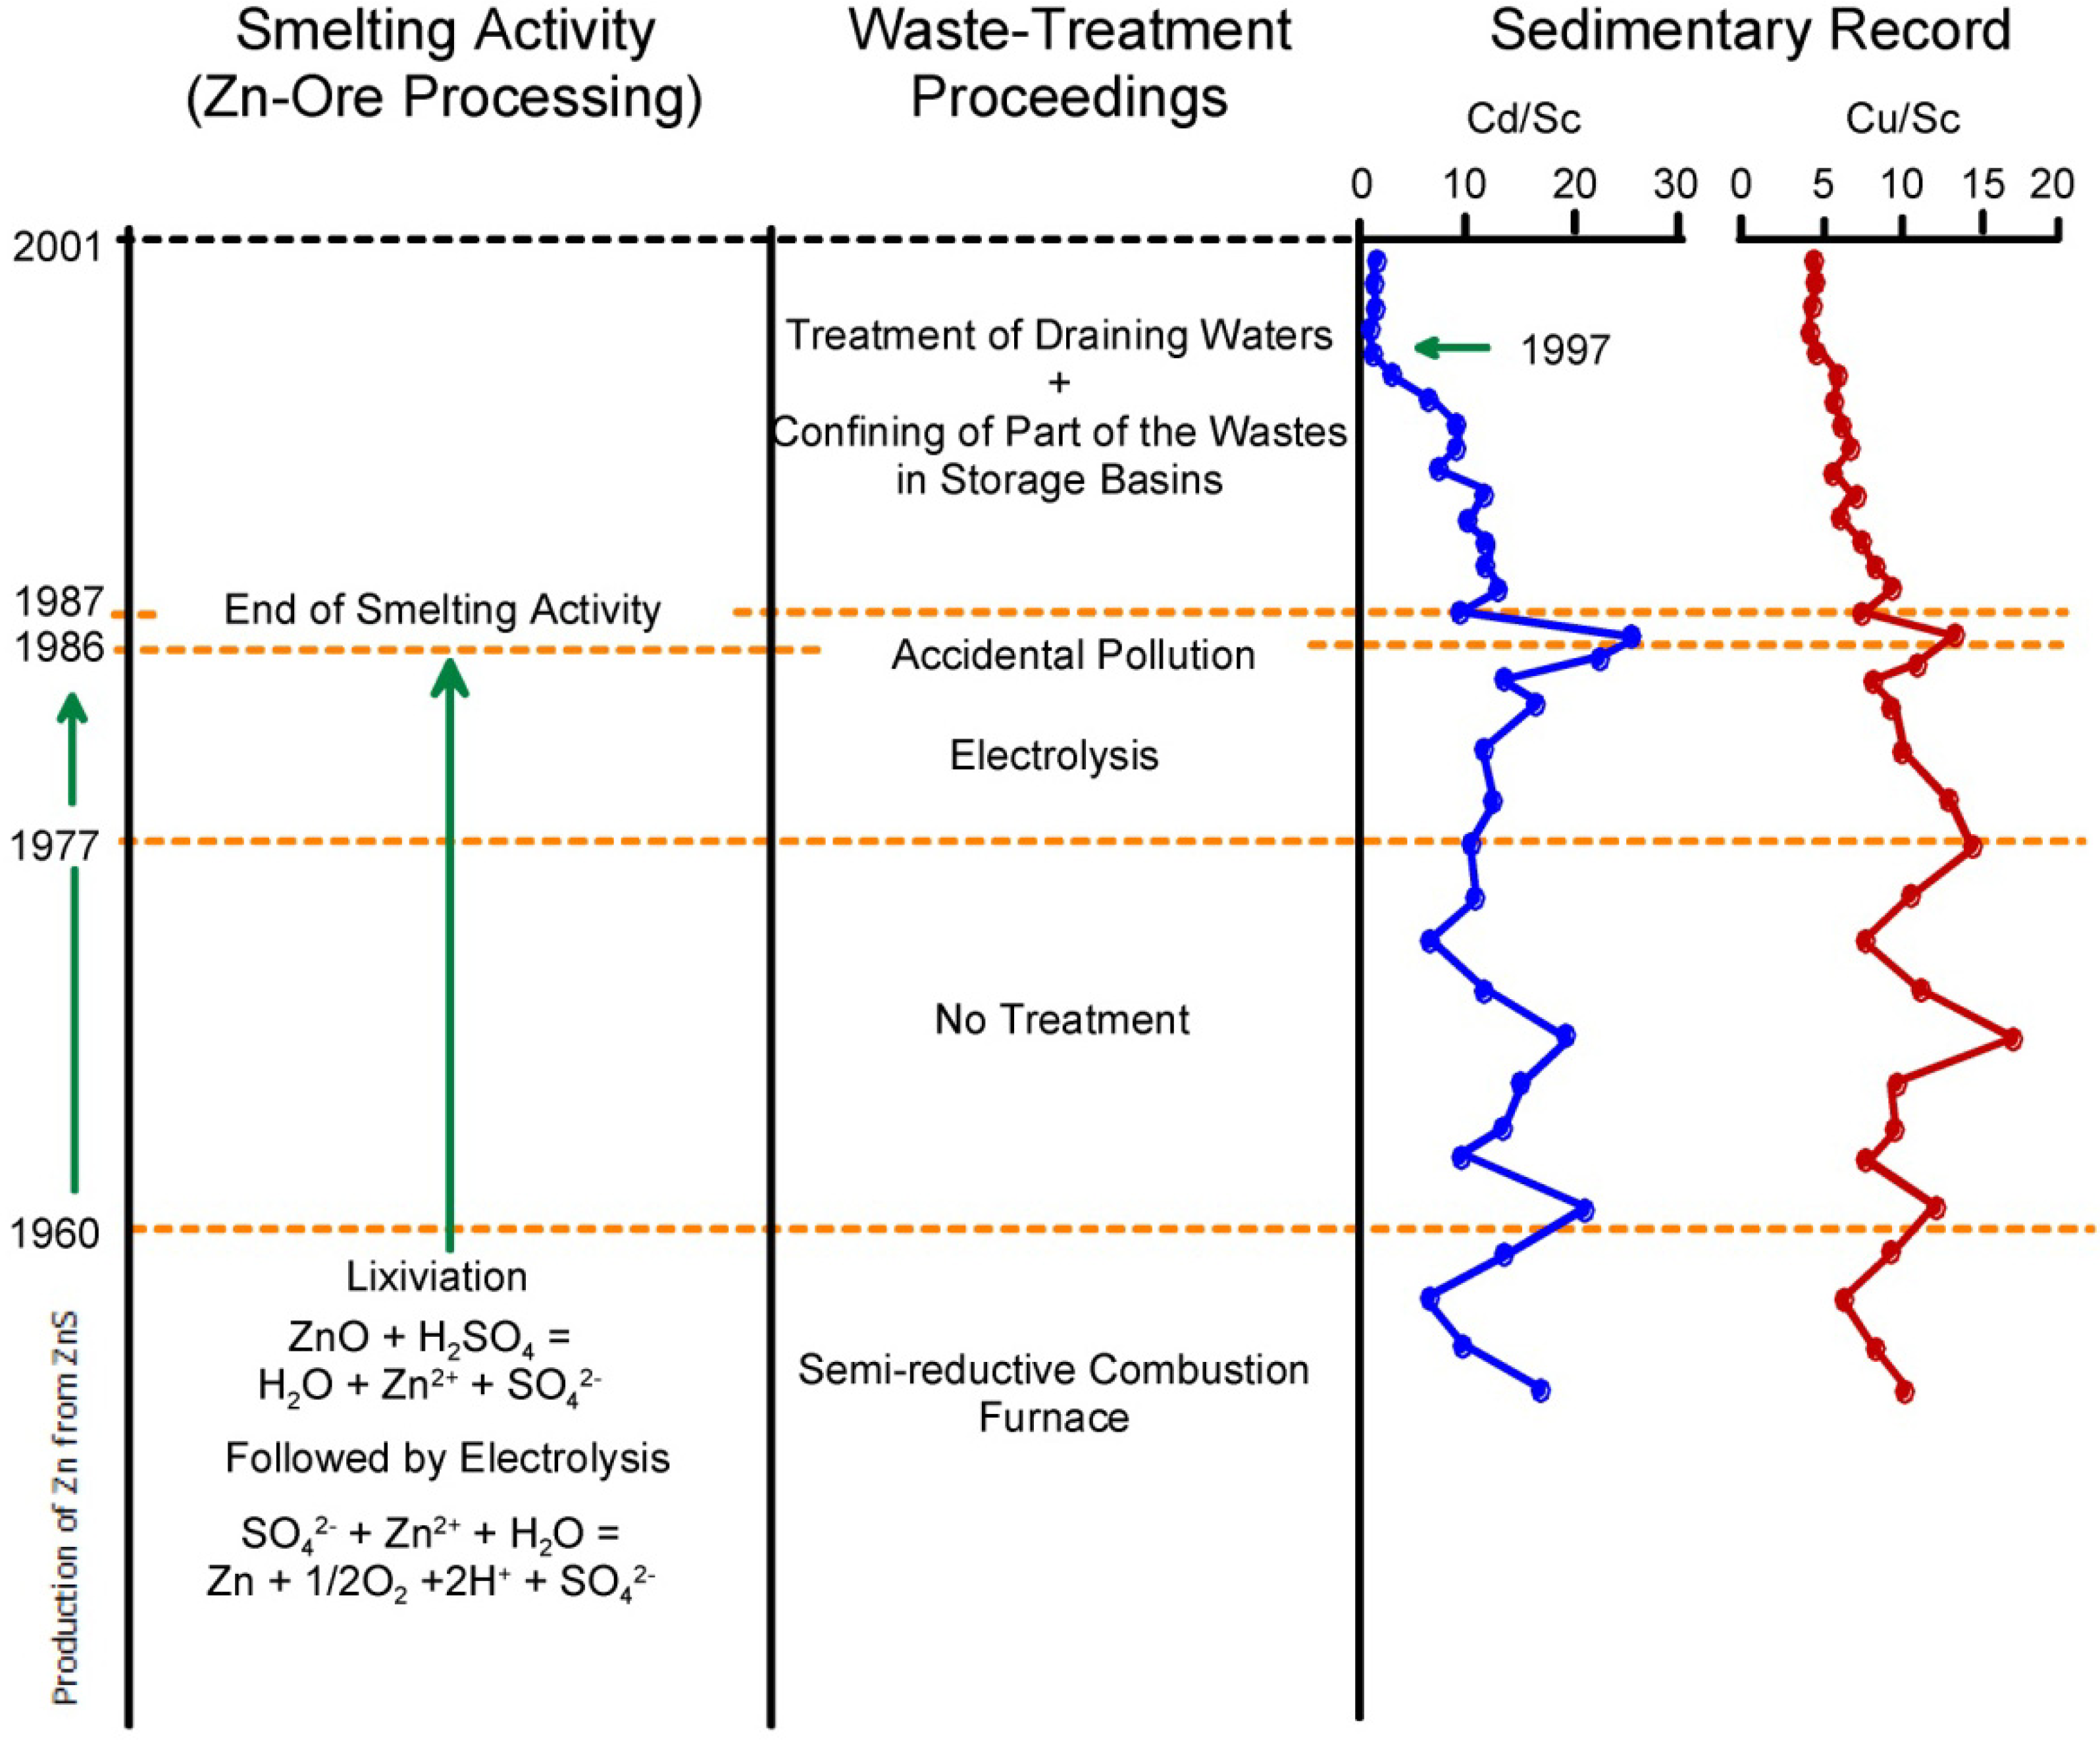
3.2. Pollution Histories Based on Lacustrine Deposits
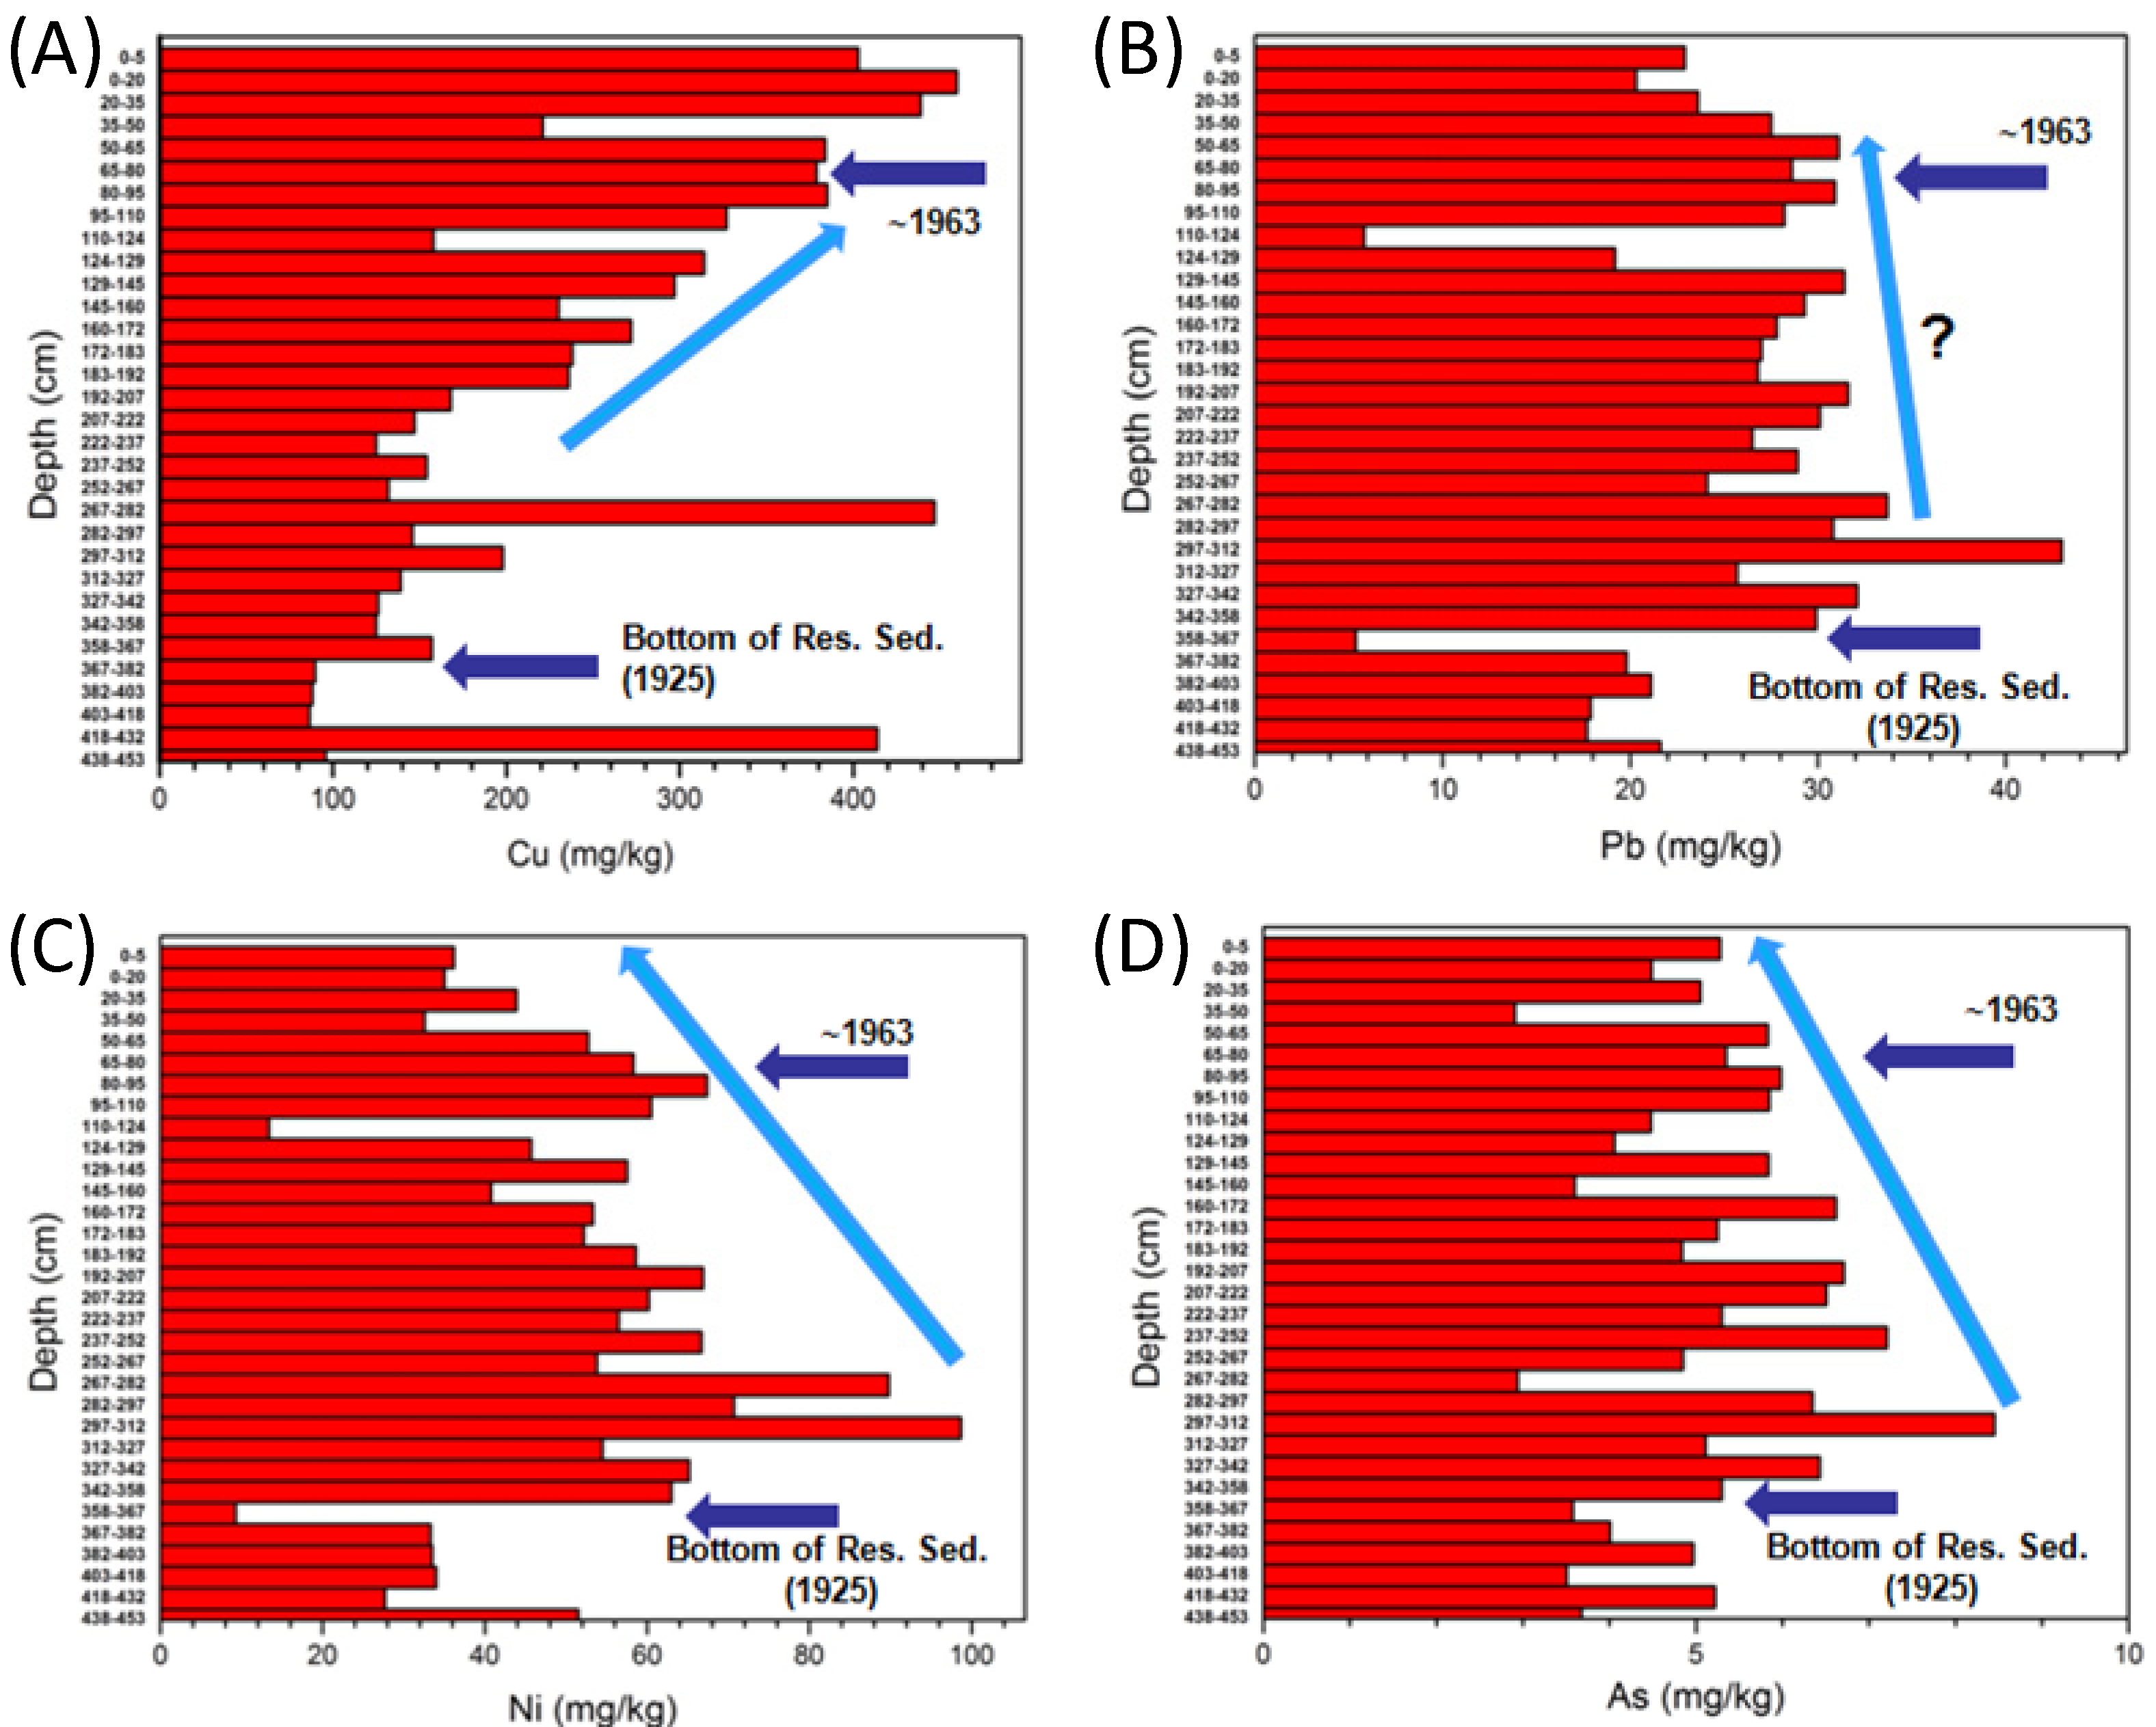
3.3. Extrapolating Site Data Using Chemostratigraphic Methods
4. Elemental Isotopes as a Geochemical Tracer
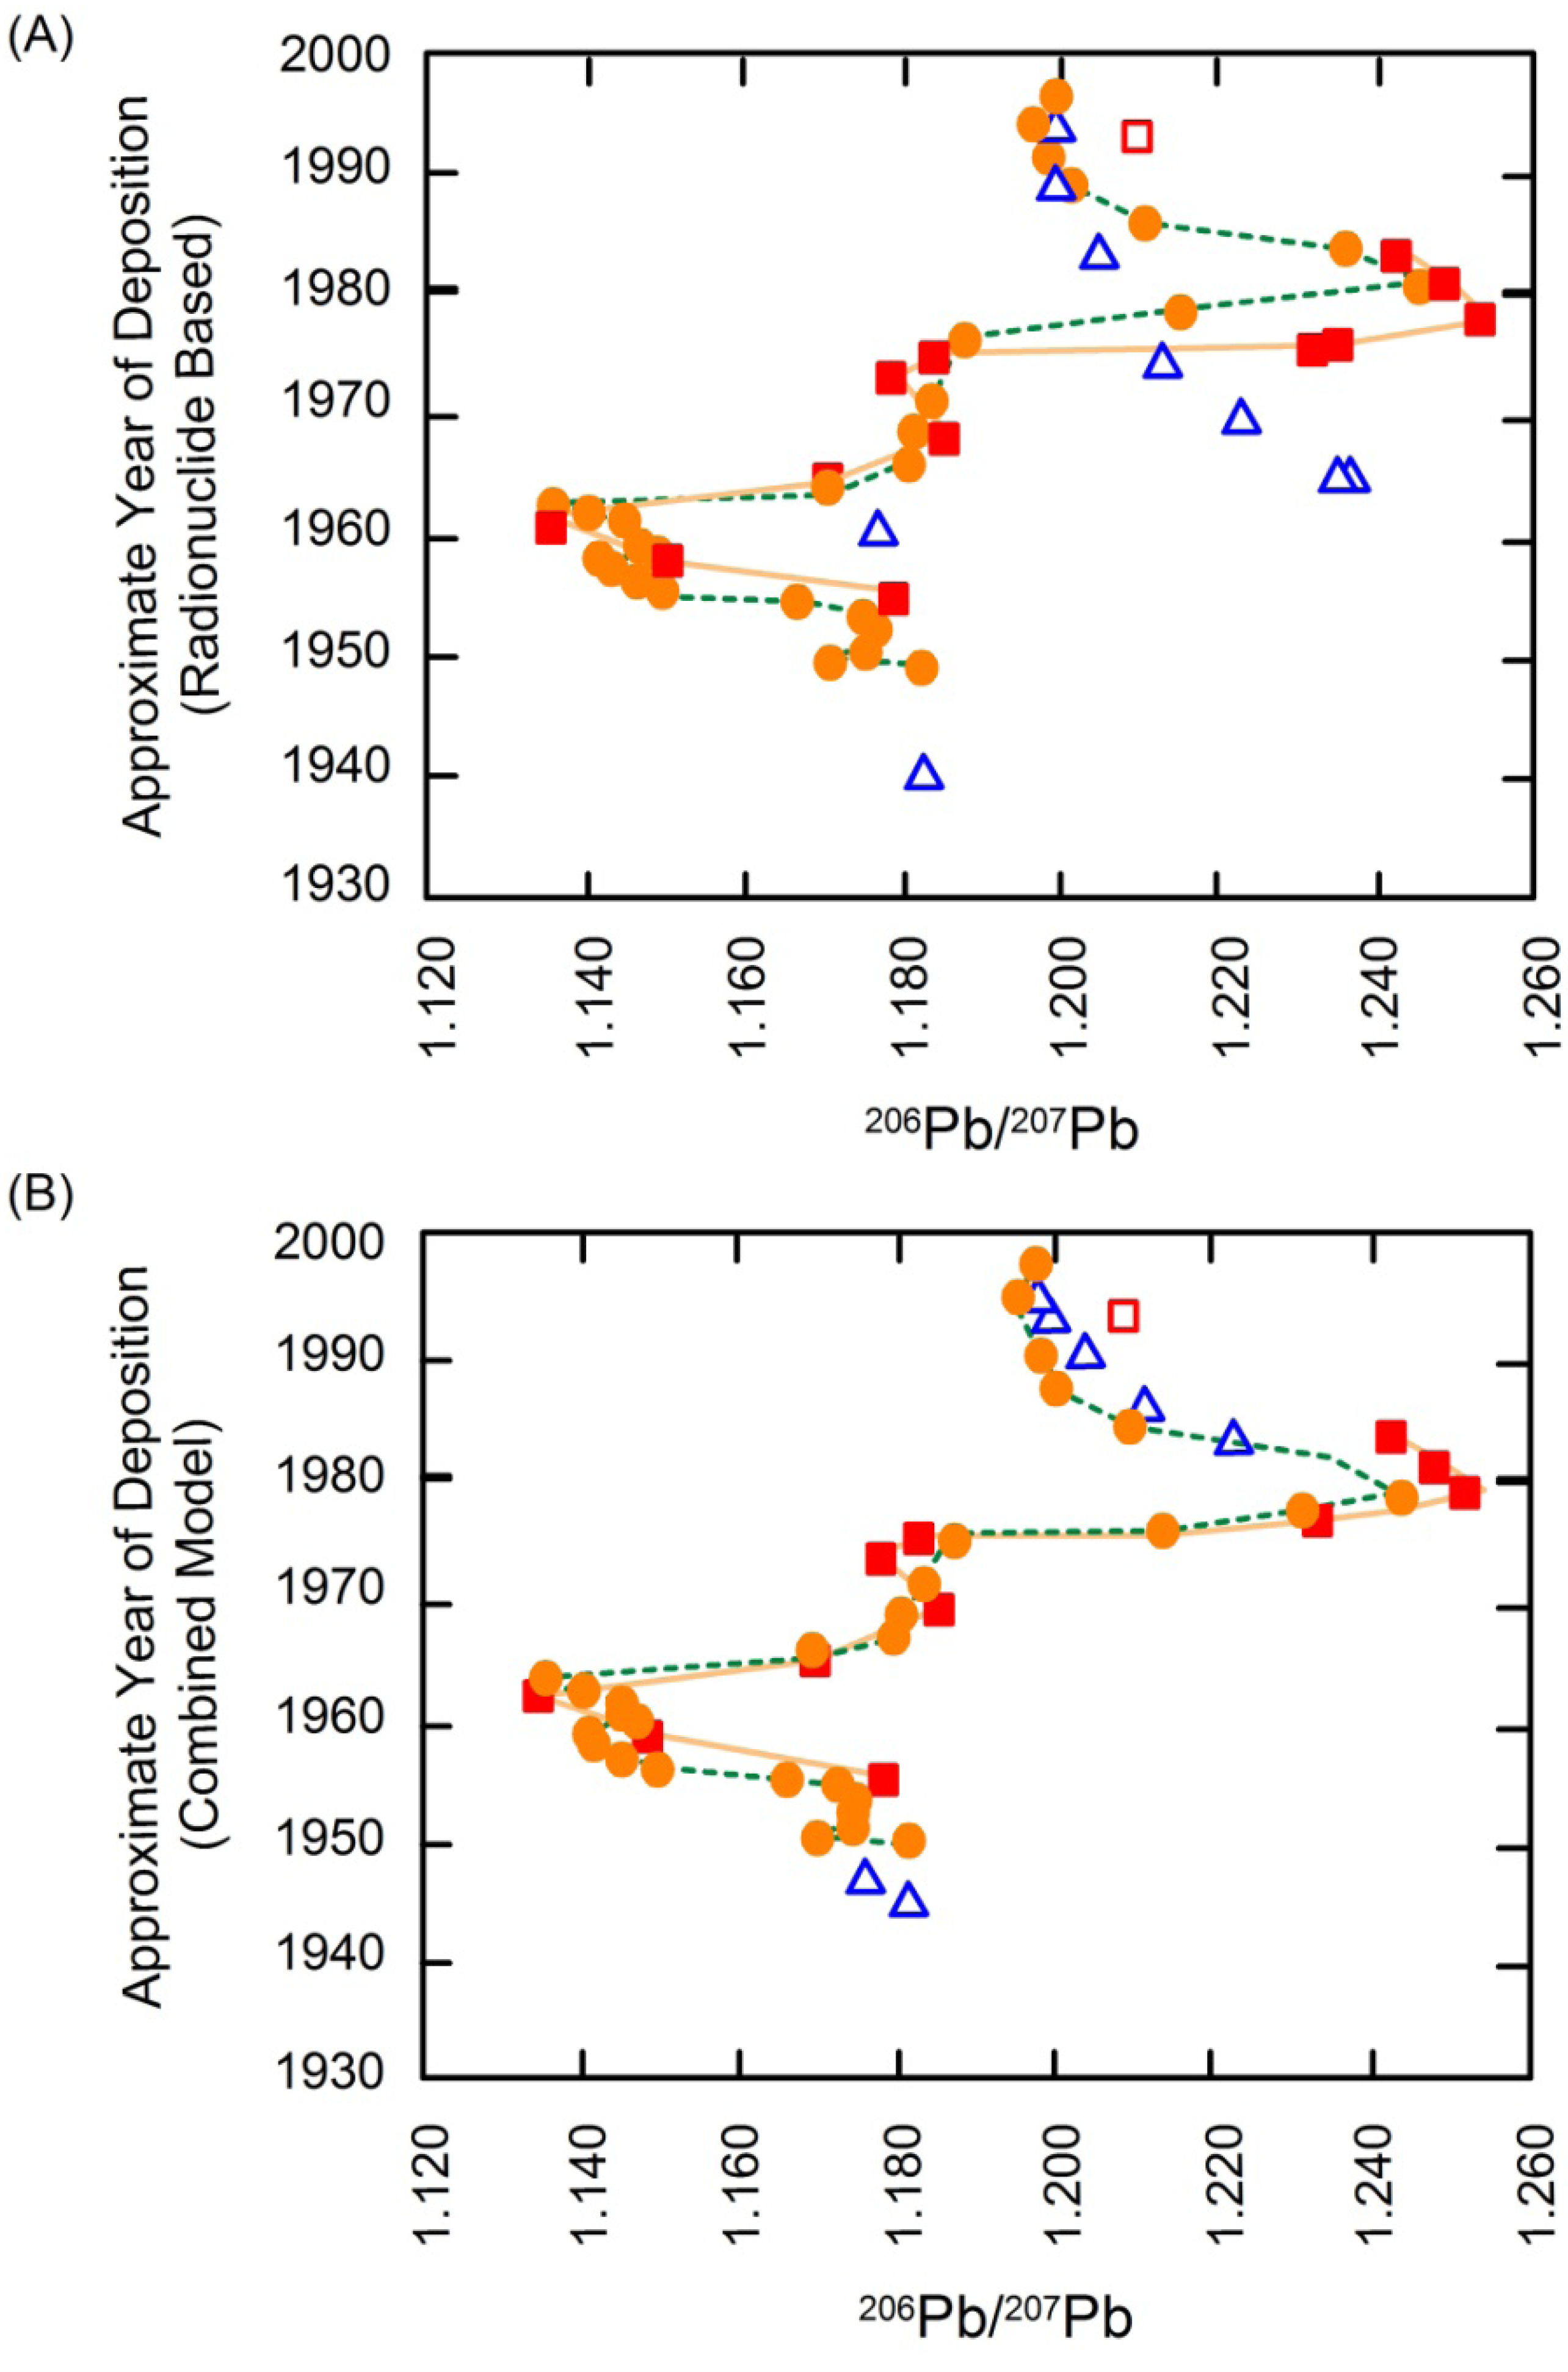
4.1. Pb Isotopes

| Isotope | Abundance | Half-life and Parent Isotope |
|---|---|---|
| 204Pb | 1.48% | 204Pb (stable) |
| 206Pb | 23.60% | 238U to 206Pb; ½ life of 4.5 × 10⁹ years |
| 207Pb | 22.60% | 235U to 207Pb; ½ life of 7.1 × 10⁸ years |
| 208Pb | 52.30% | 232Th to 208Pb; ½ life of 1.4 × 10¹⁰ years |
4.2. Applying Pb Isotopes as a Tracer in Riverine Environments


4.3. Other Stable Isotopes as Geochemical Tracers
| Element | Stable Isotopes * | Frequently Used Isotopic Ratios 1 | Primary Fractionation Processes | Comments | Selected References Relevant to Riverine Environments |
|---|---|---|---|---|---|
| Cd | 106Cd, 108Cd, 110Cd, 111Cd, 112Cd, 113Cd, 114Cd, 116Cd | 114Cd/110Cd | Evaporation and condensation, including that associated with ore processing; biological processes | Possible use to assess nutrient uptake and translocation in microorganisms and plants; may be used to trace source, but not adequately tested | Gao et al. [183]; Cloquet et al. [184]; Weiss et al. [185]; Shiel et al. [186,187] |
| Cu | 63Cu, 65Cu | 65Cu/63Cu | Redox reaction; biogenic accumulation; solution speciation | May be used to assess redox processes during biogeochemical cycling and to trace source of Cu, but not adequately tested | Weiss et al. [185]; Bird [29]; Kimball et al. [188]; Zhu et al. [189]; Petit et al. [190] |
| Cr | 50Cr, 52Cr, 53Cr, 54Cr | 53Cr/52Cr | Redox reactions; equilibrium adsorption | May be used to assess redox processes during biogeochemical cycling of elements | Weiss et al. [185] |
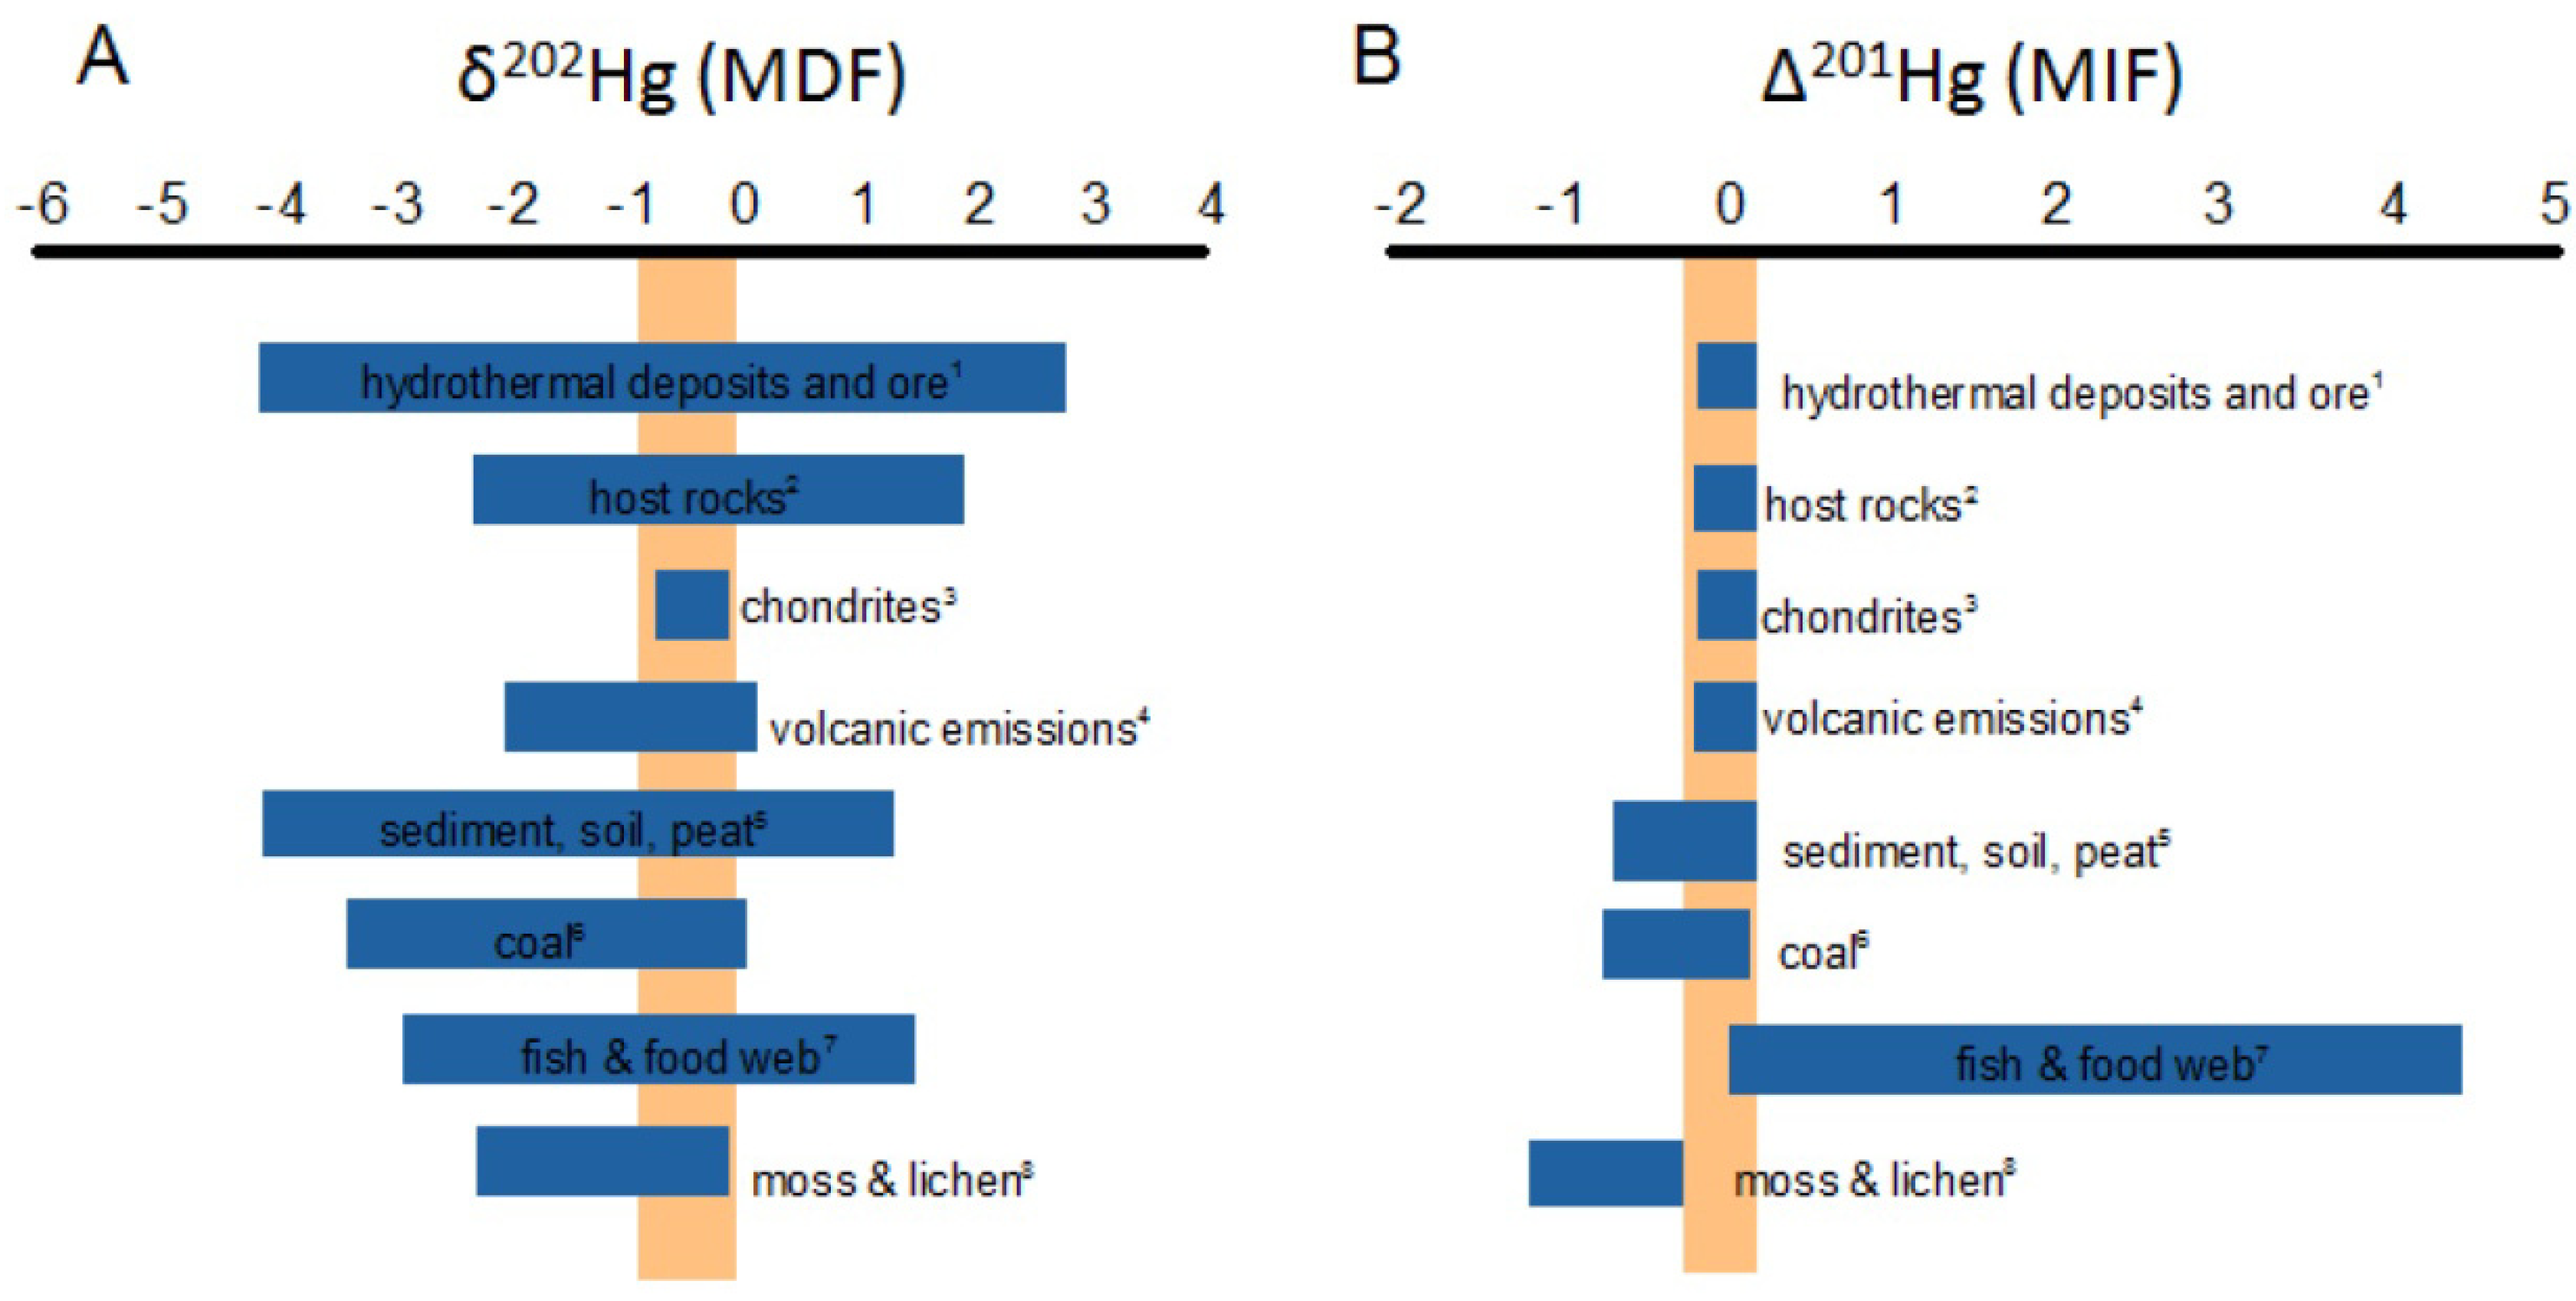
| Hg | 196Hg, 198Hg, 199Hg, 200Hg, 201Hg, 202Hg, 204Hg | 202Hg/198Hg | MDF—Redox reactions, biomethylation, evaporation, condensation; absorption; MIF—photoreduction, biological transformations | May be used to assess redox processes during biogeochemical cycling of elements | Mil-Homes et al. [105]; Bergquist and Blum [191]; Yin et al. [192]; Sonke et al. [193] |
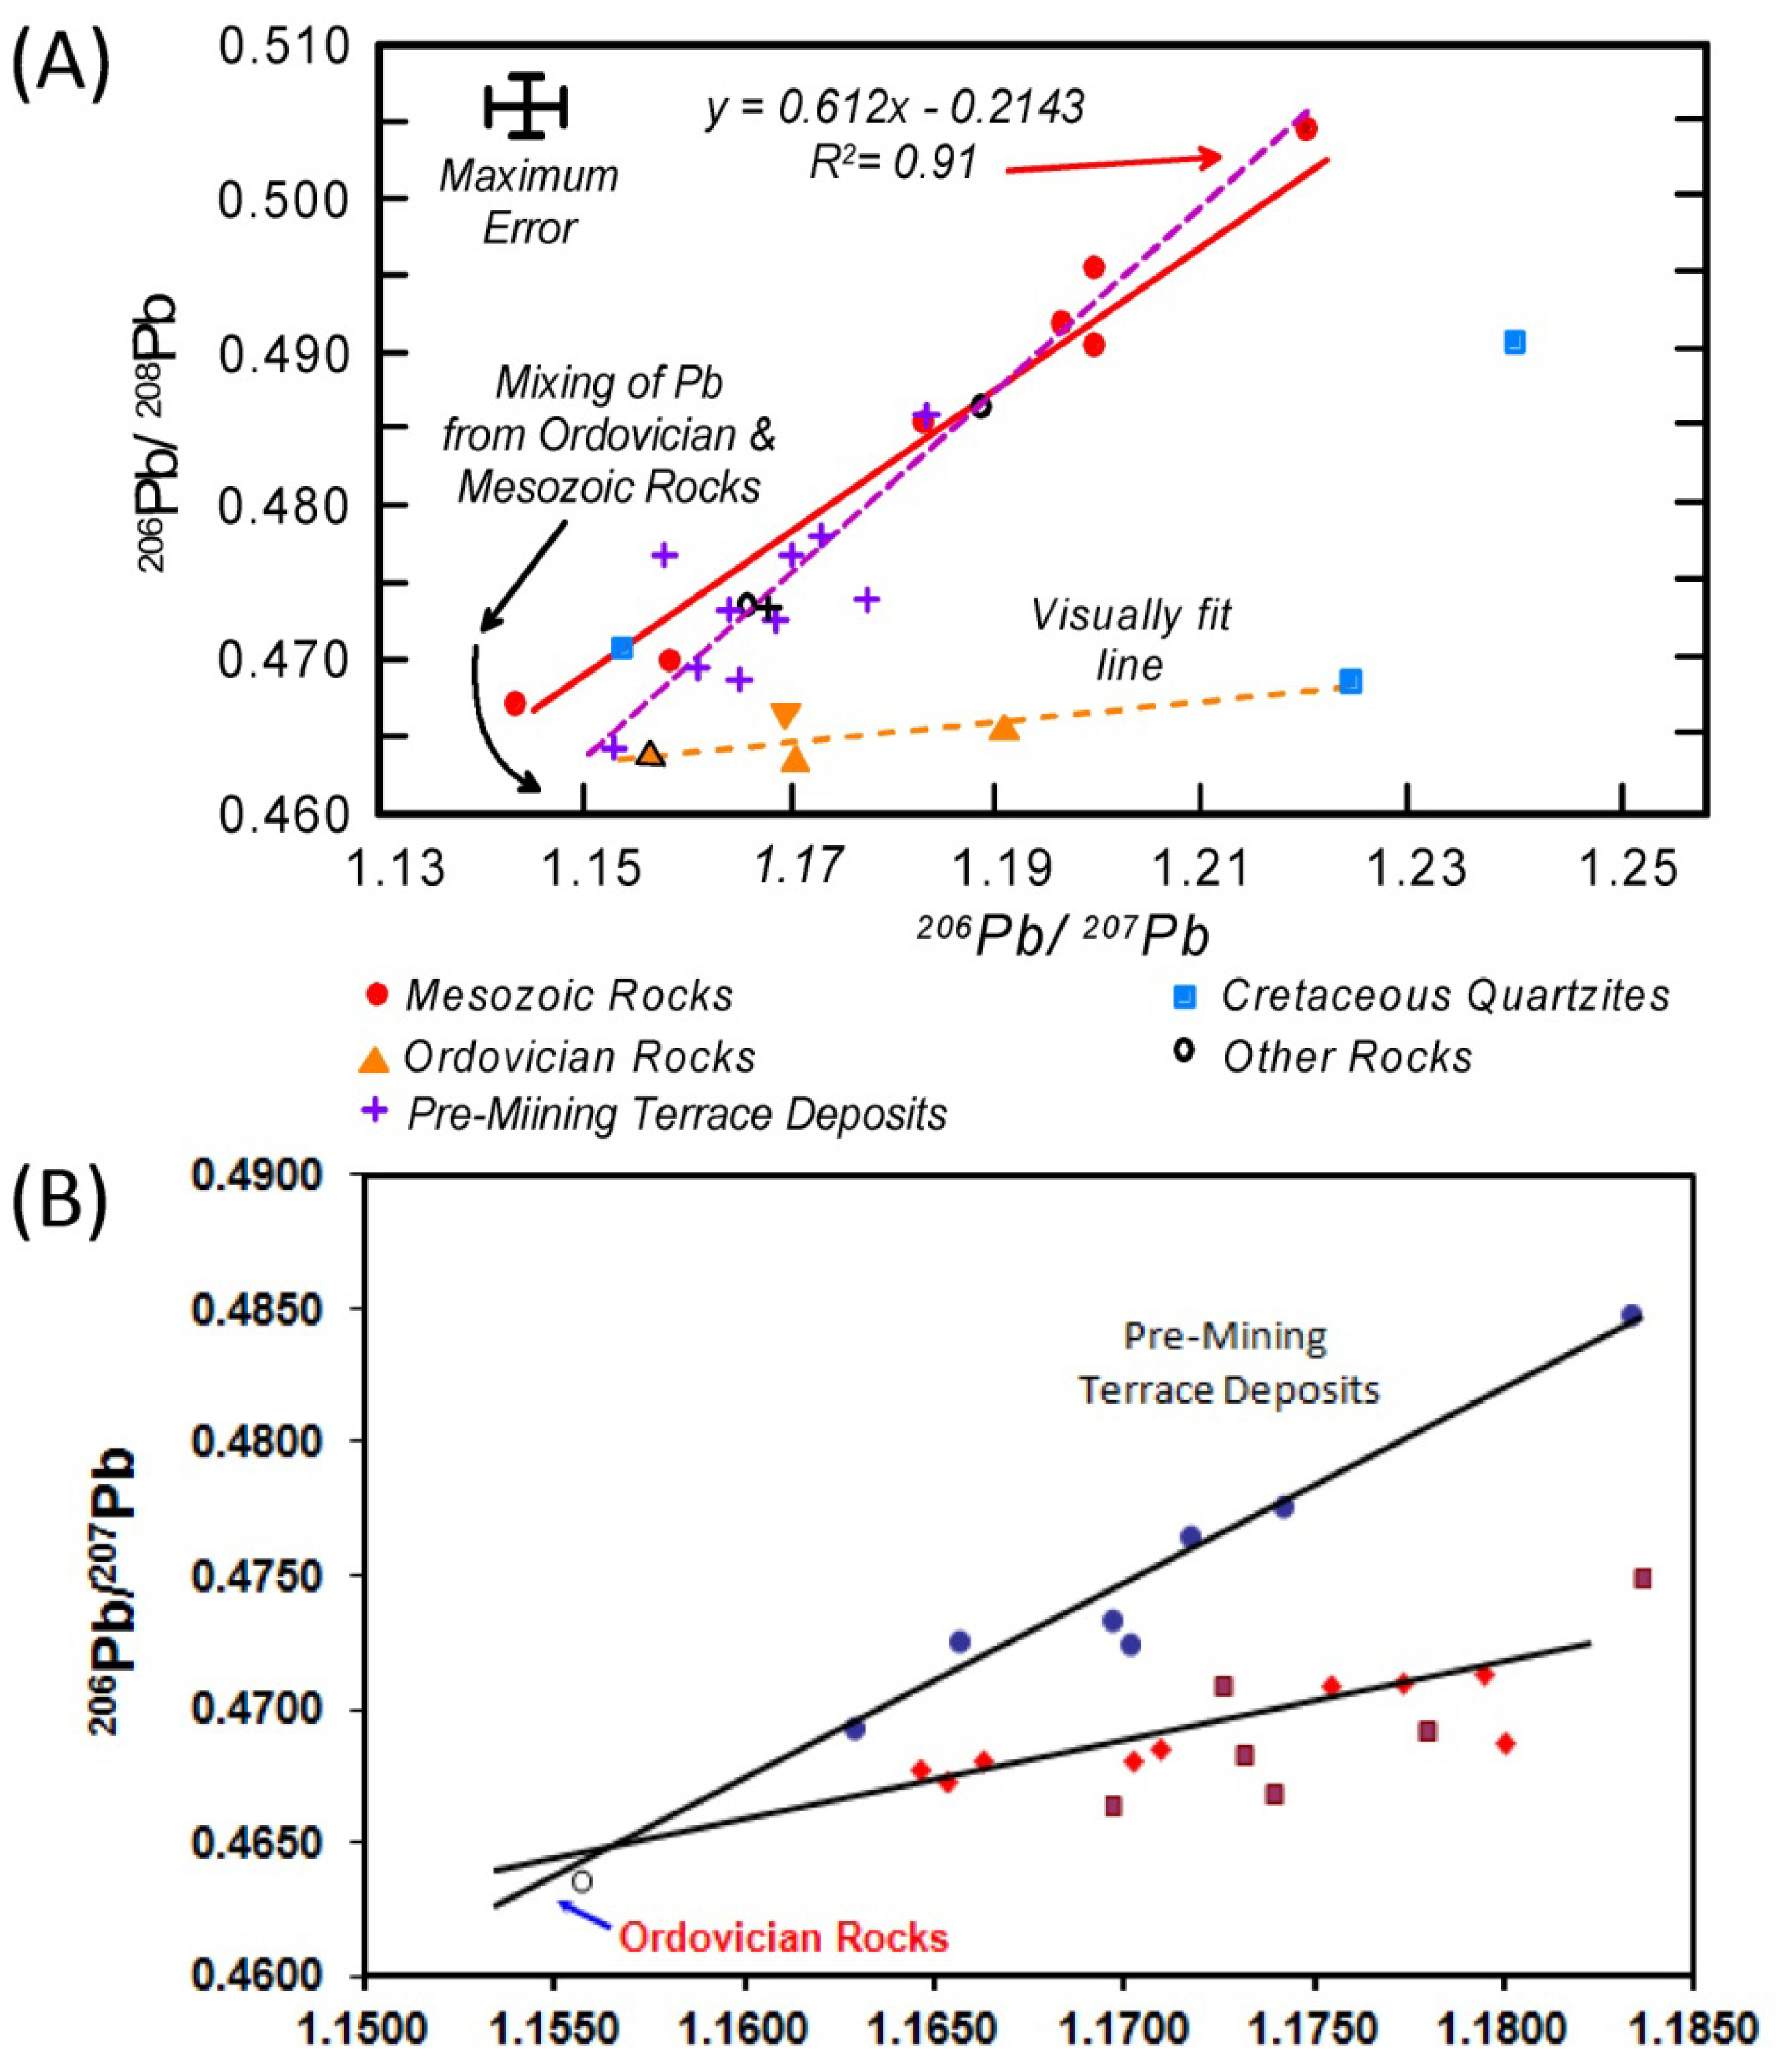
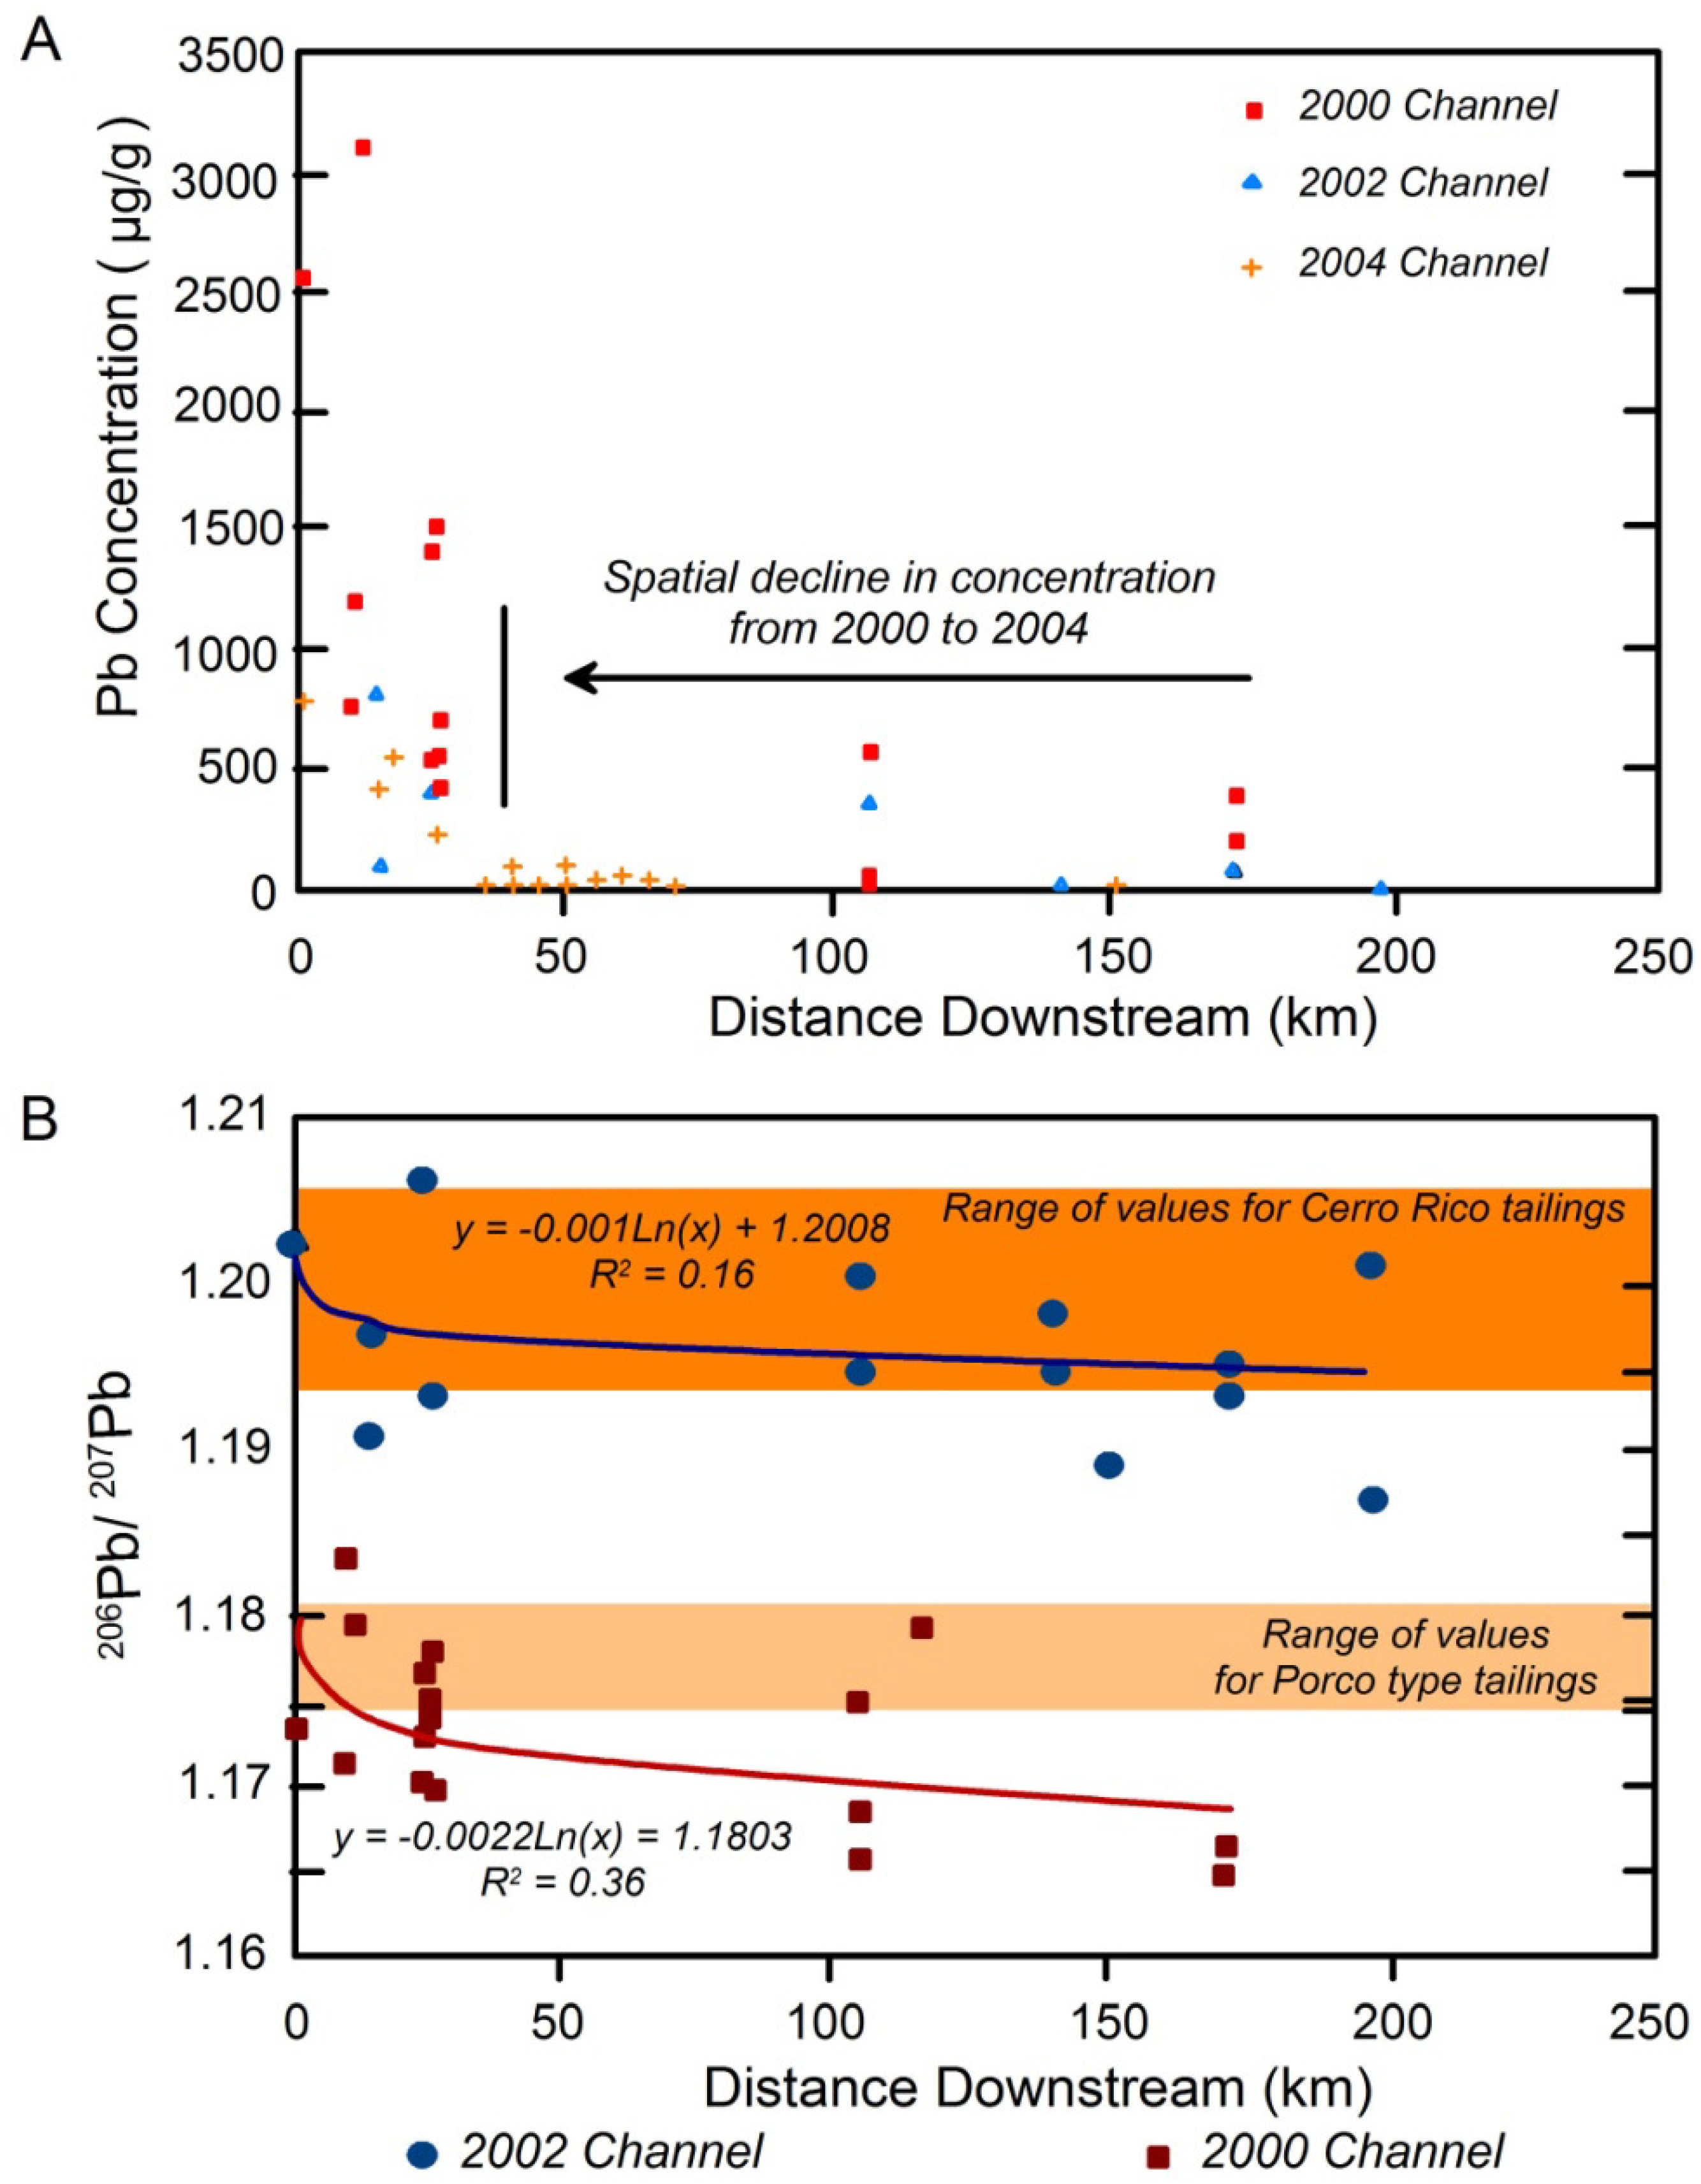
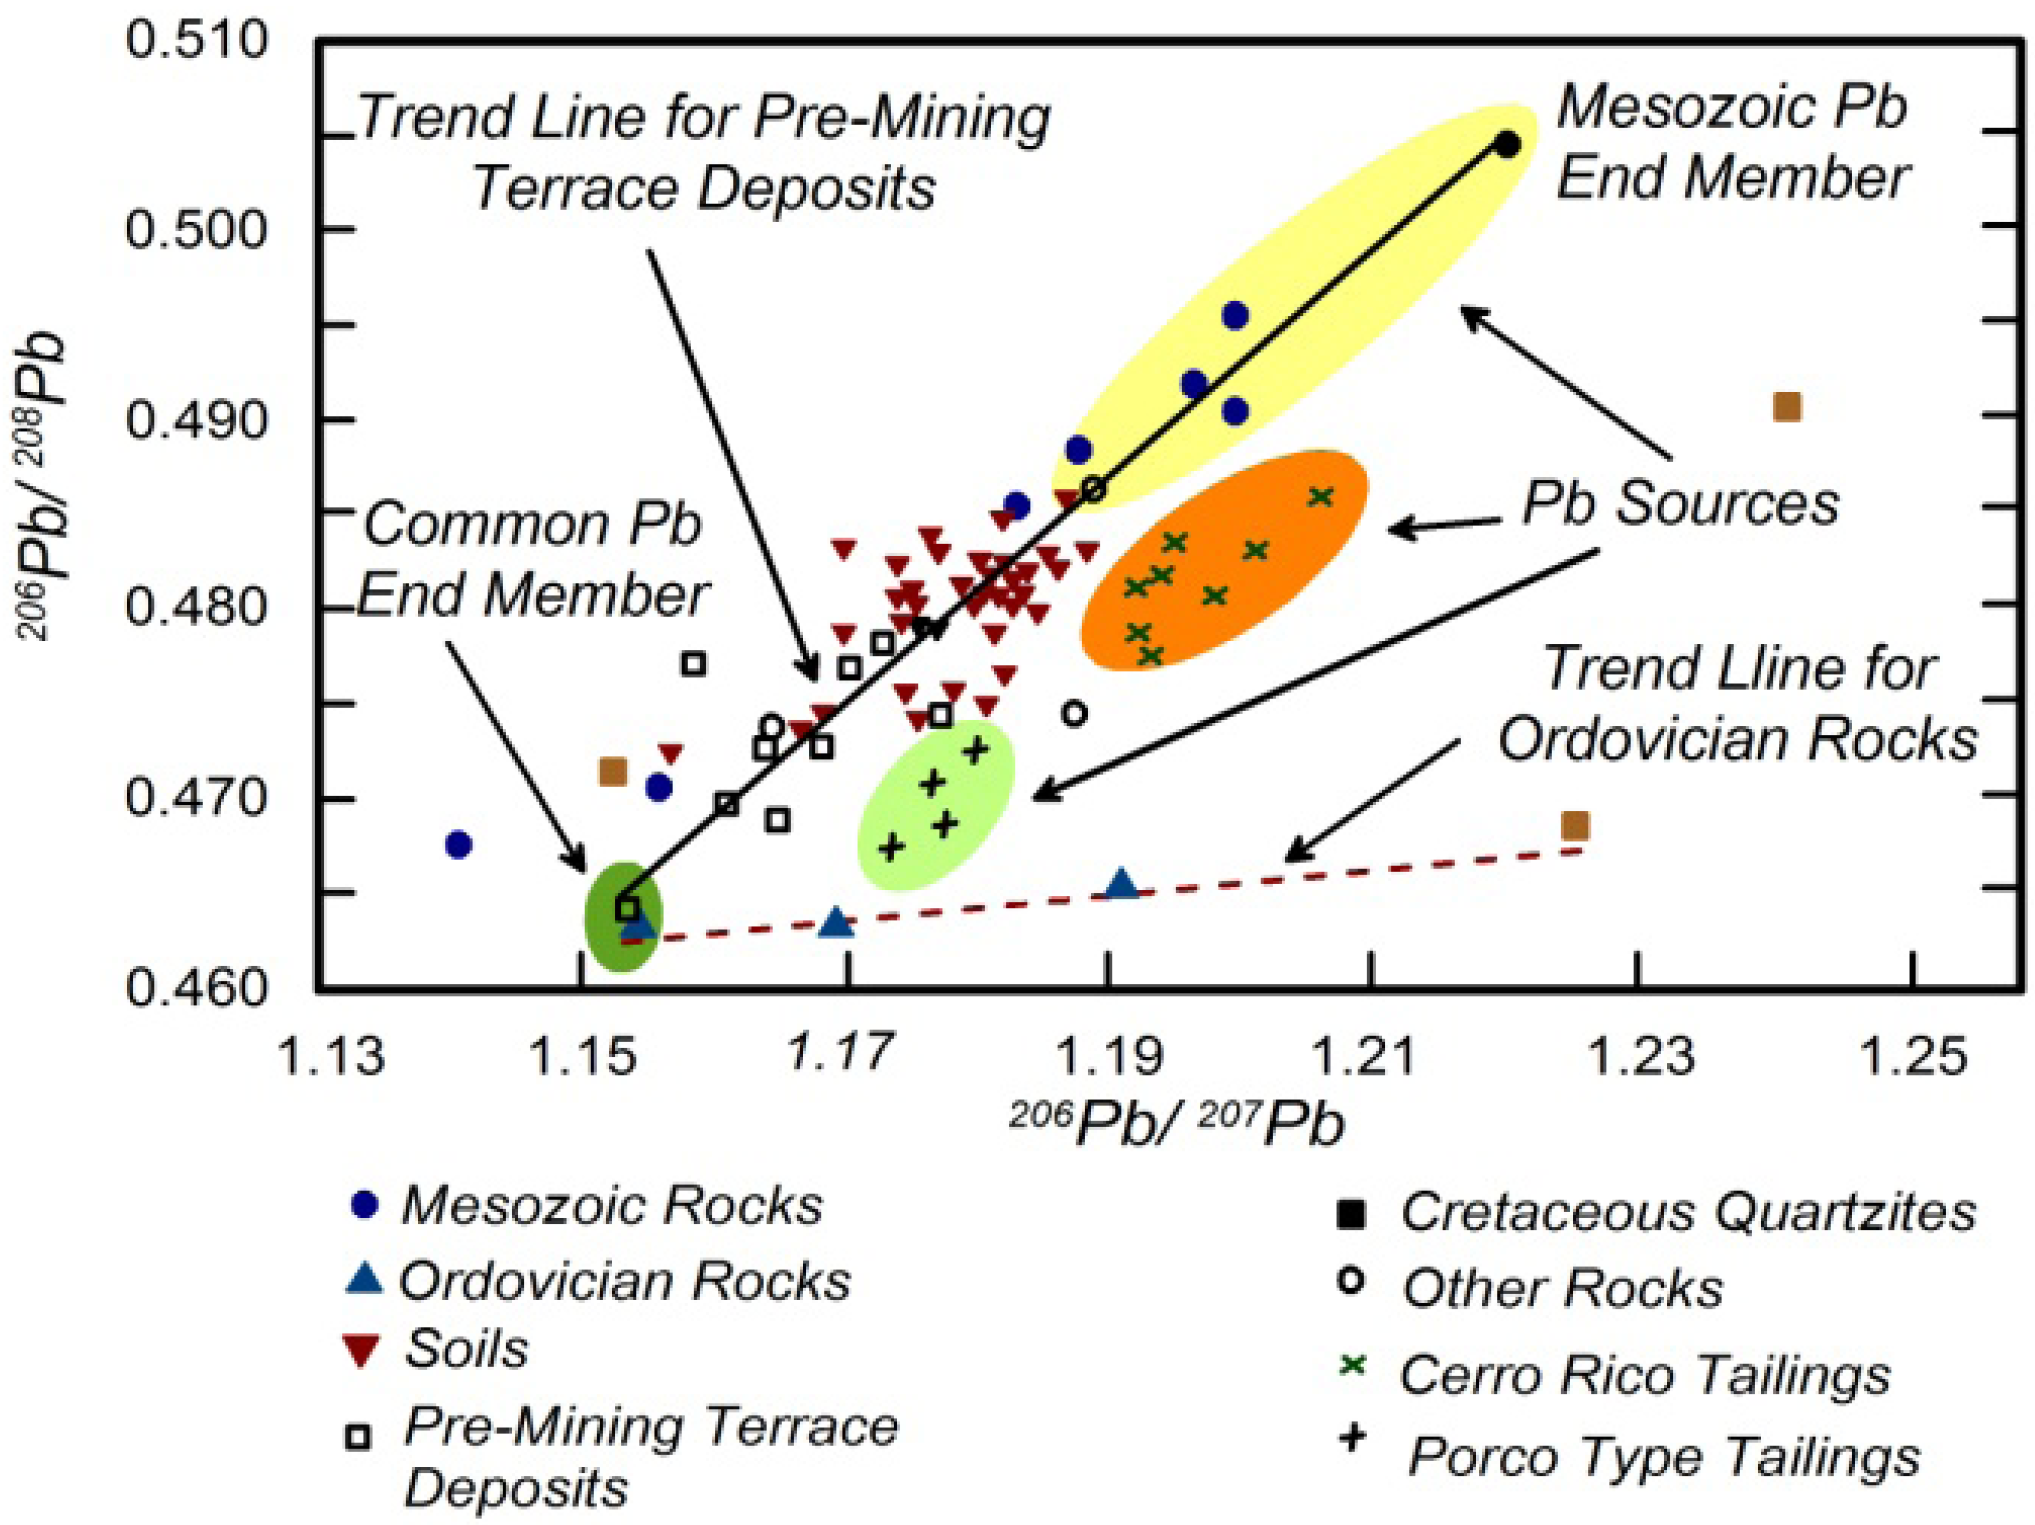
| Pb | 204Pb, 206Pb, 207Pb, 208Pb | 206Pb/207Pb, 206Pb/208Pb, 207Pb/208Pb | Negligible; Isotopic composition dependent on initial geological source | Extensively utilized to assess Pb sources | Bird [29]; Villarroel et al. [45]; Miller et al. [64,172]; Cheng [131] |
| Sb | 121Sb, 123Sb | 121Sb/123Sb | Redox reactions; biological activity; volatilization | Possible use to trace Sb sources; may be used to assess redox processes during biogeochemical cycling of elements | Rouxel et al. [194]; Wilson [195] |
| Zn | 64Zn, 66Zn, 67Zn, 68Zn, 70Zn | 66Zn/64Zn | Evaporation and condensation, including that associated with ore processing; biogenic uptake; diffusion, adsorption/complexation on organics and Fe oxides | Use appears promising for tracing Zn sources from industrial processes, particularly from ore processing; may be used to assess of Zn cycling in environment | Bird [29]; Sivry et al. [196]; Shiel et al. [187]; Bentahila et al. [197]; Petit et al. [190] |
4.3.1. Zn and Cd Isotopes


 and
and  are the δ and ε values of the element, respectively, for the isotopic ratio represented by i/j. In most instances, the lighter isotope is used as the denominator, such as δ114/110Cd (often shown as δ114Cd), in which case, δ > 0 is heavier than the standard, and δ < 0 lighter.
4.3.2. Cu and Cr Isotopes
4.3.3. Mercury Isotopes


4.3.4. Sb Isotopes
5. Summary and Concluding Remarks
Acknowledgments
Conflict of Interest
References
- Murray, R.C. Evidence from the Earth; Mountain Press: Sevierville, TN, USA, 2004. [Google Scholar]
- Murray, R.C. Forensic geology: Yesterday, today and tomorrow. In Forensic Geosciences: Principles, Techniques, and Applications; Special Publication 232; Pye, K., Croft, D.J., Eds.; The Geological Society of London: London, UK, 2004; pp. 7–9. [Google Scholar]
- Zarull, M.A.; Hartig, J.H.; Maynard, L.; Sediment Priority Action Committee; Great Lakes Water Quality Board. Ecological Benefits of Contaminated Sediment Remediation in the Great Lakes Basin; International Joint Commission: Detroit, MI, USA, 1999; Available online: http://www.ijc.org/files/publications/C80.pdf (accessed on 6 May 2013).
- Miller, J.R.; Orbock Miller, S.M. Contaminated River: A Geomorphological-Geochemical Approach to Site Assessment and Remediation; Springer: Berlin, Germany, 2007. [Google Scholar]
- Förstner, U.; Wittmann, G.T.W. Metal Pollution in the Aquatic Environment, 2nd ed; Springer Verlag: New York, NY, USA, 1981. [Google Scholar]
- Gibbs, R.J. Transport phases of transition metals in the Amazon and Yukon Rivers. Geol. Soc. Am. Bull. 1977, 88, 829–843. [Google Scholar] [CrossRef]
- Horowitz, A.J. A Primer on Sediment-Trace Element Chemistry, 2nd ed; Lewis Publishers: Chelsea, MI, USA, 1991. [Google Scholar]
- Macklin, M.G.; Brewer, P.A.; Hudson-Edwards, K.A.; Bird, G.; Coulthard, T.J.; Dennis, I.A.; Lechler, P.J.; Miller, J.R.; Turner, J.N. A Geomorphological-Geochemical Approach to River Basin Management in Mining-Affected Rivers. In The Human Role in Changing Fluvial Systems, Proceedings of the 37th International Binghamton Geomorphology Symposium, Columbia, SC, USA, 20–22 October 2006; James, L.A., Marcus, W.A., Eds.; Elsevier: Amsterdam, The Netherlands, 2006; pp. 423–447. [Google Scholar]
- Foster, I.D.L.; Lees, J.A. Tracers in geomorphology: Theory and applications in tracing fine particulate sediments. In Tracers in Geomorphology; Foster, I.D.L., Ed.; John Wiley and Sons: Hoboken, NJ, USA, 2000; pp. 3–20. [Google Scholar]
- Hoefs, J. Geochemical fingerprints: A critical appraisal. Eur. J. Miner. 2010, 22, 3–15. [Google Scholar] [CrossRef]
- Bigham, J.M.; Ciolkosz, E.J. Soil Color; SSSA Special Publication No. 31; Soil Science Society of America: Madison, WI, USA, 1993. [Google Scholar]
- Croft, D.J.; Pye, K. Colour Theory and the evaluation of an instrumental method of measurement using geological samples for forensic applications. In Forensic Geosciences: Principles, Techniques, and Applications; Special Publication 232; Pye, K., Croft, D.J., Eds.; The Geological Society of London: London, UK, 2004; pp. 49–62. [Google Scholar]
- Dudley, R.J.; Smalldon, K.W. The objective comparison of the particle size distribution in soils with particular reference to the sand fraction. Med. Sci. Law. 1978, 18, 278–281. [Google Scholar]
- Robertson, J.; Thomas, C.J.; Caddy, B.; Lewis, A.J.M. Particle size analysis of soils: A comparison of dry and wet sieving techniques. Forensic Sci. Int. 1984, 24, 209–217. [Google Scholar] [CrossRef]
- Knox, J.C. Historical valley floor sedimentation in the upper Mississippi valley. Ann. Assoc. Am. Geogr. 1987, 77, 224–244. [Google Scholar] [CrossRef]
- Sutherland, R.A. Selective erosion and sediment source identification, Baringo District, Kenya. Z. Geomorphol. 1991, 35, 293–304. [Google Scholar]
- Blott, S.J.; Croft, D.J.; Pye, K.; Saye, S.E.; Wilson, H.E. Particle size analysis by laser diffraction. In Forensic Geosciences: Principles, Techniques, and Applications; Special Publication 232; Pye, K., Croft, D.J., Eds.; The Geological Society of London: London, UK, 2004; pp. 63–73. [Google Scholar]
- Fan, P.F. Recent silts in the Santa Clara River drainage basin, Southern California: A mineralogical investigation of their origin and evolution. J. Sediment. Petrol. 1976, 46, 802–812. [Google Scholar]
- Graves, W.J. A mineralogical soil classification technique for the forensic scientist. J. Forensic Sci. 1979, 24, 323–337. [Google Scholar]
- Ugolini, F.C.; Corti, G.; Agenelli, A.; Piccardi, F. Mineralogical, physical and chemical properties of rock fragments in soil. Soil Sci. 1996, 161, 521–542. [Google Scholar]
- Oldfield, R.; Rummery, T.A.; Thomas, R.; Walling, D. Identification of suspended sediment sources by means of magnetic measurements: Some preliminary results. Water Resour. Res. 1979, 15, 211–218. [Google Scholar] [CrossRef]
- Walling, D.E.; Peart, M.R.; Oldfield, F.; Thompson, R. Suspended sediment sources identified by magnetic measurements. Nature 1979, 281, 110–113. [Google Scholar] [CrossRef]
- Fitzpatrick, F.; Thornton, J.I.M. Wide-band detector for microampere low-energy elecontron currents. J. Forensic Sci. 1974, 4, 460–475. [Google Scholar]
- Demmelmeyer, H.; Adam, J. Forensic investigation of soil and vegetable materials. Forensic Sci. Rev. 1995, 7, 120–136. [Google Scholar]
- Pirrie, D.; Butcher, A.R.; Power, M.R.; Gottlieb, P.; Miller, G.L. Rapid quantitative mineral and phase analysis using automated scanning electron microscopy (QuemSCAN): Potential applications in forensic geosciences. In Forensic Geosciences: Principles, Techniques, and Applications; Special Publication 232; Pye, K., Croft, D.J., Eds.; The Geological Society of London: London, UK, 2004; pp. 123–136. [Google Scholar]
- Pye, K. Forensic Examination of rocks, sediments, soils, and dust using scanning electron microscopy and X-ray chemical microanalysis. In Forensic Geosciences: Principles, Techniques, and Applications; Special Publication 232; Pye, K., Croft, D.J., Eds.; The Geological Society of London: London, UK, 2004; pp. 103–122. [Google Scholar]
- Lewin, J.; Wolfenden, P.J. The assessment of sediment source: A field experiment. Earth Surf. Proc. Land. 1978, 3, 171–178. [Google Scholar] [CrossRef]
- Knox, J.C. Rates of floodplain overbank vertical accretion. In Floodplain Evolution; Brakenridge, G.R., Hagedorn, J., Eds.; Elsevier: Amsterdam, The Netherlands, 1992. [Google Scholar]
- Bird, G. Provenancing anthropogenic Pb within the fluvial environment: Developments and challenges in the use of Pb isotopes. Environ. Int. 2011, 37, 802–819. [Google Scholar]
- Macklin, M.G. Floodplain sedimentation in the Upper Axe Valley, Mendip, England. Trans. Inst. Br. Geogr. 1985, 10, 235–244. [Google Scholar] [CrossRef]
- Passmore, D.G.; Macklin, M.G. Provenance of fine-grained alluvium and late holocene land-use change in the Tyne Basin, Northern England. Geomorphology 1994, 9, 127–142. [Google Scholar] [CrossRef]
- Church, S.E.; Unruh, D.M.; Fey, D.L.; Sole, T.C. Trace Element and Lead Isotopes in Streambed Sediment in Streams Affected by Historical Mining; U.S. Geological Survey Professional Paper 1652; U.S. Government Printing Office: Washington, DC, USA, 2004; Chapter D8. [Google Scholar]
- Ulrich, A.; Moor, C.; Vonmont, H.; Jordi, H.R.; Lory, M. ICP-MS trace element analysis as a forensic tool. Anal. Bioanal. Chem. 2004, 378, 1059–1068. [Google Scholar] [CrossRef]
- Aggarwal, J.; Habicht-Mauche, J.; Juarez, C. Application of heavy stable isotopes in forensic geochemistry: A review. Appl. Geochem. 2008, 23, 2658–2666. [Google Scholar] [CrossRef]
- Zhang, H.; Yao, Q.; Zhu, Y.; Fan, S.; He, P. Review of source identification methodologies for heavy metals in solid waste. Chin. Sci. Bull. 2013, 58, 162–168. [Google Scholar] [CrossRef]
- Collins, A.L.; Walling, D.E.; Leeks, G.J.L. Source type ascription for fluvial suspended sediment based on a quantitative composite fingerprinting technique. Catena 1997, 29, 1–27. [Google Scholar] [CrossRef]
- Collins, A.L.; Walling, D.E.; Leeks, G.J.L. Use of the geochemical record preserved in floodplain deposits to reconstruct recent changes in River Basin Sediment Sources. Geomorphology 1997, 19, 151–167. [Google Scholar] [CrossRef]
- Collins, A.L.; Walling, D.E.; Leeks, G.J.L. Use of composite fingerprints to determine the provenance of the contemporary suspended sediment load transported by rivers. Earth Surf. Proc. Land. 1998, 23, 31–52. [Google Scholar] [CrossRef]
- Collins, A.L.; Walling, D.E. Selecting fingerprinting properties for discriminating potential suspended sediment sources in river basins. J. Hydrol. 2002, 261, 218–244. [Google Scholar] [CrossRef]
- Miller, J.; Lord, M.; Yurkovich, S.; Mackin, G.; Kolenbrander, L. Historical trends in sedimentation rates and sediment provenance, Fairfield Lake, western North Carolina. Water Resour. Bull. 2005, 41, 1053–1075. [Google Scholar] [CrossRef]
- Miller, J.R.; Mackin, G.; Lechler, P.; Lord, M.; Lorentz, S. Influence of basin connectivity on sediment source, transport, and storage within the Mkabela Basin, South Africa. Hydrol. Earth Syst. Sci. 2012, 17, 1–22. [Google Scholar]
- Cheng, H.; Hu, Y. Lead (Pb) isotopic fingerprinting and its applications in lead pollution studies in China: A review. Environ Pollut. 2010, 158, 1134–1146. [Google Scholar] [CrossRef]
- Farmer, J.G.; Eades, L.J.; MacKenzie, A.B.; Kirika, A.; Bailey-Watts, T.E. Stable lead isotope record of lead pollution in Loch Lomond sediments since 1630 A.D. Environ. Sci. Technol. 1996, 3, 3080–3083. [Google Scholar]
- Duzgoren-Aydin, N.S.; Weiss, A.L. Use and abuse of Pb-isotope fingerprinting technique and GIS mapping data to assess lead in environmental studies. Environ. Geochem. Health 2008, 30, 577–588. [Google Scholar] [CrossRef]
- Villarroel, L.F.; Miller, J.R.; Lechler, P.J.; Germanoski, D. Lead, Zinc, and Antimony contamination of the Rio Chilco-Rio Tupiza drainage system, southern Bolivia. Environ. Geol. 2006, 51, 283–299. [Google Scholar] [CrossRef]
- Wolfenden, P.J.; Lewin, J. Distribution of metal pollutants in floodplain sediments. Catena 1978, 4, 309–317. [Google Scholar] [CrossRef]
- Lewin, J.; Macklin, M.G. Metal mining and floodplain sedimentation in Britian. In International Geomorphology; Gardiner, V., Ed.; John Wiley and Sons: Hoboken, NJ, USA, 1987; pp. 1009–1027. [Google Scholar]
- Marcus, W.A. Copper dispersion in ephemeral stream sediments. Earth Surf. Proc. Land. 1987, 12, 217–228. [Google Scholar] [CrossRef]
- Taylor, M.P.; Kesterton, R.G.H. Heavy metal contamination of an arid river environment: Gruben River, Namibia. Geomorphology 2002, 42, 311–327. [Google Scholar] [CrossRef]
- Miller, J.R.; Lechler, P.J.; Desilets, M. The role of geomorphic processing in the transport and fate of mercury in the Carson River basin, west-central Nevada. Environ. Geol. 1998, 33, 249–262. [Google Scholar] [CrossRef]
- Moore, J.N.; Brook, E.J.; Johns, C. Grain size partitioning of metals in contaminated, coarse-grained river floodplain sediments: Clark Fork River, Montana, USA. Environ. Geol. Water S. 1989, 12, 107–115. [Google Scholar]
- Loring, D.H. Lithium—A new approach for the granulometric normalization of trace metal data. Mar. Chem. 1990, 29, 155–168. [Google Scholar] [CrossRef]
- Loring, D.H.; Rantala, R.T.T. Manual for the geochemical analysis of sediments and suspended particular matter. Earth Sci. Rev. 1992, 32, 235–283. [Google Scholar] [CrossRef]
- Devesa-Rey, R.; Díaz-Fierros, F.; Barral, M.T. Normalization strategies for river bed sediments: A graphical approach. Microchem. J. 2009, 91, 253–265. [Google Scholar] [CrossRef]
- Macklin, M.G.; Lewin, J. Sediment transfer and transformation of an alluvial valley floor: The river south Tyne, Northumbria, U.K. Earth. Surf. Proc. Land. 1989, 14, 233–246. [Google Scholar] [CrossRef]
- Macklin, M.G.; Dowsett, R.B. The chemical and physical speciation of trace metals in fine grained overbank flood sediments in the Tyne Basin, north-east England. Catena 1989, 16, 135–151. [Google Scholar] [CrossRef]
- Mackin, M.G. Fluxes and storage of sediment-associated heavy metals in floodplain systems: assessment and river basin management issues at a time of rapid environmental change. In Floodplain Processes; Anderson, M.G., Walling, D.E., Bates, P.D., Eds.; John Wiley and Sons: Hoboken, NJ, USA, 1996; pp. 441–460. [Google Scholar]
- Miller, J.R.; Germanoski, D.; Villarroel, L.F.; Lechler, P. Spatial and temporal variations in the transport and storage of trace metal contaminants in the Upper Río Pilcomayo, Southern Bolivia. Int. J. Environ. Heal. R. 2009, 3, 334–361. [Google Scholar] [CrossRef]
- Nicholas, A.P.; Ashworth, P.J.; Kirkby, M.J.; Macklin, M.G.; Murray, T. Sediment slugs: Large-scale fluctuations in fluvial sediment transport rates and storage volumes. Prog. Phys. Geog. 1995, 19, 500–519. [Google Scholar] [CrossRef]
- Hoey, T. Temporal variation in bedload transport rates and sediment storage in gravel river beds. Prog. Phys. Geog. 1992, 16, 319–338. [Google Scholar] [CrossRef]
- Bartley, R.; Rutherfurd, I. Re-evaluation of the wave model as a tool for quantifying the geomorphic recovery potential of streams disturbed by sediment slugs. Geomorphology 2005, 64, 221–242. [Google Scholar] [CrossRef]
- Gilbert, G.K. Hydraulic-Mining Debris in the Sierra Nevada; U.S. Geological Survey Professional Paper 105; U.S. Government Printing Office: Washington, DC, USA, 1917.
- Helgen, S.O.; Moore, J.N. Natural background determination and impact quantification in trace metal-contaminated river sediments. Environ. Sci. Technol. 1996, 30, 129–135. [Google Scholar] [CrossRef]
- Miller, J.R.; Lechler, P.J.; Hudson-Edwards, K.A.; Macklin, M.G. Lead isotopic fingerprinting of heavy metal contamination, Rio Pilcomayo, Bolivia. J. Geochem. Explor. Environ. Anal. 2002, 2, 225–233. [Google Scholar]
- Yu, L.; Oldfield, F. A multivariate mixing model for identifying sediment source from magnetic measurements. Quat. Res. 1989, 32, 168–181. [Google Scholar] [CrossRef]
- Rowan, J.S.; Goodwill, P.; Franks, S.W. Uncertainty estimation in fingerprinting suspended sediment sources. In Tracers in Geomorphology; Foster, I.D.L., Ed.; John Wiley and Sons: Hoboken, NJ, USA, 2000; pp. 279–289. [Google Scholar]
- Rowan, J.S.; Black, S.; Franks, S.W. Sediment fingerprinting as an environmental forensics tool explaining cyanobacteria blooms in lakes. Appl. Geogr. 2012, 32, 832–843. [Google Scholar] [CrossRef]
- Collins, A.L.; Walling, D.E.; Webb, L.; King, P. Apportioning catchment scale sediment sources using a modified composite fingerprinting technique incorporating property weights and prior information. Geoderma 2010, 155, 249–261. [Google Scholar] [CrossRef]
- Small, I.F.; Rowan, J.S.; Franks, S.W. Quantitative sediment fingerprinting using a Bayesian uncertainty estimation framework. In The Structure, Function and Management Implications of Fluvial Sedimentary Systems; Dyer, F.J., Thoms, M.C., Olley, J.M., Eds.; IAHS Publications: Wallingford, UK, 2002; pp. 443–450. [Google Scholar]
- Small, I.F.; Rowan, J.S.; Franks, S.W.; Wyatt, A.; Duck, R.W. Bayesian sediment fingerprinting provides a robust tool for environmental forensic geosciences applications. In Forensic Geosciences: Principles, Techniques, and Applications; Special Publication 232; Pye, K., Croft, D.J., Eds.; The Geological Society of London: London, UK, 2004; pp. 207–213. [Google Scholar]
- Miller, J.R.; Mackin, G. Concentrations, sources, and potential ecological impacts of selected trace metals on aquatic biota within the Little Tennessee River Basin, North Carolina. Water Air Soil Poll. 2013, in press. [Google Scholar]
- Macklin, M.G.; Klimek, K. Dispersal, storage and transformation of metal-contaminated alluvium in the upper Vistula basin, southwest Poland. Appl. Geochem. 1992, 12, 7–30. [Google Scholar]
- Hudson-Edwards, K.A.; Macklin, M.; Taylor, M. Historic metal mining input to Tees River sediment. Sci. Total Environ. 1997, 194–195, 437–445. [Google Scholar] [CrossRef]
- Nguygen, H.L.; Braun, M.; Szaloki, I.; Baeyens, W.; van Grieken, R.; Lerrmakers, M. Tracing the metal pollution history of the Tisza River through the analysis of a sediment depth profile. Water Air Soil Poll. 2009, 200, 119–132. [Google Scholar] [CrossRef]
- Bábek, O.; Famĕra, M.; Hilscherová, K.; Kalvoda, J.; Dobrovolný, P.; Sedláček, J.; Machát, J.; Holoubek, I. Geochemical traces of flood layers in the fluvial sedimentary archive: Implications for contamination history analyses. Catena 2011, 87, 281–290. [Google Scholar]
- Matys Grygar, T.M.; Nováková, T.; Bábek, O.; Elznicová, J.; Vadinová, N. Robust assessment of moderate heavy metal contamination levels in floodplain sediments: A cast study on the Jizera River, Czech Republic. Sci. Total Environ. 2013, 452–453, 233–245. [Google Scholar]
- Du Laing, G.; Rinklebe, J.; Vandencasteele, B.; Meers, E.; Tack, F.M.G. Trace metal behavior in estuarine and riverine floodplain sediments: A review. Sci. Total Environ. 2009, 407, 3972–3985. [Google Scholar] [CrossRef]
- Matys Grygar, T.; Novakoa, T.; Mihaljevic, M.; Strnad, L.; Koptikova, L. Surprisingly small increase in the sedimentation rate in the foodplain of Marova River in the Straznice area, Czech Republic, in the last 100 years. Catena 2011, 86, 461–471. [Google Scholar]
- Matys Grygar, T.; Sedlacek, J.; Bábek, O.; Novakoa, T.; Strnad, L.; Mihaljevic, M. Regional contamination of Moravia (south-eastern Czech Republic): Temporal shift of Pb and Zn loading in fluvial sediments. Water Air Soil Pollut. 2012, 223, 739–753. [Google Scholar] [CrossRef]
- Ferrand, E.; Eyrolle, F.; Radakovitch, O.; Provansal, M.; Dufour, S.; Vella, C.; Raccasi, G.; Gurriaran, R. Historical levels of heavy metals and artificial radionuclides reconstructed from overbank sediment records in lower Rhône River (South-East France). Geochim. Cosmochim. Acta 2012, 82, 163–182. [Google Scholar] [CrossRef]
- Walling, D.E.; Owens, P.N.; Carter, J.; Leeks, G.J.L.; Lewis, S.; Meharg, A.A.; Wright, J. Storage of sediment-associated nutrients and contaminants in river channel and floodplain systems. Appl. Geochem. 2003, 18, 195–220. [Google Scholar] [CrossRef]
- Tobin, G.A.; Brinkmann, R.; Montz, B.E. Flooding and the distribution of selected metals in floodplain sediments in St. Maries, Idaho. Environ. Geochem. Health 2000, 22, 219–232. [Google Scholar] [CrossRef]
- Pease, P.; Leece, S.; Gares, P.; Rigsby, C. Heavy metal concentrations in sediment deposits on the Tary River floodplain following Hurricane Floyd. Environ. Geol. 2007, 51, 1003–1111. [Google Scholar]
- Stokes, S.; Walling, D.E. Radiogenic and isotopic methods for the direct dating of fluvial sediments. In Tools in Fluvial Geomorphology; Kondolf, M.G., Piegay, H., Eds.; John Wiley and Sons: Chichester, UK, 2005; pp. 233–267. [Google Scholar]
- Hudson-Edwards, K.A.; Macklin, M.G.; Curtis, C.D.; Vaughan, D.J. Chemical remobilization of contaminated metals within floodplain sediments in an incising river system: Implications for dating and chemostratigraphy. Earth Surf. Proc. Land. 1998, 23, 671–684. [Google Scholar] [CrossRef]
- Davies, B.E.; Lewin, J. Chronosequences in alluvial soils with special reference to historical pollution in Cardiganshire, Wales. Environ. Pollut. 1974, 6, 49–57. [Google Scholar] [CrossRef]
- Rang, M.C.; Schouten, C.J. Evidence for historical heavy metal pollution in floodplain soils: The Meuse. In Historical Change of Large Alluvial Rivers: Western Europe; Petts, G.E., Ed.; John Wiley and Sons: Chichester, UK, 1989; pp. 127–142. [Google Scholar]
- Sear, D.; Carver, S. The release and dispersal of Pb and Zn contaminated sediments within an Arctic braided river system. Appl. Geochem. 1996, 11, 187–195. [Google Scholar] [CrossRef]
- Klimek, K.; Zawilinska, L. Trace elements in alluvia of the Upper Vistula as indicators of palaeohyology. Earth Surf. Proc. Land. 1985, 10, 273–280. [Google Scholar] [CrossRef]
- Taylor, M.P.; Lewin, J. River behaviour and Holocene alleviation: The river Severn at Welshpool, mid-Wales, U.K. Earth Surf. Proc. Land. 1996, 21, 77–91. [Google Scholar] [CrossRef]
- Harrison, J.; Heijnis, H.; Caprarelli, G. Historical pollution variability form abandoned mine sites, Greater Blue Mountains World Heritage Area, New South Wales, Australia. Environ. Geol. 2003, 43, 680–687. [Google Scholar]
- Bradley, S.B.; Cox, J.J. Heavy metals in the Hamps and Manifold valleys, North Straffordshire, U.K.: Partitioning of metals in floodplain soils. Sci. Total Environ. 1987, 65, 135–153. [Google Scholar] [CrossRef]
- Knox, J.C. Responses of floods to Holocene climatic change in the Upper Mississippi Valley. Quatern. Res. 1985, 23, 287–300. [Google Scholar] [CrossRef]
- Berner, Z.A.; Bleeck-Schumidt, B.; Stüben, D.; Neumann, T.; Fuchs, M.; Lehmann, M. Floodplain deposits: A geochemical archive of flood history—A case study on the River Rhine, Germany. Appl. Geochem. 2012, 27, 543–561. [Google Scholar] [CrossRef]
- Navrátil, T.; Rohovec, J.; Žák, K. Floodplain sediments of the 2002 catastrophic flood at eh Vltava (Moldau) River and its tributaries: Mineralogy, chemical composition, and post-sedimentary evolution. Environ. Geol. 2008, 56, 399–412. [Google Scholar] [CrossRef]
- Brovo, A.G.; Loizeau, J.L.; Ancey, L.; Ungureanu, V.G.; Dominik, J. Historical record of mecury contamination in sediments from the Babeni Reservoir in the Olt River, Romania. Environ. Sci. Pollut. R. 2009, 16, 66–75. [Google Scholar] [CrossRef]
- Lewin, J.; Macklin, M. Perservation potential for Late Quaternary river alluvium. J. Quat. Sci. 2003, 18, 107–1120. [Google Scholar]
- Müller, J.; Ruppert, H.; Muramatsu, Y.; Schneider, J. Reservoir sediments—A witness of mining and industrial development (Malter reservoir, eastern Erzgebirge, Germany. Environ. Geol. 2000, 39, 1341–1351. [Google Scholar] [CrossRef]
- Arnason, J.G.; Fletcher, B.A. A 40+ year record of Cd, Hg, Pb, and U deposition in sediments of Patroon Reservoir, Albany County, NY, USA. Environ. Pollut. 2003, 123, 383–391. [Google Scholar] [CrossRef]
- Callender, E. Geochemical effects of rapid sedimentation in aquatic systems: Minimal diagenesis and the preservation of historical metal signatures. J. Paleolimnol. 2000, 23, 243–260. [Google Scholar] [CrossRef]
- Audry, S.; Schäfer, J.; Blanc, G.; Jouanneau, J.M. Fify-year sedimentary record of heavy metal pollution (CD, Zn, Cu, Pb) in the Lot River reservoirs (France). Environ. Pollut. 2004, 132, 413–426. [Google Scholar]
- Von Gunten, H.R.; Sturm, M.; Moser, R.N. 200-year record of metals in lake sediments and natural background concentrations. Environ. Sci. Technol. 1997, 31, 2193–2197. [Google Scholar] [CrossRef]
- Kähkönen, M.A.; Suominen, K.P.; Manninen, P.K.; Salkinoja-Salonen, M.S. 100 years of sediment accumulation history of organic halogens and heavy metals in recipient and nonrecipient lakes of pulping industry in Finland. Environ. Sci. Technol. 1998, 32, 1741–1746. [Google Scholar] [CrossRef]
- Lima, A.L.; Bergquist, B.A.; Boyle, E.A.; Reuer, M.K.; Dudas, F.O.; Reddy, C.M.; Eglinton, T.I. High-resolution historical records from Pettaquamscutt River basin sediments. Geochim. Cosmochim. Acta 2005, 69, 1813–1824. [Google Scholar] [CrossRef]
- Mil-Homens, M.; Blum, J.; Canário, J.; Caetano, M.; Costa, A.M.; Lebreiro, S.M.; Trancoso, M.; Richter, T.; de Stigter, H.; Johnson, M.; et al. Tracing anthropogenic Hg and Pb input using stable Hg and Pb isotope ratios in sediments of the central Portuguese Margin. Chem. Geol. 2013, 336, 62–71. [Google Scholar] [CrossRef]
- MacDonald, D.D.; Ingersoll, C.G.; Berger, T.A. Development and evaluation of consensus-based sediment quality guidelines for freshwater ecosystems. Arch. Environ. Contaminat. Toxicol. 2000, 39, 20–31. [Google Scholar] [CrossRef]
- Leigh, D.S. Morphology and channel evolution of small streams in the Southern Blue Ridge Mountains of western North Carolina. Southeastern Geogr. 2010, 50, 397–421. [Google Scholar] [CrossRef]
- Banner, J.L. Radiogenic isotopes: Systematics and applications to earth surface processes and chemical stratigraphy. Earth Sci. Rev. 2004, 65, 141–194. [Google Scholar]
- Calanchi, N.; Dinelli, E.; Lucchini, F.; Mordenti, A. Chemostratigraphy of late Quaternary sediments from Lake Albano and Central Adriatic Sea corres (Paliclas Project). Memoir 1st Ital. Idrobiol. 1996, 55, 247–263. [Google Scholar]
- Boyle, J.F. Iorganic geochemical methods in palaeolimnology. In Tracking Environmental Change Using Lake Sediments: Physical and Geochemical Methods; Last, W.M., Smol, J.P., Eds.; Khrwer: Dordrecht, The Netherland, 2001; pp. 85–141. [Google Scholar]
- Lucchini, F.; Dinelli, E.; Calachi, N. Chemostratigraphy of Lago Albano sediments (central Italy): Geochemical evidence of palaeoenvironmental changes in late Quaternary. J. Paleoliminol. 2003, 29, 109–122. [Google Scholar] [CrossRef]
- Mabrouk, A.; Jarvis, I.; Belayouni, H.; Moody, R.T.J.; de Cabrera, S. An integrated chemostratigraphic study of the Campanian-Early Masstrichtian deposits of offshore Miskar Field in southeastern Tunisia: SIS, δ13C and δ18 O isotopes, and elemental geochemistry. Stratigraphy 2005, 2, 193–216. [Google Scholar]
- Popp, C.L.; Hawley, J.W.; Love, D.W.; Dehn, M. Use of radiometric (Cs-137, Pb-210), geomorphic and stratigraphic techniques to date recent oxbow sediments in the Rio Puerco drainage, Grants Uranium region, New Mexico. Environ. Geol. Water Sci. 1988, 11, 253–269. [Google Scholar]
- Chillrud, S.N.; Semming, S.; Shuster, E.L.; Simpson, H.J.; Bopp, R.F.; Ross, J.M.; Pederson, D.C.; Chaky, D.A.; Tolley, L.-R.; Estabrooks, F. Stable lead isotopes, contaminant metals and radionuclides in upper Hudson River sediment cores: Implications for improved time stratigraphy and transport processes. Chem. Geol. 2003, 199, 53–70. [Google Scholar] [CrossRef]
- Grygar, T.; Svĕtlík, I.; Lisá, L.; Koptíková, L.; Bajer, A.; Wray, D.; Ettler, V.; Mihaljevič, M.; Nováková, T.; Koubová, M.; et al. Geochemical tools for the stratigraphic correlation of floodplain deposits of the Morava River in Strážnické Pomoraví, Czech Republic from the last millennium. Catena 2010, 80, 106–121. [Google Scholar] [CrossRef]
- Miller, J.R.; Hudson-Edwards, K.A.; Lechler, P.J.; Preston, D.; Macklin, M.G. Heavy metal contamination of water, soil, and produce within riverine communities of the Rio Pilcomayo basin, Bolivia. Sci. Total Environ. 2004, 320, 189–209. [Google Scholar]
- Chow, T.J.; Johnstone, M.S. Lead isotopes in gasolina and aerosols of Los Angeles Basin, California. Science 1985, 147, 147–148. [Google Scholar]
- Ault, W.A.; Senechal, R.G.; Erleback, W.E. Isotopic composition as a natural tracer of lead in the environment. Environ. Sci. Technol. 1970, 4, 305–313. [Google Scholar]
- Chiaradia, M.; Cupelin, F. Behaviour of airborne lead and temporal variations of its source effects in Geneva (Switzerland): Comparison of anthropogenic versus natural processes. Atmos. Environ. 2000, 34, 959–971. [Google Scholar] [CrossRef]
- Gulson, B.L.; Howarth, D.; Mizon, K.J.; Waw, A.J.; Korsch, M.J.; Davis, J.J. The source of lead in humans from Broken Hill mining community. Environ. Geochem. Health 1994, 16, 19–25. [Google Scholar] [CrossRef]
- Gulson, B.L.; Mizon, K.J.; Korsch, M.J.; Howarth, D. Importance of monitoring family members in establishing sources and pathways of lead in blood. Sci. Total Environ. 1996, 188, 173–182. [Google Scholar] [CrossRef]
- Gulson, B.L.; Mizon, K.J.; Davis, J.D.; Palmer, J.M.; Vimpani, G. Identification of sources of led in children in a primary zinc-led smelter environment. Environ. Health Persp. 2004, 112, 52–60. [Google Scholar]
- Rosman, K.J.R.; Chisolm, W.; Boutron, C.F.; Candelone, J.P.; Gorlach, U. Isotopic evidence for the source of lead in Greenland snows since the late 1960s. Nature 1993, 362, 333–334. [Google Scholar] [CrossRef]
- Rosman, K.J.R.; Chisolm, W.; Boutron, C.F.; Candelone, J.P.; Patterson, C.C. Anthropogenic lead isotopes in Antarctica. Geophy. Res. Lett. 1994, 21, 2669–2672. [Google Scholar] [CrossRef]
- Rosmann, K.J.R.; Chisolm, W.; Hong, S.; Candelone, J.P.; Boutron, C.F. Lead from Carthaginian and Roman Spanish mines isotopically identified in Greenland ice dated from 600 B.C. to 300 A.D. Environ. Sci. Technol. 1997, 31, 3413–3416. [Google Scholar] [CrossRef]
- Shotyk, W.; Zheng, J.C.; Krachler, M.; Zdanowicz, C.; Koerner, R.; Fisher, D. Predominance of industrial Pb in recent snow (1994–2004) and ice (1842–1996) from Devon Island, Arctic Canada. Geophys. Res. Lett. 2005, 32, L21814. [Google Scholar] [CrossRef]
- Veysseyre, A.M.; Bollhofer, A.F.; Rosman, K.J.R.; Ferrari, C.P.; Boutron, C.F. Tracing the origin of pollution in French Alpine snow and aerosols using lead isotope ratios. Environ. Sci. Technol. 2001, 35, 4463–4469. [Google Scholar] [CrossRef]
- Gulson, B.L.; Tiller, K.G.; Mizon, K.J.; Merry, R.H. Use of lead isotope ratios in soils to identify the source of lead contamination near Adelaide, South Australia. Environ. Sci. Tech. 1981, 15, 691–696. [Google Scholar] [CrossRef]
- Steinmann, M.; Stille, P. Rare earth element behavior and Pb, Sr, Nd isotope systematics in a heavy metal contaminated soil. Appl. Geochem. 1997, 12, 607–632. [Google Scholar] [CrossRef]
- Hansmann, W.; Köppel, V. Lead-isotopes as tracers of pollutants in soils. Chem. Geol. 2000, 171, 123–144. [Google Scholar] [CrossRef]
- Mihaljevic, M.; Ettler, V.; Sebek, O.; Strnad, L.; Chrastny, V. Lead isotopic signatures of wine and vineyard soils—Tracers of lead origin. J. Geochem. Explor. 2006, 88, 130–133. [Google Scholar] [CrossRef]
- Reimann, C.; Flem, B.; Fabian, K.; Birke, M.; Landenberger, A.; Négrel, P.; Demetriades, A.; Hoogewerff, J.; The GEMAS Project Team. Lead and lead isotopes in agricultural soils of Europe—The continental perspective. Appl. Geochem. 2012, 27, 532–542. [Google Scholar] [CrossRef]
- Shirahata, H.; Elias, R.W.; Patterson, C. Chronological variations in concentrations and isotopic compositions and anthropogenic atmospheric Pb in sediments of a remote subalpine pond. Geochim. Cosmochim. Ac. 1980, 44, 149–167. [Google Scholar] [CrossRef]
- Petit, D.; Mennesier, J.P.; Lamberts, L. Stable Pb isotopes in pond sediments as tracer of past and present atmospheric Pb pollution in Belgium. Atmos. Environ. 1984, 18, 1189–1193. [Google Scholar] [CrossRef]
- Chiaradia, M.; Chenhall, B.E.; Depers, A.M.; Gulson, B.I.; Jones, B.G. Idenitification of historical lead sources in roof dusts and recent lake sediments from an industrialized area: Indications from lead isotopes. Sci. Total Environ. 1997, 2005, 107–128. [Google Scholar]
- Foster, I.D.L.; Less, J.A.; Jones, A.R.; Chapman, A.S.; Turner, S.E.; Hodgkinson, R. The possible role of agricultural land drains in sediment delivery to a small reservoir, Worcestershire UK: A multiparameter tracing study. In Structure, Function and Management Implications of Fluvial Sedimentary Systems; Dyer, F.J., Thoms, M.C., Olley, J.M., Eds.; IAHS Publications: Wallingford, UK, 2002; pp. 443–442. [Google Scholar]
- Shotyk, W.; Weiss, D.; Appleby, P.G.; Cheburkin, A.K.; Frei, R.; Gloor, M.; Kramers, J.D.; Reese, S.; Knaap, W.O.V.D. History of atmospheric lead deposition since 12,370 14C yr BP from a peat bog, Jura Mountains, Switzerland. Science 1998, 281, 1635–1640. [Google Scholar] [CrossRef]
- Weiss, D.; Shotyk, W.; Appleby, P.G.; Kramers, J.D.; Cheburkin, A.K. Atmospheric lead deposition since the industrial revolution recorded by five Swiss peat profiles: Enrichment factors, fluxes, isotopic composition, and sources. Environ. Sci. Technol. 1999, 33, 1340–1352. [Google Scholar] [CrossRef]
- Marcantonio, F.; Flowers, G.C.; Templin, N. Lead contamination in a wetland watershed: Isotopes as fingerprints of pollution. Environ. Geol. 2000, 39, 1070–1076. [Google Scholar] [CrossRef]
- Cloy, J.M.; Farmer, J.G.; Graham, M.C.; MacKenzie, A.B.; Cook, G.T. Historical records of atmospheric Pb deposition in four Scottish ombrotropic peat bogs: An isotopic comparison with other records from western Europe and Greenland. Glob. Biogeochem. Cycles 2008, 22. [Google Scholar] [CrossRef]
- Bellis, D.J.; Satake, K.; McLeod, C.W. A comparison of lead isotope ratios in the bark pockets and annual rings of two beech trees collected in Derbyshire and South Yorkshire, UK. Sci. Total Environ. 2004, 32, 105–113. [Google Scholar] [CrossRef]
- Bindler, R.; Renberg, I.; Klaminder, J.; Emteryd, O. Tree rings as Pb pollution archives? A comparison of 206Pb/207Pb isotope ratios in pine and other environmental media. Sci. Total Environ. 2004, 319, 173–183. [Google Scholar] [CrossRef]
- Bi, X.; Feng, X.; Yang, Y.; Li, X.; Shin, G.P.; Li, F.; Qiu, G.; Li, G.; Liu, T.; Fu, Z. Allocation and source attribution of lead and dadmium in maize (Zea mays L.) impacted by smelting emissions. Environ. Pollut. 2009, 157, 834–939. [Google Scholar]
- Manton, W.I. Sources of lead in blood—Identification by stable isotopes. Arch. Environ. Health 1977, 32, 149–159. [Google Scholar] [CrossRef]
- Keinonen, M. The isotopic composition of lead in man and the environment in Finland 1966–1987—Isotope ratios of lead as indicators of pollutant source. Sci. Total Environ. 1992, 113, 251–268. [Google Scholar] [CrossRef]
- Labonne, M.; Othamn, D.B.; Lee, J.M. Pb isotopes in mussels as tracers of metal sources and water movements in a lagoon (Thau Basin, S. France). Chem. Geol. 2001, 181, 181–191. [Google Scholar] [CrossRef]
- Miller, J.R.; Anderson, J.B.; Lechler, P.J.; Kondrad, S.L.; Galbreath, P.F.; Salter, E.B. Influence of temporal variations in water chemistry on the Pb isotopic composition of rainbow trout (Oncorhynchus mykiss). Sci. Total Environ. 2005, 350, 204–224. [Google Scholar] [CrossRef]
- Soto-Jimenez, M.F.; Paez-Osuna, F.; Scelfo, G.; Hibdon, S.; Franks, R.; Aggarawl, J.; Flegal, A.R. Lead pollution in subtropical ecosystems on the SE Gulf of California Coast: A study of concentrations and isotopic composition. Mar. Environ. Res. 2008, 66, 451–458. [Google Scholar] [CrossRef]
- Soto-Jimenez, M.F.; Flegal, A.R. Origin of lead in the Gulf of California ecoregion using stable isotope analysis. J. Geochem. Explor. 2009, 101, 209–217. [Google Scholar] [CrossRef]
- Søndergaard, J.; Asmund, G.; Johansen, P.; Elberling, B. Pb isotopes as tracers of mining-related Pb in lichens, seaweed and mussels near a former Pb-Zn mine in West Greenland. Environ. Pollut. 2010, 158, 1319–1326. [Google Scholar] [CrossRef]
- Potot, C.; Féraud, G.; Schärer, A.; Barats, A.; Durrieu, G.; Le Poupon, C.; Travi, Y.; Simler, R. Groundwater and river baseline quality using major, trace elements, organic carbon and Sr-Pb-O isotopes in a Mediterranean catchment: The case of the Lower Var Valley (south-eastern France). J. Hydrol. 2012, 472–473, 126–147. [Google Scholar] [CrossRef]
- Sangster, D.F.; Outridge, P.M.; Davis, W.J. Stable lead isotope characteristics of lead ore deposits of environmental significance. Environ. Rev. 2000, 8, 115–147. [Google Scholar] [CrossRef]
- Balcaen, L.; Moens, L.; Vanhaecke, F. Determination of isotope ratios of metals and metalloids by means of ICP mass spectrometry for provenanceing purposes. Spectrochim. Acta Part B At. Spectrosc. 2010, 65, 769–786. [Google Scholar] [CrossRef]
- Thirwall, M.F. Inter-laboratory and other errors in Pb isotope analyses investigated using Pb-207/Pb-204 double spike. Chem. Geol. 2000, 163, 299–322. [Google Scholar] [CrossRef]
- Yeager, K.M.; Santschi, P.H.; Herbert, B.E. Suspended sources and tributary effects in the lower reaches of a coastal plain stream as indicated by radionuclides, Loca Bayou, Texas. Environ. Geol. 2005, 47, 382–395. [Google Scholar] [CrossRef]
- Komarek, M.; Ettler, V.; Chrastny, V.; Milhaljevic, M. Lead isotopes in environmental sciences: A review. Environ. Int. 2008, 34, 562–572. [Google Scholar] [CrossRef]
- Hopper, J.R.; Ross, H.B.; Sturges, W.T.; Barrie, L.A. Regional source discrimination of atmsoperhic aerosols in Europe using the isotopic composition of lead. Tellus 1991, 43B, 45–60. [Google Scholar]
- Gobiel, C.; Johnson, W.K.; MacDonald, R.W.; Wong, C.S. Sources and burden of lead in St. Lawrence Estuary sediments: Isotopic evidence. Environ. Sci. Technol. 1995, 29, 193–201. [Google Scholar] [CrossRef]
- Li, X.D.; Shen, Z.G.; Wai, O.W.H.; Li, Y.S. Chemical forms of Pb, Zn, and Cu in the sediment profiles of the Pearl River Estuary. Mar. Pollut. Bull. 2001, 42, 215–223. [Google Scholar] [CrossRef]
- Negrel, P.; Kloppman, W.; Garcin, M.; Giot, D. Lead isotope signatures of Holocene fluvial sediments from the Loire River valley. Appl. Geochem. 2004, 19, 957–972. [Google Scholar] [CrossRef]
- Xu, B.; Gu, Z.Y.; Zhang, Y.H.; Chen, Y.F.; Lu, Y.W. Sequence extraction and isotope analysis for discriminating the chemical forms and origins of Pb in sediment from Liaodong Bay, China. Arch. Environ. Con. Tox. 2009, 57, 230–238. [Google Scholar] [CrossRef]
- Shepherd, T.J.; Chenery, S.R.N.; Pashley, V.; Lord, R.A.; Ander, L.E.; Breward, N.; Hobbs, S.F.; Horstwood, M.; Klinck, B.A.; Worral, F. Regional lead isotope study of a polluted river catchment: River Wear, Northern England, UK. Sci. Total Environ. 2009, 407, 4882–4892. [Google Scholar] [CrossRef]
- British Geological Survey; Dunham, K.C. Geology of the Northern Pennine Orefield, Tyne to Stainmore; The Stationery Office: Norwich, UK, 1990. [Google Scholar]
- Elbaz-Paulichet, F.; Hollinger, P.; Martin, J.M.; Petit, D. Stable lead isotope ratios in major French rivers and estuaries. Sci. Total Environ. 1986, 54, 61–76. [Google Scholar] [CrossRef]
- McGill, R.A.R.; Pearce, J.M.; Fortey, N.J.; Watt, J.; Ault, L.; Parrish, R.R. Contamination source apportionment by PIMMS lead isotope analysis and SEM-image analysis. Environ. Geochem. Health 2003, 25, 25–32. [Google Scholar] [CrossRef]
- Kurkjan, R.; Dunlap, C.; Flegal, A.R. Long-range downstream effects of urban runoff and acid mine drainage in the Debed River, Armenia: Insights from lead isotope modeling. Appl. Geochem. 2004, 19, 1567–1580. [Google Scholar]
- Ettler, V.; Mihaljevič, M.; Šebeck, O.; Molek, M.; Grygar, T.; Zeman, J. Geochemical and Pb isotopic evidence for sources and dispersal of metal contamination in stream sediments from the mining and smelting district of Pribram, Czech Republic. Environ. Pollut. 2006, 142, 409–417. [Google Scholar] [CrossRef]
- Bird, G.; Brewer, P.A.; Macklin, M.G.; Nikolova, M.; Kotsev, T.; Mollov, M.; Swain, C. Pb isotope evidence from contaminant-metal dispersal in an international river system: The lower Danube catchment, Eastern Europe. Appl. Geochem. 2010, 25, 1070–1084. [Google Scholar]
- Bird, G.; Brewer, P.A.; Macklin, M.G.; Nikolova, M.; Kotsev, T.; Mollov, M.; Swain, C. Quantifying sediment-associated dispersal using Pb isotope: Application of binary and multivariate mixing models in the Maritsa catchment, Bulgaria. Environ. Pollut. 2010, 158, 2158–2169. [Google Scholar]
- Townsend, A.T.; Seen, A.J. Historical lead isotope record of a sediment core from the Derwent River (Tasmania, Australia): A multiple source environment. Sci. Total Environ. 2012, 424, 153–161. [Google Scholar] [CrossRef]
- Erel, Y.; Veron, A.; Halicz, L. Tracing the transport of anthropogenic lead in the atmosphere and in soils using isotope ratios. Geochim. Cosmochim. Acta 1997, 61, 4495–4505. [Google Scholar]
- Miller, J.R.; Lechler, P.J.; Mackin, G.; Germanoski, D.; Villarroel, L.F. Evaluation of particle dispersal from mining and milling operations using lead isotopic fingerprinting techniques, Rio Pilcomayo Basin, Bolivia. Sci. Total Environ. 2007, 384, 355–373. [Google Scholar] [CrossRef]
- Church, S.E.; Fey, D.L.; Unruh, D.M. Trace elements and lead isotopes in streambed sediments in streams affected by historical mining. In Integrated Investigations of Environmental Effects of Historical Mining in the Animas River Watershed, San Juan County, Colorado; USGS Professional Paper 1651; Church, S.E., von Guerard, P., Finger, S.E., Eds.; U.S. Government Printing Office: Washington, DC, USA, 2007; pp. 283–335. [Google Scholar]
- Hudson-Edwards, K.A.; Macklin, M.G.; Miller, J.R.; Lechler, P.J. Sources, distribution and storage of heavy metals in the Rio Pilcomayo, Bolivia. J. Geochem. Explor. 2001, 72, 229–250. [Google Scholar] [CrossRef]
- Monna, F.; Lancelot, J.; Croudace, I.W.; Cundy, A.B.; Lewis, J.T. Pb isotopic composition of airborne particulate materials from France and the Southern United Kingdom: Implications for Pb pollution sources in urban areas. Environ. Sci. Technol. 1997, 31, 2277–2286. [Google Scholar]
- N’Guessan, Y.M.; Probst, J.L.; Bur, T.; Probst, A. Trace elements in stream bed sediments from agricultural catchments (Gascogne region, S-W France): Where do they come from? Sci. Total Environ. 2009, 407, 2939–2952. [Google Scholar] [Green Version]
- Ip, C.C.M.; Li, X.D.; Zhang, G.; Wai, O.W.H.; Li, Y.S. Trace metal distribution in sediments of the Pearl River Estuary and the surrounding coastal area, South China. Environ. Pollut. 2007, 147, 311–323. [Google Scholar] [CrossRef]
- Batista, M.J.; de Oliveira, D.P.S.; Abreu, M.M.; Locutura, J.; Sheperd, T.; Matos, J.; Bel-Lan, A.; Martins, L. Sources, background and enrichments of lead and other elements: Lower Guadiana River. Geoderma 2013, 193–194, 265–274. [Google Scholar]
- Nelson, B.K.; DePaolo, D.J. Application of Sm-Nd and Rb-Sr isotope systematics to studies of provenance and basin analysis. J. Sediment. Petrol. 1988, 58, 348–357. [Google Scholar]
- Awwiller, D.N.; Marck, L.E. Diagenetic resetting of Sm-Nd isotope systematics in Wilcox Groups sandstones and shales, San Marcos Arch, south-central Texas. Gulf Coast Assoc. Geol. Soc. Trans. 1989, 39, 321–330. [Google Scholar]
- McLennan, S.M. Rare earth elements in sedimentary rocks: Influence of provenance and sedimentary processes. Rev. Miner. Geochem. 1989, 21, 169–200. [Google Scholar]
- Awwiller, D.N. Geochronology and mass transfer in Gulf Coast mudrocks (south-central Texas, U.S.A.): Rb-Sr, Sm-Nd and REE systematics. Cehm Geol. 1994, 116, 61–84. [Google Scholar] [CrossRef]
- Gao, B.; Liu, Y.; Sun, K.; Liang, X.R.; Peng, P.; Sheng, G.; Fu, J. Precise determination of cadmium and lead isotopic compositions in river sediments. Anal. Chim. Acta 2008, 612, 114–120. [Google Scholar] [CrossRef]
- Cloquet, C.; Carignan, J.; Libourel, G.; Sterckeman, T.; Perdrix, E. Tracing source pollution in soils using cadmium and lead isotopes. Environ. Sci. Technol. 2006, 40, 2525–2530. [Google Scholar]
- Weiss, D.J.; Rehkämper, M.; Schoenberg, R.; McLaughlin, M.; Kirby, J.; Campbell, P.G.C.; Arnold, T.; Chapman, J.; Peel, K.; Gioia, S. Application of nontraditional stable-isotopes to the study of sources and fate of metals in the environment. Environ. Sci. Technol. 2008, 42, 655–664. [Google Scholar] [CrossRef]
- Shiel, A.E.; Weis, D.; Orians, K.J. Evaluation of zinc, cadmium, and lead isotope fractionation during smelting and refining. Sci. Total Environ. 2010, 408, 2357–2368. [Google Scholar] [CrossRef]
- Shiel, A.E.; Weis, D.; Orians, K.J. Tracing cadmium, zinc, and lead sources in bivalves from the coasts of western Canada and the USA using isotopes. Geochim. Cosmochim. Acta 2012, 76, 175–190. [Google Scholar] [CrossRef]
- Kimball, B.E.; Mathur, R.; Dohnalkova, A.C.; Wall, A.J.; Runkel, R.L.; Brantley, S.L. Copper isotope fractionation in acid mine drainage. Geochim. Cosmochim. Ac. 2009, 73, 1247–1263. [Google Scholar] [CrossRef]
- Zhu, X.K.; Onions, R.K.; Guo, Y.; Belshaw, N.S.; Rickard, D. Determination of natural cu-isotope variation by plasma source mass spectrometry: Implications for use as geochemical tracers. Chem. Geol. 2000, 163, 139–149. [Google Scholar] [CrossRef]
- Petit, J.C.J.; DeJong, J.; Chou, L.; Mattielli, N. Development of Cu and Zn isotope MC-ICP-MS measurements: Application to suspended particulate matter and sediments from the Scheldt Estuary. Geostand. Geoanal. Res. 2008, 32, 149–166. [Google Scholar] [CrossRef]
- Bergquist, B.; Blum, J.D. The odds and evens of mercury isotopes: Applications of mass-dependent and mass-independent isotope fractionation. Elements 2009, 5, 353–357. [Google Scholar] [CrossRef]
- Yi, R.; Feng, X.; Shi, W. Application of the stable-isotope system to the study of sources and fate of Hg in the environment: A review. Appl. Geochem. 2010, 25, 1467–1477. [Google Scholar]
- Sonke, J.E.; Schäfer, J.; Chmeleff, J.; Audry, S.; Blanc, G.; Dupré, B. Sedimentary mercury stable isotope records of atmospheric and riverine pollution from two major European heavy metal refineries. Chem. Geol. 2010, 279, 90–100. [Google Scholar] [CrossRef]
- Rouxel, O.; Ludden, J.; Fouquet, Y. Antimony isotope variations in natural systems and implications for their use as geochemical tracers. Chem. Geol. 2003, 200, 25–40. [Google Scholar]
- Wilson, L.R. Determination of Trace Element Provenance, Rio Loa Basin, Northern Chile. Master’s Thesis, Department of Chemistry and Physics, Western Carolina University, Cullowee, NC, USA, July 2011. [Google Scholar]
- Sivry, Y.; Riotte, J.; Sonke, J.E.; Audray, S.; Schäfer, J.; Viers, J.; Blanc, G.; Freydier, R.; Dupré, B. Zn isotopes as tracers of anthropogenic pollution from Zn-ore smelters, The Riou Mort-Lot River System. Chem. Geol. 2008, 255, 295–304. [Google Scholar] [CrossRef]
- Bentahila, Y.; Othman, B.; Luck, J.M. Stontium, lead, and zinc isotopes in marine cores as tracers of sedimentary provenance: A case study around Taiwan orogen. Chem. Geol. 2008, 248, 62–82. [Google Scholar] [CrossRef]
- Wombacher, F.; Rahkämper, M.; Mezger, K. Determination of the massdependence of cadmium isotope fractionation during evaporation. Geochim. Cosmochim. Acta 2004, 68, 2349–2357. [Google Scholar] [CrossRef]
- Rahkämper, M.; Wombacher, F.; Horner, T.J.; Xue, Z. Natural and anthropogenic cd isotope variations. In Handbook of Environmental Isotope Geochemistry, Advances in Isotope Geochemistry; Baskarn, M., Ed.; Springer-Verlag: Berlin, Germany, 2011; pp. 125–154. [Google Scholar]
- Bullen, T.D. Stable isotope of transition and post-transition metals as tracers in environmental studies. In Handbook of Environmental Isotope Geochemistry; Baskarn, M., Ed.; Springer-Verlag: Berlin, Germany, 2011; pp. 177–203. [Google Scholar]
- Geagea, M.L.; Stille, P.; Gauthier-Lafaye, F.; Millet, M. Tracing of industrial aerosol sources in an urban environment using Pb, Sr, and Nd isotopes. Environ. Sci. Tech. 2008, 42, 692–698. [Google Scholar] [CrossRef]
- Weiss, D.J.; Rausch, N.; Mason, T.F.D.; Coles, B.J.; Wilkinson, J.J.; Ukonmaanaho, L.; Nieminen, T. Geochim. Atmospheric deposition and isotope biogeochemistry of zinc in ombrotrophic peat. Geochim. Cosmochim. Acta 2007, 71, 942–960. [Google Scholar] [CrossRef]
- Cloquet, C.; Carignan, J.; Lehmann, M.R.; Vanhaecke, F. Variation in the isotopic compositon of zinc in the natural environment and the use of zinc isotopes in biogeosciences: A review. Anal. Bioanal. Chem. 2008, 390, 451–463. [Google Scholar] [CrossRef]
- Chen, J.; Gaillardet, J.; Louvat, P. Zinc isotopes in the Seine River waters, France: A probe of anthropogenic contamination. Environ. Sci. Technol. 2008, 42, 6494–6501. [Google Scholar]
- Aranda, S.; Borrok, D.M.; Wanty, R.B.; Balistrien, L.S. Zinc isotope investigation of surface and pore waters in a mountain watershed impacted by acid rock drainage. Sci. Total Environ. 2012, 420, 202–213. [Google Scholar] [CrossRef]
- Wanty, R.B.; Podda, F.; de Giudici, G.; Cidu, R.; Lattanzi, P. Zinc isotope and transition-element dynamics accompanying hydrozincite biomineralization in the Rio Naracauli, Sardinia, Italy. Chem. Geol. 2013, 337-338, 1–10. [Google Scholar]
- Lambelet, M.; Rehkämper, M.; van de Flierdt, T.; Xue, Z.; Kreissig, K.; Coles, B.; Porcelli, D.; Andersson, P. Isotopic analysis of Cd in the mixing zone of Siberian rivers with the Arctic Ocean-New constraints on marine Cd cycling and the isotope composition of riverine Cd. Earth Plant. Sci. Lett. 2013, 361, 64–73. [Google Scholar] [CrossRef]
- Cloquet, C.; Rouxel, O.; Carignan, J.; Libourel, G. Natural cadmium isotopic variations in eight geological reference materials (NIST SRM 2711, BCR 176, GSS-1, GXR-1, GXR-2, GSD-12, Nod-P-1, Nod-A-1) and anthropogenic samples, measured by MC-ICP-MS. Geostand. Geoanal. Res. 2005, 29, 95–106. [Google Scholar]
- Ripperger, S.; Rehkämper, M. Precis determination of cadmium isotope fractionation in seawater by double spike MC-ICP-MS. Geochem. Cosmochim. Acta 2007, 71, 631–642. [Google Scholar]
- Bullen, T.D.; Walczyk, T. Environmental and Biomedical application of natural metal stable isotope variations. Elements 2009, 5, 381–385. [Google Scholar] [CrossRef]
- Mathur, R.; Ruiz, J.; Titley, S.; Liermann, L.; Buss, H.; Brantley, S. Cu isotopic fractionation in the supergene environment with and without bacteria. Geochim. Cosmochim. Acta 2005, 69, 5233–5246. [Google Scholar] [CrossRef]
- Zink, S.; Schoenberg, R.; Staubwasser, M. Isotope fractionation and reaction kinetics between Cr(III) and Cr(VI) in aqueous media. Geochim. Cosmochim. Acta 2010, 5729–5745. [Google Scholar]
- Kitchen, J.W.; Johnson, T.M.; Bullen, T.D.; Zhu, J.; Raddatz, A. Chromium isotope fractionation factors for reduction of Cr(VI) by aqueous Fe(II) and organic molecules. Geochim. Cosmochim. Acta 2012, 89, 190–201. [Google Scholar] [CrossRef]
- Borrok, D.M.; Wanty, R.B.; Ridley, W.I.; Lamothe, P.J.; Kimball, B.A.; Verplanck, P.L.; Runkel, R.L. Application of iron and zinc isotopes to track the sources and mechanisms of metal loading in a mountain watershed. Appl. Geochem. 2009, 24, 1270–1277. [Google Scholar] [CrossRef]
- Fernandez, A.; Borrok, D.M. Fractionation of Cu, Fe, and Zn isotopes during the oxidative weathering of sulphide-rich rock. Chem. Geol. 2009, 264, 1–12. [Google Scholar] [CrossRef]
- Hoefs, J. Stable Isotope Geochemistry; Springer Verlag: New York, NY, USA, 2009. [Google Scholar]
- Bullen, T.D. Chromium Stable Isotopes as a New Tool for Forensic Hydrology at Sites Contaminated with Anthropogenic Chromium. In Water-Rock Interactions, Proceedings of 12th International Symposium on Water-Rock Interactions (WRI-12), Kunming, China, 31 July–5 August 2007; Bullen, T.D., Wang, Y., Eds.; Taylor & Francis: London, UK, 2007; pp. 699–702. [Google Scholar]
- Raddatz, A.L.; Johnson, T.M.; McLing, T.L. Cr stable isotopes in Snake River plan aquifer groundwater: Evidence for natural reduction of dissolved Cr(VI). Environ. Sci. Technol. 2011, 45, 502–507. [Google Scholar] [CrossRef]
- Wanner, C.; Eggenberger, U.; Kurz, D.; Zink, S.; Mäder, U. A chromate—contaminated site in southern Switzerland-Part I: Site characterization and the use of Cr isotopes to delineate fate and transport. App. Geochem. 2012, 27, 644–654. [Google Scholar] [CrossRef]
- Sherman, L.S.; Blum, J.D. Mercury stable isotopes in sediments and largemouth bass from Florida lakes, USA. Sci. Total Environ. 2013, 448, 163–175. [Google Scholar] [CrossRef]
- Hintelmann, H.; Lu, S.Y. High precision isotope ratio measurements of mercury isotopes in cinnabar ores using multi-collector inductively coupled plasma mass spectrometry. Analyst 2003, 128, 636–639. [Google Scholar]
- Smith, C.N.; Kesler, S.E.; Kaue, B.; Blum, J.D. Mercury isotope fractionation in fossil hydrothermal systems. Geology 2005, 33, 825–828. [Google Scholar] [CrossRef]
- Smith, C.N.; Kesler, S.E.; Blum, J.D.; Rytuba, J.J. Isotope geochemistry of mercury isn source rocks, mineral depsoits and spring deposits of the California Coast Ranges, USA. Earth Planet. Sci. Lett. 2008, 269, 399–407. [Google Scholar] [CrossRef]
- Lauretta, D.S.; Klaue, B.; Blum, J.D.; Buseck, P.R. Mercury abundances and isotopic compositions in the Murchison (CM) and Allende (CV) carbonaceous chondrites. Geochemica Cosmochim. Acta 2001, 65, 2807–2818. [Google Scholar] [CrossRef]
- Sonke, J.E.; Zambardi, T.; Toutain, J.P. Indirect gold trap-MC-ICP-MS coupling for Hg stable isotope analysis using a syringe injection interface. J. Anal. Atomic Spectrom. 2008, 23, 569–573. [Google Scholar] [CrossRef]
- Zambardi, T.; Sonke, J.E.; Toutain, J.P.; Sortino, F.; Shinohara, H. Mercury emissions and stable isotopic compositions at Vulcano Island (Italy). Earth Planet. Sci. Lett. 2009, 227, 236–243. [Google Scholar]
- Jackson, T.A.; Muir, D.C.G.; Vincent, W.F. Historical variations in the stable isotope composition of mercury in Arctic lake sediments. Environ. Sci. Technol. 2004, 38, 2813–2121. [Google Scholar] [CrossRef]
- Foucher, D.; Hintelmann, H. High-precision measurements of mercury isotope ratios in sediments using cold-vapor generation multi-collector inductively coupled plasma mass spectrometry. Anal. Bioanal. Chem. 2006, 384, 1470–1478. [Google Scholar] [CrossRef]
- Biswas, A.; Blum, J.D.; Bergquist, B.A.; Keeler, G.J.; Xie, Z.Q. Natural mecury isotope variation in coal deposits and organic soils. Environ. Sci. Technol. 2008, 42, 8303–8309. [Google Scholar] [CrossRef]
- Ghosh, S.; Xu, Y.F.; Humayun, M.; Odom, L. Mass-independent fractionation of mercury isotopes in the environment. Geochem. Geophy. Geosyst. 2008, 9. [Google Scholar] [CrossRef]
- Jackson, T.A.; Whittle, D.M.; Evans, M.S.; Muir, D.C.G. Evidence for mass-independent and mass-dependent fractionation of the stable isotopes of mercury by natural processes in aquatic ecosystems. Appl. Geochem. 2008, 23, 547–571. [Google Scholar] [CrossRef]
- Foucher, D.; Ogrinc, N.; Hintelmann, H. Tracing mercury contamination from the Idraja mining region (Slovenia) to the Gulf of Trieste using Hg isotope ratio measurements. Environ. Sci. Technol. 2009, 43, 33–49. [Google Scholar] [CrossRef]
- Gehrke, G.E.; Blum, J.D.; Meyers, P.A. The geochemical behavior and isotopic composition of Hg in a mid-Pleistocene western Mediterranean sapropel. Geochim. Cosmochim. Acta 2009, 73, 1651–1665. [Google Scholar] [CrossRef]
- Carignan, J.; Estrade, N.; Sonke, J.E.; Donard, O.F.X. Odd isotope deficits in atmospheric Hg measured in lichens. Environ. Sci. Technol. 2009, 43, 5660–5664. [Google Scholar] [CrossRef]
- Blum, J.D.; Bergquist, B.A. Reporting of variations in natural isotopic compositions of mercury. Anal. Bioanal. Chem. 2007, 388, 353–359. [Google Scholar] [CrossRef]
- Feng, X.B.; Foucher, D.; Hintelmann, H.; Yan, H.Y.; He, T.R.; Qiu, G.L. Tracing mercury contamination sources in sediments using mercury isotope compositions. Environ. Sci. Technol. 2010, 44, 3363–3368. [Google Scholar] [CrossRef]
- Foucher, D.; Hintelmann, H.; Al, T.A.; MacQuarrie, K.T. Mercury isotope fractionation in waters and sediments of the Murray Brook mine watershed (New Brunswick, Canada): Tracing mercury contamination and transformations. Chem. Geol. 2013, 336, 87–95. [Google Scholar] [CrossRef]
- Yin, R.; Feng, X.; Wang, J.; Li, P.; Liu, J.; Zhang, Y.; Chen, J.; Zheng, L.; Hu, T. Mercury speciation and mercury isotope fractionation during ore roasting process and their implication to source identification of downstream sediment in the Wanshan mercury mining area, SW China. Chem. Geol. 2013, 336, 72–79. [Google Scholar] [CrossRef]
© 2013 by the authors; licensee MDPI, Basel, Switzerland. This article is an open access article distributed under the terms and conditions of the Creative Commons Attribution license (http://creativecommons.org/licenses/by/3.0/).
Share and Cite
Miller, J.R. Forensic Assessment of Metal Contaminated Rivers in the 21st Century Using Geochemical and Isotopic Tracers. Minerals 2013, 3, 192-246. https://doi.org/10.3390/min3020192
Miller JR. Forensic Assessment of Metal Contaminated Rivers in the 21st Century Using Geochemical and Isotopic Tracers. Minerals. 2013; 3(2):192-246. https://doi.org/10.3390/min3020192
Chicago/Turabian StyleMiller, Jerry R. 2013. "Forensic Assessment of Metal Contaminated Rivers in the 21st Century Using Geochemical and Isotopic Tracers" Minerals 3, no. 2: 192-246. https://doi.org/10.3390/min3020192