
An Integrated Petrographic, Geomatic and Geophysical Approach for the Characterization of the Carbonate Rocks of the Calcari di Cagliari Formation

 , , , and
Abstract
:1. Introduction
2. Materials and Methods
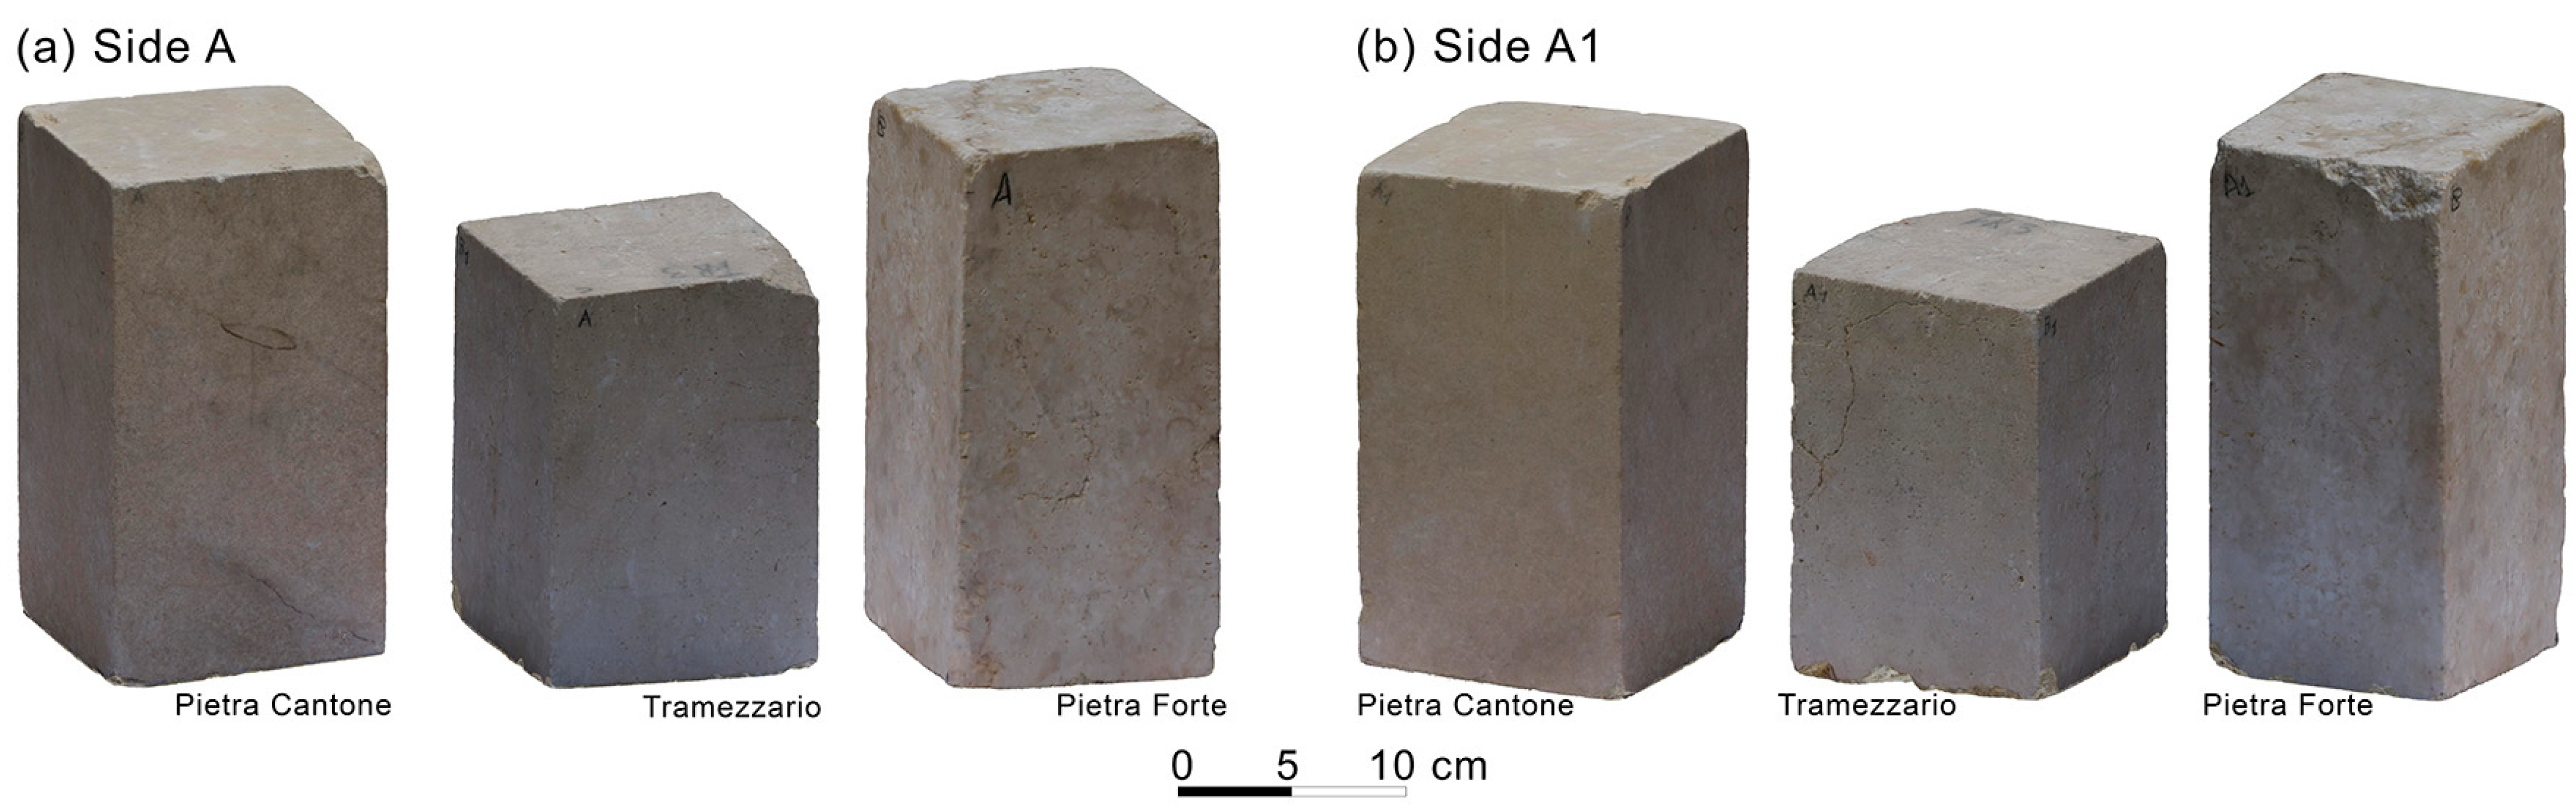
2.1. Materials
2.2. Optical and Scanning Electron Microscopy
2.3. Mercury Intrusion Porosimetry
2.4. CRP Method
2.5. Three-Dimensional Ultrasonic Tomography
3. Results and Discussion
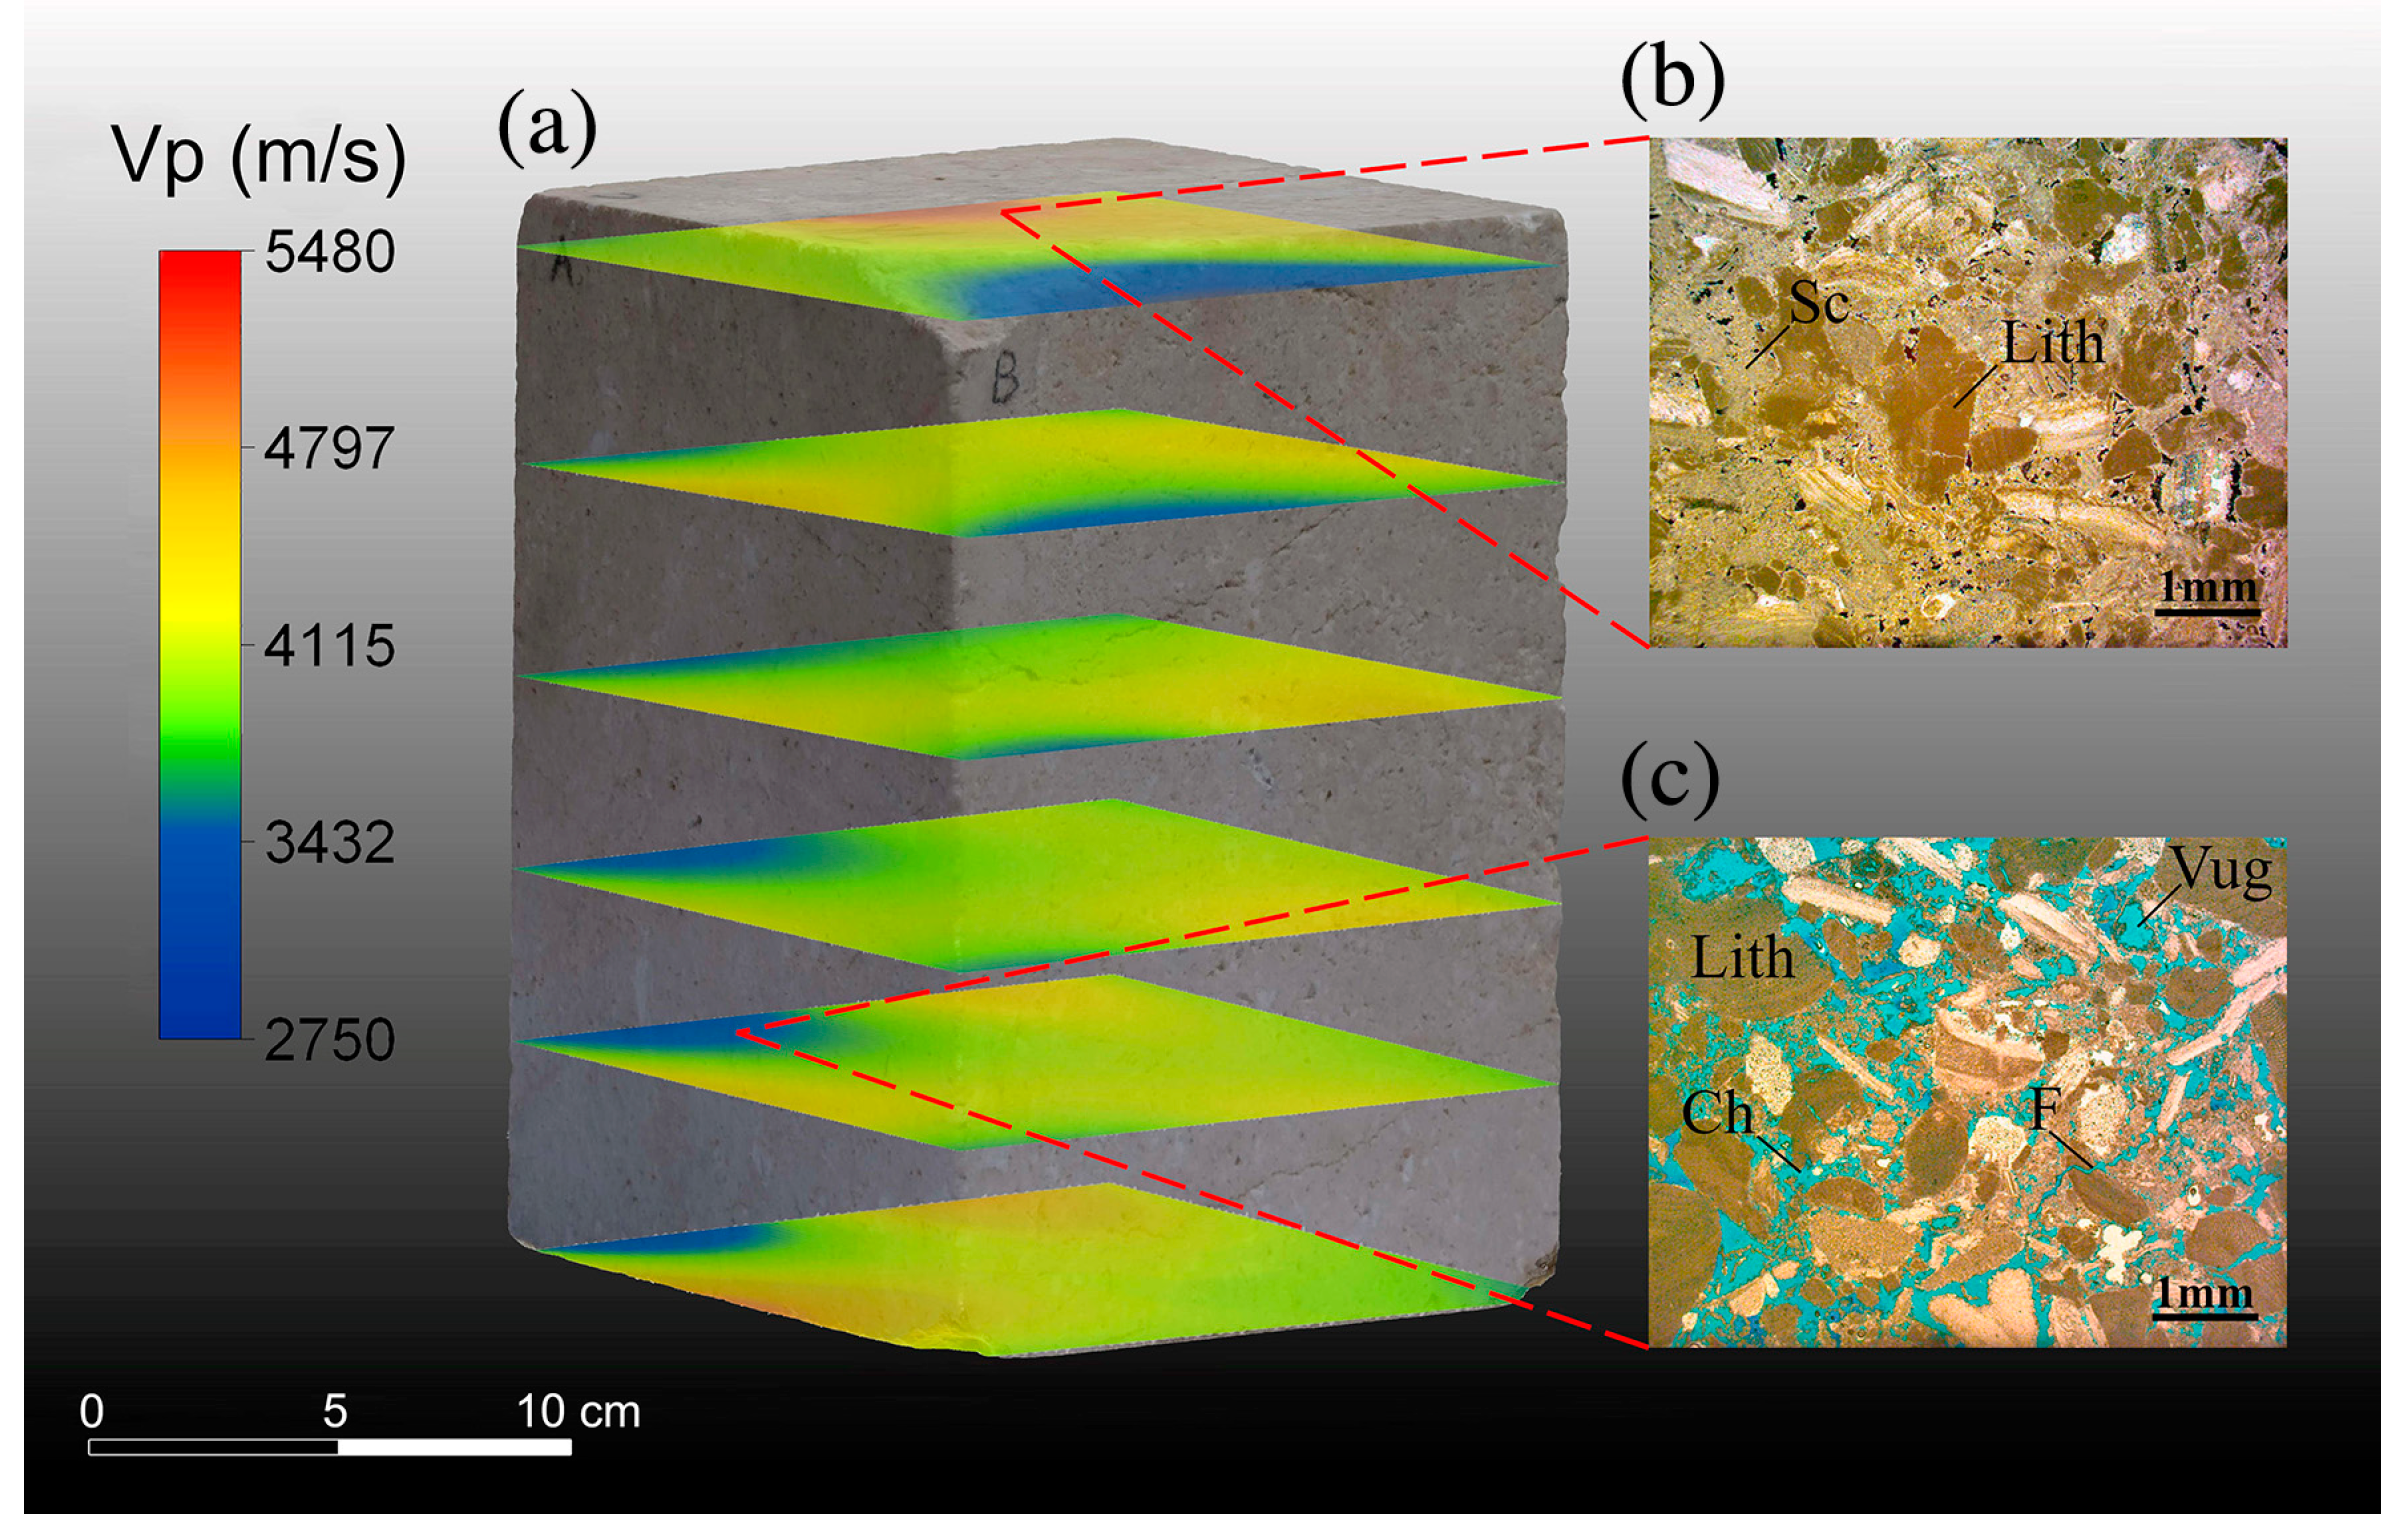
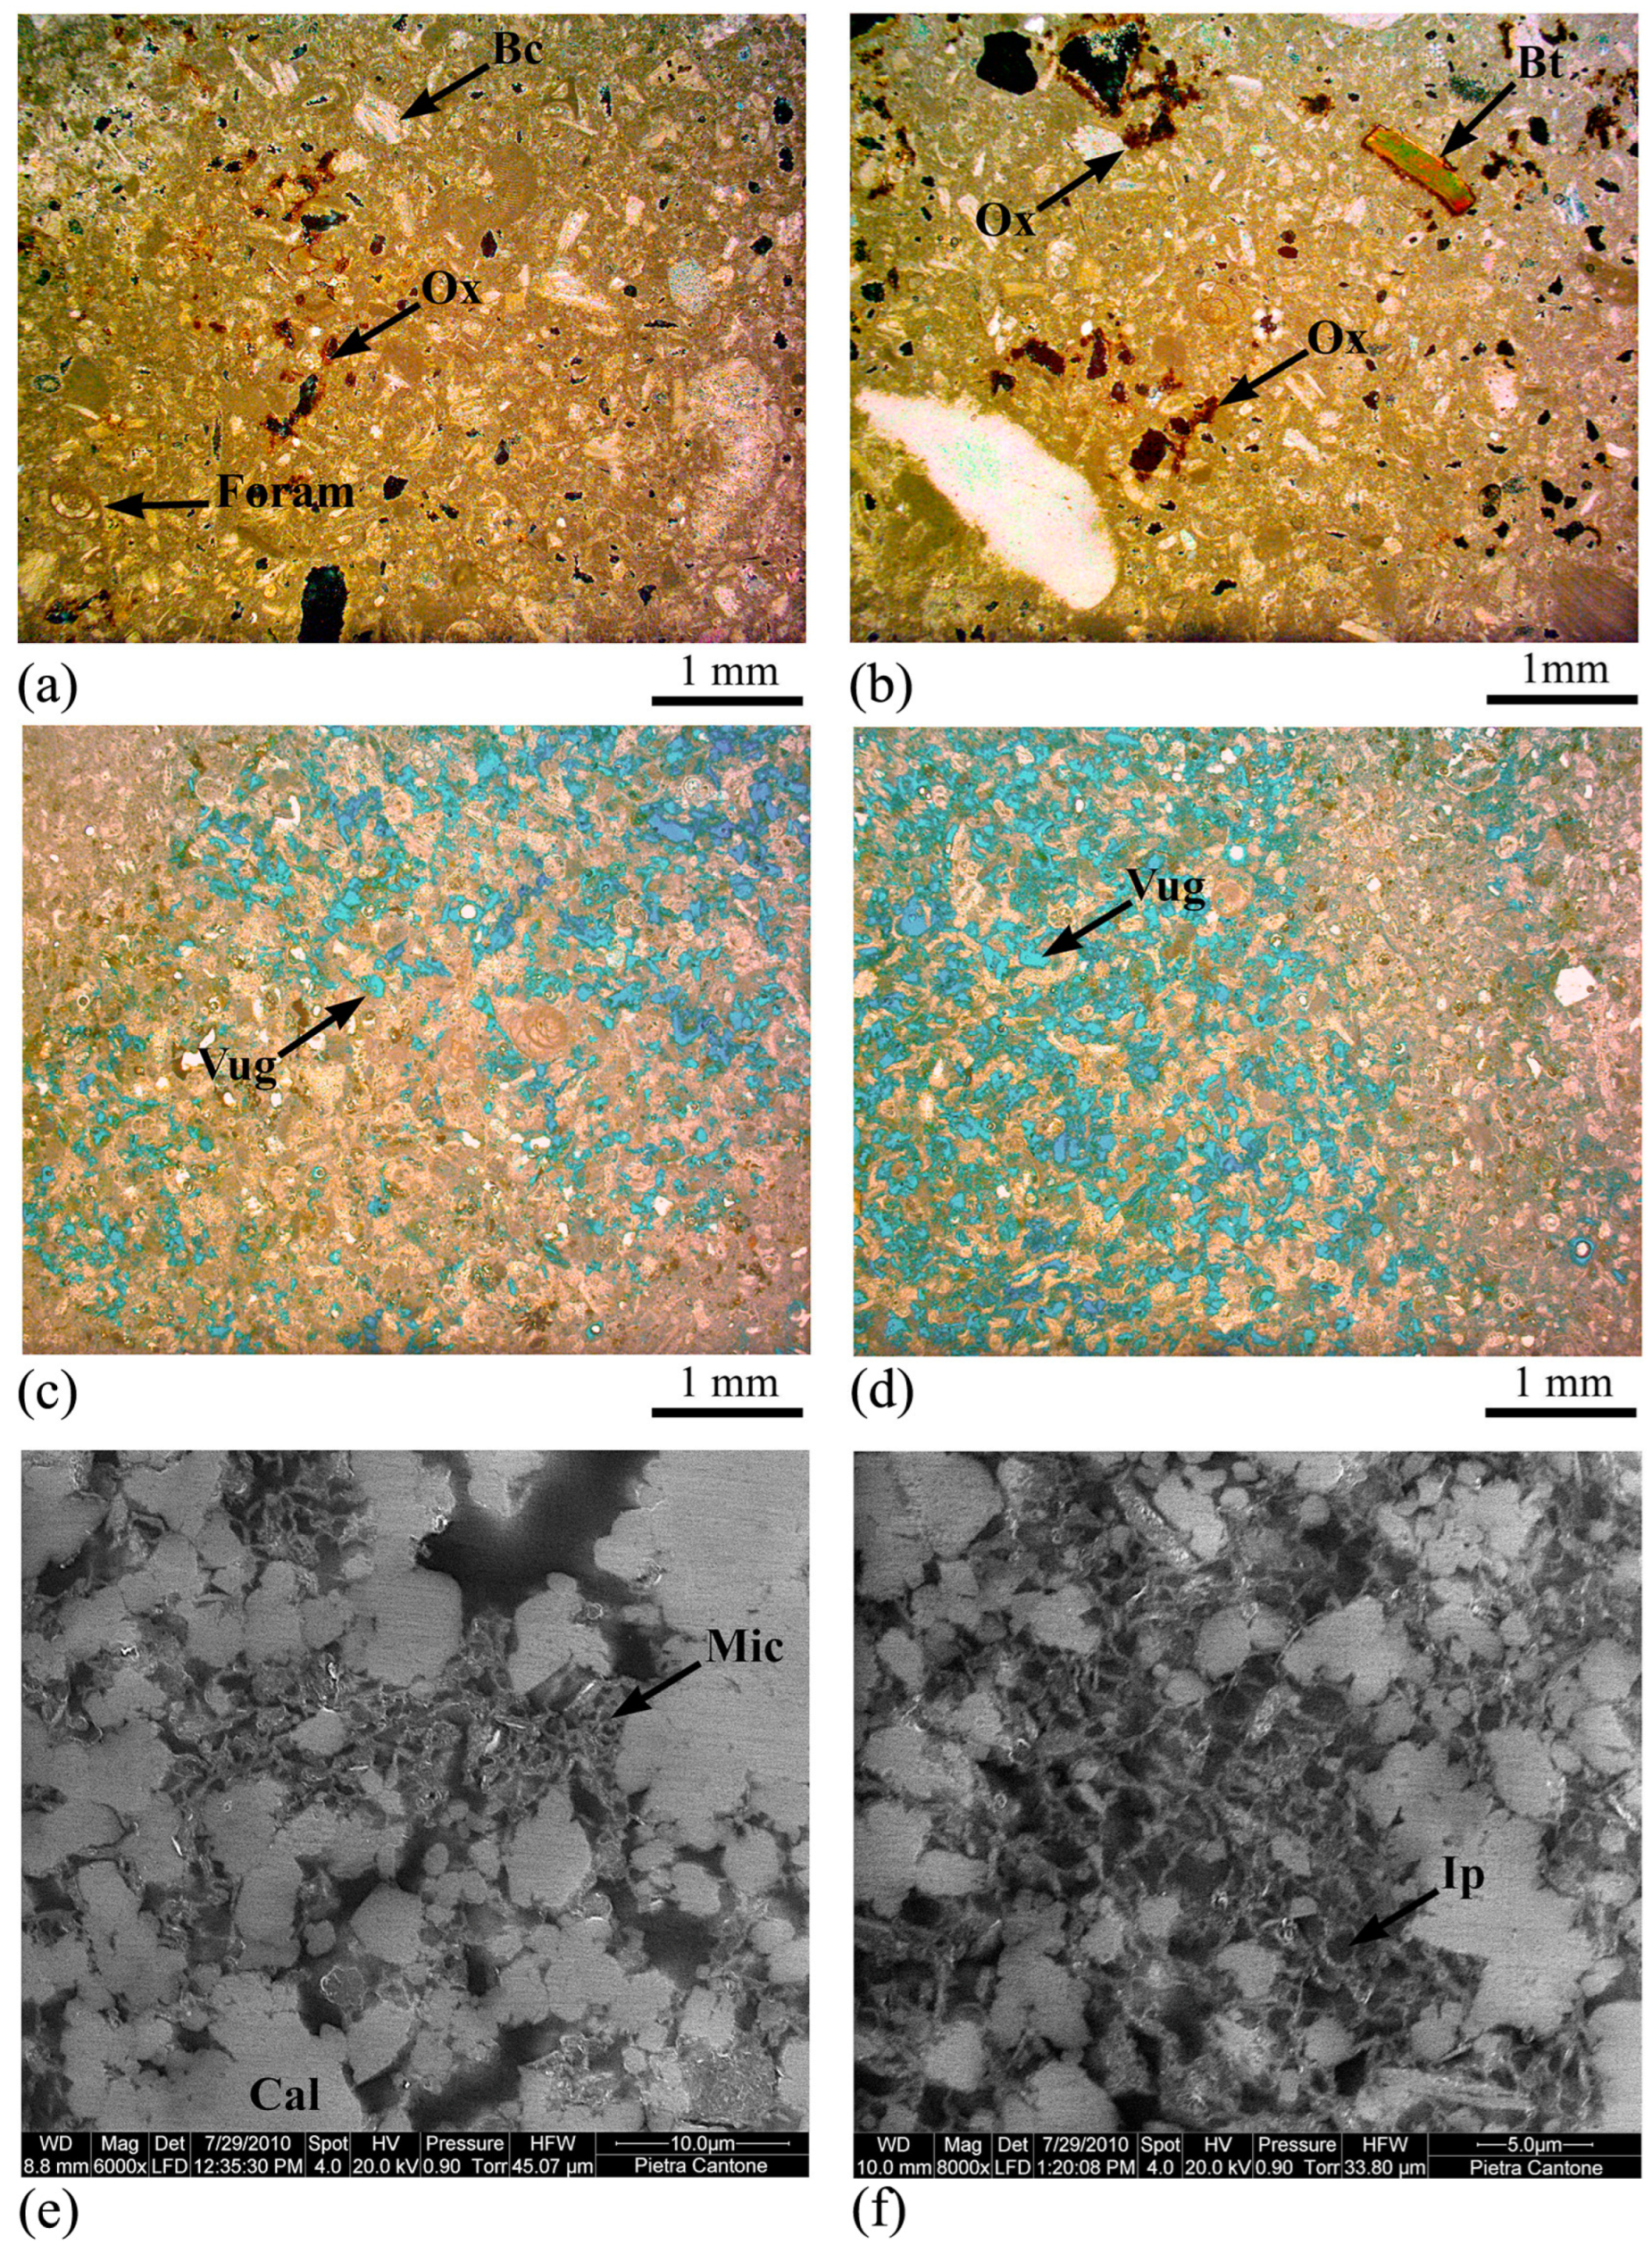
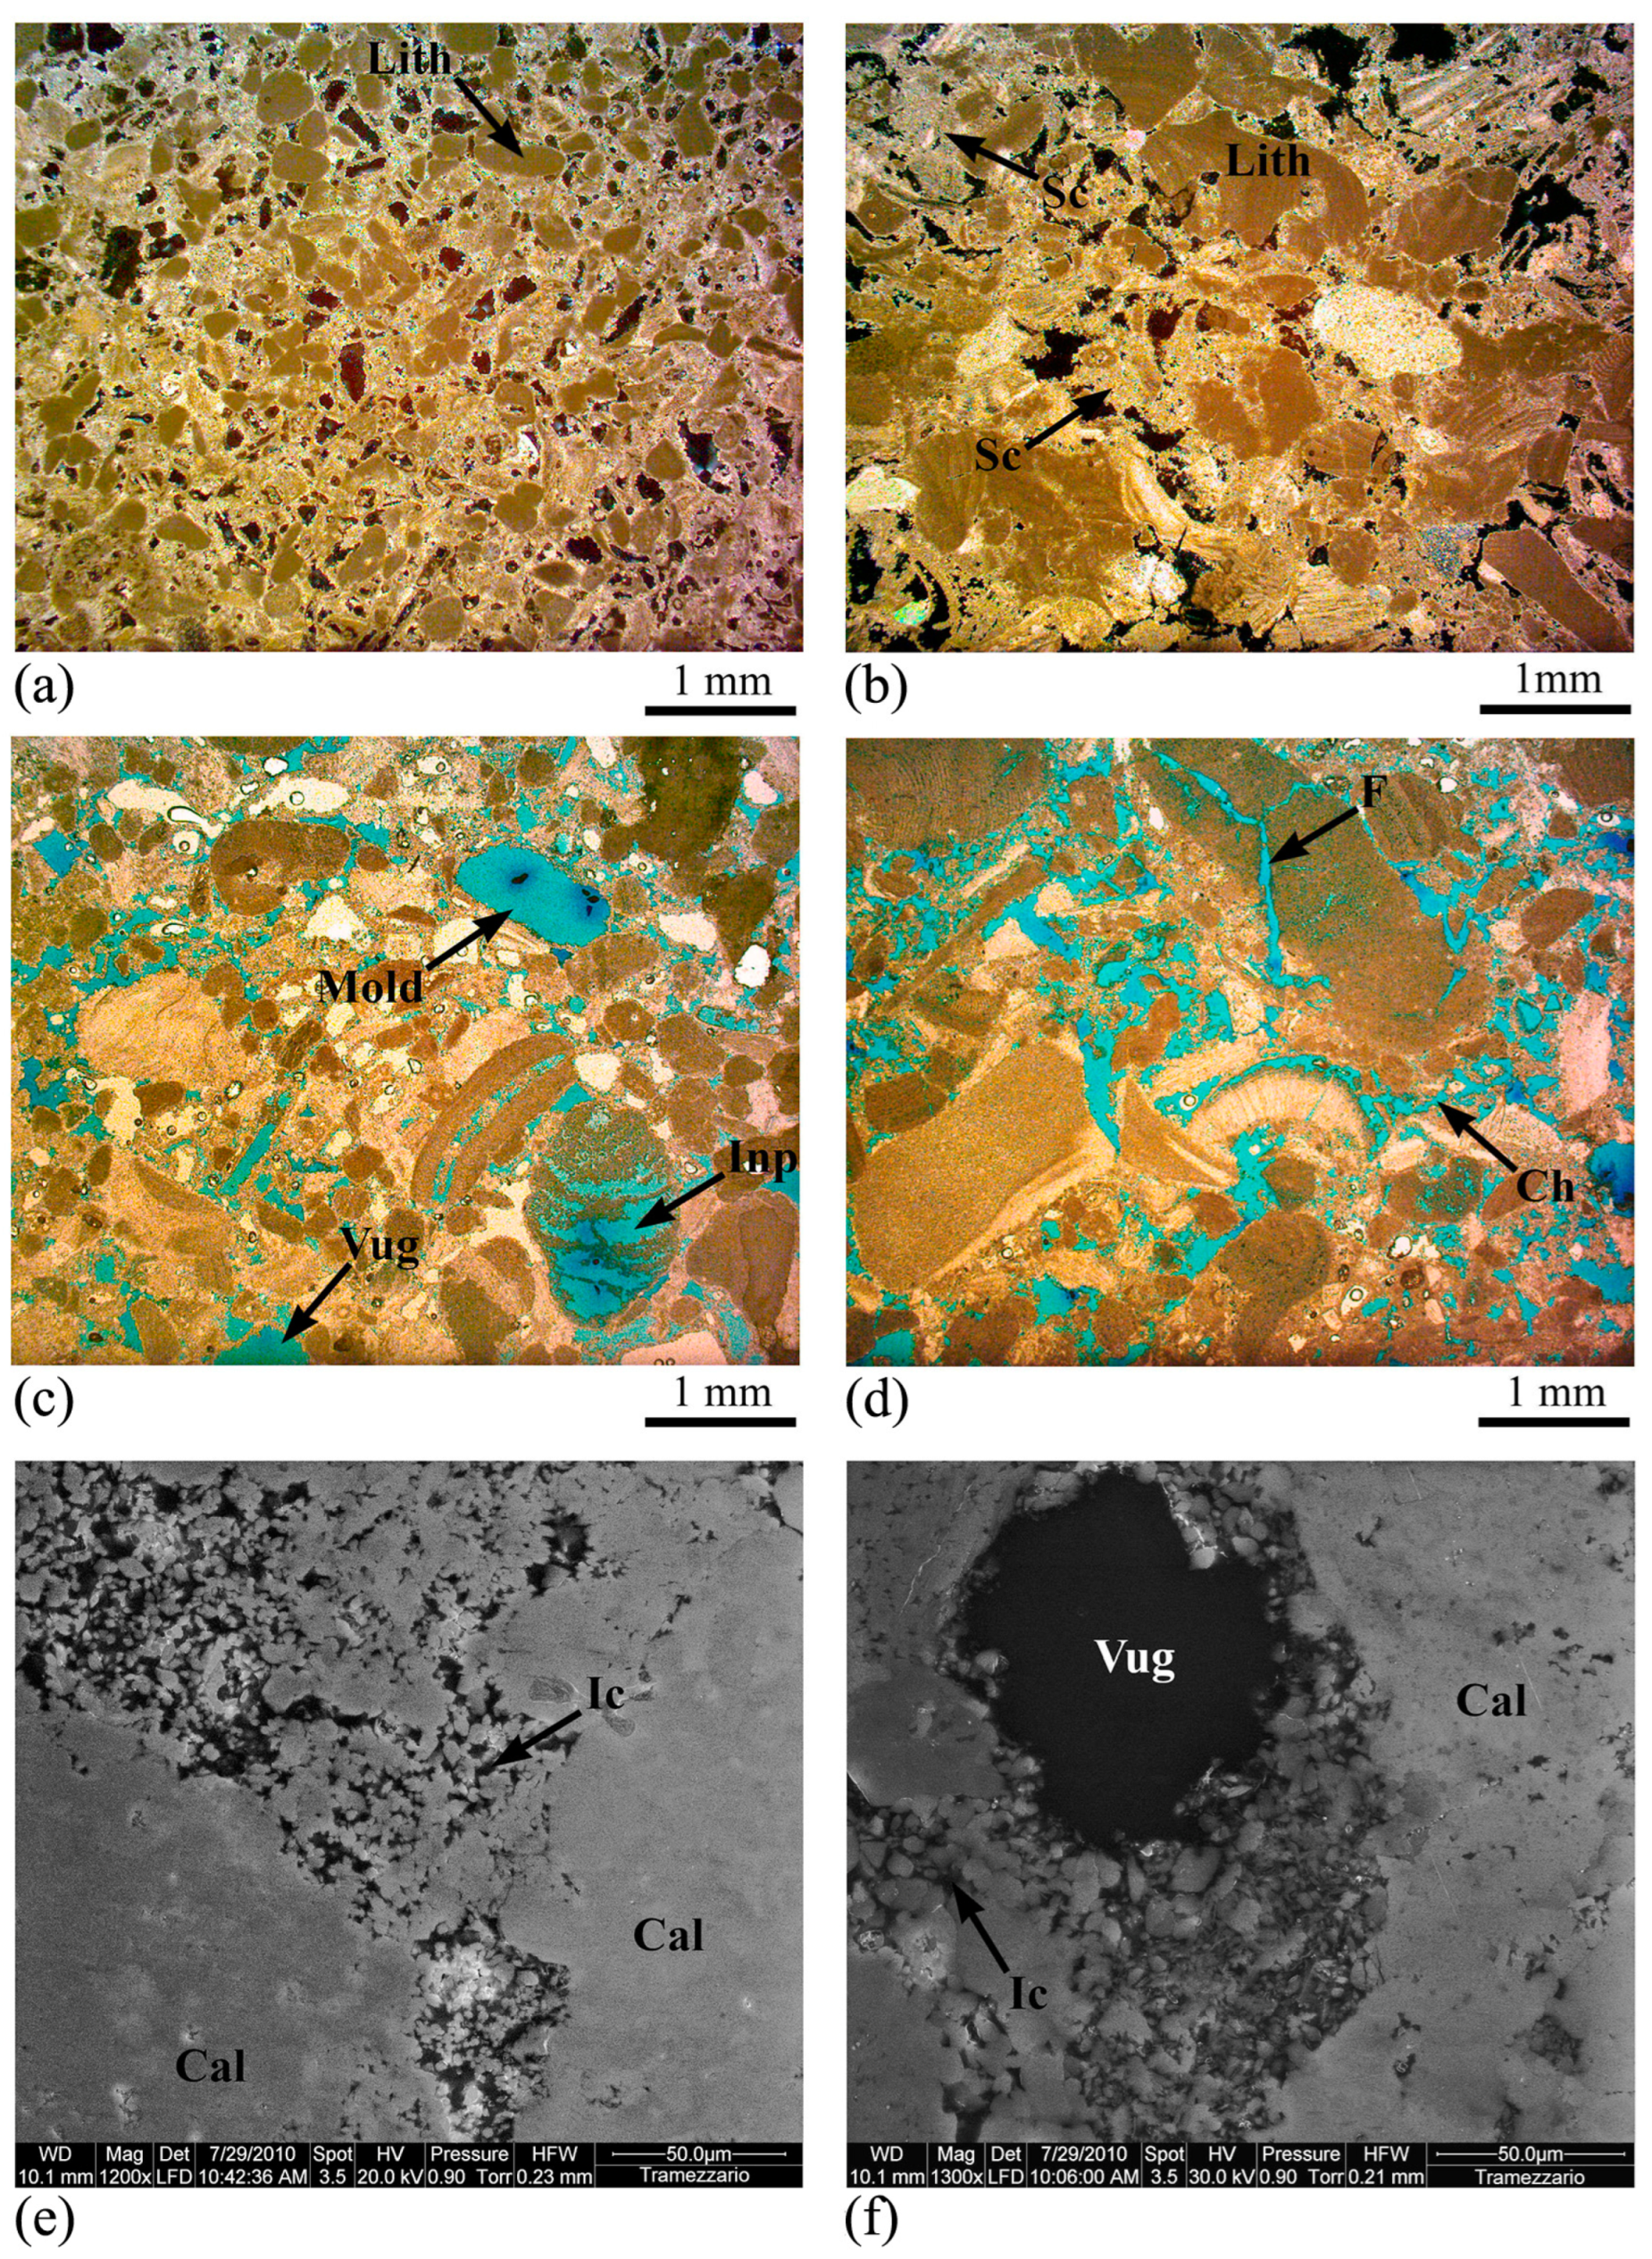
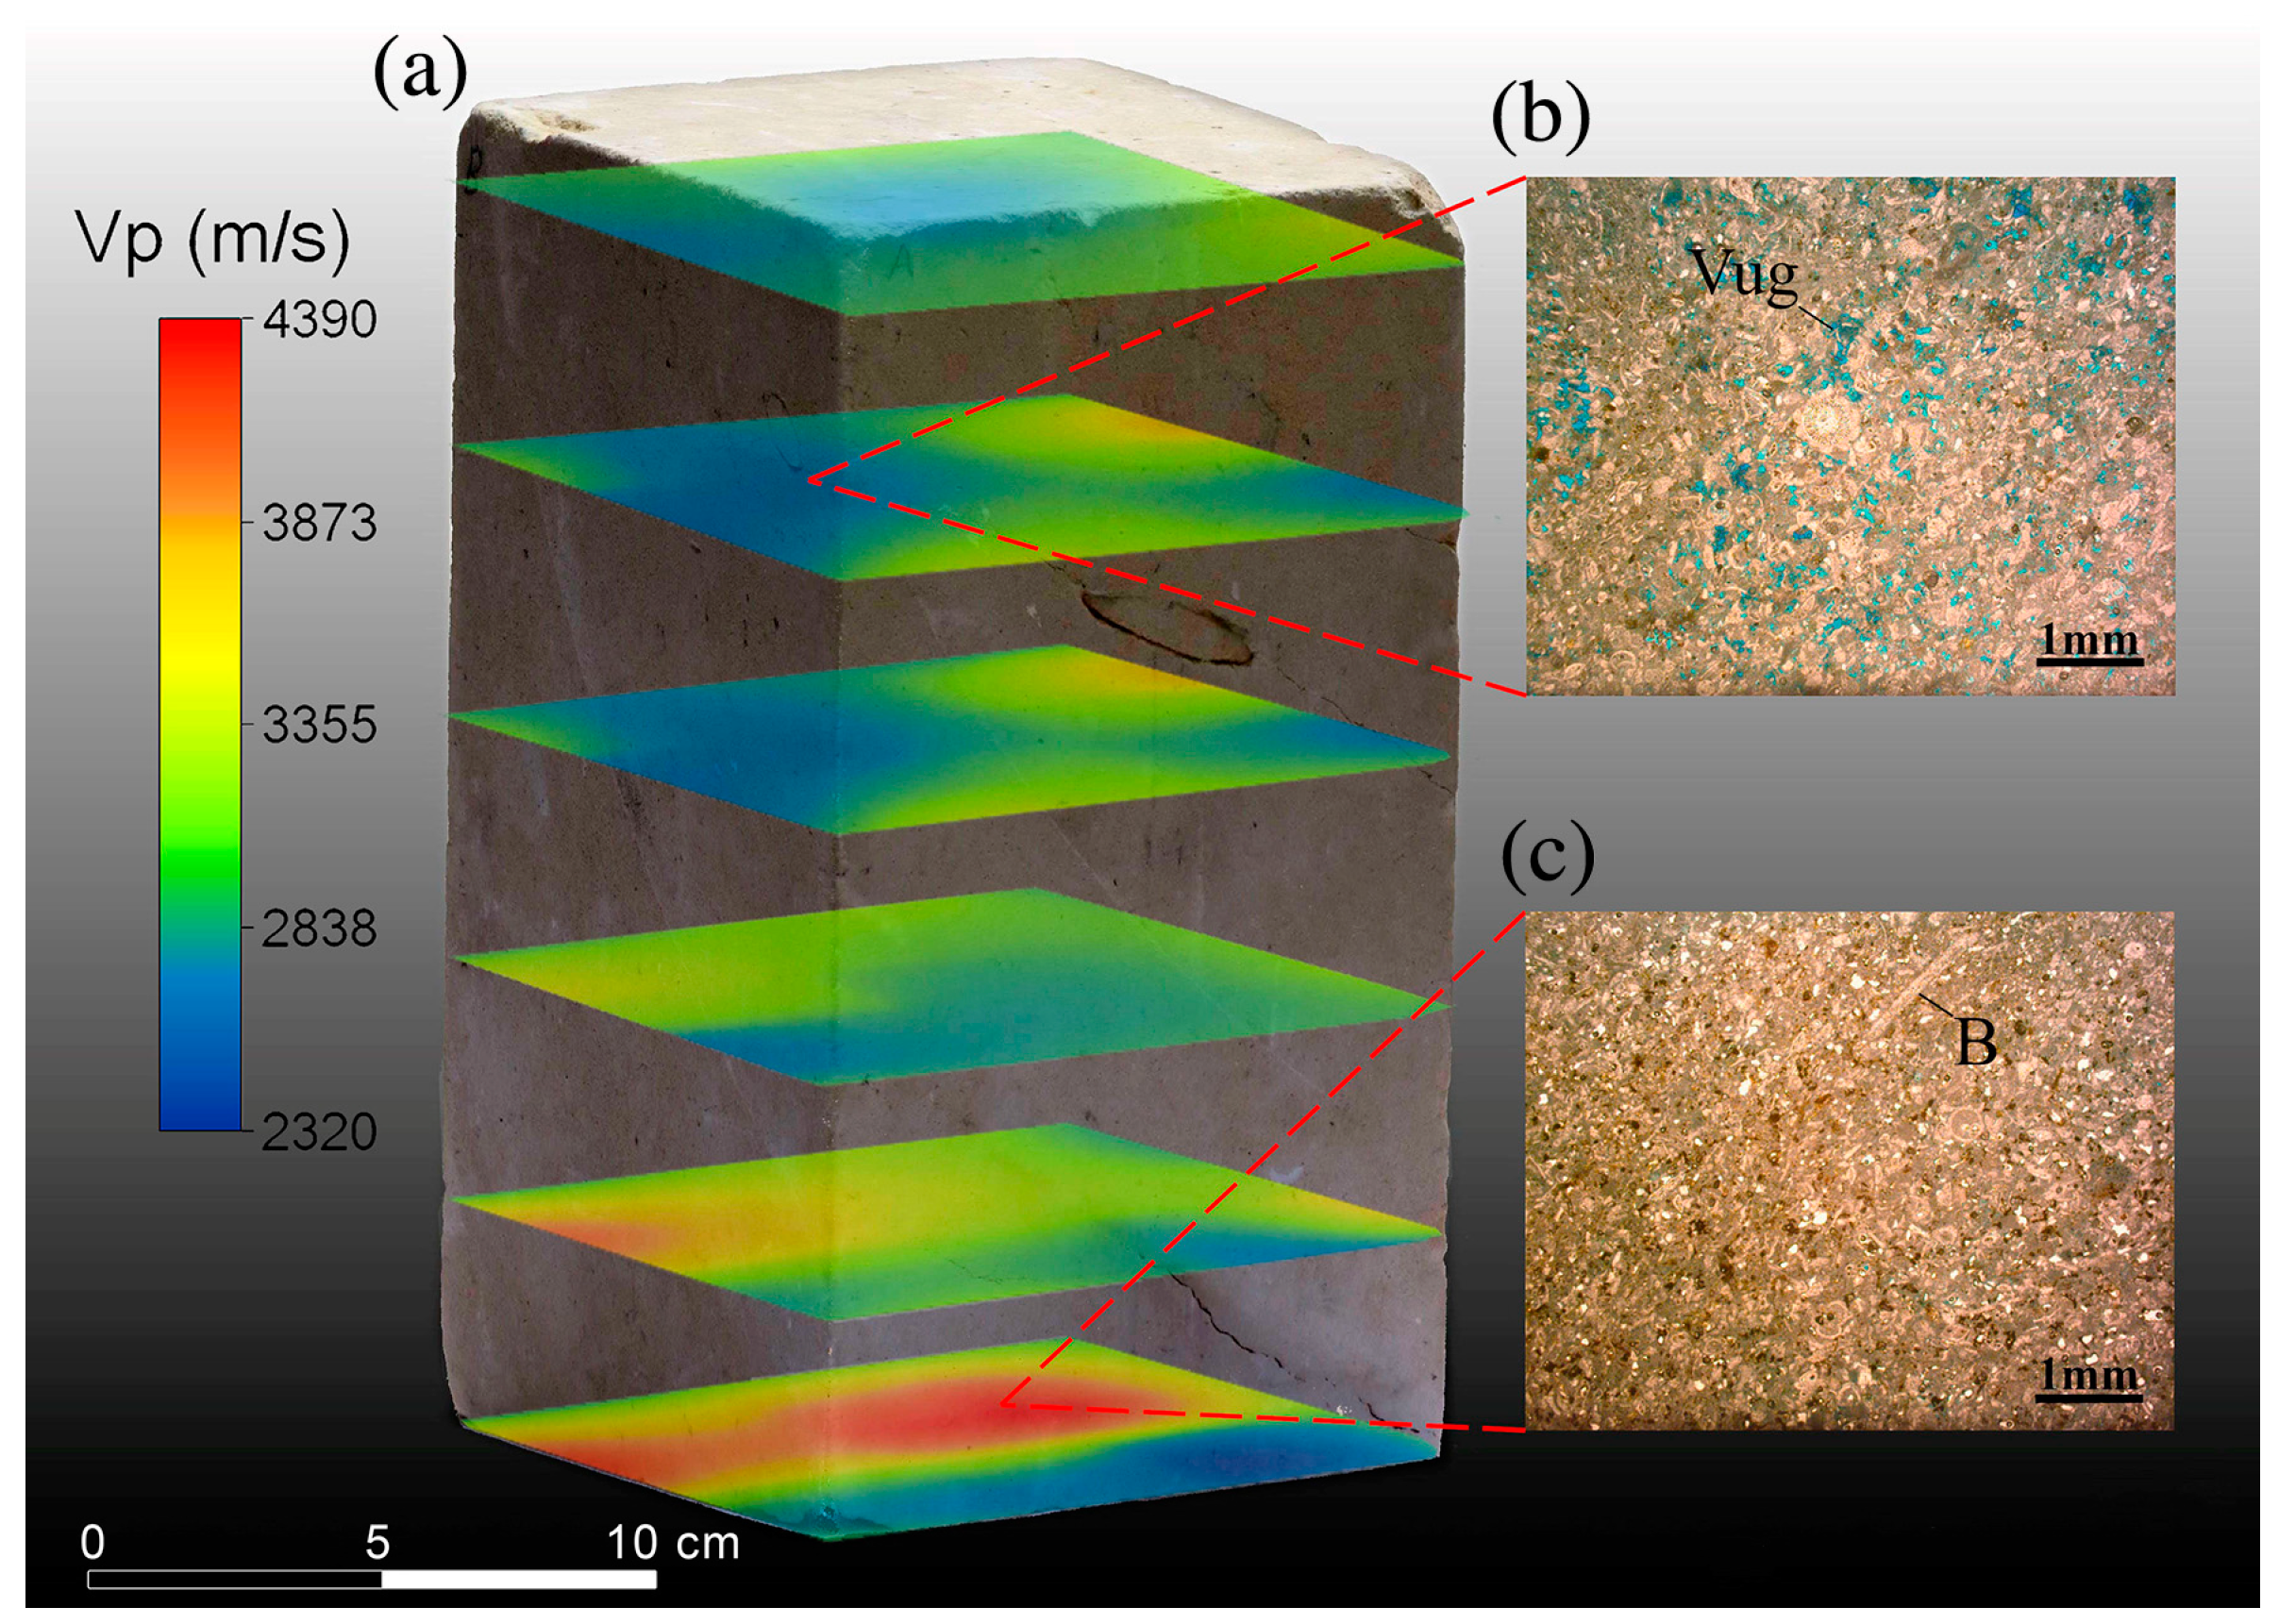
3.1. Thin Section Analysis
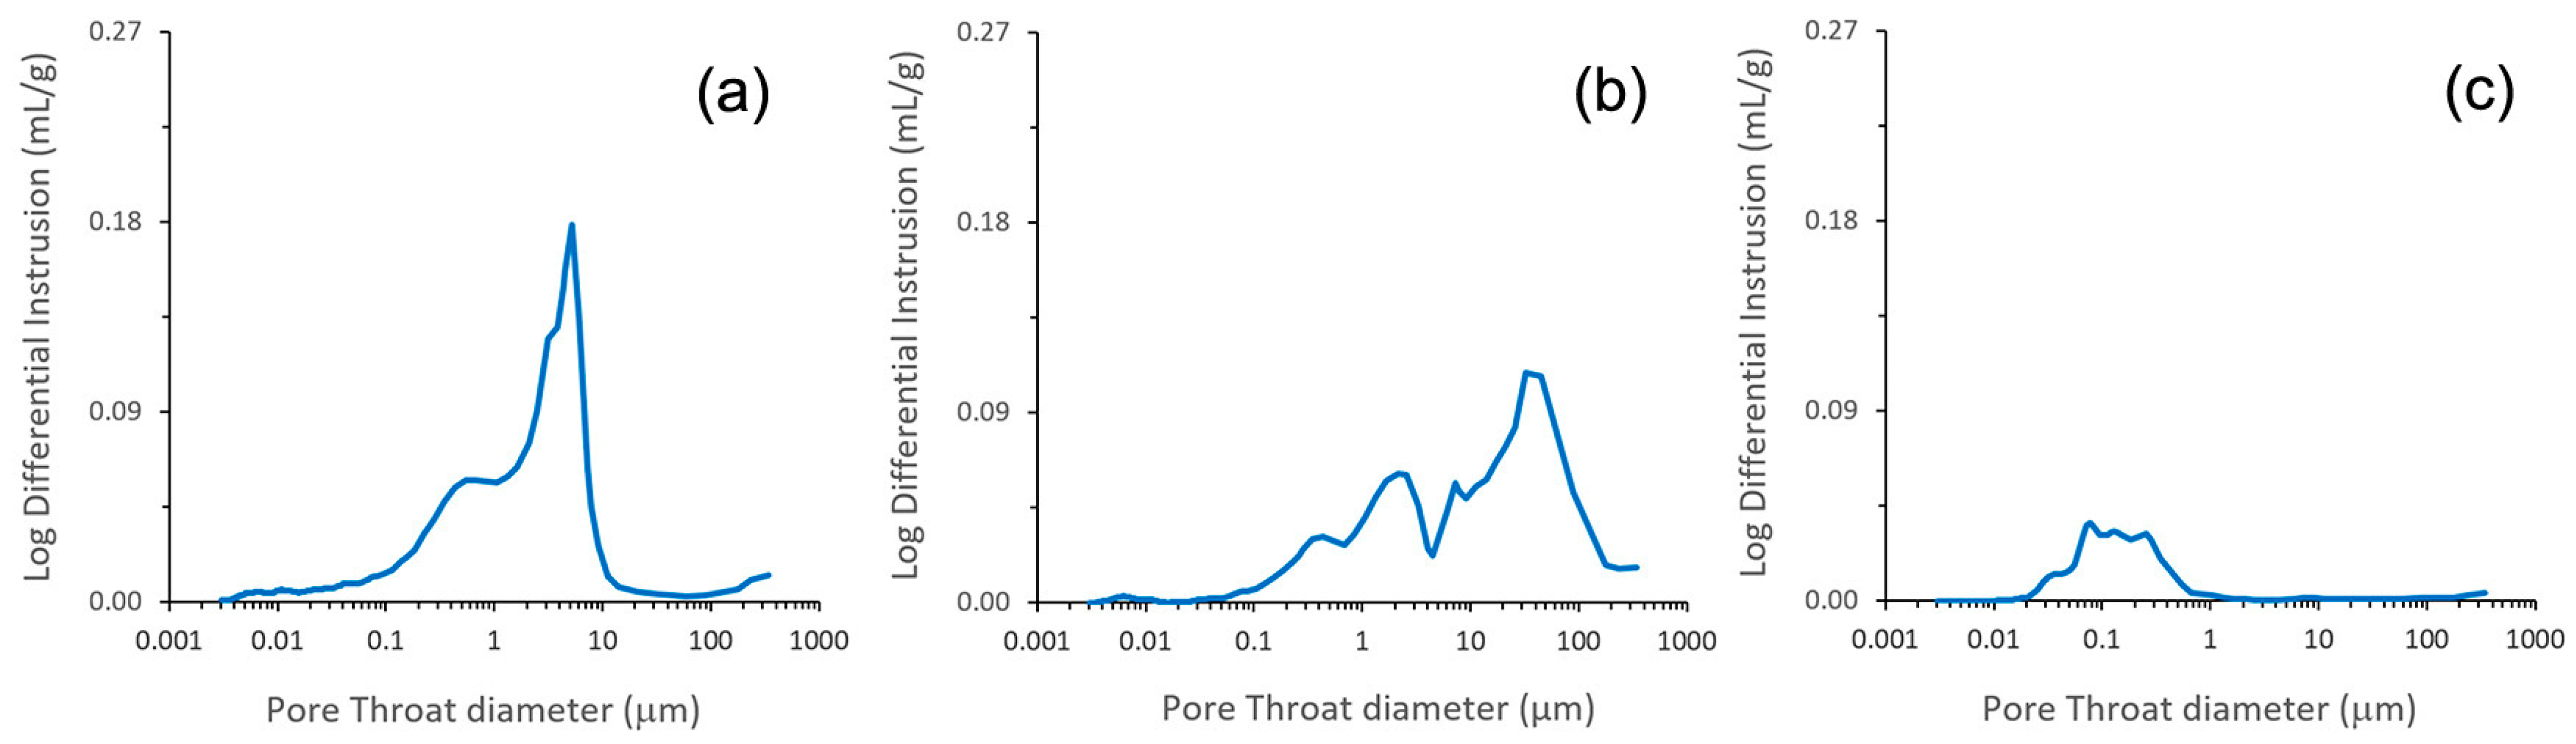
3.2. MIP Analyses
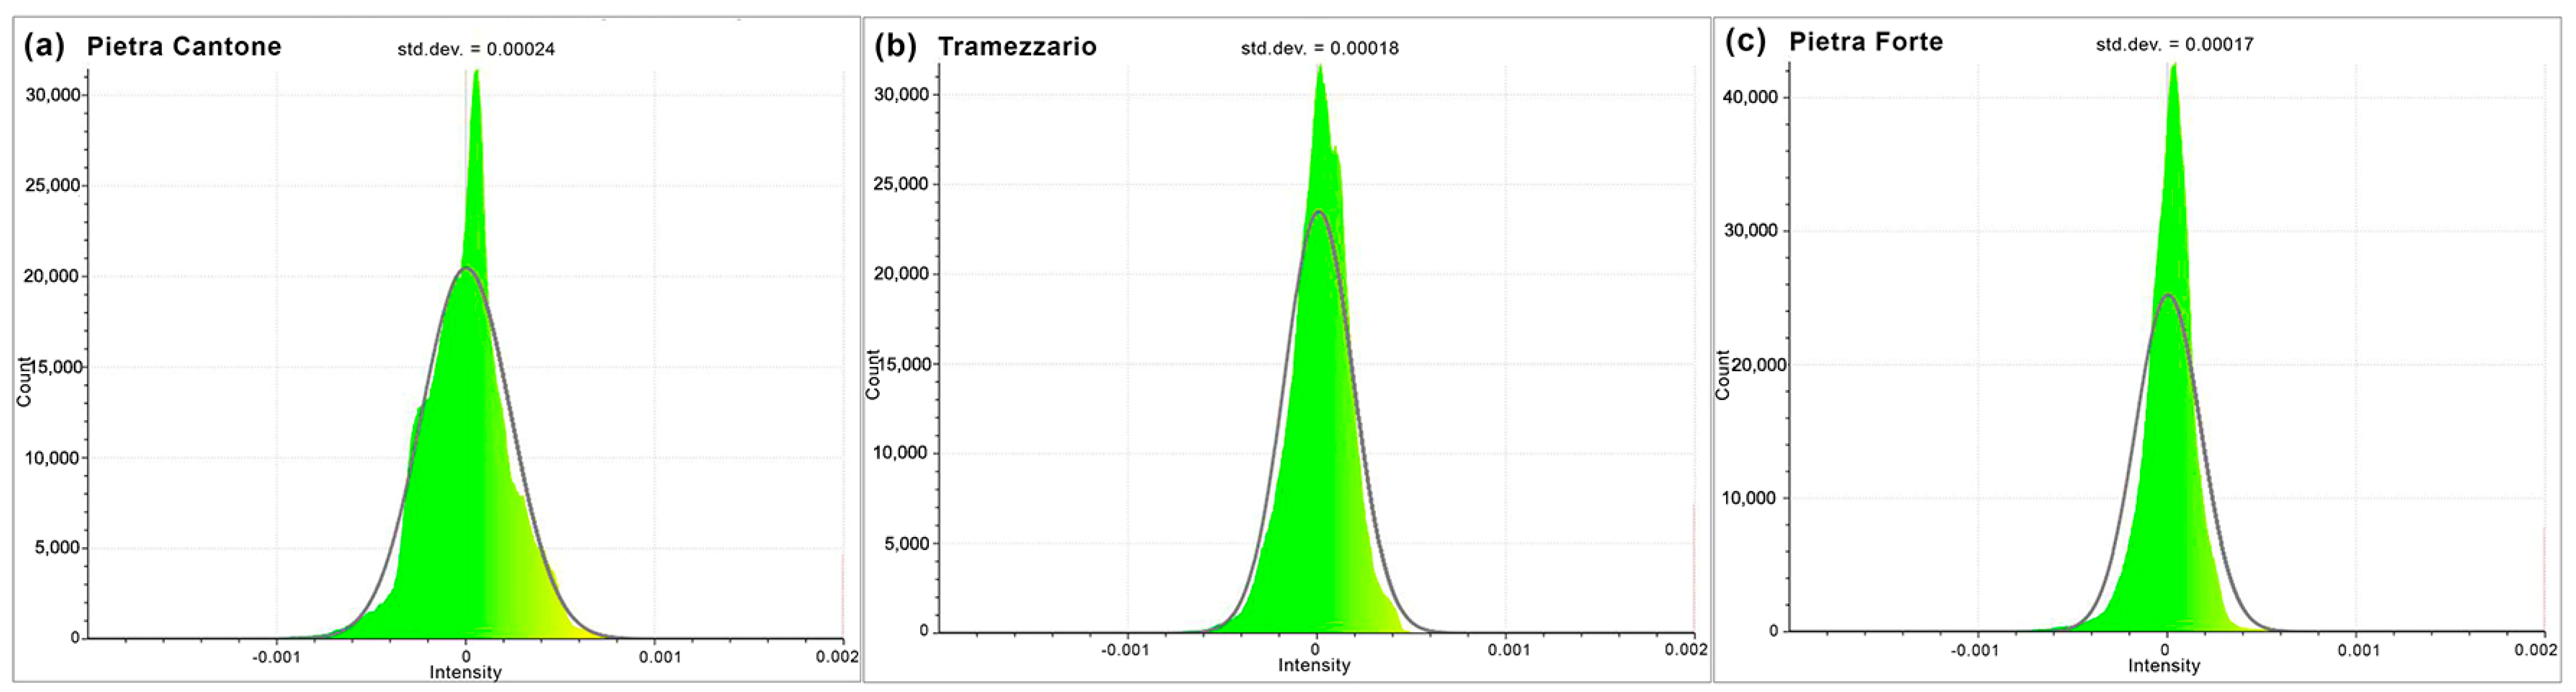
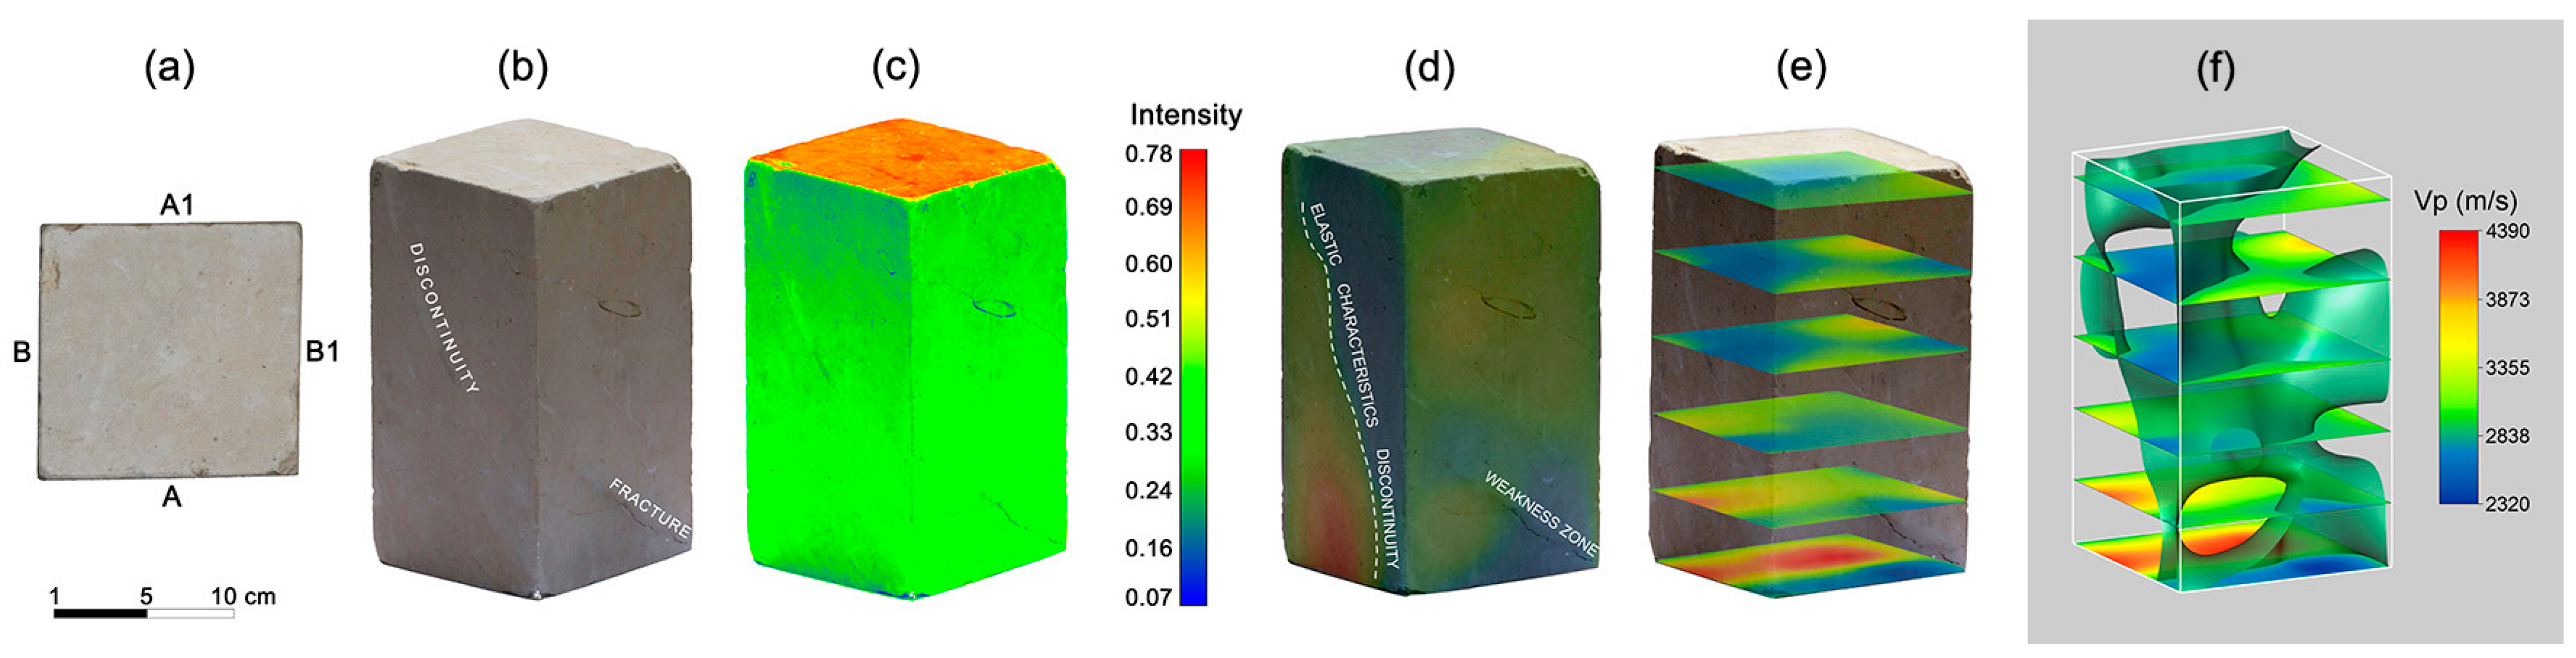
3.3. CRP
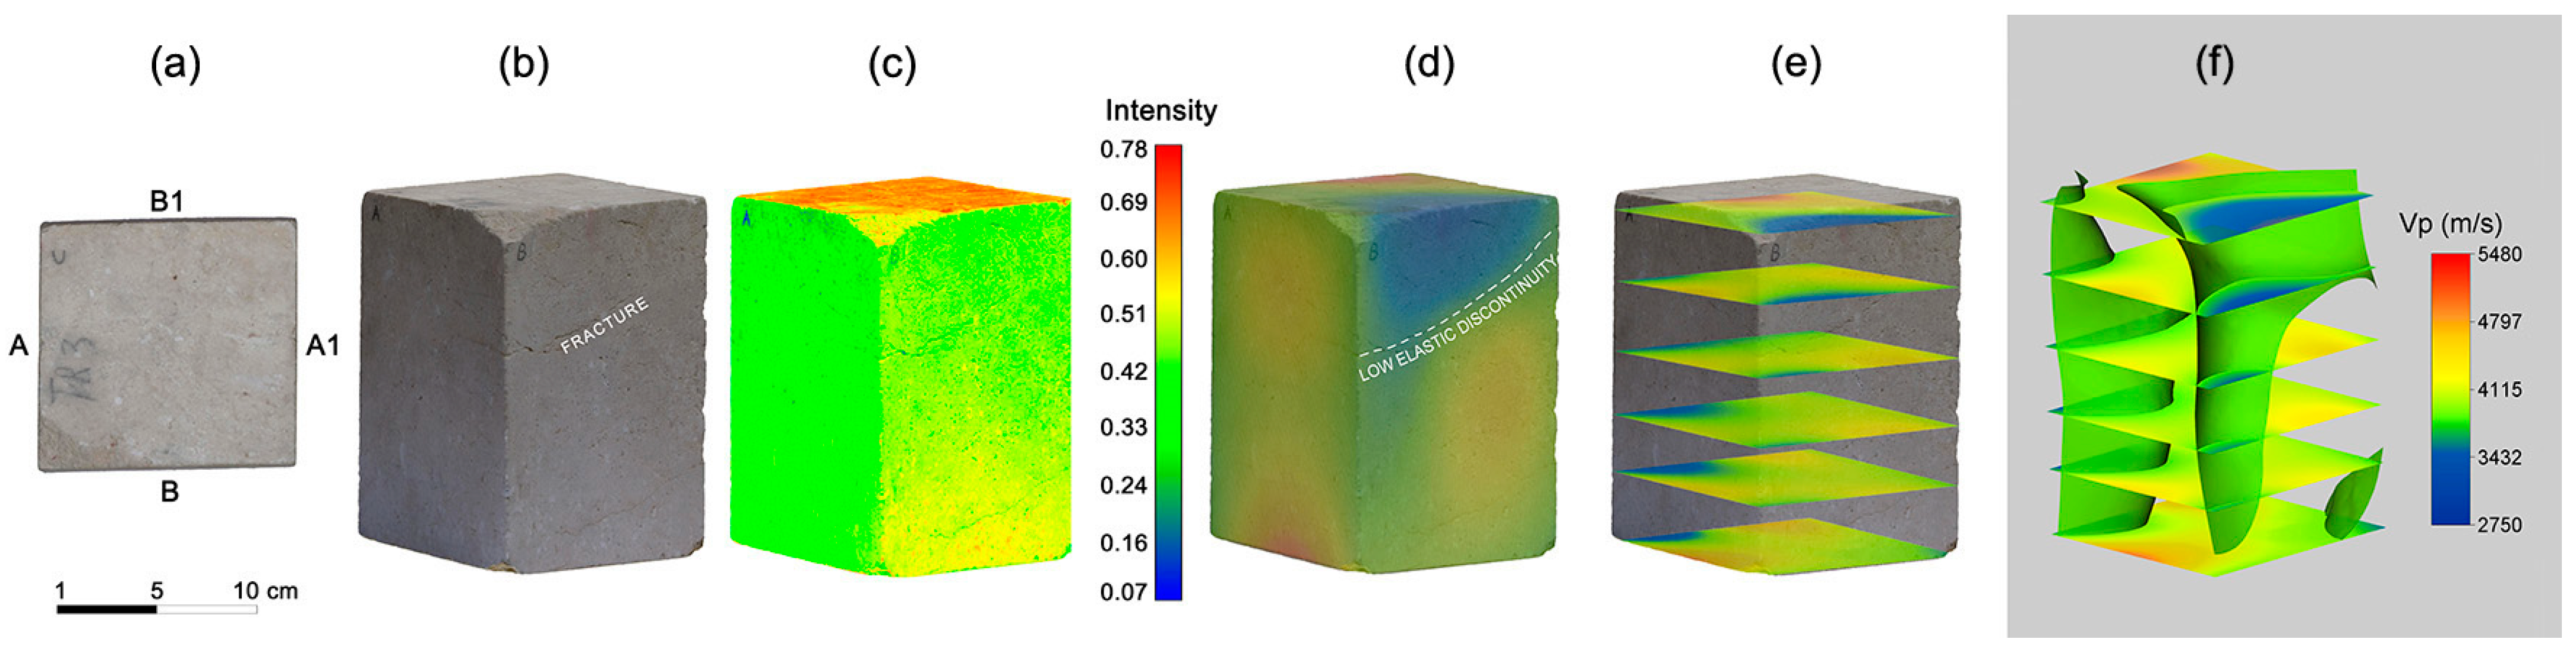
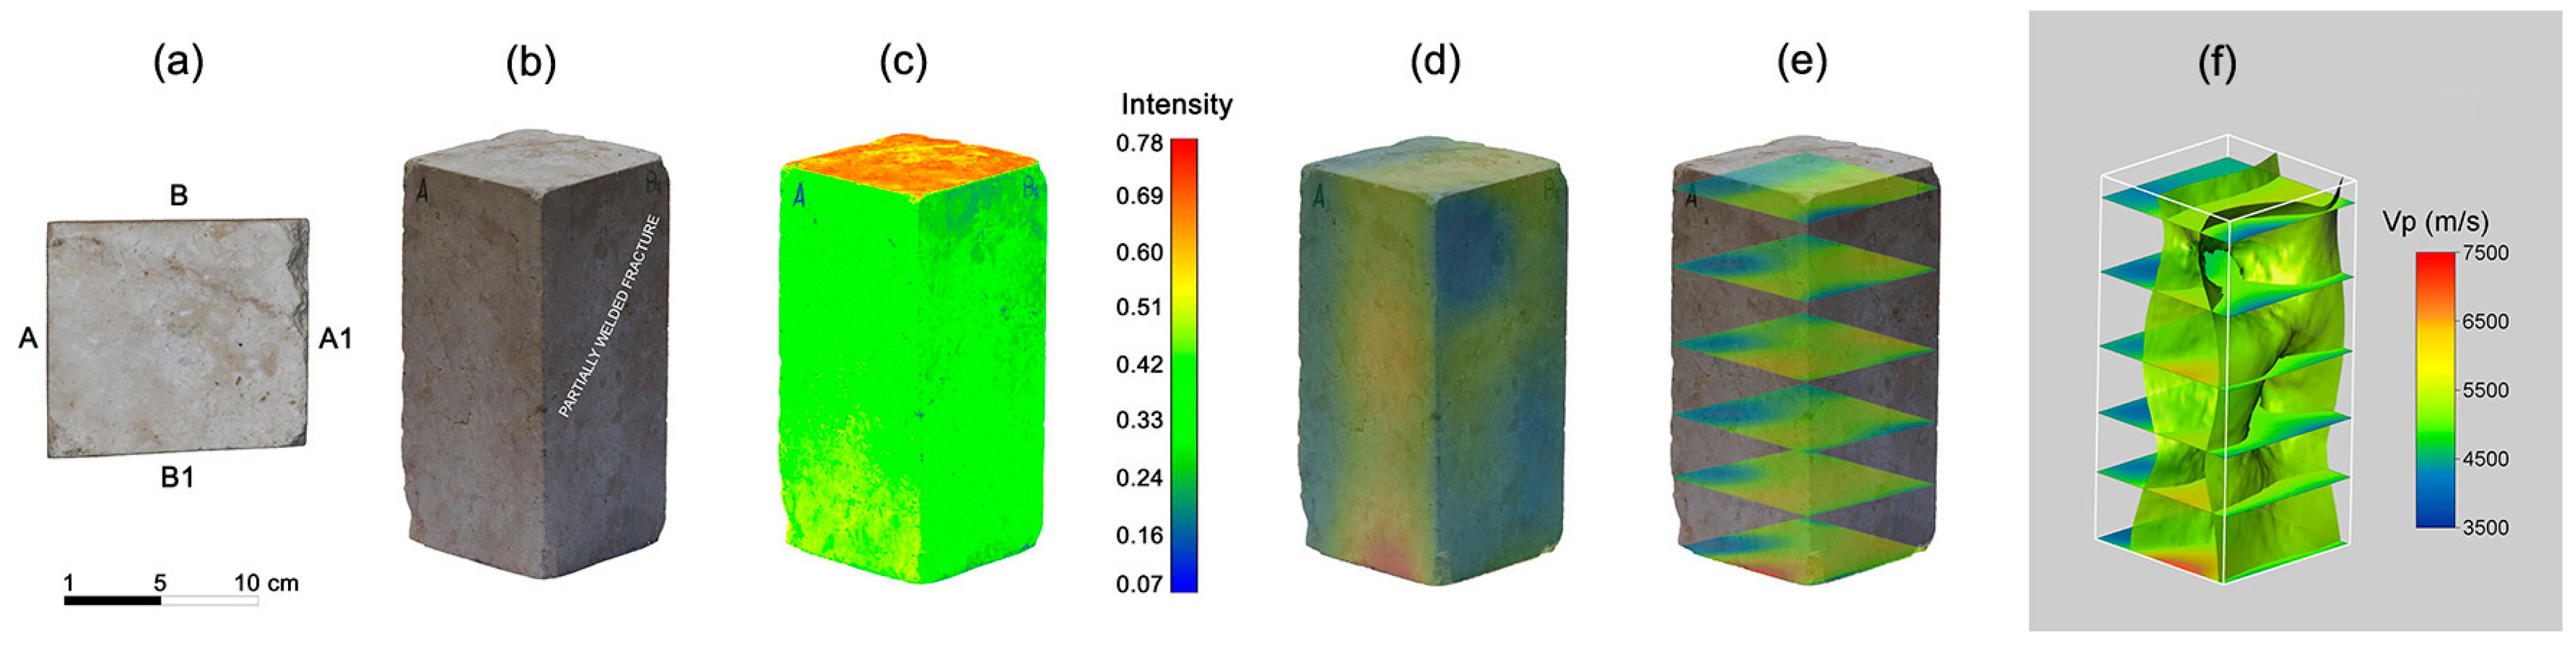
3.4. Ultrasonic Tomography

4. Concluding Remarks
Author Contributions
Funding
Data Availability Statement
Conflicts of Interest
References
- Bianco, L. Geochemistry, Mineralogy and Textural Properties of the Lower Globigerina Limestone Used in the Built Heritage. Minerals 2021, 11, 740. [Google Scholar] [CrossRef]
- Dionísio, A.; Martinho, E.; Grangeia, C.; Almeida, F. Examples of the Use of Non-Invasive Techniques for the Evaluation of Stone Decay in Portugal. Key Eng. Mater. 2013, 548, 239–246. [Google Scholar] [CrossRef]
- Lisci, C.; Galhano, C.; Simão, J.; Pires, V.; Sitzia, F.; Mirão, J. Hydrophobic Coatings’ Efficiency and Limestones’ Resistance to Salt Crystallisation. Sustainability 2024, 16, 816. [Google Scholar] [CrossRef]
- Proietti, N.; Calicchia, P.; Colao, F.; De Simone, S.; Di Tullio, V.; Luvidi, L.; Prestileo, F.; Romani, M.; Tatì, A. Moisture Damage in Ancient Masonry: A Multidisciplinary Approach for In Situ Diagnostics. Minerals 2021, 11, 406. [Google Scholar] [CrossRef]
- Roussel, E.; Vautier, F.; Voldoire, O.; André, M.-F.; Cassar, J.; Fronteau, G.; Phalip, B.; Thomachot-Schneider, C.; Toumazet, J.-P. Quantifying 450 Years of Limestone Weathering Induced by Salt Crystallization on Fortifications in Malta and Gozo. Geomorphology 2021, 378, 107614. [Google Scholar] [CrossRef]
- Sitzia, F.; Lisci, C.; Mirão, J. Building Pathology and Environment: Weathering and Decay of Stone Construction Materials Subjected to a Csa Mediterranean Climate Laboratory Simulation. Constr. Build. Mater. 2021, 300, 124311. [Google Scholar] [CrossRef]
- Aly, N.; Wangler, T.; Török, Á. The Effect of Stylolites on the Deterioration of Limestone: Possible Mechanisms of Damage Evolution. Environ. Earth Sci. 2018, 77, 565. [Google Scholar] [CrossRef]
- Cantrell, D.L.; Hagerty, R.M. Microporosity in Arab Formation Carbonates, Saudi Arabia. GeoArabia 1999, 4, 129–154. [Google Scholar] [CrossRef]
- Fais, S.; Casula, G.; Cuccuru, F.; Ligas, P.; Bianchi, M.G.; Plaisant, A.; Pettinau, A. A Contribution to the Geological Characterization of a Potential Caprock-Reservoir System in the Sulcis Coal Basin (South-Western Sardinia). Energies 2019, 12, 4524. [Google Scholar] [CrossRef]
- Patzek, T.W.; Saad, A.M.; Hassan, A. Multimodal Carbonates: Distribution of Oil Saturation in the Microporous Regions of Arab Formations. Energies 2022, 15, 1243. [Google Scholar] [CrossRef]
- Vázquez, M.A.; Galán, E.; Ortiz, P.; Ortiz, R. Digital Image Analysis and EDX SEM as Combined Techniques to Evaluate Salt Damp on Walls. Constr. Build. Mater. 2013, 45, 95–105. [Google Scholar] [CrossRef]
- Christaras, B.; Auger, F.; Mosse, E. Determination of the Moduli of Elasticity of Rocks. Comparison of the Ultrasonic Velocity and Mechanical Resonance Frequency Methods with Direct Static Methods. Mater. Struct. 1994, 27, 222–228. [Google Scholar] [CrossRef]
- Christaras, B. Non Destructive Methods for Investigation of Some Mechanical Properties of Natural Stones in the Protection of Monuments. Bull. Int. Assoc. Eng. Geol. 1996, 54, 59–63. [Google Scholar] [CrossRef]
- Hrdina, M.; Surový, P. Internal Tree Trunk Decay Detection Using Close-Range Remote Sensing Data and the PointNet Deep Learning Method. Remote Sens. 2023, 15, 5712. [Google Scholar] [CrossRef]
- Puxeddu, M.; Cuccuru, F.; Fais, S.; Casula, G.; Bianchi, M.G. 3D Imaging of CRP and Ultrasonic Tomography to Detect Decay in a Living Adult Holm Oak (Quercus ilex L.) in Sardinia (Italy). Appl. Sci. 2021, 11, 1199. [Google Scholar] [CrossRef]
- Bianchi, M.G.; Casula, G.; Cuccuru, F.; Fais, S.; Ligas, P.; Ferrara, C. Three-Dimensional Imaging from Laser Scanner, Photogrammetric and Acoustic Non-Destructive Techniques in the Characterization of Stone Building Materials. Adv. Geosci. 2018, 45, 57–62. [Google Scholar] [CrossRef]
- Cara, S.; Valera, P.; Matzuzzi, C. Morphometric Analysis through 3D Modelling of Bronze Age Stone Moulds from Central Sardinia. Minerals 2021, 11, 1192. [Google Scholar] [CrossRef]
- Casula, G.; Fais, S.; Cuccuru, F.; Bianchi, M.G.; Ligas, P. Diagnostic Process of an Ancient Colonnade Using 3D High-Resolution Models with Non-Invasive Multi Techniques. Sensors 2023, 23, 3098. [Google Scholar] [CrossRef] [PubMed]
- Christaras, B.; Cuccuru, F.; Fais, S.; Papanikolaou, H. Application of Non Destructive Ultrasonic Techniques for the Analysis of the Conservation Status of Building Materials in Monumental Structures. In Engineering Geology for Society and Territory-Volume 8; Springer: Basel, Switzerland, 2015; Volume 8, pp. 139–143. ISBN 978-3-319-09408-3. [Google Scholar]
- De Fino, M.; Galantucci, R.A.; Fatiguso, F. Condition Assessment of Heritage Buildings via Photogrammetry: A Scoping Review from the Perspective of Decision Makers. Heritage 2023, 6, 7031–7067. [Google Scholar] [CrossRef]
- Dionísio, A.; Martinho, E.; Pozo-António, J.S.; Sequeira Braga, M.A.; Mendes, M. Evaluation of Combined Effects of Real-Fire and Natural Environment in a Building Granite. Constr. Build. Mater. 2021, 277, 122327. [Google Scholar] [CrossRef]
- Fais, S.; Casula, G.; Cuccuru, F.; Ligas, P.; Bianchi, M.G. An Innovative Methodology for the Non-Destructive Diagnosis of Architectural Elements of Ancient Historical Buildings. Sci. Rep. 2018, 8, 4334. [Google Scholar] [CrossRef] [PubMed]
- Brunke, O.; Brockdorf, K.; Drews, S.; Müller, B.; Donath, T.; Herzen, J.; Beckmann, F. Comparison between X-Ray Tube-Based and Synchrotron Radiation-Based μCT. In Proceedings of the Developments in X-ray Tomography VI, San Diego, CA, USA, 10–14 August 2008; Volume 7078, p. 70780U. [Google Scholar]
- Kaufhold, A.; Halisch, M.; Zacher, G.; Kaufhold, S. X-Ray Computed Tomography Investigation of Structures in Opalinus Clay from Large-Scale to Small-Scale after Mechanical Testing. Solid Earth 2016, 7, 1171–1183. [Google Scholar] [CrossRef]
- Wolański, K.; Zarudzki, W.; Kiersnowski, H.; Dohnalik, M.; Drabik, K.; Urbaniec, A.; Skupio, R. X-Ray Computed Tomography (CT) Applied for Rock Core Analysis. Bull. Russ. Acad. Nat. Sci. 2017, 5, 43–50. [Google Scholar]
- Omori, T.; Suzuki, S.; Michibayashi, K.; Okamoto, A. Super-Resolution of X-Ray CT Images of Rock Samples by Sparse Representation: Applications to the Complex Texture of Serpentinite. Sci. Rep. 2023, 13, 6648. [Google Scholar] [CrossRef] [PubMed]
- Albertin, F.; Bettuzzi, M.; Brancaccio, R.; Morigi, M.P.; Casali, F. X-ray Computed Tomography In Situ: An Opportunity for Museums and Restoration Laboratories. Heritage 2019, 2, 2028–2038. [Google Scholar] [CrossRef]
- Albertin, F.; Morigi, M.P.; Bettuzzi, M.; Brancaccio, R.; Macchioni, N.; Saccuman, R.; Quarta, G.; Calcagnile, L.; Picchi, D. X-ray Tomography Unveils the Construction Technique of Un-Montu’s Egyptian Coffin (Early 26th Dynasty). J. Imaging 2022, 8, 39. [Google Scholar] [CrossRef]
- Ashi, J. 11. Computed Tomography Scan Image Analysis of Sediments1. In Proceedings of the Ocean Drilling Program, Scientific Results; Texas A & M University: College Station, TX, USA, 1997; Volume 156, pp. 151–158. [Google Scholar]
- Ujiie, K.; Maltman, A.J.; Sánchez-Gómez, M. Origin of Deformation Bands in Argillaceous Sediments at the Toe of the Nankai Accretionary Prism, Southwest Japan. J. Struct. Geol. 2004, 26, 221–231. [Google Scholar] [CrossRef]
- Tonai, S.; Kubo, Y.; Tsang, M.-Y.; Bowden, S.; Ide, K.; Hirose, T.; Kamiya, N.; Yamamoto, Y.; Yang, K.; Yamada, Y.; et al. A New Method for Quality Control of Geological Cores by X-Ray Computed Tomography: Application in IODP Expedition 370. Front. Earth Sci. 2019, 7, 117. [Google Scholar] [CrossRef]
- Martino, D.D.; Bellanova, M.; Cippo, E.P.; Felicetti, R.; Scherillo, A.; Kelleher, J.; Kis, Z.; Gorini, G. A Neutron Diffraction and Imaging Study of Ancient Iron Tie Rods. J. Instrum. 2018, 13, C05009. [Google Scholar] [CrossRef]
- Mongy, T. Application of Neutron Tomography in Culture Heritage Research. Appl. Radiat. Isot. 2014, 85, 54–59. [Google Scholar] [CrossRef]
- Bakirov, B.; Saprykina, I.; Kichanov, S.; Mimokhod, R.; Sudarev, N.; Kozlenko, D. Phase Composition and Its Spatial Distribution in Antique Copper Coins: Neutron Tomography and Diffraction Studies. J. Imaging 2021, 7, 129. [Google Scholar] [CrossRef]
- Snavely, N.; Seitz, S.M.; Szeliski, R. Modeling the World from Internet Photo Collections. Int. J. Comput. Vis. 2008, 80, 189–210. [Google Scholar] [CrossRef]
- Westoby, M.J.; Brasington, J.; Glasser, N.F.; Hambrey, M.J.; Reynolds, J.M. ‘Structure-from-Motion’ Photogrammetry: A Low-Cost, Effective Tool for Geoscience Applications. Geomorphology 2012, 179, 300–314. [Google Scholar] [CrossRef]
- Adamopoulos, E.; Rinaudo, F. Close-Range Sensing and Data Fusion for Built Heritage Inspection and Monitoring—A Review. Remote Sens. 2021, 13, 3936. [Google Scholar] [CrossRef]
- Mestre-Runge, C.; Lorenzo-Lacruz, J.; Ortega-Mclear, A.; Garcia, C. An Optimized Workflow for Digital Surface Model Series Generation Based on Historical Aerial Images: Testing and Quality Assessment in the Beach-Dune System of Sa Ràpita-Es Trenc (Mallorca, Spain). Remote Sens. 2023, 15, 2044. [Google Scholar] [CrossRef]
- Angelini, A.; Cozzolino, M.; Gabrielli, R.; Gentile, V.; Mauriello, P. Three-Dimensional Modeling and Non-Invasive Diagnosis of a Huge and Complex Heritage Building: The Patriarchal Basilica of Santa Maria Assunta in Aquileia (Udine, Italy). Remote Sens. 2023, 15, 2386. [Google Scholar] [CrossRef]
- Assefa, S.; McCann, C.; Sothcott, J. Velocities of Compressional and Shear Waves in Limestones. Geophys. Prospect. 2003, 51, 1–13. [Google Scholar] [CrossRef]
- Al-Dousari, M.; Garrouch, A.A.; Al-Omair, O. Investigating the Dependence of Shear Wave Velocity on Petrophysical Parameters. J. Pet. Sci. Eng. 2016, 146, 286–296. [Google Scholar] [CrossRef]
- Casula, G.; Fais, S.; Cuccuru, F.; Bianchi, M.G.; Ligas, P.; Sitzia, A. Decay Detection in an Ancient Column with Combined Close-Range Photogrammetry (CRP) and Ultrasonic Tomography. Minerals 2021, 11, 1114. [Google Scholar] [CrossRef]
- Kahraman, S.; Yeken, T. Determination of Physical Properties of Carbonate Rocks from P-Wave Velocity. Bull. Eng. Geol. Environ. 2008, 67, 277–281. [Google Scholar] [CrossRef]
- Kassab, M.A.; Weller, A. Study on P-Wave and S-Wave Velocity in Dry and Wet Sandstones of Tushka Region, Egypt. Egypt. J. Pet. 2015, 24, 1–11. [Google Scholar] [CrossRef]
- Pappalardo, G.; Mineo, S. Microstructural Controls on Physical and Mechanical Properties of Dolomite Rocks. Rend. Online Della Soc. Geol. Ital. 2016, 41, 321–324. [Google Scholar] [CrossRef]
- Anselmetti, F.S.; Eberli, G.P. Sonic Velocity in Carbonate Sediments and Rocks. In Carbonate Seismology; Palaz, I., Marfurt, K.J., Eds.; Society of Exploration Geophysicists: Tulsa, OK, USA, 1997; pp. 53–74. ISBN 978-1-56080-038-5. [Google Scholar]
- Eberli, G.P.; Baechle, G.T.; Anselmetti, F.S.; Incze, M.L. Factors Controlling Elastic Properties in Carbonate Sediments and Rocks. Lead. Edge 2003, 22, 654–660. [Google Scholar] [CrossRef]
- Fais, S.; Ligas, P.; Cuccuru, F.; Maggio, E.; Plaisant, A.; Pettinau, A.; Casula, G.; Bianchi, M.G. Detailed Petrophysical and Geophysical Characterization of Core Samples from the Potential Caprock-Reservoir System in the Sulcis Coal Basin (Southwestern Sardinia–Italy). Energy Procedia 2015, 76, 503–511. [Google Scholar] [CrossRef]
- Fais, S.; Cuccuru, F.; Casula, G.; Bianchi, M.G.; Ligas, P. Characterization of Rock Samples by A High-Resolution Multi-Technique Non-Invasive Approach. Minerals 2019, 9, 664. [Google Scholar] [CrossRef]
- Soete, J.; Kleipool, L.M.; Claes, H.; Claes, S.; Hamaekers, H.; Kele, S.; Özkul, M.; Foubert, A.; Reijmer, J.J.G.; Swennen, R. Acoustic Properties in Travertines and Their Relation to Porosity and Pore Types. Mar. Pet. Geol. 2015, 59, 320–335. [Google Scholar] [CrossRef]
- Weger, R.J.; Baechle, G.T.; Masaferro, J.L.; Eberli, G.P. Effects of Porestructure on Sonic Velocity in Carbonates. In Proceedings of the 2004 SEG Annual Meeting, Denver, CO, USA, 10–15 October 2004; pp. 1774–1777. [Google Scholar]
- Cherchi, A. Appunti Biostratigrafici Sul Miocene Della Sardegna (Italia). Mém. BRGM 1974, 78, 433–445. [Google Scholar]
- Gandolfi, R.; Porcu, A. Contributo Alla Conoscenza Delle Microfacies Mioceniche Delle Colline Di Cagliari (Sardegna). Riv. Ital. Paleontol. Stratigr. 1967, 73, 313–348. [Google Scholar]
- Leone, F.; Pontillo, C.; Spano, C.; Carmignani, L.; Sassi, F.P. Benthic Paleocommunities of the Middle–Upper Miocene Lithostratigraphic Units from the Cagliari Hills (Southern Sardinia, Italy). In Contribution to the Geology of Italy with Special Regard to the Paleozoic Basement. A Volume Dedicated to Tommaso Cocozza IGCP Project N° 276, Newsletter 5; Carmignani, L., Sassi, F.P., Eds.; Pacini: Siena, Italy, 1992; Volume 5, pp. 151–158. [Google Scholar]
- Cherchi, A.P. Micropaleontological Researches in Sardinia: Guidebook; Agip: Milano, Italy, 1985. [Google Scholar]
- Barca, S.; Melis, E.; Annino, E.; Cincotti, F.; Ulzega, A.; Orrù, P.; Pintus, C. Note Illustrative Della Carta Geologica d’Italia Alla Scala 1: 50.000, Foglio 557, Cagliari. Serv. Geol. D’Italia Carta Geol. D’Italia ISPRA. 2005, 1, 240. [Google Scholar] [CrossRef]
- Cuccuru, F.; Fais, S.; Ligas, P. Dynamic Elastic Characterization of Carbonate Rocks Used as Building Materials in the Historical City Centre of Cagliari (Italy). Q. J. Eng. Geol. Hydrogeol. 2014, 47, 259–266. [Google Scholar] [CrossRef]
- Étienne, J. Technique d’imprégnation de Roches Par Des Résines Colorées Pour l’étude de La Porosité En Lame Mince. Rev. L’Institut Fr. Pet. Ann. Combust. Liq. 1963, 18, 611–619. [Google Scholar]
- Lønøy, A. Making Sense of Carbonate Pore Systems. AAPG Bull. 2006, 90, 1381–1405. [Google Scholar] [CrossRef]
- Katz, A.J.; Thompson, A.H. Quantitative Prediction of Permeability in Porous Rock. Phys. Rev. B 1986, 34, 8179–8181. [Google Scholar] [CrossRef] [PubMed]
- Katz, A.J.; Thompson, A.H. Prediction of Rock Electrical Conductivity from Mercury Injection Measurements. J. Geophys. Res. 1987, 92, 599. [Google Scholar] [CrossRef]
- Hager, J. Steam Drying of Porous Media. Ph.D. Thesis, Department of Chemical Engineering, Lund University, Lund, Sweden, 1998. [Google Scholar]
- Semyonov, D. Agisoft Metashape Manual, LLC. St. Petersburg, Russia. Available online: https://www.agisoft.com/pdf/metashape_2_0_en.pdf (accessed on 27 February 2024).
- ISRM. The Complete ISRM Suggested Methods for Rock Characterization, Testing and Monitoring: 1974–2006. In Suggested Methods Prepared by the Commission on Testing Methods; Ulusay, R., Hodson, J.A., Eds.; International Society for Rock Mechanics; ISRM Turkish National Group: Ankara, Turkey, 2007; p. 628. ISBN 975-93675-4-8. [Google Scholar]
- ISRM. Upgraded ISRM Suggested Method for Determining Sound Velocity by Ultrasonic Pulse Transmission Technique. In Testing and Monitoring: 2007–2014; Ulusay, R., Ed.; ISRM: Cham, Switzerland; Heidelberg, Germany; New York, NY, USA; Dordrecht, The Netherlands; London, UK, 2014; pp. 95–99. [Google Scholar]
- Casula, G.; Cuccuru, F.; Bianchi, M.G.; Fais, S.; Ligas, P. High Resolution 3-D Modelling of Cylinder Shape Bodies Applied to Ancient Columns of a Church. Adv. Geosci. 2020, 54, 119–127. [Google Scholar] [CrossRef]
- Trampert, J.; Leveque, J.-J. Simultaneous Iterative Reconstruction Technique: Physical Interpretation Based on the Generalized Least Squares Solution. J. Geophys. Res. 1990, 95, 12553–12559. [Google Scholar] [CrossRef]
- Mendes, M. A Hybrid Fast Algorithm for First Arrivals Tomography. Geophys. Prospect. 2009, 57, 803–809. [Google Scholar] [CrossRef]
- Fais, S.; Casula, G. Application of Acoustic Techniques in the Evaluation of Heterogeneous Building Materials. NDT E Int. 2010, 43, 62–69. [Google Scholar] [CrossRef]
- Lucia, F.J. Rock-Fabric/Petrophysical Classification of Carbonate Pore Space for Reservoir Characterization. AAPG Bull. 1995, 79, 1275–1300. [Google Scholar] [CrossRef]
- Dunham, R.J. Classification of Carbonate Rocks According to Depositional Textures. Am. Assoc. Pet. Geol. 1962, 1, 108–121. [Google Scholar]
- Choquette, P.W.; Pray, L.C. Geologic Nomenclature and Classification of Porosity in Sedimentary Carbonates. Am. Assoc. Pet. Geol. Bull. 1970, 54, 207–250. [Google Scholar]
- Fais, S.; Cuccuru, F.; Ligas, P.; Casula, G.; Bianchi, M.G. Integrated Ultrasonic, Laser Scanning and Petrographical Characterisation of Carbonate Building Materials on an Architectural Structure of a Historic Building. Bull. Eng. Geol. Environ. 2017, 76, 71–84. [Google Scholar] [CrossRef]
- Elkhrachy, I. 3D Structure from 2D Dimensional Images Using Structure from Motion Algorithms. Sustainability 2022, 14, 5399. [Google Scholar] [CrossRef]
- Garia, S.; Pal, A.K.; Ravi, K.; Nair, A.M. A Comprehensive Analysis on the Relationships between Elastic Wave Velocities and Petrophysical Properties of Sedimentary Rocks Based on Laboratory Measurements. J. Pet. Explor. Prod. Technol. 2019, 9, 1869–1881. [Google Scholar] [CrossRef]
- Verwer, K.; Braaksma, H.; Kenter, J.A. Acoustic Properties of Carbonates: Effects of Rock Texture and Implications for Fluid Substitution. Geophysics 2008, 73, B51–B65. [Google Scholar] [CrossRef]
- Casula, G.; Fais, S.; Ligas, P. An Experimental Application of a 3D Terrestrial Laser Scanner and Acoustic Techniques in Assessing the Quality of the Stones Used in Monumental Structures. Int. J. Microstruct. Mater. Prop. 2009, 4, 45. [Google Scholar] [CrossRef]


| Calcari di Cagliari | Sample | d50 (μm) | Bulk Density (g/cm3) | Skeletal Density (g/cm3) | Porosity (%) | Permeability (mD) | Tortuosity |
|---|---|---|---|---|---|---|---|
| Pietra Cantone | PC1 | 1.69 | 2.07 | 2.77 | 25.35 | 8.16 | 21.23 |
| PC2 | 8.85 | 1.62 | 2.65 | 38.71 | 215.10 | 5.34 | |
| PC3 | 1.03 | 1.89 | 2.66 | 28.86 | 0.37 | 16.01 | |
| PC4 | 1.78 | 1.89 | 2.72 | 30.41 | 9.16 | 20.20 | |
| PC5 | 2.45 | 1.91 | 2.68 | 28.72 | 10.93 | 23.25 | |
| Tramezzario | TR1 | 12.06 | 1.58 | 2.67 | 40.85 | 557.92 | 3.01 |
| TR2 | 3.06 | 2.33 | 2.69 | 13.40 | 26.02 | 3.73 | |
| TR3 | 10.67 | 1.99 | 2.71 | 26.61 | 506.42 | 4.45 | |
| TR4 | 17.58 | 2.09 | 2.73 | 23.25 | 702.28 | 3.90 | |
| TR5 | 14.70 | 1.89 | 2.75 | 31.00 | 1168.12 | 3.68 | |
| Pietra Forte | PF1 | 0.13 | 2.53 | 2.70 | 6.26 | 0.11 | 2.39 |
| PF2 | 0.20 | 2.46 | 2.71 | 9.24 | 0.12 | 6.55 | |
| PF3 | 0.15 | 2.46 | 2.70 | 8.74 | 0.11 | 6.21 | |
| PF4 | 16.13 | 2.51 | 2.69 | 6.66 | 1044.22 | 2.36 | |
| PF5 | 0.05 | 2.65 | 2.71 | 2.21 | 0.16 | 2.03 |
Disclaimer/Publisher’s Note: The statements, opinions and data contained in all publications are solely those of the individual author(s) and contributor(s) and not of MDPI and/or the editor(s). MDPI and/or the editor(s) disclaim responsibility for any injury to people or property resulting from any ideas, methods, instructions or products referred to in the content. |
© 2024 by the authors. Licensee MDPI, Basel, Switzerland. This article is an open access article distributed under the terms and conditions of the Creative Commons Attribution (CC BY) license (https://creativecommons.org/licenses/by/4.0/).
Share and Cite
Casula, G.; Fais, S.; Cuccuru, F.; Bianchi, M.G.; Ligas, P. An Integrated Petrographic, Geomatic and Geophysical Approach for the Characterization of the Carbonate Rocks of the Calcari di Cagliari Formation. Minerals 2024, 14, 501. https://doi.org/10.3390/min14050501
Casula G, Fais S, Cuccuru F, Bianchi MG, Ligas P. An Integrated Petrographic, Geomatic and Geophysical Approach for the Characterization of the Carbonate Rocks of the Calcari di Cagliari Formation. Minerals. 2024; 14(5):501. https://doi.org/10.3390/min14050501
Chicago/Turabian StyleCasula, Giuseppe, Silvana Fais, Francesco Cuccuru, Maria Giovanna Bianchi, and Paola Ligas. 2024. "An Integrated Petrographic, Geomatic and Geophysical Approach for the Characterization of the Carbonate Rocks of the Calcari di Cagliari Formation" Minerals 14, no. 5: 501. https://doi.org/10.3390/min14050501