
Fractal Evolution Characteristics of Isolation Layers in a Submarine Gold Mine: A Case Study

1
School of Resource and Safety Engineering, Central South University, Changsha 410083, China
2
Xinjiang Kalatongke Mining Co., Ltd., Altay 836500, China
3
Changsha Institute of Mining Research Co., Ltd., Changsha 410083, China
4
School of Resources, Environment and Safety Engineering, University of South China, Hengyang 421001, China
*
Author to whom correspondence should be addressed.
Minerals 2024, 14(2), 205; https://doi.org/10.3390/min14020205
Submission received: 16 December 2023
/
Revised: 31 January 2024
/
Accepted: 7 February 2024
/
Published: 17 February 2024
(This article belongs to the Topic New Advances in Mining Technology)
Abstract
:The establishment of an isolation layer in submarine mining has been a persistent challenge. In the context of this research, we conducted a similarity simulation test to preliminarily assess the interaction between the thickness and extent of the isolation layer. Subsequently, we introduce an innovative approach that integrates fractal theory and the Bonded Block Model (BBM) to simulate undersea isolation layer mining. The validation of this method relies on on-site borehole scanning and displacement monitoring, which depict the intricate fractal evolution of fractures and predict the optimal thickness of the isolation layer. Our findings affirm the robustness and validity of this method. Evaluation of the fractal dimensions of fractures reveals that a critical threshold of 1.7 is essential to prevent structural failure of the isolation layer, while a limit of 1.5 is necessary to avoid significant water ingress. Remarkably, the correlation dimension of the settlement time series closely aligns with the fractal dimension of the fractures, underscoring the feasibility of ensuring the safety of isolation layer mining through real-time settlement monitoring.
1. Introduction
Mine water inrushes represent a significant geological hazard in underground mining [1,2]. In the context of underwater and subsea mining operations, a protective isolation layer of a specified thickness is conventionally employed as a safety barrier to segregate the mining zone from the surrounding aquatic environment [3,4]. Throughout the continuous extraction of ore deposits, the surrounding rock formations undergo intricate processes, including stress redistribution and seepage effects. These factors can contribute to the generation of secondary fractures within the rock mass, resulting in the degradation of the surrounding geological strata. This, in turn, can precipitate progressive deterioration of the expansive isolation layer, potentially culminating in catastrophic incidents such as roof collapses and water inrush events [5,6]. Consequently, the investigation of isolation layers within fractured geological mediums holds paramount significance in ensuring the safety and efficacy of underground mining practices [7,8].
Previous research has explored various approaches to address the challenges of undersea mining. Traditionally, the isolation layer has been treated as an ideal continuum body, with its thickness being estimated using methods such as the thickness–span ratio [9], the general arch approach [10], and the load transfer intersection line technique [11]. Additionally, numerical simulation tools like FLAC3D, PFC, and UDEC [12] have gained widespread adoption due to their practicality and simplicity in analyzing the mechanical behavior of the isolation layer. However, it is well-established that underground rock strata are replete with adverse geological features, including joints and fractures [13], whose intricate geometries make it nearly impossible to ascertain their true structure [14]. Consequently, the utilization of continuum mechanics to investigate the isolation layer, without accounting for the influence of fractures, appears inherently flawed. In the context of undersea mining, exemplified by the Xinli mining area of the Sanshan Island gold mine, as depicted in Figure 1, extracting high-grade ore deposits from the isolation layer while ensuring safety can optimize overall profitability. Recognizing that the evolutionary dynamics of fractured rock masses under seepage–mechanical stress coupling play a pivotal role in assessing the stability of underground mining, an exploration of the interplay between fracture evolution characteristics and the thickness of the isolation layer offers a novel avenue for enhancing the safety and efficiency of undersea mining.
Fortunately, the propagation and development of fractures within a rock mass can be effectively studied using the discrete element method. Within this methodological framework, two primary approaches are prominent: the Particle Flow Method [15] and the Block Discrete Element Method [16,17]. The Particle Flow Method is particularly suited for delving into the micromechanics of rock masses [18], while the Block Discrete Element Method finds its applicability in the intermediate realm, bridging the gap between continuous medium and particle discrete body analyses [19,20]. To enhance the simulation of fracture behavior within rock masses, a novel approach, the Bonded Block Model (BBM), has been introduced and integrated into 3DEC. This incorporation has yielded notably improved results [21]. The research underscores that fractures exhibit self-similarity, a characteristic known as fractal behavior [22]. Fractals, by their very nature, remain scale-independent, enabling their versatile application in characterizing fracture propagation [23] and predicting the permeability of fractured rock formations [24].
As demonstrated in prior research, both the discrete element method and fractal models have proven capable of elucidating the mechanical behaviors of fractured rock [25], considering both macro- and micro-sized fracture characteristics [26]. However, no previous studies have explored undersea mining through the synergistic application of fractal theory and the Bonded Block Model (BBM), an approach that holds promise and effectiveness [27,28]. Hence, this study introduces a novel fractal BBM for simulating isolation layer mining, accompanied by the development of dedicated software to predict the optimal thickness within a three-dimensional (3D) numerical model. Subsequently, on-site monitoring and validation were conducted to assess the model’s capacity to depict natural fractures and its efficacy in forecasting undersea isolation layer mining outcomes for the future.
2. Fractal Theory of Fractures
Self-similarity and fractal dimension are fundamental attributes of fractal theory. In a more detailed context, fractal dimension provides a quantitative measure of the extent of self-similarity and irregularity within a fractal structure.
2.1. Fractal Dimension of Fractures in Rock
Until now, the box dimension method [29,30,31,32,33] stands as one of the most widely used methods for calculating the fractal dimension of images. Its fundamental calculation principle is shown as follows:
Consider A(x, ε) as a closed sphere with the center at x and a radius of ε, where ε is a non-negative real number. Create a non-empty compact set of A in X. For each positive ε,
where ε and C are constants, and N(A, ε) represents the minimum number of closed sphere covering A. The box dimension of A is then determined as follows:
Let , where r is the side length of a box; then,
Let Nn(A) be the number of boxes that intersect A, and the side length of each box be 1/2n; then,
In practical applications, calculate the values of ln(2n) and lnNn(A) by counting the box number with different sizes, where n ranges sequentially from 1, 2, 3, …, to N. A curve can be drawn with ln(2n) as the abscissa and lnNn(A) as the ordinate, respectively.
2.2. Estimation of the Height of the Isolation Layer through Correlation Dimension
In the field of fractal theory, the correlation dimension is frequently utilized. To calculate the correlation dimension, the G-P algorithm, initially developed by Grassberger and Procaccia [34,35], employs the principles of embedding theory and phase space reconstruction.
Suppose a sequence with a capacity of n is obtained, namely , where xi could be extended into the phase distribution Y(Xk) of an m-dimensional phase space using a specific embedding dimension m and τ, and the expression for Y(Xk) becomes
where k is the number of phase points in the reconstructed phase space. We can determine m and τ using the following steps below:
- Calculate the distance between two adjacent phase points of xi and xj (I, j, …, N, ):
- b.
- Given any critical distance r (r > 0), the probability that the distance between two phase points is less than r is calculated as
- c.
- The correlation vector is the vector whose distance from the phase point is less than r. By selecting the value of r within a specified range, the correlation dimension of the system can be defined as
To some extent, the correlation dimension can reveal trends in variations, such as displacement and energy, providing insights into the rock’s failure characteristics from a distinctive perspective. Consequently, the computed correlation dimension holds significant importance as a foundational criterion for evaluating both the stability of the rock mass and the required thickness of the isolation layer.
3. Experiments in Undersea Chamber Mining
In materials with similar compositions, a multitude of micro-defects exists, which, influenced by external forces, grow and merge, independently of their sizes. This phenomenon causes localized damage within the material, accompanied by acoustic emissions. Furthermore, acoustic emission signals display unique characteristics across various stress stages. Empirical findings indicate that the acoustic emission sequences of rock materials exhibit a fractal distribution not only in the time domain but also in the spatial domain [36,37]. These signals form a series evolving over time, and leveraging their fractal characteristics facilitates the study of evolutionary patterns in rock damage and failure processes.
3.1. Similarity Simulation Test Platform for Undersea Mining
A simulation test platform was established to replicate the undersea deposit mining conditions of the Sanshandao gold mine. The setup, illustrated in Figure 2, includes a horizontal side pressure-loading apparatus, a vertical pressure-loading mechanism, a testing framework, a hydraulic servo pump station, a control console, and measuring instruments. Its notable technical specifications comprise a maximum vertical load capacity of 300 kN, hydraulic loading capabilities up to 1.0 MPa, horizontal displacement within the range of 0–100 mm, and model dimensions measuring 1600 mm × 800 mm × 200 mm.
In the simulation experiment, solid paraffin and liquid paraffin were utilized as cementing agents, with river sand and barite powder serving as aggregates. To evaluate the deformation characteristics of the analogous test platforms, the experiment employed the PCI-2 Acoustic Emission (AE) system for real-time monitoring of AE events. Additionally, a strain gauge was attached and connected to the DH3816 static strain test system, as depicted in Figure 3, where the numbers refer to the code numbers of the strain gauges.
3.2. Estimation of the Isolation Layer Thickness of the Similar Model
The extraction of waterproof rock pillars of a specific thickness in underwater mining is crucial for ensuring safety in subaqueous mining operations. According to the thickness–span ratio theory [38], a critical criterion to prevent the rupture of these pillars is that the ratio of their height to the stope span must exceed 0.5:
where h is the height of the waterproof rock pillar, l is the span of the panel, and n is the safety factor.
The experimental setup maintained a 1:200 similarity ratio, conducting the excavation in ten sequential steps, progressing from the center outward, with each step involving an excavation depth of approximately 0.04 m. Figure 4 illustrates the stepwise process in a simulated mining environment with 10 m of seawater and 35 m of sea mud. A 40 m safety roof thickness was upheld. Photos in Figure 4a–f capture the chamber’s span at 0.14 m, 0.28 m, and 0.4 m. Our analysis, applying the similarity ratio and safety thickness–span ratio formula, revealed that a roof thickness exceeding 40 m eliminated the risk of water inrush in the rock formation. Conversely, when the thickness fell below 40 m, characteristics indicative of a water inrush emerged, as shown in Figure 4f.
3.3. Fracture Evolution of the Isolation Layer under Pressure and Seepage Coupling
In Figure 4f, upon completing the ten excavation steps, a pronounced signal was recorded with the AE system at the central apex of the stope, coinciding with the initiation of a water inrush. Employing the localization capabilities of the acoustic emission system revealed that fractures were concentrated at the top center of the stope. As the span expanded, the acoustic emission signal at the stope’s apex gradually amplified in tandem with the ongoing excavation, as demonstrated in Figure 5, where the numbers refer to the code numbers of the AE probes. Subsequently, a growing frequency of AE signals was observed throughout the experiment, indicating the formation of an increasing number of fractures.
Following a substantial increase in AE signals, a thorough inspection was promptly conducted using a stereo microscope, and microscopic measurement analysis software was applied to scrutinize the fissures. As illustrated in Figure 6, the measurement graph depicts an average fissure width of 0.02 mm and a horizontal inclination angle of 20.58° for the upper fracture. Figure 6 provides a comparative illustration, presenting the conditions both before and after the emergence of fracture-induced water flow within the test module. The tests have unequivocally demonstrated that once the distance between the stope roof and the fissures drops below 40 m, pressurized water initiates continuous erosion of the fissures, eventually forming a smoothly channelized conduit. This streamlined outflow of water from the fissures signifies a fundamental aspect of the model’s water inrush failure mechanism.
4. Modeling the Mining of Isolation Layers Using the Bonded Block Model
The Bonded Block Model (BBM) approach simulates crack initiation, coalescence, propagation, and various forms of fracturing, including extension and shear, while considering the rock strength’s dependency on confinement, encompassing intact, jointed, or veined conditions. Throughout the years, diverse representations of these components, including elastic and inelastic zones as well as heterogeneous and homogeneous blocks and contacts corresponding to distinct mineral grains and their associated mechanical properties, have been utilized to simulate various facets of rock behavior.
4.1. Rock Mass Parameter Calibration of the Bonded Block Model
This study is situated in the Xinli mining area, focusing on the numerical model centered on the 55-line section of a substantial ore body. The primary objective is to investigate the dynamics of overlying strata movement and the evolution of mining-induced fissures within the isolation layer situated above −165 m during the mining operation. To simplify the modeling process, this simulation adopts a regular ore body with a uniform average thickness of 15 m, disregarding the natural variation in ore body thickness. In the context of undersea mining activities, it is common for the expansion and alteration of rock formations to occur, resulting in seawater ingress predominantly from the upper strata, including the isolation layer.
The mechanical properties of the rock mass used in our analyses are derived from test results obtained from rock samples sourced from the Xinli mining area. These properties vary, as presented in Table 1.
As Figure 7 shows, the simulation of the uniaxial compression test utilizes a numerical model of a block with a standard size of Φ50 mm × 100 mm and an average side length of 3.0 mm (corresponding to the average particle size of the laboratory granite sample). Calibrating micro-scale parameters at the contact interface in the Bonded Block Model (BBM) simulation involves adjusting the parameters to match the observed behavior, and a single uniaxial compression test diagram is displayed to simplify and focus the calibration process for the representative material behavior.
Through the calibration of mesoscopic parameters, the corrected mesoscopic contact parameters of various types of ore rocks are shown in Table 2.
4.2. Model Setup
The excavation simulation of the isolation layer was conducted utilizing the 3DEC Bonded Block Model. In the Xinli mining area, ore bodies located below the −165 m level undergo high-drift filling mining, employing a stage height of 50 m and roof and floor pillars each having a thickness of 6 m. For ore bodies situated above the −165 m level, the point-pillar-layered filling mining method is applied. Within this mining region, the average horizontal thickness of the ore bodies varies from 20 to 40 m, featuring an average grade of approximately 3 g/t and an inclination angle typically ranging between 33° and 67°. For our analysis, we maintain a consistent orebody inclination angle of 62°, as depicted in Figure 8.
4.3. Boundary Conditions and Initial Stress
Model loading was achieved by applying stress boundaries to the lateral and bottom surfaces, while a free boundary condition was imposed on the top surface. The initial stress experienced depth-dependent changes, as indicated by Equation (11), derived from field investigations and regression analysis of geo-stress data:
where σ1, σ3, and σ2 correspond to the maximum horizontal principal stress, vertical principal stress, and minimum horizontal principal stress, respectively, and h is the depth. Notably, the maximum horizontal principal stress aligns with the NW direction, closely approximating the orientation of the maximum tectonic stress.
5. Numerical Simulation Results and Discussion
To investigate the dynamic evolution of the fracture fractal dimension and changes in the fracture self-similarity, we incrementally mined on each layer of the established isolation layer mining model. The use of heterogeneous and inelastic Bonded Block Models (BBMs) has demonstrated remarkable effectiveness in representing the comprehensive spectrum of rock fracture behaviors within the isolation layer, effectively aligning with all calibration targets.
5.1. Deformation of the Isolation Layer with Excavation
In this study, we initially examined the dynamic evolution of fractures by analyzing the deformation of the isolation layer. As depicted in Figure 9, during the initial excavation of the isolation layer, the roof experienced a relatively substantial settlement. As the isolation layer continued to be excavated, the settlement of the hanging wall’s surrounding rock continued to increase, with an accelerating growth rate. A prominent master fracture, located at the top of the isolation layer, emerged when excavation reached the −155 m level. With further excavation, the rate of sedimentation in the hanging wall notably exceeded that of the footwall. Ultimately, the master fracture within the isolation layer penetrated the surrounding rock of the footwall. A significant transformation occurred after the complete penetration of the master fracture in the isolation layer: as the isolation layer continued to be excavated, conspicuous settlement in the surrounding rock of the footwall became evident.
In summary, it can be deduced that the settlement of the surrounding rock was primarily governed by the behavior of the master fracture. Initially, the settlement of the footwall was impeded by the motion of the hanging wall. However, once the restriction was lifted, specifically when the master fracture was fully penetrated, pronounced deformation ensued in the footwall.
To provide clarification, while the maximum displacement presented in Figure 9 is visually limited to 10 mm, it is important to note that the genuine maximum settlement of the model reached 0.0153 m, which was observed in the hanging wall at the −165 m level. In contrast, the deformation in the surrounding rock of the footwall diminishes progressively from top to bottom.
5.2. Fractal Evolution Characteristics of Rock Fractures
During the excavation of the orebody within the isolation layer, fracturing occurred at critically stressed contacts under stress–seepage coupling conditions. To further validate the mechanisms of isolation layer destruction, we examined the changes in the evolution of different types of fractures throughout the orebody excavation process. Figure 10 illustrates the dynamic propagation of fractures around the isolation layer, revealing two distinct types: tensile and shear fractures. Several noteworthy patterns emerged from the evolution of fracturing. Upon analyzing the distribution of fractures, it became apparent that the surrounding rock of the hanging wall and the roof predominantly exhibited tensile fractures. A clear correlation emerged: the greater the number of tensile fractures, the more pronounced the settlement of the rock mass, a relationship consistently observed in the surrounding rock of the hanging wall. Conversely, the rock mass of the footwall primarily featured shear fractures. Closer to the excavation surface, the incidence of tensile fractures increased.
This observed phenomenon can be attributed to the excavation of the inclined isolation layer structure, which induced tensile extension of the fractures within the hanging wall strata due to tectonic stress. Conversely, the footwall’s surrounding rock experienced compression as a result of subsidence deformation in the surrounding rock of the hanging wall. This compression explains the prevalence of shear fractures in the footwall.
Clearly, as the thickness of the isolation layer decreases, there is a corresponding increase in the number of fractures. Fractal dimensions prove to be highly effective in quantitatively characterizing the propagation of these fractures. Our examination focused on the fractal dimension of a two-dimensional plane for clarity, but three-dimensional models imply the potential for extending calculations to three-dimensional space if required. To achieve this quantification, we calculate the fractal dimension of these fractures. In practical applications, this computation involves determining the values of ln(2n) and lnNn(A) through a systematic enumeration of box sizes, with n incrementing sequentially from 1 to N. These values are then used to construct a curve, with ln(2n) plotted on the abscissa and lnNn(A) on the ordinate. In this paper, two-dimensional diagrams illustrating fracture propagation are employed to delineate their fractal attributes, as depicted in Figure 11.
After the binarization processing of the images, as illustrated in Figure 11, we successfully derived the fractal dimensions around the isolation layer. As indicated in Figure 12, the trend in fracture numbers exhibited an approximately linear trajectory across various measurement scales, with the slope of this line representing the fractal dimension of the fractures. Specifically, after mining the orebody at levels −165 m, −135 m, −95 m, and −45 m, the calculated fractal dimensions were 1.275, 1.410, 1.633, and 1.714, respectively. In essence, this implies that the fractal dimension of the model demonstrated an increasing pattern, aligning with the expected behavior in fracture evolution.
Figure 13 presents the curve illustrating variations in fracture fractal dimensions. The curve reveals a noticeable pattern, indicating a transition from substantial increases to a more gradual growth in the number of fractures. Notably, the slope of the fractal dimension curve in the initial half of the graph exceeds that in the latter half. In simpler terms, the fracture fractal dimension underwent rapid escalation until the isolation layer was mined down to the −115 m level. Subsequently, the rate of growth in the fracture fractal dimension gradually diminished.
A noteworthy observation is that the connection between the master fracture and the footwall rock mass materializes when the isolation layer is excavated down to the −135 m level, specifically during the fourth stage of excavation. At this juncture, the fracture’s fractal dimension attains a value of 1.4099, with the peak growth rate of the fractal dimension occurring at the −115 m mining level. Subsequently, the growth rate of the fractal dimension exhibits a gradual decline. It is noteworthy that when the isolation layer thickness falls below 55 m, the fractal dimension stabilizes at approximately 1.71, with minimal further variation.
5.3. Fracture Flow Characteristics of the Mining Area
Based on the simulation results of the flow patterns, the water flow discharge rate across the entire area is illustrated in Figure 14. In the initial stages of isolation layer excavation, the water flow predominantly concentrated around the hanging wall rock mass and the goaf’s roof. It is noteworthy that the water flow exceeded 100 mL/s upon the penetration and expansion of the master fracture within the isolation layer.
There was a pronounced increase in water flow within the area experiencing tensile fracturing. This observation aligns with the findings of site investigations, as illustrated in Figure 15. Specifically, when the thickness of the isolation layer was less than 105 m, corresponding to a fracture fractal dimension greater than 1.542, both the roof and hanging wall of the goaf played a significant role as channels for substantial water inflow. This phenomenon directly corresponds to the point where the growth rate of the fractal dimension was maximized.
Considering the model’s width of 120 m, a safety factor of 2 necessitates a safe thickness determined by the thickness–span ratio of 60 m. In this context, the fractal dimension of fractures falls within the range of 1.694 to 1.708, with an average value of approximately 1.70. Consequently, it is reasonable to establish the limit fractal dimension of fractures as 1.70 while ensuring the safe mining of the isolation layer. However, when large amounts of seawater are absent, the critical objective is to prevent fracture connections between the hanging wall and the goaf within the isolation layer. Therefore, it is crucial to maintain the overall fractal dimension below 1.542 in this scenario.
6. Field Investigation and Verification
6.1. Observation Hole Experiment Method Verification
To validate the reliability of the simulation results, we utilized the isolation layer situated at −165 m as the mining test stope. Concurrently, we performed core drilling on the hanging wall at −155 m, as depicted in Figure 16. In light of this, we introduced an observation hole method to assess the extent of fracture propagation.
As depicted in Figure 17, both the No.01 and No.02 boreholes reached a depth of approximately 20 m. For analytical purposes, the rock cores were segmented into 2 m sections. The borehole image for No.01 covered a depth range from 0 to 19 m, while the No.02 borehole image extended from 0 to 20 m. The fractures identified through borehole-scanning imaging were subjected to binarization, resulting in the fracture distributions illustrated in Figure 18. Upon analyzing the spatial distribution of these fractures within the borehole rock, it becomes evident that in the case of the No.01 borehole, fractures are more prominent in the length range of 0 m to 12 m, becoming relatively sparse between 12 m and 18 m. In contrast, for the No.02 borehole, fractures are relatively prevalent within the 0 m to 12 m range but less so in the 10 m to 20 m range, with no fractures observed between 10 m and 12 m. A comparison of these spatial distribution characteristics of fractures within Figure 12 reveals that the simulated fracture development patterns closely align with the actual fracture development patterns.
After obtaining the fracture distributions, we applied the box dimension calculation principle to process the original borehole images from Figure 18. These borehole images were considered to have a size of 2.0 m × 2.0 m, covering grids with precision successively set at 0.2 m, 0.1 m, 0.05 m, and 0.025 m. Through regression analysis using Equation (9), the regression equations for the rock fracture fractal dimensions of boreholes No.01 and No.02 were determined as follows: y = 1.27109x + 0.04064 and y = 1.23512x + 0.03274, respectively. The corresponding regression coefficients were R2 = 0.99188 and R2 = 0.99755, as shown in Figure 19.
Since fractals exhibit self-similar characteristics, the local rock fracture fractal dimensions can be extrapolated to derive the global fracture fractals. Therefore, we can infer that the fracture fractal dimension during the actual mining process at the −165 m level falls within the range of 1.27109 to 1.23512, which closely aligns with the calculated result of 1.2747.
6.2. Settlement Monitoring Method Verification
The validation test was conducted using the settlement monitoring method, with the site settlement monitoring locations as indicated in Figure 17. Following mining at the −165 m level, the settlement trends of the monitoring points are illustrated in Figure 20a, while the corresponding settlement simulation results are presented in Figure 21a. A comparison of these outcomes reveals a general alignment between the settlement trends of the monitoring points and the calculated settlements, with convergence observed at approximately 3500 steps. In contrast, the settlement data obtained through actual monitoring stabilized at around 170 days. Ultimately, both settlement measurements reached approximately 0.015 m.
We utilized the phase space reconstruction method in conjunction with the G-P algorithm to compute the correlation dimension for the two types of settlements mentioned above. In Figure 20b and Figure 21b, the correlation dimensions of the time series for the monitoring settlement and calculated settlement are illustrated, respectively. The G-P algorithm was employed to calculate the corresponding correlation dimension as the embedding dimension of the time series ranged from 1 to 7. The slopes of the curves in Figure 20b and Figure 21b represent the correlation dimensions. The correlation dimension of the actual settlement ranged from 1.0261 to 1.2563, while that of the calculated settlement ranged from 1.1303 to 1.2350. Both the visual observation in the figures and the change pattern of the correlation dimension indicate that the correlation dimension of the actual settlement exhibits more pronounced variations with changes in the embedding dimension. This can be attributed to the fact that the monitored actual settlement experiences more significant fluctuations, while the calculated settlement curve displays smoother trends, resulting in a more pronounced alteration in the correlation dimension of the time series for the actual settlement.
Analyzing the correlation dimension of settlement serves the purpose of uncovering underlying complexities and structural patterns within settlement data. Through methods like phase space reconstruction and the G-P algorithm, this analysis quantifies the system’s dynamics, shedding light on intricacies and predictability in settlement patterns. In the context of this academic paper, it contributes to assessing simulation reliability and understanding the dynamic behavior of the subsea isolation layer during mining operations. Although some disparities exist between the measured and actual settlement patterns, the correlation dimension remained relatively stable when the embedding dimension was set to 5. Consequently, it can be reasonably deduced that the settlement’s correlation dimension hovers around 1.23. In contrast, the correlation dimension of the settlement time series is marginally smaller than the fractal dimension of the fractures, although this numerical discrepancy is inconspicuous. As a result, the utilization of the BBM incorporated into 3DEC for safety prognostication in isolation layer mining has yielded significant success, signifying that the structurally controlled safety thickness should be 60 m, while a safety thickness of 100 m is required to prevent substantial seawater intrusion. The observed correlation between the fractal dimension variation pattern of isolation layer fractures from −165 m to −135 m and the on-site measurements suggests a preliminary alignment. However, to ascertain the generalizability of this correlation, further investigations and detailed explanations are required, particularly concerning its applicability to the section above −135 m. Additional research and analysis are necessary to validate the observed patterns and draw comprehensive conclusions for the entire isolation layer.
7. Conclusions
The evolution of fractures and damage in subsea isolation layers during underwater mining is a complex and critical process, with significant implications for the safety and sustainability of underwater mining projects. Risk assessments based on monitoring data are conducted to determine the safety of subsea mining operations. This involves considering the potential impact of fracture propagation on the stability of facilities and the environment. Adopting sustainable mining strategies is crucial to ensuring the long-term feasibility and environmental friendliness of underwater resource extraction. With these objectives in mind, this study investigated the dynamic damage evolution patterns of subsea isolation layer fractures. The main conclusions drawn from this research are as follows:
- (1)
- The results obtained through the similar test model align with the safe thickness determined by the thickness–span ratio. Acoustic emission findings indicate that damage in the model generally propagates from the central top to both sides.
- (2)
- The discrete medium mechanics calculations revealed two critical fractal dimensions for the surrounding rock during isolation layer excavation: one at 1.5 and the other at 1.70.
- (3)
- Field investigations demonstrated that the fractal dimension of fractures in the midsection at −155 m corresponds closely with the calculations from 3DEC. This suggests that determining the safe thickness of offshore isolation layers based on discrete medium mechanics is more accurate and rational. Thus, 3DEC can be effectively utilized for predicting the safety isolation layer’s thickness in offshore mining.
- (4)
- In scenarios where the fracture fractal dimension is unknown, the time series correlation dimension of displacement monitoring can serve as a crucial criterion for assessing the failure or stability of the isolation layer, proving invaluable in engineering applications.
Author Contributions
Conceptualization, Y.C.; methodology, Y.C. and Z.L.; software, W.L.; validation, Y.C. and Y.H.; formal analysis, Y.H.; investigation, Y.C. and Z.L.; resources, G.W.; data curation, R.O.; writing—original draft preparation, Y.C.; writing—review and editing, Y.H.; visualization, G.W.; supervision, Q.L.; project administration, R.O. and Q.L.; funding acquisition, Y.H. All authors have read and agreed to the published version of the manuscript.
Funding
This research was funded by Natural Science Foundation of Hunan Province grant number [2023JJ40546] and Scientific Research Project of Education Department of Hunan Province grant number [21A0264]. And The APC was funded by [2023JJ40546].
Data Availability Statement
The original contributions presented in the study are included in the article material, further inquiries can be directed to the corresponding author.
Conflicts of Interest
Authors Lin Weixing, Ou Renze and Liu Qi was employed by the company Changsha Institute of Mining Research Co. Ltd.. The remaining authors declare that the research was conducted in the absence of any commercial or financial relationships that could be construed as a potential conflict of interest.
References
- Ma, D.; Li, Q.; Cai, K.; Zhang, J.; Li, Z.; Hou, W.; Sun, Q.; Li, M.; Du, F. Understanding water inrush hazard of weak geological structure in deep mine engineering: A seepage-induced erosion model considering tortuosity. J. Cent. South Univ. 2023, 30, 517–529. [Google Scholar] [CrossRef]
- Ma, D.; Duan, H.; Zhang, J.; Liu, X.; Li, Z. Numerical simulation of water–silt inrush hazard of fault rock: A three-phase flow model. Rock Mech. Rock Eng. 2022, 55, 5163–5182. [Google Scholar] [CrossRef]
- Liu, Z.; Dang, W.; He, X. Undersea safety mining of the large gold deposit in Xinnli District of Sanshandao Gold Mine. Int. J. Miner. Metall. Mater. 2012, 19, 574–583. [Google Scholar] [CrossRef]
- Wang, L.; Chen, J.; Qiao, Z.; Yang, J.; Liu, W. Tribological behaviors of in situ TiB2 ceramic reinforced TiAl-based composites under sea water environment. Ceram. Int. 2017, 43, 4314–4323. [Google Scholar] [CrossRef]
- Ma, D.; Duan, H.; Zhang, J.; Bai, H. A state-of-the-art review on rock seepage mechanism of water inrush disaster in coal mines. Int. J. Coal Sci. Technol. 2022, 9, 50. [Google Scholar] [CrossRef]
- Peng, K.; Li, X.; Wan, C.; Peng, S.; Zhao, G. Safe mining technology of undersea metal mine. Trans. Nonferrous Met. Soc. China 2012, 22, 740–746. [Google Scholar] [CrossRef]
- Zhao, B.; Wang, J. Study on interval rupture mechanism and support optimization of layered roof. Eng. Fail. Anal. 2022, 141, 106690. [Google Scholar] [CrossRef]
- Yang, J.; Liu, C.; Yu, B.; Wu, F. The effect of a multi-gob, pier-type roof structure on coal pillar load-bearing capacity and stress distribution. Bull. Eng. Geol. Environ. 2015, 74, 1267–1273. [Google Scholar] [CrossRef]
- Zhang, H.; Song, W.; Fu, J. Analysis of large-span goaf roof instability critical parameters and stability. J. Min. Saf. Eng. 2014, 31, 66. (In Chinese) [Google Scholar]
- Liu, Z.; Lu, T.; Li, X.; Li, X.; Huai, Z.; Wang, S. Construction of reasonable pillar group for undersea mining in metal mine. Trans. Nonferrous Met. Soc. China 2018, 28, 757–765. [Google Scholar] [CrossRef]
- Li, D.; Zhang, J.; Sun, Y.; Li, G. Evaluation of rockburst hazard in deep coalmines with large protective island coal pillars. Nat. Resour. Res. 2021, 30, 1835–1847. [Google Scholar] [CrossRef]
- Wu, W.; Bai, J.; Wang, X.; Yan, S.; Wu, S. Numerical study of failure mechanisms and control techniques for a gob-side yield pillar in the Sijiazhuang coal mine, China. Rock Mech. Rock Eng. 2019, 52, 1231–1245. [Google Scholar] [CrossRef]
- Miao, X.; Cui, X.; Wang, J.; Xu, J. The height of fractured water-conducting zone in undermined rock strata. Eng. Geol. 2011, 120, 32–39. [Google Scholar] [CrossRef]
- Davies, R.; Mathias, S.; Moss, J.; Hustoft, S.; Newport, L. Hydraulic fractures: How far can they go? Mar. Pet. Geol. 2012, 37, 1–6. [Google Scholar] [CrossRef]
- Baghbanan, A.; Jing, L. Hydraulic properties of fractured rock masses with correlated fracture length and aperture. Int. J. Rock Mech. Min. Sci. 2007, 44, 704–719. [Google Scholar] [CrossRef]
- Castro-Filgueira, U.; Alejano, L.; Ivars, D. Particle flow code simulation of intact and fissured granitic rock samples. J. Rock Mech. Geotech. Eng. 2020, 12, 960–974. [Google Scholar] [CrossRef]
- Lak, M.; Fatehi, M.; Yarahmadi, A.; Abdollahipour, A. Discrete element modeling of explosion-induced fracture extension in jointed rock masses. J. Min. Environ. 2019, 10, 125–138. [Google Scholar] [CrossRef]
- Ju, Y.; Wang, Y.; Su, C.; Zhang, D.; Ren, Z. Numerical analysis of the dynamic evolution of mining-induced stresses and fractures in multilayered rock strata using continuum-based discrete element methods. Int. J. Rock Mech. Min. Sci. 2019, 113, 191–210. [Google Scholar] [CrossRef]
- Tomac, I.; Gutierrez, M. Micromechanics of hydraulic fracturing and damage in rock based on DEM modeling. Granul. Matter 2020, 22, 56. [Google Scholar] [CrossRef]
- Di, S.; Xu, W.; Wang, W.; Wu, G. Macro-mechanical properties of columnar jointed basaltic rock masses. J. Cent. South Univ. Technol. 2011, 18, 2143–2149. [Google Scholar] [CrossRef]
- Wang, H.; Song, F.; Chen, Y.; Li, T.; Ma, G. Stability analysis of fractured rock masses based on an extended key block theory considering the forces between blocks and block rotation. Tunn. Undergr. Space Technol. 2023, 132, 104895. [Google Scholar] [CrossRef]
- Sinha, S.; Walton, G. A study on Bonded Block Model (BBM) complexity for simulation of laboratory-scale stress-strain behavior in granitic rocks. Comput. Geotech. 2020, 118, 103363. [Google Scholar] [CrossRef]
- Ryvkin, M.; Shraga, R. Fracture toughness of hierarchical self-similar honeycombs. Int. J. Solids Struct. 2018, 152, 151–160. [Google Scholar] [CrossRef]
- Archambault, G.; Rouleau, A.; Daigneault, R.; Flamand, R. Progressive failure of rock masses by a self similar anastomosing process of rupture at all scales and its scale effect on their shear strength. In Scale Effects in Rock Masses 93; CRC Press: Boca Raton, FL, USA, 2020; pp. 133–141. [Google Scholar]
- Zhou, B.; Wei, D.; Ku, Q.; Wang, J.; Zhang, A. Study on the effect of particle morphology on single particle breakage using a combined finite-discrete element method. Comput. Geotech. 2020, 122, 103532. [Google Scholar] [CrossRef]
- Liu, X.; Zeng, Y.; Xia, C.; Liu, H.; Xie, Q.; Zhong, Y. Influence of specimen size on granite fracture characteristics and acoustic emission phenomena under mode I loading conditions. Theor. Appl. Fract. Mech. 2023, 128, 104106. [Google Scholar] [CrossRef]
- Rasmussen, L.; Min, K. Developments to the Bonded Block Modeling technique for Discrete Element simulation of transversely isotropic rocks. Int. J. Rock Mech. Min. Sci. 2023, 170, 105518. [Google Scholar] [CrossRef]
- Sinha, S.; Shirole, D.; Walton, G. Investigation of the micromechanical damage process in a granitic rock using an inelastic bonded block model (BBM). J. Geophys. Res. Solid Earth 2020, 125, e2019JB018844. [Google Scholar] [CrossRef]
- Sui, L.; Yu, J.; Cang, D.; Miao, W.; Wang, H.; Zhang, J. The fractal description model of rock fracture networks characterization. Chaos Solitons Fractals 2019, 129, 71–76. [Google Scholar] [CrossRef]
- Miao, T.; Yu, B.; Duan, Y.; Fang, Q. A fractal analysis of permeability for fractured rocks. Int. J. Heat Mass Transf. 2015, 81, 75–80. [Google Scholar] [CrossRef]
- Bisoi, A.K.; Mishra, J. On calculation of fractal dimension of images. Pattern Recognit. Lett. 2001, 22, 631–637. [Google Scholar] [CrossRef]
- Klinkenberg, B. A review of methods used to determine the fractal dimension of linear features. Math. Geol. 1994, 26, 23–46. [Google Scholar] [CrossRef]
- Foroutan-pour, K.; Dutilleul, P.; Smith, D. Advances in the implementation of the box-counting method of fractal dimension estimation. Appl. Math. Comput. 1999, 105, 195–210. [Google Scholar] [CrossRef]
- Grassberger, P. Grassberger-Procaccia algorithm. Scholarpedia 2007, 2, 3043. [Google Scholar] [CrossRef]
- Camastra, F.; Vinciarelli, A. Intrinsic dimension estimation of data: An approach based on Grassberger–Procaccia’s algorithm. Neural Process. Lett. 2001, 14, 27–34. [Google Scholar] [CrossRef]
- Chen, D.; Li, N.; Wang, E.-Y. Temporal and spatial evolution of acoustic emission and waveform characteristics of specimens with different lithology. J. Geophys. Eng. 2018, 15, 1878–1888. [Google Scholar] [CrossRef]
- Cheng, T.; Wang, L.; Xiao, Y.; He, M.; Wang, T.; Peng, M.; Li, H. Correlational fractal characteristics and damage progression of granite with different grain sizes based on acoustic emission monitoring. Eng. Geol. 2023, 327, 107358. [Google Scholar] [CrossRef]
- Wang, F.F.; Dai, H.H.; Giorgio, I. A numerical comparison of the uniformly valid asymptotic plate equations with a 3D model: Clamped rectangular incompressible elastic plates. Math. Mech. Solids 2022, 27, 1370–1396. [Google Scholar] [CrossRef]
Figure 1.
Geological structure diagram of the Sanshandao gold mine.

Figure 2.
Similar simulation test system: (a) similar test model, (b) control system.
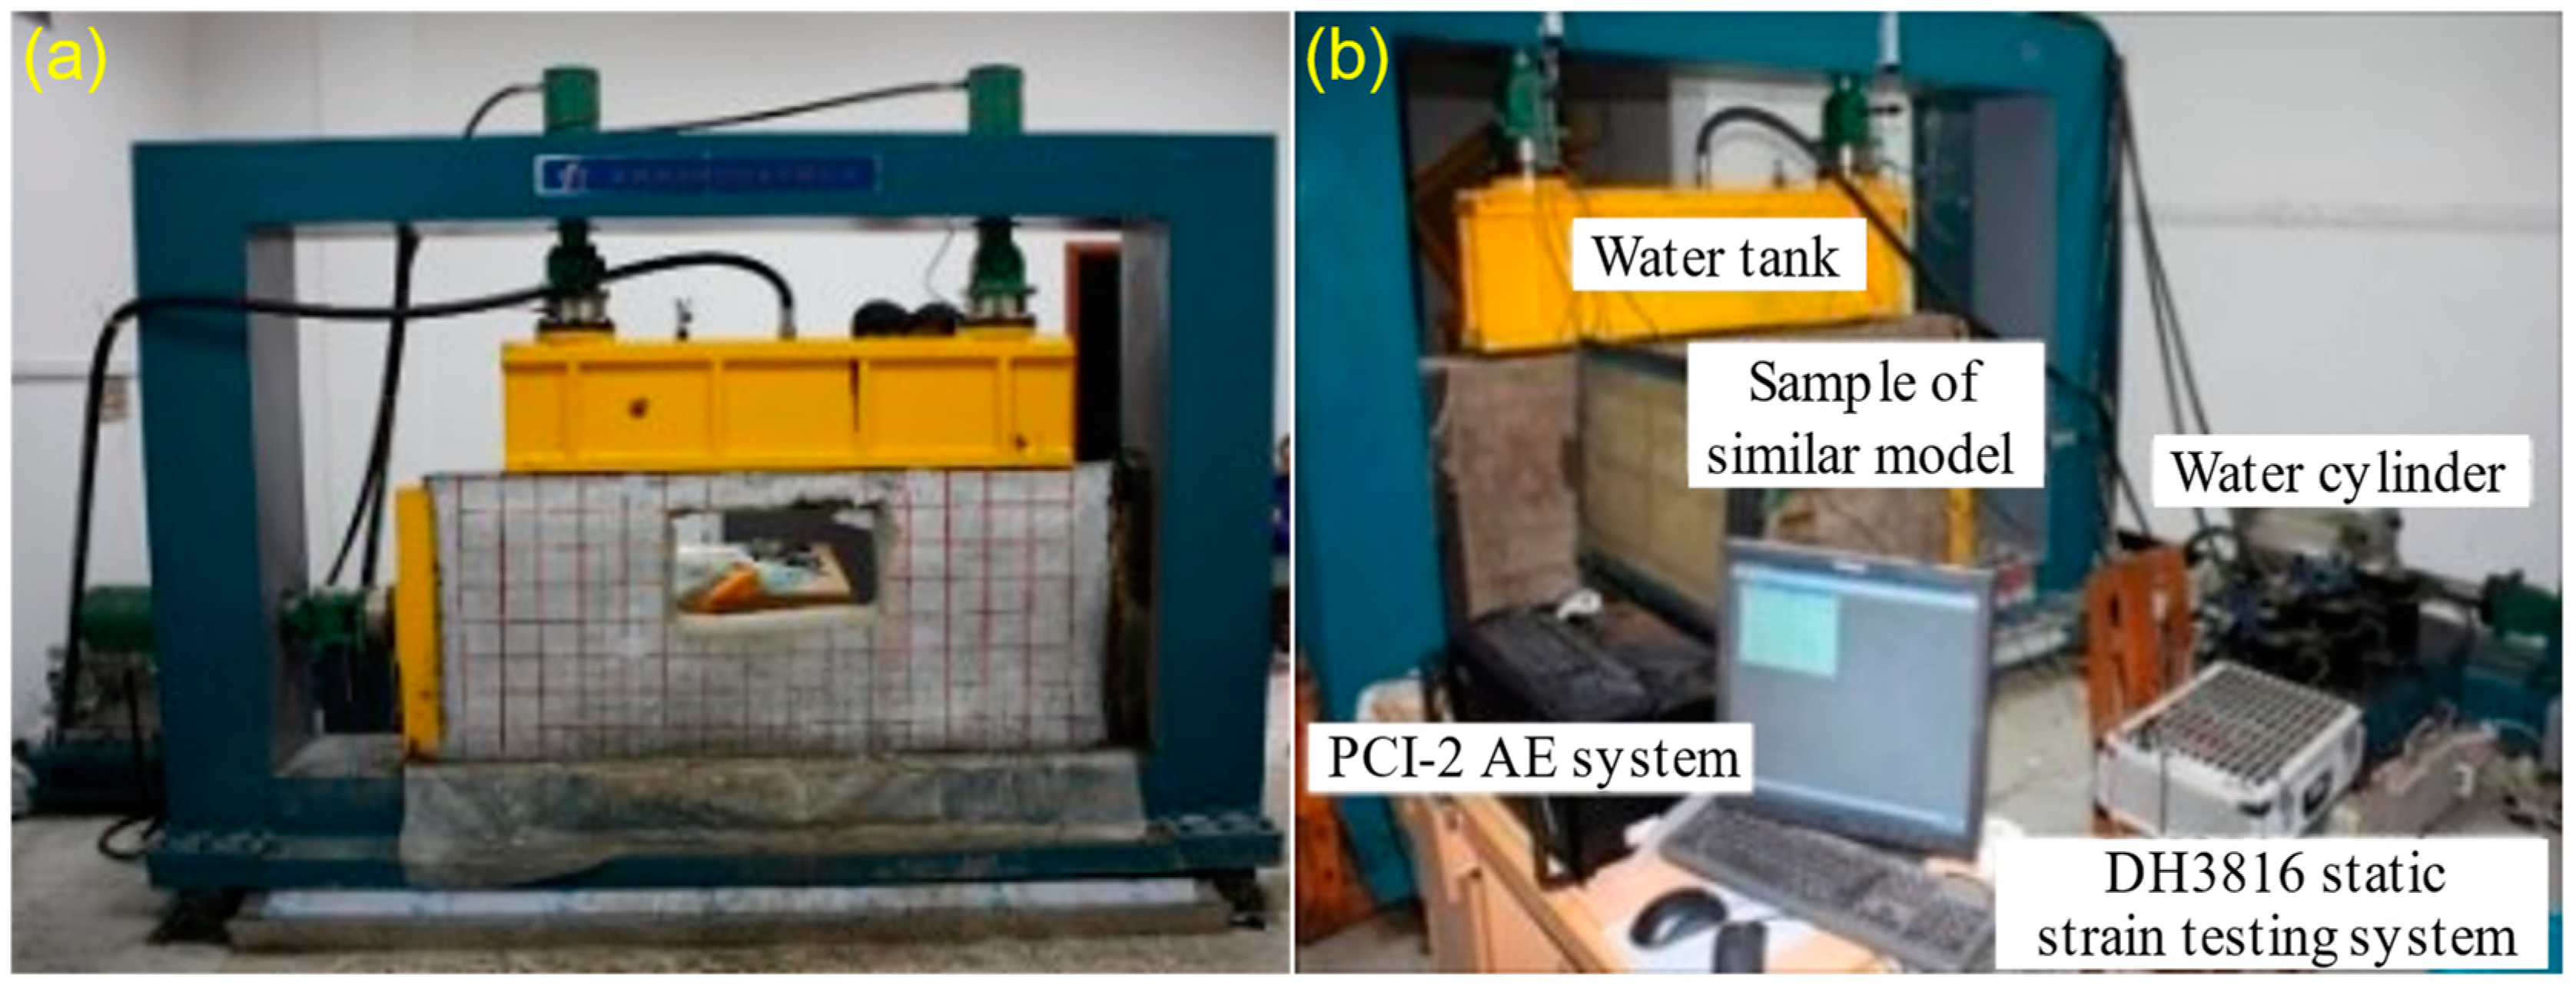
Figure 3.
Arrangement of AE probe and strain gauge for similar simulation experiment.

Figure 4.
The gradual excavation process of the similar simulation test: (a) the second excavation step, (b) the second excavation step, (c) the sixth excavation step, (d) the ninth excavation step, (e) the tenth excavation step, (f) water inrush after ten excavation steps.
Figure 4.
The gradual excavation process of the similar simulation test: (a) the second excavation step, (b) the second excavation step, (c) the sixth excavation step, (d) the ninth excavation step, (e) the tenth excavation step, (f) water inrush after ten excavation steps.
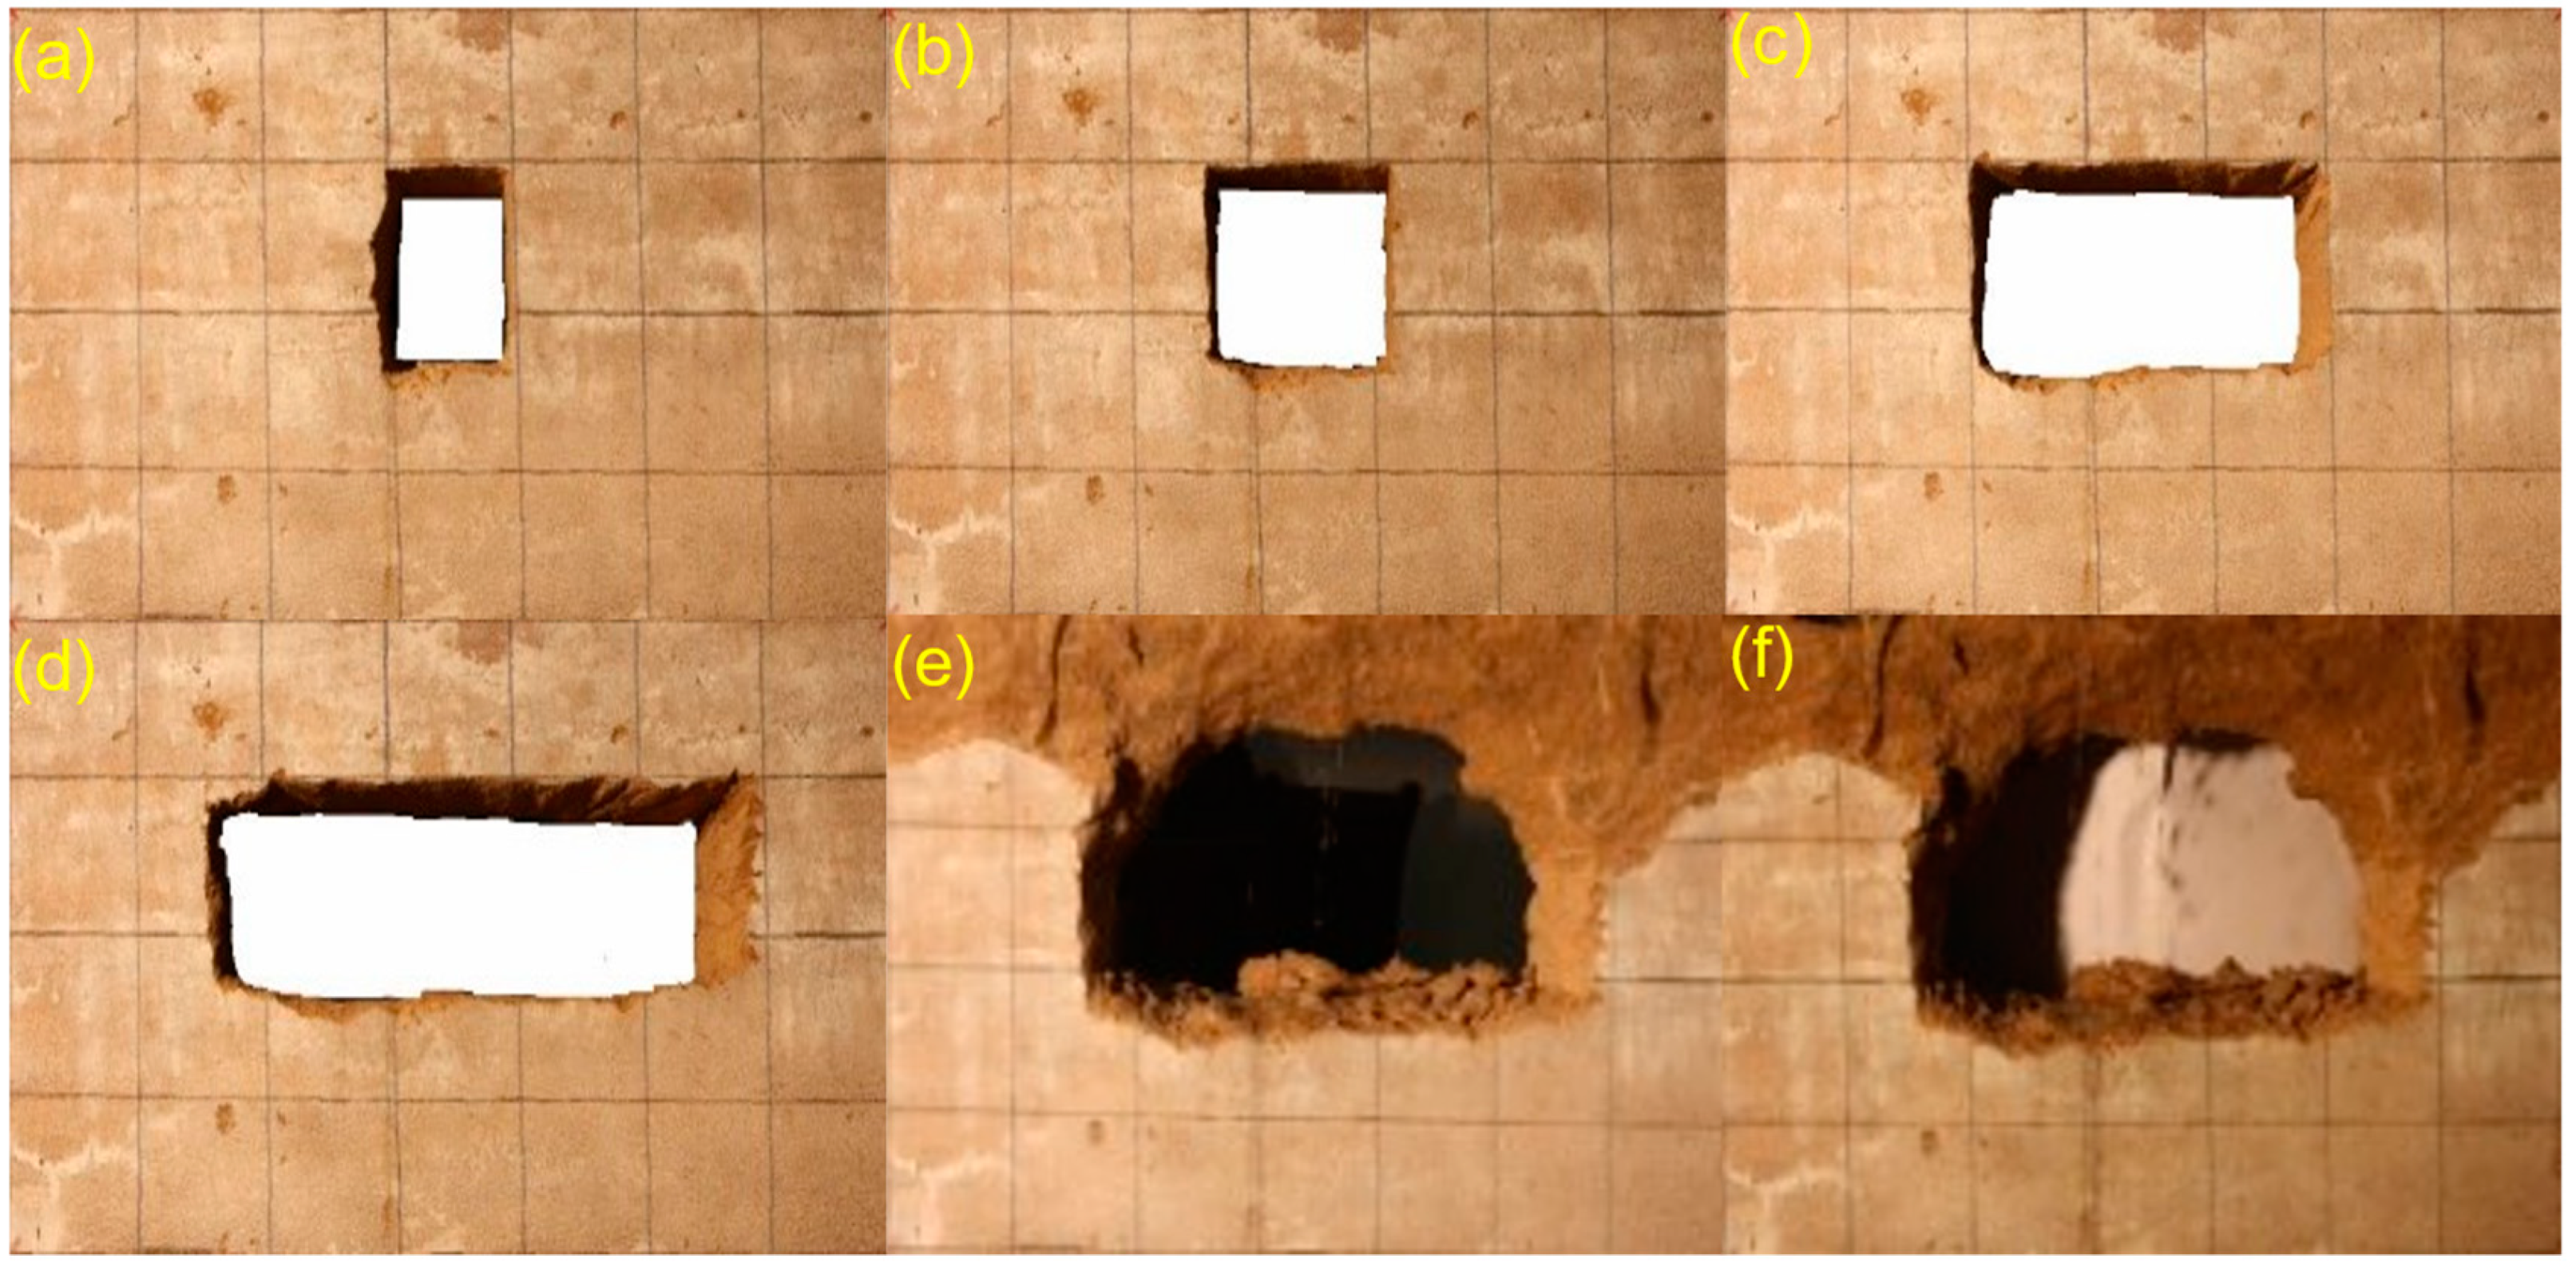
Figure 5.
Acoustic emission distribution and monitoring signals: (a) acoustic emission signal time–space distribution, (b) monitoring signals.
Figure 5.
Acoustic emission distribution and monitoring signals: (a) acoustic emission signal time–space distribution, (b) monitoring signals.
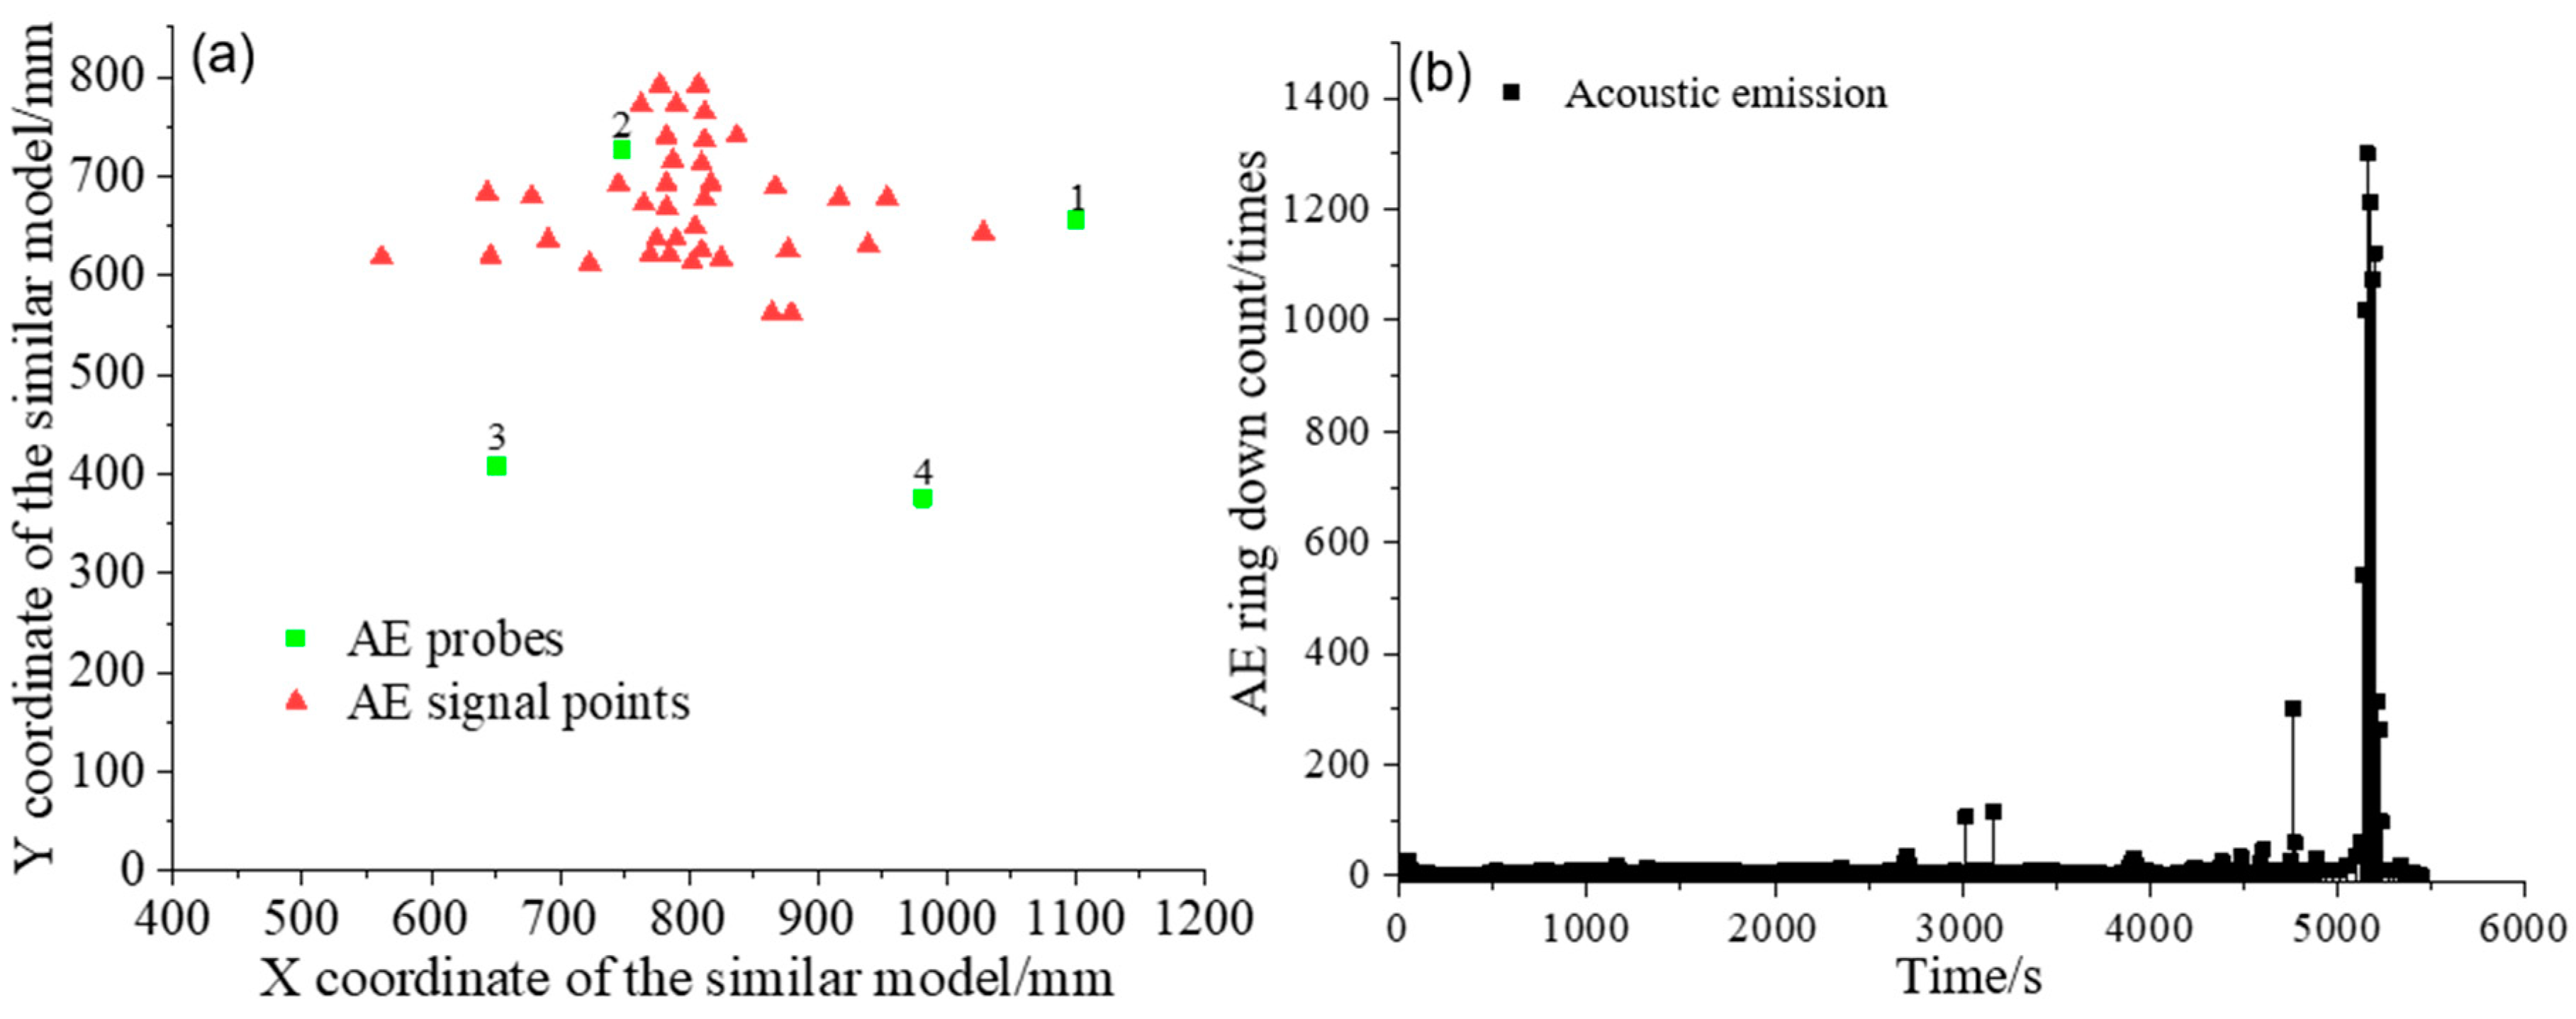
Figure 6.
Fracture water flow meso-process map: (a) initial fracture propagation, (b) continuous fracture propagation, (c) fracture water channel formation, (d) fracture water channel completely connected.
Figure 6.
Fracture water flow meso-process map: (a) initial fracture propagation, (b) continuous fracture propagation, (c) fracture water channel formation, (d) fracture water channel completely connected.
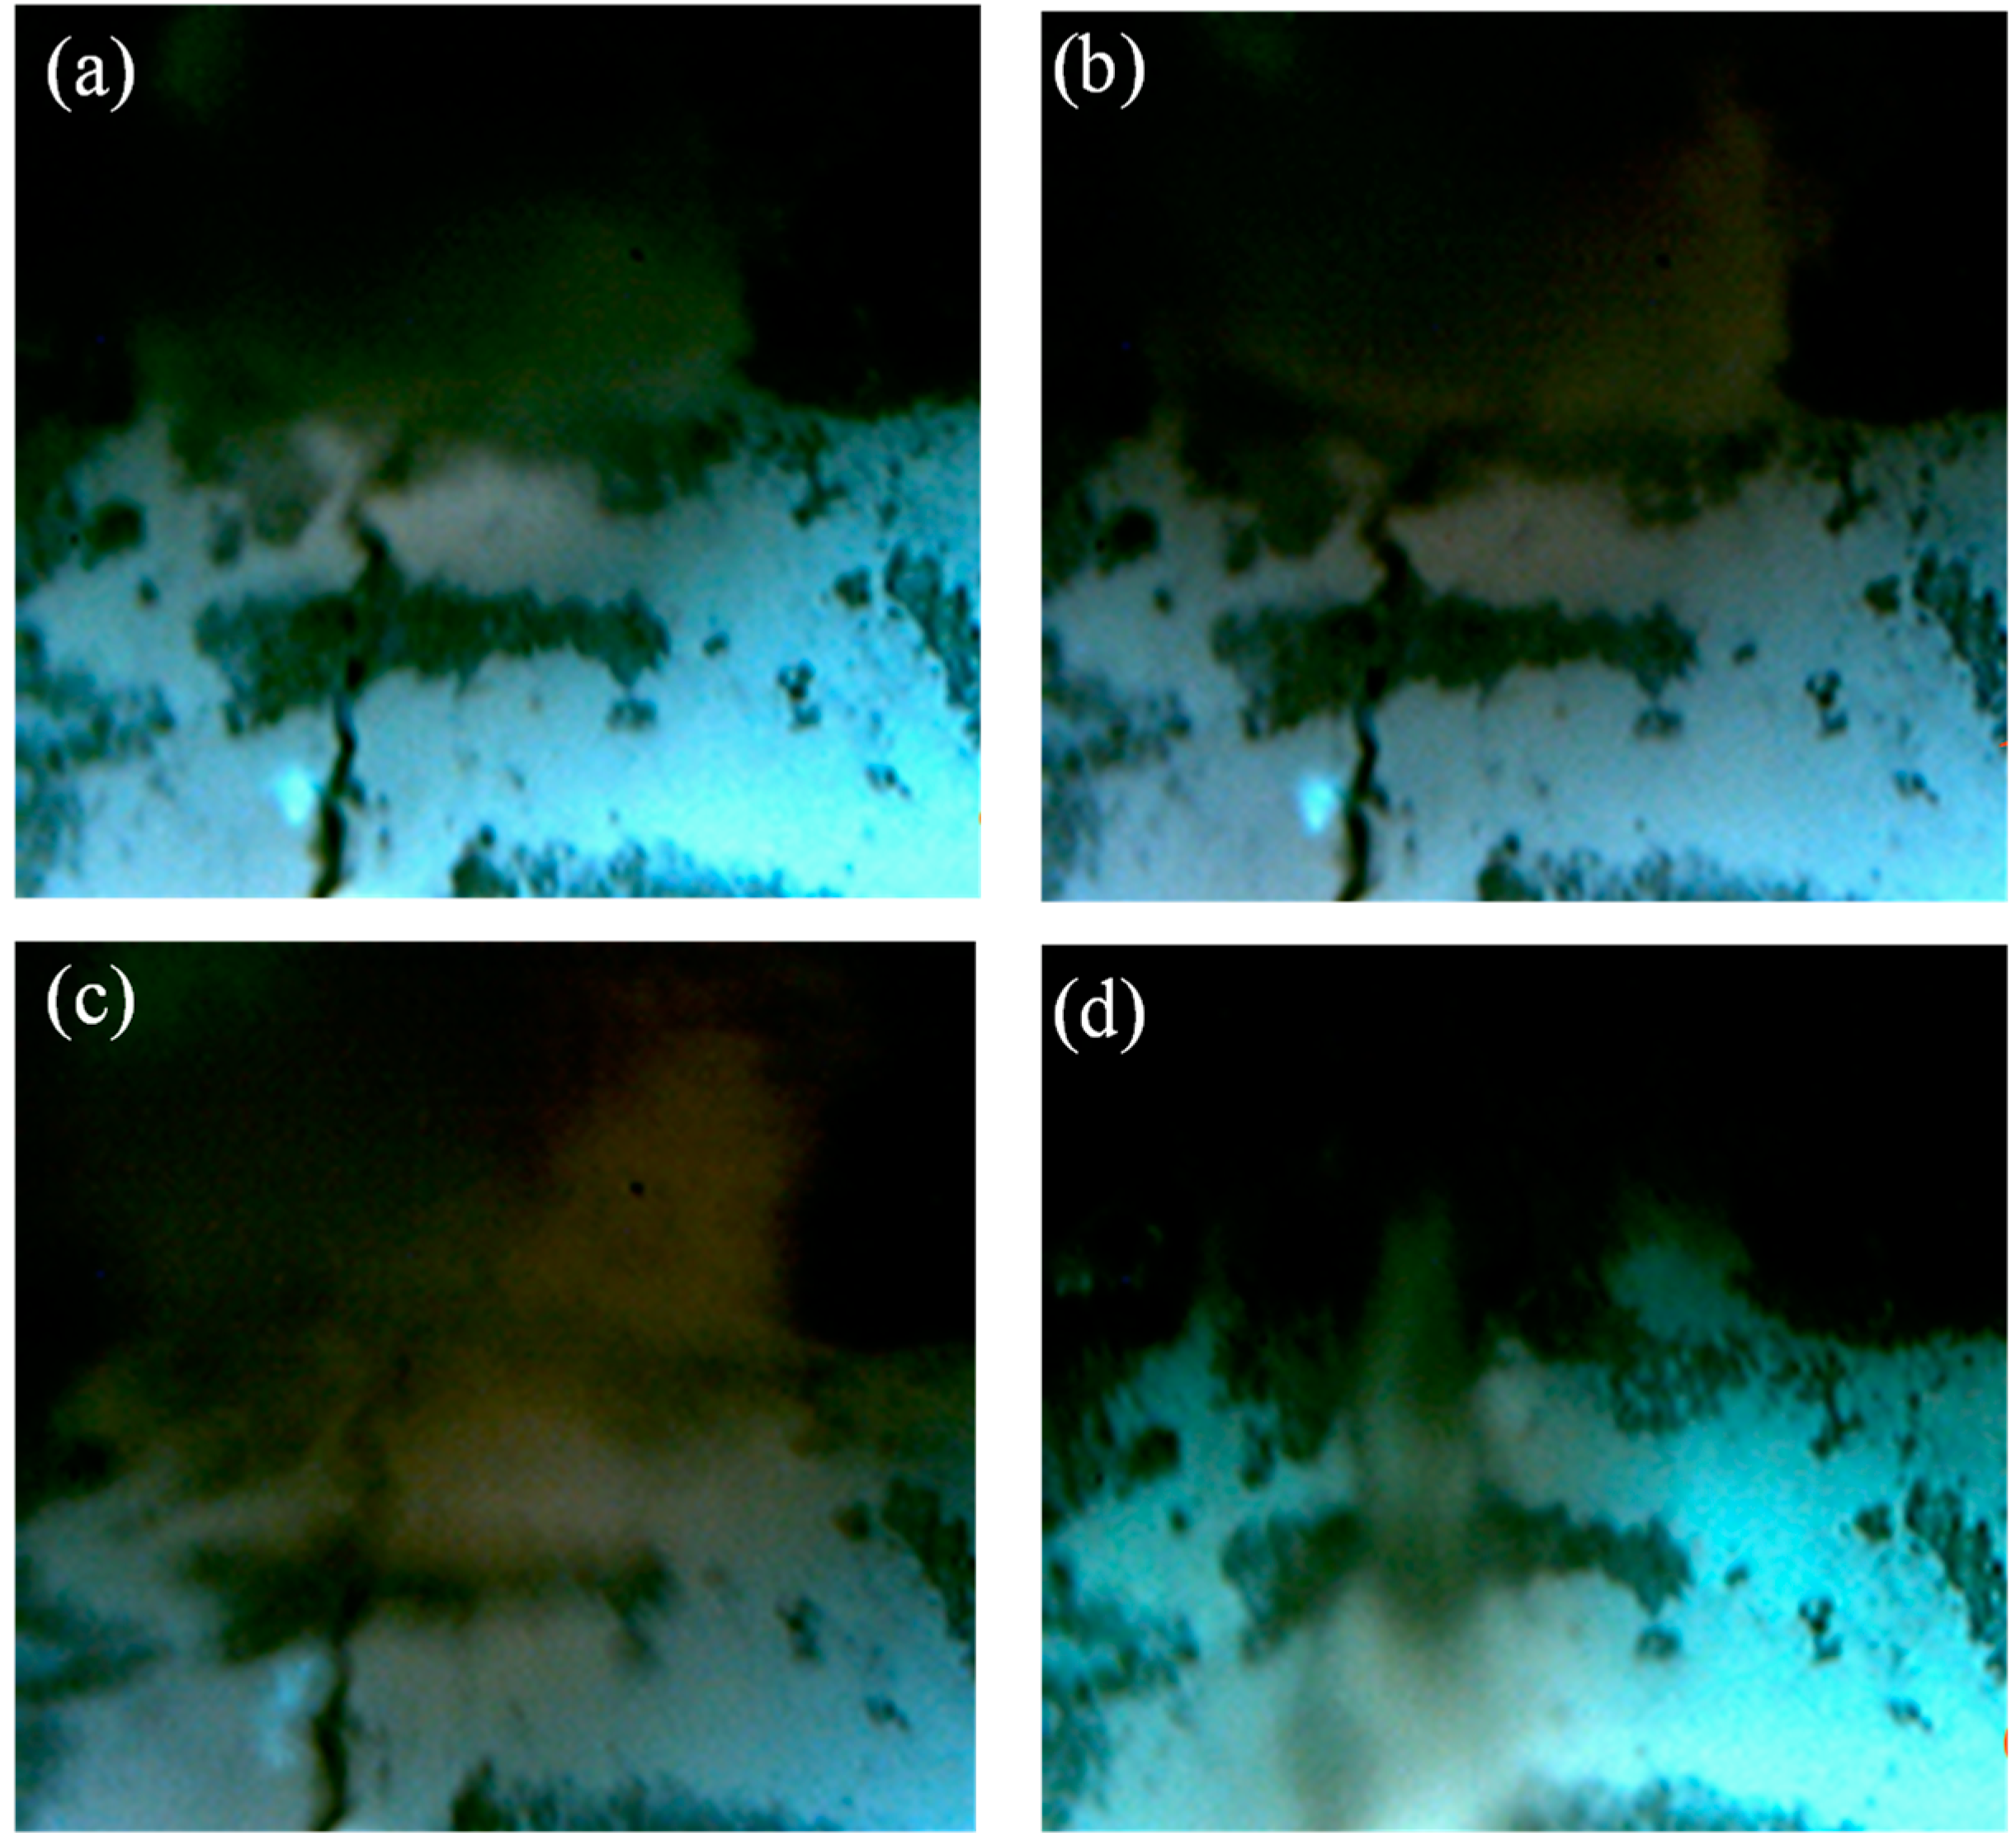
Figure 7.
Uniaxial compression test simulation for the Sanshandao gold mine: (a) stress-strain relation of the experiment and simulation test; (b) failure model with damage extent.
Figure 7.
Uniaxial compression test simulation for the Sanshandao gold mine: (a) stress-strain relation of the experiment and simulation test; (b) failure model with damage extent.
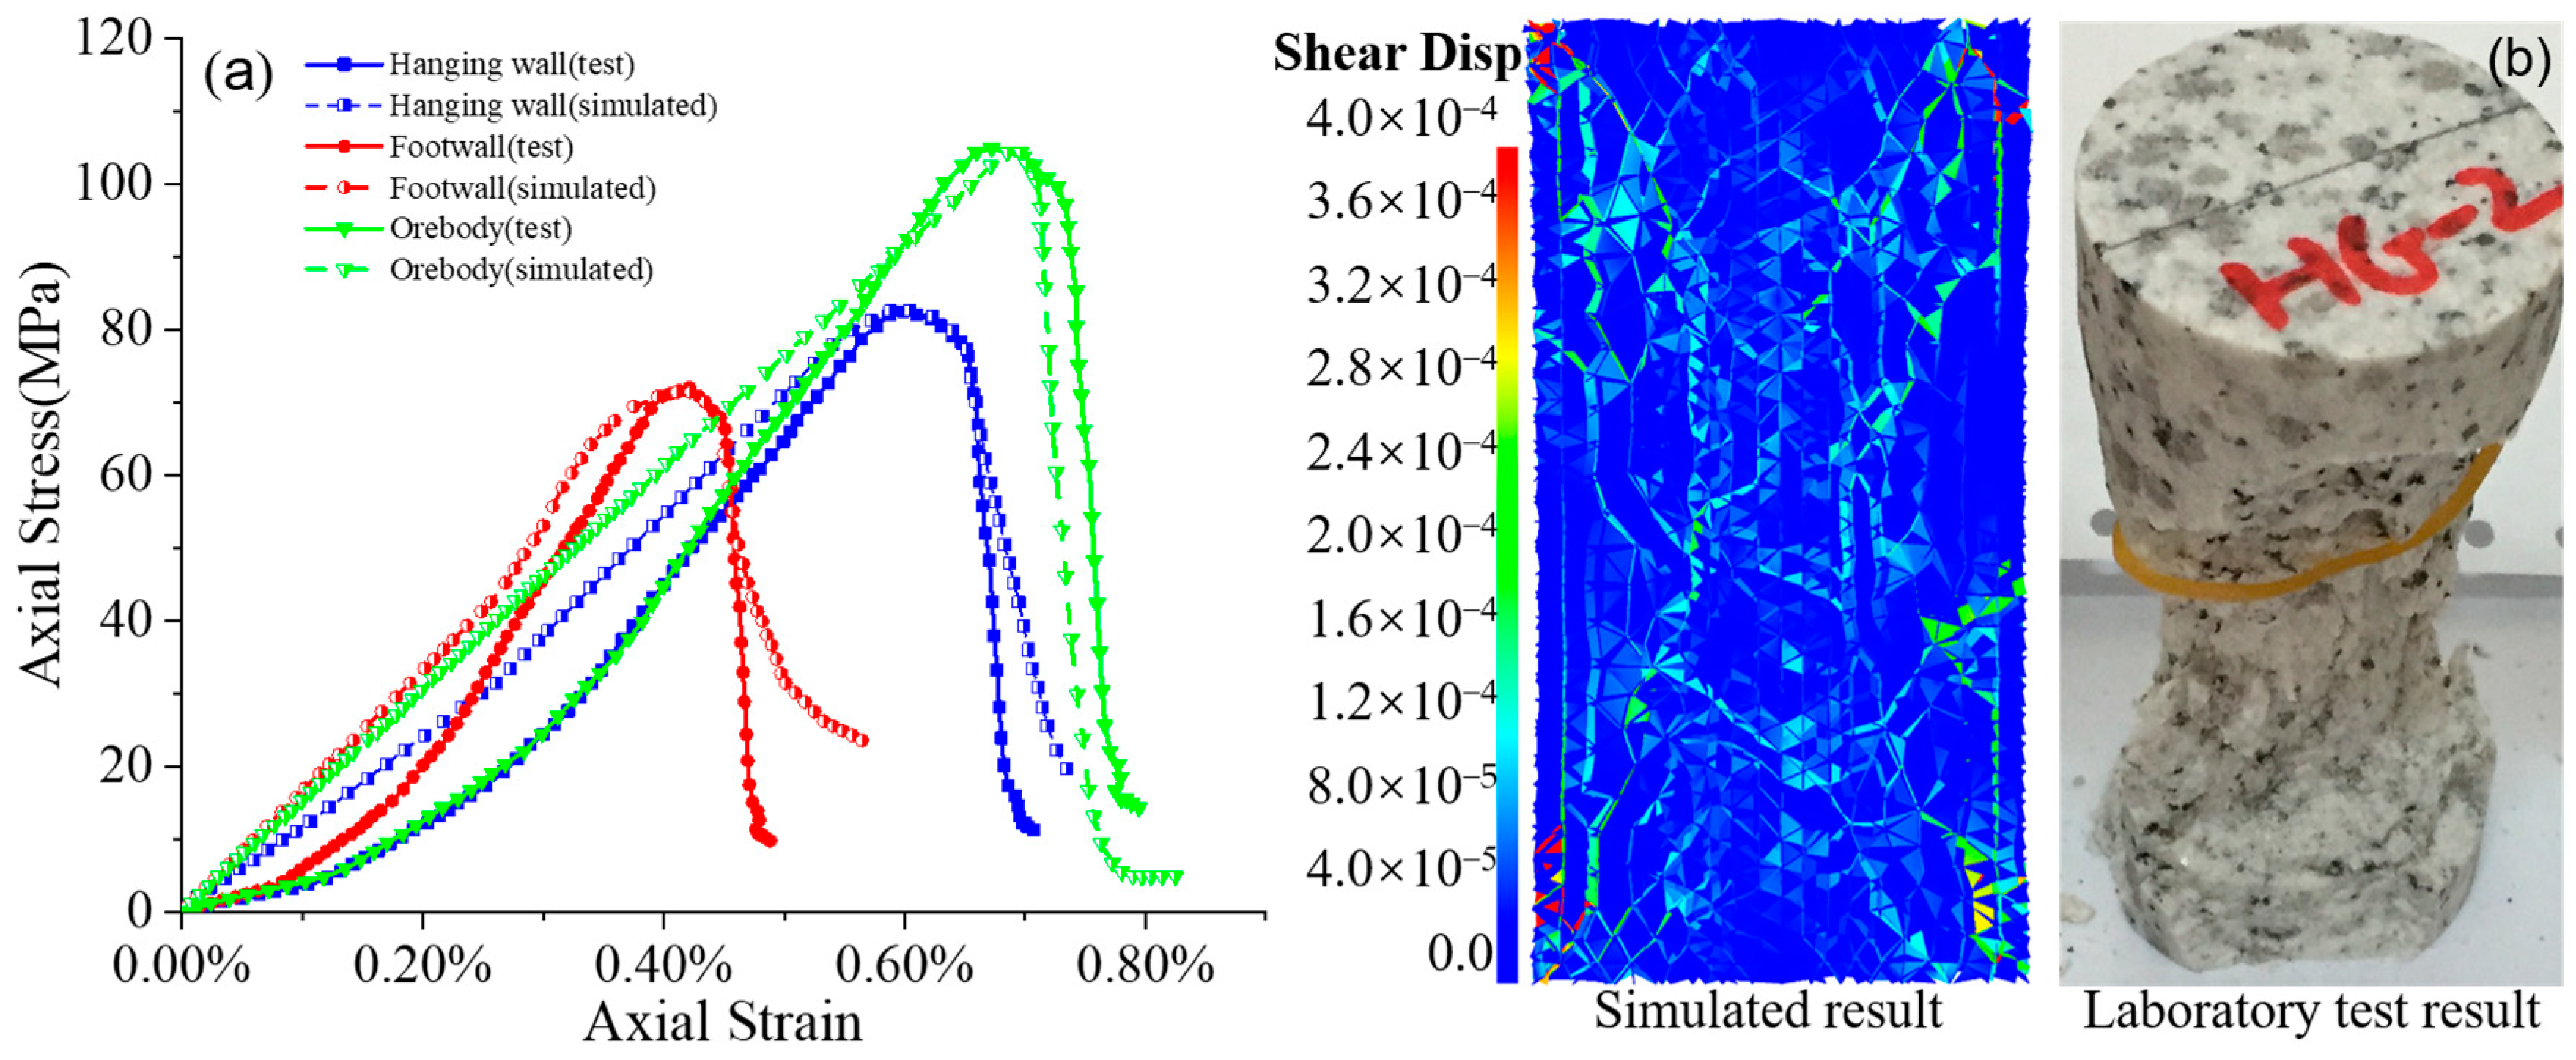
Figure 8.
Lithologies and geological structures in the model, (a) model profile, (b) model stereogram.
Figure 8.
Lithologies and geological structures in the model, (a) model profile, (b) model stereogram.
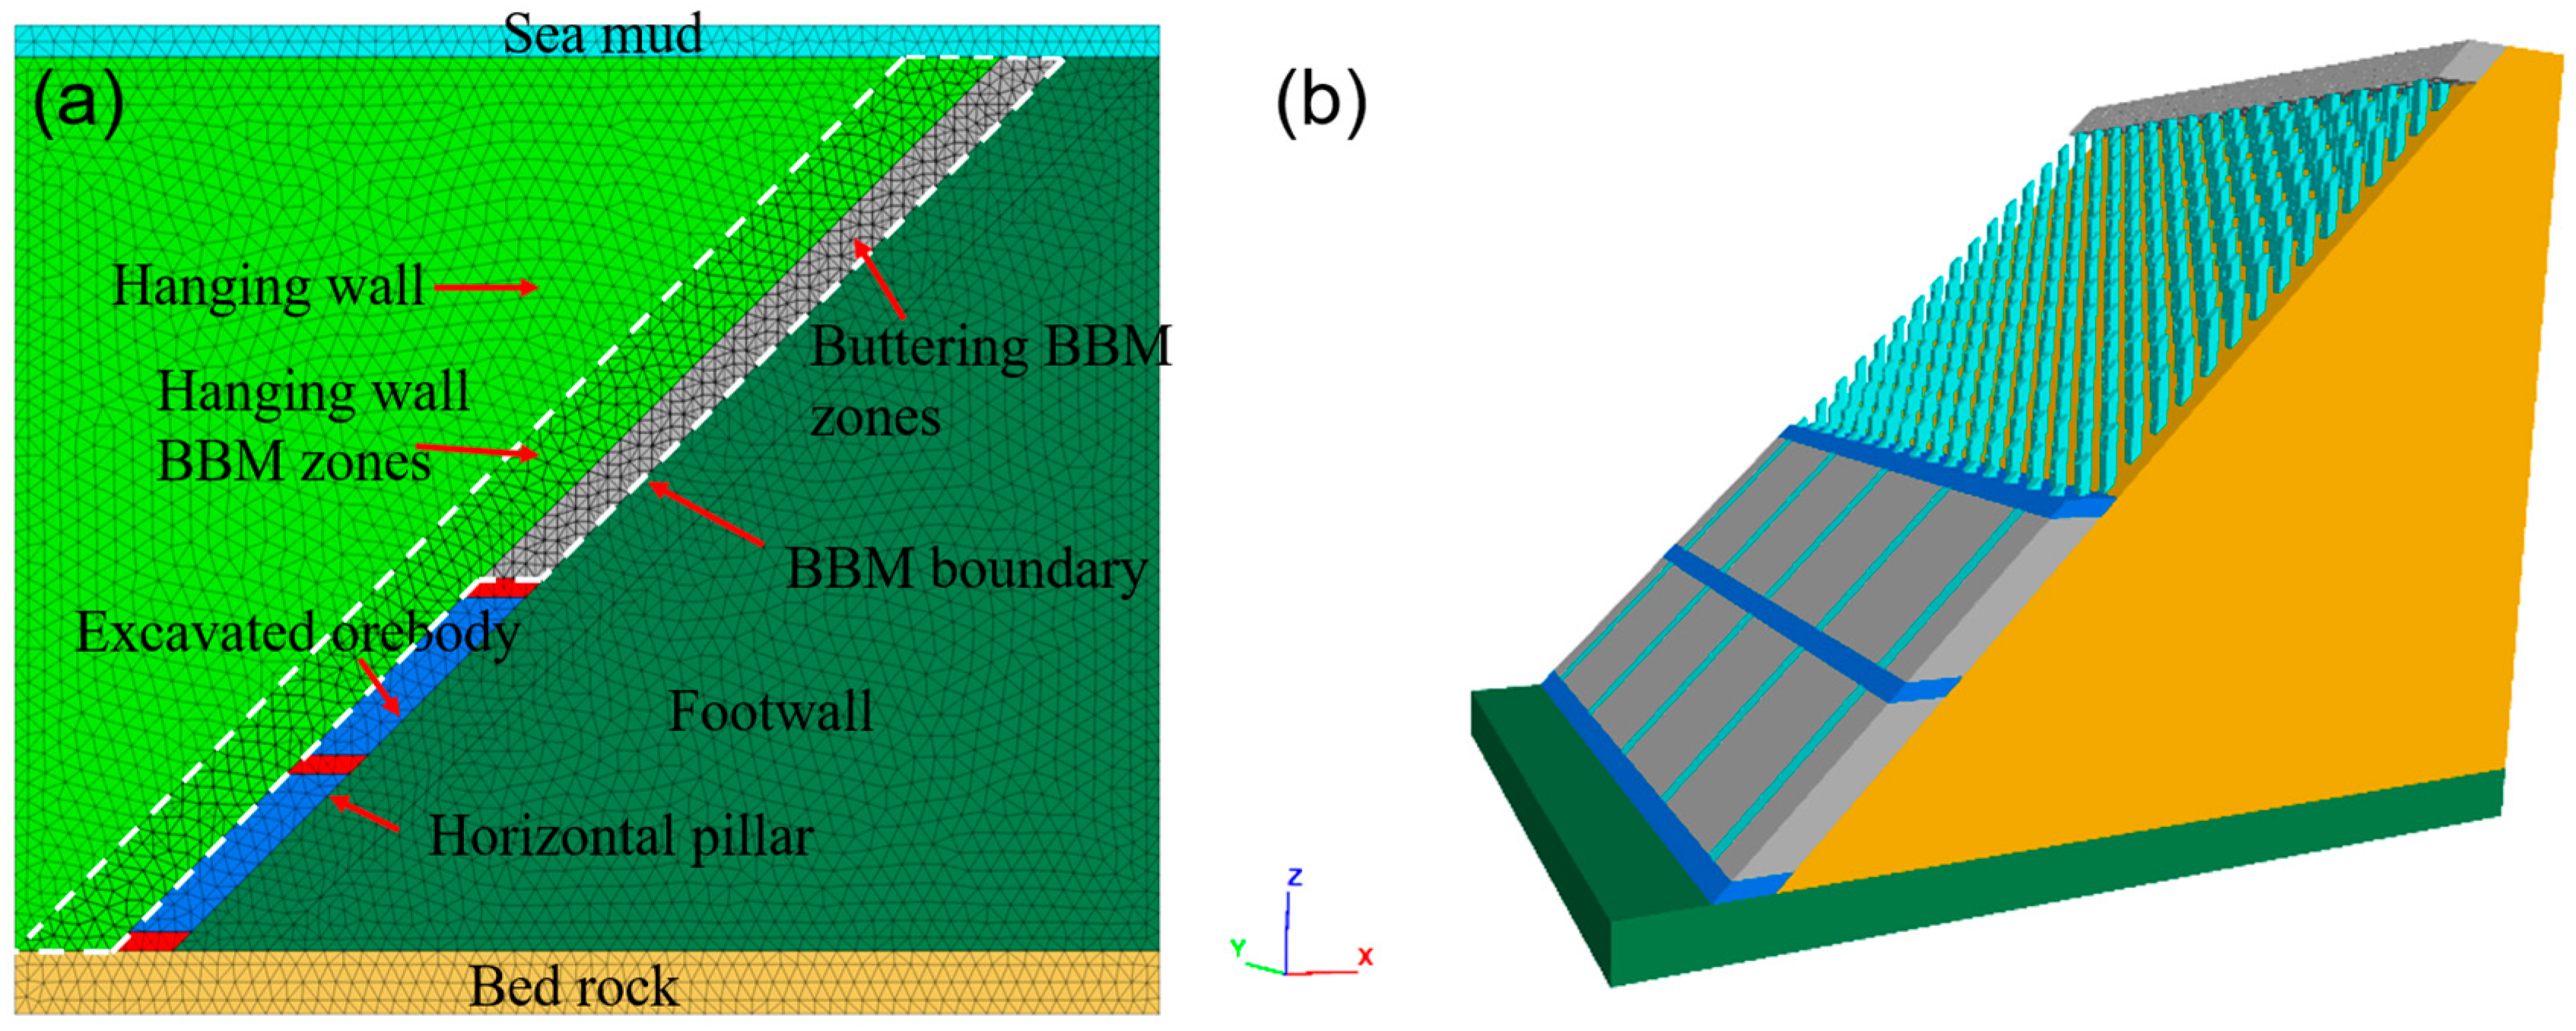
Figure 9.
Vertical displacements (contours) and fracture extensions (white lines) after excavation at different levels, with (a–l) corresponding to the excavation levels of −165 m to −55 m.
Figure 9.
Vertical displacements (contours) and fracture extensions (white lines) after excavation at different levels, with (a–l) corresponding to the excavation levels of −165 m to −55 m.

Figure 10.
Simulated fracturing pattern throughout the isolation layer excavation (a–l), with the red line indicating tensile fractures, the green line indicating shear fractures, and the white area indicating goafs.
Figure 10.
Simulated fracturing pattern throughout the isolation layer excavation (a–l), with the red line indicating tensile fractures, the green line indicating shear fractures, and the white area indicating goafs.
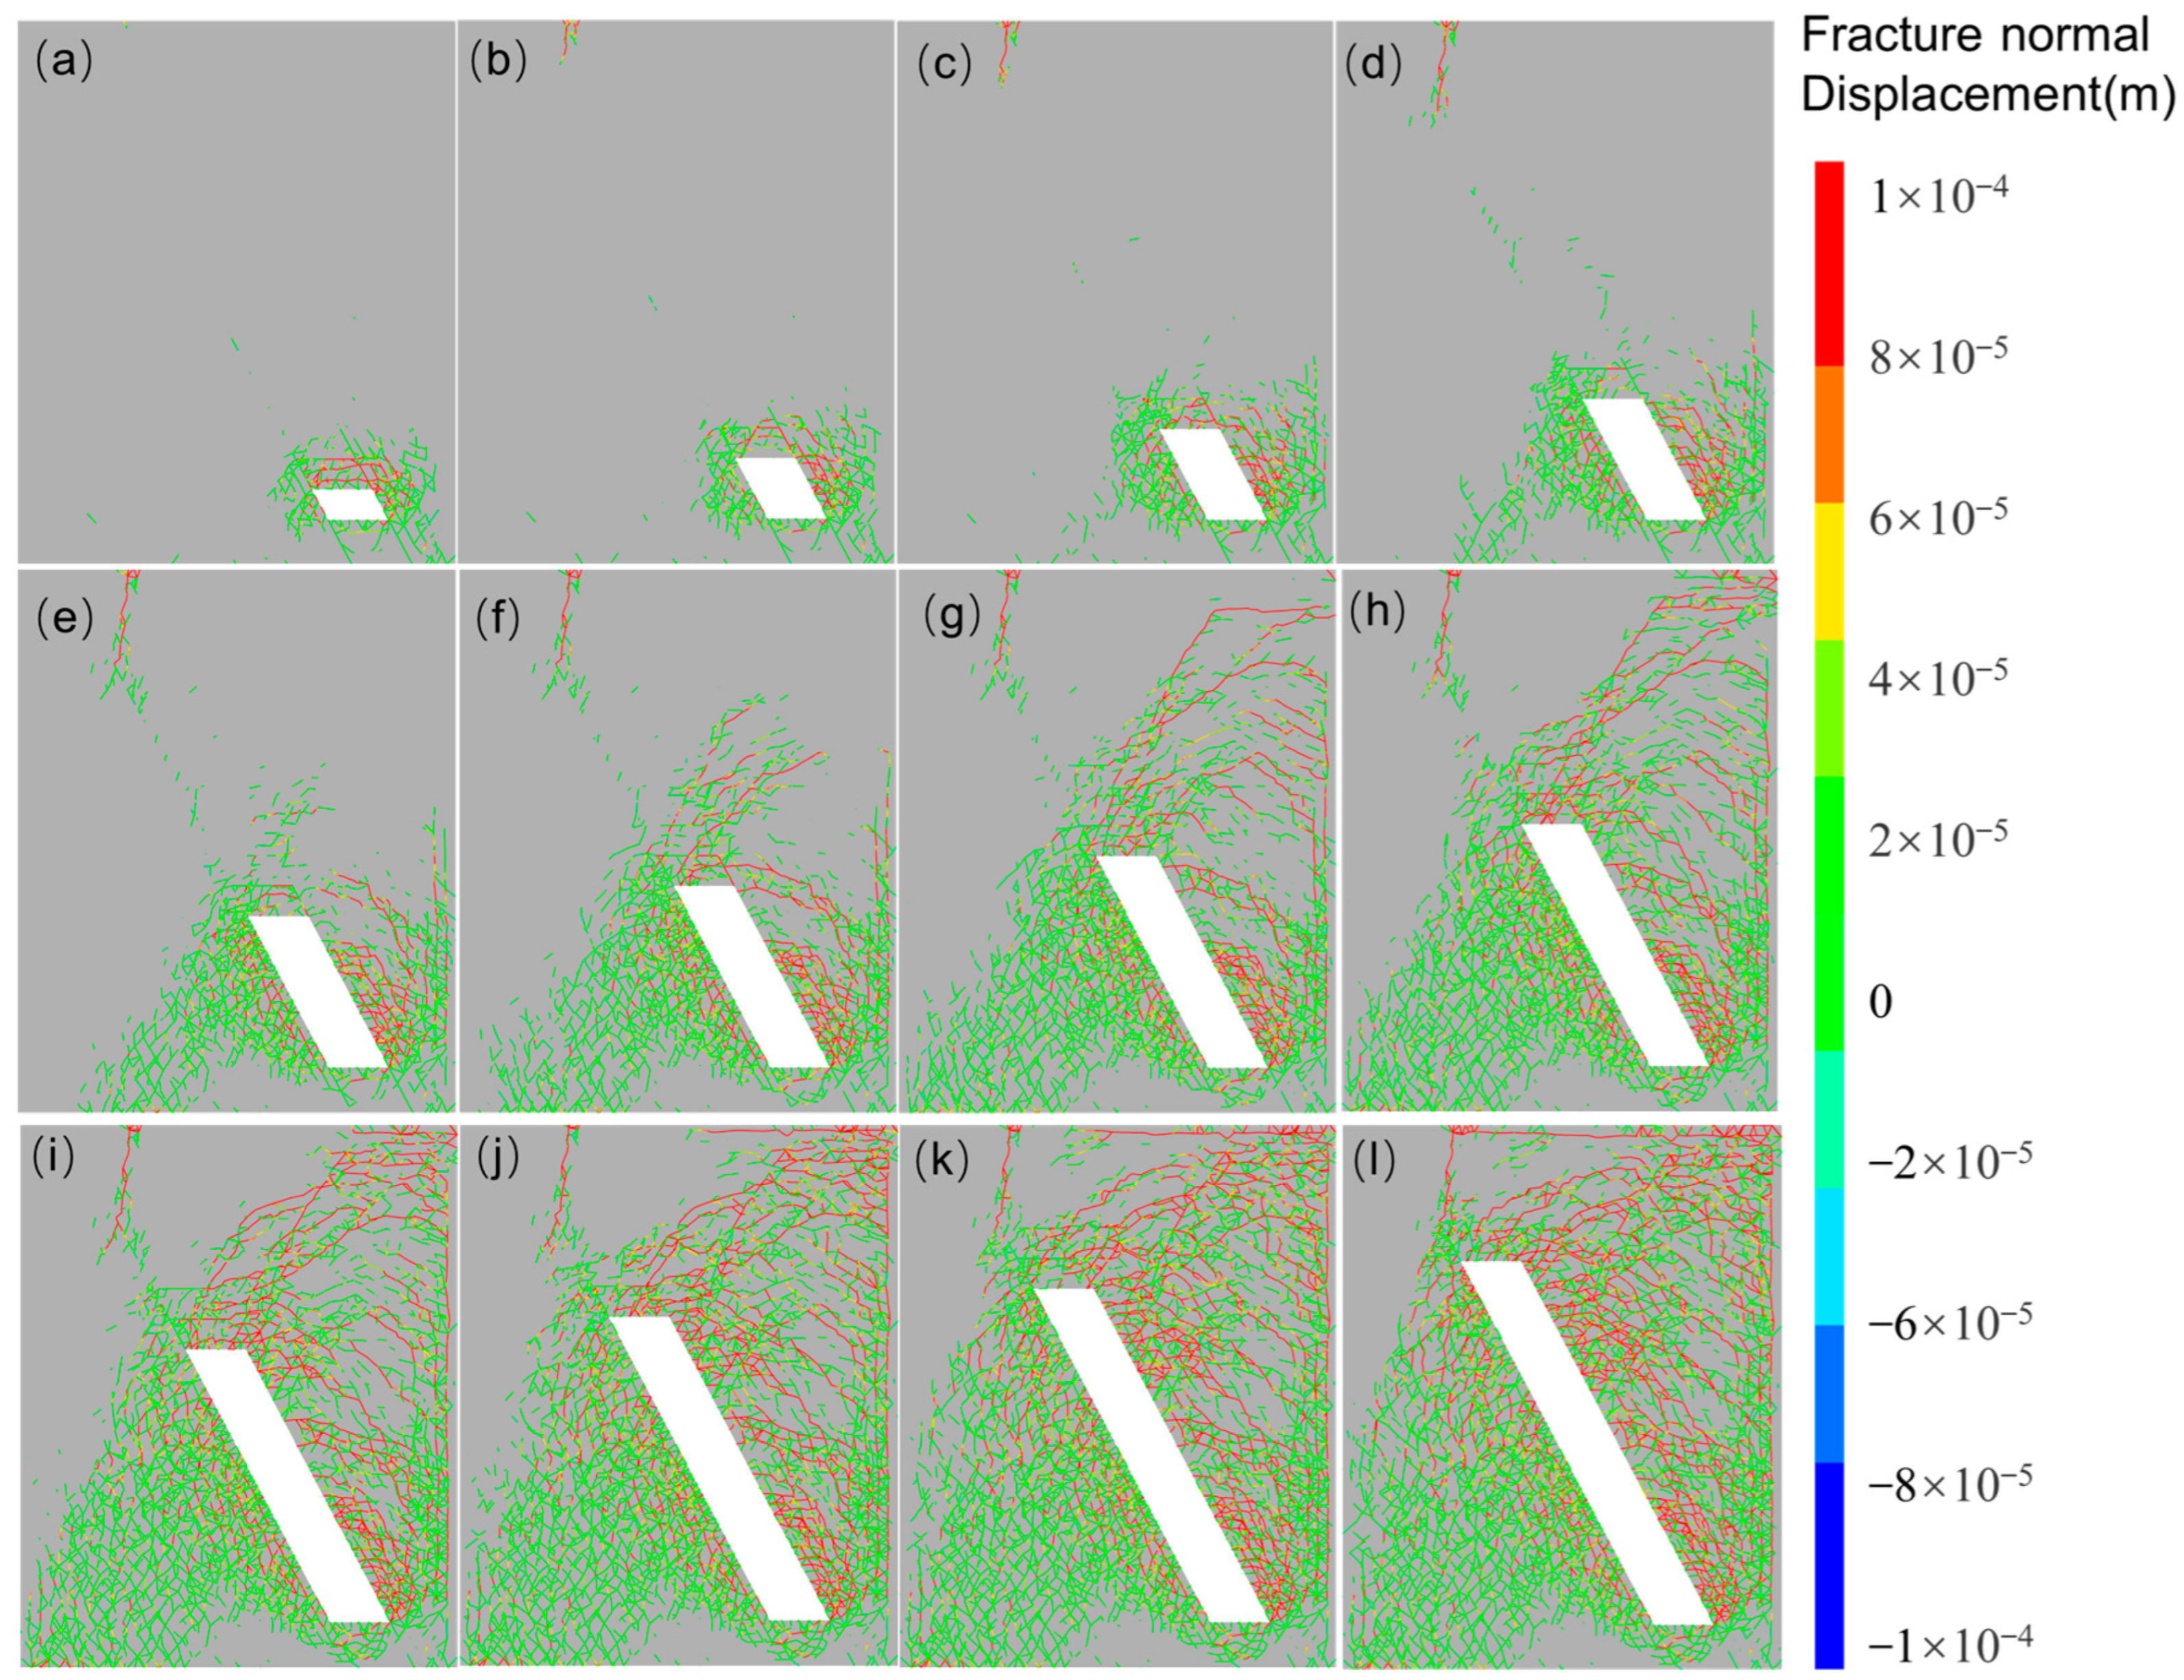
Figure 11.
Image binarization processing of fracture extension evolution (level −155 m): (a) fracture propagation, (b) fracture binarization treatment.
Figure 11.
Image binarization processing of fracture extension evolution (level −155 m): (a) fracture propagation, (b) fracture binarization treatment.

Figure 12.
Fractal dimension around the isolation layer: (a) mining level −165 m; (b) mining level −135 m; (c) mining level −95 m; (d) mining level −45 m.
Figure 12.
Fractal dimension around the isolation layer: (a) mining level −165 m; (b) mining level −135 m; (c) mining level −95 m; (d) mining level −45 m.
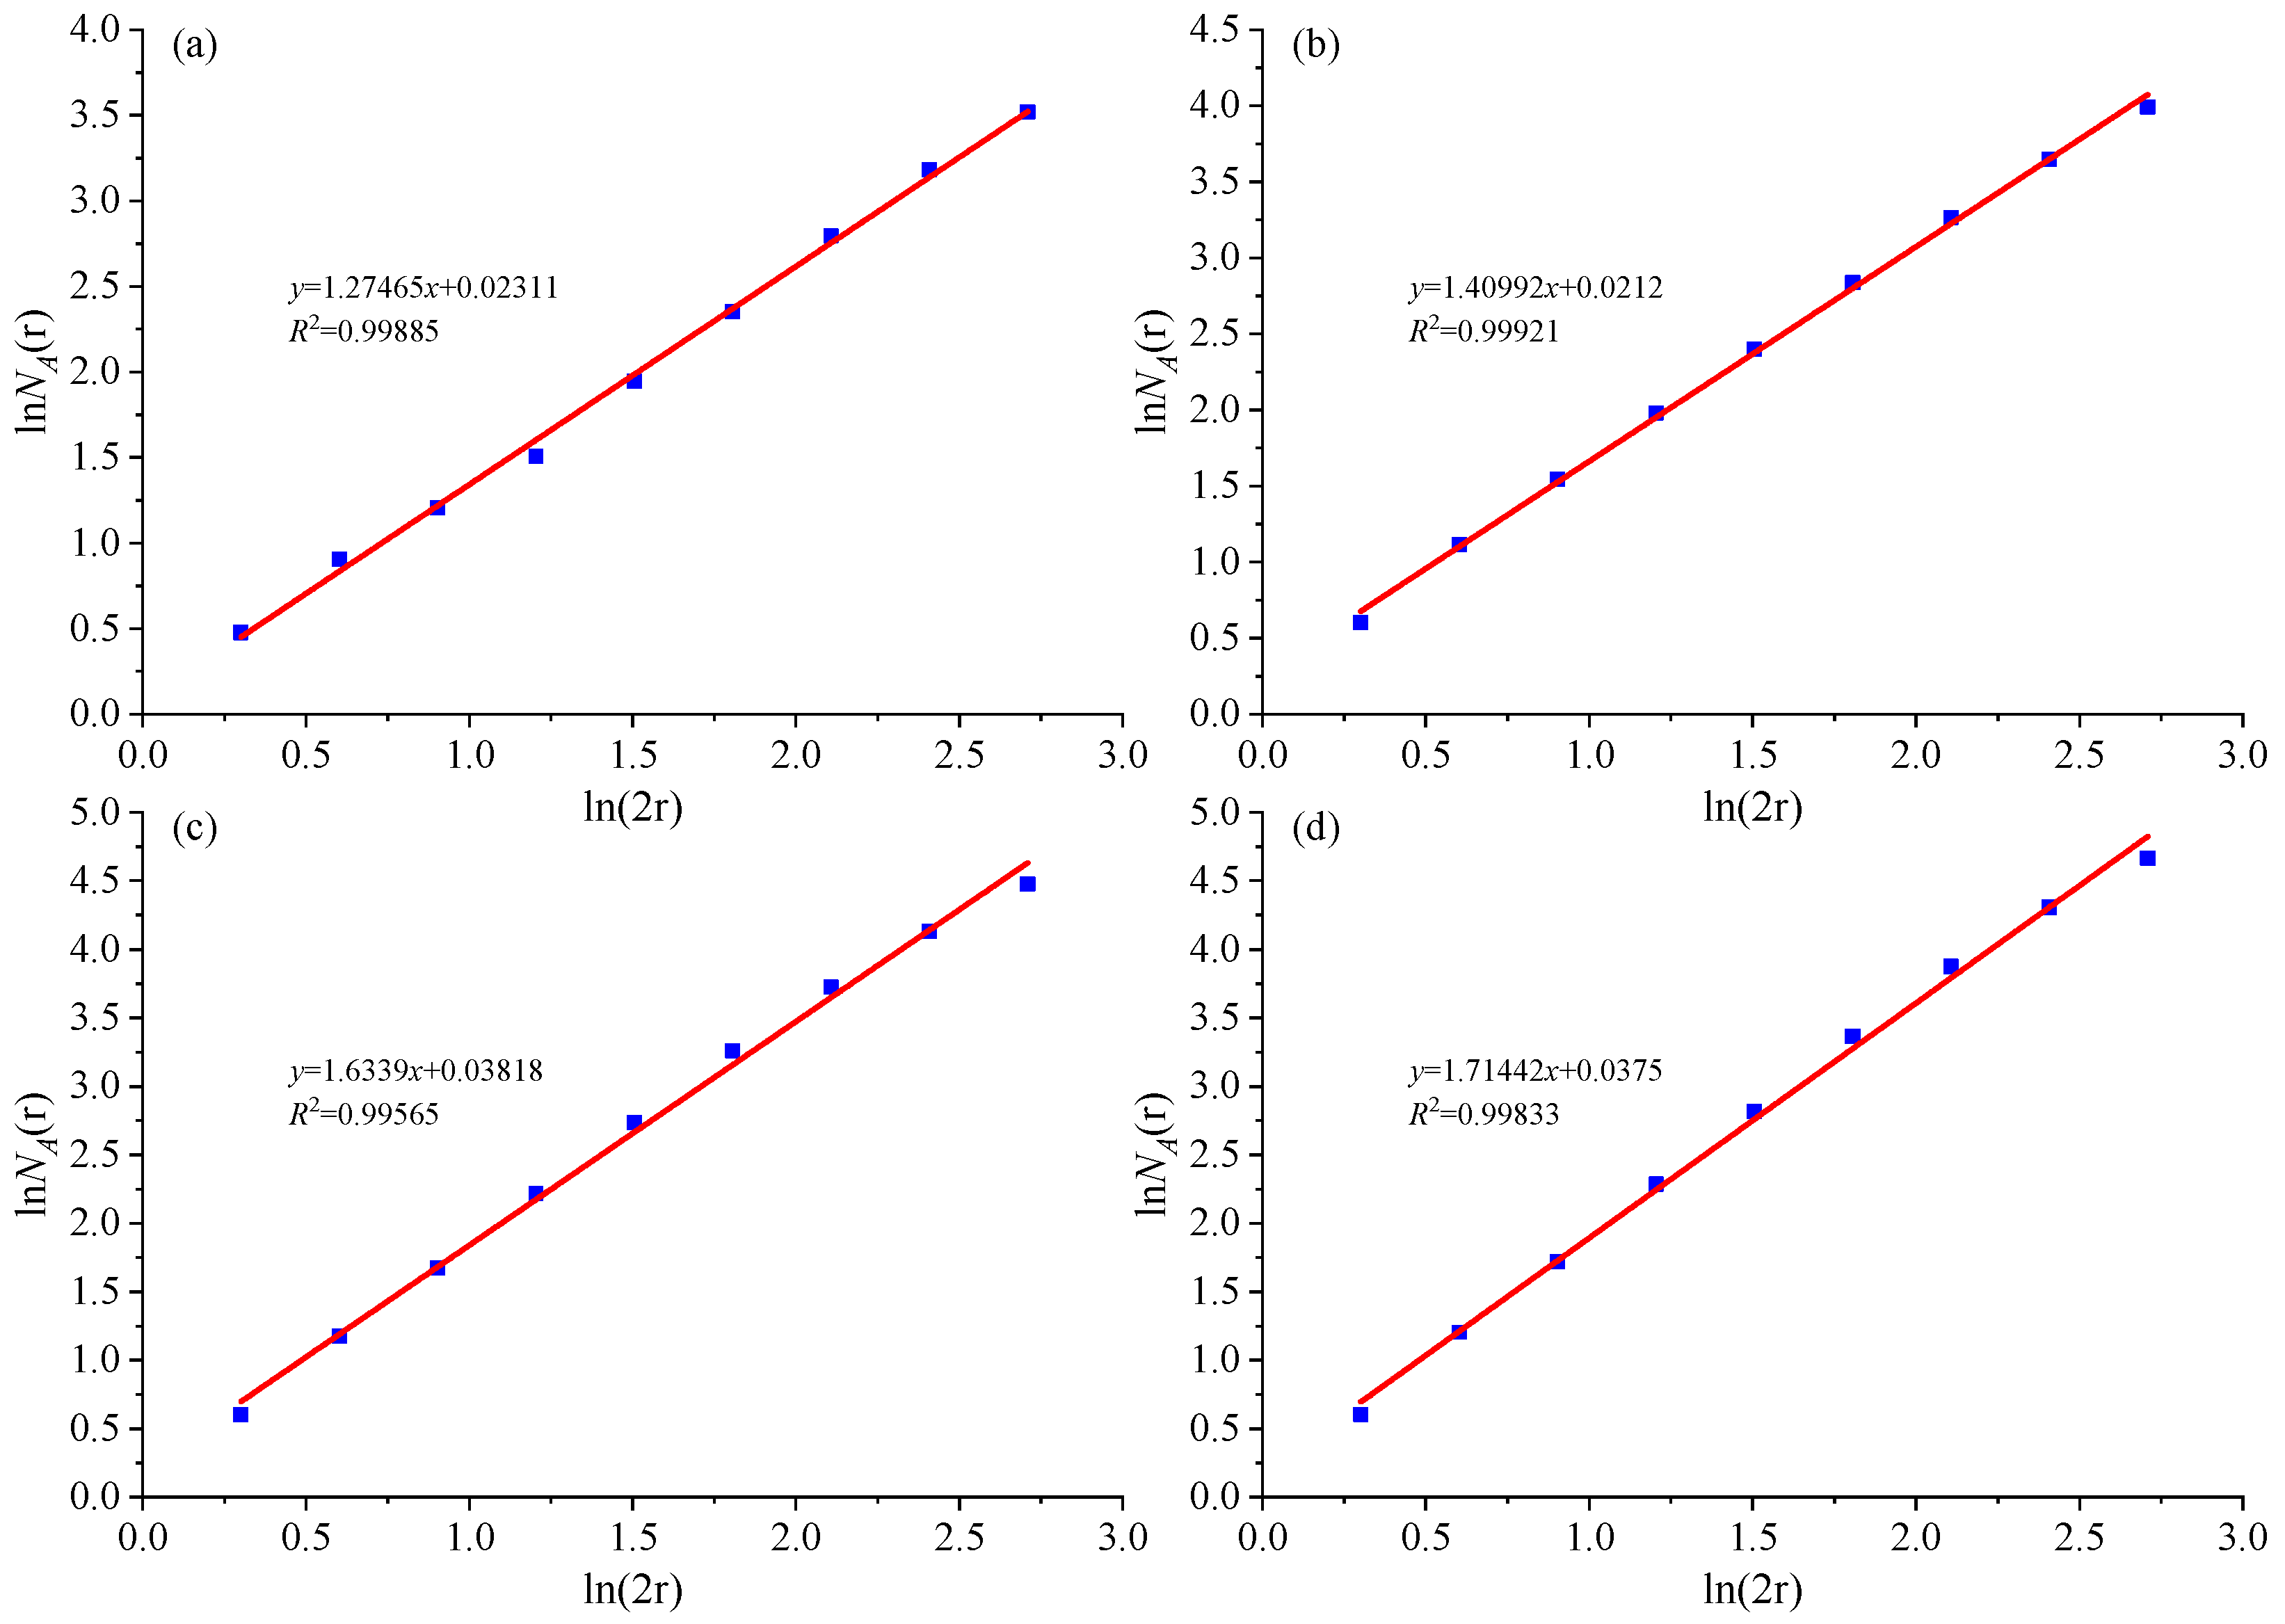
Figure 13.
Rock mass fracture fractal dimension with mining steps.
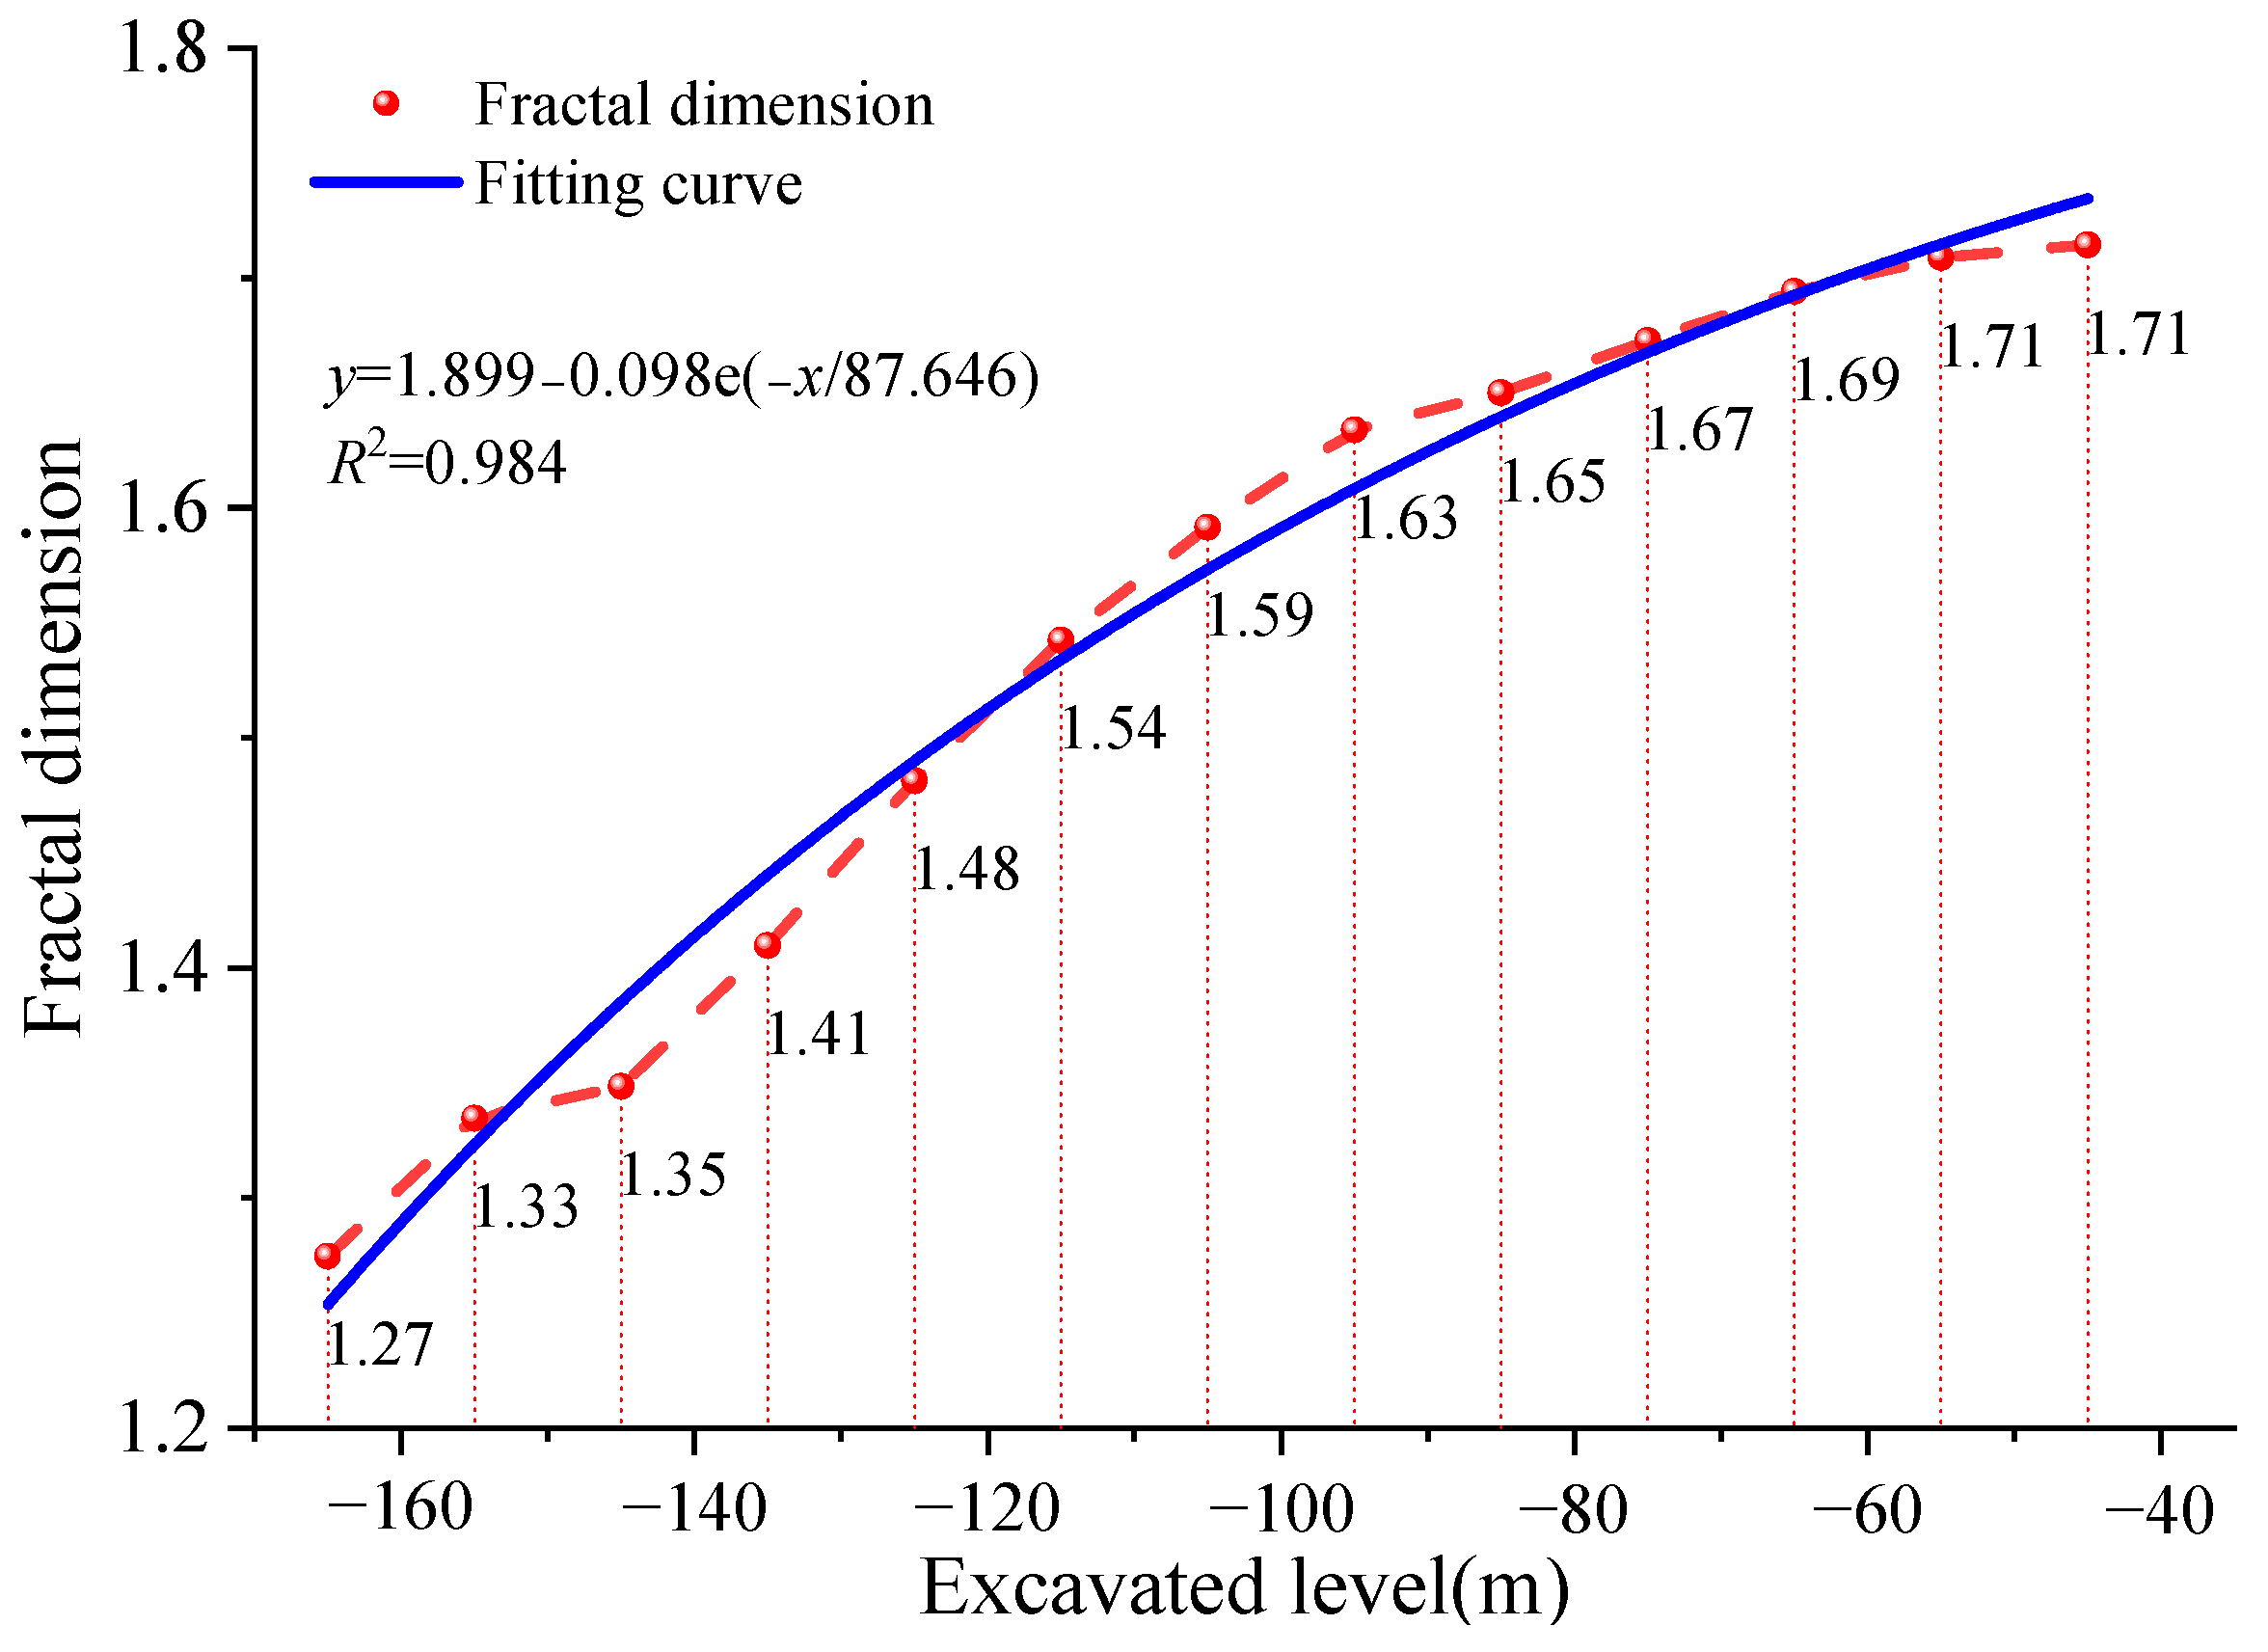
Figure 14.
Fracture flow discharge rate after excavation at different mining levels, with (a–l) corresponding to the excavation levels of −165 m to −55 m, and the white area corresponding to the goafs.
Figure 14.
Fracture flow discharge rate after excavation at different mining levels, with (a–l) corresponding to the excavation levels of −165 m to −55 m, and the white area corresponding to the goafs.
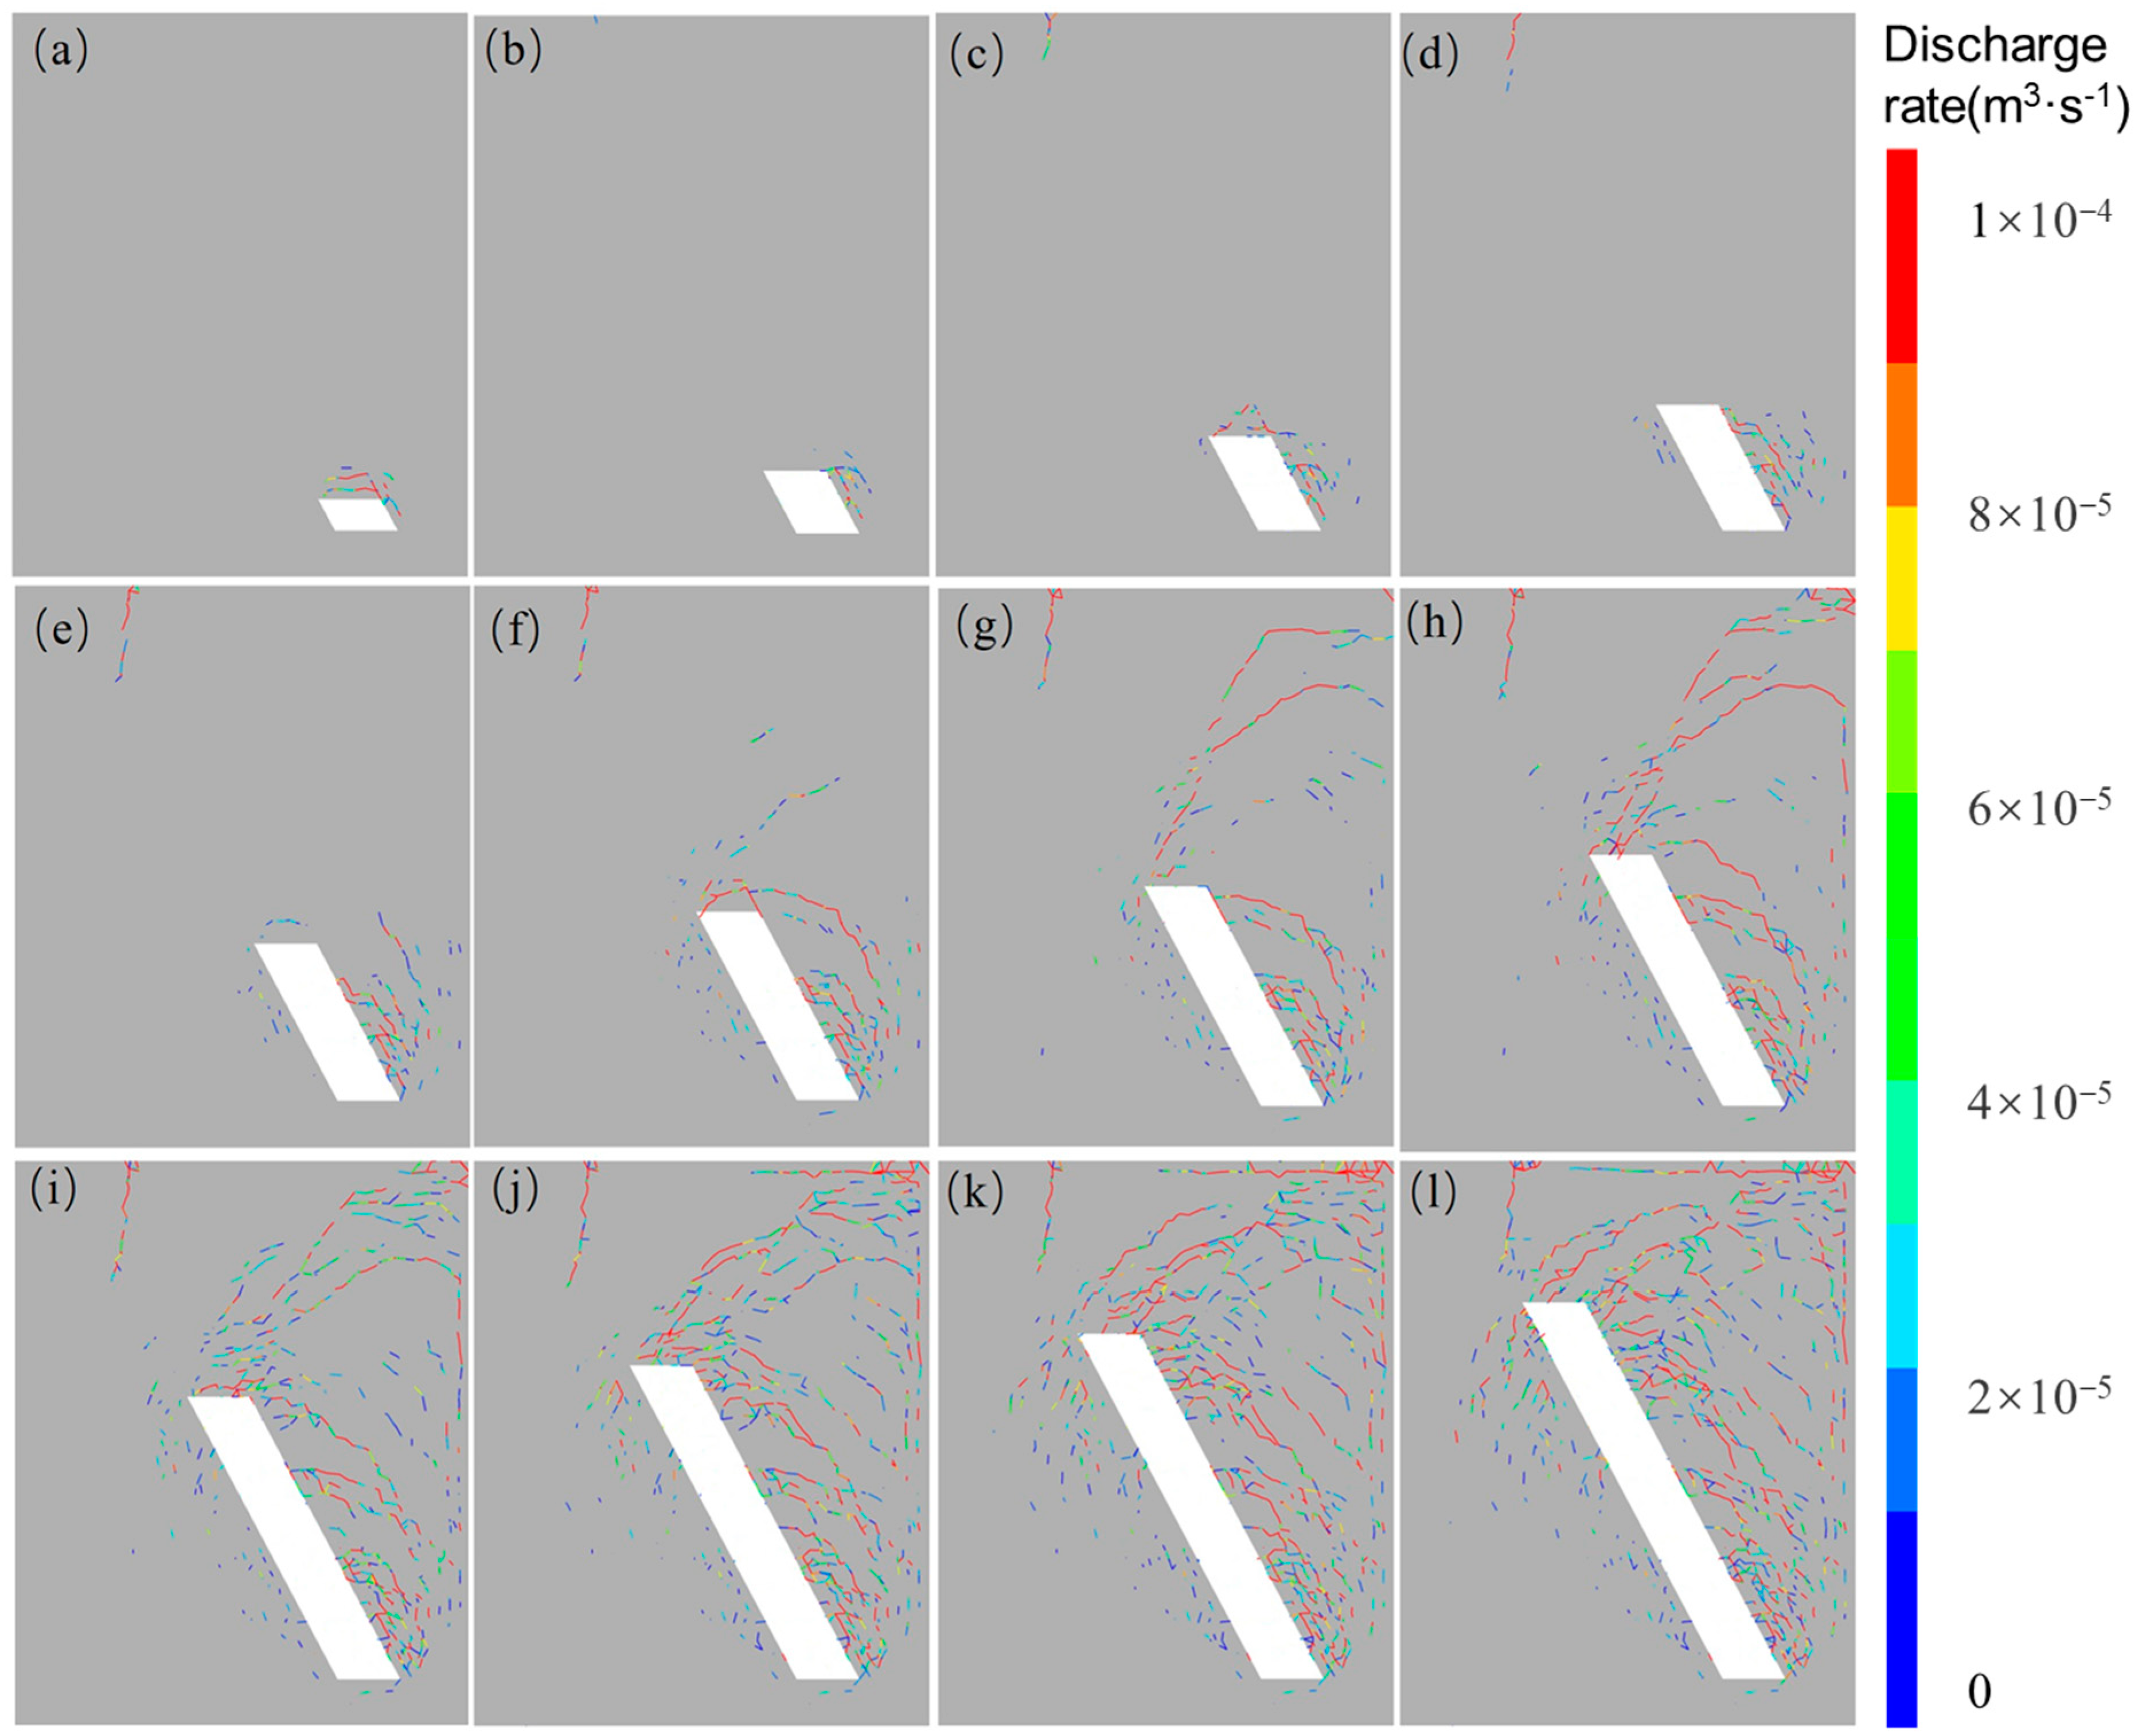
Figure 15.
On-site investigation of crushing zone (a) and water inrush in hanging wall (b).
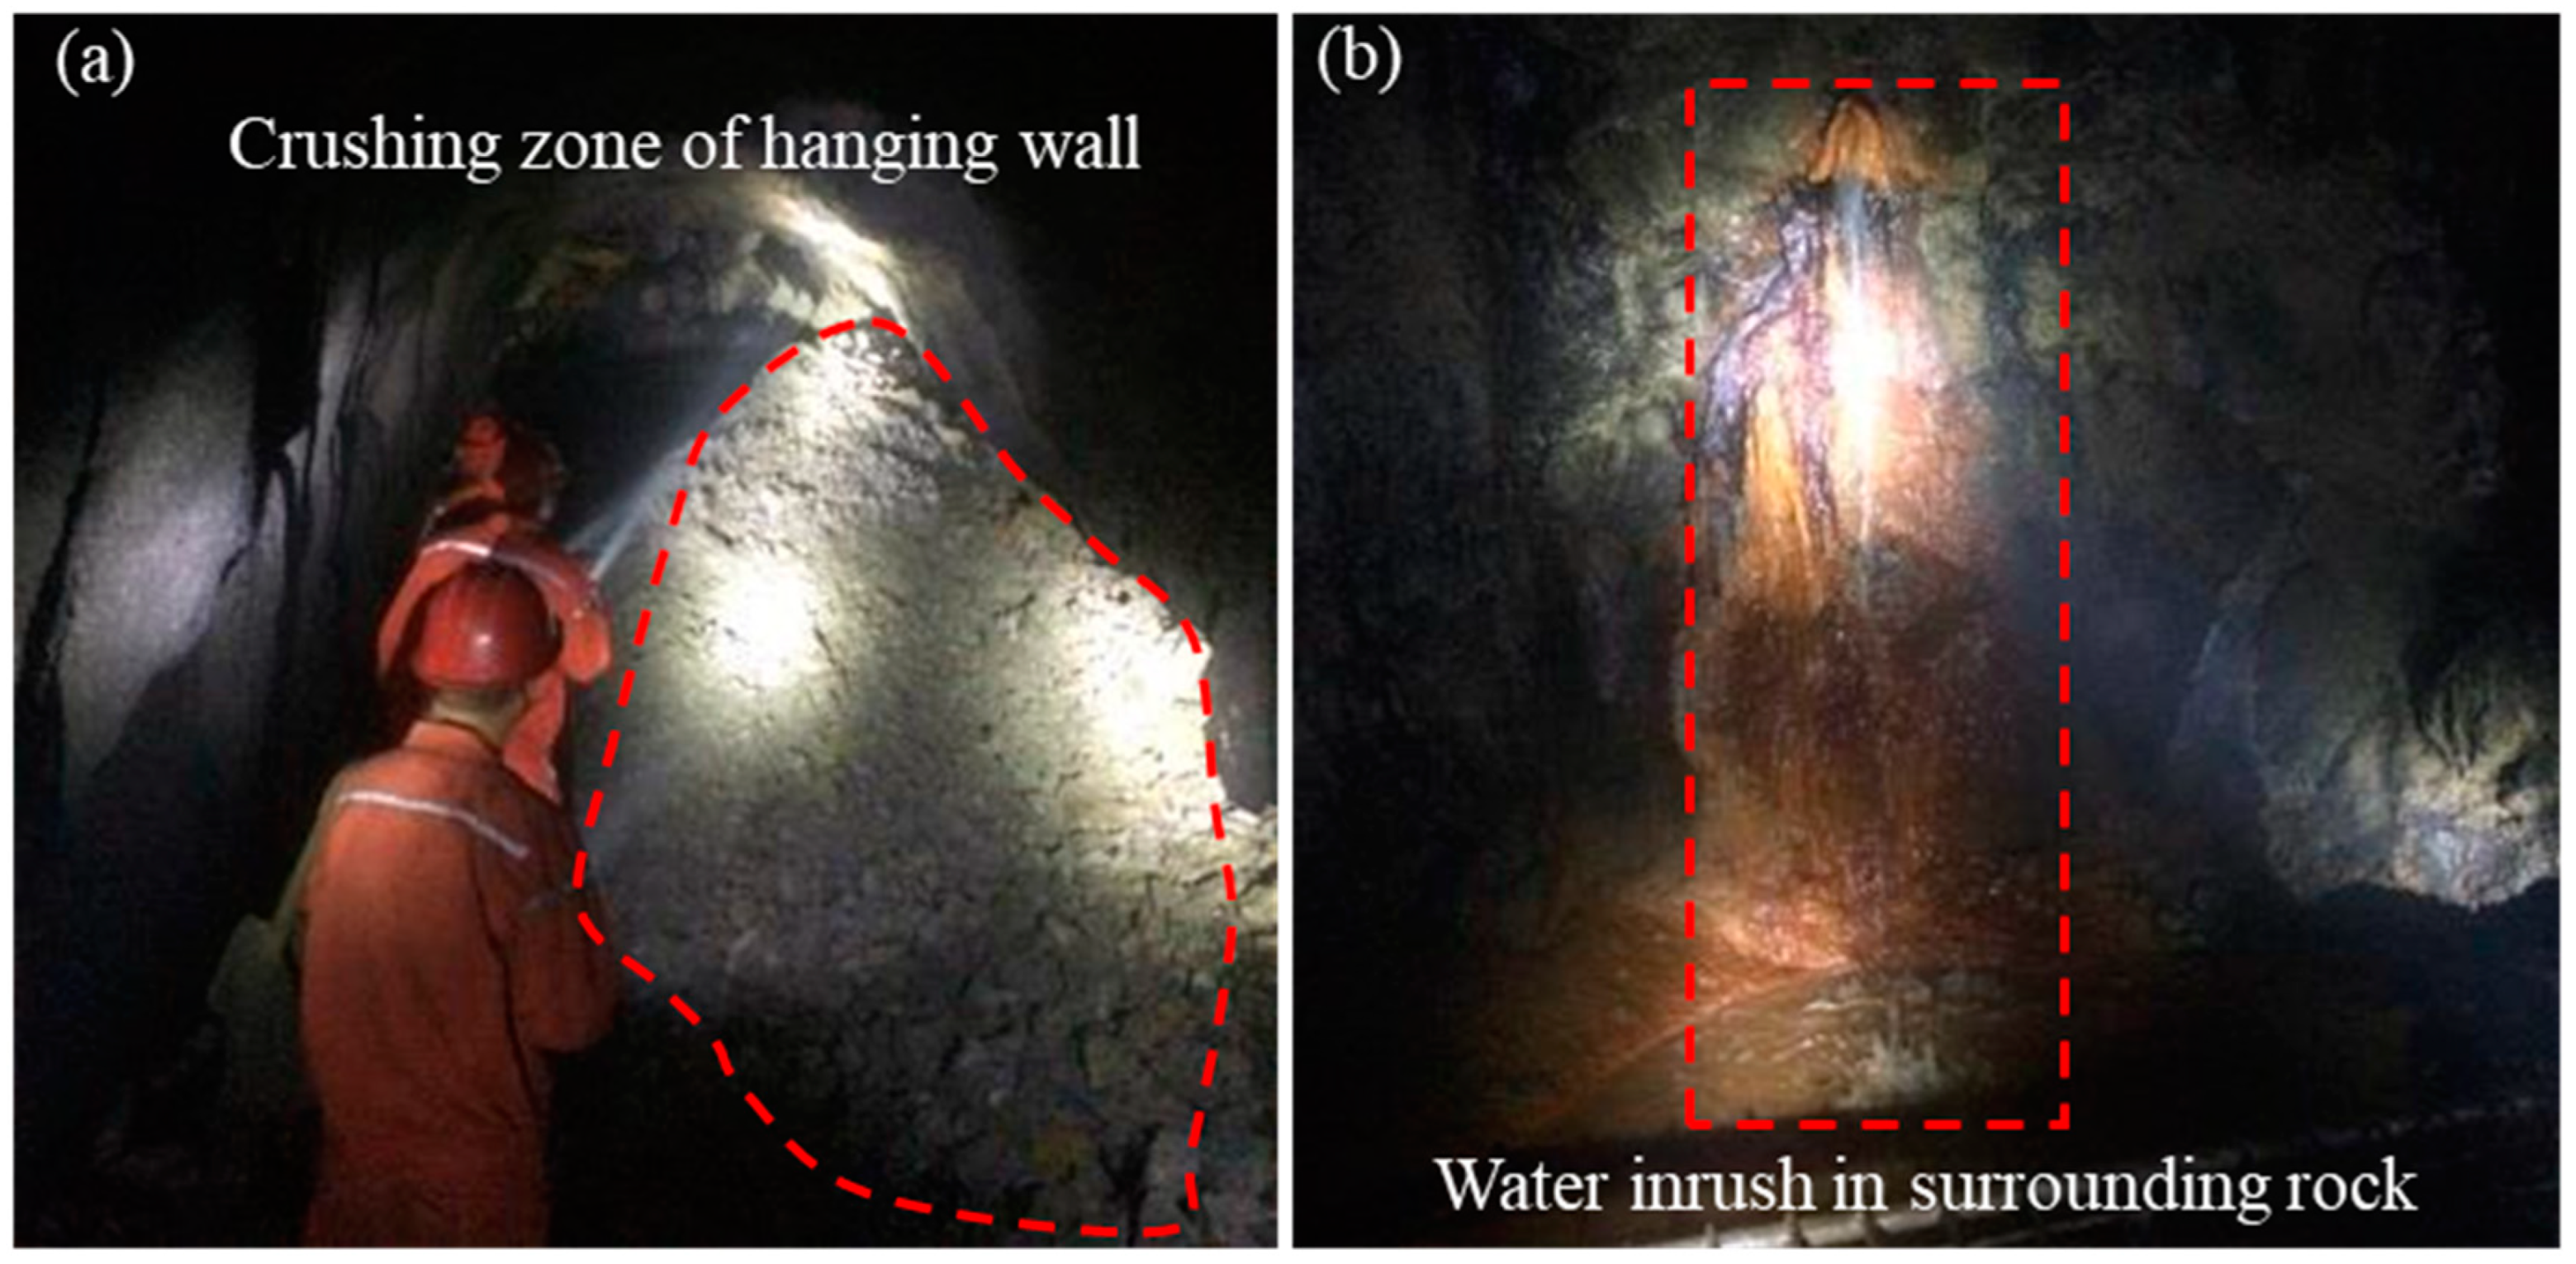
Figure 16.
Borehole scanning and displacement monitoring point layout profile at level −155 m.
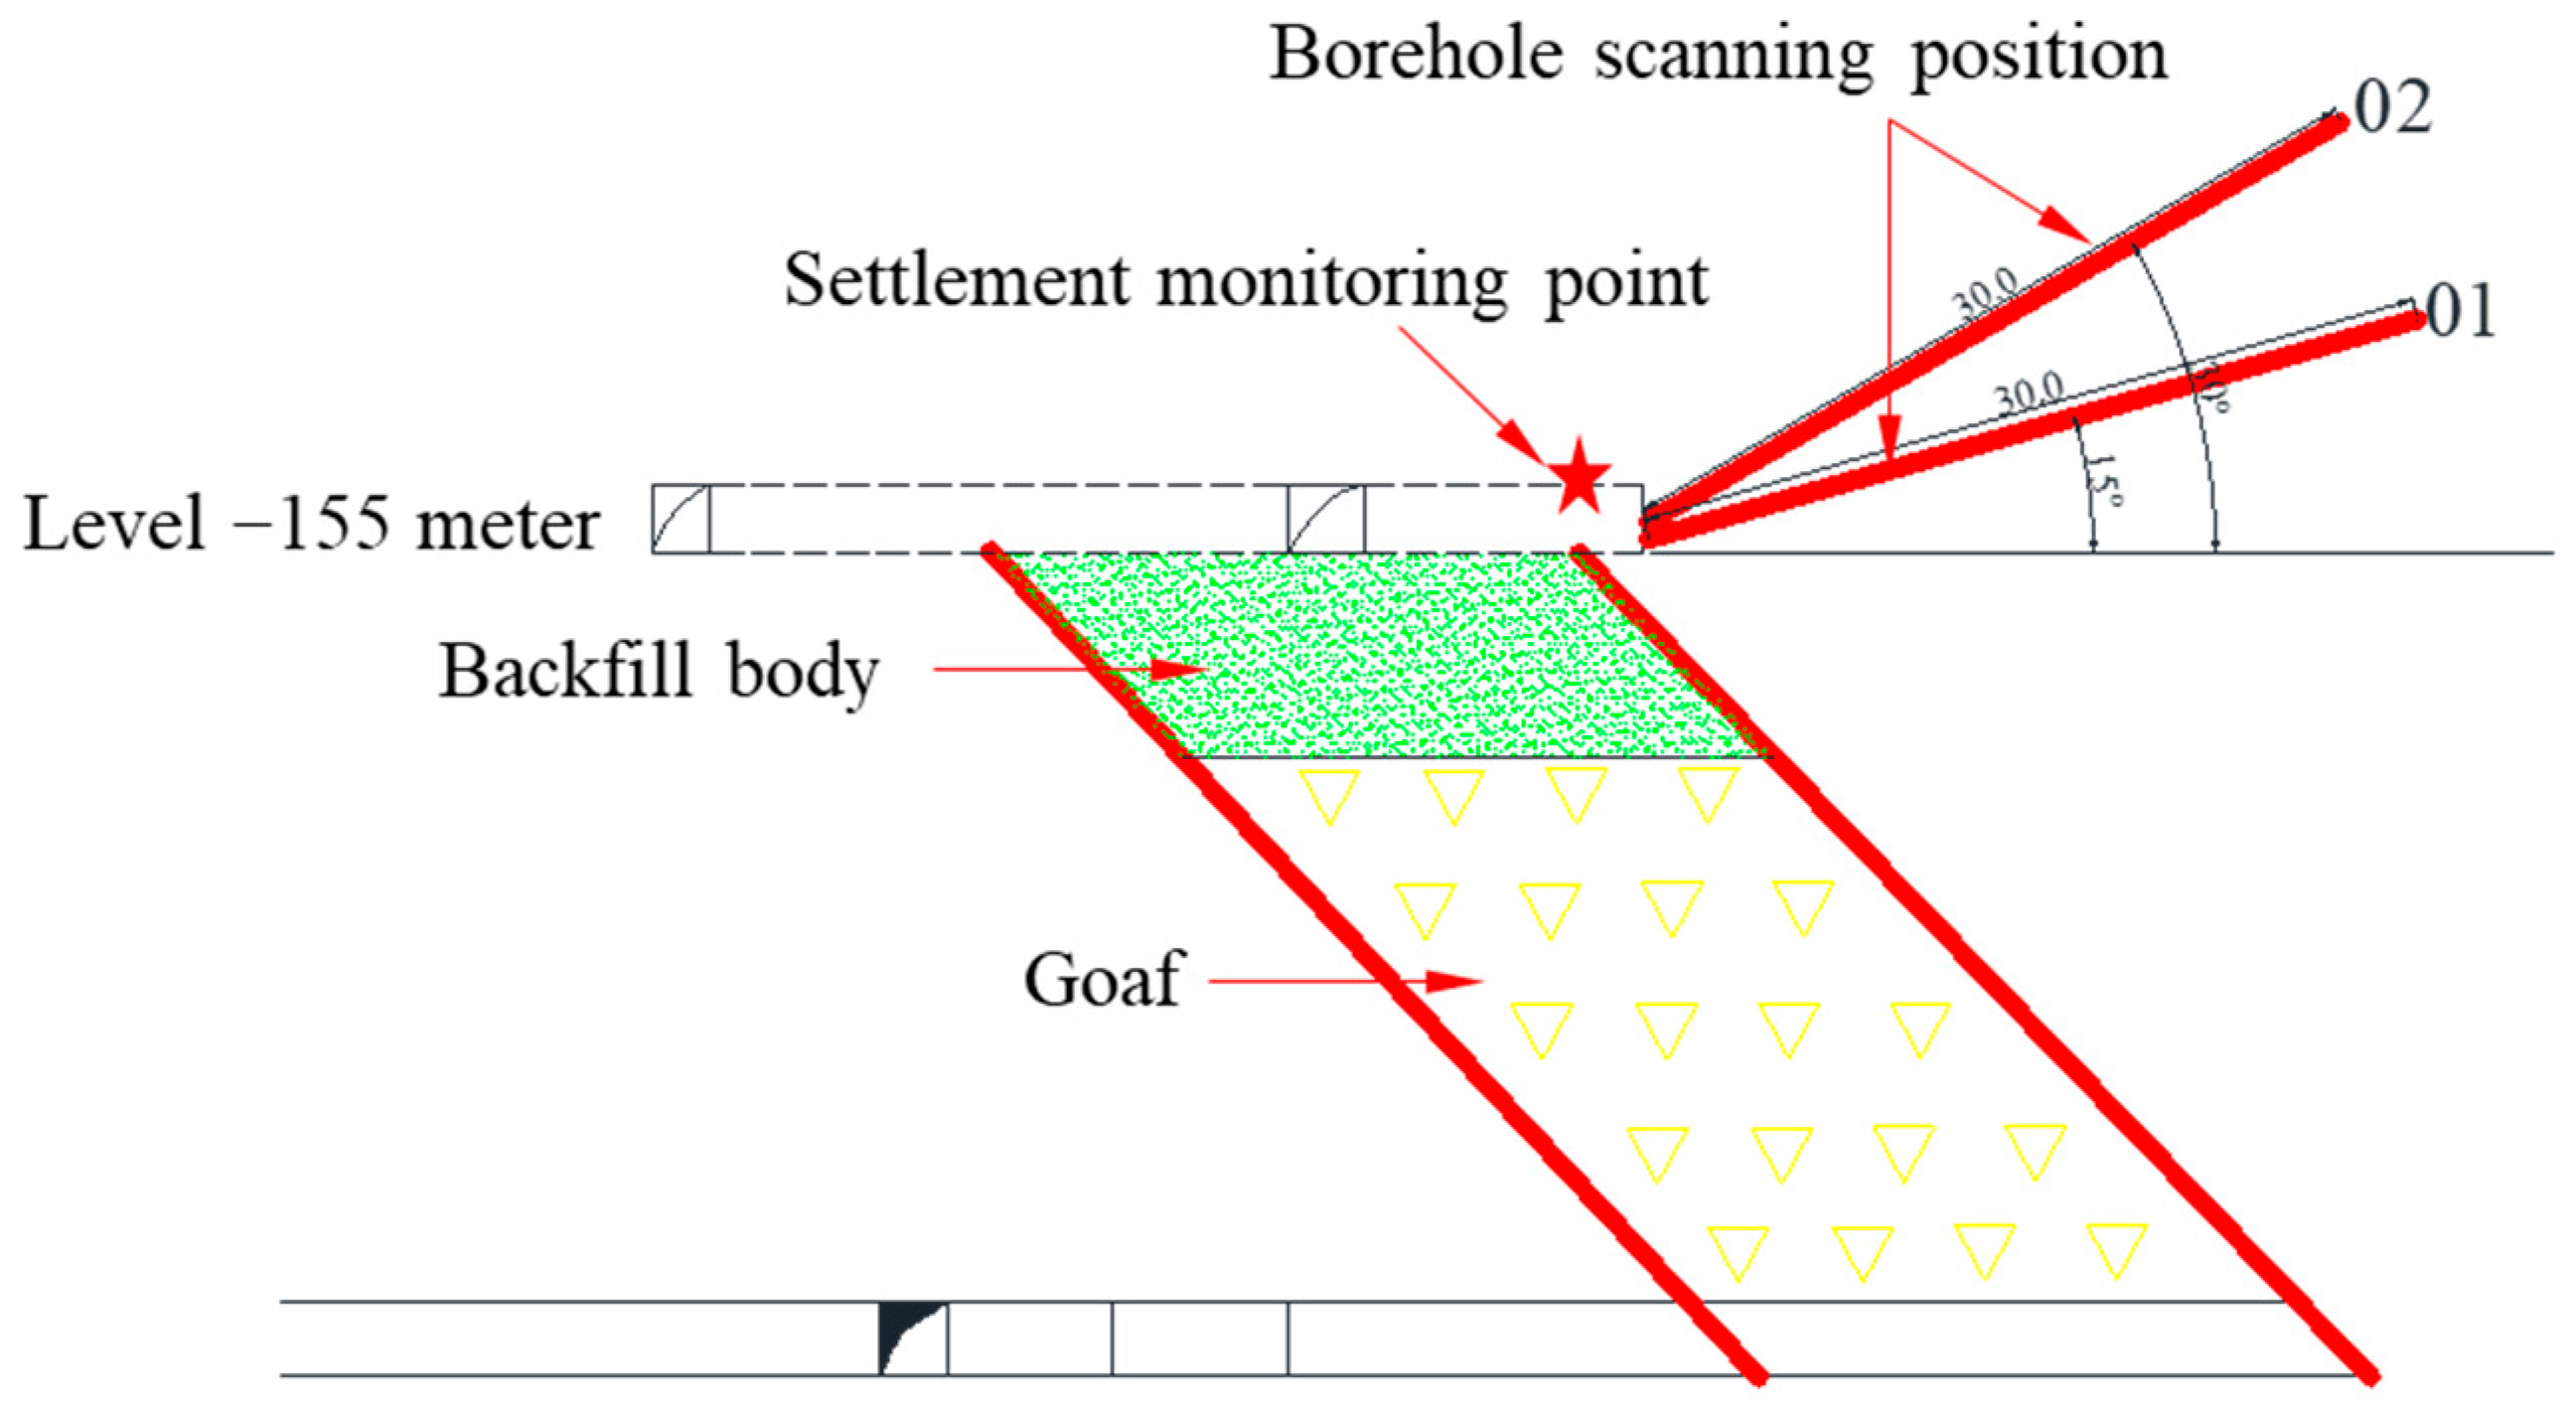
Figure 17.
Borehole observations of rock fractures in undersea mining: (a) No.01 and (b) No.02.

Figure 18.
Distribution of rock fractures in borehole scanning: (a) No.01 and (b) No.02.
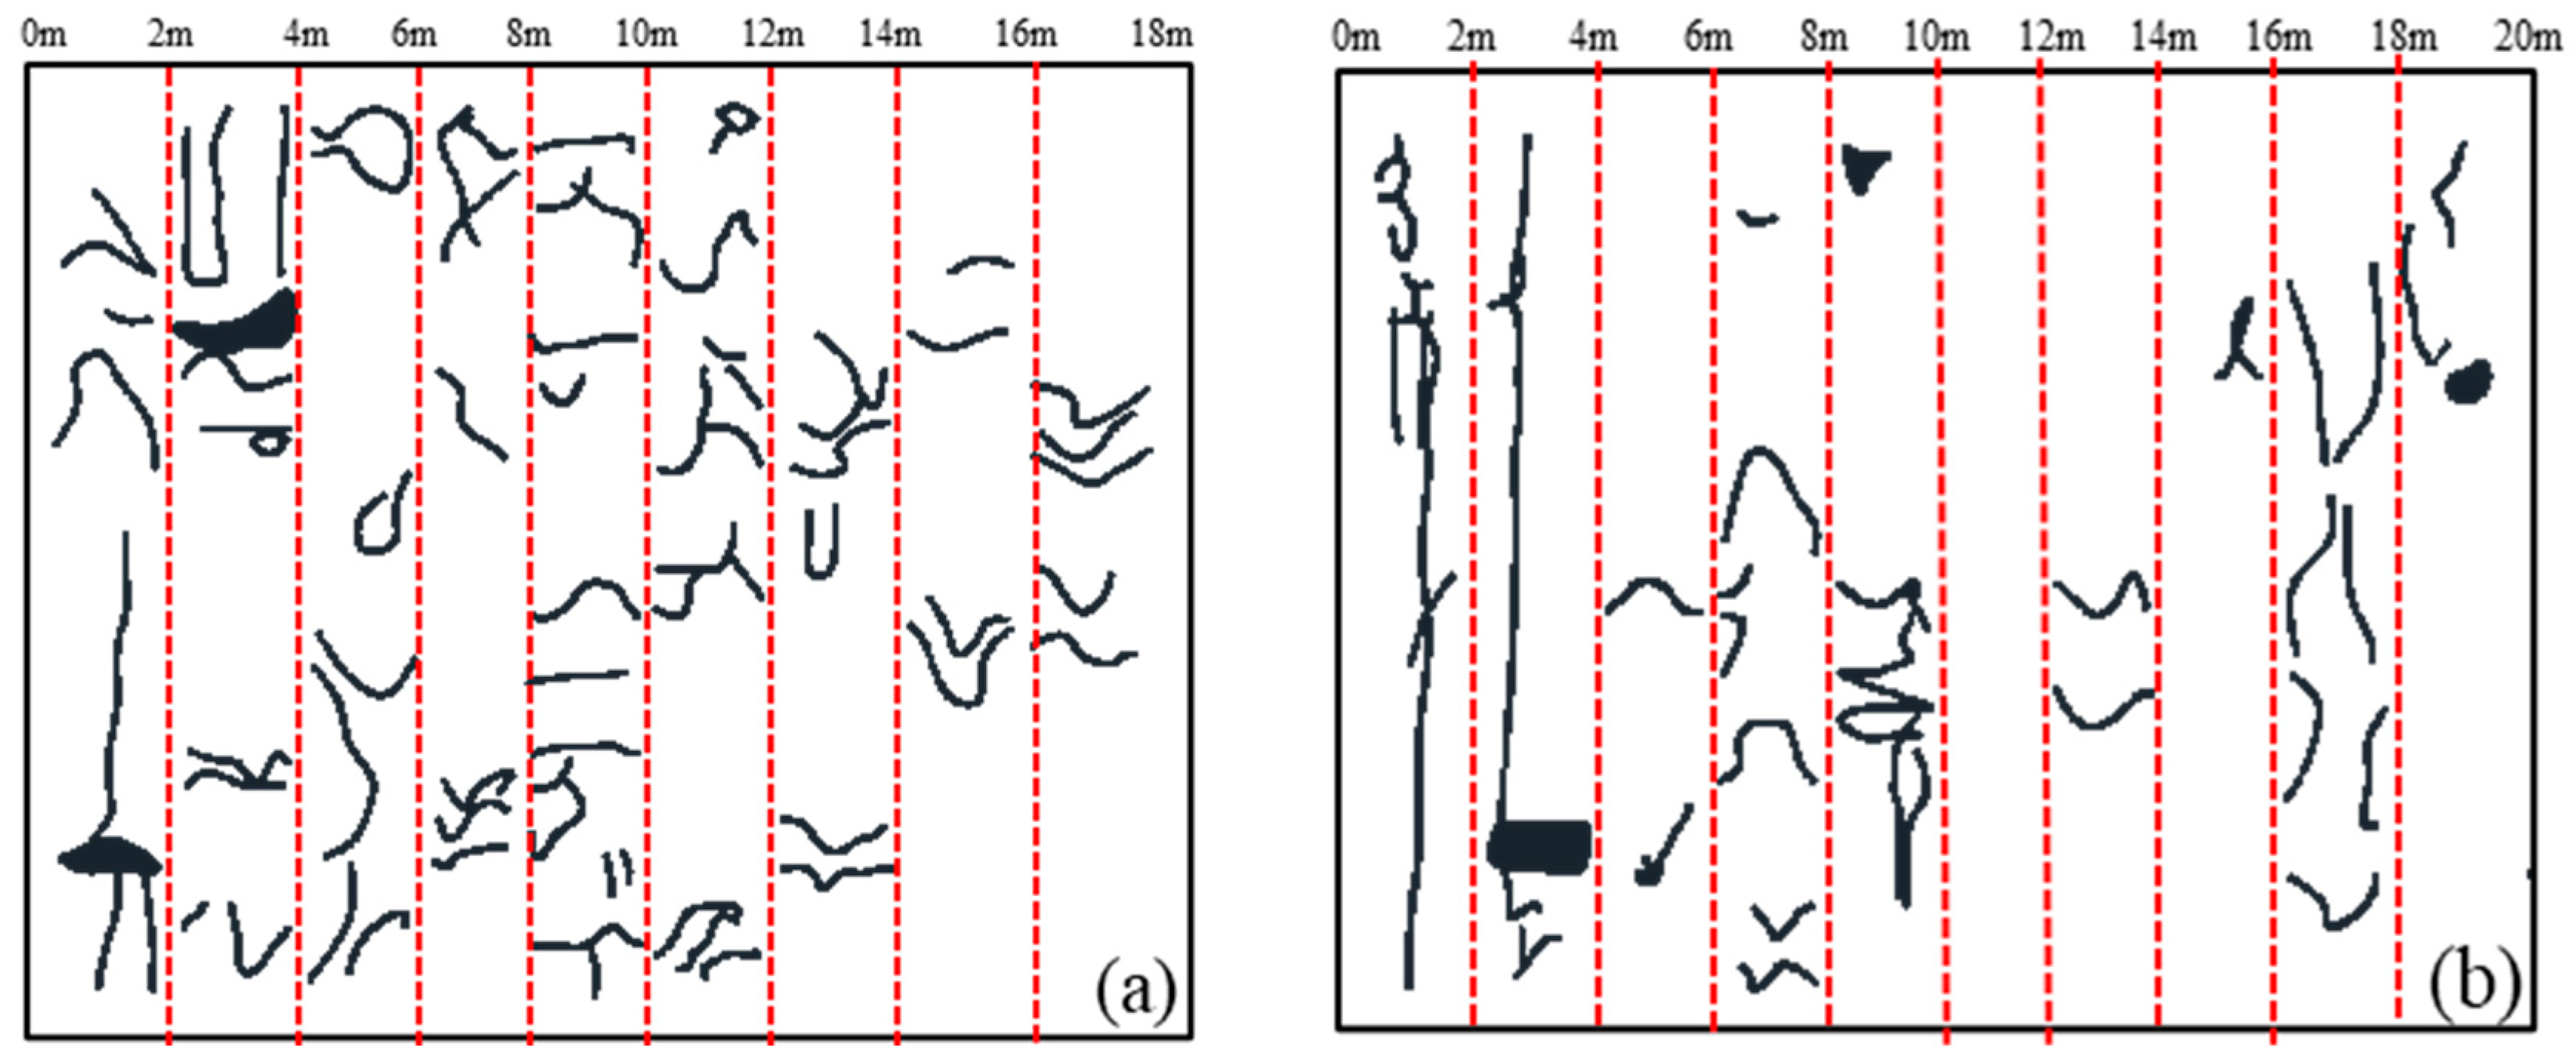
Figure 19.
Fracture fractal dimension of boreholes: (a) No.01 and (b) No.02.
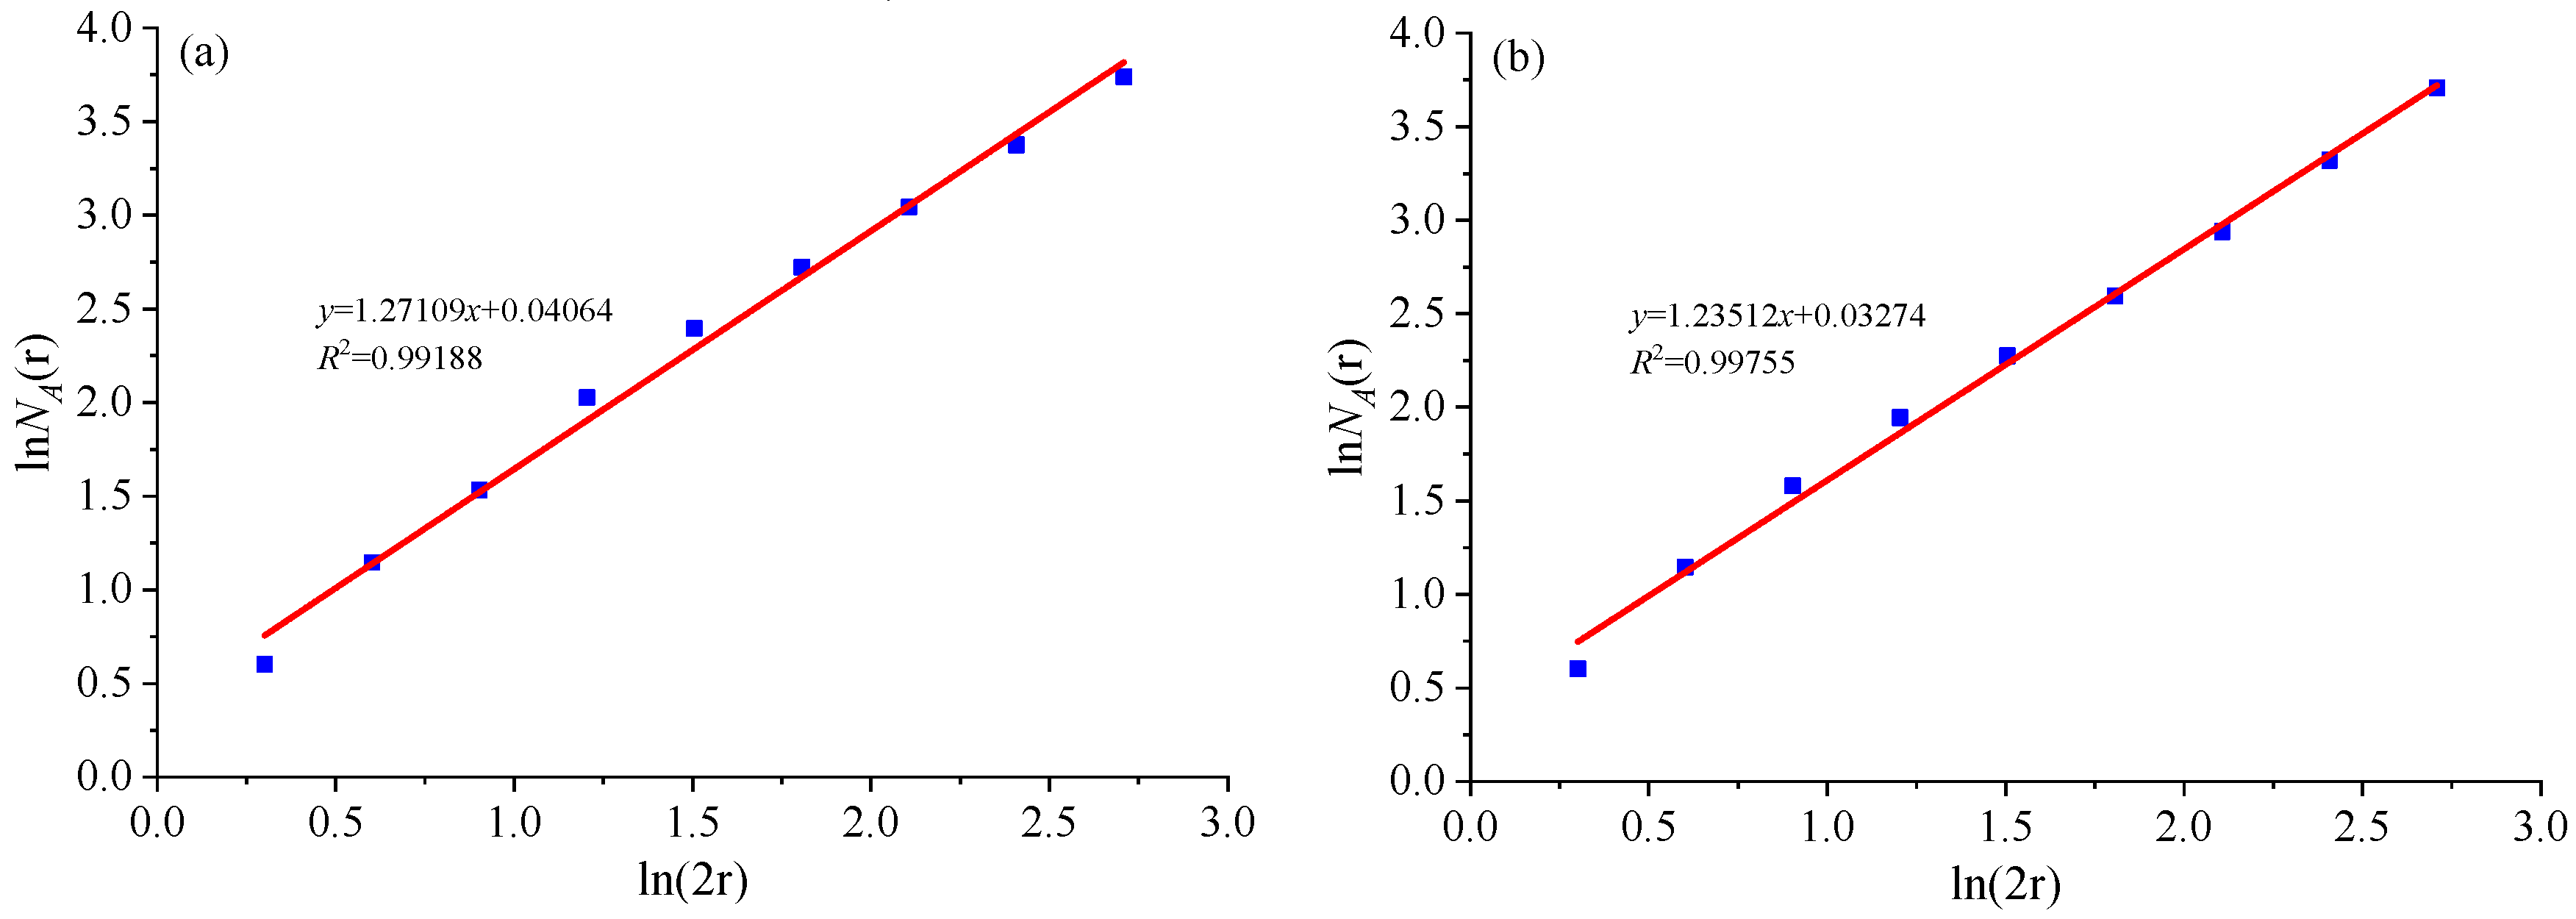
Figure 20.
Actual settlement and its correlation dimension, (a) the actual monitoring deformation of rock mass, (b) correlation dimension of actual deformation of rock mass.
Figure 20.
Actual settlement and its correlation dimension, (a) the actual monitoring deformation of rock mass, (b) correlation dimension of actual deformation of rock mass.

Figure 21.
Simulated settlement and its correlation dimension, (a) the simulated deformation of rock mass, (b) correlation dimension of simulated deformation of rock mass.
Figure 21.
Simulated settlement and its correlation dimension, (a) the simulated deformation of rock mass, (b) correlation dimension of simulated deformation of rock mass.


Table 1.
Rock mechanical parameters of the Sanshandao gold mine.
| Lithology | Density (kg·m−3) | Elastic Young’s Modulus, E (GPa) | Poisson’s Ratio | Tensile Strength (MPa) | Cohesion (MPa) | Internal Friction Angle (°) | Uniaxial Compressive Strength (MPa) |
|---|---|---|---|---|---|---|---|
| Hanging wall | 2706 | 13.44 | 0.20 | 3.18 | 5.72 | 30.60 | 82.03 |
| Orebody | 2709 | 15.02 | 0.19 | 3.72 | 6.43 | 32.60 | 102.95 |
| Footwall | 2635 | 17.10 | 0.24 | 4.31 | 5.72 | 36.94 | 72.07 |
Table 2.
Corrected microscopic parameters of the Bonded Block Model.
| Contact | Normal Stiffness (GPa·m−1) | Shear Stiffness, (GPa·m−1) | Tensile Strength (MPa) | Cohesion (MPa) | Internal Friction Angle (°) |
|---|---|---|---|---|---|
| Hanging wall | 324 | 105 | 4.35 | 12.19 | 29.72 |
| Orebody | 267 | 89 | 4.51 | 12.37 | 29.30 |
| Footwall | 163 | 61.9 | 4.28 | 11.82 | 29.63 |
Disclaimer/Publisher’s Note: The statements, opinions and data contained in all publications are solely those of the individual author(s) and contributor(s) and not of MDPI and/or the editor(s). MDPI and/or the editor(s) disclaim responsibility for any injury to people or property resulting from any ideas, methods, instructions or products referred to in the content. |
© 2024 by the authors. Licensee MDPI, Basel, Switzerland. This article is an open access article distributed under the terms and conditions of the Creative Commons Attribution (CC BY) license (https://creativecommons.org/licenses/by/4.0/).
Share and Cite
MDPI and ACS Style
Chen, Y.; Li, Z.; Lin, W.; He, Y.; Wang, G.; Ou, R.; Liu, Q. Fractal Evolution Characteristics of Isolation Layers in a Submarine Gold Mine: A Case Study. Minerals 2024, 14, 205. https://doi.org/10.3390/min14020205
AMA Style
Chen Y, Li Z, Lin W, He Y, Wang G, Ou R, Liu Q. Fractal Evolution Characteristics of Isolation Layers in a Submarine Gold Mine: A Case Study. Minerals. 2024; 14(2):205. https://doi.org/10.3390/min14020205
Chicago/Turabian StyleChen, Yin, Zijun Li, Weixing Lin, Yan He, Guoqiang Wang, Renze Ou, and Qi Liu. 2024. "Fractal Evolution Characteristics of Isolation Layers in a Submarine Gold Mine: A Case Study" Minerals 14, no. 2: 205. https://doi.org/10.3390/min14020205
Note that from the first issue of 2016, this journal uses article numbers instead of page numbers. See further details here.