Article

Montbrayite from the Svetlinsk Gold–Telluride Deposit (South Urals, Russia): Composition Variability and Decomposition

by
Olga V. Vikent’eva
1,*,
Vladimir V. Shilovskikh
2,
Vasily D. Shcherbakov
3,
Tatyana N. Moroz
4,
Ilya V. Vikentyev
1 and
Nikolay S. Bortnikov
1
1
Institute of Geology of Ore Deposits, Petrography, Mineralogy and Geochemistry, Russian Academy of Sciences (IGEM RAS), 119017 Moscow, Russia
2
Geomodel Center, St. Petersburg State University (SPbU), 199034 St. Petersburg, Russia
3
Faculty of Geology, Lomonosov Moscow State University, 119991 Moscow, Russia
4
Sobolev Institute of Geology and Mineralogy, Siberian Branch of the Russian Academy of Sciences (IGM SB RAS), 630090 Novosibirsk, Russia
*
Author to whom correspondence should be addressed.
Minerals 2023, 13(9), 1225; https://doi.org/10.3390/min13091225
Submission received: 26 August 2023 / Revised: 14 September 2023 / Accepted: 16 September 2023 / Published: 18 September 2023

Abstract

:
A rare gold–telluride montbrayite from the large Svetlinsk gold–telluride deposit (South Urals, Russia) was comprehensively studied using optical microscopy, scanning electron microscopy, electron microprobe analysis, reflectance measurements, electron backscatter diffraction, and Raman spectroscopy. Significant variations in the composition of the mineral were revealed (in wt%): Au 36.98–48.66, Te 43.35–56.53, Sb 2.49–8.10, Ag up to 4.56, Pb up to 2.04, Bi up to 0.33, Cu up to 1.42. There are two distinct groups with much more-limited variation within the observed compositional interval (in wt%): (1) Au 36.98–41.22, Te 49.35–56.53, Sb 2.49–5.57; (2) Au 47.86–48.66, Te 43.35–44.92, Sb 7.15–8.10. The empirical formula calculated on the basis of 61 apfu is Au16.43–23.28Sb1.79–6.09Te32.01–38.89Ag0–3.69Bi0–0.14Pb0–0.90Cu0–1.96. Two substitution mechanisms for antimony are proposed in the studied montbrayite grains: Sb→Au (2.5–5.6 wt% Sb) and Sb→Te (7–8 wt% Sb). The dependence of the reflection spectra and Raman spectra on the antimony content and its substitution mechanism, respectively, was found in the mineral. The slope of the reflectance spectra decreases and the curve in the blue–green region of the spectrum disappears with increasing Sb content in montbrayite. Raman spectra are reported for the first time for this mineral. The average positions of the peak with high-intensity are ~64 cm−1 and ~90 cm−1 for montbrayite with Sb→Te and Sb→Au, respectively. Two grains of montbrayite demonstrate decomposition according to two schemes: (1) montbrayite (7 wt% Sb) → native gold + calaverite ± altaite, and (2) montbrayite (5 wt% Sb) → native gold + tellurantimony ± altaite. A combination of melting and dissolution–precipitation processes may be responsible for the formation of these decomposition textures.

1. Introduction

Montbrayite as a new mineral species was first described at the Robb-Montbray mine, Montbray, Abitibi County, Quebec (Canada) [1]. The chemical formula of the mineral was given as Au2Te3, or (Au,Sb)2Te3, and other elements (Ag, Pb, Bi) reported in the chemical analysis were excluded because the studied montbrayite contained inclusions of tellurobismuthite (Bi2Te3), altaite (PbTe), and petzite (Ag3AuTe2). This montbrayite contained 1 wt% Sb.
Attempts to synthesize Au2Te3, reported by [1,2,3,4] as the mineral montbrayite, were unsuccessful. Rucklidge [5] first suggested that montbrayite should contain “small but probably essential amounts of Bi and Pb” to be stabilized. Later, the experiments of Bachechi [6] allowed him to conclude that montbrayite is not stable in the Au–Te system; however, isomorphous substitution of Bi, Pb, and Sb or of Sb only was responsible for the stability of montbrayite. Then, Gather and Blachnik [7,8], who studied the ternary Au–Sb–Te system found a new ternary compound of the approximate composition AuSb0.07Te2; the X-ray diagram of this phase corresponds to the montbrayite from [1]. Later, Nakamura and Ikeda [9] studied the ternary phase relations in the Au–Sb–Te system at 350 °C and also found the Au1.9(Te2.64Sb0.46)3.1 phase, whose XRD pattern is most similar to that of montbrayite reported by [6]. Synthetic montbrayite shows a small solid solution field and has non-stoichiometric composition, which is located near the Au2(Te,Sb)3 stoichiometric line, but not on the (Au,Sb)2Te3 line [9]. Around the same time, Shackleton and Spry [10], studying Sb-rich montbrayite from the Golden Mile, Western Australia, concluded that Bi, Ag, and Pb appear to stabilize montbrayite in much the same manner as Sb. They also assumed a modification of the formula of montbrayite to (Au,Ag,Sb)2(Te,Sb,Bi)3 or, more likely, (Au,Ag,Sb,Bi)2(Te,Sb,Bi)3 [10].
However, to determine the formula correctly, it is necessary to study the structure of the mineral. The first X-ray diffraction data were obtained for the first finding of montbrayite, but the crystal structure remained unsolved [1]. Attempts to solve the montbrayite structure were made by Bachechi [11] and Edenharter with colleagues [12]. Later, the crystal structure of the mineral was solved for montbrayite from the Robb-Montbray mine [13]. The authors suggested a possible scenario: (1) Pb can substitute for Au or Te; (2) Bi can substitute for Te (in an ordered fashion) or Au; (3) Sb can substitute for Au (in a disordered fashion) or Te; (4) Ag, when present, substitutes for Au. On the basis of the structural and chemical data, the chemical formula of montbrayite was revised and was approved by the Commission on New Minerals as (Au,Ag,Sb,Bi,Pb)23(Te,Sb,Bi,Pb)38 [13].
Despite the fact that the mineral was discovered about 80 years ago, its findings are documented only in a few deposits. Antimony-rich (Golden Mile, Western Australia [10,14,15,16]; Enasen, central Sweden [17]), Bi-rich (Robb-Montbray mine, Quebec, Canada [1,5,6,13,18], Kochkar, S. Urals, Russia [19]), and Pb-rich (Zhana-Tyube, South Aksu, Zholymbet, Kazakhstan [20]) montbrayite were found in the ores of the gold deposits. Bi-rich montbrayite was also defined in a sample of noritic breccias from the Voronezhsky massif [21]. Montbrayite is still a rare gold telluride, but it is one of the main gold minerals [22].
In this paper, Sb-rich montbrayite from the Svetlinsk deposit was comprehensively studied using optical microscopy, scanning electron microscopy (SEM), electron microprobe analysis (EMPA), reflectance measurements, electron backscatter diffraction (EBSD), and Raman spectroscopy (RS). In addition, montbrayite decomposition was first found, and we tried to explain the formation mechanism of these decomposition textures. The new information on montbrayite, a rare mineral with a chemical variability of composition, will be useful for mineralogists studying the mineralogy and genesis of telluride-bearing gold deposits.

2. Geological Setting

The large (~135 t Au) gold–telluride Svetlinsk deposit (54°17′ N, 60°25′ E) is located within the East Uralian megazone at the junction of the Kochkar anticlinorium with the Aramil-Sukhtel synclinorium [23]. Host Devonian–Carboniferous volcano–sedimentary rocks underwent strong up to amphibolite facies metamorphism caused by emplacement of a hidden granitic pluton and by the influence of a major west-dipping thrust-fault [23]. Gold mineralization is represented by disseminated sulfides in the host rocks (CAu up to 1 g/t) and by sulfide–quartz veins (CAu = 0.8–2.5 g/t). Three mineralization stages have been recognized [23,24]: (1) the disseminated quartz–pyrite–pyrrhotite stage, with rare chalcopyrite, tetrahedrite, galena, and native gold; (2) the quartz–pyrite vein stage, with scheelite; (3) the gold–telluride stage (the main productive one). Native gold (620–965‰) is often associated with tellurides that are common and varied in the ore veins. Tellurides of Fe, Ni, Pb, Sb, Bi, Ag, and Au were found in the ore assemblages: frohbergite, melonite, altaite, tellurantimony, vavřínite, tsumoite, tellurobismuthite, tetradymite, volynskite, montbrayite, calaverite, sylvanite, krennerite, petzite, hessite, empressite. Tellurides form simple or more often complex inclusions in quartz and also fill fractures in it and are rarely intergrown with pyrite, chalcopyrite, and tetrahedrite. Mineralization is accompanied by quartz–sericite, quartz–carbonate–sericite (beresite, listvenite), quartz–albite, quartz–microcline, and quartz–biotite hydrothermal alteration. Previous studies have shown the ore to be polygenetic, involving contrasting fluids with multiple sources [23,25,26]. A specific feature of the deposit is the high formation temperature of the mineral assemblages including those containing some tellurides.

3. Materials and Methods

Montbrayite was found in specimens that were taken from the open pit (levels 275–300 m) of the deposit. Polished samples were studied under a polarizing microscope Olympus BX-51 and a JEOL JSM-5610LV scanning electron microscope equipped with an Oxford-INCA-450 EDS at the Institute of Geology of Ore Deposits, Petrography, Mineralogy and Geochemistry, Russian Academy of Sciences (IGEM RAS).
The chemical composition was determined at the IGEM RAS using a JEOL JXA-8200 electron microprobe equipped with five wavelength-dispersive spectrometers (WDS) and operated at 20 kV and 20 nA. The beam diameter was 1 μm. Calibration standards (X-ray lines, analyzing crystals) included AuTe2 for Au (Mα, PETH) and Te (Lα, PETH), Sb2S3 for Sb (Lα, PETH), AgSbS2 for Ag (Lα, PETH), Bi2Te3 for Bi (Mβ, PETH), PbS for Pb (Mα, PETH), and CdSe for Se (Lα, TAP). The counting times were 10 s on peaks and 5 s on the upper and lower backgrounds for Au, Te, Sb, and Ag; 30 and 15 s for Pb, Cu, and Se; and 60 and 30 s for Bi, respectively. Detection limits (3σ criterion) for the minor elements (wt%) were 0.09 for Ag, 0.06 for Bi and Cu, 0.05 for Pb, and 0.04 for Se. The ZAF correction was performed using the JEOL software.
Reflectance measurements were performed in air relative to a silicon standard with a microscope–spectrophotometer (MSF-R, LOMO) with a photoelectronic multiplier (Hamamatsu, Japan) at the Institute of Mineralogy (Miass, Russia). The lens was 40 × 0.65 (achromat). The diameter of the measuring area was 7 µm.
Electron backscatter diffraction (EBSD) studies were performed simultaneously with EDX mapping on a Hitachi S-3400N scanning electron microscope (SEM) equipped with an Oxford X-Max 20 energy-dispersive X-ray (EDX) spectrometer and NordLys Nano EBSD detector (“Geomodel” resource center, Scientific Park, SPbU). Prior to the EBSD investigation, the samples were polished with progressively smaller diamond suspensions up to 0.25 µm and Ar+-plasma-etched (Oxford Instruments Ionfab300, 10 min, incident angle of 45°, accelerating voltage of 500 V, current of 200 mA, beam diameter of 10 cm; “Nanophotonics” resource center, Scientific Park, SPbU). Montbrayite crystals produce high-quality diffraction patterns with an excellent fit to the known montbrayite structure (12 bands, 0.26° MAD, AMCSD 0014682). The conditions for single-pattern acquisition were as follows: 30kV accelerating voltage, 1 nA beam current, 0.2 s dwell time per one image, the averaging of 20 images. No binning was applied. The mapping conditions were the same except 2 × 2 image binning and 2-image averaging. Image processing was automatically performed using the Oxford AzTec software for EBSD image acquisition and matching.
The Raman spectra were collected with a Horiba XPloRA (Jobin Yvon) Raman spectrometer installed on an Olympus BX51 optical microscope and equipped with a Si-based charge-coupled detector (CCD) at the Department of Petrology and Volcanology (Faculty of Geology, Lomonosov Moscow State University) using circularly polarized 532 nm excitation wavelength and a diffraction grating of 2400 lines/mm (spectral resolution < 1 cm−1). The Raman spectra were collected in the range 50–1200 cm−1. Samples were irradiated for 300 s (30 × 10 s) with an ~3 mW laser beam (25% of maximum laser source power) to prevent mineral surface destruction observed by us at higher laser power. The spatial resolution was approximately 1 µm. Deconvolution of the Raman spectra using a Voigt function was carried out with the Origin7.5 software packet.

4. Results

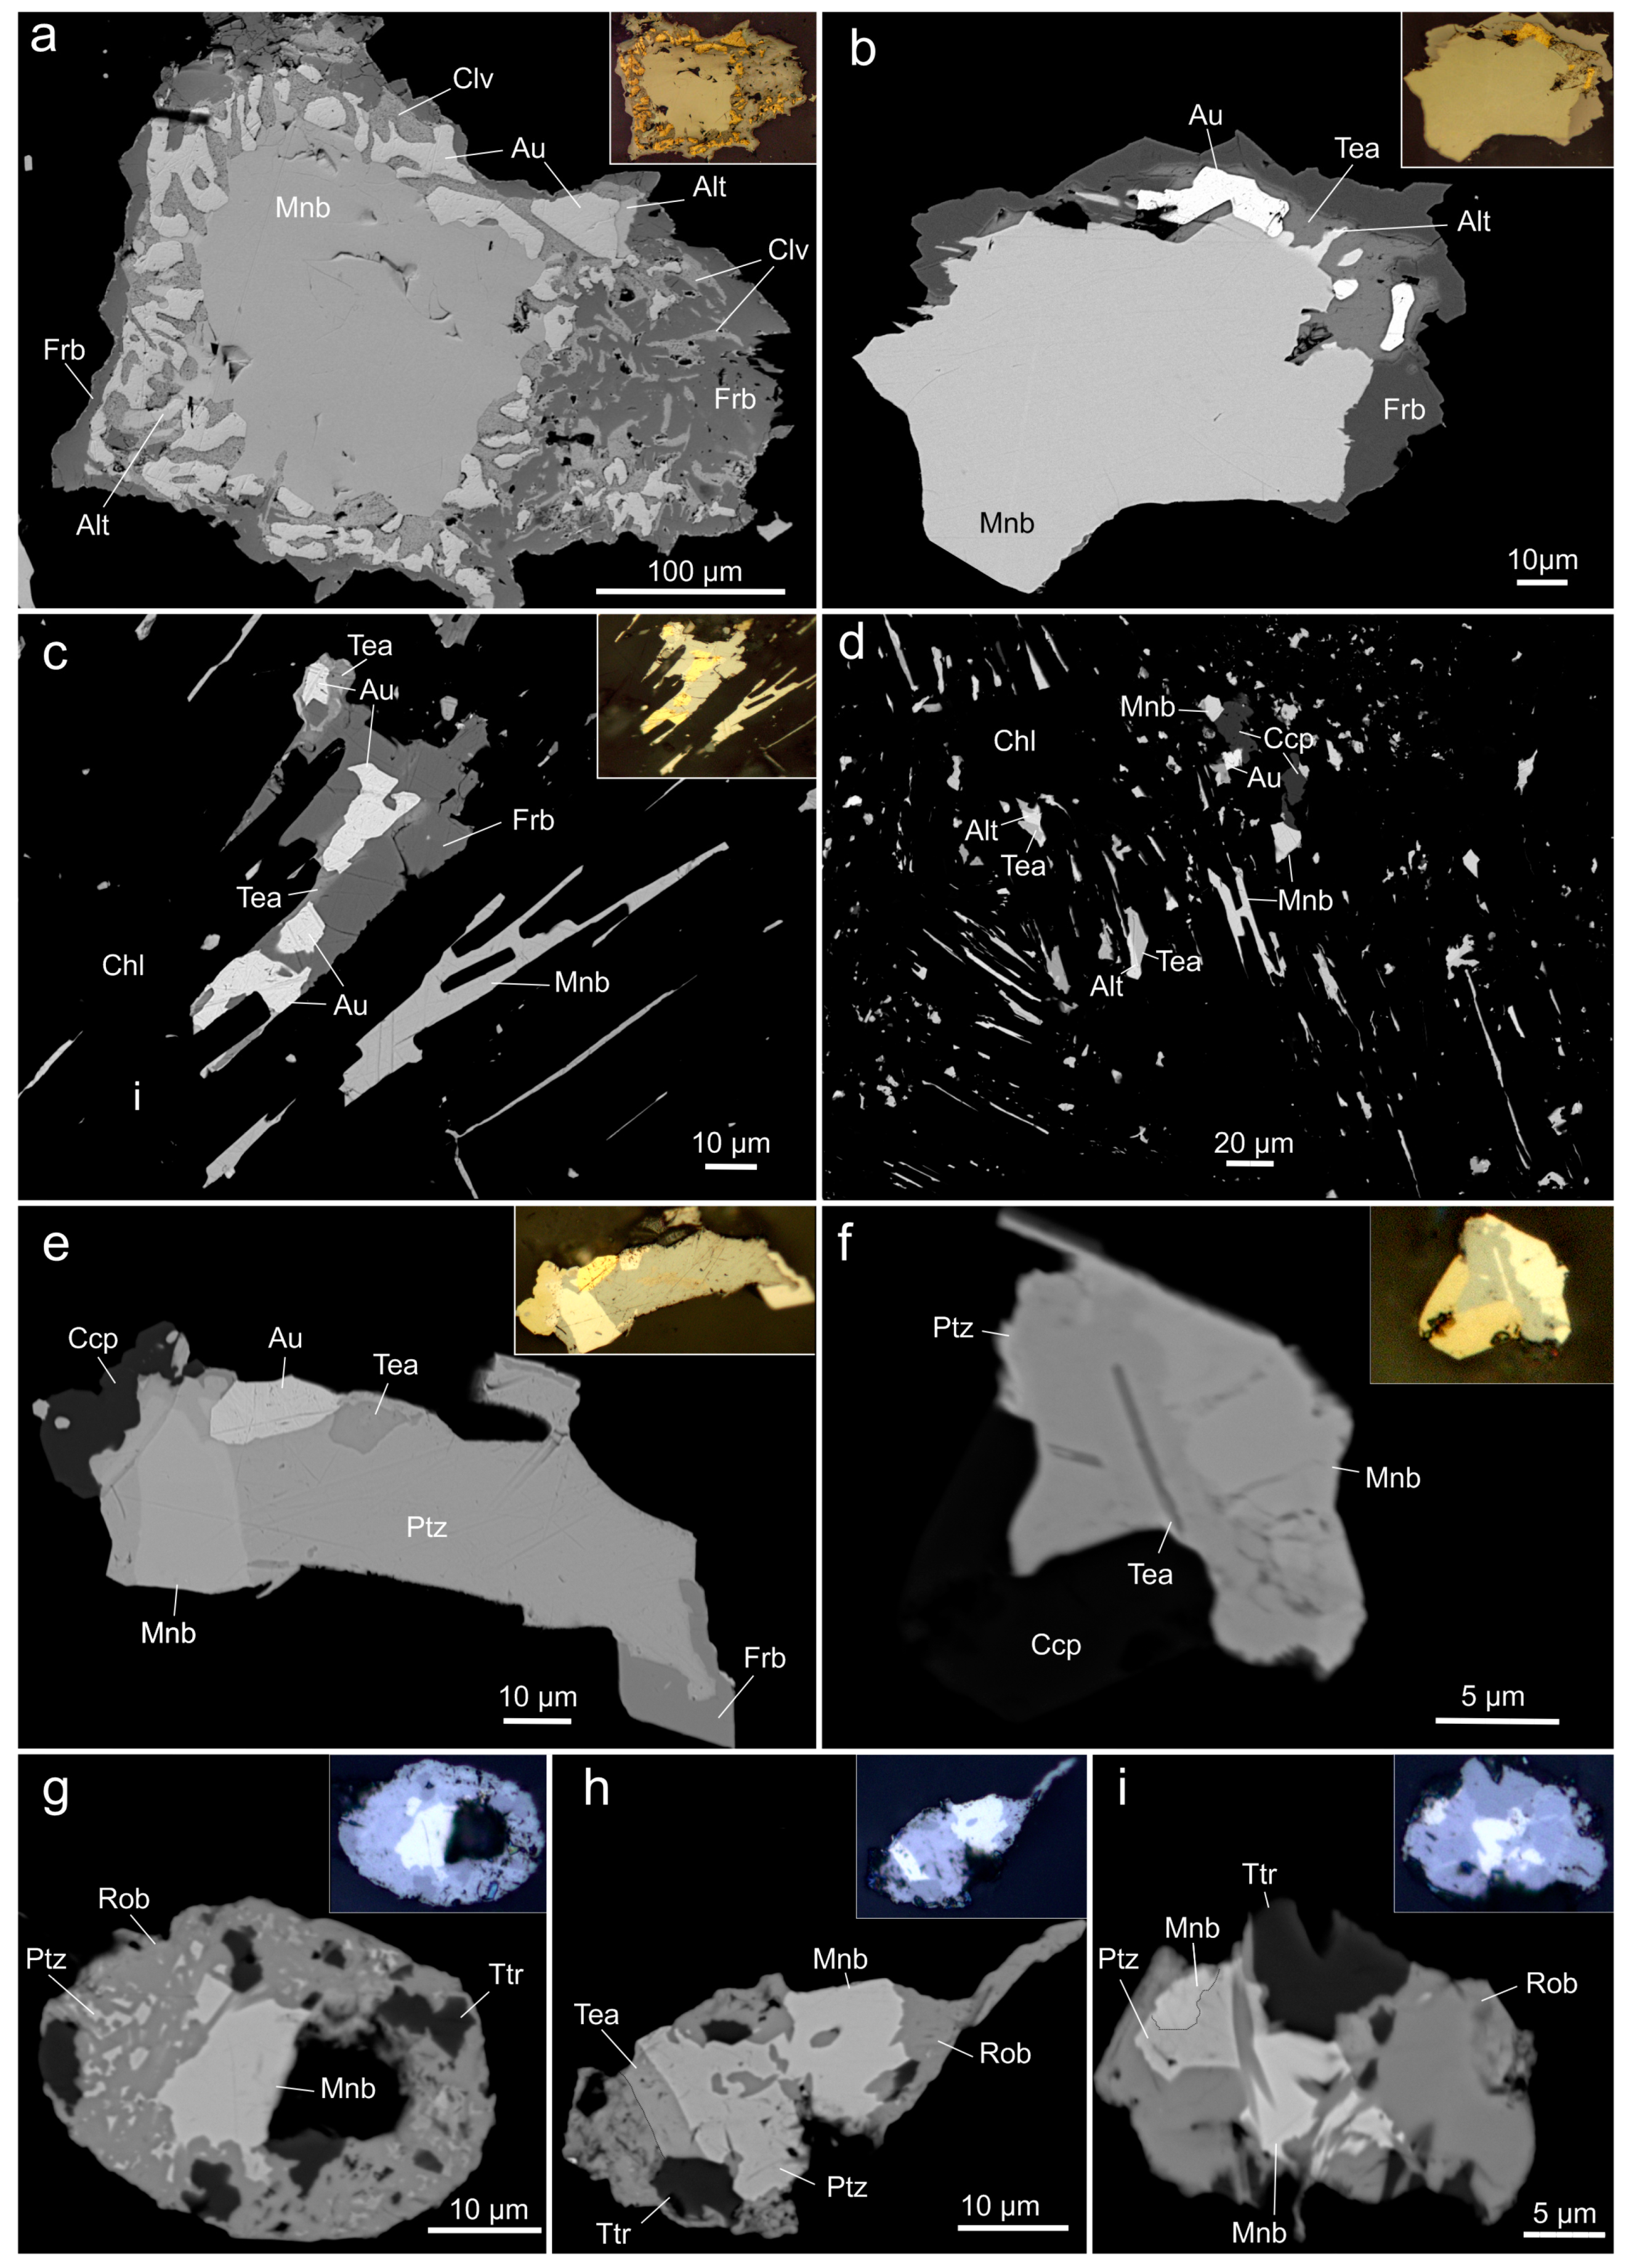
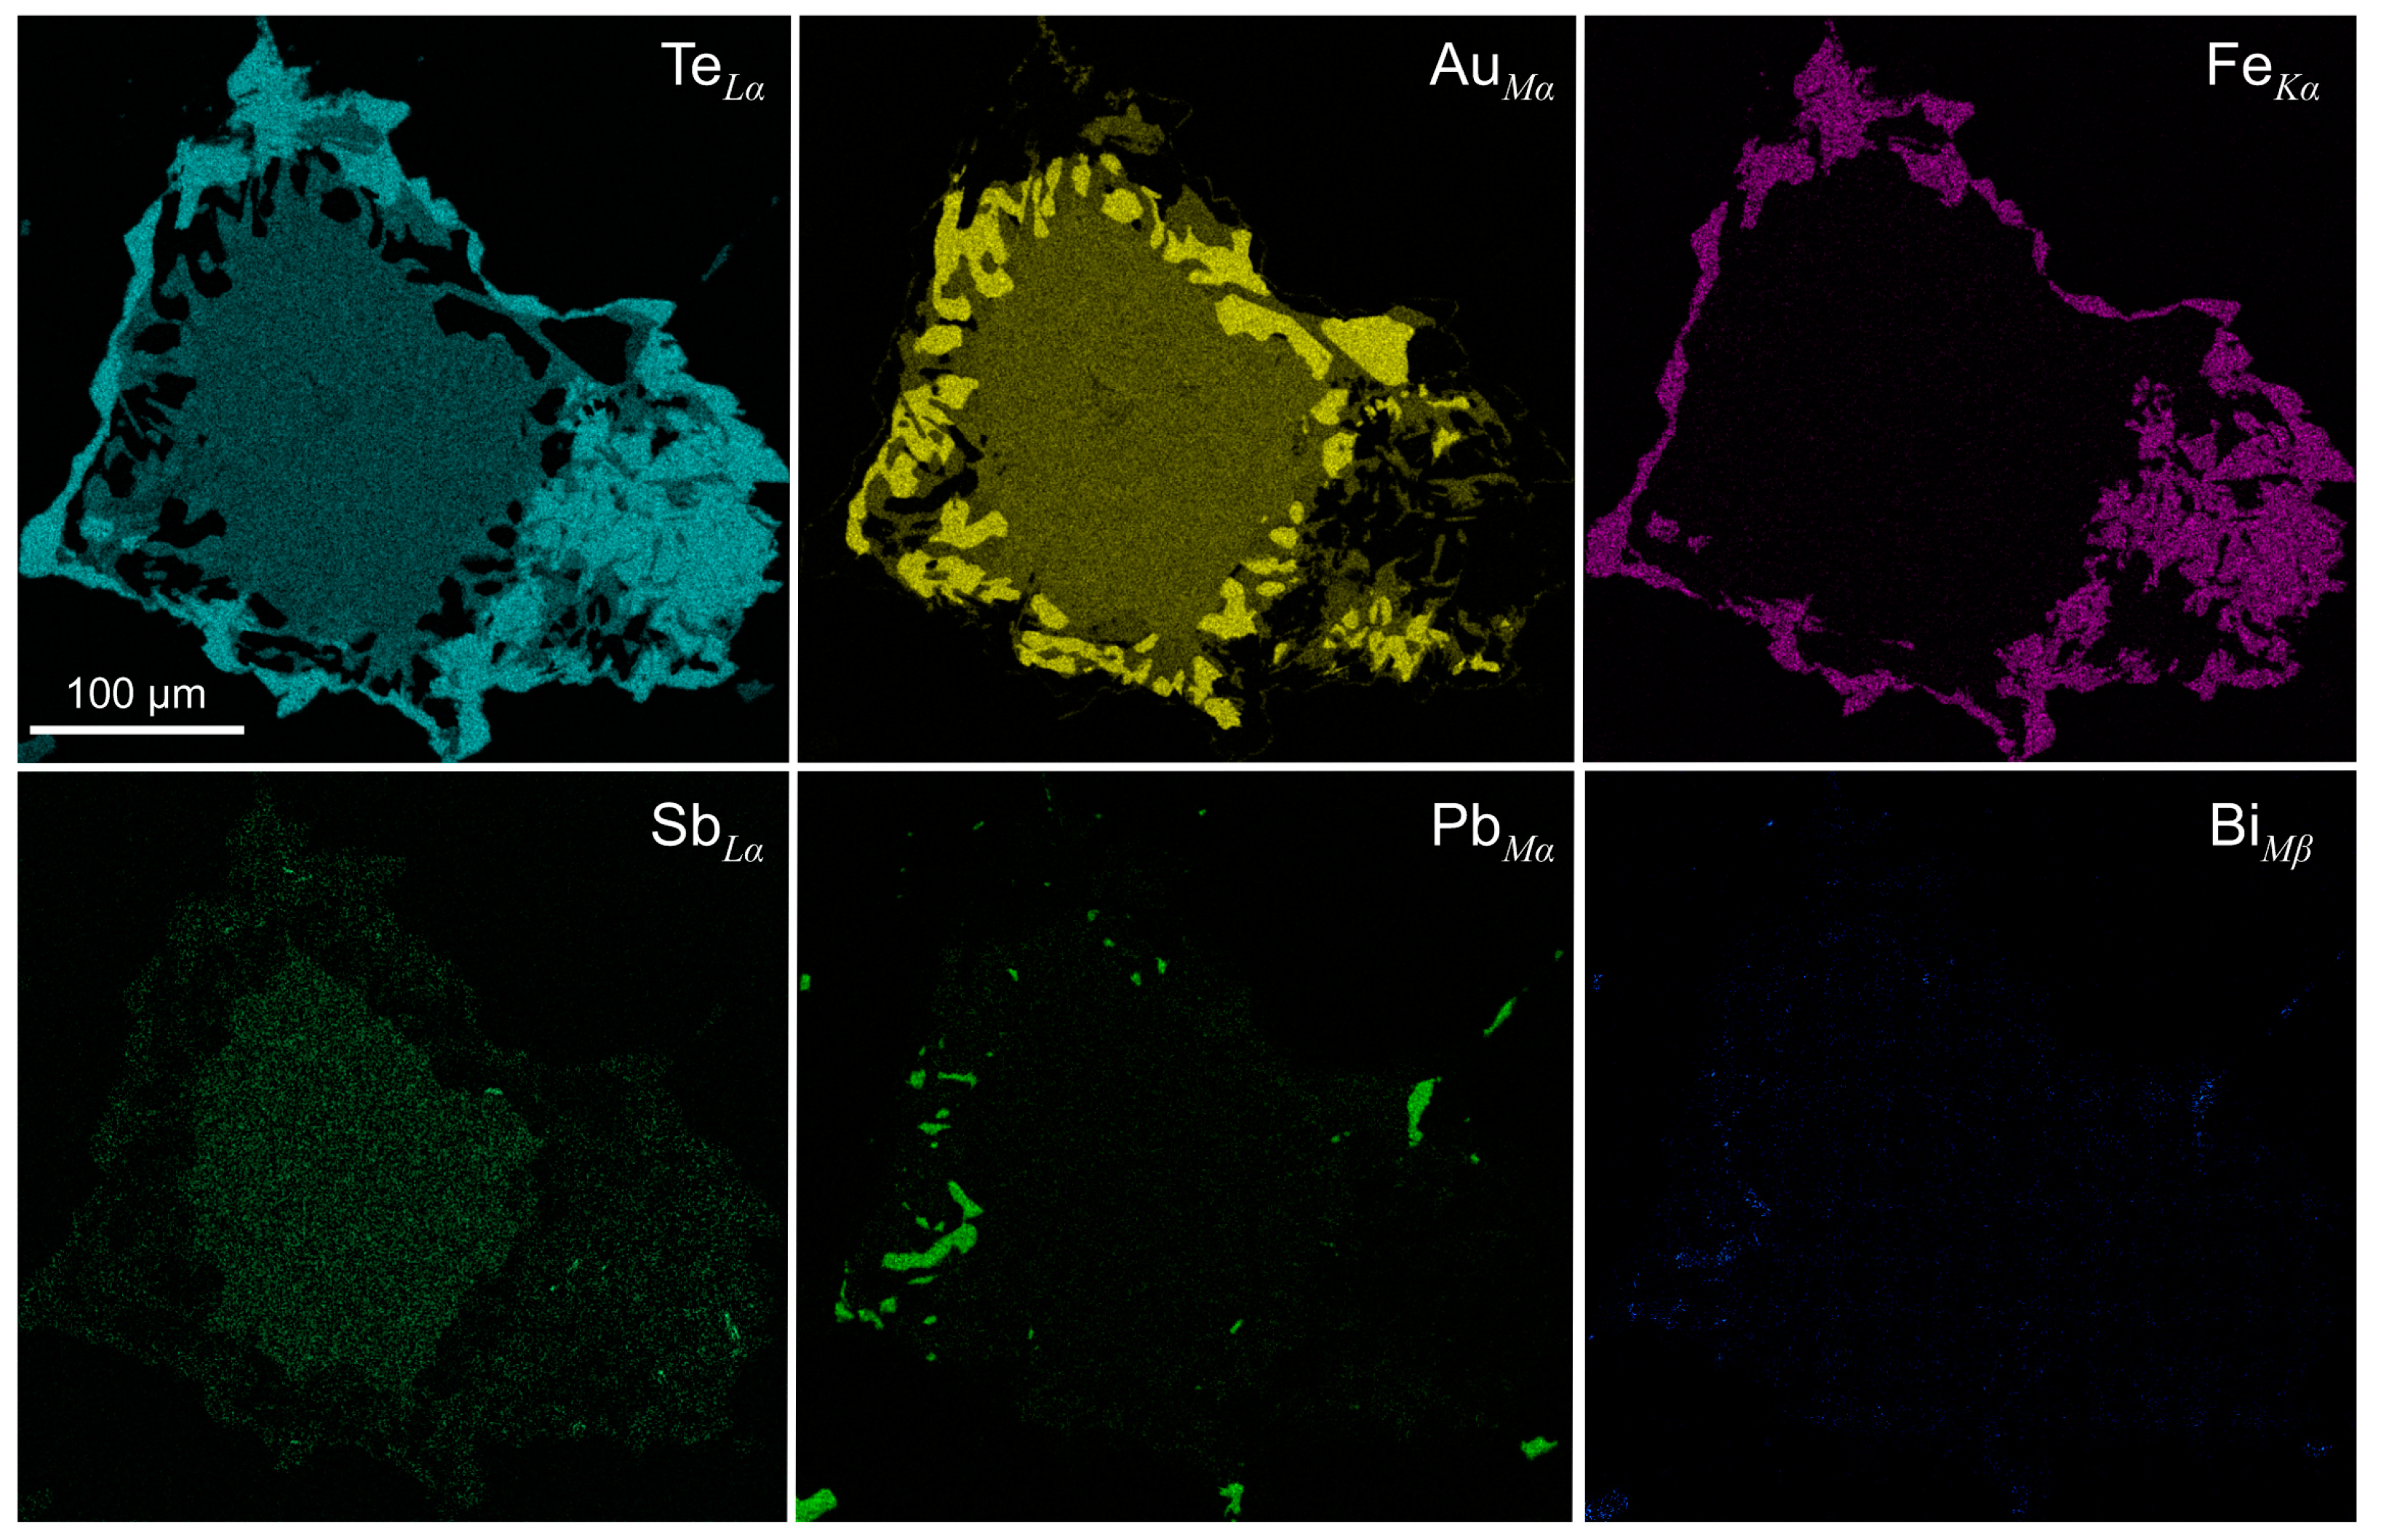
4.1. Mineral Assemblages and Physical Properties

Grains of montbrayite were found in several assemblages in the quartz–sulfide veins. Montbrayite occurs as inclusions in quartz and chlorite together with tellurides (tellurides of Fe, Sb, Pb, and, rarely, Au-Ag), native gold, and less often, with sulfides and sulfosalts (Figure 1) and as inclusions (3–5 μm) in pyrite. The observed montbrayite assemblages can be divided into two groups: (1) montbrayite coexists with frohbergite, as well as native gold, tellurantimony and petzite, which is intergrown with chalcopyrite; intergrowths of native gold with calaverite (or tellurantimony) and altaite were found along the contact of large (about 100 μm) grains of montbrayite and frohbergite; (2) montbrayite coexists with petzite and sulfosalts (robinsonite and tetrahedrite). In this study, the selected montbrayite grains are indicated by capital letters (from A to J) for the correspondence between microphotographs, electron microprobe analyses in the table and graphs, as well as Raman spectra. Montbrayite was comprehensively studied in the following assemblages: montbrayite (Grain A, 150 × 150 μm) + native gold (910‰) + calaverite + frohbergite ± altaite (Figure 1a and Figure 2); montbrayite (Grain B, 90 × 60 μm) + native gold (962‰) + tellurantimony + frohbergite ± altaite (Figure 1b); montbrayite (Grain C, up to 10 × up to 70 μm) + chlorite + native gold (935‰) + tellurantimony + frohbergite (Figure 1c); montbrayite (Grain D, 10 × 10 μm) + chalcopyrite + native gold (932‰) + chlorite + tellurantimony + altaite + frohbergite (Figure 1d); montbrayite (Grain E, 15 × 25 μm) + petzite + native gold (876‰) + tellurantimony + frohbergite + chalcopyrite (Figure 1e); montbrayite (Grain F, 5 × 12 μm) + petzite + tellurantimony + chalcopyrite (Figure 1f); montbrayite (Grain G, 7 × 10 μm) + robinsonite + tetrahedrite + petzite (Figure 1g); montbrayite (Grain H, 10 × 10 μm) + robinsonite + tetrahedrite + petzite + tellurantimony (Figure 1h); montbrayite (Grain I, up to 5 × up to 7 μm) + robinsonite + tetrahedrite + petzite (Figure 1i). The inclusion of montbrayite in pyrite is Grain J (~5 μm).
The review of mineral assemblages found for Bi-, Sb-, and Pb-rich varieties of montbrayite is collected in Table 1.
In plane-polarized reflected light, montbrayite is white or creamy white. Under crossed polarizers, the mineral shows moderate anisotropism. However, the variations in the amount of impurities, such as Sb, Bi, Pb, and Ag, result in optical differences for montbrayite [10].
Reflectance data for Sb-rich montbrayite from the Svetlinsk deposit are shown in Figure 3. They were compared with the appropriate spectra for Bi-rich montbrayite from Robb-Montbray (taken from [18]). The spectrum profile changes with increasing Sb content; the slope of the spectra decreases, and the curve in the blue–green region of the spectrum disappears. The significant differences in the dispersion of the reflectance of montbrayite were noted [18].

4.2. Chemical Composition
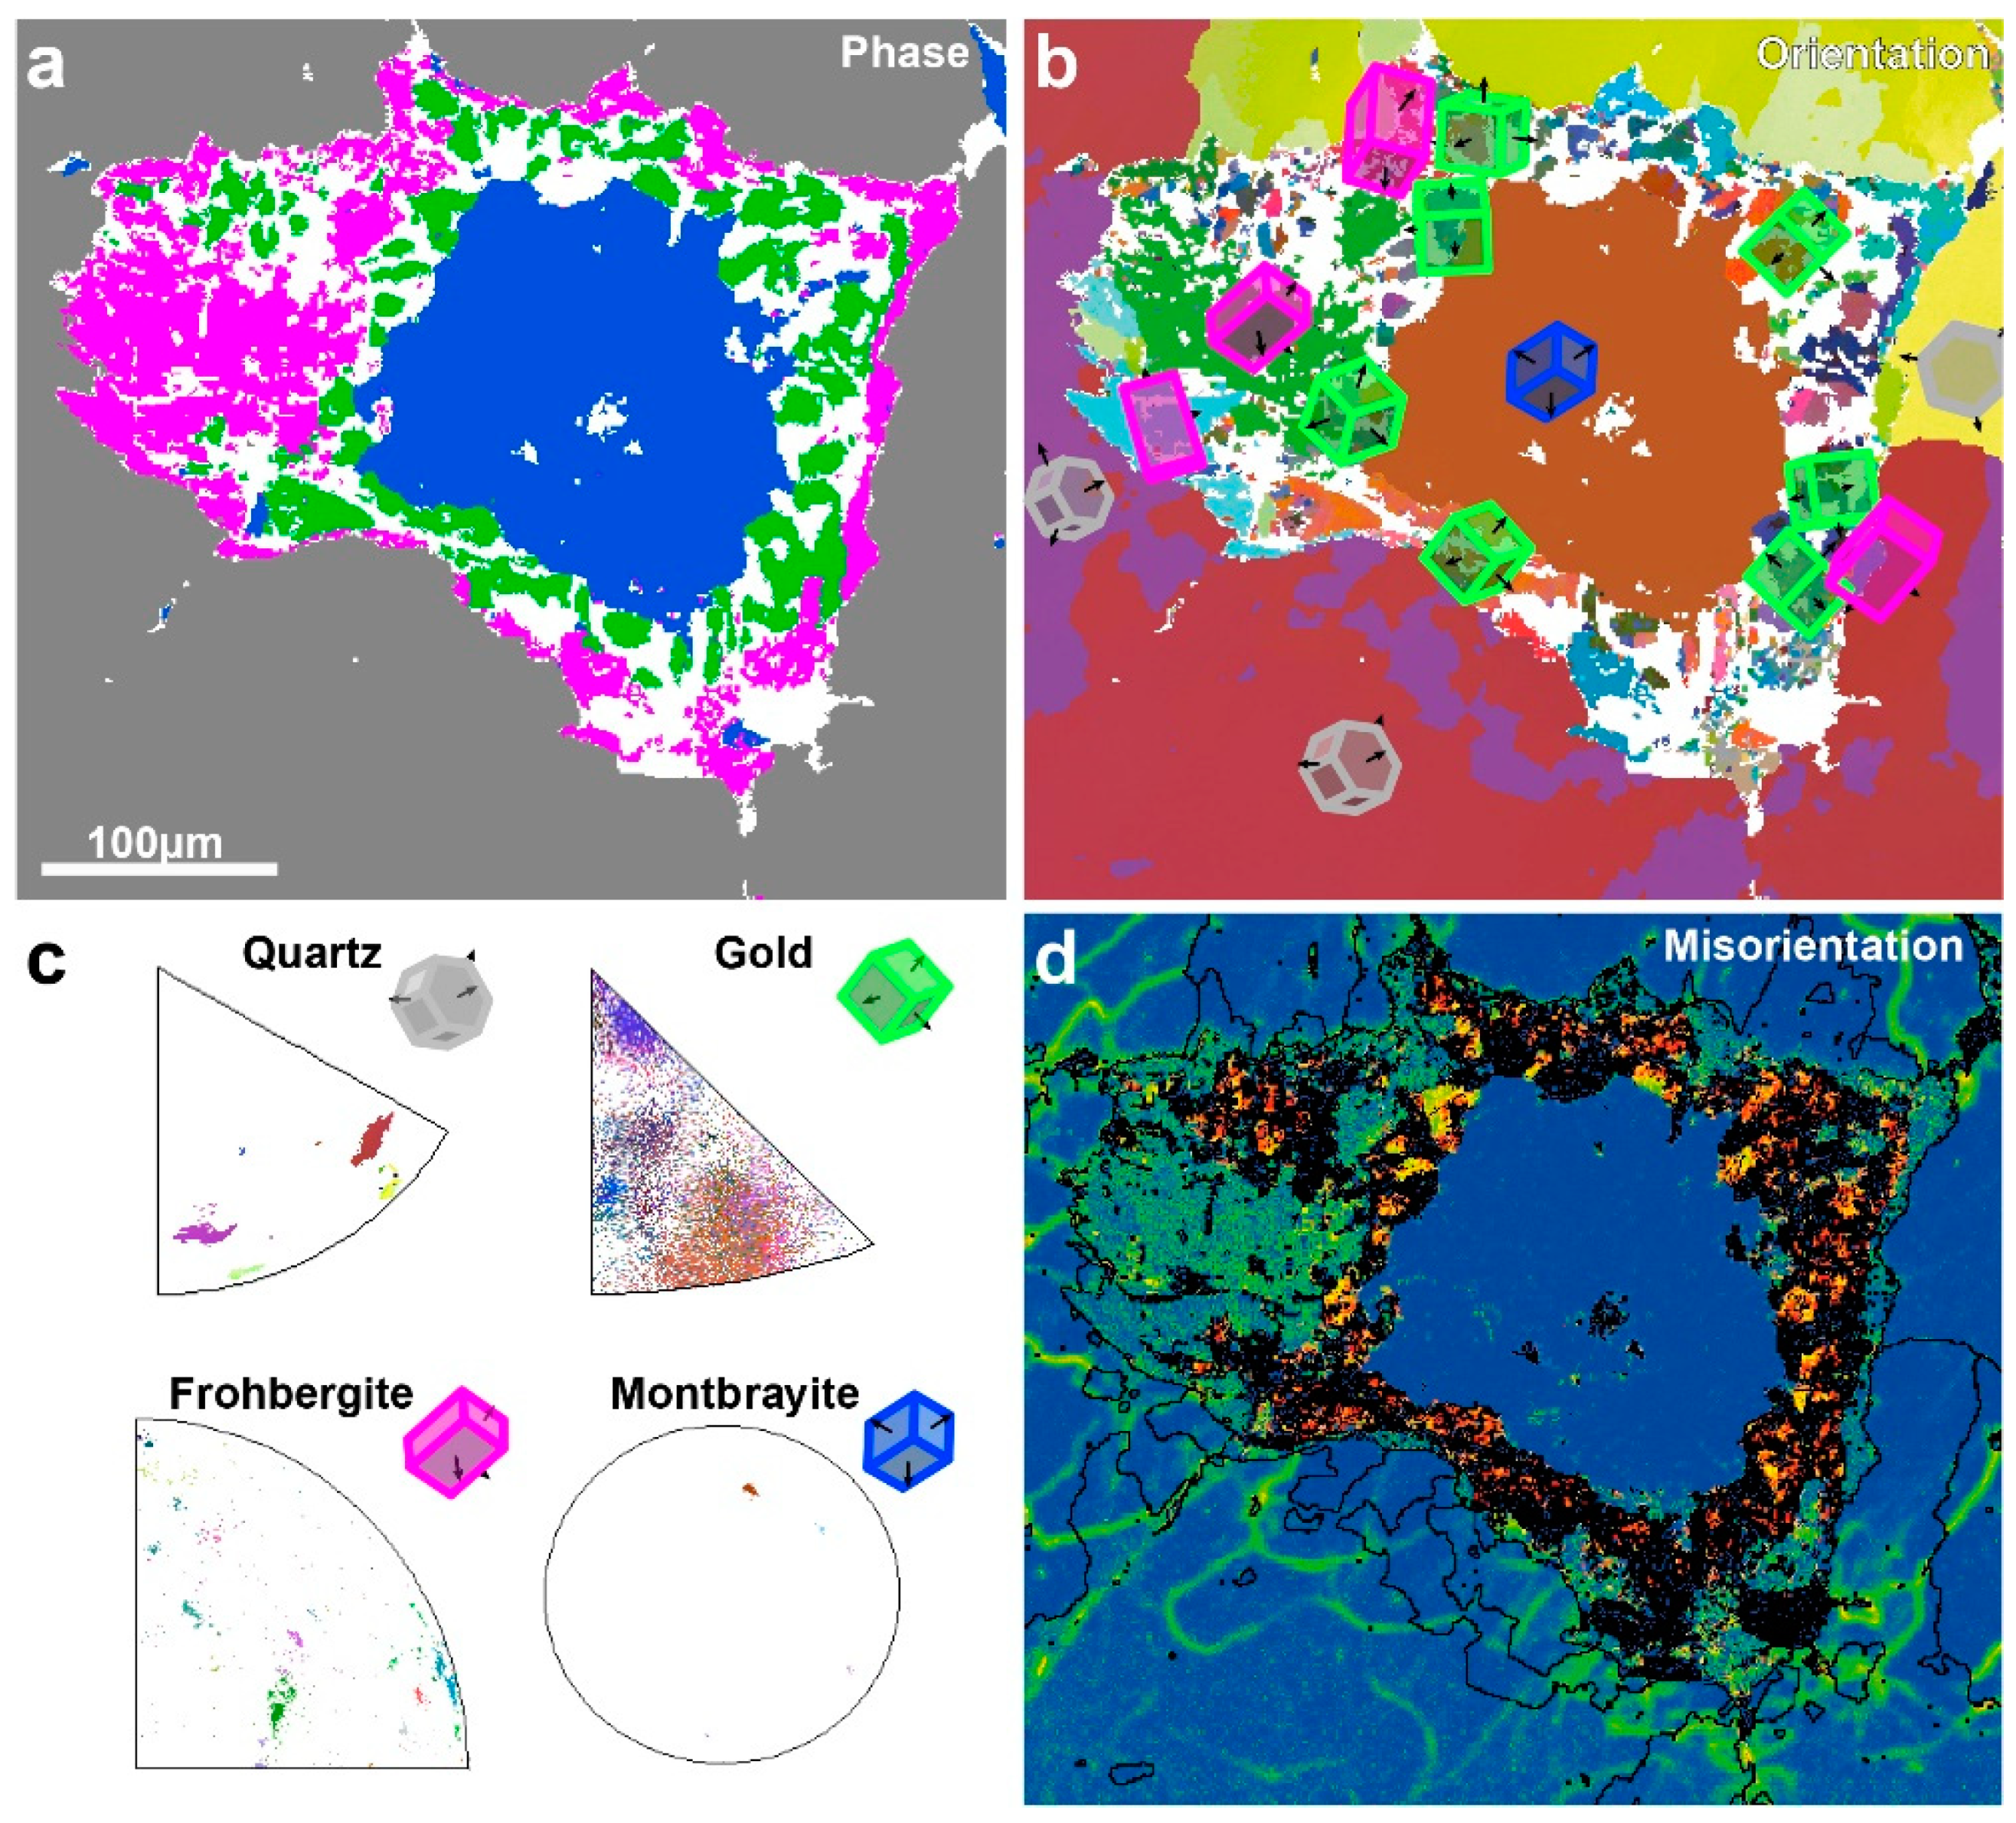
Electron microprobe analyses of montbrayite from the Svetlinsk deposit are given in Table 2. Significant variations were detected in the composition of the mineral (in wt%): Au 36.98–48.66, Te 43.35–56.53, Sb 2.49–8.10, Ag up to 4.56, Pb up to 2.04, Bi up to 0.33, Cu up to 1.42. There are two distinct groups with much more-limited variation within the observed compositional interval (in wt%): (1) Au 36.98–41.22, Te 49.35–56.53, Sb 2.49–5.57; (2) Au 47.86–48.66, Te 43.35–44.92, Sb 7.15–8.10. The empirical formula calculated on the basis of 61 apfu is Au16.43–23.28Sb1.79–6.09Te32.01–38.89Ag0–3.69Bi0–0.14Pb0–0.90Cu0–1.96. Variations in the chemical composition of montbrayite are shown in Figure 4 together with results for both montbrayite from other gold deposits and the synthetic phase from the literature. On the Au vs. Te (in apfu) graph (Figure 4c,d), all the analyses were divided into two groups. We believe this was caused by different substitution mechanisms for antimony mainly: in one group, antimony substitutes predominantly for gold (Sb→Au, all grains studied, except Grain A), in the other—predominantly for tellurium (Sb→Te, Grain A, and literature data). An inverse relationship between Sb and Ag contents in grains from the first group indirectly confirms the Sb→Au mechanism because Ag, when present, substitutes for Au [13]. The same grains contain minor Cu.

4.3. EBSD Study

The EBSD study showed a perfect consistency of the studied grains (A, B, E, and G) with the structure of montbrayite. EBSD mapping of the montbrayite-containing assemblage is shown on the example Grain A (Figure 5). Different phases and crystallites do not have pronounced orientation relationships. The montbrayite core is a single crystal. It is surrounded by randomly oriented native gold grains up to several tens of micrometers in size. However, individual particles are mainly one crystal only. Frohbergite is also represented by misoriented crystallites of 1–100 µm. The quartz matrix consists of macroscopic grains, each of which twins about the c axis (Figure 5b).
The orientation distribution figures show that a montbrayite core has the most-consistent orientation (Figure 5c). It shows no subdomains or mechanical defects, which is typical for free-growing crystals. The clusters on the pole figure of quartz have a deformational widening and are mirrored due to twinning. The pole figure of frohbergite has an array of chaotically dispersed clusters with apparent directional widening. It can indicate an obstructed growth, such as a gradual growth through a solid transition or protophase decay. Gold has the widest orientation clusters on the pole figures, which is usual for the metal due to its high ductility. It can also be a sign of the mechanical stress superimposed on the symplectites during the solid phase transformations (Figure 5c). The local misorientation distribution map confirms the data from pole figures and shows a highly deformed rim around the montbrayite core. Besides, it also shows defects in the quartz matrix located around the inclusion. These dislocations suggest a volumetric expansion of the inclusion during its evolution (Figure 5d).

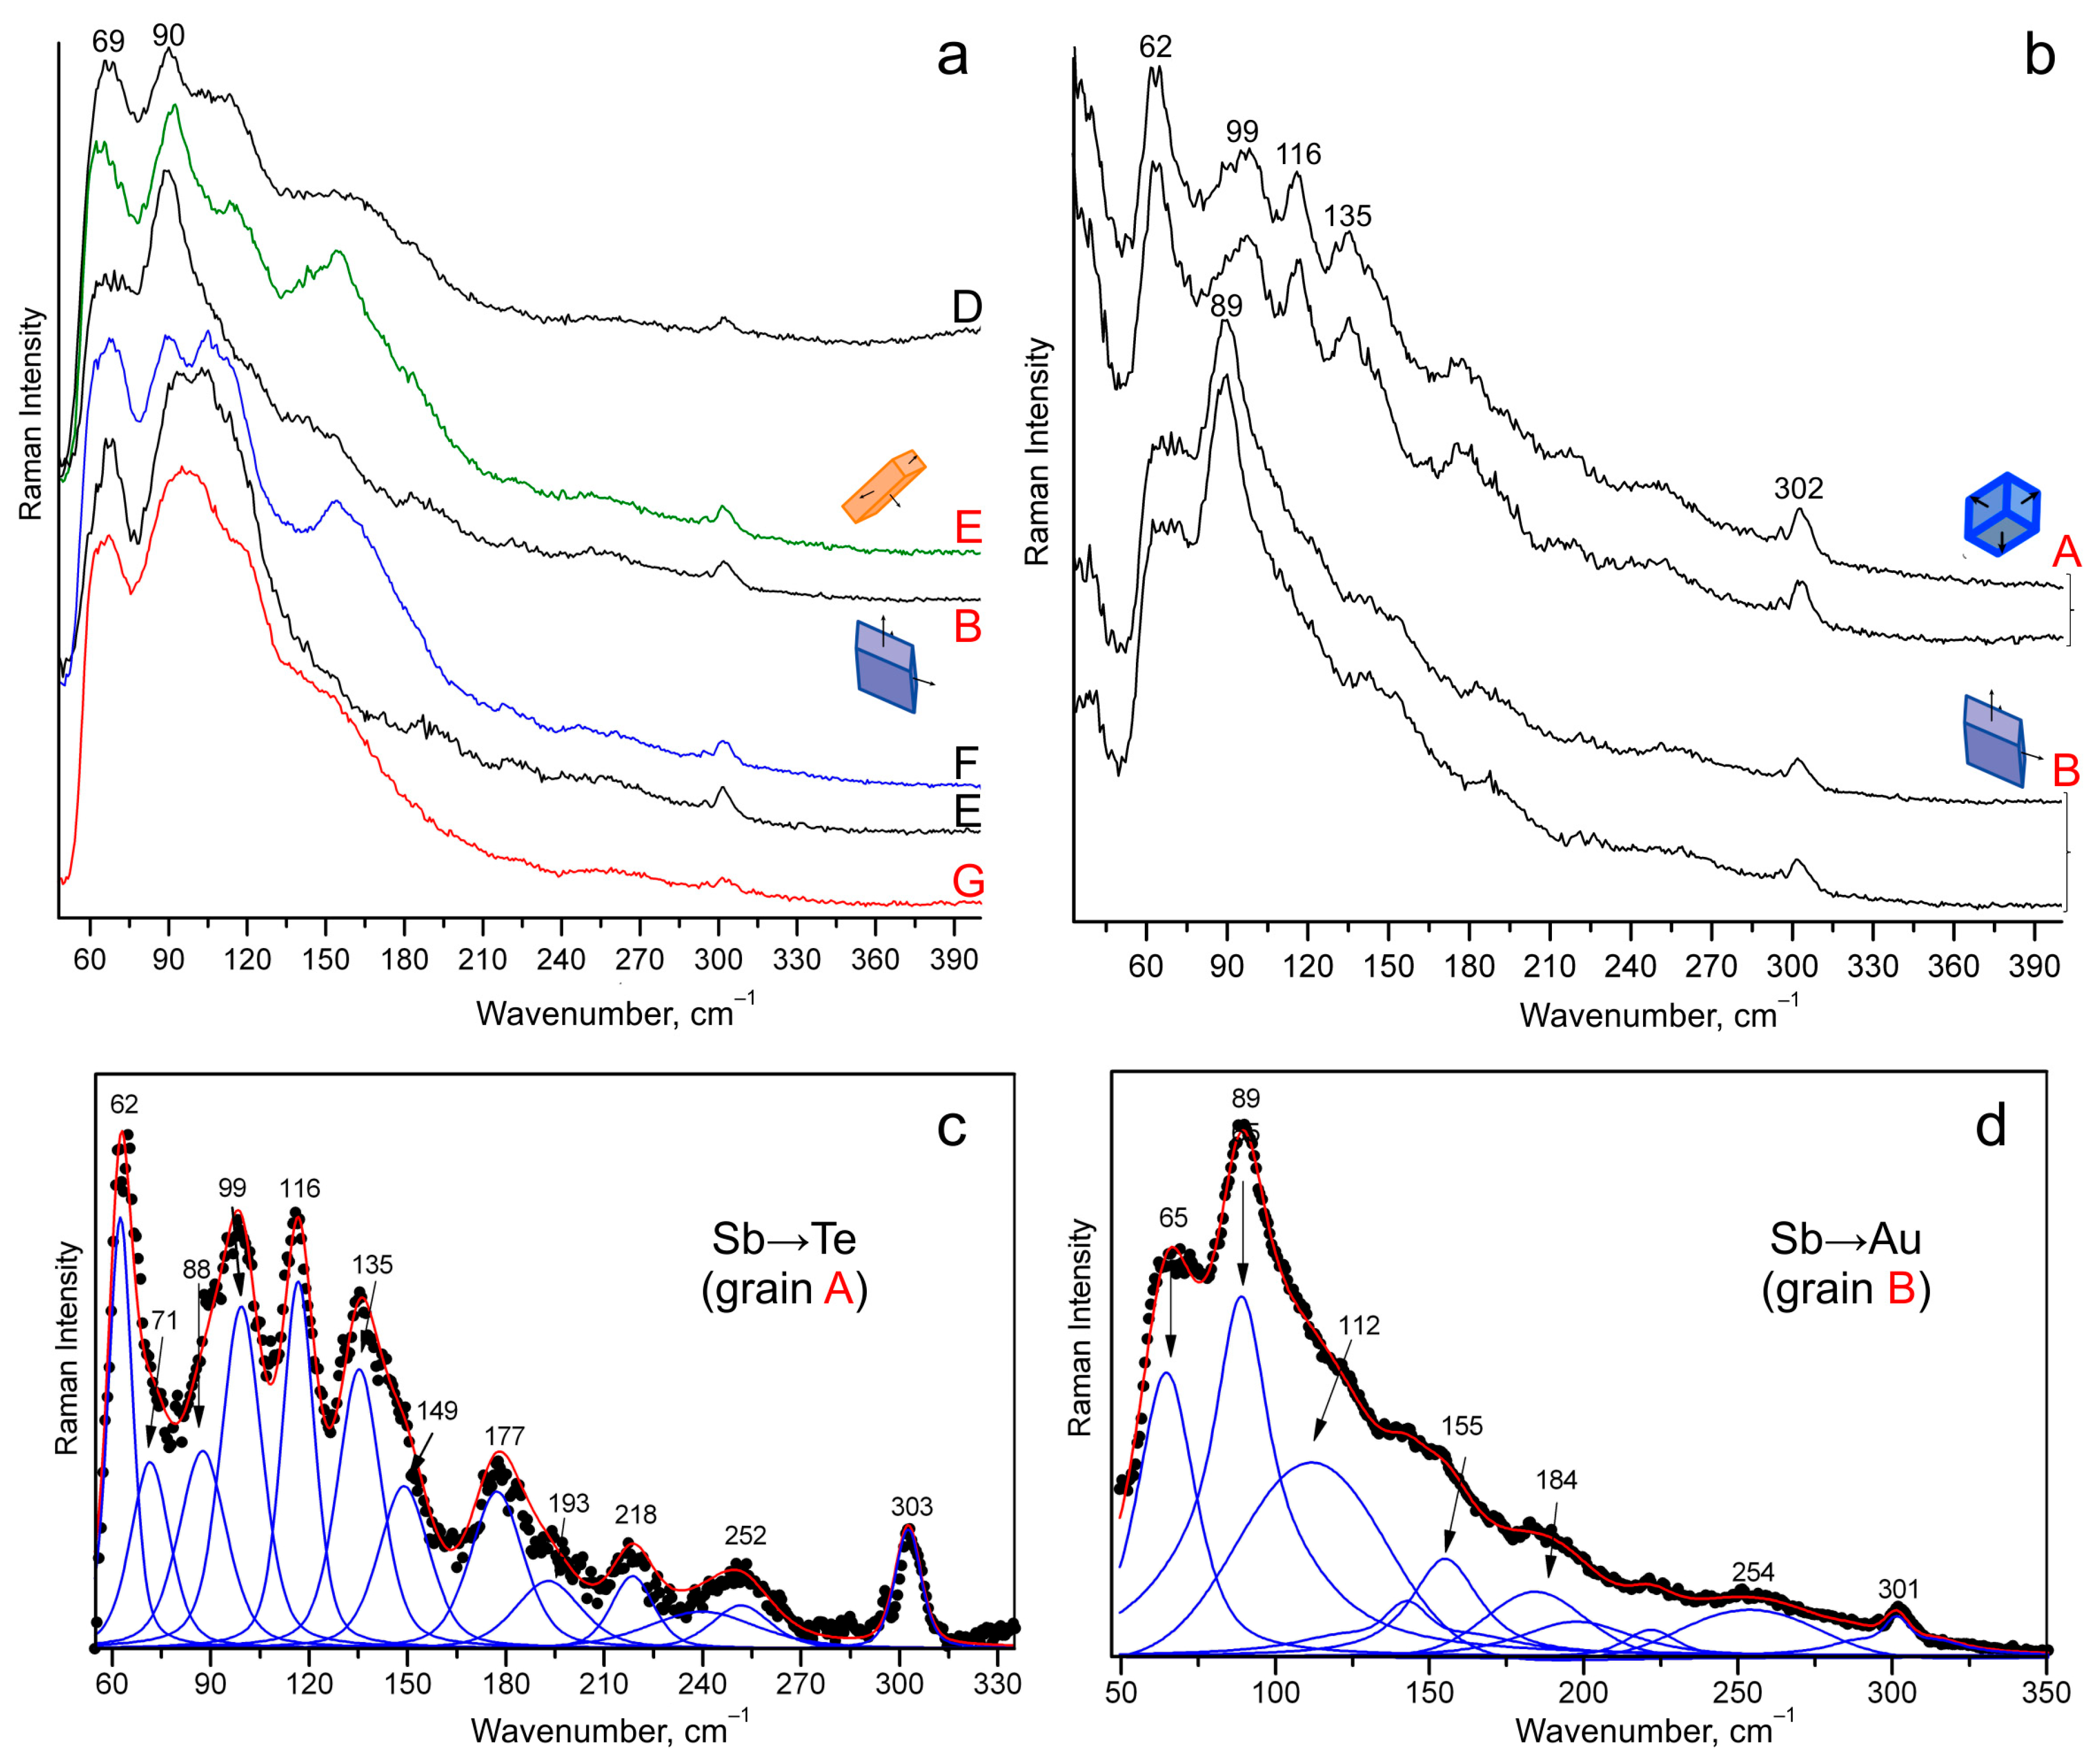
4.4. Raman Spectroscopy

This is the first Raman study of montbrayite. Representative Raman spectra using 532 nm-wavelength excitations for the selected samples are shown in Figure 6. The wavenumber positions of the bands and Raman parameters are given in Table 3. All the collected Raman spectra of montbrayite exhibit similarities and share some common features. Vibrational modes with peak positions in the range of 62–70, 87–92, 112–120, and ~302 cm−1 are present in all the spectra. The montbrayite samples exhibit a broad Raman band at about 90 cm−1 with a halfwidth from 17 to 38 cm–1 (Table 3, Figure 6a). This band has a greater Raman intensity in the spectra for the Grain B and other grains (Figure 6a,b,d), unlike Grain A (Figure 6b,c). The average main peak positions are 62, 99, 116, 135, 177, and 302 cm–1 in the spectra for Grain A. Band fitting was performed using a Voigt function with the minimum number of component bands used for the fitting process (Table 3, Figure 6c,d). The structure of montbrayite is triclinic, with space group P 1 ¯ = Ci [13]. There are 19 Te atoms with C1 site symmetry and two non-equivalent lattice sites for 11 Au atoms (C1 site symmetry) and 1 Au with Ci site symmetry per primitive cell in the crystal structure. As the primitive unit cell contains 61 atoms, there are 183 vibration modes, 90 Au infra-red active modes, 90 Ag Raman active modes, and 3 Au acoustic modes at k = 0. The montbrayite exhibits a large number of overlapping Raman active modes. The observed features depend on both the chemical composition and the structural characteristics, including the presence of vibrations at k not equal to zero for the montbrayite structure with commensurate modulation of ~52.6 Å along [3010] [13].
Based on the published data on other compounds of Au, Sb, Bi, Pb, and Te (see Table A2), we attempted to relate the observed Raman peaks and chemical bonds as follows: the peaks in the ranges of 88–92, 99–104, 112–120, and 135 cm−1 likely correspond to Te–Te bonds; 38–43 cm−1—to Au-Te or Te-Te bonds; 60–62 cm−1—to Sb-Te, Au-Te, or Te-Te bonds; 66–71 cm−1—to Sb-Te bonds; and 153–157 cm−1—to Sb-Te, Sb-Sb or Au-Sb bonds. This assignment may be speculative and requires further research. All the corresponding Raman modes with references are summarized in Table A2.

5. Discussion

5.1. Chemical Variability of Montbrayite

The montbrayite from the Svetlinsk gold–telluride deposit has non-stoichiometric compositions, which are located both on the (Au,Sb)23Te38 and Au23(Te,Sb)38 stoichiometric lines. Antimony is a main impurity in the studied montbrayite, which also contains Pb, Bi, Ag, and Cu. We explain this by two substitution mechanisms for antimony in the studied montbrayite grains: Sb→Au (2.5–5.6 wt% Sb) and Sb→Te (7–8 wt% Sb). Grains with Sb→Au substitution mechanism contain Ag and Cu. An inverse relationship between Sb and Ag contents was found that indirectly confirms the Sb→Au mechanism because Ag, when present, substitutes for Au in montbrayite [13]. The mineral composition, namely the antimony content, is manifested in both the reflection and Raman spectra. The slope of the reflectance spectra decreases, and the curve in the blue–green region of the spectrum disappears with increasing of Sb content in montbrayite. In the Raman spectra, montbrayite with different Sb substitution mechanisms differs in the average positions of a peak with high intensity. They are ~64 cm−1 and ~90 cm−1 for montbrayite with Sb→Te and Sb→Au, respectively. We believe that the variations of the peak position for grains with Sb→Au are the result of Sb substitution of Au in a disordered fashion in the mineral structure. The variability of the exhibited Raman modes also depends on the crystal orientation and was demonstrated by high-resolution Raman spectroscopy of calaverite at low temperature [29].

5.2. Formation Conditions of Montbrayite

Montbrayite is a rare gold telluride, the stability of which is controlled by the presence of impurities of Sb, Bi, Pb, and Ag in its structure. In nature, both Sb-rich and Bi-rich, as well as Pb-rich montbrayite have been found, e.g., [1,10,20]. We believe, however, following Bachechi [6], that the role of Sb is the main one, since the phase corresponding to montbrayite based on X-ray diffraction was synthesized only in the Au–Sb–Te system [7,8,9]. In the Au–Bi–Te [30,31] and Au–Pb–Te [32] systems, no ternary compounds were detected. Montbrayite from the Svetlinsk deposit is an Sb-rich variety of the mineral. Based on this, we used data from experimental studies of the ternary system Au–Sb–Te for the estimation of the possible conditions of the montbrayite formation. The eutectic assemblage Mnb + Au + Sb2Te3 crystallizes at 423 °C, and at 444 °C, montbrayite melts with decomposition into AuTe2 and melt [7]. The peritectic temperature was estimated as 460 °C (Mnb—AuTe2 + melt) [8]. In studying the Au–Sb–Te system at 350 °C, the following univariant assemblages were defined: montbrayite + calaveritess + Au, montbrayite + Au + Sb2Te3, montbrayite + Sb2Te3 + calaveritess [9]. Montbrayite was also synthesized in the temperature interval of 360–400 °C [6], and evidence for its melting at 420 and 440 °C was found. Subsequently, a melting temperature of 410 ± 5 °C was estimated by a heating experiment; synthetic montbrayite (with 5.5 at% of Au substituted by Sb plus Pb and 4.0 at% of Te substituted by Bi) melts at 410 °C and does not undergo any phase transformations in the range of temperature of 200–410 °C [6]. According to these experimental data, we estimated the upper temperature range of montbrayite crystallization as 410–440 °C.
The formation temperature of chlorite coexisting with montbrayite was estimated as 349–385 °C using a chlorite geothermometer (Vikent’eva, unpublished data). The robinsonite composition from montbrayite assemblages probably suggests the high temperature of its formation (~350–370 °C or higher), because the robinsonite composition changes to the more metal-rich side at 320 °C [33]. The study of fluid inclusions from quartz indicates that the mineralization formed at temperatures from 365 to 240 °C, from 345 to 195 °C, and from 405 to 295 °C during 1 to 3 stages, respectively [26]. High temperatures were obtained by mineral geothermometers for early minerals from gold–telluride assemblages (pyrrhotite—375–550 °C, arsenopyrite—300–320 °C and 355–440 °C for the center and edge of the grains, respectively; Vikent’eva, unpublished data). The high-temperature formation conditions of telluride mineralization are one of the specific features of the Svetlinsk deposit [23].

5.3. Decomposition of Montbrayite

This study was also focused on the reaction zones rimming the montbrayite, where symplectite-like textures were observed. Two grains of montbrayite in contact with frohbergite demonstrate decomposition: (1) into native gold and Sb-bearing calaverite (Figure 1a) and (2) into native gold and tellurantimony (Figure 1b). A small amount of altaite was also found in both products’ intergrowths; altaite contains a Bi impurity (see Figure 2).
Previous studies of montbrayite have shown the formation of complex intergrowths, both along the grain boundaries and inside the grains. Montbrayite from the Robb-Montbray, which was described as a new mineral, contains ovoid inclusions of the eutectoid intergrowth of tellurobismuthite and altaite [1]. Tellurantimony is intergrown with worm-shaped native gold on the contact of melonite and montbrayite from the Golden Mile [16]. Intergrowths of tellurantimony with native gold were found along the contact of montbrayite and frohbergite at the Pompas Au-U occurrence, Finland [34].
Textures similar to those observed by us can be a result of different processes. Symplectites could have been formed during the breakdown of the parent phase, its partial melting, or during the replacement of montbrayite by a coupled dissolution−reprecipitation (CDR) reaction. The main features of the replacement reactions are as follows, e.g., [35]: (1) some of the parent material is lost to the fluid phase; (2) porosity in the product phase that cannot be explained by the change in molar volume between the parent and product; (3) a sharp reaction front between the parent and product, with no significant diffusion profile in the parent. The CDR mechanism acts over a wide range of conditions, but is particularly common at low temperature when solid-state diffusional (SSD) mechanisms are less favorable. The role of these different processes was demonstrated for the decomposition of maldonite to gold and bismuth, e.g., [36,37], and for the transformation of gold tellurides in hydrothermal conditions (e.g., calaverite and krennerite to gold follow CDR reactions at 220 °C [38,39]; sylvanite to Au–Ag alloy through the complex of CDR and SSD reactions at 160–220 °C [40]).
Experimental studies have shown that montbrayite decomposed to calaverite and gold. Bachechi [6] found that the synthetic montbrayite melts at 440 °C and 420 °C, the resulting quench products being mainly calaverite and gold (however, tellurobismuthite was also identified, and Sb in variable amounts was found in the calaverite; however, altaite was not detected). Furthermore, Bachechi conducted experiments on the Au–Te system at the Au2Te3 composition in the temperature range 250–440 °C. Intergrowths of calaverite and native gold were observed, but two varieties of calaverite were found, one homogeneous and the other containing numerous small particles of gold. These textures were interpreted by the author as a simultaneous growth of calaverite and metastable montbrayite, followed by a breakdown of the latter to calaverite and gold [6]. The fusion experiments by Peacock and Thompson [1] gave similar intergrowths of calaverite and gold; in the beginning, the calaverite was crystallized, and finally, a mixture of calaverite and native gold was solidified.
Taking the above into consideration, we assume the following scenario for our observed textures of montbrayite decomposition. The high-temperature formation of mineral assemblages and the composition of fluids were favorable for the crystallization of montbrayite. A local temperature increase above 410 °C led to melting with decomposition to Sb-bearing calaverite and native gold or to tellurantimony and native gold. The temperature could be lower if we consider the presence of Pb, Bi, and Ag impurities in the studied montbrayite. The volume change of montbrayite decomposition reactions was positive (see Appendix B), and thus, it is a potential cause of stresses in the matrix, which eventually leads to fracturing both of frohbergite and partly of the parent montbrayite, as well as of the quartz matrix. The subsequent inflow of fluid through the cracks leads to the leaching of calaverite, the dissolution of gold, and the precipitation of nonporous calaverite without the Sb impurity between frohbergite grains, of the Au-rich phase replacing frohbergite (Figure 1a and Figure 2), and of altaite in radial cracks in the surrounding quartz. The complex history of deposit formation including two metamorphism events [23], the abundance of mineral intergrowths in ores that are typical for crystallization from melts (Vikent’eva, unpublished data), and our assumptions about polymetallic melts as an alternative mechanism of gold concentration in the Svetlinsk hydrothermal system [41] also do not contradict montbrayite melting.

6. Conclusions

  • Two substitution mechanisms for antimony were proposed for montbrayite from the Svetlinsk gold–telluride deposit: Sb → Au (2.5–5.6 wt% Sb) and Sb → Te (7–8 wt% Sb).
  • The slope of the reflectance spectra decreases, and the curve in the blue–green region of the spectrum disappears with increasing Sb content in montbrayite.
  • The average positions of the peak with high intensity are ~64 cm−1 and ~90 cm−1 for montbrayite with Sb → Te and Sb → Au, respectively. Variations of the peak position are the result of Sb substitution of Au in a disordered fashion.
  • The upper temperature range of montbrayite crystallization is 410–440 °C.
  • A possible scenario of montbrayite decomposition is as follows: local temperature increase → montbrayite melting and decomposition → positive volume change → reaction-induced fracturing → fluid inflow through cracks → leaching of calaverite, dissolution of gold, precipitation of new phases.

Author Contributions

Conceptualization, O.V.V., methodology and investigation, O.V.V., V.V.S., V.D.S. and T.N.M.; field work, I.V.V. and O.V.V.; writing—original draft preparation, O.V.V.; reviewing and editing of the draft, O.V.V., V.V.S., I.V.V. and N.S.B.; project administration, N.S.B. All authors have read and agreed to the published version of the manuscript.

Funding

The Ministry of Science and Higher Education of the Russian Federation partially financed this research. The work was performed under the theme of state assignment of the IGEM RAS (121041500220-0) and IGM SB RAS (122041400243-9, the interpretation of Raman spectroscopic data).

Data Availability Statement

Not applicable.

Acknowledgments

We thank S.E. Borisovskiy and E.V. Kovalchuk (EMPA), O.A. Doynikova and L.O. Magazina (SEM), K. Novoselov (reflectance measurements), and M. Lozhkin (Ar ion polishing for EBSD) for carrying out the analytical procedures. We are grateful to the anonymous reviewers for their comments and suggestions. We thank the managers and geological team of JSC Uzhuralzoloto Group of Companies (UGC) for their assistance during fieldwork. V.D.S. acknowledges support from the Lomonosov Moscow State University Program of Development and thanks M.F. Vigasina for fruitful discussion of the Raman spectroscopy results. The work was performed on the state assignment of IGEM RAS and in part of IGM SB RAS.

Conflicts of Interest

The authors declare no conflict of interest.

Appendix A

Table A1. Review of the electron microprobe analyses of montbrayite.
No.Wt%Formula Calculated on the Basis of 61 Atoms
AgAuPbSbBiTeTotalAgAuPbSbBiTe
Bi-rich montbrayite
10.5544.321.610.902.8149.8099.990.4821.150.730.701.2636.68
20.6047.701.300.302.9047.0099.800.5323.130.600.241.3335.18
346.101.101.103.8047.1099.20022.460.510.871.7435.42
446.001.101.004.0047.4099.50022.340.510.791.8335.53
545.090.021.793.6849.1599.91021.6000.681.3137.41
646.740.79 3.5947.0098.12023.100.3701.6735.86
70.0747.381.30 4.4647.48100.690.0622.850.6002.0335.35
849.643.5846.3299.54024.32001.6535.03
949.343.4346.9699.73024.07001.5835.36
1046.101.101.103.8047.1099.20022.460.510.871.7435.42
Sb-rich montbrayite
1148.735.631.9542.9799.28023.5904.410.8932.11
120.9244.863.731.7549.17100.430.7921.0302.830.7735.58
1350.765.031.7946.55104.13023.3803.750.7833.10
1449.714.941.9046.20102.75023.1803.730.8433.26
1550.6049.40100.00024.3300036.67
1647.704.9045.2097.80023.2003.86033.94
170.1047.905.0044.7097.700.0923.3403.94033.63
1848.304.6046.4099.30023.1303.56034.30
1948.600.406.4046.20101.60022.690.184.83033.30
2049.606.0045.10100.70023.4704.59032.94
2148.000.306.1047.20101.60022.350.134.59033.92
2247.400.106.8046.40100.70022.220.055.16033.58
2347.906.400.1047.10101.50022.3004.820.0433.84
2447.107.400.1046.00100.60022.0705.610.0433.27
2547.100.207.5045.40100.20022.190.095.72033.01
260.1046.900.107.1046.90101.100.0821.830.045.35033.70
2746.718.36 43.1998.26022.2706.45031.79
2846.066.36 46.9499.36021.8104.87034.31
Pb-rich montbrayite
293.1346.754.411.41 45.00100.702.7222.211.991.08033.00
303.3244.954.451.69 44.7599.162.9121.582.031.31033.16
Synthetic montbrayite
310.4047.401.001.103.2046.7099.800.3522.950.460.861.4634.91
32 20.13 1.53 39.35
33 48.24 7.38 43.7899.40023.0305.70032.27
34 48.07 7.82 43.2199.10023.0106.06031.93
35 49.06 6.67 43.6699.39023.5205.17032.31
Notes: dash—below detection limit, blank—not analyzed. 1–5—Robb-Montbray, Quebec, Canada (1—[1], Fe trace; 2—[5]; 3–4—[18] (3—n = 5, Ag and Cu were sought, but not detected); 5—[13], n = 5; 6–7—Kochkar, South Urals, Russia (6—minimum content, 7—maximum content, n = 4, up to 0.04 wt%, and 0.12 apfu S, [19]); 8–10—noritic breccias from the Voronezhsky massif, Russia [21]; 11–14—Enasen, Sweden [17]; 15–28—Golden Mile, Western Australia (15—[14]; 16–18—[15]; 19–26—[10] (19–23—No. 2 Western lode, 24–26—Oroya lode); 27—[16], n = 15, included wt%/apfu 0.1/0.17 Fe, 0.14/0.24 Ni, 0.07/0.09 As, 28—[28], n = 17; 29–30—South Aksu, Kazakhstan [20], Cu and Hg trace, Se—below detection limit; 31—[6]; 32—[8]; 33–35—[9].
Table A2. Raman modes in montbrayite.
Raman Shift (cm−1)Corresponding Raman ModesReferences
A*BCDEFG
38 41384043Mode at 42 cm−1 of AuTe2[29]
62 62606062Mode at 57 cm−1 of AuTe2[29]
Modes at 58 and 61 cm−1 of AuAgTe4[42]
Sb-Te vibration (63 cm−1) of Sb2Te3[43]
71656671676871Mode at 69 cm−1 of Sb2Te3[44]
Mode at 71 cm−1 of AuSbTe[45]
88899087908992Modes at 88 and 92 cm−1 of AuTe2[29]
Modes at 88 and 95 cm−1 of AuAgTe4[42]
Mode at 88 cm−1 [46]
Mode at 90 cm−1 of Te[47]
99 103 104 Mode at 101 cm−1 of AuTe2[29]
Mode at 103 cm−1 of Bi2Te3[44]
Mode at 105 cm−1 of Cu-doped Sb2Te3[48]
Mode at 102 cm−1 of AuAgTe4[42]
Mode at 98 cm−1 of Se-rich AuTe2[49]
Mode at 98 cm−1 of Bi2Te3[50]
116112118112 120114120Mode at 119 cm−1 of AuTe2[29]
Te-Te vibration (116 cm−1) of Sb2Te3[43]
Modes at 117 and 121 cm−1 of AuSb2[51]
Mode at 120 cm−1 of Bi2Te3 and mode at 112 cm−1 of Sb2Te3[44]
Mode at 120 cm−1 of Cu-doped Sb2Te3[48]
Mode at 117 cm−1 [46]
Mode at 112 cm−1 of Sb2Te3[52]
Mode at 119 cm−1[53]
Mode at 120 cm−1 [47]
Mode at 116 cm−1 of Bi2Te3[50]
Modes 114 and 121 cm−1 of AuAgTe4[42]
135 Te-Te vibration (137 cm−1) of Sb2Te3[43]
Mode at 134 cm−1 of Bi2Te3[44]
Mode at 135 cm−1 of Cu-doped Sb2Te3[48]
Mode at 137 cm−1 [46]
Mode at 136 cm−1 of Bi2Te3[50]
Modes at 132 and 134 cm−1 of AuAgTe4[42]
149142146 148Mode at 143 cm−1 of AuTe2[29]
Mode at 147 cm−1 of AuSbTe[45]
155 155153157 Modes at 152 and 162 cm−1of AuTe2[29]
Sb-Te vibration (162 cm−1) of Sb2Te3[43]
Modes at 155 and 162 cm−1 of AuSb2[51]
Mode at 158 cm−1 of AuAgTe4[42]
Mode at 160 cm−1 of Cu-doped Sb2Te3[48]
Mode at 159 cm−1 of AuSbTe[45]
177 171 Mode at 172 cm−1 of AuTe2[29]
Mode at 176 cm−1 of Au2.73Te6.23Se3.84[49]
Mode at 174 to 178 cm−1 of synthetic Au3X10 (X = Te, Se, S)[49]
184190190185 Mode at 183 cm−1 of PbTe [53]
193198 197 Mode at 206 cm−1 of synthetic AuX (X = Te,Se,S)[49]
218222222217216 Mode at 210 and 238 cm−1 of synthetic AuX (X = Te, Se, S)[49]
240254257262255245 Sb-O vibration (251 cm−1) [43]
279 Mode at 276 to 284 cm−1 of synthetic Au3X10 (X = Te, Se, S)[49]
303301302303302302294Mode at 302 cm−1 of PbTe [53]
*—capital letters denote the studied montbrayite grains. Peaks with maximum intensity are highlighted in bold.

Appendix B

The volume change was calculated by
ΔV = 100 × ((np × Vmp − npd × Vmpd)/npd × Vmpd),
where np and npd are the number of moles of the product phase and the parent decomposition phase; Vmp and Vmpd are the molar volumes of the product and parent phases.

References

  1. Peacock, M.A.; Thompson, R.M. Montbrayite, a new gold telluride. Am. Miner. 1946, 31, 515–526. [Google Scholar]
  2. Markham, N.L. Synthetic and natural phases in the system Au-Ag-Te. Econ. Geol. 1960, 55, 1148–1178. [Google Scholar]
  3. Cabri, L.J. Phase relations in the Au-Ag-Te system and their mineralogical significance. Econ. Geol. 1965, 60, 1569–1606. [Google Scholar] [CrossRef]
  4. Howie, F.H.; Veale, C.R. Low temperature synthesis of gold telluride. J. Inorg. Nucl. Chem. 1966, 28, 1149–1154. [Google Scholar] [CrossRef]
  5. Rucklidge, J. Frohbergite, montbrayite, and a new Pb-Bi telluride. Can. Miner. 1969, 9, 709–716. [Google Scholar]
  6. Bachechi, F. Synthesis and stability of montbrayite, Au2Te3. Am. Miner. 1972, 57, 146–154. [Google Scholar]
  7. Gather, B.; Blachnik, R. Das ternäre System Gold-Antimon-Tellur. Int. J. Mater. Res. 1976, 67, 395–399. [Google Scholar] [CrossRef]
  8. Blachnik, R.; Gather, B. Notizen: Einige neue ternäre Goldchalkogenide. Z. Naturforschung B 1976, 31, 526–527. [Google Scholar] [CrossRef]
  9. Nakamura, Y.; Ikeda, K. Isothermal phase relations in the Au–Sb–Te system at 350 °C. Neues Jahrb. Mineral. Monatshefte 2002, H6, 276–288. [Google Scholar] [CrossRef]
  10. Shackleton, J.M.; Spry, P.G. Antimony-rich montbrayite ((Au,Sb)2Te3) from the Golden Mile, Western Australia, and its compositional implications. Neues Jahrb. Miner. Monatshefte 2003, 3, 113–125. [Google Scholar] [CrossRef]
  11. Bachechi, F. Crystal structure of montbrayite. Nat. Phys. Sci. 1971, 231, 67–68. [Google Scholar] [CrossRef]
  12. Edenharter, A.; Bente, K.; Steins, M. Strukturuntersuchungen an Montbrayit, Au2Te3. Z. Krist. Suppl. 1991, 3, 63–64. (In German) [Google Scholar]
  13. Bindi, L.; Paar, W.H.; Lepore, G.O. Montbrayite, (Au,Ag,Sb,Pb,Bi)23(Te,Sb,Pb,Bi)38, from the Robb-Montbray mine, Montbray, Québec: Crystal structure and revision of the chemical formula. Can. Miner. 2018, 56, 129–142. [Google Scholar] [CrossRef]
  14. Travis, G.A. A Study of the Gold and Telluride Mineralization at Kalgoorlie, Western Australia. Master’s Thesis, Imperial College, London, UK, 1966. [Google Scholar]
  15. Golding, Y.L. Mineralogy, Geochemistry and Origin of the Kalgoorlie Gold Deposits, Western Australia. Ph.D. Thesis, University of Melbourne, Melbourne, Australia, 1978. [Google Scholar]
  16. Mueller, A.G.; Muhling, J.R. Early pyrite and late telluride mineralization in vanadium-rich gold ore from the Oroya Shoot, Paringa South mine, Golden Mile, Kalgoorlie: 3. Ore mineralogy, Pb-Te (Au-Ag) melt inclusions, and stable isotope constraints on fluid sources. Miner. Depos. 2020, 55, 733–766. [Google Scholar] [CrossRef]
  17. Nysten, P.; Annersten, H. The gold mineralization at Enasen, Central Sweden. Geol. Foereningen I Stockh. Foerhandlingar 1984, 106, 245–256. [Google Scholar] [CrossRef]
  18. Criddle, A.J.; Stanley, C.J.; Paar, W.H. The optical properties of montbrayite, Au2Te3, from Robb Montbray, Quebec, compared with those of the other gold tellurides. Can. Miner. 1991, 29, 223–229. [Google Scholar]
  19. Spiridonov, E.M. Mineralogy of the metamorphosed Kokchar plutogenic gold-quartz deposit (Southern Urals): 1. Gold-telluride ores (new minerals Bi-Pb-Te-S; kochkarite, ruklidgeite, aleksite, gold, montbrayite, tellurides and sulphides of Bi). Proc. Russ. Mineral. Soc. 1995, 124, 24–39. [Google Scholar]
  20. Spiridonov, E.M. New data on mineralogy of deposits of plutonogenic gold-quartz formation in the northern Central Kazakhstan. Part I. New Data Miner. 2014, 49, 57–73. [Google Scholar]
  21. Genkin, A.D.; Safonov, Y.G.; Tsepin, A.I.; Scherbachev, D.K. Montbrayite from Voronezhsky Massif. Proc. Russ. Mineral. Soc. 1999, 128, 93–94. [Google Scholar]
  22. Palyanova, G.A. Gold and silver minerals in sulfide ore. Geol. Ore Dep. 2020, 62, 383–406. [Google Scholar] [CrossRef]
  23. Sazonov, V.N.; Popov, V.A.; Grigoryev, N.A.; Murzin, V.V.; Metsner, E.I. Crust-Mantle Mineralisation in the Salic Blocks of Eugeosyncline; UrO USSR AN: Sverdlovsk, Russia, 1989; 113p. (In Russian) [Google Scholar]
  24. Vikent’eva, O.V.; Bortnikov, N.S. The large Svetlinsk Au-Te deposit, South Urals: Telluride mineralization for genetic reconstructions. In Proceedings of the 13th Biennial SGA Meeting, Nancy, France, 24–27 August 2015; pp. 851–854. [Google Scholar]
  25. Bortnikov, N.S.; Murzin, V.V.; Sazonov, V.N.; Prokof’ev, V.Y.; Stolyarov, M.I. The Svetlinsk gold-telluride deposit, Urals, Russia: Mineral paragenesis, fluid inclusions and stable isotope studies. In Proceedings of the Fifth Biennial SGA Meeting and the Tenth Quadrennial JAGOD Symposium, London, UK, 22–25 August 1999; Volume 1, pp. 21–24. [Google Scholar]
  26. Vikent’eva, O.; Prokofiev, V.; Borovikov, A.; Kryazhev, S.; Groznova, E.; Pritchin, M.; Vikentyev, I.; Bortnikov, N. Contrasting Fluids in the Svetlinsk Gold-Telluride Hydrothermal System, South Urals. Minerals 2020, 10, 37. [Google Scholar] [CrossRef]
  27. Shackleton, J.M.; Spry, P.G.; Bateman, R. Telluride mineralogy of the Golden Mile deposit, Kalgoorlie, Western Australia. Can. Miner. 2003, 41, 1503–1524. [Google Scholar] [CrossRef]
  28. Mueller, A.G.; Hagemann, S.G.; Brugger, J.; Xing, Y.; Roberts, M.P. Early Fimiston and late Oroya Au–Te ore, Paringa South mine, Golden Mile, Kalgoorlie: 4. Mineralogical and thermodynamic constraints on gold deposition by magmatic fluids at 420–300 °C and 300 MPa. Miner. Depos. 2020, 55, 767–796. [Google Scholar] [CrossRef]
  29. van Loosdrecht, P.H.M.; van Bentum, P.J.M.; Balzuweit, K. Raman study of incommensurately modulated calaverite (AuTe2). Ferroelectrics 1992, 125, 517–522. [Google Scholar] [CrossRef]
  30. Gather, B.; Blachnik, R. Das System Gold–Wismut–Tellur. Z. Met. 1974, 65, 653–656, (In German with English Abstract). [Google Scholar] [CrossRef]
  31. Winkler, E.W.; Bright, N.F.H. Experiments in the Au–Bi–Te system. Solid State Communications 1964. 2, 293–295.
  32. Legendre, B.; Souleau, C. Etude du systeme ternaire Au-Pb-Te. Bull. Chim. Fr. 1972, 2, 473–479. (In French) [Google Scholar]
  33. Kitakaze, A.; Nakamura, M.; Komatsu, R. Phase relation of some sulfide systems-(6): Especially Pb-Sb-S ternary system. Mem. Fac. Eng. Yamaguchi Univ. 2020, 71, 7–16. [Google Scholar]
  34. Polekhovsky, Y.S.; Petrov, S.V.; Kalinin, A.A.; Koval, A.V. New data on mineralogy of the Rompas gold-uranium occurrence, Finland. In Proceedings of the Fersman Scientific Session; Kola Science Center RAS: Apatity, Russia, 2018; Volume 15, pp. 482–486. (In Russian) [Google Scholar]
  35. Putnis, A. Mineral replacement reactions: From macroscopic observations to microscopic mechanisms. Miner. Mag. 2002, 66, 689–708. [Google Scholar] [CrossRef]
  36. Ciobanu, C.L.; Birch, W.D.; Cook, N.J.; Pring, A.; Grundler, P.V. Petrogenetic significance of Au–Bi–Te–S associations: The example of Maldon, Central Victorian gold province, Australia. Lithos 2010, 116, 1–17. [Google Scholar] [CrossRef]
  37. Gamyanin, G.N.; Nekrasov, I.Y.; Samusikov, V.P. Maldonite from gold occurences of Eastern Yakutia. Miner. J. 1986, 8, 65–71. [Google Scholar]
  38. Zhao, J.; Brugger, J.; Grundler, P.V.; Xia, F.; Chen, G.; Pring, A. Mechanism and kinetics of a mineral transformation under hydrothermal conditions: Calaverite to metallic gold. Am. Miner. 2009, 94, 1541–1555. [Google Scholar] [CrossRef]
  39. Xu, W.; Zhao, J.; Brugger, J.; Chen, G.; Pring, A. Mechanism of mineral transformations in krennerite, Au3AgTe8, under hydrothermal conditions. Am. Miner. 2013, 98, 2086–2095. [Google Scholar] [CrossRef]
  40. Zhao, J.; Brugger, J.; Xia, F.; Ngothai, Y.; Chen, G.; Pring, A. Dissolution-reprecipitation vs. solid-state diffusion: Mechanism of mineral transformations in sylvanite, (AuAg)2Te4, under hydrothermal conditions. Am. Miner. 2013, 98, 19–32. [Google Scholar] [CrossRef]
  41. Vikent’eva, O.V.; Bortnikov, N.S. Evidences of mineral melting in the ores of the Svetlinsk gold deposit, South Urals, Russia. Dokl. Earth Sci. 2023, 513, 2. [Google Scholar]
  42. Amiel, Y.; Kafle, G.P.; Komleva, E.V.; Greenberg, E.; Ponosov, Y.S.; Chariton, S.; Lavina, B.; Zhang, D.; Palevski, A.; Ushakov, A.V.; et al. Silvanite AuAgTe4: A rare case of gold superconducting material. J. Mater. Chem. C 2023, 11, 10016. [Google Scholar] [CrossRef]
  43. Zybała, R.; Mars, K.; Mikuła, A.; Bogusławski, J.; Soboń, G.; Sotor, J.; Schmidt, M.; Kaszyca, K.; Chmielewski, M.; Ciupiński, L.; et al. Synthesis and characterization of antimony telluride for thermoelectric and optoelectronic applications. Arch. Metall. Mater. 2017, 62, 1067–1070. [Google Scholar] [CrossRef]
  44. Richter, W.; Köhler, H.; Becker, C.R. A Raman and far-infrared investigation of phonons in the rhombohedral V2-VI3 compounds Bi2Te3, Bi2Se3, Sb2Te3 and Bi2(Te1−xSex)3 (0 < x < l), (Bi1−ySby)2Te3 (0 < y < 1). Phys. Stat. Sol. 1977, 6, 619–628. [Google Scholar]
  45. Vikent’eva, O.V.; Shilovskikh, V.V.; Shcherbakov, V.D.; Vikentyev, I.V.; Bortnikov, N.S. A Rare Au-Sb telluride pampaloite from the Svetlinsk gold-telluride deposit, South Urals, Russia. Minerals 2022, 12, 1274. [Google Scholar] [CrossRef]
  46. Rodríguez-Fernández, C.; Manzano, C.V.; Romero, A.H.; Martín, J.; Martín-González, M.; Morais de Lima Jr, M.; Cantarero, A. The fingerprint of Te-rich and stoichiometric Bi2Te3 nanowires by Raman spectroscopy. Nanotechnology 2016, 27, 075706. [Google Scholar] [CrossRef]
  47. Volodin, V.A.; Sinyukov, M.P.; Shcheglov, D.V.; Latyshev, A.V.; Fedosenko, E.V. Raman scattering in PbTe and PbSnTe films: In situ phase transformations. Semiconductors 2014, 48, 173–177. [Google Scholar] [CrossRef]
  48. Shi, D.; Wang, R.; Wang, G.; Li, C.; Shen, X.; Nie, Q. Enhanced thermoelectric properties in Cu-doped Sb2Te3 films. Vacuum 2017, 145, 347–350. [Google Scholar] [CrossRef]
  49. Palyanova, G.; Beliaeva, T.; Kokh, K.; Seriotkin, Y.; Moroz, T.; Tolstykh, N. Characterization of synthetic and natural gold chalcogenides by electron microprobe analysis, X-ray powder diffraction, and Raman spectroscopic methods. J. Raman Spectrosc. 2022, 53, 1012–1022. [Google Scholar] [CrossRef]
  50. Russo, V.; Bailini, A.; Zamboni, M.; Passoni, M.; Conti, C.; Casari, C.S.; Li Bassi, A.; Bottani, C.E. Raman spectroscopy of Bi-Te thin films. J. Raman Spectrosc. 2008, 39, 205–210. [Google Scholar] [CrossRef]
  51. Freund, G.A.; Kirby, R.D.; Sellmyer, D.J. Raman scattering from pyrite structure AuSb2. Solid State Commun. 1977, 22, 5–7. [Google Scholar] [CrossRef]
  52. Goncalves, L.M.; Alpuim, P.; Rolo, A.G.; Correia, J.H. Thermal co-evaporation of Sb2Te3 thin-films optimized for thermoelectric applications. Thin Solid Film. 2011, 519, 4152–4157. [Google Scholar] [CrossRef]
  53. Zhang, B.; Cai, C.; Zhu, H.; Wu, F.; Ye, Z.; Chen, Y.; Li, R.; Kong, W.; Wu, H. Phonon blocking by two dimensional electron gas in polar CdTe/PbTe heterojunctions. Appl. Phys. Lett. 2014, 104, 161601. [Google Scholar] [CrossRef]
Figure 1. Backscatter electron (BSE) and reflected light (plane-polarized, in the inset) images showing the montbrayite assemblages from the Svetlinsk deposit. (a) Montbrayite (Grain A) with the rim of eutectoid-like (or symplectite-like) intergrowths of porous calaverite and native gold along the contact with frohbergite. Altaite is rare among calaverite and native gold. See also Figure 2 for this grain. (b) Intergrowth of montbrayite (Grain B) and frohbergite with native gold, tellurantimony, and rare altaite along their contact. The diffusion boundary is between tellurantimony and frohbergite according to the SEM data (profiles and mapping). (c) Montbrayite (Grain C) and intergrowth of frohbergite with native gold and tellurantimony in the chlorite matrix. (d) Montbrayite alone or with chalcopyrite (Grain D), as well as intergrowths of altaite with tellurantimony in chlorite matrix. (e) Montbrayite (Grain E) occurs as inclusion in petzite together with native gold and tellurantimony; petzite is intergrown with frohbergite and chalcopyrite. (f) Montbrayite (Grain F) in contact with petzite intergrown with chalcopyrite. Elongate inclusions of tellurantimony are in petzite. (g) Montbrayite (Grain G) is surrounded by a complex intergrowth of robinsonite with tetrahedrite and petzite. (h) Montbrayite (Grain H) coexists with robinsonite, petzite, tellurantimony, and tetrahedrite. (i) Montbrayite (Grain I) is intergrown with petzite, robinsonite, and tetrahedrite. The matrix is quartz for all images, except for Figure 1c,d. The figure letter number corresponds to the grain designation. Abbreviations: Alt—altaite, Au—native gold, Ccp—chalcopyrite, Chl—chlorite, Clv—calaverite, Frb—frohbergite, Mnb—montbrayite, Ptz—petzite, Rob—robinsonite, Tea—tellurantimony, Ttr—tetrahedrite.
Minerals 13 01225 g001
Figure 2. EDX element maps of the montbrayite.
Minerals 13 01225 g002
Figure 3. Reflectance spectra for montbrayite with varying contents of antimony and other impurities (in wt%) from the Svetlinsk (Grain A, 7 wt% Sb, and Grain B, 5 wt% Sb) and Robb-Montbray [18].
Minerals 13 01225 g003
Figure 4. Chemical composition variations of montbrayite from the Svetlinsk deposit in comparison with the literature data [1,5,6,8,9,10,13,14,15,16,17,18,19,20,21,28]. (a,b) Au–Sb–Te ternary diagram. The black triangular area has been enlarged. (c,d) Au vs. Te (in apfu) graph. Capital letters indicate studied grains; the grains with EBSD data are highlighted in red. The structure refinement was made for the composition from [13]. See the chemical analyses in Table 2 and Table A1.
Minerals 13 01225 g004
Figure 5. EBSD mapping of the montbrayite-containing assemblage (Grain A): (a) phase map, (b) orientation map, Euler angles color scheme, (c) inverse pole figures (y component) of the constituting map, (d) misorientation map. The white-colored area (Figure 4a) does not give Kikuchi bands.
Minerals 13 01225 g005
Figure 6. Raman spectra of montbrayite. (a,b) Raman spectra of studied grains of montbrayite are marked with capital letters; the grains with EBSD data are highlighted in red. (c,d) Band fitting of the Raman spectra of montbrayite Grains A and B with presumed various substitution mechanisms for Sb.
Minerals 13 01225 g006
Table 1. Review of montbrayite mineral assemblages at the gold deposits.
MnbDeposit/LocationMineral AssemblagesReferences
Bi-richRobb-Montbray Mine/Quebec, CanadaMnb-Au-Tbi-Alt-Ptz-Mlt[1]
Mnb-Clv[5]
Mnb-Tbi[18]
Mnb-Tbi-Frb-Ptz-Alt-Mlt-Ccp-Au[13]
Kochkar/S. Urals, RussiaMnb-Au-Koc[19]
Sb-richGolden Mile/Kalgoorlie, Western AustraliaMnb-Mlt, Mnb-Syl, Mnb-Clv, Mnb-Alt-Ptz[14]
Mnb-Alt-Ptz, Mnb-Au, Mnb-Ptz, Mnb-Clv-Au, Mnb-Au-Mtg, Mnb-Au-Tea[15]
Mnb-Alt, Mnb-Alt-Ptz, Mnb-Au-Ptz[27]
Mnb-Alt-Ptz, Mnb-Au-Ptz[10]
Mnb-Au-Mlt, Mnb-Au-Tea, Mnb-Alt-Tea-Clr-Mlt-Clv-Ptz[16]
Enasen/SwedenMnb-Au-Tea, Mnb-Frb[17]
Svetlinsk/S. Urals, RussiaMnb-Frb-Au-Clv-Alt, Mnb-Frb-Au-Tea-Alt, Mnb-Frb-Au-Tea-Chl-Ccp, Mnb-Frb-Au-Tea-Ptz-Ccp, Mnb-Tea-Ptz-Ccp, Mnb-Tea-Ptz-Rob-TtrThis study
Pb-richZhana-Tyube, South Aksu, Zholymbet/KazakhstanMnb-Mlt-Frb-Au in the pyrrhotite ores[20]
Abbreviations: Alt—altaite, Au—native gold, Ccp—chalcopyrite, Chl—chlorite, Clr-coloradoite, Clv—calaverite, Frb—frohbergite, Hes—hessite, Koc—kochkarite, Mlt—melonite, Mnb—montbrayite, Mtg—mattagamite, Ptz—petzite, Rob—robinsonite, Syl—sylvanite, Tbi—tellurobismuthite, Tea—tellurantimony, Ttr—tetrahedrite.
Table 2. Electron microprobe analyses of montbrayite from the Svetlinsk deposit.
No.wt.%Formula Calculated on the Basis of 61 Atoms
AgAuCuPbSbBiTeTotalAgAuCuPbSbBiTe
148.660.267.2243.3599.49023.2800.125.59032.01
248.470.237.1543.3999.24023.2400.105.54032.12
347.880.227.1543.5098.75023.0300.105.57032.30
4 *48.19 0.618.1044.92101.82022.4000.276.09032.24
5 *47.86 7.7944.1499.79022.70005.98032.32
6 *48.62 0.347.8844.71101.55022.6900.155.95032.21
70.9341.160.384.9552.95100.370.7718.770.5403.65037.27
80.9740.990.475.0253.29100.740.8118.580.6503.68037.28
90.9641.220.395.0853.11100.760.7918.710.5503.73037.21
102.3639.190.463.790.1155.42101.331.9217.490.6302.730.0538.17
111.5437.690.965.1555.06100.401.2616.801.3303.71037.90
121.3639.341.164.070.3353.4799.731.1317.801.6302.980.1437.34
131.1938.901.424.250.3254.89100.970.9617.271.9603.050.1437.62
142.2239.830.473.780.3352.9399.561.8518.200.6702.800.1437.34
151.6039.580.304.3852.5898.441.3518.340.4203.28037.61
164.5637.180.160.092.5256.53101.043.6916.500.220.041.81038.74
174.4237.180.112.4956.53100.733.6016.570.1501.79038.89
182.4838.810.262.045.5749.3598.502.1018.030.370.904.19035.40
19*4.0336.98 3.86 55.13100.003.3116.63 2.81 38.26
Notes: dash—below detection limit, blank—not analyzed, *—SEM analyses, all others by EMPA. Analyses 1–6 are for Grain A, 7–9 for B, 10 for C, 11 for D, 12–14 for E, 15 for F, 16 for G, 17 for H, 18 for I, 19 for J. The Se content was below the detection limit in all analyses.
Table 3. Raman spectra parameters (band positions and full-width at half-maximum (FWHM) for each mode) of montbrayite obtained from the deconvolution of the spectra.
1234567891011121314
PeakFWHMPeakFWHMPeakFWHMPeakFWHMPeakFWHMPeakFWHMPeakFWHM
385 419382940134310
6296522662462126086086211
7114 7113671568157110
8817892590178727901789259238
9915 10325 10413
11612112541182911231116
120
30
25
1142712028
13516
149181422714634 14870
15527 155601534515760
17719 17118
18438190391902218531
1932319843 197170
2181522220222342179821633
240402545025753262302555224568
27921
303103011530283031430213302142943
Montbrayite grains: 1, 2—A; 3, 4—B; 5, 6—C; 7, 8—D; 9, 10—E; 11, 12—F; 13, 14—G. Peaks with high intensity are highlighted in bold.
Disclaimer/Publisher’s Note: The statements, opinions and data contained in all publications are solely those of the individual author(s) and contributor(s) and not of MDPI and/or the editor(s). MDPI and/or the editor(s) disclaim responsibility for any injury to people or property resulting from any ideas, methods, instructions or products referred to in the content.

