Article

Impact of Admixtures on Environmental Footprint, Rheological and Mechanical Properties of LC3 Cemented Paste Backfill Systems

1
Master Builders Solutions Deutschland GmbH, Dr-Albert-Frank-Strasse 32, 83308 Trostberg, Germany
2
Master Builders Solutions Schweiz AG, H7-06, Im Schachen, 5113 Holderbank, Switzerland
*
Authors to whom correspondence should be addressed.
Minerals 2023, 13(12), 1552; https://doi.org/10.3390/min13121552
Submission received: 23 October 2023 / Revised: 11 December 2023 / Accepted: 13 December 2023 / Published: 16 December 2023
(This article belongs to the Special Issue Backfilling Materials for Underground Mining, Volume III)

Abstract

:
This study investigates the time-dependent rheological behavior of cemented paste backfill (CPB) that contains calcined clay as a binder, particularly with LC3 (Limestone Calcined Clay Cement) compositions, using two different PCEs (Polycarboxylate Ether) superplasticizers. Rheological measurements have been conducted on four different mix designs using the Bingham model to describe the CPB mixtures. Both yield stress and plastic viscosity have been reported, and the impact of the admixture on these parameters has been investigated. Unconfined compressive strength (UCS) was measured over 182 days for all mix designs. Both admixtures showed better workability in all cases, with significantly improved yield stress and plastic viscosity compared to the reference, while showing little to no negative impact on strength over time. This study highlights that both from a binder and an admixture point of view, relevant to the industry, these calcined clay systems are ready to be used in a CPB and could make a significant impact on the sustainability of a mining operation in the near future.

1. Introduction

Mining operations play a vital role in supplying energy, building materials, and essential mineral-based resources needed for human society’s advancement. However, they also generate significant amounts of mining waste, one of the most important being tailings: in the case of China, by the end of 2020, the accumulated volume of tailings reached a staggering 22.2 billion tons, with the annual emissions of tailings exceeding 1.5 billion tons [1]. The discharge of such massive quantities of tailings not only pollutes the environment, disrupts ecological balance, and leads to hazardous incidents like mudslides and dam failures, but it also depletes valuable land resources and hampers economic development for mining companies [2,3].
Mine backfilling is an essential component of underground mining due to various reasons [4,5,6]. These include tailings disposal, ensuring ground stability, and providing a working platform for operators [7]. Binding agents are crucial in enhancing the strength and durability of the backfill material used in underground mined-out stopes or openings [8]. Different types of tailings management are found in the industry, such as impoundment, which leads to the formation of tailings ponds that can collapse and present an ecological risk. Backfill, on the other hand, is a way to manage tailings and avoid the risk of tailing pond surges. There are five primary types of mine backfilling methods: cemented hydraulic fill, cemented rock fill, cemented aggregate fill, cemented paste backfill (CPB), and cemented composite fill. CPB, which is the focus of this work, typically consists of a carefully engineered mixture comprising processing tailings, with a solid percentage conventionally ranging between 70% and 85%. It also includes a single or double hydraulic binder, typically comprising 1% to 10% by weight, to ensure sufficient cohesion and prevent liquefaction. Each component of CPB plays a significant role during transportation, placement, curing, and the acquisition of mechanical strength, and a superplasticizer can have a significant impact on the overall performance of the CPB mixture [9].
The potential for CPB to improve the overall stability and sustainability of mining operations is becoming increasingly significant. The most used binder within the backfill industry is ordinary Portland cement (OPC) due to its availability and versatility [10]. However, OPC has a high CO2 footprint with a Global Warming Potential (GWP) value comprised roughly between 650 and 1000 kg CO2/ton [11]. In addition, binder costs can comprise up to 75% of the operating costs when OPC is used as a sole binder [12]. To both reduce the binder-induced costs and lower the CO2 footprint of a backfill mix design, one of the most promising strategies is to reduce the clinker content of cement, which can be achieved by incorporating Supplementary Cementitious Materials (SCMs) [13,14,15,16]. While traditional SCMs like fly ash and ground-granulated blast furnace slag (GGBFS) have been used for many years, they are waste by-products of CO2-emitting sectors and will have limited availability in the future [17].
Calcined clays have emerged as a preferred SCM for reducing the carbon footprint of cement since, unlike clinker production, the calcination of clay releases no CO2 directly and requires a much lower calcination temperature (750–850 °C). Unlike other industries such as paper or porcelain, construction-grade calcined clays do not require high purity when used in a cementitious binder, making them an ideal SCM for reducing clinker content and consequently lowering the CO2 footprint in cement production [13,14]. The combination of OPC, calcined clay, and limestone is named LC3 (Limestone Calcined Clay Cement), and these compositions have demonstrated a potential for reducing the CO2 footprint by up to 50% compared to OPC [18]. These suitable calcined clays are available worldwide, making them a viable option for sustainable cement production, and their wide availability suggests that they could be present close to the mine site, with a not-too-far-fetched projection of seeing a mine producing their own calcined clay on site and using it in CPB.
To the best of our knowledge, some studies have investigated the use of calcined clays as a binder for CPB [19,20]; however, none of these aforementioned studies have investigated the effect of superplasticizers on rheological and mechanical properties of calcined clay cemented paste backfill systems. In this study, the time-dependent rheological behavior of cemented paste backfill (CPB) containing calcined clay as a binder was investigated, as well as the unconfined compressive strength (UCS) over 182 days. Two PCEs (Polycarboxylate Ether) superplasticizers were used in combination with four different binder compositions, two of which are LC3 systems. In those four binders, three different calcined clays were chosen to represent the wide array of materials to be expected. One blast furnace slag was also used to show the possibility of combining these two SCMs. Both admixtures showed better workability in all cases, with significantly improved yield stress and plastic viscosity compared to the reference, while showing little to no negative impact on strength over time. This study demonstrates that PCEs can offer remarkable performances in LC3 systems, making this type of binder ready for industrial-scale applications in mining. In this study, the authors also show that when using Life Cycle Assessment (LCA), these mix designs based on calcined clay binders gave a significantly reduced carbon footprint.

2. Material and Methods

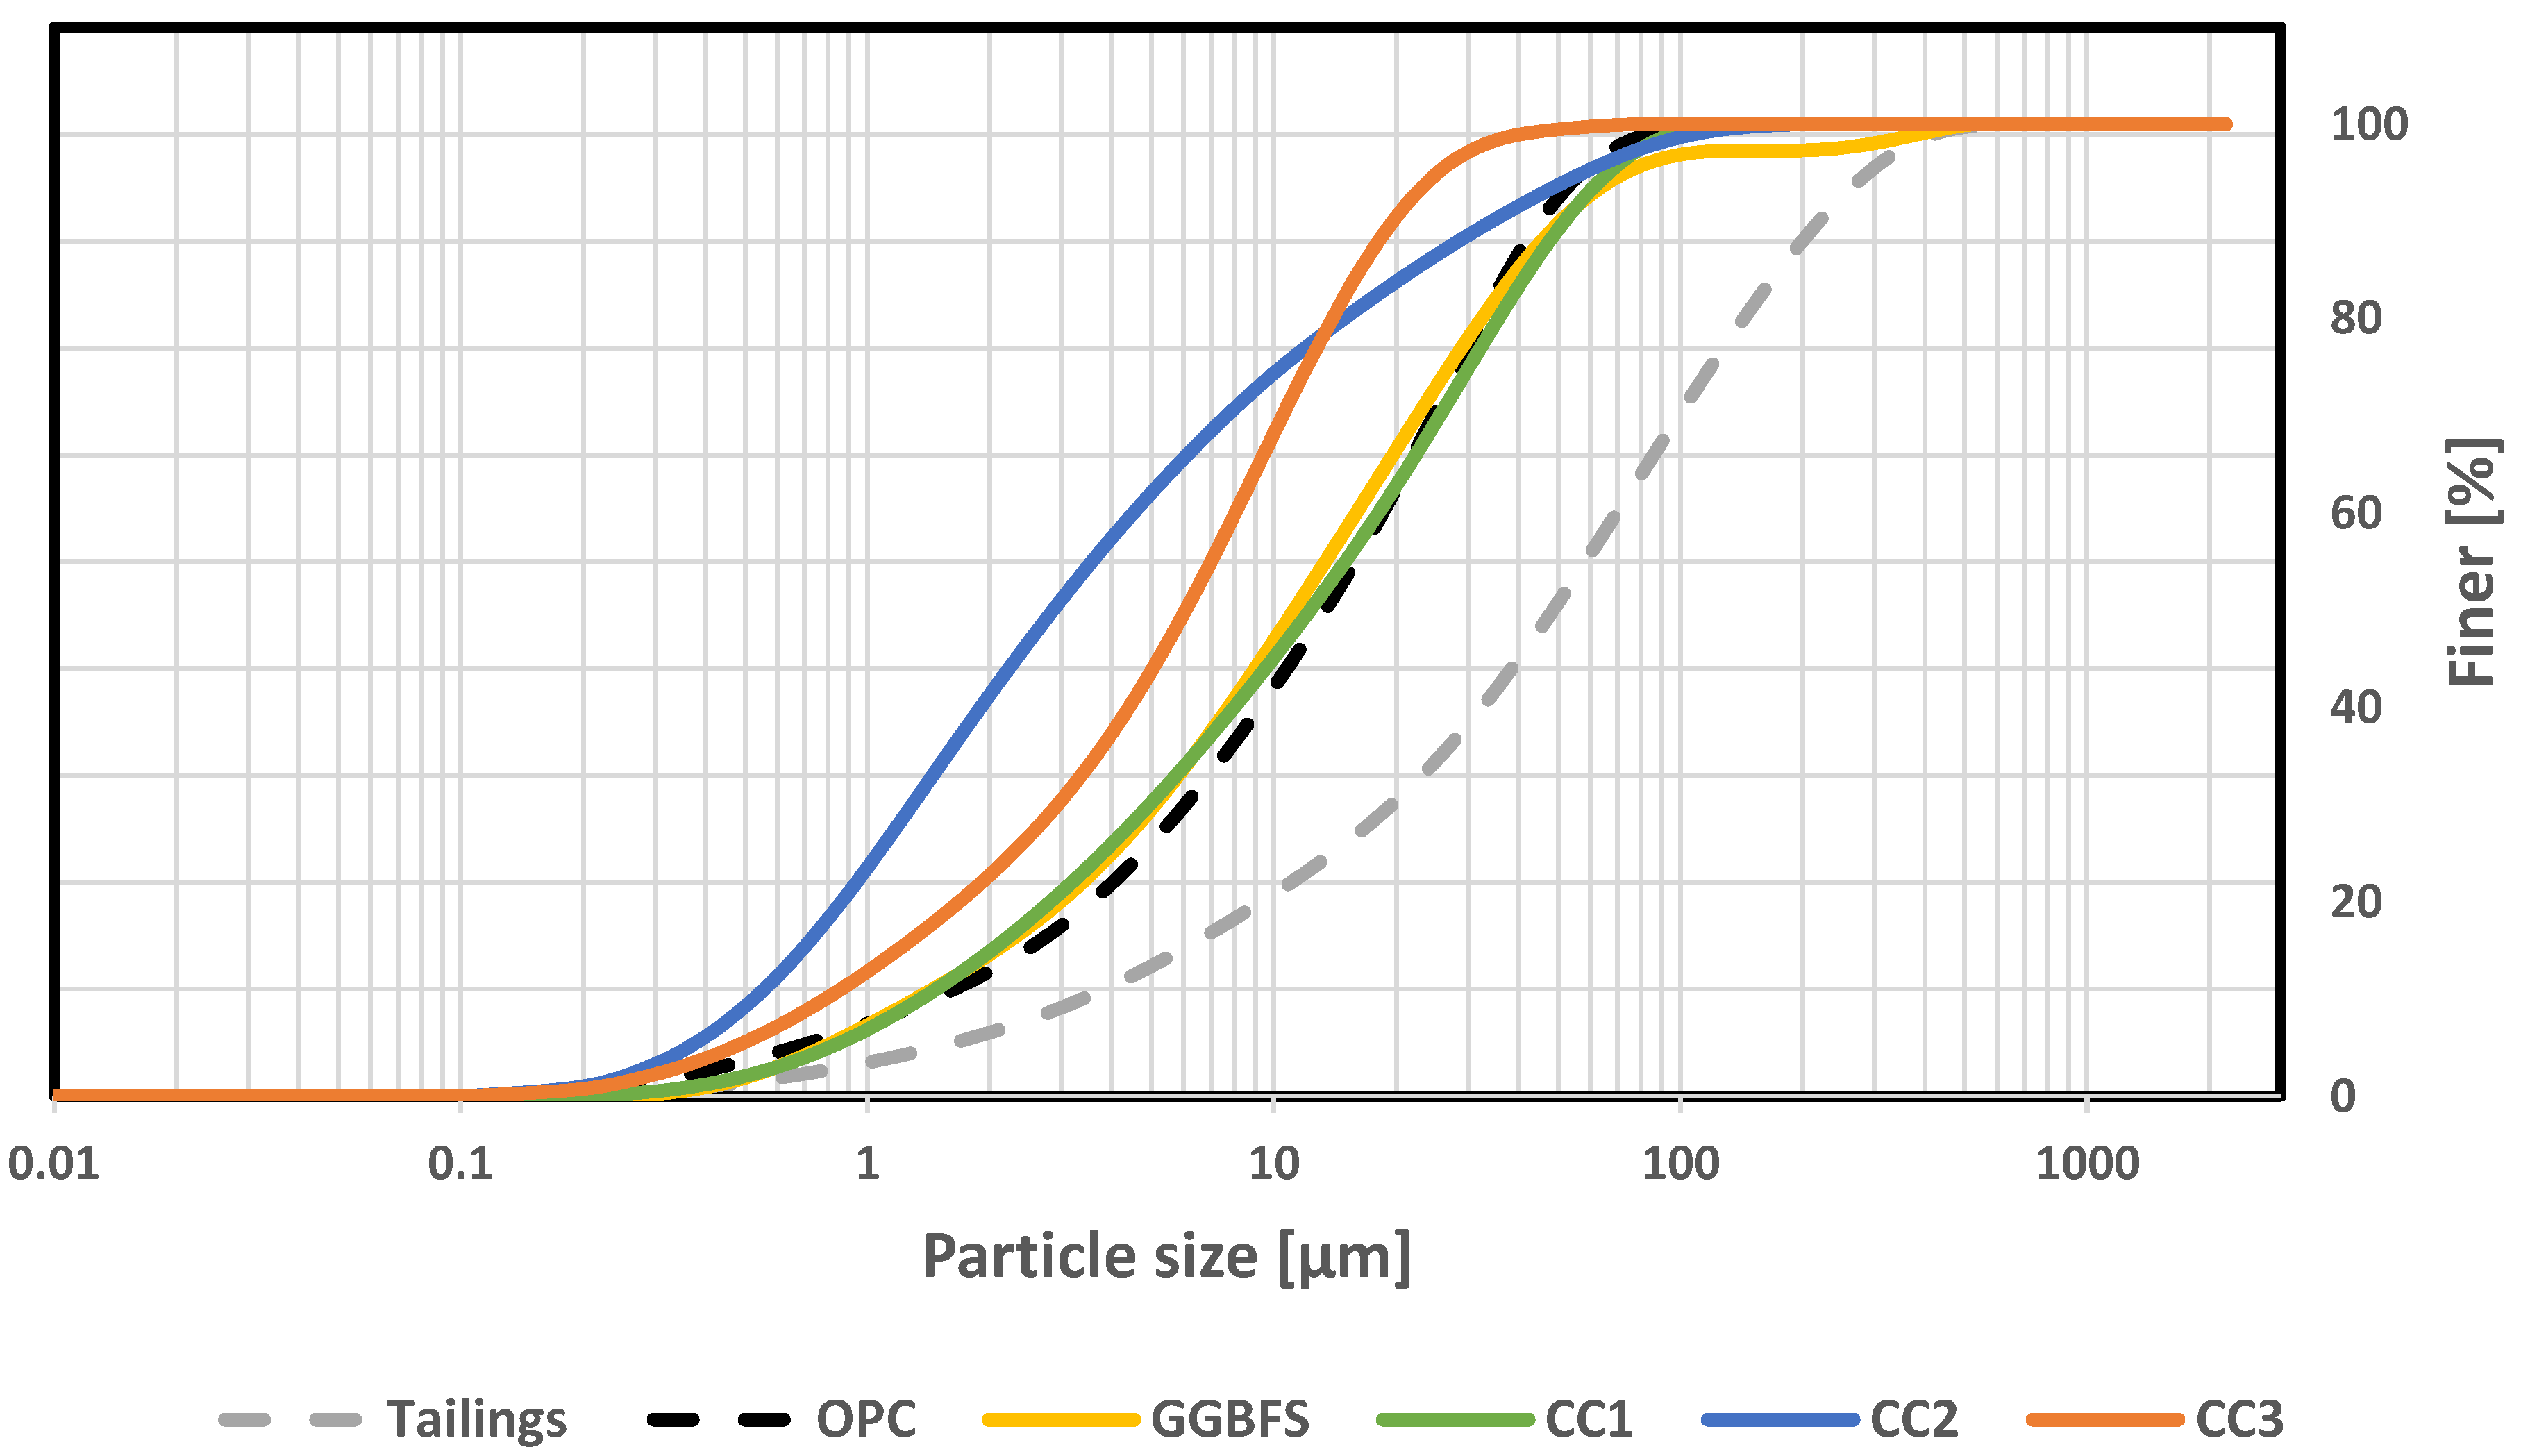
2.1. Materials Characterization

The tailings samples used in this study were produced from an operational copper mine and were milled in a laboratory ball mill for 30 min. The cement used in this study was provided by the mine (type GP according to named OPC in the study). Three calcined clays were used in this study: one originating from Europe (CC1), one coming from India (CC2), and one originating from Europe and selected to be a particularly challenging calcined clay due to a high specific surface (CC3). The ground-granulated blast furnace slag (named GGBFS) used in this study was obtained from ECOCEM. Gypsum was used in LC3 compositions to adjust sulphatation (see Section 2.2 below).
A Mastersizer 3000 Malvern Panalytical (Malvern Panalytical, Worcestershire, UK) was used for PSD (particle size distribution) measurements (Figure 1), and a NOVATouch from 3P-Intruments (NOVATouch from 3P-Intruments, Odelzhausen, Germany) was used for BET (Brunauer, Emmett, and Teller) gas sorption measurements to determine the specific surface, according to ISO 9277. The reactivity of the calcined clays was measured following the R3 test methods developed by and now part of the ASTM C1897 standard [21]. A summary of these parameters is found in Table 1.
The mineralogical composition was determined using XRD (X-ray diffraction) using a D8 Endeavour Bragg Brentano diffractometer from Bruker AXS equipped with a Cu-tube and an energy-dispersive and position-sensitive LynxEye XE-T detector. The tube was driven with 40.0 kV and 30 mA. The 2 theta range of 5–65° was scanned with a step size of 0.02° per step (counting time of 0.36 seconds per step). The evaluation was performed using the Rietveld software Topas 6 by Bruker AXS. XRF (X-ray Fluorescence) and LOI (loss of ignition) were measured according to DIN EN 196-2. All quantifications can be found in Table 2.

2.2. Admixtures

Both admixtures, SP1 and SP2, are pure PCE polymers supplied by Master Builders Solutions (Master Builders Solutions Admixtures, Beachwood, OH, USA). Both admixtures have different side chain lengths and charge densities.

2.3. Sample Preparation

Samples were cast using an IKA mixer (IKA, im Breisgau, Germany) (30 s stirring, 30 s rest, then 1 min stirring) in 20 × 20 × 20 mm cubes or transferred to the rheometer for rheology measurements (see below). The 20 × 20 × 20 mm cubes do not correspond to a norm; however, they have been used internally for more than a decade, and studies in the literature show transferable values for smaller measurement systems [22,23].
Samples for strength measurements were stored in a climate chamber at 80% rH and 30 °C. A typical mix design (total 404.86 g) is described here: 78% solid content, including 95% tailings (=300 g) and 5% binder (=15.79 g), with 22% water including 0.2% of admixture (=0.2 g, equivalent of 500 ml/ton of backfill mix). The water used in this study is distilled water.
Four different systems are described in this study: MIX A (containing 80% clinker and 20% calcined clay), MIX B (containing 70% clinker, 20% calcined clay, and 10% slag), MIX C (containing 35% clinker, 40% calcined clay, 20% limestone, and 5% gypsum), and MIX D (containing 65% clinker, 15% calcined clay, 15% limestone, and 5% gypsum).

2.4. Unconfined Compressive Strength

Unconfined compressive strength (UCS) was measured on a Zwick Roell Allround Line Z150 (ZwickRoell, Ulm, Germany) with an Xforce K 10kN force cell at 7, 14, 28, 56, 91, and 182 days, with three repetitions for each sample.

2.5. Rheology Testing

The rheological behavior of CPB slurries was measured using an Anton Paar HAAKE viscometer MCR 502 rheometer (Anton Paar GmbH, Graz, Austria). Rotational tests were carried out in an annular vane-in-cup geometry to reduce the risk of wall slippage during measurements. The measuring device was a vane stirrer with six blades, a length of 16 mm, and an equivalent diameter of 22 mm. The cup had a gear diameter d = 28.52 cm and a bigger diameter D = 29.85 cm. The mixed sample (according to the procedure described above) was put in the rheometer, and a linear ramp up from 1 to 100 s−1 over 1 min and a linear ramp down from 100 to 1 s−1 in 1 min and this ramp was performed at 7.5 min and repeated every 15 min over 2 h, with a pre-breaking of the structure of 20 s−1 for 1 min followed by a 1-min rest before starting the ramp measurements.
The Bingham model was used to describe accurately all the CPB systems studied using the down ramp (as demonstrated by good correlation coefficients), described by the equation below:
ꞇ = ꞇ0 + ꞃα
for which is the shear stress (Pa), 0 is the yield stress (Pa), is the plastic viscosity (Pa.s), and α is the shear rate (s−1).

2.6. Life Cycle Assessment (LCA) and Global Warming Potential (GWP)

The cradle-to-gate life cycle assessment (LCA) of the CBP recipes was performed with the OneClick LCA program using global Ecoinvent 3.8 data. To provide a comprehensive benchmark against real-case scenarios, we assessed one additional cemented backfill paste (CBP) formulation. This formulation exclusively features ordinary Portland cement (OPC) as the binder, without any chemical admixtures. Our primary objective is to vividly demonstrate the ecological optimization possibilities of CBP recipes using calcined clay as part of the binder system, allowing the mine companies to reduce their annual GHG emissions.
The study does not focus on the LCA of the mining process but rather on the treatment of tailing in the form of cemented backfill paste [24]. The underground mining process is exactly the same for all scenarios under investigation. The copper is to be extracted, the tailing (waste) is to be produced, and to avoid the potential environmental hazards of conventional land-based tailing ponds, the cemented backfill treatment approach is chosen here. The question we are trying to answer with the help of LCA is which binder system would result in less global warming potential (GWP) and have less environmental impact.
The functional unit (FU) is defined as 1 ton of backfill. Since generic global datasets are used, the same dataset is used for the three calcined clays. Nonetheless, the distance of the clay quarry can impact the results. Two transportation scenarios were considered: Variant 1 with a very close clay quarry (20 km) and Variant 2 with a fair distance of 200 km [18]. The transportation distance for OPC, other SCM, and admixtures is set to 1000 km for both transportation scenarios, based on the remote location of a typical mineral mine.
Table 3 summarizes the composition of different mixes for 1 ton of backfill. For all mix designs except MIX OPC, a 78% solid content is considered. In OPC mixtures without admixture, the solid content is reduced (76% instead of 78%), and the binder content is increased (7% instead of 5%) to ensure workability and avoid possible blockages during backfilling.

2.7. Cost Calculations

The raw material cost of clay is considered zero, as in this scenario, it is assumed that it would be the property of the mine. The transportation cost for 20 km clay is USD 16.5/ton, and the 200 km clay costs USD 29/ton [18]. On top of that, USD 50/ton was added for calcination costs. For OPC and GGBFS, we assume the price of raw material and transportation together are at the same level, USD 250/ton. Limestone and gypsum were assumed, for both raw material and transportation costs, to be at USD 50/ton.

3. Results and Discussion

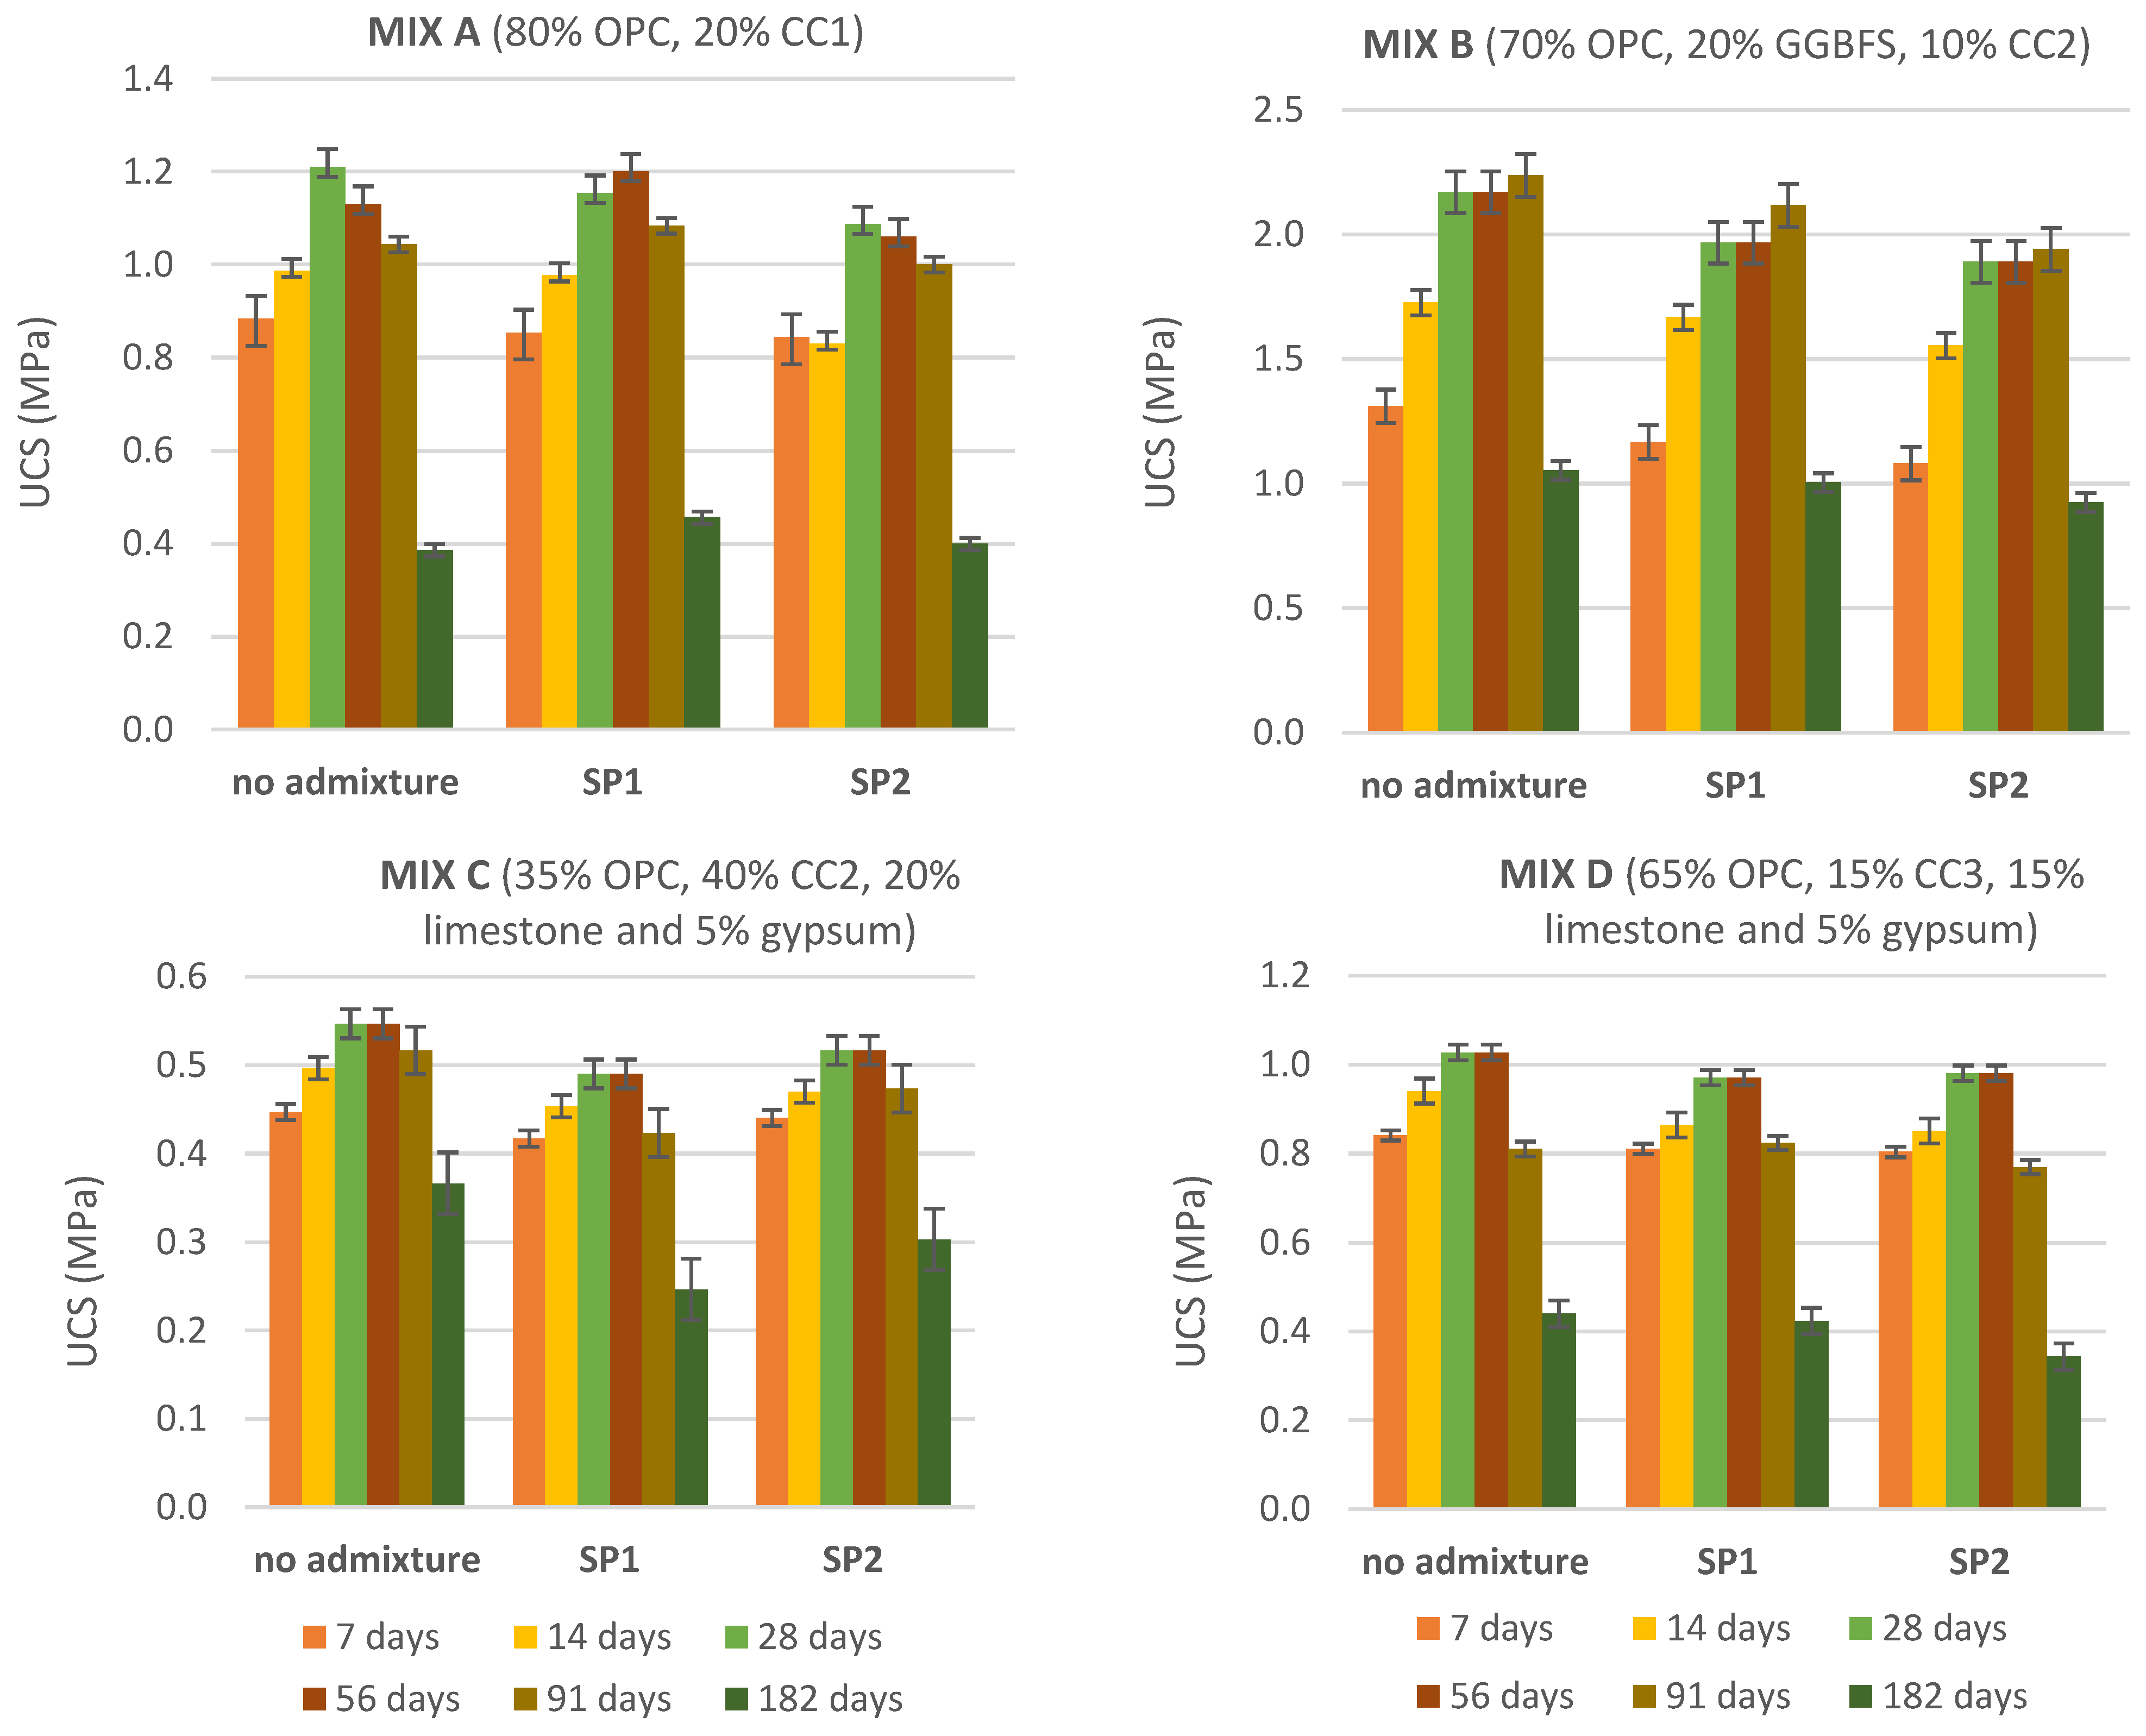
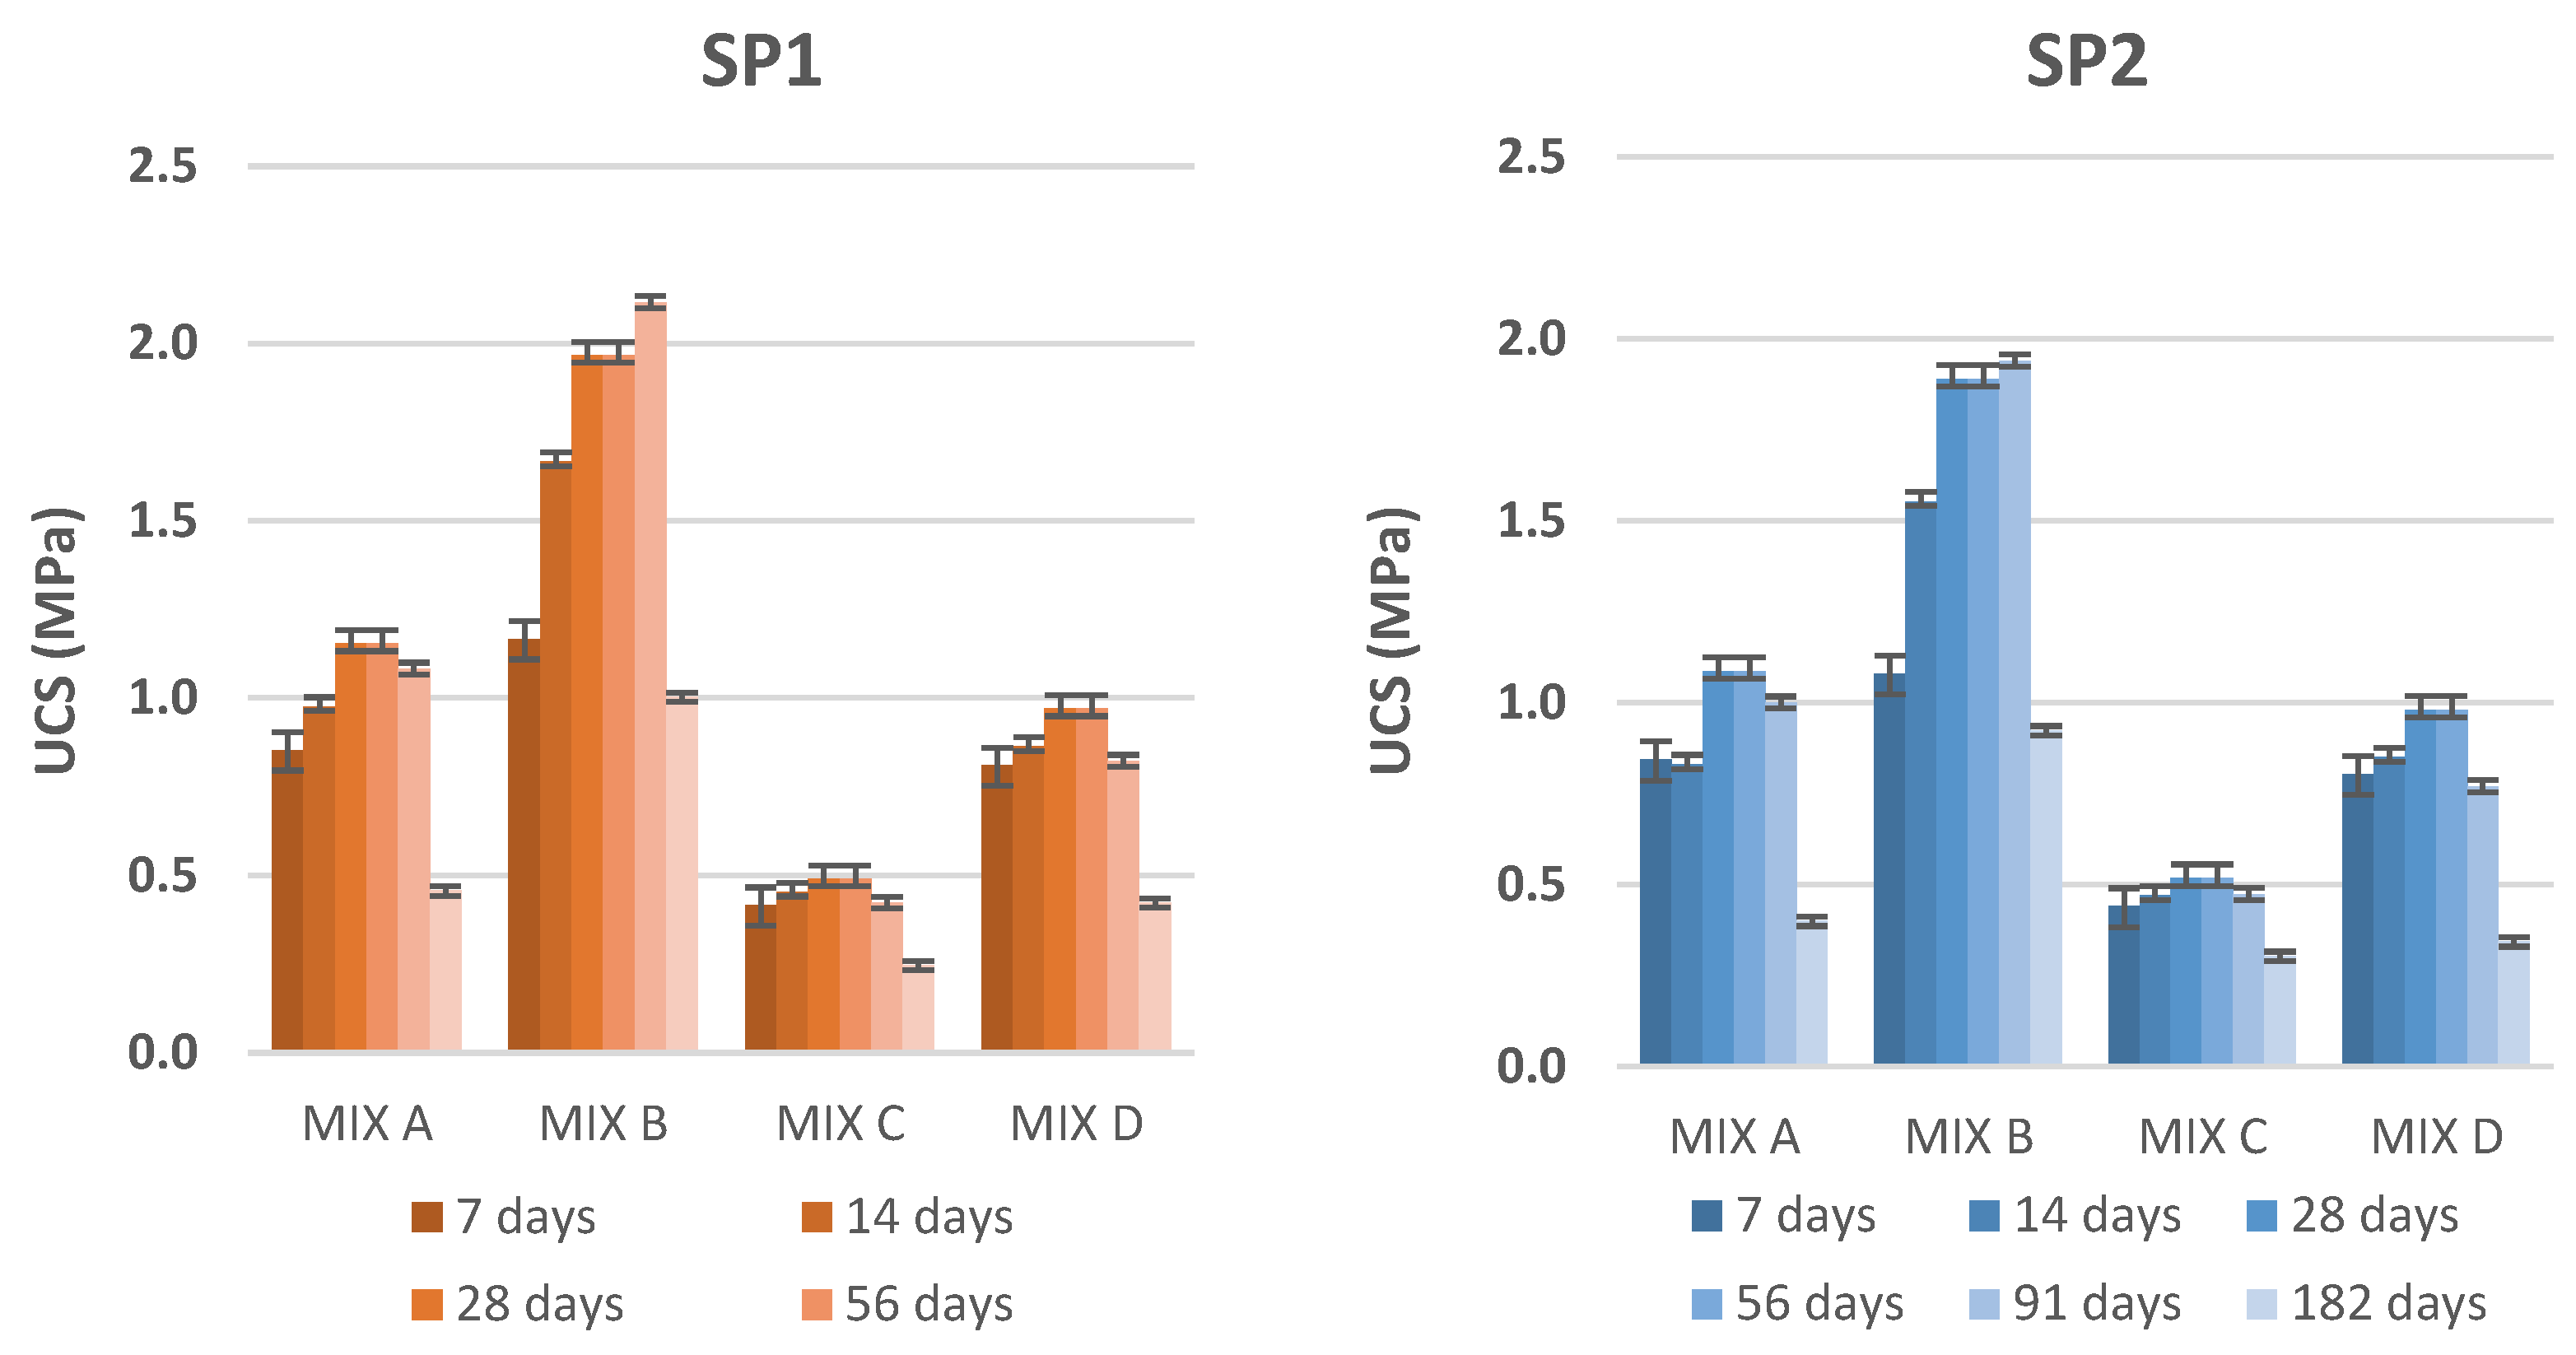
3.1. Unconfined Compressive Strength

The unconfined compressive strength (UCS) of all four binder compositions studied was measured at 7, 14, 28, 56, 91, and 182 days (Figure 2 and Figure 3, as well as Figure S1 in the supplementary material). In Figure 2, the different binders are compared separately, with both admixtures SP1 and SP2 compared to a reference sample with no admixture. For MIX A, containing the highest amount of cement of all four mixes, 80%, SP2 showed overall all-time points slightly lower UCS than the reference, whereas SP1 showed improved values for late time points, 56 to 182 days. For MIX B, C, and D, the values for both admixtures were slightly lower than the reference, with higher values for SP2 for MIX B and D and the opposite for MIX C. Overall, the impact of both admixtures on the UCS is small compared to the reference, with higher values for SP1 with mixes containing a high cement content (MIX A, B, and D) and a higher UCS obtained for SP2 compared to SP1 in MIX C, which has a low cement content. It is interesting to note that the late strength value at 182 days for MIX A using SP1 is higher than the reference, with a significant increase of 18%, showing a positive impact of the admixture on the UCS drop commonly observed at later ages.
One common feature of these mixes is the loss of UCS that occurs for all 182-day values. This is a common problem in CPB and has been linked to the nature of the tailings, as shown in the literature [3,25]. The mechanism is still unclear and requires further investigation. One conclusion that can be drawn from our study is that the use of calcined clay in the binder does not seem to improve this loss of compressive strength, and solutions are still needed to solve this problem. In Figure 3, the UCS is compared across the same admixture; respectively, SP1 on the left in orange and SP2 on the right in blue (the reference with no admixture is shown in Figure S1, Supporting Information). As already evidenced in Figure 2, the UCS values for both admixtures are in the same range, and Figure 3 clearly evidences the difference in UCS coming from the different binders. MIX B, containing 70% CEM I, 20% GGBFS slag, and 10% calcined clay CC2, shows the highest UCS values across all time points, which highlights the strong synergy between blast furnace slag and calcined clay. MIX C shows the lowest UCS, as expected since the cement content is by far the lowest of all four mixes. The comparison between MIX A and MIX D is the most interesting, showing really similar UCS values, despite the significant difference in cement content, respectively, 80% vs. 65%, and a lower amount of calcined clay, respectively, 20% vs. 15%, which can be explained by the difference in reactivity of the calcined clay, as evidenced by the R3 test (Table 1), with values of 257 J/g for CC1 vs. 543 J/g for CC3, given to our opinion a good forecast for properties of calcined clays that will be found in nature. This comparison highlights the important contribution of the calcined clay to the UCS of CPB mixes.

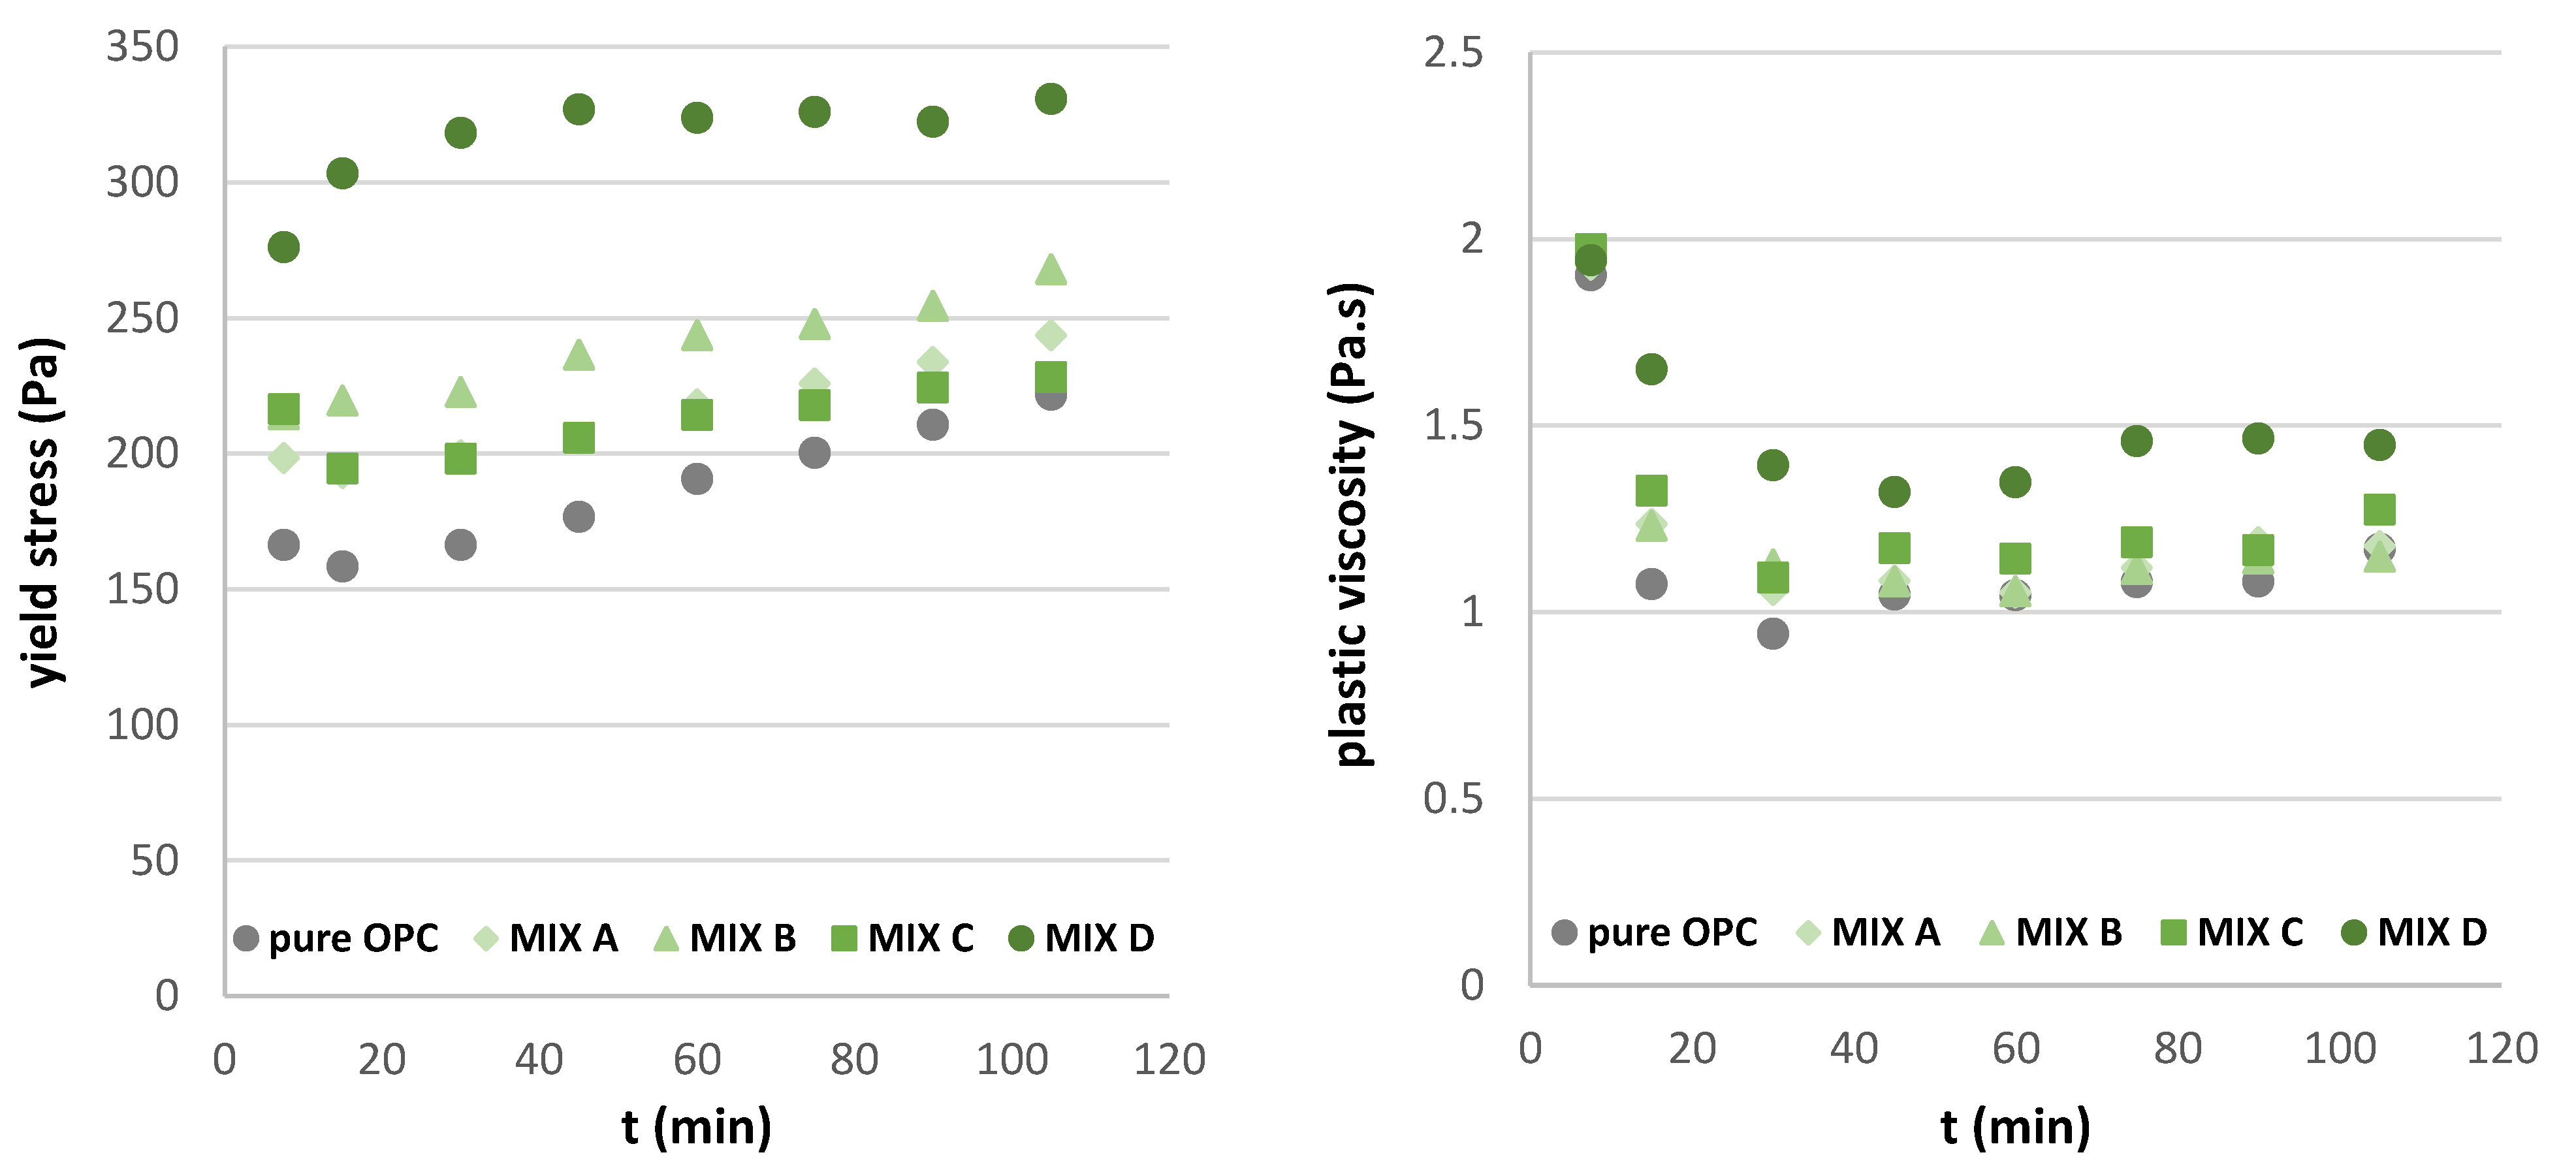
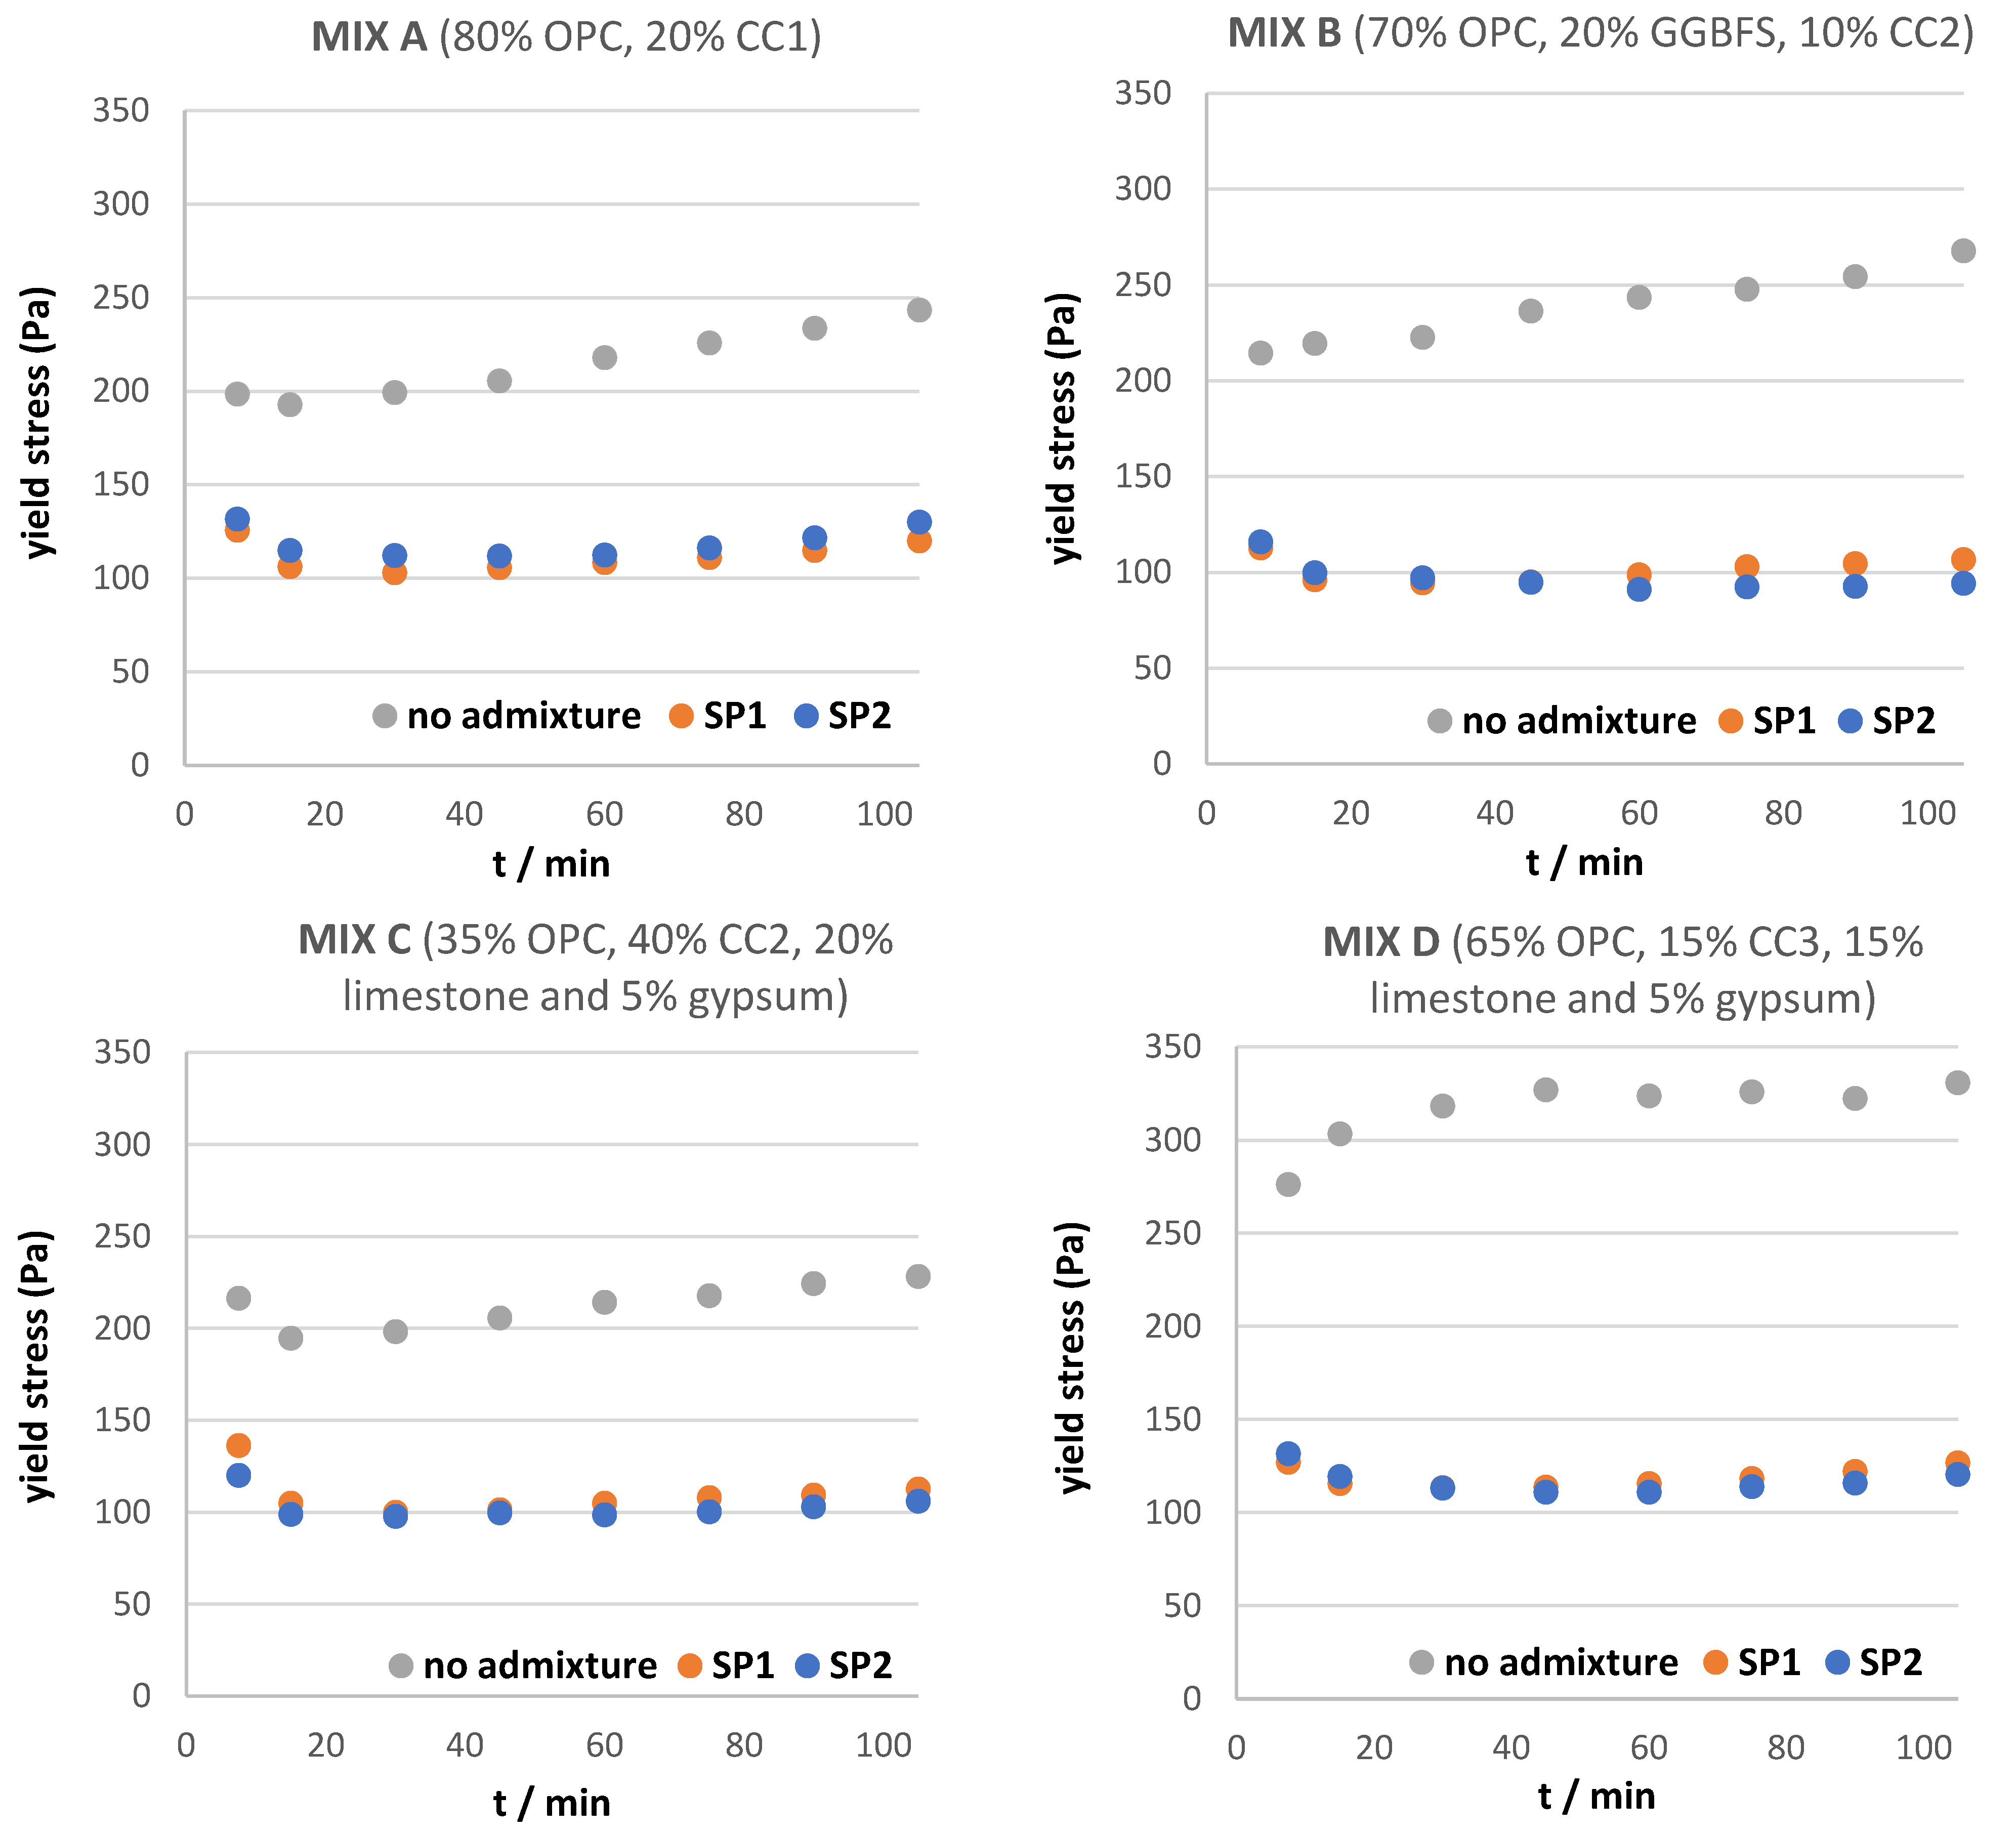
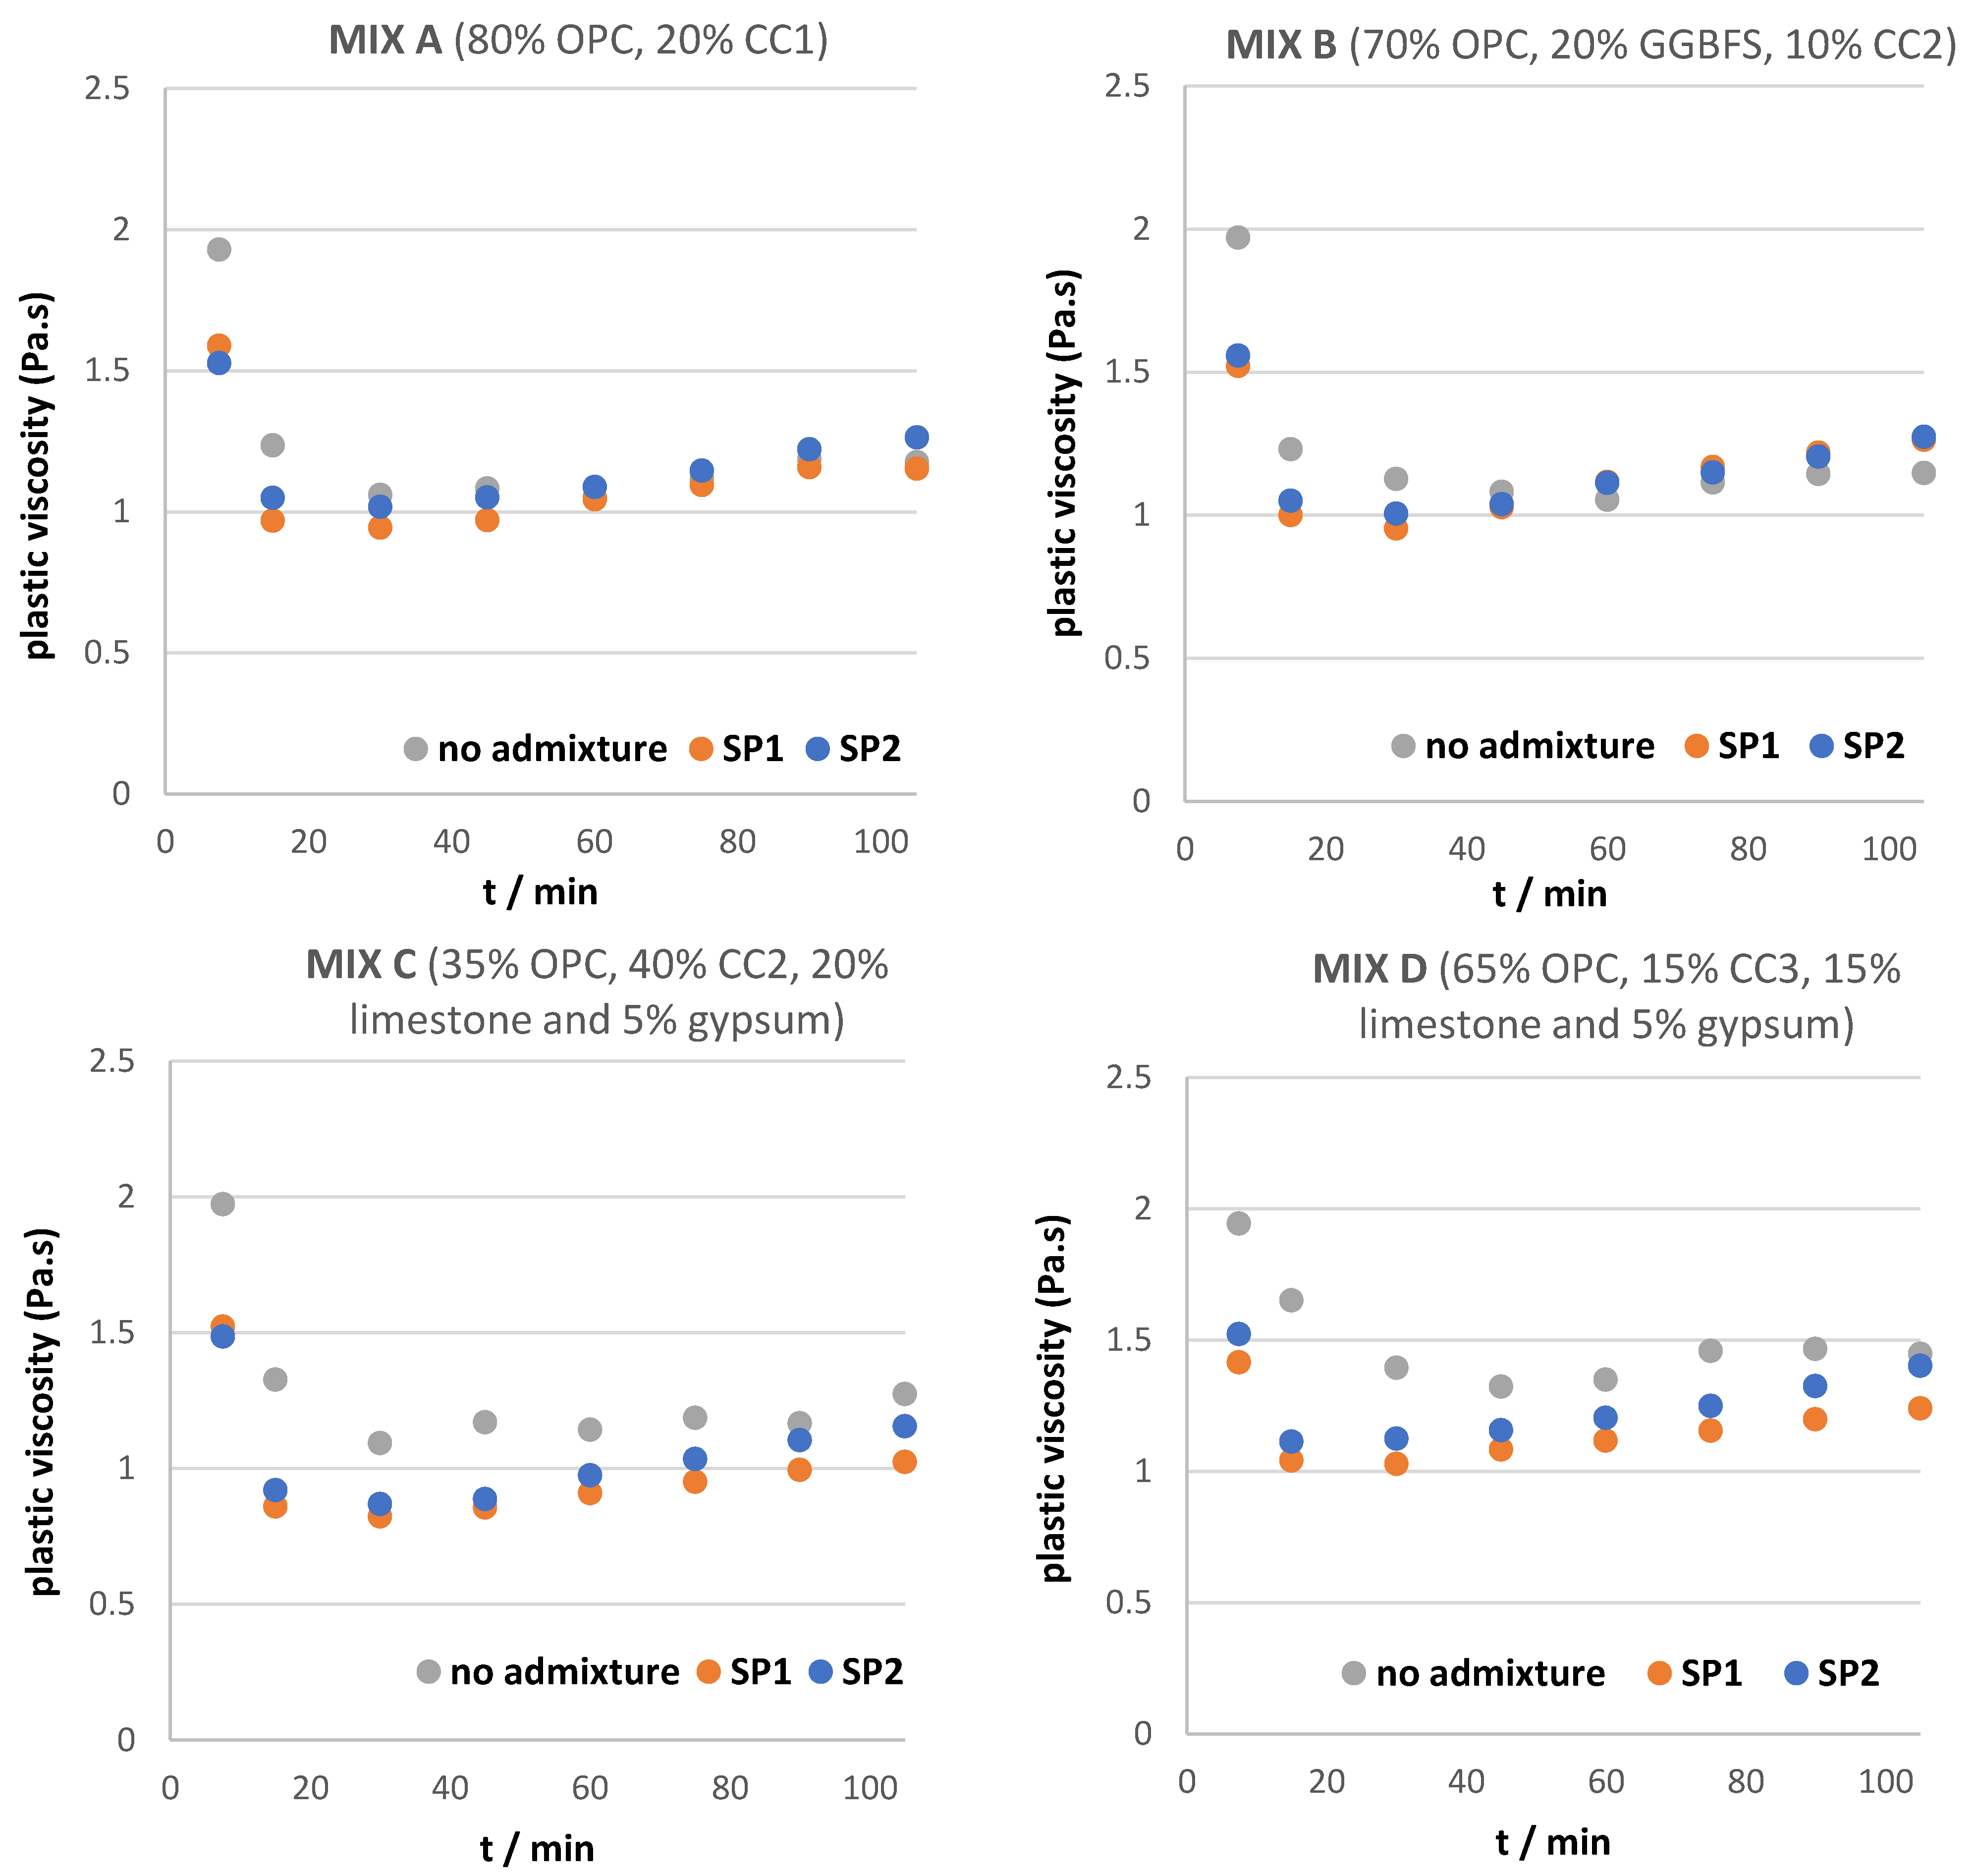
3.2. Yield Stress and Plastic Viscosity

The incorporation of calcined clay in the binder system leads to a higher viscosity, which is evidenced in Figure 4 with both yield stress and plastic viscosity (respectively, left and right) by showing a comparison between pure OPC (in gray) and the four calcined clay mixes (in various shades of green). These experiments without admixture show the importance of adapting solutions to improve the workability and the open time of the calcined clay system and ensure their use in CPB.
The variations in yield stress and plastic viscosity for CPB samples with different binders as a function of time are presented in Figure 5 and Figure 6, respectively. Time points are collected starting at 7.5 min, and then measurements are performed from 15 to 105 min every 15 min. When looking at the yield stress of the different binders, the main observation is the efficiency of both admixtures in all calcined clay-containing binders, including MIX C and MIX D, which are both LC3-type binders. To the best of our knowledge as far as mining backfill is concerned, this is the first full study showing the efficiency of PCEs in CPB using calcined clay binders. For all binders, the yield stress is reduced roughly by 50%, evidencing the gain in workability for both superplasticizers in CPB. MIX D, containing the calcined clay with the highest specific surface, shows the highest yield point measured across, starting from 276 Pa at 7.5 min and reaching 331 Pa at 105 min, whereas both admixtures show a value close to 115 Pa at 7.5 min and a value close to 100 Pa at 105 min, for an overall average reduction of yield stress over 60%. It is important to note that the yield stress obtained with both admixtures is overall almost equal in all binder systems, showing the robustness of PCE technology for these binder systems.
The plastic viscosity for CPB samples with different binders as a function of time is presented in Figure 6. Looking at the first time point, 7.5 min, for all binders, the effect of both admixtures is evident and leads to a significant reduction in plastic viscosity, on average 25% for both admixtures in all binders, exhibiting the robustness of both admixtures across different binder compositions. Comparing both admixtures, even though overall the performances are similar, the plastic viscosity obtained with SP1 is lower than SP2 in the first 30 min. When looking at the overall comparison of binders, an interesting trend arises with MIX A and B showing similar values around 30 min for both admixtures and the reference without admixture, whereas for MIX C and D the plastic viscosity observed for the reference is higher than with either admixture for almost all time points (Figure 6). This difference can be explained by what can be qualified as challenging binder compositions: in the case of MIX C, the low cement content, 35%, and the high calcined clay content of 40%, make this mix design challenging and, therefore, is reflected in the plastic viscosity difference observed. In the case of MIX D, the cement content is higher, 65%, and the calcined clay content is lower, 15%, closer to MIX A and B. However, the specific surface of CC3, the calcined clay used in this binder, is more than double CC1 and four times higher than CC2 (47.7 vs. 22.6 vs. 9.4 m2/g, respectively, Table 1). This comparison highlights the impact of calcined clay on the CPB fresh properties.
These results compare favorably to a study using pure metakaolin in combination with GGBFS in alkali-activated systems [26], where both the plastic viscosity and the yield stress a significant increase over time, demonstrating here both the performance of the admixtures used in this study, as well as the difference between LC3 and alkali-activated systems [26,27].

3.3. Ecological and Economical Comparisons

The results of the LCA study and the resulting GWP parameters are presented in Table 4, assuming the following:
  • The changing parameters are in A1 and A2 phases;
  • The GWP of the A3 phase is considered the same for all six mix designs, with the A3 phase including the energy and fuel required for mixing of CBP and pumping it underground.
Table 4. Summary of the GWP obtained for the LCA study as well as cost calculations, for pure OPC as reference and for all four LC3 mixes.
Life Cycle PhaseMIX OPCMIX AMIX BMIX CMIX D
GWP-fossil
[kg CO2e/1 ton CBP]
A145.4531.7428.0018.8626.29
A2 (variant 1)-3.133.492.413.31
A2 (variant 2)-3.263.552.683.41
Costs
[$/1 ton CBP]
Variant 1-10.311.06.99.1
Variant 2-10.41.17.19.2
Both the GWP reduction and cost reduction are intended to serve here as estimations that provide a first idea of what benefit can be expected; however, every country and operation will have different values and require a case-by-case analysis. Pure OPC was used as a reference, while all four LC3 systems were considered for both GWP and cost reduction (Table 4). In these calculations, it is assumed that the mine imports all materials except for calcined clay, which belongs to the mine, and is calcined on the mine facility.
Overall, one of the main takeaways from this LCA study is the importance of reducing the clinker/cement content in the backfill binder, showing a reduction of GWP (in kg CO2e/1 ton CBP) from 45 for OPC down to 19 for MIX C, with different LC3 compositions ranging from 32 to 19 (Table 4). In contrast, the two different variants, for the distance of the clay quarry to the mine (20 vs. 200 km), only show a reduction of less than 0.3, as opposed to a reduction of a minimum of 13 and up to 26 for LC3. This point highlights the significant impact that incorporating calcined clay into the binder would have on the carbon footprint of the backfill operation of the mine, regardless of the quarry location.
Another way to look at the data generated during this LCA study in Table 4 is to normalize to the pure OPC mix design and express these results in percent differences (Table 5). It becomes then apparent that the savings made by using LC3 binders in CPB are significant, ranging from 30 to 59 % for GWP on A1 and from 29 to 52 % for GWP in A2, depending on the variant (Table 5, top). Cost savings range from 17 to 48% depending on the variant, which is remarkable for MIX C, with almost half of the cost reduction (Table 5, bottom). When putting these values in perspective with compressive strength (Figure 2 and Figure 3), approximating that good rheology can be achieved in all cases with the admixtures used in this study (Figure 5 and Figure 6), it can be concluded that the optimum mix design would be MIX B, showing superior compressive strength while still achieving substantial GWP and cost savings. On the other hand, if the target of the optimization presents a strong focus on carbon footprint reduction, MIX C presents superior gains compared to all the other mix designs studied in this work, also for cost optimization.
These numbers could also be put in perspective using a yearly turnover of an operating mine, such as the one reported in reference [24] for a copper mine: 2 million tons of ore containing 1.15% copper, which leads to the generation of 1.97 million tons of tailings. When using this number as a basis for yearly savings, the absolute savings in GWP and costs per year obtained using LC3 binders, considering Variant 2 (raw clay 200 km from the mine), are then shown in Table 6. As stated before, these values are to be put in perspectives with fresh and solid properties; however, it is still remarkable to be able to achieve up to 80 k tons of CO2 savings per year for one mine operation, as is evidenced using MIX C. Financially, the savings obtained for MIX C would reach an outstanding USD 18 million per year on top of showing the highest carbon footprint reduction, whereas MIX B would give more than USD 7 million per year in cost reduction.
Several aspects were not directly considered in this study due to a lack of data from the mine, which could be an interesting field to explore for future work. For example, one parameter that is not considered in this LCA study but would have an important impact on the carbon footprint overall is the impact of the admixture on the flowability, yielding higher productivity and a reduction in maintenance costs. Quantifying other parameters and other LCA phases would be a more realistic and improved way to tackle the carbon footprint analysis.

4. Conclusions

This study highlights that both from a binder and an admixture point of view, calcined clay cementitious systems are ready to be used in CPB, showing both UCS values and rheology properties in line with CPB mixes currently used in the industry. The significant reduction in yield stress obtained with both admixtures and up to 60% improvement in workability for the binders tested in this study shows the importance of admixture in this type of cement for CPB.
When considering hard and fresh properties as well as carbon footprint, MIX B exhibits the best overall performances, with the highest compressive strength values of this study, while still achieving substantial GWP and cost savings. When focusing primarily on carbon footprint reduction coupled with cost optimization, MIX C shows the most interesting results and should be considered an interesting starting point for designing future sustainable CPB mixes using calcined clay binders. Overall, the most important parameters for calcined clay binders can be summarized as follows:
  • Amount of calcined clay in the binder: negative impact on UCS, positive impact on GWP;
  • Reactivity of the calcined clay (R3 test): positive impact on UCS;
  • Specific surface of the calcined clay (BET): negative impact on rheology.
When selecting a calcined clay for use in CPB, it is important to search for a material showing high reactivity, as measured using the R3 test, and one that exhibits a low specific surface, as measured using BET. This will allow a higher substitution degree of clinker, lowering both the cost and the carbon footprint of the CPB operation, as well as minimizing the difficulties encountered with rheology. However, it is important to underline that workability is more difficult with calcined clay binders than with traditional pure OPC binders, and admixtures will need to perform better and will be required in higher dosages.
At this point, it is difficult to advise on the best distance mine–clay quarry, as this will have to be put into perspective with the performance of the clay and would be a case-by-case scenario. In that regard, LCA will provide the required perspectives and should become a standard for the industry. Ultimately, when dealsing with challenging systems using either low cement content or challenging calcined clay with a high specific surface, this study demonstrated and emphasized the imperative need for high-performance admixtures.

Supplementary Materials

The following supporting information can be downloaded at https://www.mdpi.com/article/10.3390/min13121552/s1, Figure S1: UCS at 7, 14, 28, 56, 91, and 182 days (respectively, darker to lighter shades of grey) for MIX A (top right, 80% CEM I and 20% calcined clay CC1), MIX B (top right, 70% CEM I, 20% GGBFS slag, and 10% calcined clay CC2), MIX C (bottom left, comprising LC3-35 comprising 35% CEM I and 40% calcined clay CC2), and a MIX D (bottom right, comprising LC3-65 mix design comprising 65% CEM I and 15% calcined clay CC3) for the reference with no admixture.

Author Contributions

S.D.: conceptualization, methodology, investigation, writing—original draft, visualization, supervision. R.G.: investigation. D.F.: investigation. S.F.: investigation, methodology, writing—review and editing. P.S.: conceptualization, methodology, writing—review and editing. Z.M.: conceptualization, methodology, writing—review and editing. All authors have read and agreed to the published version of the manuscript.

Funding

This research received no external funding.

Data Availability Statement

Data is not available for confidentiality reasons and internal policy.

Conflicts of Interest

The authors declare that they have no known competing financial interests or personal relationships that could have appeared to influence the work reported in this paper.

References

  1. Wei, M.; Kong, X.X.; Huang, J. Current status and suggestions for the disposal of tailing waste in China. Chem. Miner. Process. 2022, 5, 34–38. [Google Scholar]
  2. Bell, F.G.; Stacey, T.R.; Genske, D.D. Mining subsidence and its effect on the environment: Some differing examples. Environ. Geol. 2000, 40, 135–152. [Google Scholar] [CrossRef]
  3. Kesimal, A.; Yilmaz, E.; Ercikdi, B.; Alp, I.; Deveci, H. Effect of properties of tailings and binder on the short-and long-term strength and stability of cemented paste backfill. Mater. Lett. 2005, 59, 3703–3709. [Google Scholar] [CrossRef]
  4. Castellanos, J.; Belem, T.; Benzaazoua, M. Design, placement, and performance of cemented paste backfill in deep mining operations. Minerals 2017, 6, 7. [Google Scholar]
  5. Song, W.; Tang, A.M.; He, X.M. Performance of cemented paste backfill in underground mining operations: A review. Miner. Eng. 2019, 138, 106–118. [Google Scholar]
  6. Fall, M.; Benzaazoua, M.; Belem, T. A review of sustainable cemented paste backfill practices based on strength and environmental considerations. Minerals 2016, 6, 37. [Google Scholar]
  7. Belem, T.; Benzaazoua, M. Design and application of underground mine paste backfill technology. Geotech. Geol. Eng. 2008, 26, 147–174. [Google Scholar] [CrossRef]
  8. Cao, S.; Yilmaz, E.; Song, W. Dynamic response of cement-tailings matrix composites under SHPB compression load. Constr. Build. Mater. 2018, 186, 892–903. [Google Scholar] [CrossRef]
  9. Ouattara, D.; Mbonimpa, M.; Yahia, A.; Belem, T. Assessment of rheological parameters of high density cemented paste backfill mixtures incorporating superplasticizers. Constr. Build. Mater. 2018, 190, 294–307. [Google Scholar] [CrossRef]
  10. Yan, B.; Zhu, W.; Hou, C.; Yilmaz, E.; Saadat, M. Characterization of early age behavior of cemented paste backfill through the magnitude and frequency spectrum of ultrasonic P-wave. Constr. Build. Mater. 2020, 249, 118733. [Google Scholar] [CrossRef]
  11. Sphera Database. Available online: www.oekobaudat.com (accessed on 10 July 2023).
  12. Hassani, F.; Razavi, S.M.; Isagon, I. A study of physical and mechanical behaviour of gelfill. CIM Bull. 2007, 100, 1–7. [Google Scholar]
  13. Scrivener, K.; Avet, F.; Maraghechi, H.; Zunino, F.; Ston, F.; Hanpongpun, W.; Favier, A. Impacting factors and properties of limestone calcined clay cements (LC3). Green Mater. 2019, 7, 3–14. [Google Scholar] [CrossRef]
  14. Scrivener, K.; Martirena, F.; Bishnoi, S.; Maity, S. Calcined clay limestone cements (LC3). Cem. Concr. Res. 2018, 14, 49–56. [Google Scholar] [CrossRef]
  15. Zieri, W.; Ismail, I. Alternative Fuels from Waste Products in Cement Industry. In Handbook of Ecomaterials; Martínez, L.M.T., Kharissova, O.V., Kharisov, B.I., Eds.; Springer International Publishing: Cham, Switzerland, 2019; pp. 1183–1206. [Google Scholar]
  16. Diaz-Loya, I.; Juenger, M.; Seraj, S.; Minkara, R. Extending supplementary cementitious material resources: Reclaimed and remediated fly ash and natural pozzolans. Cem. Concr. Compos. 2019, 101, 44–51. [Google Scholar] [CrossRef]
  17. Hache, E.; Simoën, M.M.; Seck, G.S.; Bonnet, C.; Jabberi, A.; Carcanague, S. The impact of future power generation on cement demand: An international and regional assessment based on climate scenarios. Int. Econ. 2020, 163, 114–133. [Google Scholar] [CrossRef]
  18. Scrivener, K.; Dekeukelaere, A.; Avet, F.; Grimmeissen, L. Financial Attractiveness of LC3; École Polytechnique Fédérale de Lausanne: Lausanne, Switzerland, 2019. [Google Scholar]
  19. Bahhou, A.; Taha, Y.; Khessaimi, Y.E.; Idrissi, H.; Hakkou, R.; Amalik, J.; Benzaazoua, M. Use of phosphate mine by-products as supplementary cementitious materials. Mater. Today Proc. 2021, 37, 3781–3788. [Google Scholar] [CrossRef]
  20. Yue, C. Low-carbon binders produced from waste glass and low-purity metakaolin for cemented paste backfill. Constr. Build. Mater. 2021, 312, 125443. [Google Scholar] [CrossRef]
  21. Avet, F.; Snellings, R.; Diaz, A.A.; Haha, M.B.; Scrivener, K. Development of a new rapid, relevant and reliable (R3) test method to evaluate the pozzolanic reactivity of calcined kaolinitic clays. Cem. Concr. Res. 2016, 85, 1–11. [Google Scholar] [CrossRef]
  22. Mohammed, A.; Hughes, T.G. Comparison of prototype and 1/6th model scale behaviour under compressive loading. In Proceedings of the 10th Canadian Masonry Symposium, Banff, AB, Canada, 8–12 June 2005. [Google Scholar]
  23. Zhang, N.; Hedayat, A.; Figueroa, L.; Bolaños Sosa, H.G.; González Cárdenas, J.J.; Álvarez, G.E.S.; Ascuña Rivera, V.B. Specimens Size Effect on the Compressive Strength of Geopolymerized Mine Tailings. In Proceedings of the Tailings and Mine Waste, online event (hosted by Colorado State University), Vancouver, BC, Canada, 15–18 November 2020; p. 339. [Google Scholar]
  24. Song, X.; Pettersen, J.B.; Pedersen, K.B.; Røberg, S. Comparative life cycle assessment of tailings management and energy scenarios for a copper ore mine: A case study in Northern Norway. J. Clean. Prod. 2017, 164, 892–904. [Google Scholar] [CrossRef]
  25. Zheng, J.; Guo, L.; Sun, X.; Li, W.; Jia, Q. Study on the Strength Development of Cemented Backfill Body from Lead-Zinc Mine Tailings with Sulphide. Adv. Mater. Sci. Eng. 2018, 2018, 7278014. [Google Scholar] [CrossRef]
  26. Ji, X.; Gu, X.; Wang, Z.; Xu, S.; Jiang, H.; Yilmaz, E. Admixture effects on the rheological properties/mechanical behavior and micro-structure evolution of alkali-activated slag backfills. Minerals 2023, 13, 30. [Google Scholar] [CrossRef]
  27. Kou, Y.; Jiang, H.; Ren, L.; Yilmaz, E.; Li, Y. Rheological properties of cemented paste backfill with alkali-activated slag. Minerals 2020, 10, 288. [Google Scholar] [CrossRef]
Figure 1. PSD of tailings, cement, calcined clays, and slag used in this study.
Minerals 13 01552 g001
Figure 2. UCS at 7, 14, 28, 56, 91, and 182 days (respectively, orange, yellow, green, dark orange, dark yellow, and dark green) for MIX A (top left, 80% CEM I, and 20% calcined clay CC1), MIX B (top right, 70% CEM I, 20% GGBFS slag, and 10% calcined clay CC2), MIX C (bottom left, LC3-35 comprising 35% CEM I, 40% calcined clay CC2, 20% limestone, and 5% gypsum), and a MIX D (bottom right, LC3-65 mix design comprising 65% CEM I, 15% calcined clay CC3, 20% limestone, and 5% gypsum) for the reference and two superplasticizers (SP1 and SP2).
Minerals 13 01552 g002
Figure 3. UCS at 7, 14, 28, 56, 91, and 182 days for SP1 and SP2 (respectively, darker to lighter shades of orange for SP1 and blue for SP2) for MIX A (80% CEM I and 20% calcined clay CC1), MIX B (70% CEM I, 20% GGBFS slag, and 10% calcined clay CC2), MIX C (bottom left, LC3-35 comprising 35% CEM I, 40% calcined clay CC2, 20% limestone, and 5% gypsum), and a MIX D (bottom right, LC3-65 mix design comprising 65% CEM I, 15% calcined clay CC3, 20% limestone, and 5% gypsum).
Minerals 13 01552 g003
Figure 4. Flow retention over 105 min measured using yield stress (left) and plastic viscosity (right) without admixtures for pure OPC, for MIX A (80% CEM I and 20% calcined clay CC1), MIX B (70% CEM I, 20% GGBFS slag, and 10% calcined clay CC2), MIX C (LC3-35 comprising 35% CEM I, 40% calcined clay CC2, 20% limestone, and 5% gypsum), and a MIX D (LC3-65 mix design comprising 65% CEM I, 15% calcined clay CC3, 20% limestone, and 5% gypsum).
Minerals 13 01552 g004
Figure 5. Flow retention over 105 min measured using yield stress without and with admixtures SP1 and SP2 (respectively, gray, orange, and blue) for MIX A (top left, 80% CEM I and 20% calcined clay CC1), MIX B (top right, 70% CEM I, 20% GGBFS, and 10% calcined clay CC2), MIX C (bottom left, LC3-35 comprising 35% CEM I, 40% calcined clay CC2, 20% limestone, and 5% gypsum), and a MIX D (bottom right, LC3-65 mix design comprising 65% CEM I, 15% calcined clay CC3, 20% limestone, and 5% gypsum).
Minerals 13 01552 g005
Figure 6. Plastic viscosity over 105 min without and with admixtures SP1 and SP2 (respectively, gray, orange, and blue) for MIX A (top left, 80% CEM I and 20% calcined clay CC1), MIX B (top right, 70% CEM I, 20% GGBFS slag, and 10% calcined clay CC2), MIX C (bottom left, LC3-35 comprising 35% CEM I, 40% calcined clay CC2, 20% limestone, and 5% gypsum), and a MIX D (bottom right, LC3-65 mix design comprising 65% CEM I, 15% calcined clay CC3, 20% limestone, and 5% gypsum).
Minerals 13 01552 g006
Table 1. Particle size and specific surface area of OPC, limestone, gypsum, and calcined clay samples used in this study. The associated R3 reactivity results are also given for all SCMs.
d10 (mm)d50 (mm)d90 (mm)BET (m2/g)R3 (J/g of SCM at 7 Days)
OPC0.897.7726.501.49-
Tailings3.348.5219.20.97-
Limestone1.210501.88-
Gypsum210631.68-
GGBFS0.97.330.21.52576
CC11.4125022.64257
CC20.53369.41648
CC30.86.32047.77543
Table 2. LOI (yellow), XRF (blue), and full XRD table (green) for tailings, OPC, calcined clays, and slag used in this study.
SampleCC1CC2CC3TailingsGGBFSOPC
LOI3.962.906.388.650.402.13
SiO265.7954.2333.9954.5135.9720.17
Al2O314.0134.9727.517.0511.405.74
TiO21.322.302.970.250.760.29
MnO0.050.010.230.260.150.05
Fe2O37.283.3324.6712.020.552.77
CaO1.921.330.815.3541.6563.07
MgO1.720.111.234.497.371.40
K2O2.230.200.032.140.450.50
Na2O0.200.100.001.020.290.02
SO30.420.030.002.510.293.73
P2O50.190.090.200.130.010.18
C3S Alite-----53.5
C2S Belite-----16.1
C3A total-----6.6
C3A cub.: orthor.-----90:10
C4(A,F) Ferrite-----10.2
Quartz43.2014.000.4041.90-0.1
Cristobalite-----
Calcite1.001.00-1.50-7.5
Portlandite-----0.9
CaO Free Lime-----0.1
MgO Periclase-----0.4
CaSO4 Anhydrite-----0.1
CaSO4 • 0.5 H2O Hemihydrate-----3.4
CaSO4 • 2 H2O Dihydrate-----0.3
K2SO4 Arcanite-----0.7
K3Na(SO4)2 Aphthitalite-----0.2
Dolomite-0.20-11.40--
Mullite 3:2-2.80----
Gibbsite------
Sanidine Na4.20-----
Wollastonite 2M--1.10---
Illite16.501.50----
Kaolinite-4.20----
Ilmenite--0.70---
Hematite1.402.0011.70---
Maghemite0.60-3.60---
Anatase0.301.200.90---
Rutile1.100.50----
Siderite---1.70--
Feldspar-1.00-16.50--
Mica---19.00--
Sulfides---6.00--
Amorphous content31.8071.7081.60->99-
Table 3. Summary of the different mixes considered for the LCA study.
MixMix Design [kg/1 ton CBP]
Name
Constituents
MIX OPCMIX AMIX BMIX CMIX D
Tailing706.8741.0741.0741.0741.0
OPC53.231.227.313.625.3
Calcined clay-7.83.915.65.8
GGBFS--7.8--
Limestone---7.85.8
Gypsum---1.91.9
Water240.0218.0218.0218.0218.0
Superplasticizer-2.02.02.02.0
Table 5. GWP and cost savings (presented in % difference to the pure OPC reference) for all four LC3 systems, considering two variants, Variant 1 and 2, depending on calcined clay distance to the mine (respectively, 20 and 200 km).
Life Cycle PhaseMIX OPCMIX AMIX BMIX CMIX D
GWP savingsA10%30%38%59%42%
A2 (variant 1)0%37%30%52%34%
A2 (variant 2)0%35%29%46%32%
Costs savingsVariant 10%22%17%48%31%
Variant 20%22%17%46%31%
Table 6. GWP and cost savings based on a mine yearly turnover of 2 million tons of ore.
MIX OPCMIX AMIX BMIX CMIX D
GWP saving per year (tons of CO2e)047706569118361761846
Costs saving per year (million USD)09.47.618.212.7
Disclaimer/Publisher’s Note: The statements, opinions and data contained in all publications are solely those of the individual author(s) and contributor(s) and not of MDPI and/or the editor(s). MDPI and/or the editor(s) disclaim responsibility for any injury to people or property resulting from any ideas, methods, instructions or products referred to in the content.

