Article

Sulfur and Carbon–Oxygen Isotopic Geochemistry and Fluid Inclusion Characteristics of the Yolindi Cu-Fe Skarn Mineralization, Biga Peninsula, NW Turkey: Implications for the Source and Evolution of Hydrothermal Fluids

1
Department of Geological Engineering, Faculty of Mines, Istanbul Technical University, Istanbul 34469, Turkey
2
General Directorate of Industrial Zones, Ministry of Industry and Technology, Ankara 06510, Turkey
3
Department of Geology, Faculty of Science, Benha University, Benha 13518, Egypt
*
Author to whom correspondence should be addressed.
Minerals 2023, 13(12), 1542; https://doi.org/10.3390/min13121542
Submission received: 6 November 2023 / Revised: 5 December 2023 / Accepted: 11 December 2023 / Published: 14 December 2023
(This article belongs to the Special Issue Geochemistry and Genesis of Hydrothermal Ore Deposits)

Abstract

:
The current study sought to investigate the physiochemical conditions and fluid evolution within the Yolindi Cu-Fe skarn mineralization located in the Biga Peninsula, NW Turkey. This was accomplished through a comprehensive investigation of geological and mineralogical data, along with isotopic analyses of sulfur (δ34S), carbon (δ13C), and oxygen (δ18O) of sulfide and calcite minerals, respectively, as well as fluid inclusion data pertaining to various minerals (e.g., andradite, quartz, and calcite). The Yolindi area features a complex geological framework, including the Paleozoic Kalabak Group (which includes the Torasan, Yolindi, and Sazak formations) and the Triassic Karakaya Complex. These formations were subsequently intruded via Early Miocene Şaroluk granitoids and Hallaçlar volcanics. Skarn formation is zoned into endoskarn and exoskarn types (being categorized into proximal, intermediate, and distal zones), with distinct mineral assemblages indicating concentric and contact metamorphic alteration patterns around the western part of Şaroluk granitoid intrusion in contact with the Torasan formation. The ore mineralogy and paragenesis suggest three distinct stages of evolution: an initial phase of prograde metasomatism characterized by the formation of magnetite and pyrite alongside anhydrous calc-silicate minerals; a subsequent phase of retrograde alteration marked by the formation of epidote, actinolite, and scapolite, accompanied by the occurrence of chalcopyrite and specular hematite; and finally, a post-metasomatic stage involving oxidation processes that led to the development of secondary mineral assemblages containing cerussite, covellite, and malachite. Sulfur isotopes (δ34S) of sulfides from endoskarn (from +0.27 to +0.57‰VCDT) to intermediate exoskarn (from −9.44 to −5.46‰VCDT) zones indicate a diverse sulfur source, including magmatic, sedimentary, and possibly organic matter. δ34S values in hydrothermal fluids suggest a magmatic–hydrothermal origin, with endoskarn and proximal zone fluids showing a slight negative signature and intermediate zone fluids indicating a strong influence from organic-rich or metamorphic sulfur reservoirs. Carbon and oxygen isotopic compositions (δ13C and δ18O) of calcite revealed a progression from marine carbonate signatures in marble samples (from +1.89 to +2.23‰VPDB; from +21.61 to +21.73‰VSMOW) to depleted values in prograde (from −6.0 to +0.09‰VPDB; from +6.22 to +18.14‰VSMOW) and retrograde skarns (from −3.8 to −2.25‰VPDB; from +0.94 to +3.62‰VSMOW), reflecting interactions with high-temperature magmatic fluids and meteoric water mixing. The fluid inclusions in prograde minerals generated under the conditions of fluid boiling exhibited high temperatures, reaching up to 412 °C, and salinities up to 26 wt.% NaCl equivalent. Conversely, the fluid inclusions in retrograde minerals, which were generated due to fluid mixing, exhibited lower temperatures (with an average of 318 °C) and salinities with an average of 4.9 wt.% NaCl equivalent. This indicated that the cooler and more diluted fluids mix with meteoric waters and interact with organic materials in the host rocks. This suggests a multifaceted origin involving various sources and processes. Therefore, this study concluded that the skarn mineralization in the Yolindi area resulted from complex interactions between magmatic, metamorphic, and meteoric fluids, reflecting a dynamic ore-forming environment with implications for the regional metallogeny of Cu-Fe skarn deposits.

1. Introduction

Skarn deposits are a noteworthy category of mineral resources that result from the complex geological interaction of magmatic, hydrothermal, and metasomatic processes [1]. The Biga Peninsula in northwestern Turkey is particularly rich in such deposits, with Fe skarns and Cu skarns being prominent [2,3,4,5]. Fe skarns are often associated with the regional Oligocene to Lower Miocene granitoids and often occur with porphyry copper or epithermal gold deposits [3,6,7,8,9]. These skarns have a high iron content and may also display copper enrichment, especially in areas where magnetite undergoes alteration to hematite. In addition, Cu skarns have often been identified by the presence of garnet–pyroxene and wollastonite–garnet skarns in the endoskarn zones and wollastonite–garnet skarns in the exoskarn zones [3]. The formation of these deposits has been closely associated with intrusions, such as granodiorite, monzodiorite, and quartz diorite, that interact with their surrounding sedimentary and volcanosedimentary rocks [3]. The observed variation in mineral composition, which ranges from endoskarns within the intrusive bodies to exoskarns in the surrounding country rocks, is a direct consequence of the differences in fluid composition, pressure, and temperature that occurred during their formation [1,3,10].
The Yolindi area is situated in the northeastern part of the Biga Peninsula, which is located in the western sector of the Sakarya Zone in northwest Turkey (Figure 1). The tectonic activity of the Biga Peninsula is mainly influenced by the movement taking place along the North Anatolian Fault Zone [11]. This fault zone splits into two main branches, known as the northern and southern branches, which are situated in the eastern region of Marmara. The main tectono-stratigraphic formations in the area of the Biga Peninsula consist of the Denizgoren ophiolite and the Çetmi ophiolitic mélange, located in the southwestern and northern parts of the Biga Peninsula, respectively [2,12]. During the Mesozoic period, the peninsula saw significant tectonic activities, such as sedimentation, the emplacement of ophiolites, and the formation of volcanic island arcs. The process of sedimentation played a crucial role in shaping the geological features of the region throughout the Triassic period [12]. It included the accumulation of carbonate rocks, namely limestones and dolomites, in shallow marine environments. During the transition from the Mesozoic era to the Jurassic and Cretaceous periods, there was a spreading of ophiolite complexes, flysch, and mélange deposits due to tectonic activity. In addition to the metamorphic basement rocks, the Biga Peninsula encompasses a comprehensive geological history of magmatic and volcanic activity that extends from the pre-Cenozoic to the Cenozoic periods [12]. The emplacement of granitic intrusions and volcanic rocks occurred in the Biga Peninsula during the Late Paleozoic period as a result of the closing of the Paleo-Tethys Ocean and the evolution of the supercontinent Pangea [13]. The volcanic rocks, together with their associated mineral deposits, provide crucial insights into the tectonic and magmatic processes that occurred in the area throughout the Late Paleozoic period. In the Cenozoic era, there were several intrusions that occurred from the Eocene to the Oligo-Miocene periods. These intrusions include Dikmen, Evciler, Eybek, Kestanbol, Kuşçayir, Şaroluk, and Yenice [7,8,14,15,16,17,18,19]. They were mostly found in the middle and southern areas of the peninsula. Meanwhile, the Ayvacik volcanic rocks, Ezine basalt, and Taştepe basalt represent the Cenozoic volcanic rocks. These rocks exhibit calc-alkaline to alkaline affinities, suggesting a varied history of magmatic activity [15,20,21]. The Cenozoic plutons and volcanic successions of the Biga Peninsula have both geological and economic importance. They are responsible for the bulk of the metallic mineral resources and industrial materials that have contributed to this region’s economy [2,22].
This study utilized a multidisciplinary method, integrating microthermometry of fluid inclusions and several isotopic data types, to investigate the physiochemical conditions and fluid evolution within the Yolindi Cu-Fe skarn mineralization. In sulfide minerals, sulfur isotopes (δ34S) can be used to identify sulfur sources, whereas carbon (δ13C) and oxygen isotopes (δ18O) in calcite minerals provide information regarding the composition and temperature of fluid–rock interactions. Moreover, the fluid inclusions within various minerals formed at distinct phases of skarn mineralization provide a direct record of the physical and chemical conditions, allowing to figure out how pressure, temperature, and compositional evolution have changed throughout the skarn formation.

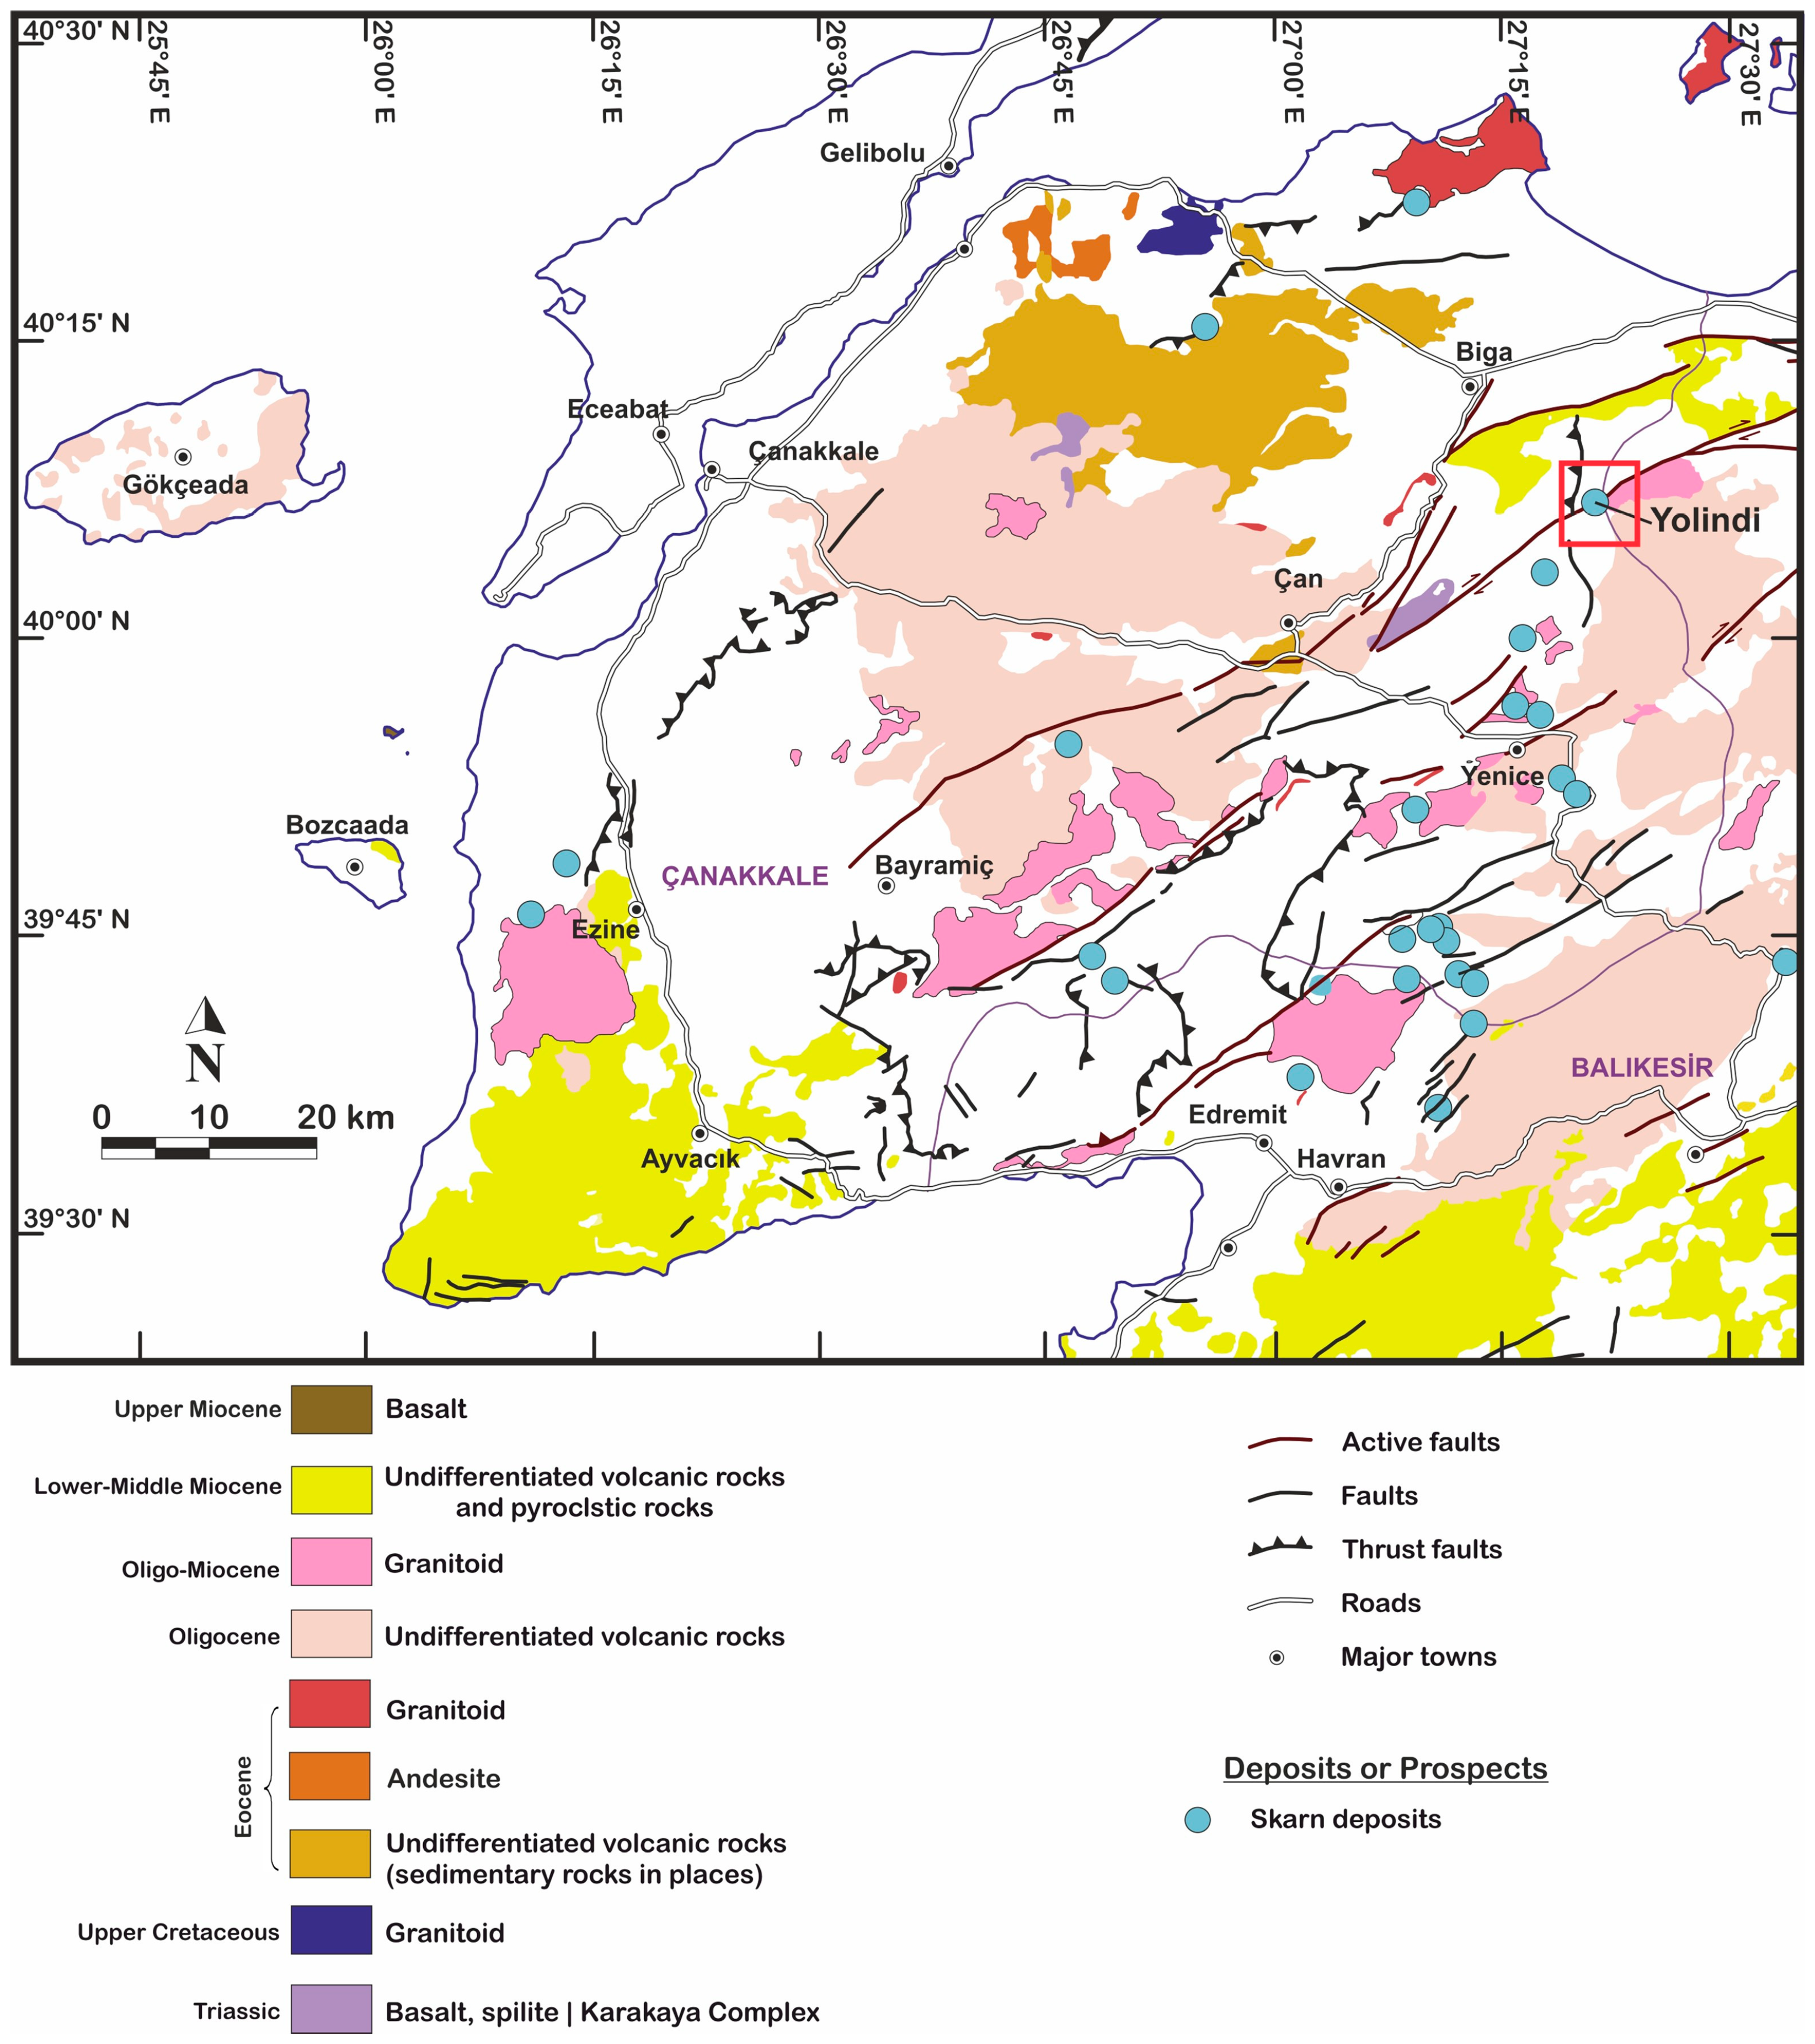
2. Geology of the Yolindi Area

The Yolindi area is located NE of the Biga Peninsula in Çanakkale province, NW Turkey (Figure 1). It comprises the Paleozoic Kalabak Group and Triassic Karakaya Complex, which were subsequently intruded by the Early Miocene Şaroluk granitoids and Hallaçlar volcanics (Figure 2).
The Kalabak Group forms the basement of the Sakarya Zone, which is a distinct tectonic unit that includes the Torasan formation at the base and the Sazak formation at the top, later intruded by Yolinidi metagranodiorite (Figure 2). The Lower Paleozoic Torasan formation (Pzt) is located in the western study area, in close proximity to Yolindi village, Bıçkı, and Baltaoluk hill (Figure 2). Phyllites, muscovite, biotite, talc, tremolite, and chlorite schists, along with their associated tuffs, constitute the majority of this formation, along with actinolite hornfels, metasandstone, and metasiltstone. Phyllites contain serpentinized peridotites (Pzts) (Figure 3a) and marble members (Pztm) as their blocks and lenses, respectively. Phyllites have a distinct foliation consisting of muscovite, biotite, and quartz, together with opaque minerals (Figure 3b). Actinolite hornfels are composed of actinolite, quartz, clinozoisite, clinopyroxene, and opaque minerals (Figure 3c). The composition of serpentinite lenses primarily consists of antigorite, chlorite, and clinopyroxene, along with a small amount of opaque minerals (Figure 3d). Marble and recrystallized limestone are characterized by a fine-grained texture and are primarily composed of calcite (Figure 3e). The Yolindi metagranitoids (Pzy) have been determined to be of early Middle Devonian ages using U-Pb zircon SHRIMP and LA-ICP-MS dating techniques, as reported by Aysal et al. [25]. The study area in Yolindi village has prominent outcrops to the north (Figure 2 and Figure 3f). These rocks include biotite gneiss and metagranodiorite. Biotite gneiss consists of biotite, quartz, sericitized plagioclase, and opaque minerals (Figure 3g). Metagranodiorite is composed of plagioclase that has undergone sericitization, together with quartz, biotite, and opaque minerals (Figure 3h). The Triassic Karakaya Complex (Trkk) is located in the middle and western parts of the study area, close to the villages of Inova and Tahtali (Figure 2). It is made up of marble, metasandstone, phyllite, metavolcanics, and serpentinites [4].
The Şaroluk granitoid (TmŞ) is a 20 km2 elliptical pluton that is oriented in an east–west direction (Figure 2). The U-Pb zircon dating conducted by Aslan et al. [26] revealed that the Şaroluk pluton originated from magmatic activity during the Early Miocene period, between 22.18 ± 0.40 and 21.51 ± 0.37 Ma. Aysal [27] reported an accurate date of 23.97 ± 0.53 Ma for the same event. A hornfels zone evolved in the Torasan formation along the western boundary of the Şaroluk intrusion (Figure 3i). The Şaroluk pluton mostly consists of quartz monzonite, with some granodiorite. Quartz monzonite consists of biotite, tremolite, actinolite, K-feldspar, quartz, and biotite with tremolite (Figure 3j). Granodiorite is composed of plagioclase (50%–70%), quartz (20%–30%), microperthite (5%–15%), hornblende, biotite, small quantities of pyroxene, and opaque minerals (Figure 3k).
The Hallaçlar formation (Tmh) is found in the southwest of the study area, around Beyoluk village, Bayındırlık Hill, Koca Hill, and Deniz Hill (Figure 2). It was dated at 23.6 Ma by Krushensky [28], 26.5 ± 1.1 Ma by Dönmez et al. [29], and 22.6 ± 0.8 Ma by Karacik et al. [30], indicating volcanic activity from the Late Oligocene period to the Early Miocene period. Rhyodacite, felsic tuffs, tuffaceous siltstone, and pyroclastics are included. Porphyritic andesite mainly comprises hornblende, biotite, and plagioclase phenocrysts embedded in fine-grained microcrystalline groundmass of plagioclase laths, quartz, and opaque minerals (Figure 3l).

3. Deposit Geology of the Yolindi Cu-Fe Skarn Mineralization

The Yolindi Cu-Fe (±Zn ± Pb) skarn mineralization exhibits zonal alteration patterns that can occur either in a concentric manner or perpendicular to the contact between the Şaroluk granitoid intrusion and the Torasan formation, as well as carbonate-rich rock or limestone. The zones are categorized as endoskarns and exoskarns, which can be further subdivided into three zones based on their distance from the intrusive body: proximal, intermediate, and distal zones (Figure 4). These zones exhibit distinct mineral assemblages (Figure 4).
The Şaroluk quartz monzonite has undergone bleaching along the boundaries between the Torasan formation and the Şaroluk intrusion. This is evident in the field through the presence of the endoskarn zone (Figure 4 and Figure 5a). The formation of endoskarn occurs within the Şaroluk intrusive body itself, usually in its outer parts. It has been specifically noticed near the Maden Deresi and İmameğreği Sırtı areas (Figure 4). On a mesoscopic scale, the occurrences of skarnized granitoids (which include andradite) can refer to the garnet formation, followed by epidote and sericite, during metasomatism. In the Maden Deresi area, there was a transition from granodiorite containing magnetite that has undergone a few alterations to endoskarn containing magnetite, with the degree of alterations rising towards the contact region (Figure 5a). The magnetite-bearing granodiorites comprise quartz, plagioclase, microperthite, biotite, hornblende, pyroxene, and sphene, along with magnetite (Figure 5b). The magnetite-bearing endoskarn is characterized by the presence of andradite and epidote minerals, together with magnetite and goethite (Figure 5c). The İmameğreği Sırtı area is recognized by the presence of magnetite- and pyrite-bearing granodiorite with quartz, plagioclase, microperthite, biotite, diopside, actinolite, and sphene, along with magnetite, pyrite, and hematite (Figure 5d).
The exoskarns located around the Şaroluk granitoid body in the Torasan formation usually have magnetite, pyrite, epidote, scapolite, garnet, pyroxene, chalcopyrite, bornite, hematite, and sometimes sphalerite and galena. Meinert [31] classified these zonal patterns into three subzones: proximal, intermediate, and distant zones.
The earliest phase of the skarn system is the proximal prograde exoskarn zone, characterized by a high concentration of garnet and magnetite in the Sarıot Deresi area (Figure 4). It has been distinguished by zones of dark garnet (zoned andradite) and magnetite zones with subordinate hematite (martitization) throughout the hornfels rocks of the Torasan formation (Figure 5e–g). The proximal retrograde exoskarn zone located in the northwest of the Sarıot Deresi area is distinguished by its greenish color and having retrograde minerals like epidote and actinolite, along with clinopyroxene relics and andradite–grossular intergrowth that are intersected by quartz–carbonate veins (Figure 5h,i).
The intermediate exoskarn zone underwent development in the Sarıot Sırtı, Ihlamurluk Tepe, and Alaburun Sırtı areas within the Torasan formation (Figure 5j). This area is rich in garnet, pyroxene, calcite, and scapolite. This zone exhibits distinct characteristics that indicate a gradual transition from the hot, magma-influenced area located closer to the source to the cooler, more distant area with retrograde processes. Minerals such as epidote, scapolite, and chlorite are frequently formed (Figure 5k,l), suggesting a shift from high-temperature minerals to lower-temperature and retrograde minerals, which is caused by changes in temperature and fluid composition during the evolution of skarn, including chalcopyrite, pyrite, and specular hematite.
In addition, the distal exoskarn zone is located farthest from the Şaroluk granitoid pluton inside the Torasan formation in the Bıçkı Tepe area (Figure 4). It encompasses distinct mineral compositions, including epidote, chlorite, calcite, dolomite, and sericite (Figure 5m–o), along with galena, sphalerite, and a lesser amount of chalcopyrite with cerussite, covellite, and malachite.

4. Sampling and Analytical Methods

A comprehensive fieldwork project was conducted in the Yolindi area to gain a thorough comprehension of the geological setting. In order to ensure that the samples were representative, they were systematically collected from both the main host rocks and the altered rocks that exhibited mineralization. A total of 121 thin sections and 88 polished sections were meticulously prepared. These sections underwent a petrographic examination using a polarizing microscope to ascertain the mineralogical and textural relationships within the rocks.
Thirty-four mineralized samples were carefully selected from various skarn zones with the specific aim of evaluating sulfur isotope data on sulfide minerals. A total of six pyrite samples were obtained from the endoskarn zone, consisting of three pyrite and three chalcopyrite samples from the prograde proximal exoskarn zone, ten pyrite and three chalcopyrite samples from the retrograde proximal exoskarn zone, and seven pyrite and two chalcopyrite specimens from the intermediate exoskarn zone. The initial preparation of these selected samples comprised the procedure of grinding and sieving to obtain a consistent mesh size of 2 mm, ensuring uniformity in the granularity of these samples. Individual mineral grains were carefully handpicked under a binocular microscope to guarantee the purity of the sample set for isotopic analysis. The total sulfur content and sulfur isotopic composition (δ34S/δ32S ratios) of the samples were determined using elemental analysis coupled with isotope ratio mass spectrometry (EA/IRMS) at the Iso-Analytical Laboratory in Sandbach, UK. The isotope data were expressed as δ34S values that were standardized to the Vienna Cañon Diablo Troilite (VCDT) standard. The addition of vanadium pentoxide (V2O5) to the samples was performed in order to enhance the combustion characteristics. The International Atomic Energy Agency (IAEA) distributes NBS-127, IAEA-S-1, and IAEA-SO-5 as inter-laboratory comparison standards, which have globally recognized δ34S values. For cross-validation, the NBS-127, IAEA-S-1, and IAEA-SO-5 were used to accomplish analytical calibration. The measurement precision of the δ34S results was verified to be within ±0.3‰ for all standards, with six duplicates each, thereby confirming correctness.
Isotopic compositions of carbon (δ13C) and oxygen (δ18O) in calcite minerals were determined from a diverse suite of samples, including marble (n = 5), retrograde skarn (n = 9), and prograde skarn (n = 11). Each carbonate sample, precisely weighed between 0.2 and 0.6 mg using a sensitive balance, underwent a reaction with approximately 0.1 mL of 99% orthophosphoric acid (MERCK) at a constant temperature of 25 °C on an autosampler table. The resultant CO2 gas, after being liberated from the carbonate samples, was processed using the gas bench continuous flow isotope ratio mass spectrometry technique. The isotopic ratios were analyzed utilizing a Thermo Finnigan Deltaplus XP isotope ratio mass spectrometer (IRMS) (Thermo Fisher Scientific, Waltham, MA, USA), with the isotopic ion ratios converted into raw isotope data using ISODAT 2.0 software. The international standard NBS19 Limestone (NIST), with known δ13C of 1.95‰ and δ18O of −2.20‰, served as the primary reference for calibrating the crude isotope measurements to true values, anchored to the VPDB (Vienna Pee Dee Belemnite) standard. Measurements were conducted with a precision of ±0.2‰ for both isotopes, reflecting high reproducibility and accuracy. These analyses were carried out at the METU Central Laboratory within the Stable Isotope Ratio Mass Spectroscopy Laboratory (DIL), ensuring robustness in the methodological approach and data integrity.
The fluid inclusion investigations were conducted in the Istanbul Technical University (ITU) fluid inclusions laboratory on 80-µm-thick, double-polished, thin sections of andradite, grossular, quartz, and calcite minerals. The measurements were acquired using a Linkam THMG-600 stage, which had the ability to both heat and freeze and was mounted on a Leica DM2500P optical microscope (Leica, Wetzlar, Germany). The microscope was outfitted with a video camera and a display. The temperature range for the measurements was from +600 to −200 °C. The calibration of this step was conducted with potassium dichromate, pure H2O, CO2, and H2O–NaCl standards. The microthermometric measurements for heating and freezing were performed with an accuracy of 0.4 °C for the freezing stage and 5.0 °C for the heating stage, using the standard approaches outlined by Roedder [32] and Shepherd et al. [33]. This study evaluated and recorded the homogenization temperature (Th), eutectic temperature (Te), and final melting temperature of ice (Tm-ice).

5. Results

5.1. Ore Mineralogy and Paragenesis

The ore mineralogy includes magnetite, pyrite, chalcopyrite, and specular hematite, with a subordinate amount of galena, sphalerite, cerussite, malachite, and goethite (Figure 6). Magnetite mostly occurred within the endoskarn in the magnetite-bearing granodiorite (Figure 6a) and magnetite-bearing endoskarn (Figure 6b), as well as throughout the proximal prograde exoskarn zone (Figure 6c), in association with pyrite, andradite, and augite minerals. It is distinguished by brownish crystals, which vary in shape from subhedral to anhedral and may reach diameters of up to 2 mm. Occasionally, it undergoes martitization, a process in which magnetite is substituted with hematite as a result of oxidation (Figure 6c). In the study area, chalcopyrite was the predominant copper–iron sulfide mineral. It occurs in the proximal retrograde exoskarn zone in the northwest of Sarıot Deresi, as well as in the intermediate zone. Subhedral crystals of a yellowish color are formed together with pyrite, hematite, and sphalerite (Figure 6d–f). Pyrite is made up of subhedral to euhedral light-yellow crystals that are 10 to 200 microns across in length. It frequently forms with magnetite in the endoskarn (Figure 6b), as well as in the proximal and intermediate exoskarn zones associated with chalcopyrite, hematite, and bornite (Figure 6d,e,g). Specular hematite is a kind of hematite that can be identified via its clusters of shiny, metallic, flat flakes or tabular crystals (Figure 6h). It is formed within the intermediate zone of the exoskarn, associated with chalcopyrite and pyrite (Figure 6e,f). Galena is distinguished by the occurrence of sizable, separate subhedral light gray crystals in the distal zone, which is encountered with sphalerite and undergoes an alteration to form cerussite (Figure 6j,k). In addition, the distal zone undergoes the alterations of galena, sphalerite, and chalcopyrite, leading to the formation of cerussite, covellite, and malachite, respectively (Figure 6j–l).
Paragenesis studies on the Yolindi Cu-Fe skarn mineralization process revealed that there were three distinct mineralization stages that were identified based on the contact relationships between the metamorphic, alteration, and ore minerals, as shown in Figure 7. The prograde stage was observed in the Yolindi area, which was distinguished by the formation of magnetite, pyrite, and medium-to-coarse-grained Fe-rich anhydrous calc-silicate minerals (e.g., andradite and augite). These minerals occurred in the endoskarn and proximal exoskarn zones. Magnetite was generated concurrently with pyrite during this phase (Figure 7). The occurrence of minerals, such as actinolite, epidote, scapolite, calcite, and chlorite pseudomorph, after garnet and pyroxene suggested that a retrograde stage occurred at lower temperatures and pressures. In addition, at this particular stage, the andradite–grossular intergrowth is associated with the hedenbergite. The aforementioned minerals are often formed in association with ore minerals, such as chalcopyrite, pyrite, specular hematite, galena, and sphalerite (Figure 7). Cerussite and malachite are characteristics of the supergene stage (Figure 7). This showed the process of metals moving and leaching from nearby areas, where primary metal sulfides break down and then turn into carbonates when the pH and redox conditions change.

5.2. Fluid Inclusion Studies

5.2.1. Fluid Inclusion Petrography

The Yolindi Cu-Fe skarn mineralization exhibits a substantial prevalence of fluid inclusions, mostly found inside andradite, grossular, quartz, and calcite crystals. The FIs may be categorized into two phases of inclusion, namely liquid H2O (L) and vapor H2O (V), with one type being rich in liquid and the other type being rich in vapor, in accordance with the classifications of Roedder [32] and Van den Kerkhof and Hein [34]. Multiple instances have led to the identification of the primary and secondary fluid inclusions in these samples. On the other hand, the primary fluid inclusions exhibit a sub-rounded, elliptical, elongated, and irregular shape, and have a maximum size of 350 µm (Figure 8). The andradite minerals that occurred in the prograde proximal zone have FIs exhibiting sub-rounded, elliptical, and irregular forms with diameters ranging from 40 to 108 µm (Figure 8a,b). At room temperature, the vapor bubble typically fills around 15%–20% of the inclusion volume, as shown in Figure 8a,b. This mineral has vapor-rich inclusions that are presently sub-rounded and irregular in shape. These inclusions have diameters ranging from 65 to 102 µm and constitute 55%–65% of the volume of the vapor bubble at room temperature (Figure 8c). In contrast, the grossular, quartz, and calcite minerals generated during the retrograde proximal stage include liquid-rich L+V FIs. In grossular, quartz, and calcite minerals, these FIs have prismatic and irregular forms, with their diameters ranging from 16 to 154 µm, from 31 to 357 µm, and from 16 to 116 µm, respectively (Figure 8d–i). Furthermore, the vapor bubble accounts for 20%–25%, 9%–22%, and 10%–20% of the volume of FIs in grossular, quartz, and calcite FIs, respectively (Figure 8d–i). The quartz crystals in the intermediate retrograde zone include FIs with diameters ranging from 3 to 110 µm in diameter. These FIs are of the liquid-rich L+V type, as shown in Figure 8j. However, their morphologies exhibit irregularities, varying in diameter from 23 to 290 µm in the quartz minerals of the distal zone (Figure 8k,l).

5.2.2. Microthermometry Results

Extensive analysis was performed on a total of 119 fluid inclusions that occurred in andradite, grossular, quartz, and calcite minerals formed throughout the prograde and retrograde phases of skarn mineralization in the proximal, intermediate, and distal exoskarn zones. The main objective of this analysis was to determine the temperatures at which homogenization and freezing took place for each inclusion (Table 1). The eutectic temperatures (Te) of liquid-rich and vapor-rich (L+V) fluid inclusions varied across various minerals (Table 1). The primary fluid inclusions of andradite, grossular, quartz, and calcite minerals from the proximal zone experienced Te values ranging from −37.80 to −12.10 °C, from −8.80 to −1.60 °C, from −26.70 to −0.80 °C, and from −17.80 to −1.10 °C, respectively (Table 1). The Te of the fluid inclusions (FIs) that were detected in quartz minerals from the intermediate and distal zones varied between −26.60 and −1.70 °C and between −8.60 and −1.90 °C, respectively (Table 1). These findings indicated the presence of a H2O–NaCl system. In contrast, the final melting temperature (Tm) of the primary fluid inclusions in andradite, grossular, quartz, and calcite minerals from the proximal zone varied between −25.80 and −8.50 °C, between −5.30 and −0.40 °C, between −13.50 and −0.50 °C, and between −12.30 and −0.20 °C, respectively (Table 1). The Tm values of the FIs found in quartz minerals from the intermediate and distal zones ranged from −17.60 to −0.40 °C and from −3.40 to −0.90 °C, respectively (Table 1). The homogenization temperature (Th) values of the primary FIs ranged from 359.00 to 412.20 °C (an average of 390.15 °C) for andradite minerals, from 280.10 to 372.60 °C (an average of 348.13 °C) for grossular minerals, from 256.00 to 394.30 °C (an average of 304.89 °C) for quartz minerals, and from 197.70 to 317.80 °C (an average of 280.45 °C) for calcite minerals (Table 1). The temperature range for the Th of the FIs observed in quartz minerals from the intermediate and distal zones was between 299.80 and 370.00 °C, with an average temperature of 337.95 °C, and between 296.10 and 336.50 °C, with an average temperature of 319.47 °C, respectively (Table 1).
The salinities were calculated using the final ice melting temperatures (Tm-ice), as suggested by Darling [35], Archer [36], Bodnar [37], and Steele-MacInnis et al. [38], along with the utilization of the BULK computer software developed by Bakker [39] (Table 1). The salinities of the primary L+V FIs in the andradite minerals from the prograde proximal exoskarn zone varied from 12.28% to 26.07 wt.% NaCl equivalent, with an average of 20.27 wt.% NaCl equivalent (Table 1). In contrast, the grossular, quartz, and calcite minerals occurring in the retrograde proximal exoskarn zone had lower salinities in their fluid inclusions. The salinity of FIs in grossular minerals varied from 0.70 to 8.28 wt.% NaCl equivalent; in quartz, it ranged from 0.88 to 17.34 wt.% NaCl equivalent, and in calcite, it ranged from 0.35 to 16.24 wt.% NaCl equivalent (Table 1). The salinity range for FIs in quartz minerals was lower in the intermediate and distal zones compared to the proximal zones. It varied between 0.70 and 20.67 wt.% NaCl equivalent, with an average of 9.35 wt.% NaCl equivalent in the intermediate zone, and between 0.35 and 16.24 wt.% NaCl equivalent, with an average of 3.63 wt.% NaCl equivalent in the distal zone (Table 1). The total densities of FIs were computed using the equation of state proposed by Zhang and Frantz [40]. The primary FIs in the andradite crystals from the prograde proximal zone have a density ranging from 0.69 to 0.91 g/cm3, with an average of 0.81 g/cm3. The densities of FIs in the grossular, quartz, and calcite minerals from the retrograde proximal zone range from 0.58 to 0.77 g/cm3 (with an average of 0.64 g/cm3), from 0.56 to 0.88 g/cm3 (with an average of 0.75 g/cm3), and from 0.71 to 0.89 g/cm3 (with an average of 0.78 g/cm3), respectively (Table 1). The overall densities of FIs in the quartz minerals from the intermediate and distal zones range from 0.65 to 0.86 g/cm3 and from 0.65 to 0.77 g/cm3, respectively (Table 1).

5.3. Stable Isotope Data

5.3.1. δ34S Isotope of Sulfides

Stable isotope analysis was performed on 34 samples containing different sulfide minerals in order to ascertain the δ34S isotopic composition (Table 2). The samples comprise six pyrite samples from the endoskarn zone, three pyrite samples and three chalcopyrite samples from the prograde proximal exoskarn zone, ten pyrite samples and three chalcopyrite samples from the retrograde proximal exoskarn zone, and seven pyrite samples and two chalcopyrite samples from the intermediate exoskarn zone (Table 2). All of these samples originated from the prograde and retrograde stages of mineralization, except for several pyrite minerals that formed alongside the Şaroluk granitic rock (see Figure 7). The δ34S data of the two pyrite varieties from the endoskarn zone ranged from +0.27 to +0.57‰VCDT and from −4.56 to −3.98‰VCDT. The pyrite and chalcopyrite acquired from the prograde proximal exoskarn zone displayed a narrow range of sulfur isotopic values. Specifically, the pyrite varied from −3.65 to −0.17‰VCDT, while the chalcopyrite ranged from −4.23 to −0.25‰VCDT (Table 2). The sulfur isotopic values of pyrite and chalcopyrite in the retrograde proximal exoskarn zone ranged from −4.27 to −2.59‰VCDT for pyrite and from −3.84 to −2.67‰VCDT for chalcopyrite. In contrast, the pyrite and chalcopyrite detected in the intermediate exoskarn zone displayed a lower sulfur isotopic value. Specifically, the pyrite varied from −9.44 to −5.46‰VCDT, while the chalcopyrite ranged from −8.88 to −5.79‰VCDT (Table 2). The δ34S ratios of the ore-forming fluids were measured on the assumption that the sulfur included in these fluids was mostly in the form of H2S. The calculations relied on fractionation equations established by Czamanske and Rye [41] and Ohmoto and Rye [42], which use the δ34S values of sulfide minerals. The formational temperatures of the fluids were determined through the analysis of fluid inclusions. These analyses revealed that the average temperature of garnet minerals in the prograde zone was 390 °C, while the average temperature of the garnet, quartz, and calcite minerals in the retrograde zone was 323 °C. The measured δ34S values of H2S in the hydrothermal fluids varied between −5.47‰ and −0.34‰, with an average of −2.82‰ ± 0.18, and between −5.39‰ and −1.08‰, with an average of −4.24‰ ± 0.18, for the sulfides from the endoskarn and proximal zones, respectively. In contrast, these values ranged from −10.57‰ to −4.54‰, with an average of −7.54‰ ± 0.23, for the sulfides from the intermediate zone. These values represent the overall sulfur isotopic composition of the magmatic–hydrothermal fluid (δ34SΣS), as shown in Table 2.

5.3.2. Carbon (δ13C) and Oxygen (δ18O) Isotope Studies

The carbon and oxygen isotopic compositions of calcite minerals obtained from marble (n = 5 samples), retrograde skarn (n = 9 samples), and prograde skarn (n = 11 samples) exhibited δ13C values ranging from +1.89‰VPDB to +2.23‰VPDB (with an average of +2.06‰VPDB), from −3.8‰VPDB to −2.25‰VPDB (with an average of −3.02‰VPDB), and from −6.0‰VPDB to +0.09‰VPDB (with an average of −2.48‰VPDB), respectively (Table 3). Additionally, the δ18O values ranged from +21.61‰VSMOW to +21.73‰VSMOW (with an average of +21.67‰VSMOW), from +0.94‰VSMOW to +3.62‰VSMOW (with an average of 2.45‰VSMOW), and from +6.22‰VSMOW to +18.14‰VSMOW (with an average of +11.24‰VSMOW) for the calcite minerals from marble, retrograde skarn, and prograde skarn, respectively (Table 3). Hence, the carbon isotope ratios (δ13C values) of the samples generally exhibit a consistent pattern, showing little enrichment in the marble as compared to the prograde and retrograde calcite samples (Table 3). Nevertheless, the δ18O values indicate a decrease in isotopic composition from the marble sample to the prograde and retrograde calcite samples. Moreover, the data provided relates to the declining carbon and oxygen isotopic compositions seen in calcite minerals throughout their transition from prograde skarn to retrograde skarn, which may be attributed to the elevated temperatures experienced in the prograde zone [43]. The fluid δ13CCO2 values calculated at 318 °C (the highest homogeneous temperatures (Th (°C)) for calcite minerals based on the fluid inclusion data of calcite minerals) using the calcite–CO2 fractionation equation established by Scheele and Hoefs [44] exhibited a range from −4.92‰ to −4.58‰ (with an average of −4.75‰), from −10.61‰ to −9.06‰ (with an average of −9.83‰) and from −9.45‰ to −6.72‰ (with an average of −8.47‰) for calcite collected from marble, retrograde skarn, and prograde skarn, respectively (Table 3). The fluid δ18OH2O values were determined using the equation for oxygen isotopic fractionation of calcite–water developed by O’Neil et al. [45]. These values were calculated at the highest Th of 318 °C (current fluid inclusion data) for calcite minerals. The range of values acquired for calcite from marble, retrograde skarn, and prograde skarn were from +20.88‰VSMOW to +21.00‰VSMOW, from 0.91‰VSMOW to +3.49‰VSMOW, and from +6.03‰VSMOW to +17.57‰VSMOW, respectively (Table 3). In Figure 9a, the diagram illustrates the relationship between δ13CPDB and δ18OSMOW. The marble samples fell within the marine carbonate field, indicating their composition. On the other hand, the samples of prograde calcite were plotted in the fields of granites, mantle-derived carbonatite, and xenoliths, as well as the transitional area between these fields and marine carbonate. This suggested that the oxygen isotope ratio increased in prograde calcite samples as a consequence of the dissolution and decarbonization of Torosan formation marble at the contact of the Şaroluk intrusion (Figure 9a). In contrast, the calcite samples collected from the retrograde skarn exhibited a reduction in oxygen isotope values, which may be attributed to the influence of meteoric water (see Figure 9a). The isotopic fractionation factor was calculated using the calcite–water equation proposed by O’Neil et al. [45]. The mixing curves for M–A were computed for several values of X (CO2) and fluid rock ratios, including 0.01, 0.1, and 0.5, and 0.5, 2, 10, 40, 80, and 100, respectively (Figure 9b). The isotopic composition of δ13C and δ18O in the prograde and retrograde stage skarn calcites of the Yolindi skarn mineralization exhibited a depletion pattern that aligns with the curves of 0.01, 0.1, and, rarely, 0.5 X (CO2). Isotopic depletion was observed in both the oxygen and carbon isotopes. The fluid–rock ratios of skarn calcites during the prograde stage exhibited the highest variability, with their values ranging from 10 to 80. In contrast, the fluid–rock ratios pertaining to retrograde-stage skarn calcites have yet to be identified.

6. Discussion

6.1. Sulfur Isotopic Compositions and Their Geological Implications

The skarn deposits exhibit geological significance in relation to geodynamic settings, crustal recycling and metallogenesis, paleoenvironmental conditions, ancient hydrothermal systems, mineral resource potential, and regional metamorphic history [49,50]. Skarn deposits often form in fractures, hydrothermal systems, and igneous–carbonate contact zones [49]. Similar to earlier hydrothermal systems and pathways, metal-rich hydrothermal fluids mix with surrounding rocks to generate skarn deposits [50]. According to Ault and Kulp [51], the variation in δ34S values within an ore deposit offers insights on the conditions under which it was generated, namely whether the deposits originated from fluids originating from a deep-seated magmatic source or from a more restricted source in the upper crust. Furthermore, it is crucial to recognize that various origins of sulfur in fluids responsible for ore formation encompass unique δ34S values. Firstly, it is common for a mantle or magmatic source to have a δ34S value within the range of 0 ± 3‰ [52]. McCuaig and Kerrich [53] stated that magmatic sources are formed through the dissolution or desulfidation of magmatic sulfides, having δ34S values that range from 0‰ to +9‰. A seawater source has been identified via a δ34S value of about +20‰ [53]. Furthermore, sedimentary rocks that have large negative δ34S values exhibit a notable decrease in sulfur concentration, as stated by Rollinson [54].
The sulfur isotopic composition (δ34S) values obtained from the Yolindi Cu-Fe Skarn mineralization exhibited distinct variations. In the endoskarn zone, two varieties of pyrite minerals occurred, with one having δ34S values ranging from +0.27 to +0.57‰VCDT and the other ranging from −4.56 to −3.98‰VCDT. Furthermore, the sulfide minerals in the exoskarn zones exhibited negative δ34S values. The proximal zone showed a slight negative signature, ranging from −4.27 to −0.17‰VCDT for pyrite and from −4.23 to −0.25‰VCDT for chalcopyrite. On the other hand, the intermediate zone displayed significantly more negative values, ranging from −9.44 to −5.46‰VCDT for pyrite and from −8.88 to −5.59‰VCDT for chalcopyrite (see Table 2). These findings indicated the potential occurrence of a sulfur source that exhibits varying consistency and encompasses a number of characteristics with magmatic sources, as well as other sources, including sedimentary, biogenic, and/or metamorphic sources (Figure 10a). The δ34S values of hydrogen sulfide (H2S) in ore fluids for sulfide minerals in the endoskarn zone (from −5.47‰ to −0.34‰) and proximal zone (from −5.39‰ to −1.08‰) exhibited a slight negative pattern, which fell slightly within the range of sulfide minerals associated with the magmatic–hydrothermal signature described by Richards [55]. These findings indicated that the sulfur found in the pyrite and chalcopyrite minerals did not mainly originate from the Earth’s mantle. However, the δ34Sfluid values still remained within the range of sulfur derived from magmatic sources [47]. The occurrence of very low (large and negative) δ34Sfluid values in the intermediate zone (from −10.57‰ to −4.54‰) indicates the potential influence of negative δ34S reservoirs, such as organic-rich sources, as detailed by Chambers [56] and Strauss [57], or similarities to metamorphic sulfide, as reported by Hutchison et al. [58] (Figure 10b). In summary, the sulfide-bearing fluid may have originated from either a magmatic–hydrothermal fluid, from the leaching process in igneous rocks, or from contributions from the organic-rich layers and/or metamorphic sources of the host metamorphic rocks of the Torasan formation. The fluctuation in sulfur isotope ratio from endoskarn to exoskarn zones and from prograde to retrograde zones in the Yolindi skarn mineralization may provide valuable insights into their physical and chemical evolution, as well as the processes involved in the processing of these deposits. Our previous article [4] discussed the transition from endoskarns to exoskarns in the Yolindi area, which indicates a spatial and temporal zonation in mineral chemistry within a skarn system. This transition is marked by different combinations of minerals, such as massive, un-zoned andradite and augite with magnetite in the endoskarn and zoned andradite in the proximal zone, indicating a prograde character [4]. Epidote, actinolite, and Cl-rich scapolite are newly formed hydrous minerals in the exoskarn intermediate and distal zones, as part of the retrograde system [4]. One instance of scapolite occurred in exoskarns, which had a greater concentration of chlorine. This indicates the presence of a hydrothermal fluid with a high NaCl content, possibly originating from the country metasediment rock of the Torasan formation [59]. The sulfur isotopic compositions at the first stage of skarn mineralization showed that the sulfur originated from a magmatic source. The sulfur isotopic compositions (δ34S) varied from 0.27‰ to 0.57‰ and from −4.56‰ to −0.17‰ in the endoskarn zone (see Table 2 and Figure 10). As the system evolved from the prograde stage to the retrograde stage, the (δ34S) values changed from −9.44‰ to −2.59‰ (see Table 2 and Figure 10). During this transition, there was a gradual decrease in the δ18O fluid values from 6.0‰ to 17.6‰ in the prograde zone and from 0.9‰ to 3.5‰ in the retrograde zone (see Table 3). This suggested that there was an increase in mixing with meteoric water [60]. Figure 10 and Figure 11 depict the typical ranges of sulfur isotopic compositions displayed under different geological settings. The δ34S values of sulfide minerals reported in several skarn deposits in Turkey and worldwide displayed a broad range of values, all of which were within the range of δ34S values seen in granitic rocks (Figure 10a). When differentiating between ore deposits from sedimentary and igneous settings, it is important to approach the use of sulfur isotopes with caution due to the substantial overlap seen in δ34S values (Figure 10a). This occurrence may be attributed to the significant deposition of sulfide and sulfate minerals from the hydrothermal fluids during the mineralization process [61]. Figure 11 revealed that the studied Yolindi Cu-Fe skarn mineralization shares similarities with various other deposits, namely the Çataltepe deposits in Turkey [62], Fırıncıkdere in Kalkım in Turkey [63], Mazraeh in NW Iran [60], Ditto in Japan [64], Shenshan in NE China [65], and Velardeña in Mexico [66] (Figure 11). These deposits exhibited a significant reduction in δ34S, indicating a strong link between the sulfur isotopic composition of rock sulfur and ore sulfur in the magnetite series of granitoids. This also suggested that they may have developed via contact metasomatism, with their light sulfur likely originating from biogenic sulfur present in the sedimentary rocks [64,67].

6.2. Source of Carbon

The δ13C/δ12C isotope ratio has often been used for the purposes of determining the source of carbon dioxide (CO2) derived from gas associated with magmatic–hydrothermal systems. In addition, it can be inferred that the computed δ13CCO2 is almost considered the δ13CƩC of the fluid [74]. This ratio is a valuable tool for distinguishing between various potential sources of fluid. These sources include: (i) gases originating from the Earth’s mantle, which typically have δ13CCO2 values ranging from −7‰ to −3‰VPDB [75,76]; (ii) the degradation of organic matter, which often produces significantly negative δ13CCO2 values (≤−20‰VPDB; Hoefs [47] and O’Leary [77]); and (iii) thermal metamorphic processes associated with the decomposition of limestone, which are typically characterized by CO2 with isotopically enriched values (δ13CCO2: >0 ± 1‰VPDB; Sano and Marty [78], Tedesco and Scarsi [79], Minissale [80] and Clark [81]). Typically, the presence of intermediate δ13CCO2 values has often been attributed to the amalgamation of carbon dioxide derived from several sources. Nevertheless, several studies have provided evidence indicating that the carbon isotopic composition of various gases is subjected to significant alterations due to the secondary processes of isotope fractionation. These processes include the interaction between gas and water, as demonstrated by Weinlich [82], Gilfillan et al. [83], Darrah et al. [84], and Güleç and Hilton [85]. Additionally, the precipitation or dissolution of carbonate minerals has been shown to have an impact on carbon isotopes in gases, as evidenced by Ohwada et al. [86], Barry et al. [87], and Venturi et al. [88]. Hence, it is important to be careful in interpreting δ13CCO2 data, especially for gases derived from regions with restricted geological constraints [89]. The measured δ13CCO2 values of prograde calcite varied between −9.45 and −6.72‰VPDB and demonstrated conformity with a magmatic source derived from the Earth’s mantle, with an influence from the thermal degradation of organic materials (Figure 12a). In contrast, the δ13CCO2 values of retrograde calcite exhibited a range from −10.61 to −9.06‰VPDB, indicating that the CO2 was solely derived by the thermal degradation of organic matter (Figure 12a).

6.3. Calcite-Forming Fluid Sources

Hydrothermal fluids from various sources have distinct carbon–oxygen isotopic compositions, as shown by Demény and Harangi [90], Demény et al. [91], Zheng and Chen [92], and Zhou et al. [93]. Particularly, carbon dioxide (CO2) originating from the mantle or igneous carbonatite sources displays a variety of isotopic compositions. More precisely, it has a δ13CPDB value that varies between −8‰ and −4‰, and a δ18OSMOW value that ranges from 6‰ to 10‰ [91,94]. However, CO2 that comes from marine carbonate sources has distinct isotopic characteristics varying between −4‰ and 4‰, whereas the δ18OSMOW value ranges from 20‰ to 30‰ [95]. In addition, CO2 originating from sedimentary organic matter has unique isotopic compositions, having δ13CPDB values ranging from −30‰ to −15‰, whereas its δ18OSMOW value ranges from 24‰ to 30‰ [47]. Furthermore, the carbon isotopic composition of the hydrothermal fluids, when paired with the oxygen isotopic composition, offers more insight into the origins of the fluid in the hydrothermal system. However, the carbon isotope signature of the water source remained rather ambiguous. The δ18OH2O data in the Yolindi area exhibited a wide range of variability. These values for calcite from prograde skarns varied from +6.03‰ to +17.57‰, and for calcite from retrograde skarns, they ranged from +0.91‰ to +3.49‰. These findings indicate that the hydrothermal fluid that caused the formation of calcite crystals in the prograde skarn zone is a mixture of metamorphic and magmatic sources, perhaps originating from mantle or igneous origins (Figure 12b). The calcite minerals in the retrograde skarn zone were formed via the activity of hydrothermal fluids originating from meteoric sources, as shown in Figure 12b.
Figure 12. (a) The δ13CCO2 values of calcite minerals from prograde skarn and retrograde skarn were compared to the natural δ13CCO2 values from different sources, as reported by Schidlowski [96] and Planavsky et al. [97]. (b) The δ18OH2O values of calcite minerals from prograde skarn and retrograde skarn were compared to the natural δ18OH2O values from different sources, as detailed by Sheppard [98] and Rollinson and Pease [99].
Minerals 13 01542 g012

6.4. Composition of Hydrothermal Solutions

Eutectic temperatures (Te) have been ascertained for different types and phases of inclusions occurring in andradite, grossular, quartz, and calcite minerals. The eutectic temperatures of the prograde proximal stage inclusions in andradite ranged from −37.80 to −12.10 °C. The temperatures mentioned are associated with the mixing of H2O-CaCl2-MgCl2-NaCl salt solutions [33], rather than being specific to individual phases (Figure 13). Nevertheless, the eutectic temperatures of the retrograde stage inclusions of grossular, quartz, and calcite minerals in the proximal, intermediate, and distal zones were found to be frequently comparable with the eutectic temperature of the H2O–NaCl system [33] (Figure 13). Considering these eutectic temperatures at all stages, the composition of the prograde early phases of inclusions was characterized by a combination of CaCl2- and MgCl2-dominated systems [33]. CaCl2 and MgCl2 are the main components of hydrothermal fluids, as stated by Roedder [32]. The salinity and temperature of this particular stage of inclusion exhibited greater values compared to the retrograde phases. The existence of CaCl2 and MgCl2 indicates a direct or indirect interaction with either hydrothermal fluid or marine carbonate in the nearby area [100,101]. The carbonaceous rocks that were found in the Torasan formation within the skarn contacts are the only plausible origin for the first-stage inclusions bearing CaCl2 and MgCl2 during the prograde stage. Thus, the existence of CaCl2 and MgCl2 in the fluid inclusions can be attributed to a variety of factors, including the evolution of hydrothermal systems, temperature and salinity fluctuations, fluid immiscibility (or boiling), and the presence of distinct types of fluid inclusions, such as liquid-rich and vapor-rich inclusions, in this stage [102,103]. Later on, it was discovered that the retrograde stage inclusions were mostly composed of NaCl, based on the very similar eutectic temperatures of the NaCl–H2O system [33]. The transition from a composition mostly consisting of CaCl2 and MgCl2 to one dominated by NaCl in the fluid inclusions indicates that there were significant interactions between the hydrothermal solutions and carbonaceous host rocks during the first stages of skarnification. During the retrograde phase, a reduction in the interaction between the hydrothermal fluids and carbonates may have resulted in alterations that led to compositions dominated by NaCl.

6.5. Evolution of Ore-Forming Fluids

The prograde-stage inclusions had higher salinity, reaching up to 26.07 wt.% NaCl equivalent, and higher Th temperatures, reaching up to 412.20 °C (Figure 14). In contrast, the fluid inclusions during the retrograde stage exhibited reduced salinity and Th temperatures. The salinity content of the minerals formed during the retrograde stage (i.e., grossular, quartz, and calcite) dropped as the temperature of the fluid inclusions decreased (Figure 14). This decrease in salinity was ascribed to the amalgamation of meteoric water and hydrothermal solutions [104], as well as the interaction of the solution with the organic material within the host Torasan formation. The results unequivocally show that the salinity content of hydrothermal solutions was higher during the first phase (prograde) of skarn formation due to the interaction between the fluids originating from magma and carbonaceous rock units of the Torasan formation. During the later stages (retrograde), the addition of meteoric water resulted in a decrease in salinity levels and a reduction in fluid temperatures.
The ore-forming fluid evolution of the Yolindi Cu-Fe skarn mineralization began with the crystallization and cooling of the Şaroluk quartz monzonite and granodiorite in the shallow crust. The early skarn stage (prograde) is characterized by relatively moderate-to-high salinities, reaching up to 26 wt.% NaCl equivalents. These salinities were believed to be the result of a magmatic fluid component that underwent boiling [106] from the crystallizing Şaroluk quartz monzonite–granodiorite parental magma. It has been widely reported that the Şaroluk intrusion, which formed at shallow depths, contains volatile-rich magmas. This has been supported by various studies [27,107,108,109,110,111]. The presence of these magmas promotes the direct release of metalliferous and highly saline aqueous fluids [55]. In this particular setting, the first fluids that separate will possess salinities of moderate levels (6–8 wt.% NaCl equivalent; Bodnar) [106]. During the process of crystallization, the concentration of chlorine increases in the molten substance. This causes the fluids that are still separating to have progressively increasing levels of salinity. The andradite minerals in this early-stage (prograde) proximal exoskarn zone contain liquid-rich and vapor-rich two-phase (L+V) aqueous inclusions. These inclusions indicate that fluid boiling occurred during this early stage, resulting from the boiling process of the initial supercritical fluid. This fluid boiling was found to be directly associated with the earlier skarn stage (Figure 15). Therefore, the magnetite deposition in the proximal zone during the prograde stage was most likely a result of boiling, along with a reduction in temperature and/or pressure of the hydrothermal fluids.
On the other hand, the cooling and reduction in pressure and salinity, as well as changes in fluid composition, during the transition from the prograde stage to the retrograde stage of skarnification can be elucidated via various processes [112]: (1) the infiltration of meteoric water and its mixing with a prevailing magmatic fluid; (2) the addition of basinal fluids from the nearby sedimentary host rocks; and/or (3) the liberation of CaCl2 during the creation of calc-silicate minerals and skarn [113]. Several porphyry and skarn systems, such as those described by Roedder [32] and Lai et al. [114], have shown similar tendencies. The fluids responsible for forming ores during the later stage (retrograde) in the proximal, intermediate, and distal exoskarn zones at the Yolindi area were found to be colder and more diluted compared to the earlier stage. This is evident from the obvious linear patterns shown in Figure 15, indicating that the influence of mixing with meteoric water is considerable [1]. The ongoing influx and mixture of meteoric water, which is relatively cold and has low salinity, resulted in ore-forming fluids with a moderate–low temperature and moderate–low salinity. The occurrence of relatively higher iron grades, associated with retrograde skarn formations, suggested that magnetite and specular hematite were formed concurrently during this stage of skarn mineralization. This is in contrast to the earlier phases, where only magnetite was formed as the initial iron oxide. The principal cause of iron deposition seems to be the combination of magmatic-dominated fluids from the crystallizing Şaroluk intrusion with cooler fluids emanating from the surface. The sulfide-rich mineralization deposition during the latter phase of the retrograde stage in the intermediate and distal zones indicated that it may have taken place under skarns to porphyry–epithermal transitional conditions (?) e.g., Bouabdellah et al. [112]. The probable explanation of this phenomenon may be attributed to a drop in temperature, pressure, and salinity, together with the occurrence of vuggy quartz and the substitution of lattice-bladed calcite with quartz. The mineralization originated from fluids with a salinity of less than 15 wt.% NaCl equivalent. The formation occurred at temperatures ranging from 390 to 197 °C and pressures below 250 bars [112]. Therefore, it is very likely that the cooling and boiling of these fluids, together with the majority of fluid mixing, significantly influenced the creation of iron and sulfide minerals.

7. Conclusions

This comprehensive study of the Yolindi Cu-Fe skarn mineralization represents a significant advancement in understanding the complex interplay of geological processes responsible for skarn formation and mineralization. Utilizing a multidisciplinary approach, combining microthermometry of fluid inclusions with isotopic analysis (δ34S, δ13C, and δ18O), this study has elucidated the physiochemical conditions and fluid evolution within this skarn mineralization process. The findings highlight the significance of magmatic impacts, meteoric water interactions, and the role of the host rock matrix in shaping the mineralization process.
The isotopic data, particularly sulfur isotopes in sulfide minerals and carbon and oxygen isotopes in calcite, have provided key insights into the sources of sulfur and the composition and temperature of fluid–rock interactions. The variable δ34S levels across different skarn zones highlight the diverse sulfur origins, ranging from magmatic impacts in endoskarn zones to organic-rich and potentially metamorphic origins in exoskarn zones. This isotopic variability reflects the complex dynamics of sulfur incorporation into the skarn system. Additionally, carbon and oxygen isotope evidence from calcites revealed a significant shift in fluid sources and interactions, transitioning from a dominantly magmatic CO2 source in the prograde skarn to predominantly meteoric water and organic material during the retrograde stage.
The fluid inclusion studies further complemented these findings, delineating a clear temporal and compositional transition of the hydrothermal fluids. The early prograde stage was characterized by high salinity and boiling magmatic fluids, indicative of intense interactions with carbonaceous rocks. The retrograde phase, marked by lower salinity and temperatures, signified the increasing influence of meteoric water and organic-rich host rocks, culminating in a complex mineralization process. This transition from high-salinity, magmatic-dominated fluids to more diluted compositions reflects the intricate interplay between deep magmatic processes and surface water influences in the formation of the Yolindi skarn mineralization.
In summary, the Yolindi Cu-Fe skarn mineralization offers a quintessential example of skarn formation, where the convergence of magmatic and meteoric fluids, coupled with the geochemical characteristics of the host rock, plays a pivotal role in mineralization. The achievements of this study lie in its detailed characterization of these interactions and their influence on ore-forming processes, contributing to a deeper understanding of the formation and evolution of skarn deposits.

Author Contributions

Conceptualization, M.K. (Mustafa Kaya), M.K. (Mustafa Kumral), C.Y. and A.A.; methodology, M.K. (Mustafa Kaya) and A.A.; software, M.K. (Mustafa Kaya) and A.A.; validation, M.K. (Mustafa Kaya) and A.A.; formal analysis, M.K. (Mustafa Kaya), M.K. (Mustafa Kumral) and A.A.; investigation, M.K. (Mustafa Kaya) and A.A.; resources, M.K. (Mustafa Kaya) and A.A.; data curation, M.K. (Mustafa Kaya) and A.A.; writing—original draft preparation, M.K. (Mustafa Kaya) and A.A.; writing—review and editing, M.K. (Mustafa Kaya), M.K. (Mustafa Kumral) and A.A.; visualization, M.K. (Mustafa Kaya) and A.A.; supervision, M.K. (Mustafa Kumral) and A.A. All authors took part in the fieldwork. All authors have read and agreed to the published version of the manuscript.

Funding

This work was funded by the Scientific Research Project (BAP project ID: 44594) for graduate students at Istanbul Technical University (ITU, Turkey).

Data Availability Statement

The data are available in Table 1, Table 2 and Table 3.

Acknowledgments

This study is part of the thesis of the first author. The authors would like to express their gratitude to Lecturer Beril Tanç Kaya and Hatice Nur Bayram (ITU, Turkey) for their assistance in the laboratory work. They would also like to thank geologist Sercan Öztürk (ITU, Turkey) for his help during the fieldwork. Mustafa Selman Aydoğan (Balıkesir University, Turkey) and Yusuf Kağan Kadioğlu (Ankara University, Turkey) are appreciated for their contributions in the geologic map. Additionally, the contributions of the editor and anonymous reviewers are gratefully recognized for their valuable comments and recommendations, which significantly enhanced the quality of the manuscript.

Conflicts of Interest

The authors declare no conflict of interest.

References

  1. Meinert, L.D.; Dipple, G.M.; Nicolescu, S.; Hedenquist, J.W.; Thompson, J.F.H.; Goldfarb, R.J.; Richards, J.P. World Skarn Deposits. In Economic Geology 100th Anniversary Volume; Society of Economic Geologists: Littleton, CO, USA, 2005; pp. 299–336. [Google Scholar]
  2. Yigit, O. A prospective sector in the Tethyan Metallogenic Belt: Geology and geochronology of mineral deposits in the Biga Peninsula, NW Turkey. Ore Geol. Rev. 2012, 46, 118–148. [Google Scholar] [CrossRef]
  3. Kuşcu, İ. Skarns and skarn deposits of Turkey. In Mineral Resources of Turkey; Pirajno, F., Ünlü, T., Dönmez, C., Şahin, M.B., Eds.; Modern Approaches in Solid Earth Sciences; Springer: Berlin/Heidelberg, Germany, 2019; Volume 16, pp. 283–336. [Google Scholar]
  4. Kaya, M.; Kumral, M.; Yalçın, C.; Abdelnasser, A. Genesis and Evolution of the Yolindi Cu-Fe Skarn Deposit in the Biga Peninsula (NW Turkey): Insights from Genetic Relationships with Calc-Alkaline Magmatic Activity. Minerals 2023, 13, 1304. [Google Scholar] [CrossRef]
  5. Kaya, M.; Kumral, M.; Abdelnasser, A.; Yalçın, C.; Öztürk, S.; Bayram, H.N.; Tanç-Kaya, B. Evolution of the hydrothermal fluids of the Yolindi Fe-Cu skarn deposit, Biga peninsula, NW Turkiye: Evidence from carbon-oxygen isotopic variations of calcite minerals. In Proceedings of the EGU General Assembly 2023, Vienna, Austria, 23–28 April 2023. [Google Scholar]
  6. Kuşcu, İ.; Tosdal, R.M.; Gençalioğlu-Kuşcu, G. Porphyry-Cu Deposits of Turkey. In Mineral Resources of Turkey; Pirajno, F., Ünlü, T., Dönmez, C., Şahin, M.B., Eds.; Modern Approaches in Solid Earth Sciences; Springer: Berlin/Heidelberg, Germany, 2019; pp. 337–425. [Google Scholar]
  7. Karaman, M.; Kumral, M.; Yildirim, D.K.; Doner, Z.; Afzal, P.; Abdelnasser, A. Delineation of the porphyry-skarn mineralized zones (NW Turkey) using concentration–volume fractal model. Geochemistry 2021, 4, 125802. [Google Scholar] [CrossRef]
  8. Abdelnasser, A.; Kumral, M.; Zoheir, B.; Yilmaz, H. Evolution of the Tepeoba porphyry-skarn Cu-Mo-Au deposit, NW Turkey: New mineralogical and geochemical findings. Ore Geol. Rev. 2022, 147, 104967. [Google Scholar] [CrossRef]
  9. Yildirim, D.K. Genesis of the Halılar Metasediment-Hosted Cu-Pb (±Zn) Mineralization, NW Turkey: Evidence from Mineralogy, Alteration, and Sulfur Isotope Geochemistry. Minerals 2022, 12, 991. [Google Scholar] [CrossRef]
  10. Meinert, L.D. Skarns and Skarn Deposits. Geosci. Can. 1992, 19, 145–162. [Google Scholar]
  11. Özden, S.; Över, S.; Poyraz, S.A.; Güneş, Y.; Pınar, A. Tectonic implications of the 2017 Ayvacık (Çanakkale) earthquakes, Biga Peninsula, NW Turkey. J. Asian Earth Sci. 2018, 154, 125–141. [Google Scholar] [CrossRef]
  12. Okay, A.; Siyako, M.; Burkan, K. Geology and tectonic evolution of the Biga Peninsula, northwest Turkey. Bull.-Tech. Univ. Istanb. 1991, 44, 191–256. [Google Scholar]
  13. Göncüoğlu, M.C. Introduction to the Geology of Turkey: Geodynamic Evolution of the Pre-Alpine and Alpine Terranes; ODTÜ Jeoloji Mühendisliği Bölümü: Ankara, Turkey, 2010; pp. 1–66. [Google Scholar]
  14. Birkle, P.; Satir, M.; Erler, A.; Ercan, T.; Bingol, E.; Orcen, S. Dating, geochemistry and geodynamic significance of the Tertiary magmatism of the Biga Peninsula, NW Turkey. In Geology of the Black Sea Region: Ankara, Turkey; Erler, A., Ed.; Mineral Research and Exploration Institute of Turkey (MTA): Ankara, Turkey, 1995; pp. 171–180. [Google Scholar]
  15. Yılmaz, Y.; Genç, Ş.; Karacık, Z.; Altunkaynak, Ş. Two contrasting magmatic associations of NW Anatolia and their tectonic significance. J. Geodyn. 2001, 31, 243–271. [Google Scholar] [CrossRef]
  16. Özdamar, Ş.; Roden, M.F.; Zou, H.; Billor, M.Z.; Hames, W.; Georgiev, S.; Dunkl, I. Petrogenesis of oligocene plutonic rocks in western Anatolia (NW Turkey): Insights from mineral and rock chemistry, Sr-Nd isotopes, and U-Pb, Ar-Ar and (U-Th)/He geochronology. Geochemistry 2021, 81, 125747. [Google Scholar] [CrossRef]
  17. Özdamar, Ş.; Zou, H.; Billor, M.Z.; Hames, W.E. Petrogenesis of mafic microgranular enclaves (MMEs) in the oligocene-miocene granitoid plutons from northwest Anatolia, Turkey. Geochemistry 2021, 81, 125713. [Google Scholar] [CrossRef]
  18. Kamacı, Ö.; Altunkaynak, Ş. Petrological insights into connections between the S- and I-type magmatic associations in metamorphic core complexes: A case study of the Çataldağ metamorphic core complex (NW Turkey). Lithos 2023, 464–465, 107433. [Google Scholar] [CrossRef]
  19. Özdamar, Ş.; Zou, H.; Billor, M.Z.; Hames, W.; Roden, M.F.; Sarıkaya, O.; Georgiev, S. Petrogenesis, geochronology and thermochronology of Oligocene to Miocene Western Anatolia granitoid plutons in Turkey. Lithos 2024, 464–465, 107430. [Google Scholar] [CrossRef]
  20. Genç, Ş.; Altunkaynak, Ş. On the Eybek granite (Biga Peninsula, NW Anatolia): A new evaluation in the light of new geochemical data. J. Earth Sci. Appl. Res. Cent. Hacet. Univ. 2007, 28, 75–98. [Google Scholar]
  21. Yılmaz, Y.; Karacık, Z. Geology of the northern side of the Gulf of Edremit and its tectonic significance for the development of the Aegean grabens. Geodin. Acta 2001, 14, 31–43. [Google Scholar] [CrossRef]
  22. Yigit, O. Mineral deposits of Turkey in relation to Tethyan metallogeny: Implications for future mineral exploration. Econ. Geol. 2009, 104, 19–51. [Google Scholar] [CrossRef]
  23. Duru, M.; Pehlivan, S.; Dönmez, M.; Ilgar, A.; Akçay, A. Geological Map of The Balıkesir-i18 Quadrangle; General Directorate of Mineral Research and Exploration: Ankara, Turkey, 2007. [Google Scholar]
  24. Aysal, N. Petrology of the Mesozoic–Tertiary Magmatism and Metamorphism in Northern Biga (Çanakkale); Istanbul University: Istanbul, Turkey, 2005. [Google Scholar]
  25. Aysal, N.; Ustaomer, T.; Ongen, S.; Keskin, M.; Koksal, S.; Peytcheva, I.; Fanning, M. Origin of the Early-Middle Devonian magmatism in the Sakarya Zone, NW Turkey: Geochronology, geochemistry and isotope systematics. J. Asian Earth Sci. 2012, 45, 201–222. [Google Scholar] [CrossRef]
  26. Aslan, Z.; Demir, H.; Altın, İ. U–Pb zircon geochronology and petrology of the early Miocene Göloba and Şaroluk plutons in the Biga Peninsula, NW Turkey: Implications for post-collisional magmatism and geodynamic evolution. J. Afr. Earth Sci. 2020, 172, 103998. [Google Scholar] [CrossRef]
  27. Aysal, N. Mineral chemistry, crystallization conditions and geodynamic implications of the Oligo–Miocene granitoids in the Biga Peninsula, Northwest Turkey. J. Asian Earth Sci. 2015, 105, 68–84. [Google Scholar] [CrossRef]
  28. Krushensky, R. Neogene calc-alkaline extrusive and intrusive rocks of the karalar-yesiller area: Northwest Anatolia, Turkey. Bull. Volcanol. 1975, 39, 336–360. [Google Scholar] [CrossRef]
  29. Dönmez, M.; Akçay, A.E.; Genç, Ş.C.; Şükrü, A. Middle-late Eocene volcanism and marine ignimbrites in Biga peninsula (NW Anatolia-Turkey). Bull. Miner. Res. Explor. 2005, 131, 21. [Google Scholar]
  30. Karacik, Z.; Yilmaz, Y.; Pearce, J.A. The Dikili-Çandarlı volcanics, Western Turkey: Magmatic interactions as recorded by petrographic and geochemical features. Turk. J. Earth Sci. 2007, 16, 493–522. [Google Scholar]
  31. Meinert, L.D. Skarn zonation and fluid evolution in the Groundhog mine, Central mining district, New Mexico. Econ. Geol. 1987, 82, 523–545. [Google Scholar] [CrossRef]
  32. Roedder, E. Volume 12: Fluid inclusions. Rev. Mineral. 1984, 12, 644. [Google Scholar]
  33. Shepherd, T.; Rankin, A.; Alderton, D. A Practical Guide to Fluid Inclusion Studies; Blackie and Son Ltd.: Glasgow, UK, 1985; p. 239. [Google Scholar]
  34. Van den Kerkhof, A.M.; Hein, U.F. Fluid inclusion petrography. Lithos 2001, 55, 27–47. [Google Scholar] [CrossRef]
  35. Darling, R.S. An extended equation to calculate NaCl contents from final clathrate melting temperatures in H2O-CO2-NaCl fluid inclusions: Implications for PT isochore location. Geochim. Cosmochim. Acta 1991, 55, 3869–3871. [Google Scholar] [CrossRef]
  36. Archer, D.G. Thermodynamic properties of the NaBr+ H2O system. J. Phys. Chem. Ref. Data 1991, 20, 509–555. [Google Scholar] [CrossRef]
  37. Bodnar, R. Revised equation and table for determining the freezing point depression of H2O-NaCl solutions. Geochim. Cosmochim. Acta 1993, 57, 683–684. [Google Scholar] [CrossRef]
  38. Steele-MacInnis, M.; Lecumberri-Sanchez, P.; Bodnar, R.J. Short note: HokieFlincs_H2O-NaCl: A Microsoft Excel spreadsheet for interpreting microthermometric data from fluid inclusions based on the PVTX properties of H2O-NaCl. Comput. Geosci. 2012, 49, 334–337. [Google Scholar] [CrossRef]
  39. Bakker, R.J. Package FLUIDS 1. Computer programs for analysis of fluid inclusion data and for modelling bulk fluid properties. Chem. Geol. 2003, 194, 3–23. [Google Scholar] [CrossRef]
  40. Zhang, Y.-G.; Frantz, J.D. Determination of the homogenization temperatures and densities of supercritical fluids in the system NaCl-KCl-CaCl2-H2O using synthetic fluid inclusions. Chem. Geol. 1987, 64, 335–350. [Google Scholar] [CrossRef]
  41. Czamanske, G.K.; Rye, R.O. Experimentally determined sulfur isotope fractionations between sphalerite and galena in the temperature range 600 degrees to 275 degrees C. Econ. Geol. 1974, 69, 17–25. [Google Scholar] [CrossRef]
  42. Ohmoto, H.; Rye, R. Isotopes of sulfur and carbon. In Geochemistry of Hydrothermal Ore Deposits; John Wiley & Sons, Inc.: Hoboken, NJ, USA, 1979; pp. 509–567. [Google Scholar]
  43. Valley, J.W.; Taylor, H.P.; O’Neil, J.R. Stable Isotopes in High Temperature Geological Processes; Walter de Gruyter GmbH & Co. KG: Berlin, Germany, 2018; Volume 16. [Google Scholar]
  44. Scheele, N.; Hoefs, J. Carbon isotope fractionation between calcite, graphite and CO2: An experimental study. Contrib. Mineral. Petrol. 1992, 112, 35–45. [Google Scholar] [CrossRef]
  45. O’Neil, J.R.; Clayton, R.N.; Mayeda, T.K. Oxygen Isotope Fractionation in Divalent Metal Carbonates; University of Chicago: Chicago, IL, USA, 1969. [Google Scholar]
  46. Sheppard, S.M. Isotope geothermometry. In Thermométrie et Barométrie Géologiques; Lagache, M., Ed.; French Society of Mineralogy and Crystallography: Paris, France, 1984; pp. 349–412. [Google Scholar]
  47. Hoefs, J. Stable Isotope Geochemistry; Springer Science & Business Media: Cham, Switzerland, 2008. [Google Scholar]
  48. Taylor, J. Water/rock interactions and the origin of H2O in granitic batholiths: Thirtieth William Smith lecture. J. Geol. Soc. 1977, 133, 509–558. [Google Scholar] [CrossRef]
  49. Chen, Y.-J.; Chen, H.-Y.; Zaw, K.; Pirajno, F.; Zhang, Z.-J. Geodynamic settings and tectonic model of skarn gold deposits in China: An overview. Ore Geol. Rev. 2007, 31, 139–169. [Google Scholar] [CrossRef]
  50. Dawson, K.M.; Eckstrand, O.R.; Sinclair, W.D.; Thorpe, R.I. Skarn Deposits. In Geology of Canadian Mineral Deposit Types; Geological Society of America: Boulder, CO, USA, 1995; Volume 8, p. 650. [Google Scholar]
  51. Ault, W.U.; Kulp, J.L. Sulfur isotopes and ore deposits. Econ. Geol. 1960, 55, 73–100. [Google Scholar] [CrossRef]
  52. Chaussidon, M.; Lorand, J.-P. Sulphur isotope composition of orogenic spinel lherzolite massifs from Ariege (North-Eastern Pyrenees, France): An ion microprobe study. Geochim. Cosmochim. Acta 1990, 54, 2835–2846. [Google Scholar] [CrossRef]
  53. McCuaig, T.C.; Kerrich, R. P—T—T—Deformation—Fluid characteristics of lode gold deposits: Evidence from alteration systematics. Ore Geol. Rev. 1998, 12, 381–453. [Google Scholar] [CrossRef]
  54. Rollinson, H. Using Geochemical Data; Longman Scientific & Technical Publisher: Harlow, UK, 1993; p. 352. [Google Scholar]
  55. Richards, J.P. Alkalic-type epithermal gold deposits—A review. Magmas Fluids Ore Depos. Mineral. Assoc. Can. Short Course 1995, 23, 367–400. [Google Scholar]
  56. Chambers, L. Sulfur isotope study of a modern intertidal environment, and the interpretation of ancient sulfides. Geochim. Cosmochim. Acta 1982, 46, 721–728. [Google Scholar] [CrossRef]
  57. Strauss, H. The isotopic composition of sedimentary sulfur through time. Palaeogeogr. Palaeoclimatol. Palaeoecol. 1997, 132, 97–118. [Google Scholar] [CrossRef]
  58. Hutchison, W.; Finch, A.A.; Boyce, A.J. The sulfur isotope evolution of magmatic-hydrothermal fluids: Insights into ore-forming processes. Geochim. Cosmochim. Acta 2020, 288, 176–198. [Google Scholar] [CrossRef]
  59. Zhu, Q.; Xie, G.; Mao, J.; Li, W.; Li, Y.; Wang, J.; Zhang, P. Mineralogical and sulfur isotopic evidence for the incursion of evaporites in the Jinshandian skarn Fe deposit, Edong district, Eastern China. J. Asian Earth Sci. 2015, 113, 1253–1267. [Google Scholar] [CrossRef]
  60. Rajabpour, S.; Hassanpour, S.; Jiang, S.-Y. Physicochemical evolution and mechanism of a skarn system: Insights from the world-class Mazraeh Cu deposit, NW Iran. GSA Bull. 2023, 1–20. [Google Scholar] [CrossRef]
  61. Oyman, T.; Bozan, S.; Çiçek, M.; Chiaradia, M.; Kuşcu, İ.l. Metal source and the origin of the Darıderesi Pb-Zn (Ag) veins in the Balya Mining District, NW Türkiye: Constraints from ore mineral chemistry, fluid inclusions and S-Pb isotopic signatures. All Earth 2023, 35, 210–241. [Google Scholar] [CrossRef]
  62. Demirale, G. Geology and Genesis of the Çataltepe (Lapseki/Çanakkale) Pb–Zn ± Cu ± Ag Deposit; Ankara University: Ankara, Turkey, 2011. [Google Scholar]
  63. Akıska, S.; Demirela, G.; Sayili, S. Geology, mineralogy and the Pb, S isotope study of the Kalkim Pb-Zn+/-Cu deposits, Biga Peninsula, NW Turkey. J. Geosci. 2013, 58, 379–396. [Google Scholar] [CrossRef]
  64. Shimazaki, H.; Yamamoto, M. Sulfur isotope ratios of some Japanese skarn deposits. Geochem. J. 1979, 13, 261–268. [Google Scholar] [CrossRef]
  65. Ma, X.-L.; Wang, K.-Y.; Li, S.-D.; Shi, K.-T.; Wang, W.-Y.; Yang, H. Geology, fluid inclusion, and H–O–S–Pb isotopic study of the Shenshan skarn Fe–Cu deposit, Southern Great Xing’an Range, Northeast China. J. Geochem. Explor. 2019, 200, 167–180. [Google Scholar] [CrossRef]
  66. Jiménez-Franco, A.; Canet, C.; Alfonso, P.; González-Partida, E.; Rajabi, A.; Escalante, E. The Velardeña Zn-(Pb-Cu) skarn-epithermal deposits, central-northern Mexico: New physical-chemical constraints on ore-forming processes. Bol. Soc. Geol. Mex. 2020, 72, A270719. [Google Scholar] [CrossRef]
  67. Sasaki, A.; Ishihara, S. Sulfur isotopic composition of the magnetite-series and ilmenite-series granitoids in Japan. Contrib. Mineral. Petrol. 1979, 68, 107–115. [Google Scholar] [CrossRef]
  68. Seal, R.R. Sulfur isotope geochemistry of sulfide minerals. Rev. Mineral. Geochem. 2006, 61, 633–677. [Google Scholar] [CrossRef]
  69. Taylor, B. Stable isotope geochemistry of ore-forming fluids. Mineral. Assoc. Can. Short Course Handb. 1987, 13, 337–445. [Google Scholar]
  70. Ohmoto, H.; Goldhaber, M. Sulfur and carbon isotopes. Geochem. Hydrothermal Ore Depos. 1997, 3, 517–611. [Google Scholar]
  71. Yılmazer, E.; Güleç, N.; Kuşcu, İ.; Lentz, D.R. Geology, geochemistry, and geochronology of Fe-oxide Cu (±Au) mineralization associated with Şamlı pluton, western Turkey. Ore Geol. Rev. 2014, 57, 191–215. [Google Scholar] [CrossRef]
  72. Bozan, S.; Uçar, İ. Geology, Geochemistry and isotope characteristics of Karadoru/Yenice (Çanakkale) Pb-Zn-Cu (Au-Ag) Deposit. In Proceedings of the 72nd Geological Congress of Turkey with International Participation, Ankara, Türkiye, 28 January–1 February 2019; pp. 411–413. [Google Scholar]
  73. Sipahi, F.; Akpınar, İ.; Eker, Ç.S.; Kaygusuz, A.; Vural, A.; Yılmaz, M. Formation of the Eğrikar (Gümüşhane) Fe–Cu skarn type mineralization in NE Turkey: U–Pb zircon age, lithogeochemistry, mineral chemistry, fluid inclusion, and OHCS isotopic compositions. J. Geochem. Explor. 2017, 182, 32–52. [Google Scholar] [CrossRef]
  74. Ohmoto, H. Systematics of sulfur and carbon isotopes in hydrothermal ore deposits. Econ. Geol. 1972, 67, 551–578. [Google Scholar] [CrossRef]
  75. Gerlach, T.M.; Taylor, B.E. Carbon isotope constraints on degassing of carbon dioxide from Kilauea Volcano. Geochim. Cosmochim. Acta 1990, 54, 2051–2058. [Google Scholar] [CrossRef]
  76. Poreda, R.; Craig, H.; Arnorsson, S.; Welhan, J. Helium isotopes in Icelandic geothermal systems: I. 3He, gas chemistry, and 13C relations. Geochim. Cosmochim. Acta 1992, 56, 4221–4228. [Google Scholar] [CrossRef]
  77. O’Leary, M.H. Carbon isotopes in photosynthesis. Bioscience 1988, 38, 328–336. [Google Scholar] [CrossRef]
  78. Sano, Y.; Marty, B. Origin of carbon in fumarolic gas from island arcs. Chem. Geol. 1995, 119, 265–274. [Google Scholar] [CrossRef]
  79. Tedesco, D.; Scarsi, P. Long term variations of the 3He/4He ratio and other noble gas isotopes ratios at Vulcano island (southern Italy): How the volcano works. J. Geophys. Res. 1998, 104, 10499–10510. [Google Scholar] [CrossRef]
  80. Minissale, A. Origin, transport and discharge of CO2 in central Italy. Earth-Sci. Rev. 2004, 66, 89–141. [Google Scholar] [CrossRef]
  81. Clark, I. Groundwater Geochemistry and Isotopes; CRC Press: Boca Raton, FL, USA, 2015. [Google Scholar]
  82. Weinlich, F.H. Isotopically light carbon dioxide in nitrogen rich gases: The gas distribution pattern in the French Massif Central, the Eifel and the western Eger Rift. Ann. Geophys. 2005, 48, 19–31. [Google Scholar] [CrossRef]
  83. Gilfillan, S.M.; Lollar, B.S.; Holland, G.; Blagburn, D.; Stevens, S.; Schoell, M.; Cassidy, M.; Ding, Z.; Zhou, Z.; Lacrampe-Couloume, G. Solubility trapping in formation water as dominant CO2 sink in natural gas fields. Nature 2009, 458, 614–618. [Google Scholar] [CrossRef] [PubMed]
  84. Darrah, T.H.; Tedesco, D.; Tassi, F.; Vaselli, O.; Cuoco, E.; Poreda, R.J. Gas chemistry of the Dallol region of the Danakil Depression in the Afar region of the northern-most East African Rift. Chem. Geol. 2013, 339, 16–29. [Google Scholar] [CrossRef]
  85. Güleç, N.; Hilton, D.R. Turkish geothermal fields as natural analogues of CO2 storage sites: Gas geochemistry and implications for CO2 trapping mechanisms. Geothermics 2016, 64, 96–110. [Google Scholar] [CrossRef]
  86. Ohwada, M.; Satake, H.; Nagao, K.; Kazahaya, K. Formation processes of thermal waters in Green Tuff: A geochemical study in the Hokuriku district, central Japan. J. Volcanol. Geotherm. Res. 2007, 168, 55–67. [Google Scholar] [CrossRef]
  87. Barry, P.; Hilton, D.; Füri, E.; Halldórsson, S.; Grönvold, K. Carbon isotope and abundance systematics of Icelandic geothermal gases, fluids and subglacial basalts with implications for mantle plume-related CO2 fluxes. Geochim. Cosmochim. Acta 2014, 134, 74–99. [Google Scholar] [CrossRef]
  88. Venturi, S.; Tassi, F.; Bicocchi, G.; Cabassi, J.; Capecchiacci, F.; Capasso, G.; Vaselli, O.; Ricci, A.; Grassa, F. Fractionation processes affecting the stable carbon isotope signature of thermal waters from hydrothermal/volcanic systems: The examples of Campi Flegrei and Vulcano Island (southern Italy). J. Volcanol. Geotherm. Res. 2017, 345, 46–57. [Google Scholar] [CrossRef]
  89. Tassi, F.; Feyzullayev, A.A.; Bonini, M.; Sani, F.; Aliyev, C.S.; Darrah, T.H.; Vaselli, O.; Baghirli, R.J. Mantle vs. crustal fluid sources in the gas discharges from Lesser Caucasus and Talysh Mountains (Azerbaijan) in relation to the regional geotectonic setting. Appl. Geochem. 2020, 118, 104643. [Google Scholar] [CrossRef]
  90. Demény, A.; Harangi, S. Stable isotope studies and processes of carbonate formation in Hungarian alkali basalts and lamprophyres: Evolution of magmatic fluids and magma-sediment interactions. Lithos 1996, 37, 335–349. [Google Scholar] [CrossRef]
  91. Demény, A.; Ahijado, A.; Casillas, R.; Vennemann, T.W. Crustal contamination and fluid/rock interaction in the carbonatites of Fuerteventura (Canary Islands, Spain): A C, O, H isotope study. Lithos 1998, 44, 101–115. [Google Scholar] [CrossRef]
  92. Zheng, Y.; Chen, J. Stable Isotope Geochemistry; Science Press: Beijing, China, 2000; pp. 62–118. (In Chinese) [Google Scholar]
  93. Zhou, J.-X.; Huang, Z.-L.; Lv, Z.-C.; Zhu, X.-K.; Gao, J.-G.; Mirnejad, H. Geology, isotope geochemistry and ore genesis of the Shanshulin carbonate-hosted Pb–Zn deposit, southwest China. Ore Geol. Rev. 2014, 63, 209–225. [Google Scholar] [CrossRef]
  94. Taylor, H.P.; Frechen, J.; Degens, E.T. Oxygen and carbon isotope studies of carbonatites from the Laacher See District, West Germany and the Alnö District, Sweden. Geochim. Cosmochim. Acta 1967, 31, 407–430. [Google Scholar] [CrossRef]
  95. Veizer, J.; Hoefs, J. The nature of O18/O16 and C13/C12 secular trends in sedimentary carbonate rocks. Geochim. Cosmochim. Acta 1976, 40, 1387–1395. [Google Scholar] [CrossRef]
  96. Schidlowski, M. Carbon isotopes as biogeochemical recorders of life over 3.8 Ga of Earth history: Evolution of a concept. Precambrian Res. 2001, 106, 117–134. [Google Scholar] [CrossRef]
  97. Planavsky, N.; Partin, C.; Bekker, A. Carbon Isotopes as a Geochemical Tracer. In Encyclopedia of Astrobiology; Gargaud, M., Irvine, W.M., Amils, R., Cleaves, H.J., Pinti, D.L., Quintanilla, J.C., Rouan, D., Spohn, T., Tirard, S., Viso, M., Eds.; Springer: Berlin/Heidelberg, Germany, 2015; pp. 366–371. [Google Scholar]
  98. Sheppard, S.M. Characterization and isotopic variations in natural waters. Rev. Mineral. Geochem. 1986, 16, 165–183. [Google Scholar]
  99. Rollinson, H.; Pease, V. (Eds.) Using Stable Isotope Data. In Using Geochemical Data: To Understand Geological Processes, 2nd ed.; Cambridge University Press: Cambridge, UK, 2021; pp. 219–285. [Google Scholar]
  100. Neng, J.; Jiuhua, X.; Mianxin, S. Fluid inclusion characteristics of mesothermal gold deposits in the Xiaoqinling district, Shaanxi and Henan provinces, People’s Republic of China. Miner. Depos. 1999, 34, 150–162. [Google Scholar] [CrossRef]
  101. Germann, K.; Lüders, V.; Banks, D.A.; Simon, K.; Hoefs, J. Late Hercynian polymetallic vein-type base-metal mineralization in the Iberian Pyrite Belt: Fluid-inclusion and stable-isotope geochemistry (S-O-H-Cl). Miner. Depos. 2003, 38, 953–967. [Google Scholar] [CrossRef]
  102. Massawe, R.J.R.; Lentz, D.R. Petrogenesis and U–Pb (titanite) age of Cu–Ag skarn mineralization in the McKenzie Gulch area, northern New Brunswick, Canada. J. Geochem. Explor. 2022, 232, 106902. [Google Scholar] [CrossRef]
  103. Ren, T.; Zhong, H.; Zhang, X.C. Fluid inclusion and stable isotope (C, O and S) constraints on the genesis of the high-grade Langdu Cu skarn deposit in Yunnan, SW China. Ore Geol. Rev. 2020, 118, 103354. [Google Scholar] [CrossRef]
  104. Wilkinson, J. Fluid inclusions in hydrothermal ore deposits. Lithos 2001, 55, 229–272. [Google Scholar] [CrossRef]
  105. Niu, P.-P.; Jiang, S.-Y.; Xiong, S.-F.; Hu, Q.-S.; Xu, T.-l. Fluid Inclusions and H-O-C-S Isotopes of the Wushan Copper Polymetallic Deposit in the Suizao Area, Hubei Province: Implications for Ore Genesis. Geofluids 2019, 2019, 3431909. [Google Scholar] [CrossRef]
  106. Bodnar, R. Fluid-inclusion evidence for a magmatic source for metals in porphyry copper deposits. In Magmas, Fluids and Ore Deposits; Thompson, J., Ed.; Short Course Series; Mineralogical Association of Canada: Quebec, QC, Canada, 1995; Volume 23, pp. 139–152. [Google Scholar]
  107. Altunkaynak, Ş.; Yılmaz, Y. The Mount Kozak magmatic complex, Western Anatolia. J. Volcanol. Geotherm. Res. 1998, 85, 211–231. [Google Scholar] [CrossRef]
  108. Erkül, S.T. Petrogenetic evolution of the Early Miocene Alaçamdağ volcano-plutonic complex, northwestern Turkey: Implications for the geodynamic framework of the Aegean region. Int. J. Earth Sci. 2012, 101, 197–219. [Google Scholar] [CrossRef]
  109. Erkül, S.T.; Erkül, F. Comment on “Al-in-Hornblende Thermobarometry and Sr-Nd-O-Pb Isotopic Compositions of the Early Miocene Alaçam Granite in NW Anatolia (Turkey)”. Turk. J. Earth Sci. 2013, 22, 354–358. [Google Scholar] [CrossRef]
  110. Karacık, Z.; Yılmaz, Y. Geology of the ignimbrites and the associated volcano–plutonic complex of the Ezine area, northwestern Anatolia. J. Volcanol. Geotherm. Res. 1998, 85, 251–264. [Google Scholar] [CrossRef]
  111. Hasözbek, A.; Erdoǧan, B.; Satir, M.; Siebel, W.; Akay, E.; Doǧan, G.D.; Taubald, H. Al-in-hornblende thermobarometry and Sr-Nd-O-Pb isotopic compositions of the early miocene Alaçam granite in NW Anatolia (Turkey). Turk. J. Earth Sci. 2012, 21, 37–52. [Google Scholar] [CrossRef]
  112. Bouabdellah, M.; Jabrane, R.; Margoum, D.; Sadequi, M. Skarn to Porphyry-Epithermal Transition in the Ouixane Fe District, Northeast Morocco: Interplay of Meteoric Water and Magmatic-Hydrothermal Fluids. In Mineral Deposits of North Africa; Bouabdellah, M., Slack, J.F., Eds.; Springer International Publishing: Cham, Switzerland, 2016; pp. 201–225. [Google Scholar]
  113. Kwak, T.; Tan, T.H. The importance of CaCl2 in fluid composition trends; evidence from the King Island (Dolphin) skarn deposit. Econ. Geol. 1981, 76, 955–960. [Google Scholar] [CrossRef]
  114. Lai, J.; Chi, G.; Peng, S.; Shao, Y.; Yang, B. Fluid evolution in the formation of the fenghuangshan Cu-Fe-Au deposit, Tongling, Anhui, China. Econ. Geol. 2007, 102, 949–970. [Google Scholar] [CrossRef]
Figure 1. The spatial distribution of skarn deposits on the Biga Peninsula, located in northwestern Turkey, modified according to Yigit [2], Kuşcu [3], and Kaya et al. [4]. The red box refers to Figure 2.
Minerals 13 01542 g001
Figure 2. Geologic map of the Yolindi area (modified according to Duru et al. [23], Aysal [24], Aysal et al. [25], and Kaya et al. [4]).
Minerals 13 01542 g002
Figure 3. (a) Serpentinized peridotites within the Torasan formation. (b) Phyllite exhibits well-developed muscovite, biotite, and quartz foliation with opaque minerals. (c) Actinolite and quartz in actinolite hornfels with clinozoisite, clinopyroxene, and opaque minerals. (d) Serpentinites are made up of antigorite, chlorite, clinopyroxene remnants, and other less frequent opaque minerals. (e) The major component of marble is calcite. (f) General view of the Yolindi metagranitoids. (g) Biotite gneiss contains biotite in addition to quartz, sericitized plagioclase, and other opaque minerals. (h) Sericitized plagioclase, quartz, biotite, and opaque minerals are found in metagranodiorite. (i) At the border of the Şaroluk granitoids, a hornfels zone formed inside the Torasan formation. (j) The majority of quartz monzonite is composed of plagioclase, K-feldspar, quartz, biotite, actinolite, and tremolite. (k) Granodiorite contains plagioclase, quartz, and microperthite, as well as hornblende, biotite, and other opaque minerals. (l) Porphyritic andesite with hornblende, actinolite, biotite, and plagioclase phenocrysts embedded in fine-grain microcrystalline plagioclase laths, biotite, hornblende, quartz, and opaque minerals. Abbreviations: actinolite (act), antigorite (atg), biotite (bt), calcite (cal), chlorite (chl), clinopyroxene (cpx), clinozoisite (czo), hornblende (hb), microperthite (mp), muscovite (ms), orthoclase (or), opaque mineral (opq), plagioclase (pl), quartz (qz), and sericite (ser).
Minerals 13 01542 g003
Figure 4. The zonation map of the Yolindi Cu-Fe Skarn mineralization illustrates several skarn zones, including the endoskarn and the proximal, intermediate, and distal exoskarn zones [4].
Minerals 13 01542 g004
Figure 5. (a) General characteristics of the endoskarn zone within the Şaroluk intrusion in Maden Deresi. (b) Magnetite-bearing granodiorites. (c) Magnetite-bearing endoskarns with andradite and epidote. (d) Magnetite- and pyrite-bearing granodiorite containing quartz, plagioclase, microperthite, biotite, and actinolite as opaques, as well as magnetite and pyrite. (e,f) Garnet- and magnetite-bearing prograde proximal zones within the Torasan formation. (g) In the proximal zone, andradite, calcite, and quartz occur. (h) The retrograde proximal zone’s greenish tint, which has been cut with a quartz carbonate vein. (i) In the retrograde proximal zone, andradite–grossular intergrowth, calcite, and quartz occur. (j) Green and brown color alteration of the intermediate exoskarn zone. (k,l) In the intermediate exoskarn zone, garnet (andradite–grossular), pyroxenes, scapolite, and calcite coexist with opaque minerals. (mo) Sericite and carbonate alteration of the distal exoskarn zone. Abbreviations: actinolite (act), andradite (adr), biotite (bt), calcite (cal), chlorite (chl), clinopyroxene (cpx), dolomite (dol), epidote (ep), feldspar (fls), grossular (grs), hematite (hem), hornblende (hb), magnetite (mag), microperthite (mp), orthopyroxene (opx), plagioclase (pl), pyroxene (px), pyrite (py), quartz (qz), scapolite (scp), and sericite (ser).
Minerals 13 01542 g005
Figure 6. (a) Magnetite occurred within the granodiorite in Maden Deresi. (b) Magnetite and pyrite in magnetite-containing endoskarn. (c) Magnetite’s martitization to hematite in the proximal exoskarn zone. (d) Chalcopyrite and pyrite in the proximal retrograde zone. (e) In the retrograde proximal zone, there is chalcopyrite, pyrite, and specular hematite. (f) Chalcopyrite occurs, along with sphalerite and specular hematite. (g) Pyrite with bornite in the proximal retrograde zone. (h) Clusters of specular hematite flakes that are shiny, metallic, and flat. (i) Specular hematite is seen in association with pyrite. (j,k) Cerussite and covellite are the alteration products of galena in the distal zone. (l) Malachite and goethite are the alteration products of chalcopyrite and pyrite, respectively, in the distal zone. Abbreviations: bornite (bo), cerussite (cer), chalcopyrite (cp), covellite (cv), galena (gn), goethite (gth), hematite (hem), magnetite (mag), malachite (mal), pyrite (py), and sphalerite (sp).
Minerals 13 01542 g006
Figure 7. A paragenetic sequence of metamorphic, altered, and ore minerals in the Yolindi Fe-Cu skarn mineralization.
Minerals 13 01542 g007
Figure 8. (a,b) Liquid-rich primary (liquid–vapor) fluid inclusions in andradite minerals from the prograde proximal exoskarn zone. (c) Vapor-rich primary (L+V) fluid inclusions with liquid-rich ones in andradite minerals from the prograde proximal exoskarn zone. (d,e) Liquid-rich primary (L+V) fluid inclusions in grossular minerals from the retrograde proximal exoskarn zone. (f,g) Liquid-rich primary (L+V) fluid inclusions in quartz minerals from the retrograde proximal exoskarn zone. (h,i) Liquid-rich primary (L+V) fluid inclusions in calcite minerals from the retrograde proximal exoskarn zone. (j) Liquid-rich primary (L+V) fluid inclusions in quartz minerals from the intermediate exoskarn zone. (k,l) Liquid-rich primary (L+V) fluid inclusions in quartz minerals from the distal exoskarn zone.
Minerals 13 01542 g008
Figure 9. (a) δ13CPDB vs. δ18OSMOW binary diagram for calcites from marble, prograde, and retrograde skarn zones. These compositions were then compared with the δ13C and δ18O isotopic compositions of other rock types, as documented by Sheppard [46] and Hoefs [47]. (b) Plots of δ13CCO2 vs. δ18OH2O isotopes of skarn calcites on the fluid–rock interaction model of Taylor [48], with curves generated for various X (CO2) and fluid–rock ratios of 0.01, 0.1, 0.5, 2, 10, 40, 80, and 100, respectively.
Minerals 13 01542 g009
Figure 10. (a) δ34S values of various geologic reservoirs, as reported by Seal [68], while skarn deposits were detailed by Taylor [69]. (b) δ34Sfluid values of the Yolindi skarn mineralization and their comparison with the magmatic–hydrothermal deposits from Richards [55] and Ohmoto and Goldhaber [70] and metamorphic sulfide from Hutchison et al. [58].
Minerals 13 01542 g010
Figure 11. Sulfur isotopic composition diagram for sulfides from Yolindi area in the Biga Peninsula. Compilation of S isotope data: (1) Şamlı, Turkey [71]; (2) Karadoru, Turkey [72]; (3) Çataltepe, Turkey [62]; (4) Eğrikar (Gümüşhane), Turkey [73]; (5) Mazraeh, NW Iran [60]; (6) Ditto, Japan [64]; (7) Shenshan, NE China [65]; (8) Velardeña, Mexico [66]; and (9) Handeresi-Bağırkaçderesi-Fırıncıkdere in Kalkım, Turkey [63].
Minerals 13 01542 g011
Figure 13. Comparing the measured eutectic temperatures of fluid inclusions from various mineral phases at different stages with the eutectic temperatures of certain salt solutions according to Shepherd et al. [33] and Wilkinson [104].
Minerals 13 01542 g013
Figure 14. Salinity vs. total homogenization temperature plot of the fluid inclusions [105], the skarn field after Roedder [32], showing the fluid evolution in the Yolindi Cu-Fe skarn mineralization. The symbols are shown in Figure 13.
Minerals 13 01542 g014
Figure 15. Homogenization temperature (Th°C) and salinity (wt.% NaCl) diagram for the Yolindi Cu-Fe skarn mineralization [104]. Shepherd et al. [33] modified the figure inset to depict temperature–salinity trends or fluid evolution pathways deriving from various geological events. The dotted lines indicate the line graphs for each sample type. The symbols are shown in Figure 13.
Minerals 13 01542 g015
Table 1. Summary of microthermometric data and their calculations of andradite, grossular, quartz, and calcite minerals from the different skarn zones from the study area.
MineralAndraditeGrossularQuartzCalcite
StageProgradeRetrogradeRetrogradeRetrogradeRetrogradeRetrograde
ZoneProximalProximalProximalIntermediateDistalProximal
Inclusion type (primary)L–VL–VL–VL–VL–VL–V
Eutectic temperature (°C)IntervalFrom −37.8 to −12.1From −8.8 to −1.6From −26.7 to −0.8From −26.6 to −1.7From −8.6 to −1.9From −17.8 to −1.1
n101317201224
Avg−24.1−4.9−7.0−11.9−4.7−6.3
Tm-ice (°C)IntervalFrom −25.8 to −8.5From −5.3 to −0.4From −13.5 to −0.5From −17.6 to −0.4From −3.4 to −0.9From −12.3 to −0.2
n101317201224
Avg−17.6−1.8−3.7−6.7−1.8−2.3
Th-tot (°C)IntervalFrom 359.0 to 412.2From 280.1 to 372.6From 256.0 to 394.3From 299.8 to 370From 296.1 to 336.5From 197.7 to 317.8
n101317201224
Avg390.2348.1304.9337.9319.5280.4
Salinity %NaCl eq.IntervalFrom 12.3 to 26.1From 0.7 to 8.3From 0.9 to 17.3From 0.7 to 20.7From 1.6 to 5.6From 0.4 to 16.2
n101317201224
Avg26.12.95.79.43.13.6
Density (g/cm−3)IntervalFrom 0.69 to 0.91From 0.58 to 0.77From 0.56 to 0.88From 0.65 to 0.86From 0.65 to 0.77From 0.71 to 0.89
n101317201224
Avg0.810.640.750.750.700.78
Ph (bar)IntervalFrom 145.3 to 261.4From 63.1 to 211.8From 43.1 to 255.4From 82.4 to 185.7From 80.4 to 138.4From 14.7 to 107.2
n101317201224
Avg217.8163.2100.1135.6111.367.1
Table 2. Sulfur isotope values of sulfides from the Yolindi Cu-Fe Skarn mineralization.
Sample IDMineralHostMetamorphic GradeMeasured δ34S (‰)at T °Cδ34SH2S Fluid (‰) (3) Error Range
BG-220APyriteEndoskarn −4.56390 (1)−5.47±0.18
BG-220BPyriteEndoskarn −4.11390 (1)−5.02±0.18
BG-220CPyriteEndoskarn −3.98390 (1)−4.89±0.18
BG-85APyriteEndoskarn 0.57390 (1)−0.34±0.18
BG-85BPyriteEndoskarn 0.27390 (1)−0.64±0.18
BG-87PyriteEndoskarn 0.33390 (1)−0.58±0.18
BG-102PyriteProximalPrograde−3.65390 (1)−4.56±0.18
BG-33APyriteProximalPrograde−0.17390 (1)−1.08±0.18
BG-103PyriteProximalPrograde−2.73390 (1)−3.64±0.18
BG-102ChalcopyriteProximalPrograde−4.13390 (1)−5.04±0.18
BG-102AChalcopyriteProximalPrograde−4.23390 (1)−5.14±0.18
BG-33AChalcopyriteProximalPrograde−0.25390 (1)−1.16±0.18
BG-237F2PyriteProximalRetrograde−3.54323 (2)−4.67±0.23
BG-237F2PyriteProximalRetrograde−3.49323 (2)−4.62±0.23
BG-31APyriteProximalRetrograde−2.59323 (2)−3.72±0.23
BG-44PyriteProximalRetrograde−3.7323 (2)−4.83±0.23
BG-44PyriteProximalRetrograde−3.9323 (2)−5.03±0.23
BSD-1PyriteProximalRetrograde−3.64323 (2)−4.76±0.23
BSD-10PyriteProximalRetrograde−3.48323 (2)−4.61±0.23
BSD-11PyriteProximalRetrograde−4.08323 (2)−5.21±0.23
BSD-11PyriteProximalRetrograde−4.26323 (2)−5.39±0.23
BSD-8PyriteProximalRetrograde−3.01323 (2)−4.14±0.23
BG-31AChalcopyriteProximalRetrograde−2.67323 (2)−3.80±0.23
BSD-10ChalcopyriteProximalRetrograde−3.84323 (2)−4.96±0.23
BSD-8ChalcopyriteProximalRetrograde−3.41323 (2)−4.54±0.23
BG-100PyriteIntermediateRetrograde−9.44323 (2)−10.57±0.23
BG-101PyriteIntermediateRetrograde−8.92323 (2)−10.05±0.23
BG-205PyriteIntermediateRetrograde−5.72323 (2)−6.85±0.23
BSS-4PyriteIntermediateRetrograde−5.81323 (2)−6.94±0.23
BSS-5PyriteIntermediateRetrograde−5.46323 (2)−6.58±0.23
BSS-6PyriteIntermediateRetrograde−5.52323 (2)−6.65±0.23
BSS-6PyriteIntermediateRetrograde−5.59323 (2)−6.72±0.23
BG-101ChalcopyriteIntermediateRetrograde−8.87323 (2)−10.00±0.23
BG-205ChalcopyriteIntermediateRetrograde−5.79323 (2)−6.92±0.23
(1) Based on the average homogenous temperature of the garnet minerals in the endoskarn and prograde zones; (2) Based on the average homogenous temperature of the garnet, quartz, and calcite minerals in the retrograde zone; (3) Calculated using the sulfur isotope fractionation equations outlined by Czamanske and Rye [41] and Ohmoto and Rye [42].
Table 3. Carbon (δ13C) and oxygen (δ18O) isotope analyses of the calcite minerals from the different zones and rocks in the Yolindi Cu-Fe Skarn mineralization.
Sample IDZoneδ13C (‰VPDB)δ18O (‰SMOW)δ13CCO2 (‰) (1)δ18OH2O (‰) (2)
BG-41Prograde−1.986.22−8.796.07
BG-237ePrograde−2.646.26−9.456.11
BG-237d2Prograde−2.196.55−9.006.39
BSS-9Prograde0.099.05−6.728.84
BG-204bPrograde−1.6110.38−8.4210.14
BG-62Prograde−113.94−7.8113.61
BG-39APrograde−2.315.18−9.1114.82
BG-50Prograde−0.6518.14−7.4617.70
BG-39bPrograde−2.3511.60−9.1611.32
BG-39cPrograde−2.0113.80−8.8213.47
BG-39dPrograde−1.6612.50−8.4712.20
BSD-10Retrograde−3.230.94−10.040.92
BSD-1Retrograde−3.171.20−9.981.17
BG-35ARetrograde−2.491.56−9.301.52
BSD-14Retrograde−2.252.09−9.062.04
BSS-12Retrograde−3.82.97−10.612.90
BSS-13Retrograde−3.63.06−10.412.99
BSS-14Retrograde−33.12−9.813.05
BSS-15Retrograde−2.93.45−9.713.37
BSS-16Retrograde−2.763.62−9.573.53
BG-304Marble1.8921.73−4.9221.21
BG-305Marble2.2321.61−4.5821.10
BG-306Marble1.9621.71−4.8521.19
BG-307Marble2.0721.67−4.7421.15
BG-308Marble2.1621.63−4.6521.12
(1) Equation of carbon isotope for calcite, as discussed by Scheele and Hoefs [44]. (2) Equation of oxygen isotopic fractionation of calcite-water, as outlined by O’Neil et al. [45].
Disclaimer/Publisher’s Note: The statements, opinions and data contained in all publications are solely those of the individual author(s) and contributor(s) and not of MDPI and/or the editor(s). MDPI and/or the editor(s) disclaim responsibility for any injury to people or property resulting from any ideas, methods, instructions or products referred to in the content.

