Article

The Effect of Thermal Maturity on the Pore Structure Heterogeneity of Xiamaling Shale by Multifractal Analysis Theory: A Case from Pyrolysis Simulation Experiments

1
Shale Gas Institute, PetroChina Southwest Oil & Gas Field Company, Chengdu 610056, China
2
Unconventional Oil and Gas Science and Technology Research Institute, China University of Petroleum, Beijing 102249, China
3
State Key Laboratory of Petroleum Resources and Prospecting, China University of Petroleum, Beijing 102249, China
4
PetroChina Southwest Oil & Gas Field Company, Chengdu 610056, China
*
Authors to whom correspondence should be addressed.
Minerals 2023, 13(10), 1340; https://doi.org/10.3390/min13101340
Submission received: 3 August 2023 / Revised: 14 October 2023 / Accepted: 16 October 2023 / Published: 19 October 2023

Abstract

:
Shale oil and gas, as source-reservoir-type resources, result from organic matter hydrocarbon generation, diagenesis, and nanoscale pore during the evolution processes, which are essential aspects of shale gas enrichment and reservoir formation. To investigate the impact of diagenetic hydrocarbons on shale pore heterogeneity, a thermal simulation of hydrocarbon formation was conducted on immature shale from the Middle Proterozoic Xiamaling Formation in the Zhangjiakou area, covering stages from mature to overmature. Nuclear magnetic resonance (NMR) instruments analyzed the microstructure of the thermally simulated samples, and the multifractal model quantitatively assessed pore development and heterogeneity in the experimental samples. The results reveal that the quartz and clay mineral contents show alternating trends with increasing temperature. Organic matter dissolution intensifies while unstable mineral content decreases, promoting clay mineral content development. Pyrolysis intensity influences Total Organic Carbon (TOC), which reduces as hydrocarbons are generated and released during simulation. Porosity exhibits a decreasing–increasing–decreasing trend during thermal evolution, peaking at high maturity. At maturity, hydrocarbon generation obstructs pore space, resulting in higher levels of bound fluid porosity than those of movable fluid porosity. Conversely, high maturity leads to many organic matter micropores, elevating movable fluid porosity and facilitating seepage. Shale pore heterogeneity significantly increases before 450 °C due to the dissolution of pores and the generation of liquid and gas hydrocarbons. In the highly overmature stage, pore heterogeneity tends to increase slowly, correlated with the generation of numerous micro- and nano-organic matter pores.

1. Introduction

With the exponential progress of horizontal drilling technology and extensive hydraulic fracturing techniques, shale oil and gas have achieved remarkable commercial triumphs in the domain of unconventional oil and gas exploration and development. Micro- and nano-pore spaces within shale reservoirs have increasingly captivated scholarly interest as they are considered fundamental in the storage of shale oil and gas [1,2,3,4]. In contrast to conventional reservoirs, nanoscale shale reservoir spaces exhibit a diverse range of pore size distribution, intricate pore shapes, and pronounced heterogeneity, imposing significant constraints on the efficient exploitation of shale gas [4,5,6,7]. Abundant evidence indicates that the intricate pore structure of shale is frequently synergistically governed by factors such as sedimentation and diagenesis, organic matter hydrocarbon generation, and drainage [8,9,10,11,12,13,14,15].
Thermal maturity exerts a more pronounced influence on the evolution of organic matter porosity than diagenesis on the brittle rock skeleton [12,13,16,17,18,19]. Firstly, the thermal maturation of organic matter (OM) governs the development of the organic matter pore network and significantly affects the shale reservoir capacity and microscopic storage mechanisms [20,21,22]. Secondly, organic matter maturity dictates the stage of shale hydrocarbon evolution, thereby determining the efficiency of shale hydrocarbon generation and release [10,23]. Hence, investigating the hydrocarbon generation and pore system evolution in shales at various stages of development holds immense importance in comprehending the mechanism behind shale gas enrichment and advancing the exploration and development of these formations.
A series of novel experiments have been used to study shale pore characteristics for shale reservoirs. Utilizing cutting-edge techniques such as optical microscopy (OM), scanning electron microscopy (SEM), and focused ion beam scanning electron microscopy (FIB-SEM), these experiments characterize pore morphology, surface porosity, pore connectivity, and other crucial attributes [6,24,25,26,27,28]. Simultaneously, the fluid injection technique was employed to derive the injected fluid volume and rate from various experimental approaches such as gas adsorption, mercury intrusion capillary pressure (MIP), nuclear magnetic resonance (NMR), and small/ultra-small-angle neutron scattering (SAXS/USAXS). These methodologies were utilized to calculate and obtain pertinent data regarding pore volume, pore surface area, average pore diameter, and pore size distribution [4,6,10,25,28,29,30]. In previous studies, the fractal attributes of the pores were investigated by establishing a power function correlation between the probing scales (relative pressure, transverse relaxation time, detection volume, capillary pressure) and the corresponding probing volumes (adsorption, Hg feed, cumulative saturation) [6,18,31,32]. For shale reservoirs, the fractal dimension is often used to represent the pore surface roughness and the heterogeneity characteristics of the pore structure [7,14,29,31,33]. However, the single fractal dimension proves insufficient in precisely depicting the heterogeneity features, and a multitude of parameters merely partially reflect the pore characteristics and fail to characterize the pore properties adequately. Multifractals, serving as extensions or superpositions of single fractal dimensions, not only enable the definition of system heterogeneity through the continuous dimensional spectrum but also provide adequate characterization for minor local variations [5,7,27,31,34]. In recent years, multifractals have been widely used in the Bakken Formation of the Williston Basin, the Shahezi Formation of the Songliao Basin, the Shahejie Formation of the Dongying Depression, and the Wufeng–Longmaxi Formation of the Sichuan Basin utilizing quantitative image analyses and pore structure data [6,7,27,31].
In recent years, the study of diagenetic processes and evolutionary mechanisms in organic matter-rich shale reservoirs has received increasing attention from geologists [8,9,11,35,36]. Currently, related studies are predominantly conducted through two approaches. The first method involves selecting mature samples and utilizing high-resolution scanning electron microscopy to observe these samples directly. This enables the analysis of vital aspects, such as the evolution of organic–inorganic pores, clay mineral transformations, and kerogen structure evolution, by comparing the pore morphology at various stages of thermal development [15,33,36,37,38]. However, this method overlooks the variations in the regional geological system and pore space heterogeneity within the geological background. Additionally, it fails to address the influence of tectonic deformation and fracture systems on the pore structure. As a result, direct observations do not unveil the entirety of the evolution of pore characteristics during shale hydrocarbon production. The second approach involves artificial maturation, wherein a low-maturity sample is carefully chosen, and a temperature sequence is applied to induce hydrocarbon production, enabling the quantification of pore evolution at different stages. Prior research has demonstrated that hydrocarbon thermal simulation experiments serve as vital tools in investigating hydrocarbon source rocks and assessing hydrocarbon resources [14,20,22,37,39,40,41]. They are instrumental in resolving critical hydrocarbon generation and depletion issues. Despite overcoming the challenges posed by sample heterogeneity, this method falls short of providing direct observations of pore morphology. It is impossible to quantitatively analyze the relationship between mineral and pore evolution characteristics within the same field of view and the pore morphology through fluid injection [8,12,18,19,35,42]. A series of results have been obtained regarding pore structure characteristics through thermal simulation experiments, but there is a lack of research on shale pore heterogeneity under conditions of diagenetic processes and hydrocarbon generation. There are limited investigations on the correlation between pore heterogeneity and hydrocarbon production and drainage, particularly concerning the thorough characterization of multifractal parameters during shale’s thermal evolution. This inadequacy significantly impedes the comprehensive evaluation of shale reservoirs and hydrocarbon storage.
In this study, Middle Proterozoic Xiamaling shale, selected as a representative low-maturity shale, underwent high-temperature thermal simulation experiments to induce hydrocarbon generation at high maturity and overmaturity. These experiments, coupled with NMR, mineral analysis, and organic geochemistry, were employed to delineate the mineralogical and petrographic attributes as well as the evolution of the pore system. In addition, multifractal theory is utilized to study the pore structure heterogeneity characteristics at different thermal evolution stages, and a pore system evolution model is built. This comprehensive investigation seamlessly integrates the organic matter hydrocarbon generation process and pore heterogeneity, clarifying the favorable reservoir stages in shale evolution and addressing the previously underexplored changes in shale pore system heterogeneity. The findings from this study hold significant relevance for the exploration of highly mature and overmature marine shale gas, not only in China but also in other regions worldwide.

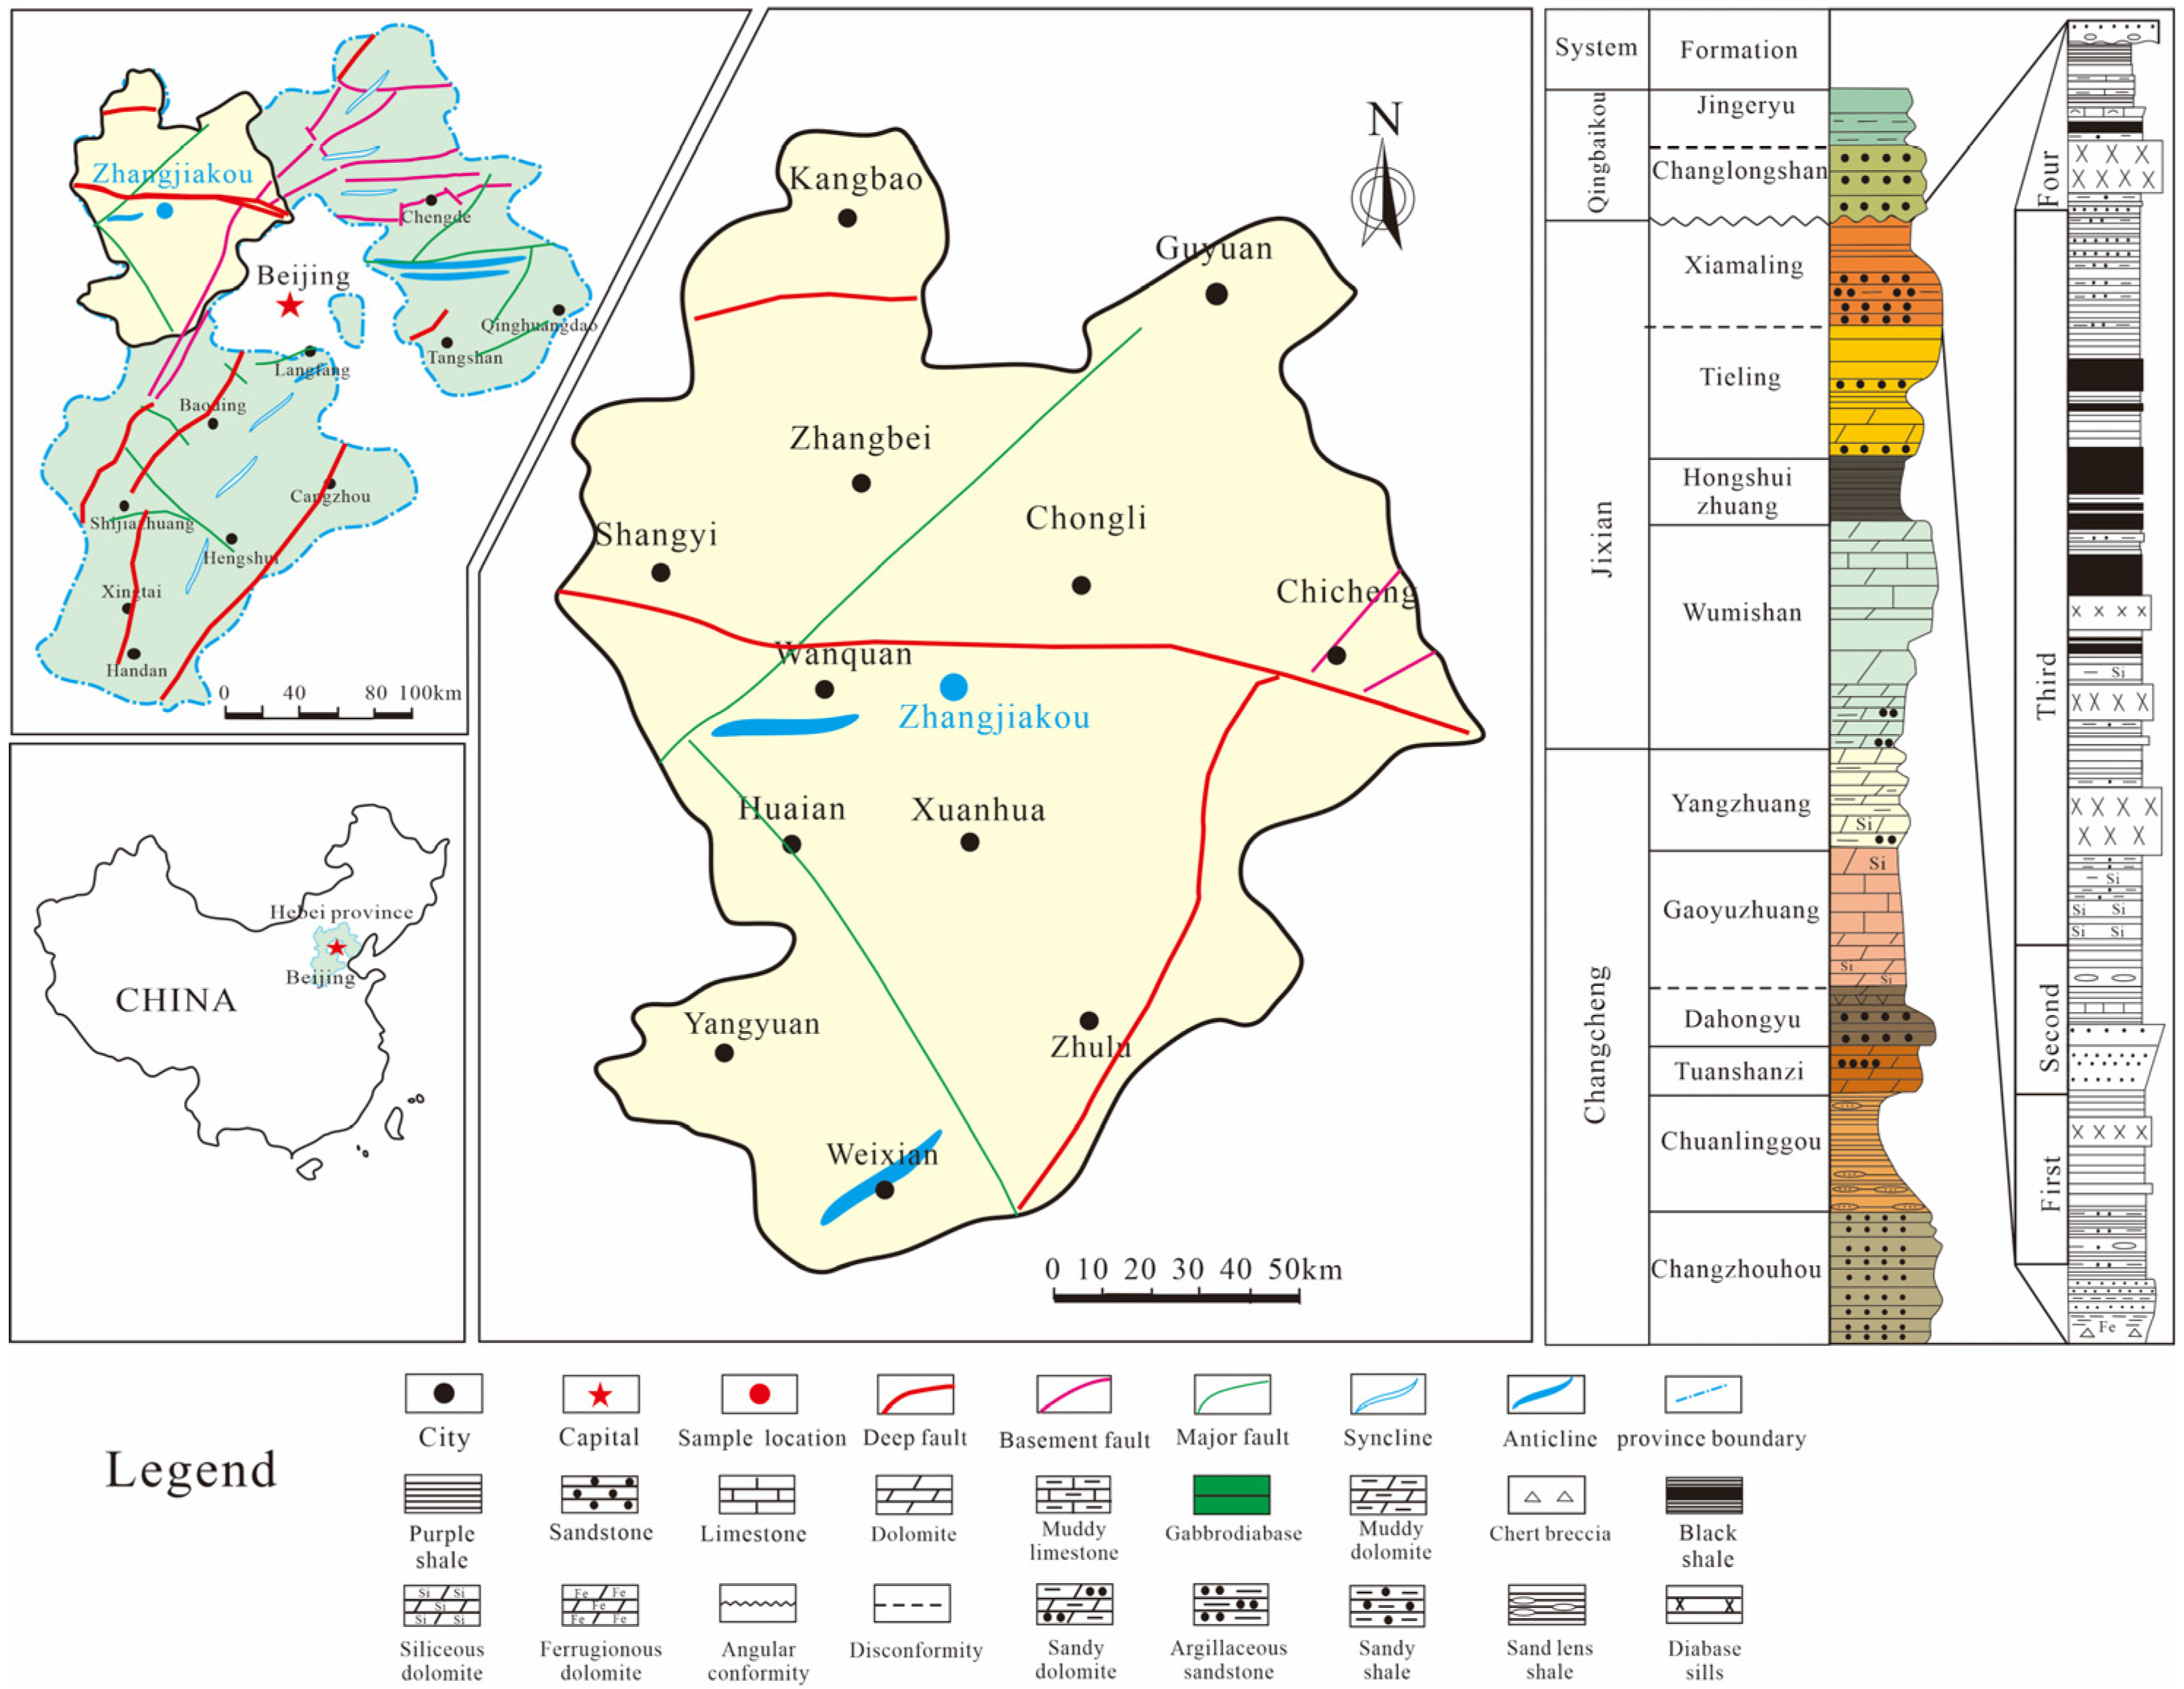
2. Geological Settings

The study area lies within the Zhangjiakou region of Hebei Province, bounded by the Kangbao–Weichang deep fault. It is bordered in the north by the Inner Mongolia–Xing’an plate and in the south by the relatively rigid North China plate (Figure 1). The Yanshan Fold Belt is situated in the central part of Hebei Province and represents one of the most extensively developed intraplate tectonic regions. During the Early Indosinian period, the tectonic direction was predominantly east–west (EW) with a relatively large scale, extensive range, and early formation, thereby influencing the tectonic structure in subsequent stages [12,24,35,43]. The Yanshan Fold Belt, being one of the most developed intraplate tectonic regions, exhibits a combination of NNE- and NS-trending tectonics, along with predominant EW-trending tectonics, which collectively define the primary tectonic features of this area. The deformation in this zone occurred after the Yanshan movement and is characterized by NE- and NNE-striking faults of considerable scale, widely distributed throughout the region [35].
North China is one of the most flourishing and remarkably preserved regions of Middle Neoproterozoic sedimentation in China. Within the Middle Neoproterozoic, the Great Wall System, the Jixian System, and the Qinbaikou System comprise 12 groups. The Jixian Group, in particular, encompasses the Wumishan Formation, the Hongshuizhuang Formation, the Tieling Formation, and the Xiamaling Formation. Measured sections of the Xiamaling Formation at Zhaojiashan, Huailai, reveal that this lower stratum was deposited in a tranquil sedimentary water environment, characterized by dark-colored shales interspersed with thin-slabbed siltstones and argillaceous siltstones as well as sandstone turbidites [35,43,44]. The predominant sediments in the Xiamaling Formation are shallow marine shelf deposits, followed by barrier coastal deposits. From the bottom to top, the sandstone exhibits an increase in coarseness and thickness of grain size. Notably, sea chlorite is observed in the sandstone layer at the bottom and within the middle, indicating the depositional environment as a barrier-free coastal stage [12,35,44].
Xiamaling Formation shale hosts the most intricate and exquisitely preserved stratigraphy of Mesopotamia in China [43]. Notably, it represents the earliest example of low-maturity marine shale in China and stands as one of the oldest marine shales discovered globally [12,43]. During the Late Carboniferous period, the Xiamaling Formation in the Zhangjiakou area underwent deposition, embracing a ground temperature gradient of approximately 24 °C per kilometer. It experienced relatively low burial temperatures (≤90 °C) throughout this process and underwent maturation, progressing from immature to early thermal maturity.

3. Samples and Methods

3.1. Samples and Experiments

In this paper, marine shale of the Middle Proterozoic Xiamaling Formation in the Xiahuayuan District of Zhangjiakou, Hebei Province, China, was used as the original sample for the thermal evolution simulation experiment. The TOC of the shales from the Xiamaling Formation ranges from 1.17% to 6.74%, with an average of more than 4.5%; vitrinite reflectance is the lowest at about 0.6%, kerogen type is dominated by type I-II1, and the mineral composition is dominated by quartz and illite [10,12,35]. For the purpose of this study, a low-maturity, organic matter-rich sample was collected from the Middle Proterozoic Xiamaling Formation in the Xiahuayuan District of Zhangjiakou, Hebei Province, China.
Shale outcrops of the Xiamaling Formation in the field were selected, and 9 core columns were obtained in the horizontal lamination direction in order to avoid the effect of shale pore heterogeneity. At the end of the thermal simulation experiments, organic geochemical and petrological measurements were carried out for each sample to obtain the geochemical parameters and mineralogical compositions of the different degrees of thermal evolution. In order to study the characteristics of shale pore structure, saturation and centrifugal NMR experiments were used to obtain the fluid mobility characteristics of different stages of thermal evolution and combined with the theory of multiple fractals to study the change characteristics of pore heterogeneity. The specific research flow can be seen in the flow chart of Figure 2.
Basic geochemical experiments and mineralogical analysis were performed at the State Key Laboratory of Oil and Gas Resources and Exploration, China University of Petroleum (Beijing). An XRD experiment was conducted to determine the mineral composition of the rock samples using a Bruker D8 Advance X-ray diffractometer with 45 KV Co Ka rays. The TOC test was performed on a Leco CS230 analyzer, and the samples were ground to about 100 μm before the test; the pyrolysis test was performed on an OGE-II analyzer.
Nuclear magnetic resonance (NMR) tests were performed on a RecCore-2500 instrument with a magnetic field at a resonance frequency of 2.38 MHz and a field strength of 0.12 T. The parameters of this NMR experiment were as follows: return interval of 0.2 ms; waiting time of 6 s; number of scans = 64; number of returns = 1024; experimental temperature of 25 °C; and humidity of 55%. The samples were individually centrifuged at 300 Psi to reach the critical bound saturated state and subsequently tested again by NMR to obtain the T2 spectra of all samples under bound water conditions.
Typically, the T2 spectrum of NMR is used to calculate porosity. Theoretically, the water-saturated porosity obtained by weighing is equivalent to the NMR porosity (φNMR). Generally, NMR porosity is divided into movable water porosity (φF) and bound water porosity (φB) based on the NMR porosity (saturated porosity) results.
φ F = φ N M R F F I F F I + B V I
φ B = φ N M R B V I F F I + B V I
where φNMR is the nuclear magnetic porosity (full water porosity), %; flexible fluid saturation (FFI) represents the region between the saturated water state and the curve after centrifugal treatment (percentage of connected pores in the sample) [45]. Bound fluid saturation (BVI) represents the region between the sample test curve after centrifugal treatment and the cross-axis (100-FFI); φF is the movable fluid porosity. The T2 spectra in the saturated and centrifuged states were converted to the cumulative porosities in the saturated and centrifuged states, corresponding to BVI + FFI, respectively. The resulting porosities correspond to BVI + FFI, total porosity (φNMR), and FFI porosity (φF). The BVI porosity (φF) is the difference between φNMR and φF.

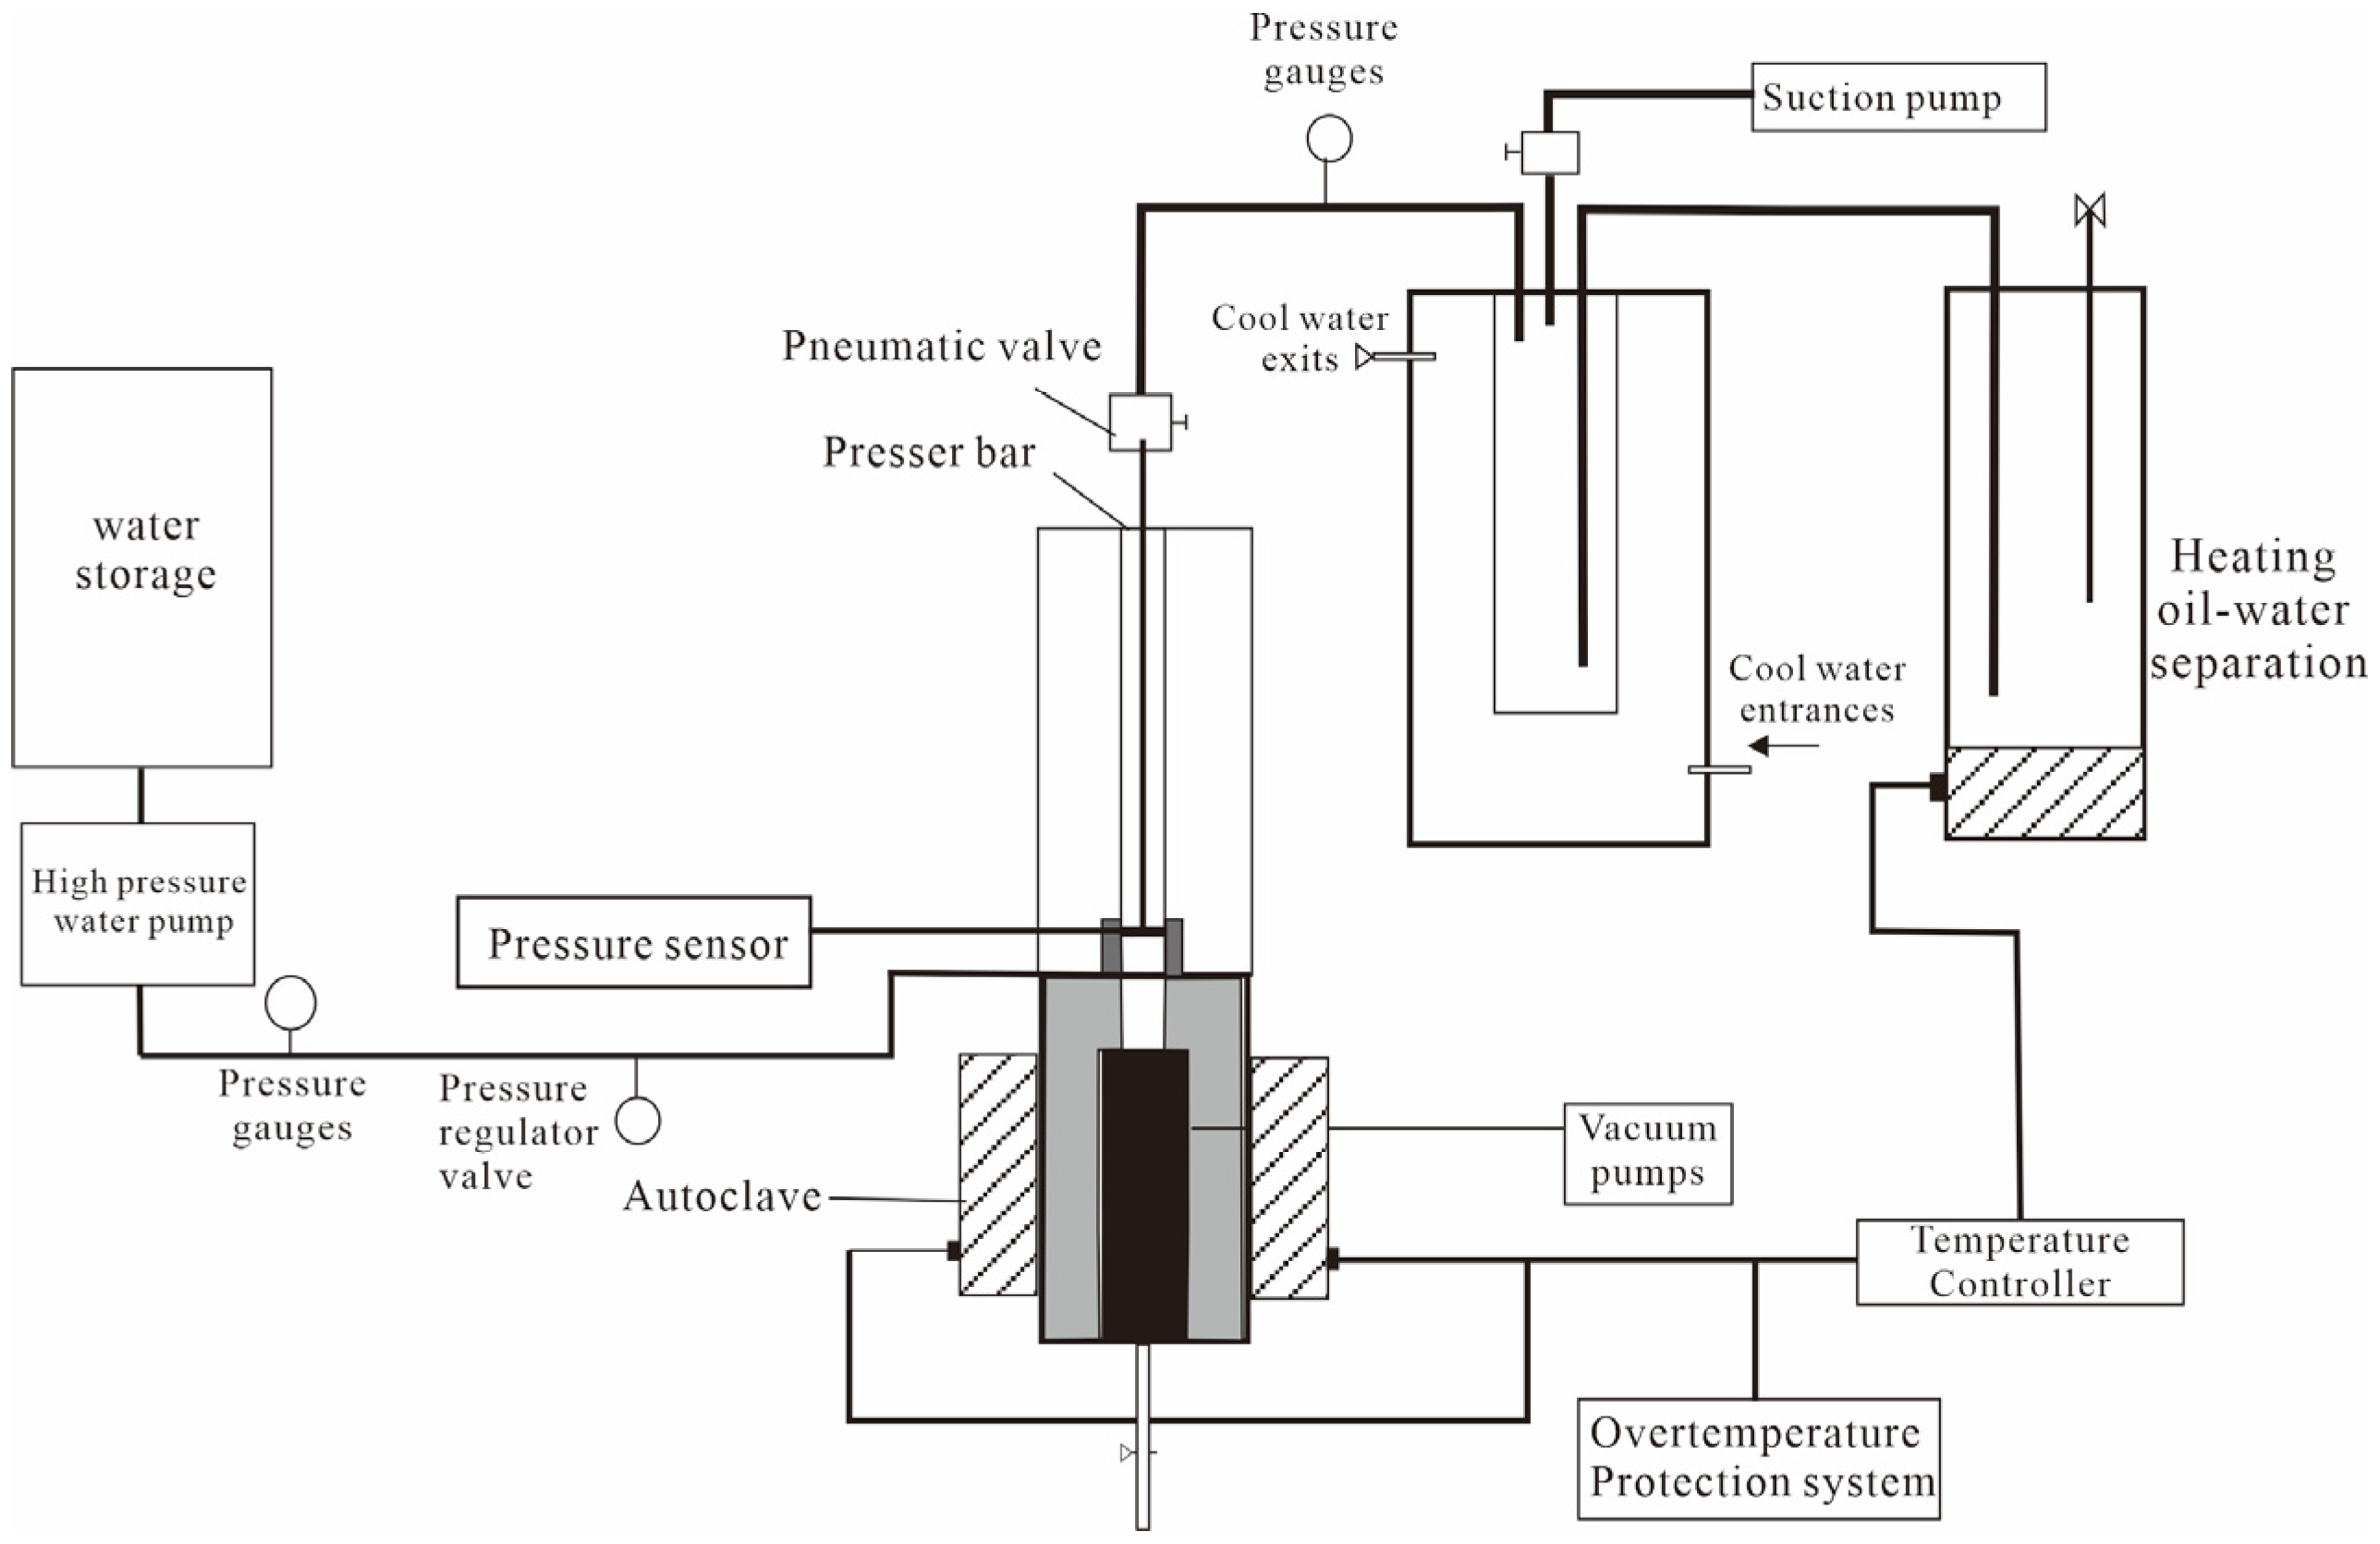
3.2. Hydrous Pyrolysis Experiments

Thermal simulation experiments on shale were conducted at the Institute of Unconventional Oil and Gas Science and Technology, China University of Petroleum (Beijing). The experimental setup, graciously provided by Jiangsu Hongbo Machinery Manufacturing Co., Ltd., Nantong, China, consists of four sets of heating core components, allowing for simultaneous multi-sample and multi-temperature point heating (Figure 3). The chosen thermal simulation system operates in an open setup. Different maturity degrees of shale samples were obtained by subjecting them to varying temperature points, following Sweeney and Burnham Easy Ro% parameter at a fixed rate of 10 °C/h under 5 MPa of hydrostatic pressure [46].
The specific experimental procedure is as follows:
(1) An original sample of lower-maturity, organic matter-rich marine shale from the Xiamaling Formation was selected and divided into eight parts. Drilling columns in the horizontal laminar direction maximizes overcoming the heterogeneity of the shale;
(2) Before the experiment, the samples were thoroughly washed with water. The initial temperature of heating was 425 °C and the ending temperature was 600 °C. The sample type was a standard core column of 5 cm length and 2.5 cm diameter. Static rock pressure was added during the experiment, but no fluid pressure or water was added. Based on the results of the Easy Ro% equivalent vitrinite reflectance, the samples were heated to different temperatures to create a series of highly mature to overly mature thermal simulation samples;
(3) After the simulation, sample residues were collected and weighed for further geochemical and petrographic tests for NMR analysis. The porosity evolution was controlled by heating time (temperature), assuming constant variability, heating rate, and heating environment.

3.3. Multifractal Theory

Multifractals can be viewed as an extension of fractal theory sued to study the normalized probability distribution of a target over a test range. In contrast to single fractal dimensions, the multifractal approach uses generalized fractal dimension spectra and multifractal singularity spectra to characterize multifractal features [47,48].
Multifractals are described in detail in some works in the literature. First, the pore size distribution curve was log-transformed over the test intervals into a dimensionless interval with 100 equidistant lengths J.
φ i = log ϕ i / ϕ 1 ,   i = 1,2 ,
where ϕ i is the pore size measured, nm; ϕ 1 is the minimum detection pore size, nm; φ i is the dimensionless value transformed for the PSD detection range. In interval J, the interior of the PSD interval has K(ε) = 2k subintervals of length ε. The interpolation method allows the inclusion of at least 1 measurement in each subinterval. K i ε is the probability density (percentage) of the pore size distribution inside each subinterval, and a family of partition functions is constructed for N i ε :
u i ( q , ε ) = K i ( ε ) i 1 N ( ε ) K i ( ε )
where u i ( q , ε ) is the q-order probability value of the i-th subinterval in the PSD data and i 1 N ( ε ) K i ( ε ) is the sum of the q-order probabilities of all subinterval values.
Therefore, the multifractal generalized dimension spectrum Dq of PSD is formulated as [49]:
D q = 1 q 1 Lim ε 0 log K q ( ε ) log ε ,   q 1 Lim ε 0 i = 1 K ( ε ) ( P i ( ε ) ln P i ( ε ) ) ln ε ,   q = 1
where q = 0, 1, and 2. The corresponding D0, D1, and D2 represent the capacity, information entropy, and association dimensions, respectively [49]. For partitions of size ε, the probability of quality on a given partition compared to the sum of possibilities on the total partition can be quantified as:
u i ( q , ε ) = P i ( ε ) q K q ( ε )
where the multifractal singularity index α ( q ) [47] is:
α q = Lim ε 0 i = 1 N ( ε ) u i ( q , ε ) log P i ( ε ) log ε
The multifractal spectral function f(α(q)) for the PSD particle size distribution of α(q) can be written as [47]:
f ( α ( q ) ) = lim ε 0 i = 1 N ( ε ) u i ( q , ε ) log u i ( q , ε ) log ε
In summary, the multifractal spectrum α ~ f ( α ) and the generalized dimension spectrum q~Dq are two different sets of parameters that characterize fractals.

4. Results

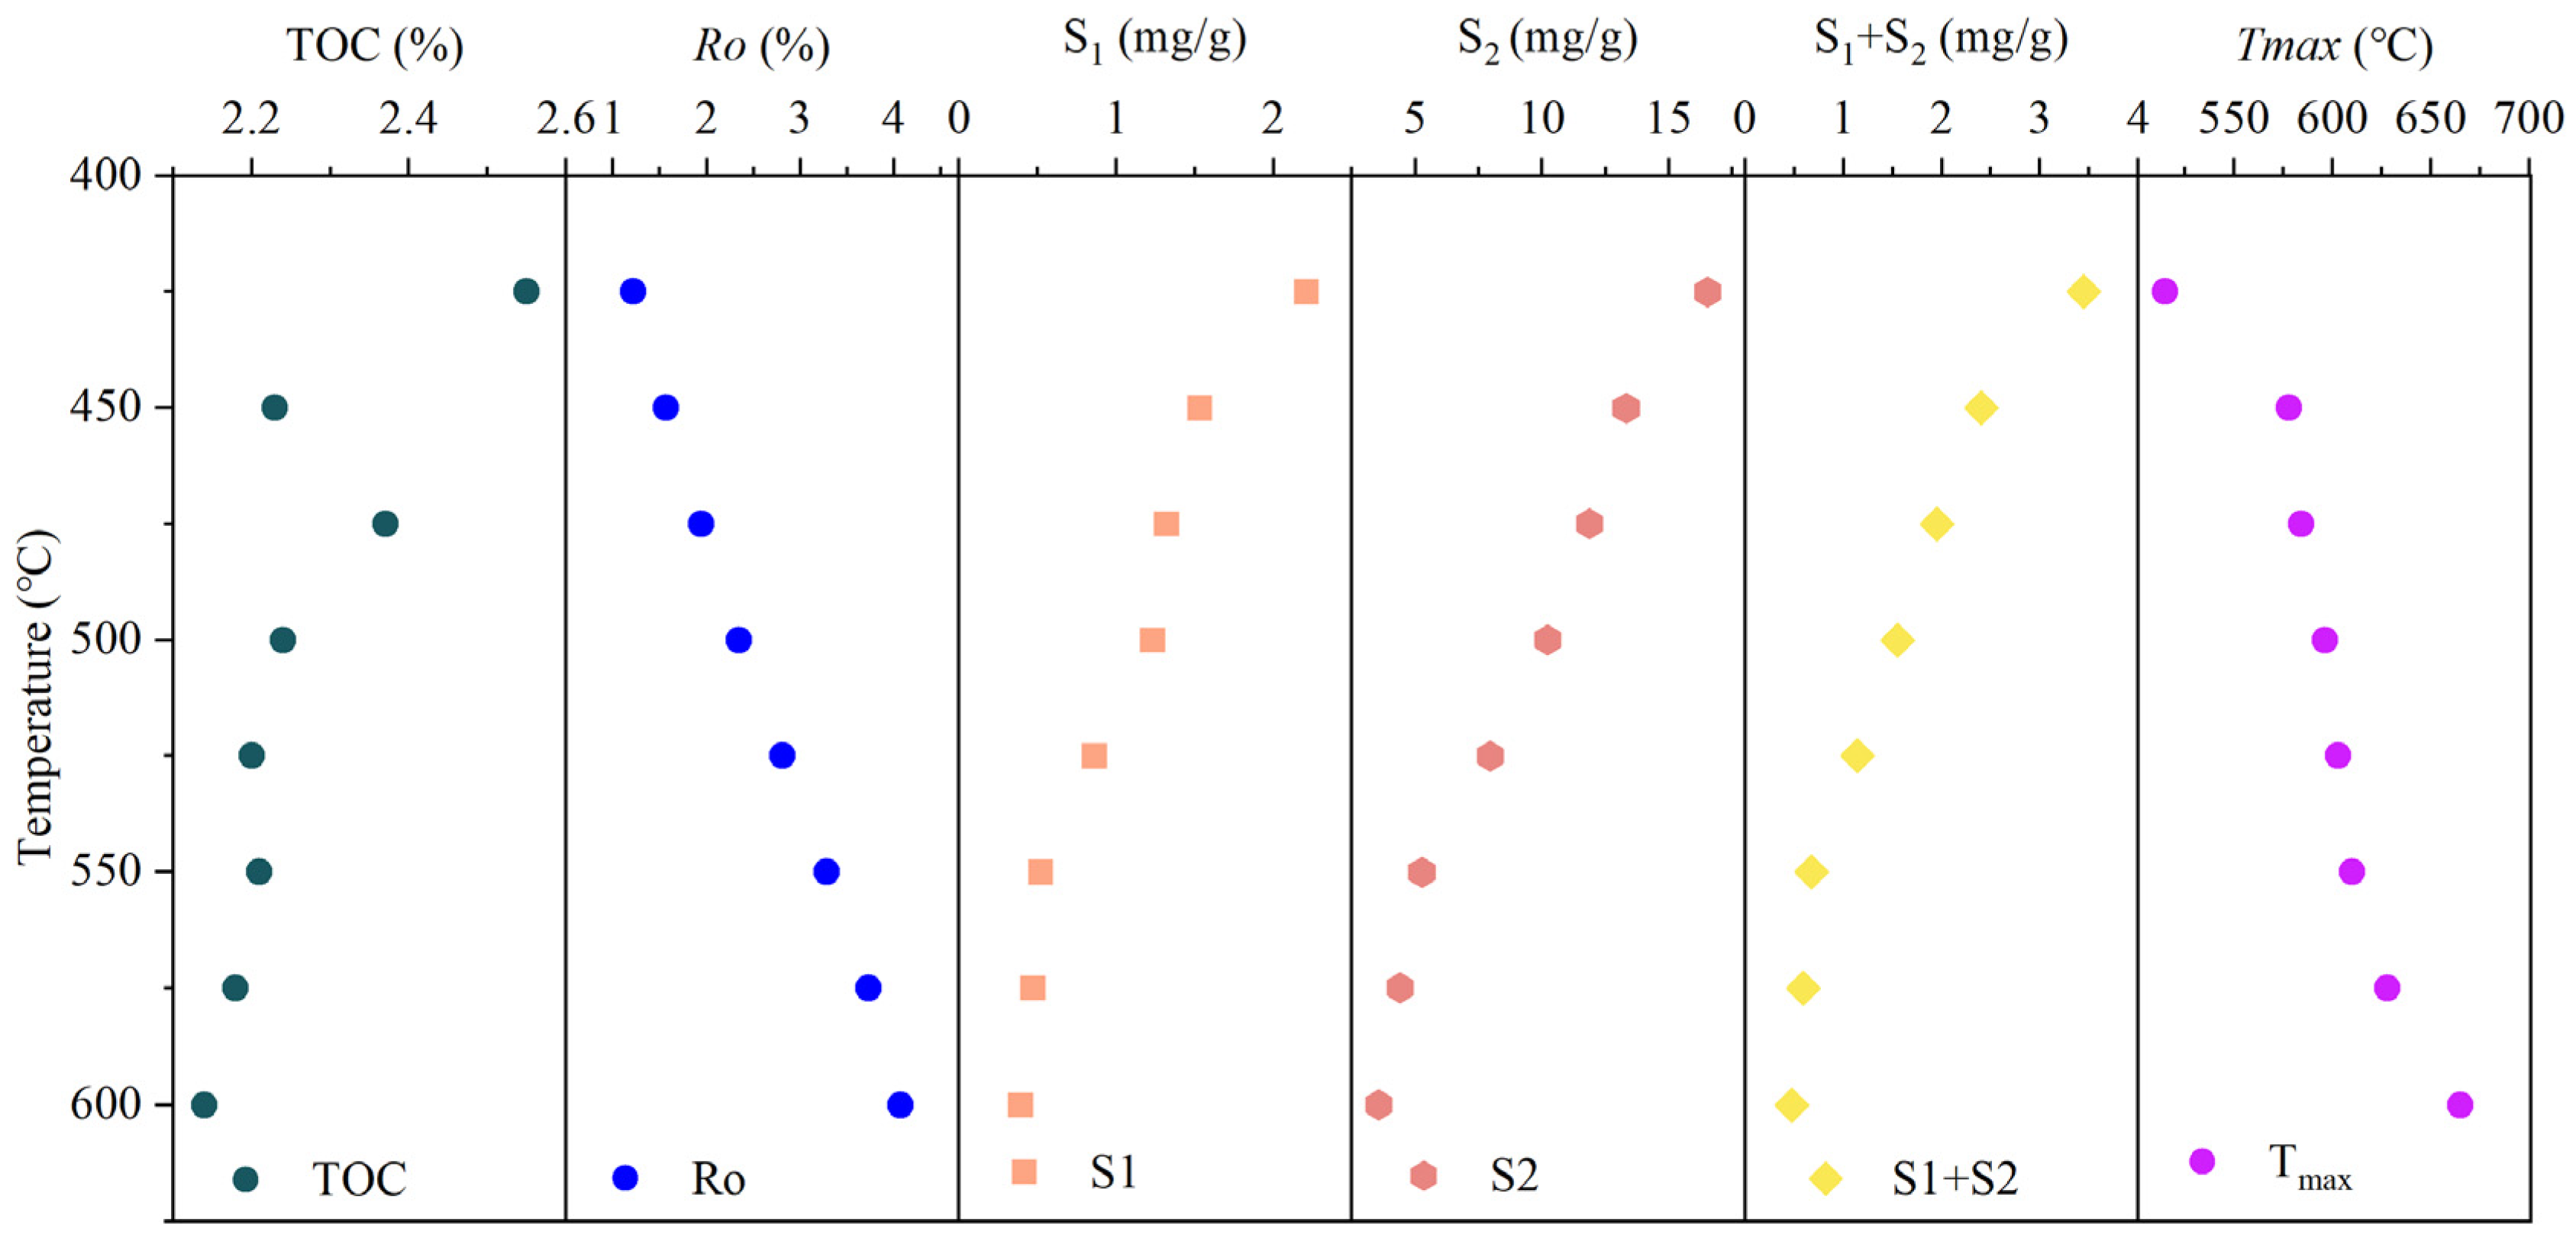
4.1. Mineral Composition and Organic Geochemistry
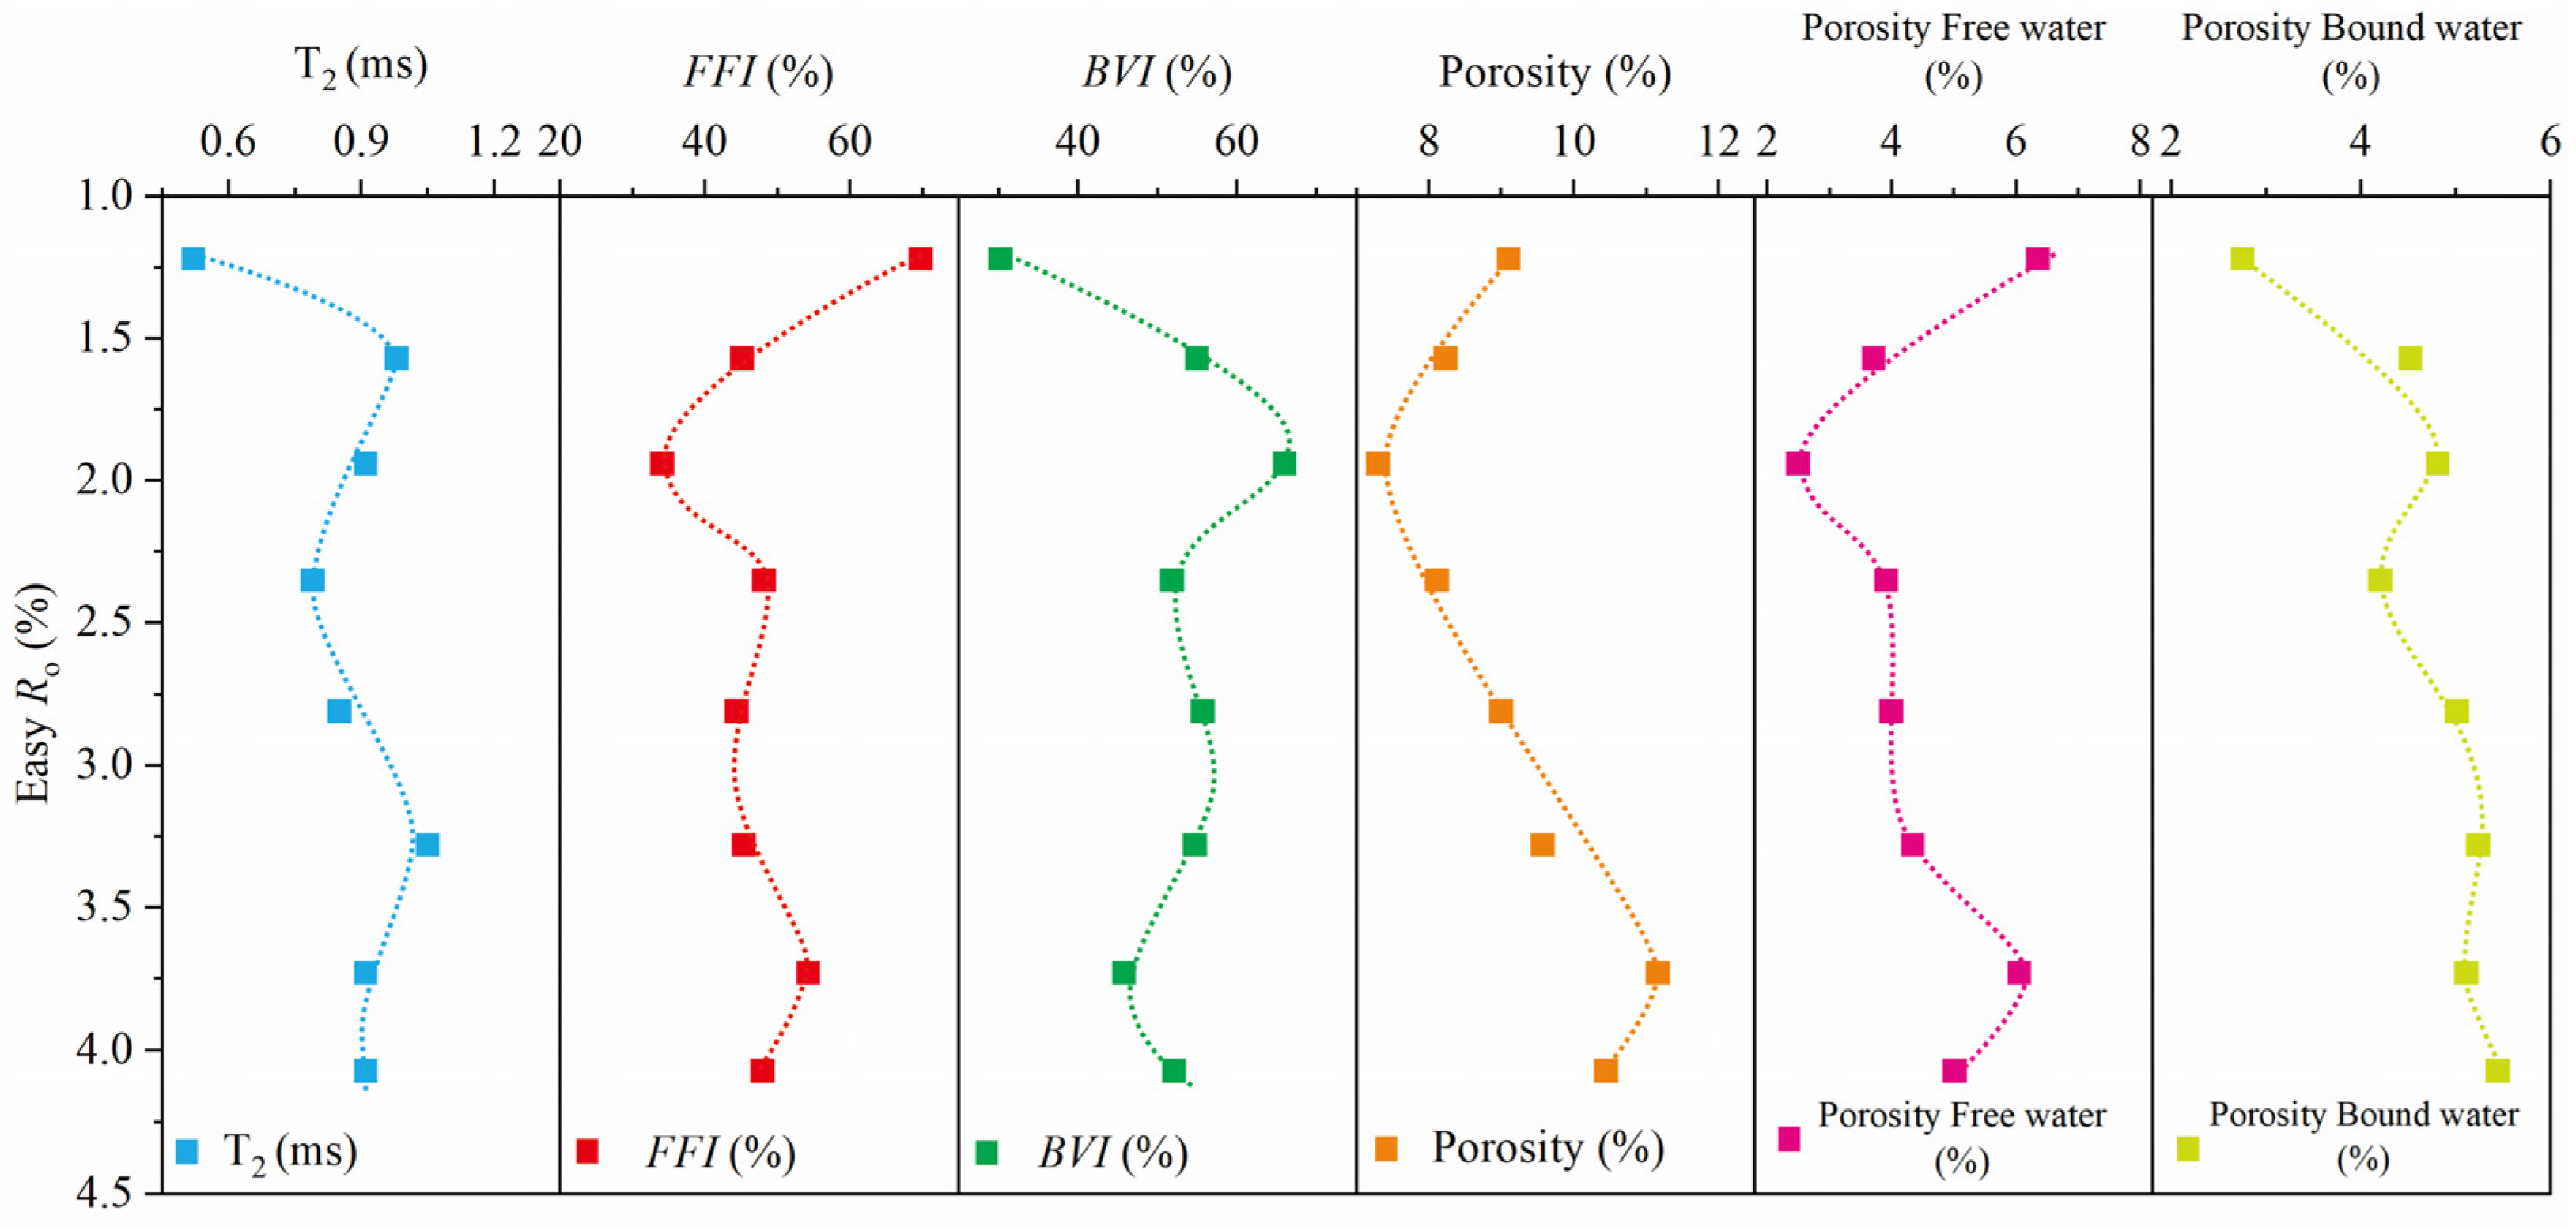
In this investigation, a meticulous examination was conducted on the geochemical attributes of samples Z0 to Z8. In particular, the original sample Z0 and the other samples (Z1 to Z8) were used for thermal simulation experiments. In this study, geochemical parameters of shale organic matter were obtained through experiments determining TOC, S1, S2, and Tmax. S1 represents the number of free hydrocarbons in the rock (mg HC/g rock); if S1 > 1 mg/g, it indicates that there may be oil. S2 represents the number of rock pyrolysis hydrocarbons (mg HC/g rock); S2 represents the hydrocarbon generation potential of the source rock during the thermal evolution process. S1 + S2 is usually used to represent the hydrocarbon generation potential. Tmax is the temperature at which casein cleavage produces the maximum content of hydrocarbons (i.e., the highest point of the S2 peak), which is indicative of the thermal maturity of the organic matter. Table 1 shows a substantial Total Organic Carbon (TOC) content of 3.76%, with S1 registering at 0.98 mg/g and S2 at 25.43 mg/g of the Z0 sample. These results indicate that the original shale possesses an abundant OM and exhibits promising potential for hydrocarbon production. Tmax indicates the temperature corresponding to the maximum content of hydrocarbons produced by kerogen cracking, which can indicate the thermal maturity of OM. Sample Z0 displayed an EqRo of 0.56% and a Tmax of 431 °C, signifying a state of low maturity. As the temperature increased, the maturity progressed from 1.22% to 4.07%, indicating a transition from maturity to an overmature gas generation stage during the simulation.
At the end of the hydrocarbon thermal simulation experiment, EqRo rose to 4.07% with a Tmax of 634 °C. A notable reduction in the TOC content and S1 + S2 content between the simulated samples was observed as the maturity level increased, indicating the generation and expulsion of hydrocarbons during the simulation process. According to previous studies, the main maceral composition in this region is amorphous teleosts and lamellae, which appear flocculent, lamellar, and striated [35]. The maceral composition type is type II, indicating that OM generates hydrocarbons during deposition [43,44].
Table 2 illustrates the mineral compositions of the Xiamaling samples and their corresponding thermal simulations. The initial samples contained significant amounts of quartz (58.1%), less clay minerals (16.1%), and levels of pyrite below 5%. Throughout the simulation process, some minerals changed slightly, with the content of quartz gradually decreasing with maturity and the content of clay minerals slightly increasing. This may be due to the release of K ions from potassium feldspar after being subjected to organic acid dissolution during hydrocarbon production; at the same time, K+ ions, the illite/smectite mixed layer, and kaolinite can further evolve into illite, resulting in an increase in the content of clay minerals [50].

4.2. NMR Parameters

In this experiment, the T2 spectra measured in the saturated water state are presented (Figure 4). Shale exhibits two main types of T2 spectra: single-peak and bimodal. Previous studies have revealed that most shale samples possess single-peak T2 spectra, primarily comprising adsorption pores [51]. These spectra display isolated peaks with short relaxation times, typically ranging from 0.01 to 10 ms. Both single-peak and bimodal T2 spectra indicate that shale porosity is dominated by micropores, while bimodal shales show better-developed connecting pores compared to single-peak ones. In this study, the T2 spectra were predominantly bimodal, with the right peak (10–100 ms) significantly smaller than the left peak (0.01–10 ms). This indicates the presence of well-developed small pores, some mesopores, and macropores in the shale.
Bimodal T2 spectra can be categorized into continuous and discontinuous types based on the presence or absence of interrupted curves. Continuous bimodal T2 spectra suggest that shale reservoir micropores are well connected to macropores or even microfractures. On the other hand, discontinuous bimodal T2 spectra indicate relatively closed pores with weak connections between different scales of pores. The NMR T2 distributions of the natural shale samples from Xiamaling (Figure 4) show that all samples are characterized by a single peak, with T2 values predominantly ranging from 0.1 to 10 ms. This observation suggests that the shale porosity is predominantly micro–mesoporous, with fewer macropores, during thermally simulated evolution. The pore spaces in the Xiamaling shale are mainly distributed in the range of 0.1–10 ms, with discontinuous curves in the bimodal T2 spectra, indicating weak connectivity between pores of different scales, which may hinder fluid diffusion.

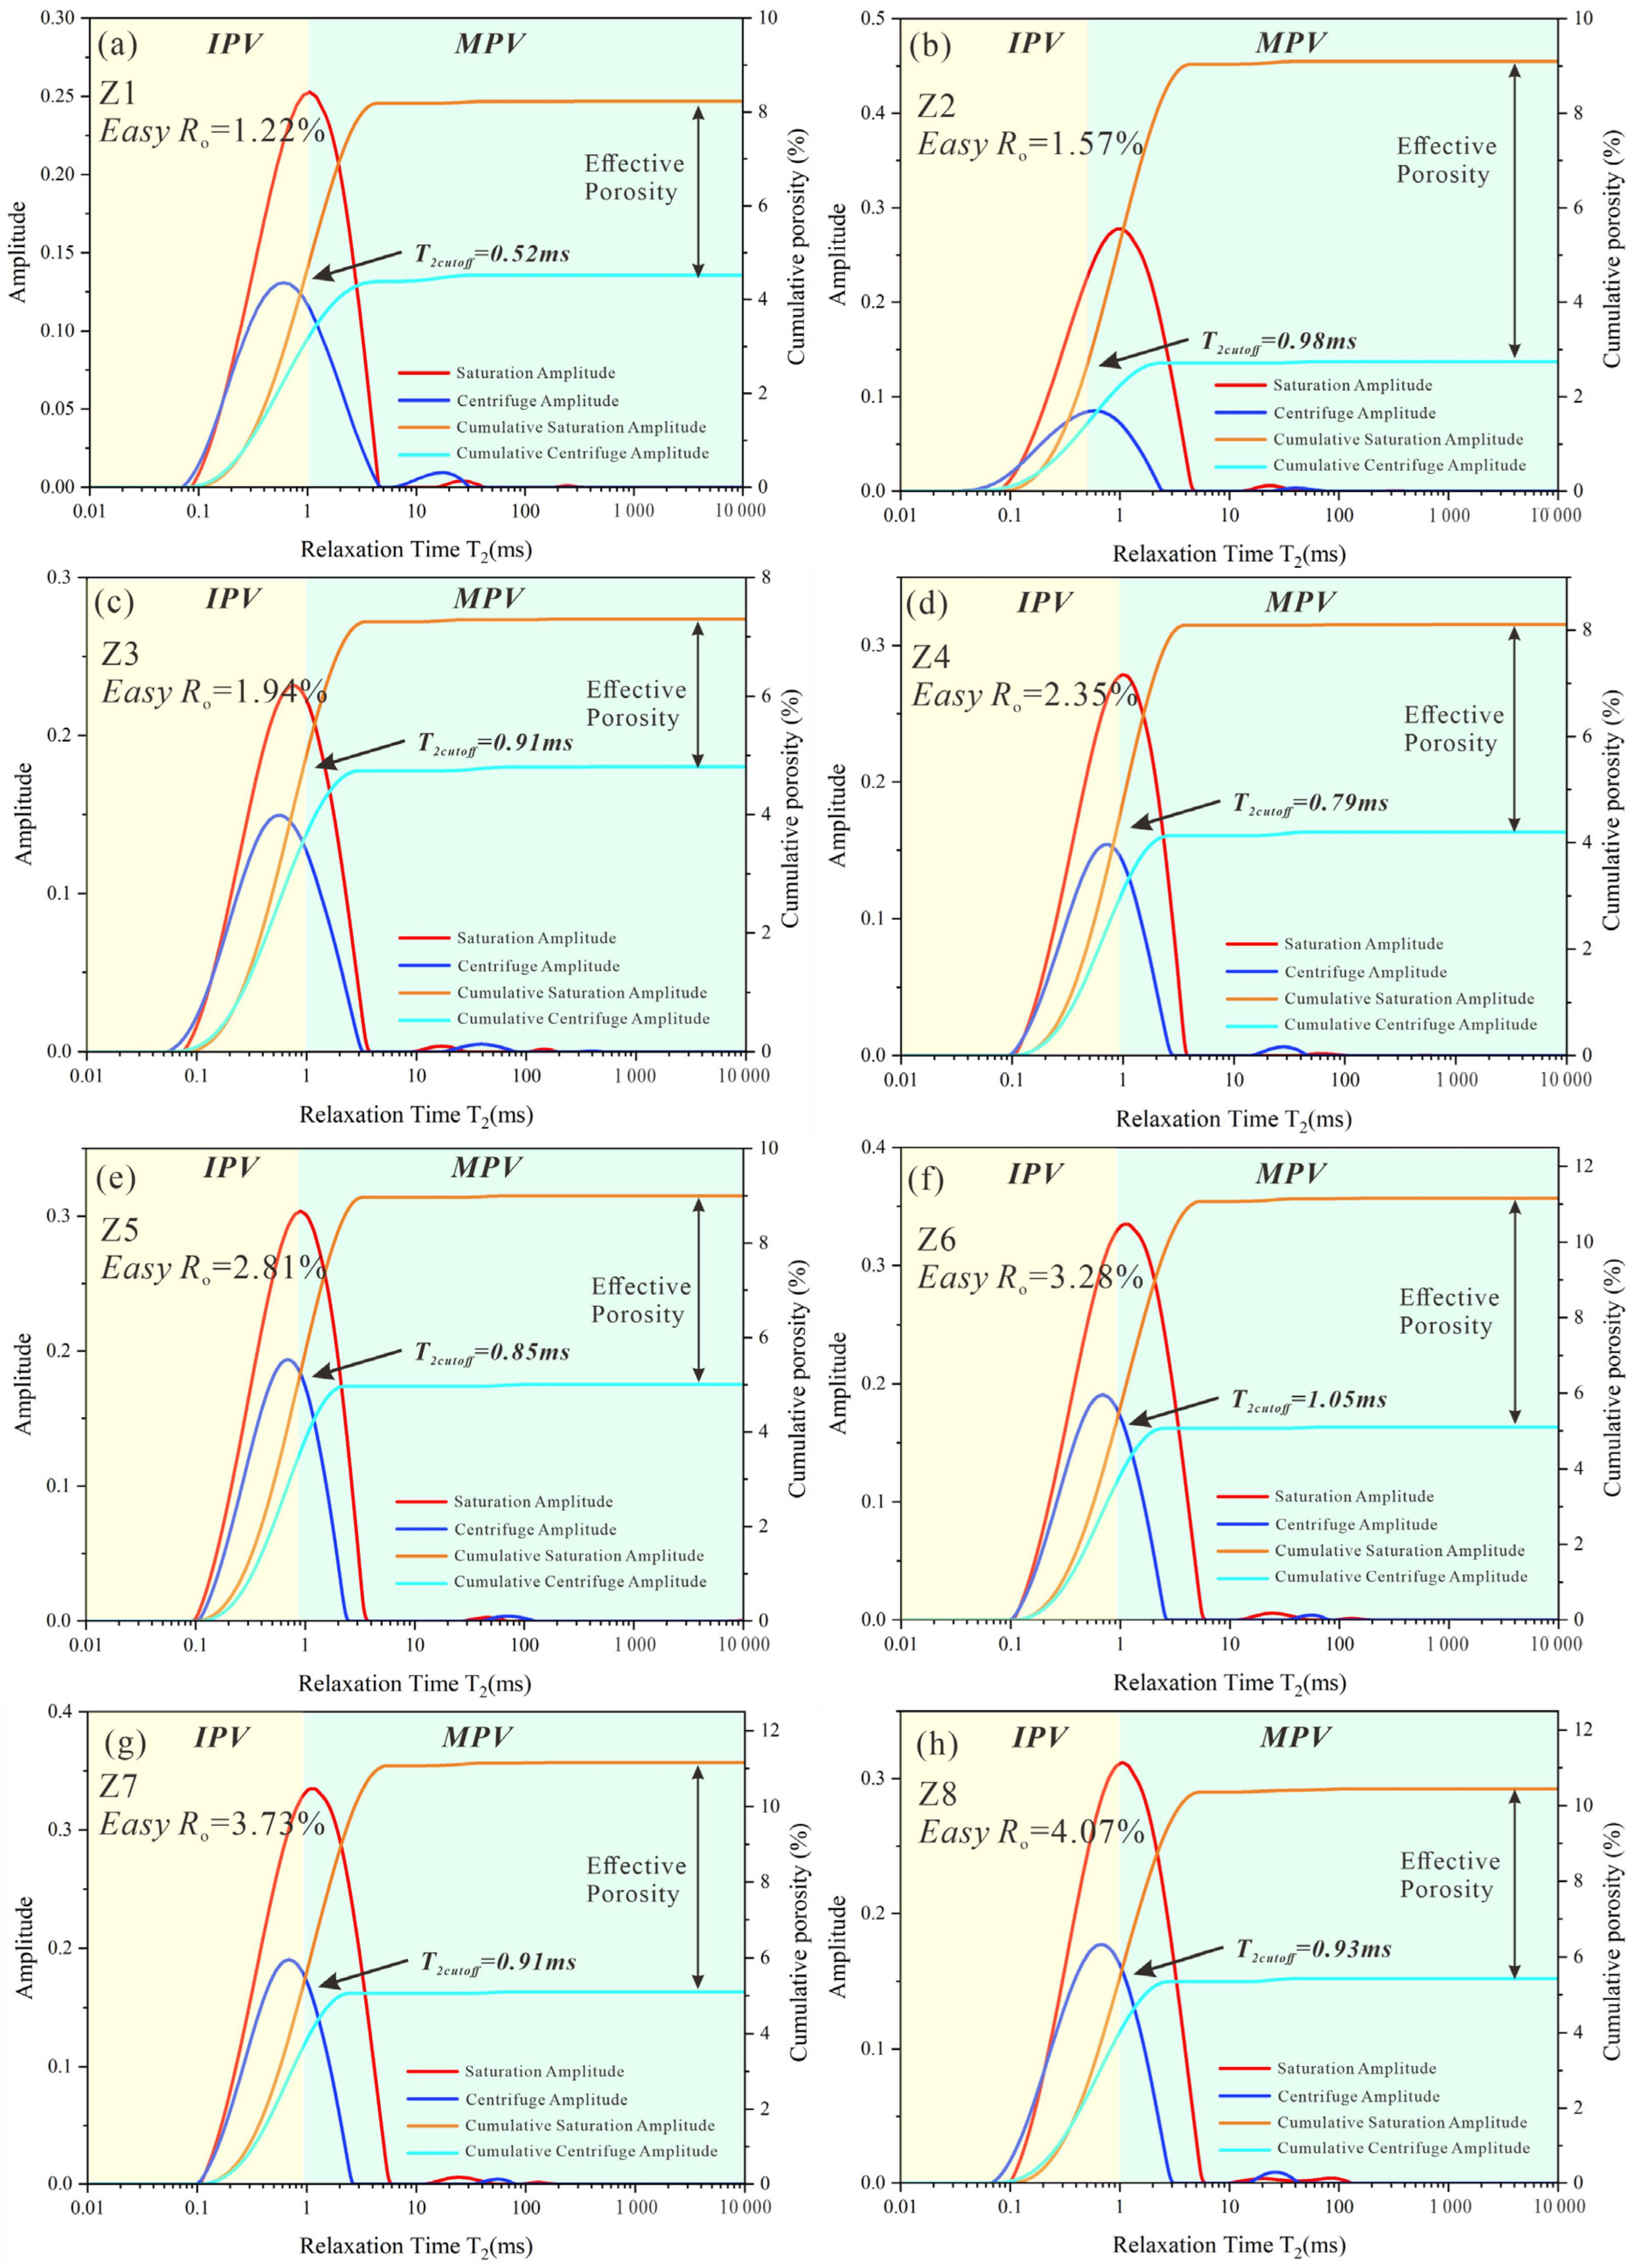
4.3. Results of the LF-NMR Measurements

The T2 spectrum of the NMR experiment enables a quantitative description of core pore structure characteristics, allowing the calculation of key physical parameters, such as total porosity, permeability, movable fluid porosity, and bound fluid porosity (Table 3). Porosity is obtained by comparing fluid signals between dry and saturated samples [52,53]. Shale samples from the Xiamaling Formation exhibit a porosity ranging from 7.3% to 11.2%, with a mean value of 9.12%. The relationship between porosity and maturity calculated using NMR shows a gently increasing trend overall. Sample Z7 (Ro = 3.2%) has the highest porosity. T2 cutoff values, derived from the difference between saturated and centrifuged samples, range from 0.52 to 1.05 ms, with an average of 0.86 ms (Table 3). The difference in T2 cutoff among samples with different maturity levels is marginal, less than 1.1 ms (Table 3).
The T2 cutoff is larger when the shale contains more bound water, indicating higher bound fluid saturation. Shale reservoir adsorption capacity corresponds to a larger T2 cutoff in the reservoir pores. FFI values range from 34.05% to 69.73%, with an average of 48.61%. Movable fluid porosities in the thermally simulated samples are all above 2%, ranging from 2.49% to 6.35%, with an average of 2.49%, showing an overall decreasing-to-increasing trend. BVI values range from 30.27% to 65.95%, with an average of 51.39%, and the distribution of bound fluid porosity in the thermally simulated samples ranges from 4.52% to 5.44%, with an average of 2.75%. The FFI parameters showed a U-shaped trend of decreasing and then increasing. A minimum value was observed in the Z3 sample which then increased with maturity.

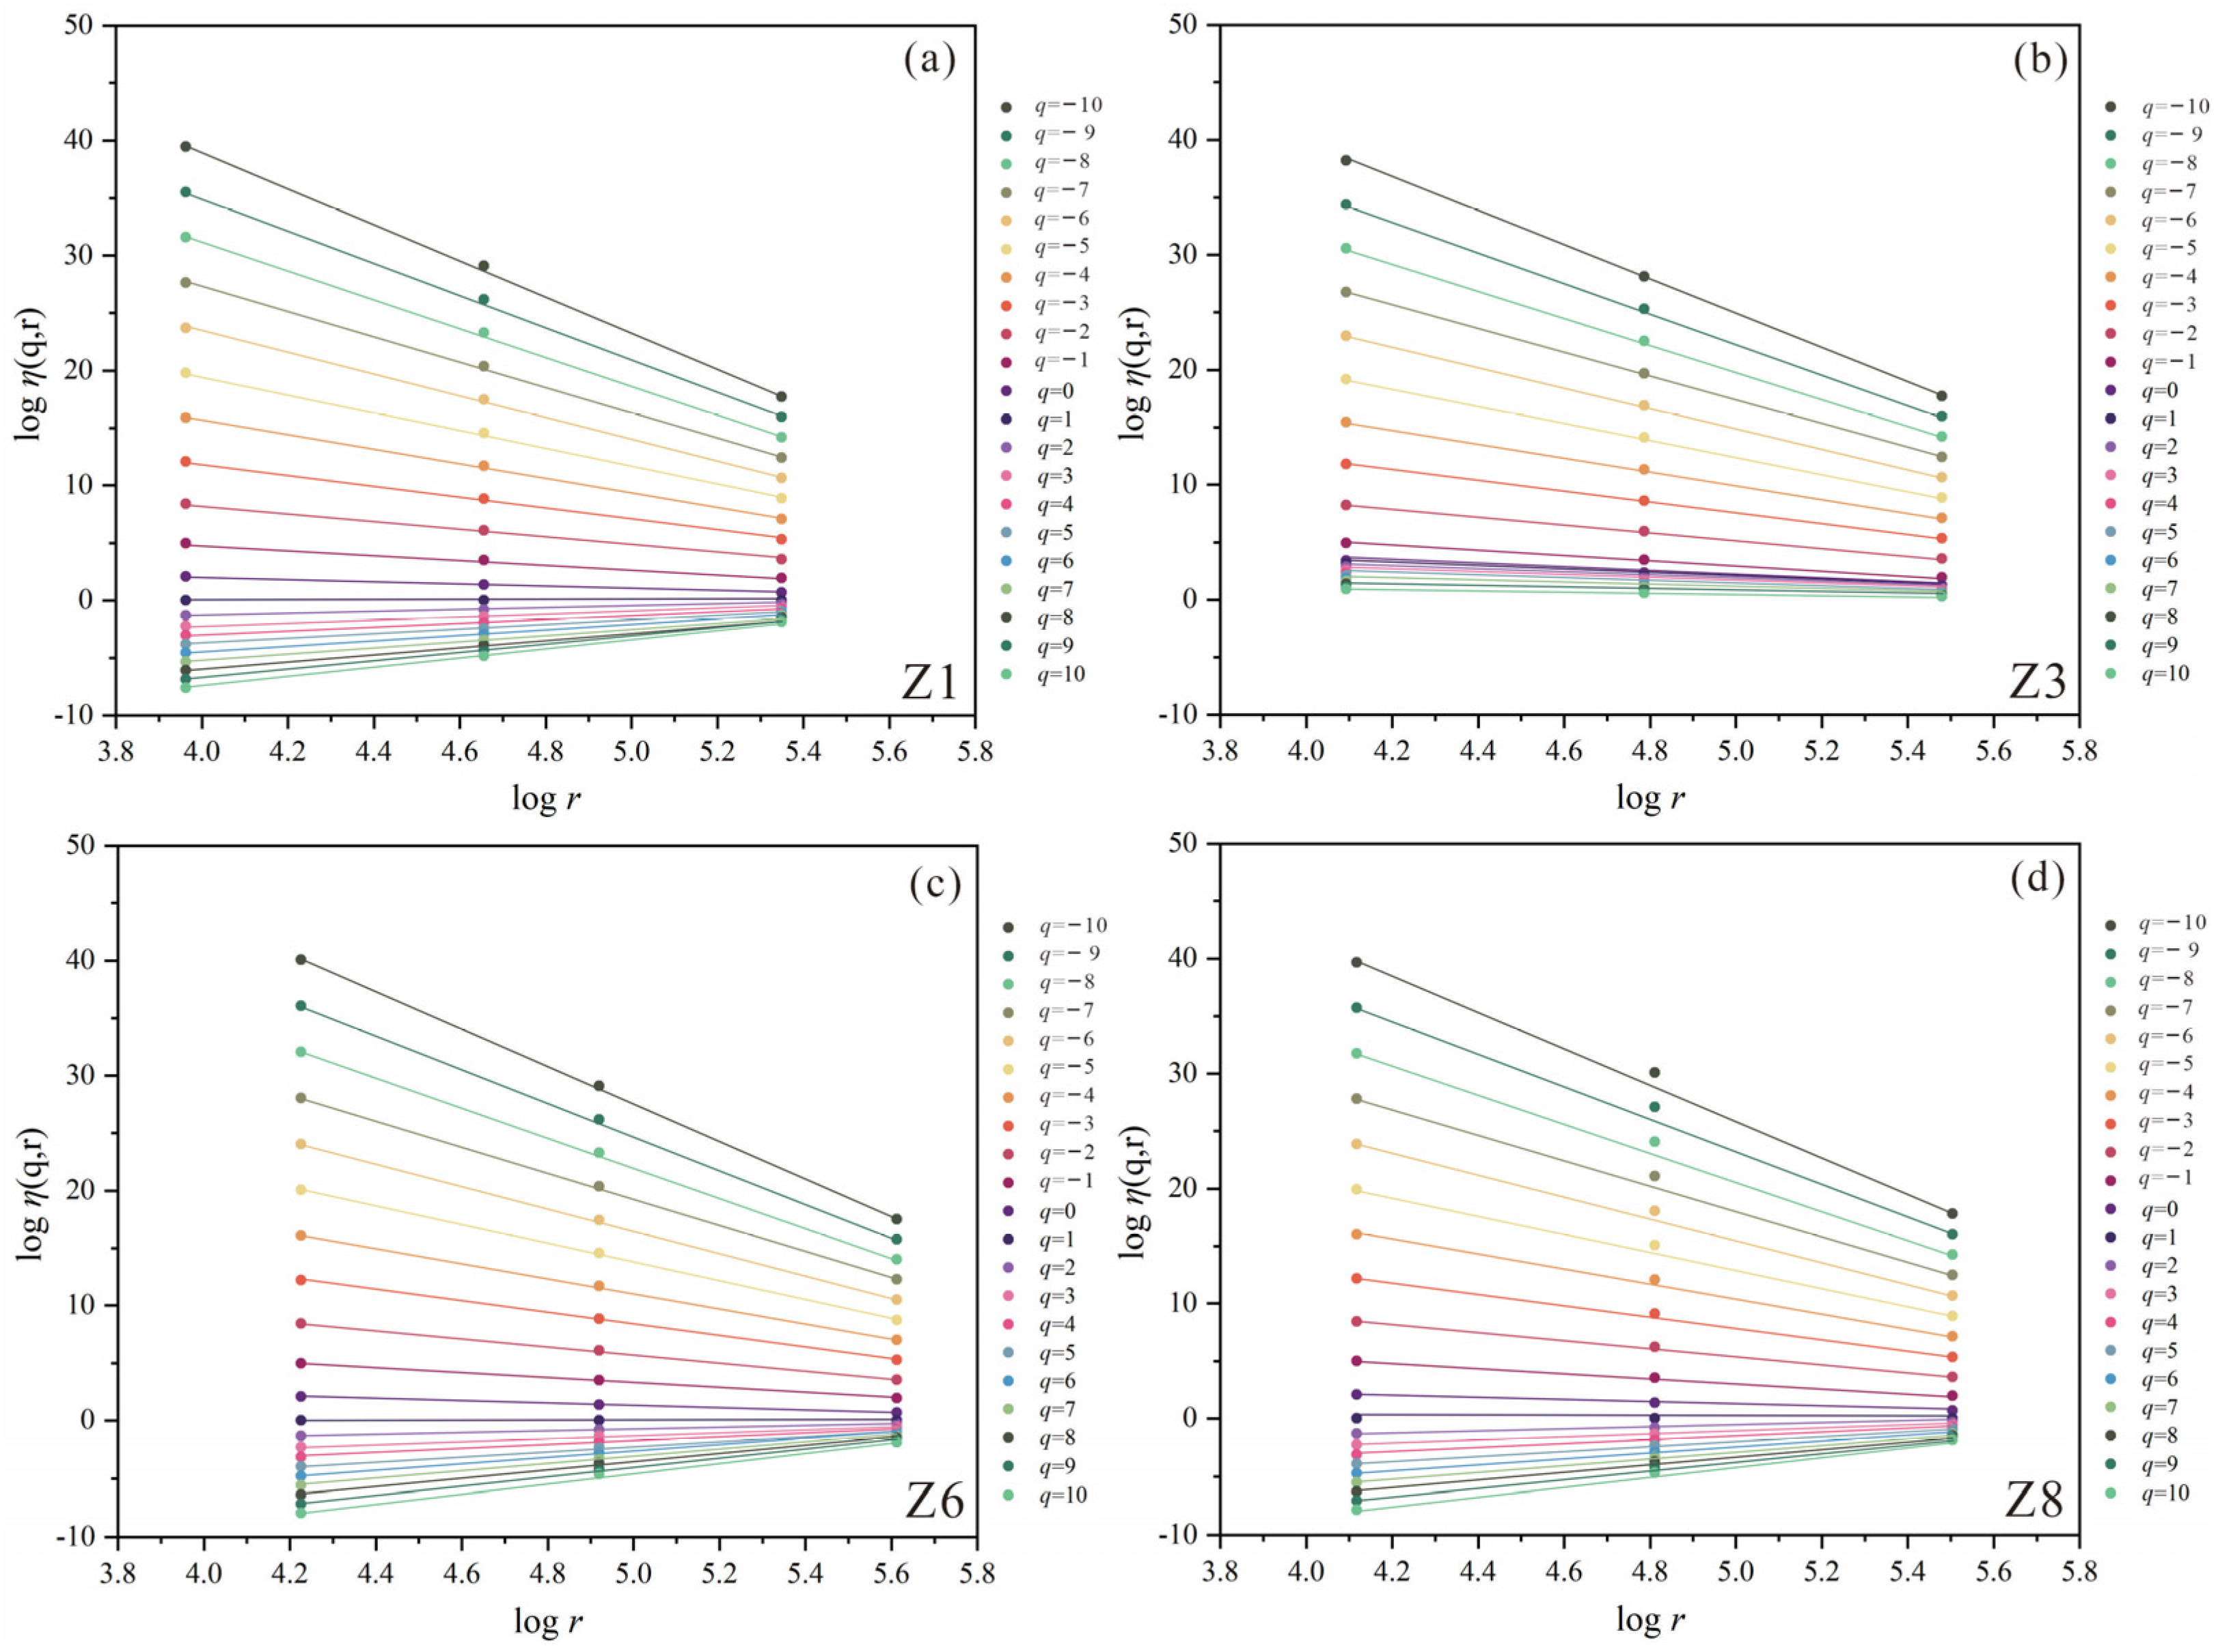
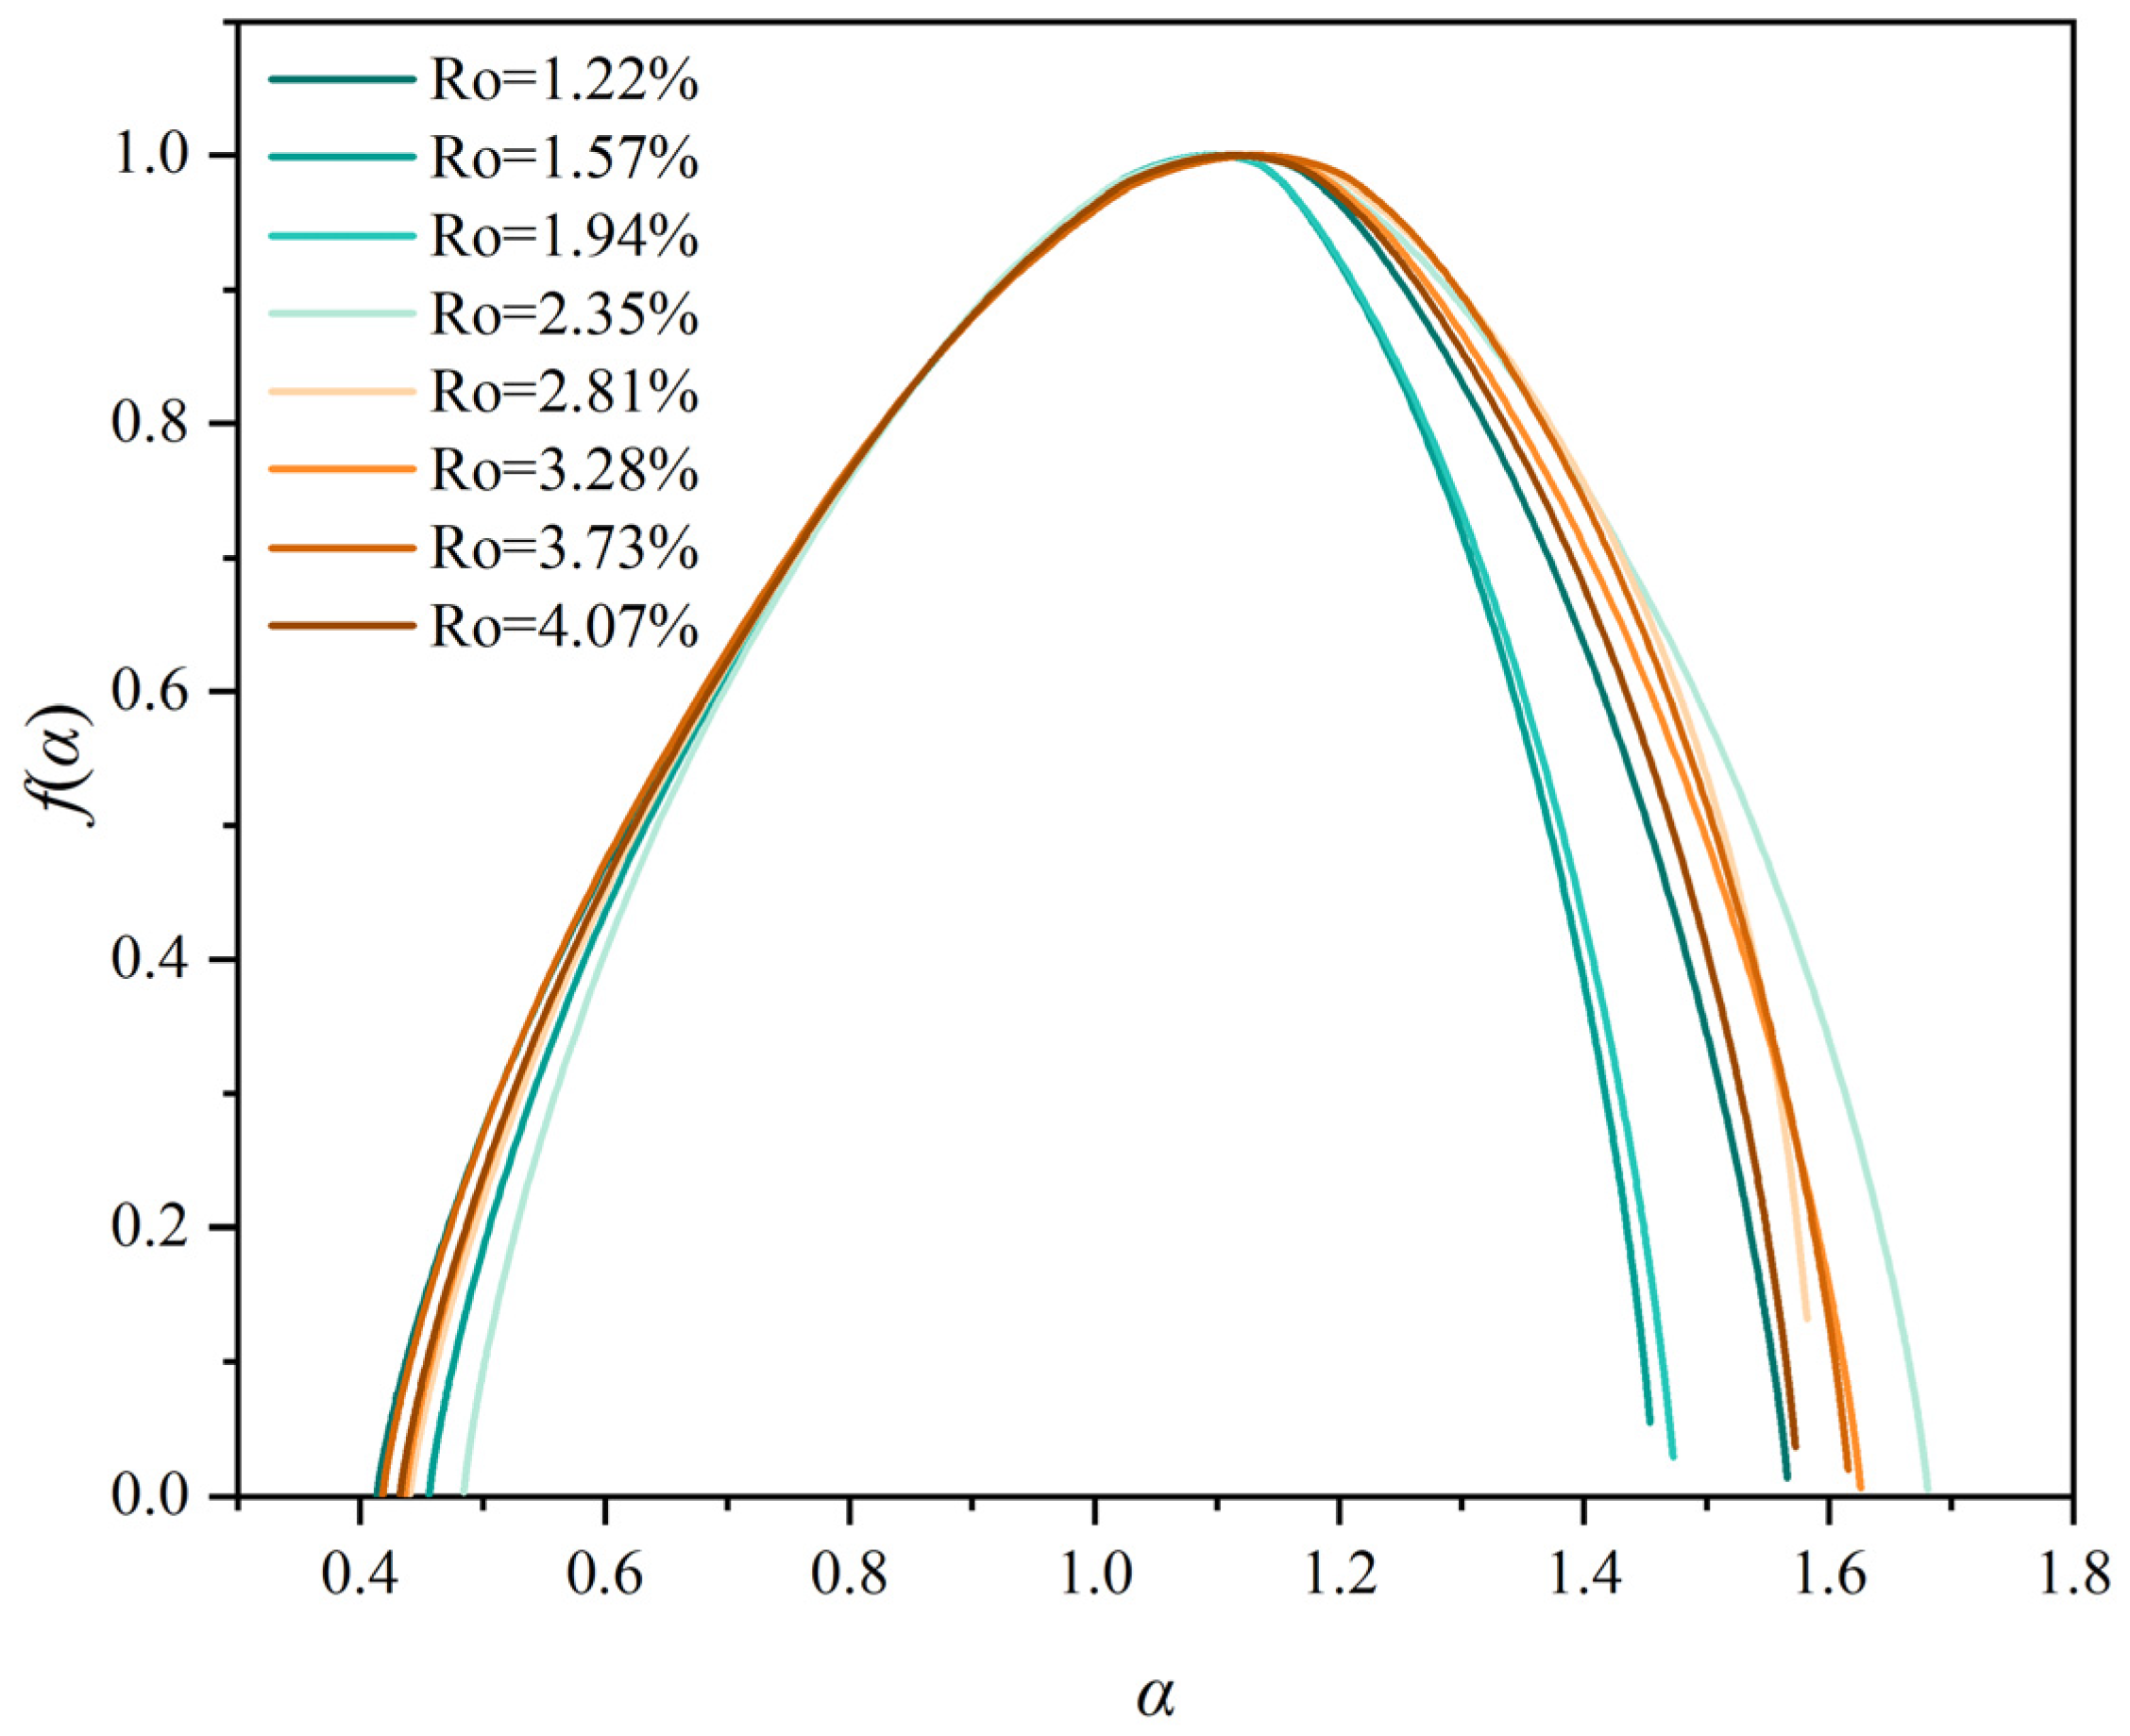
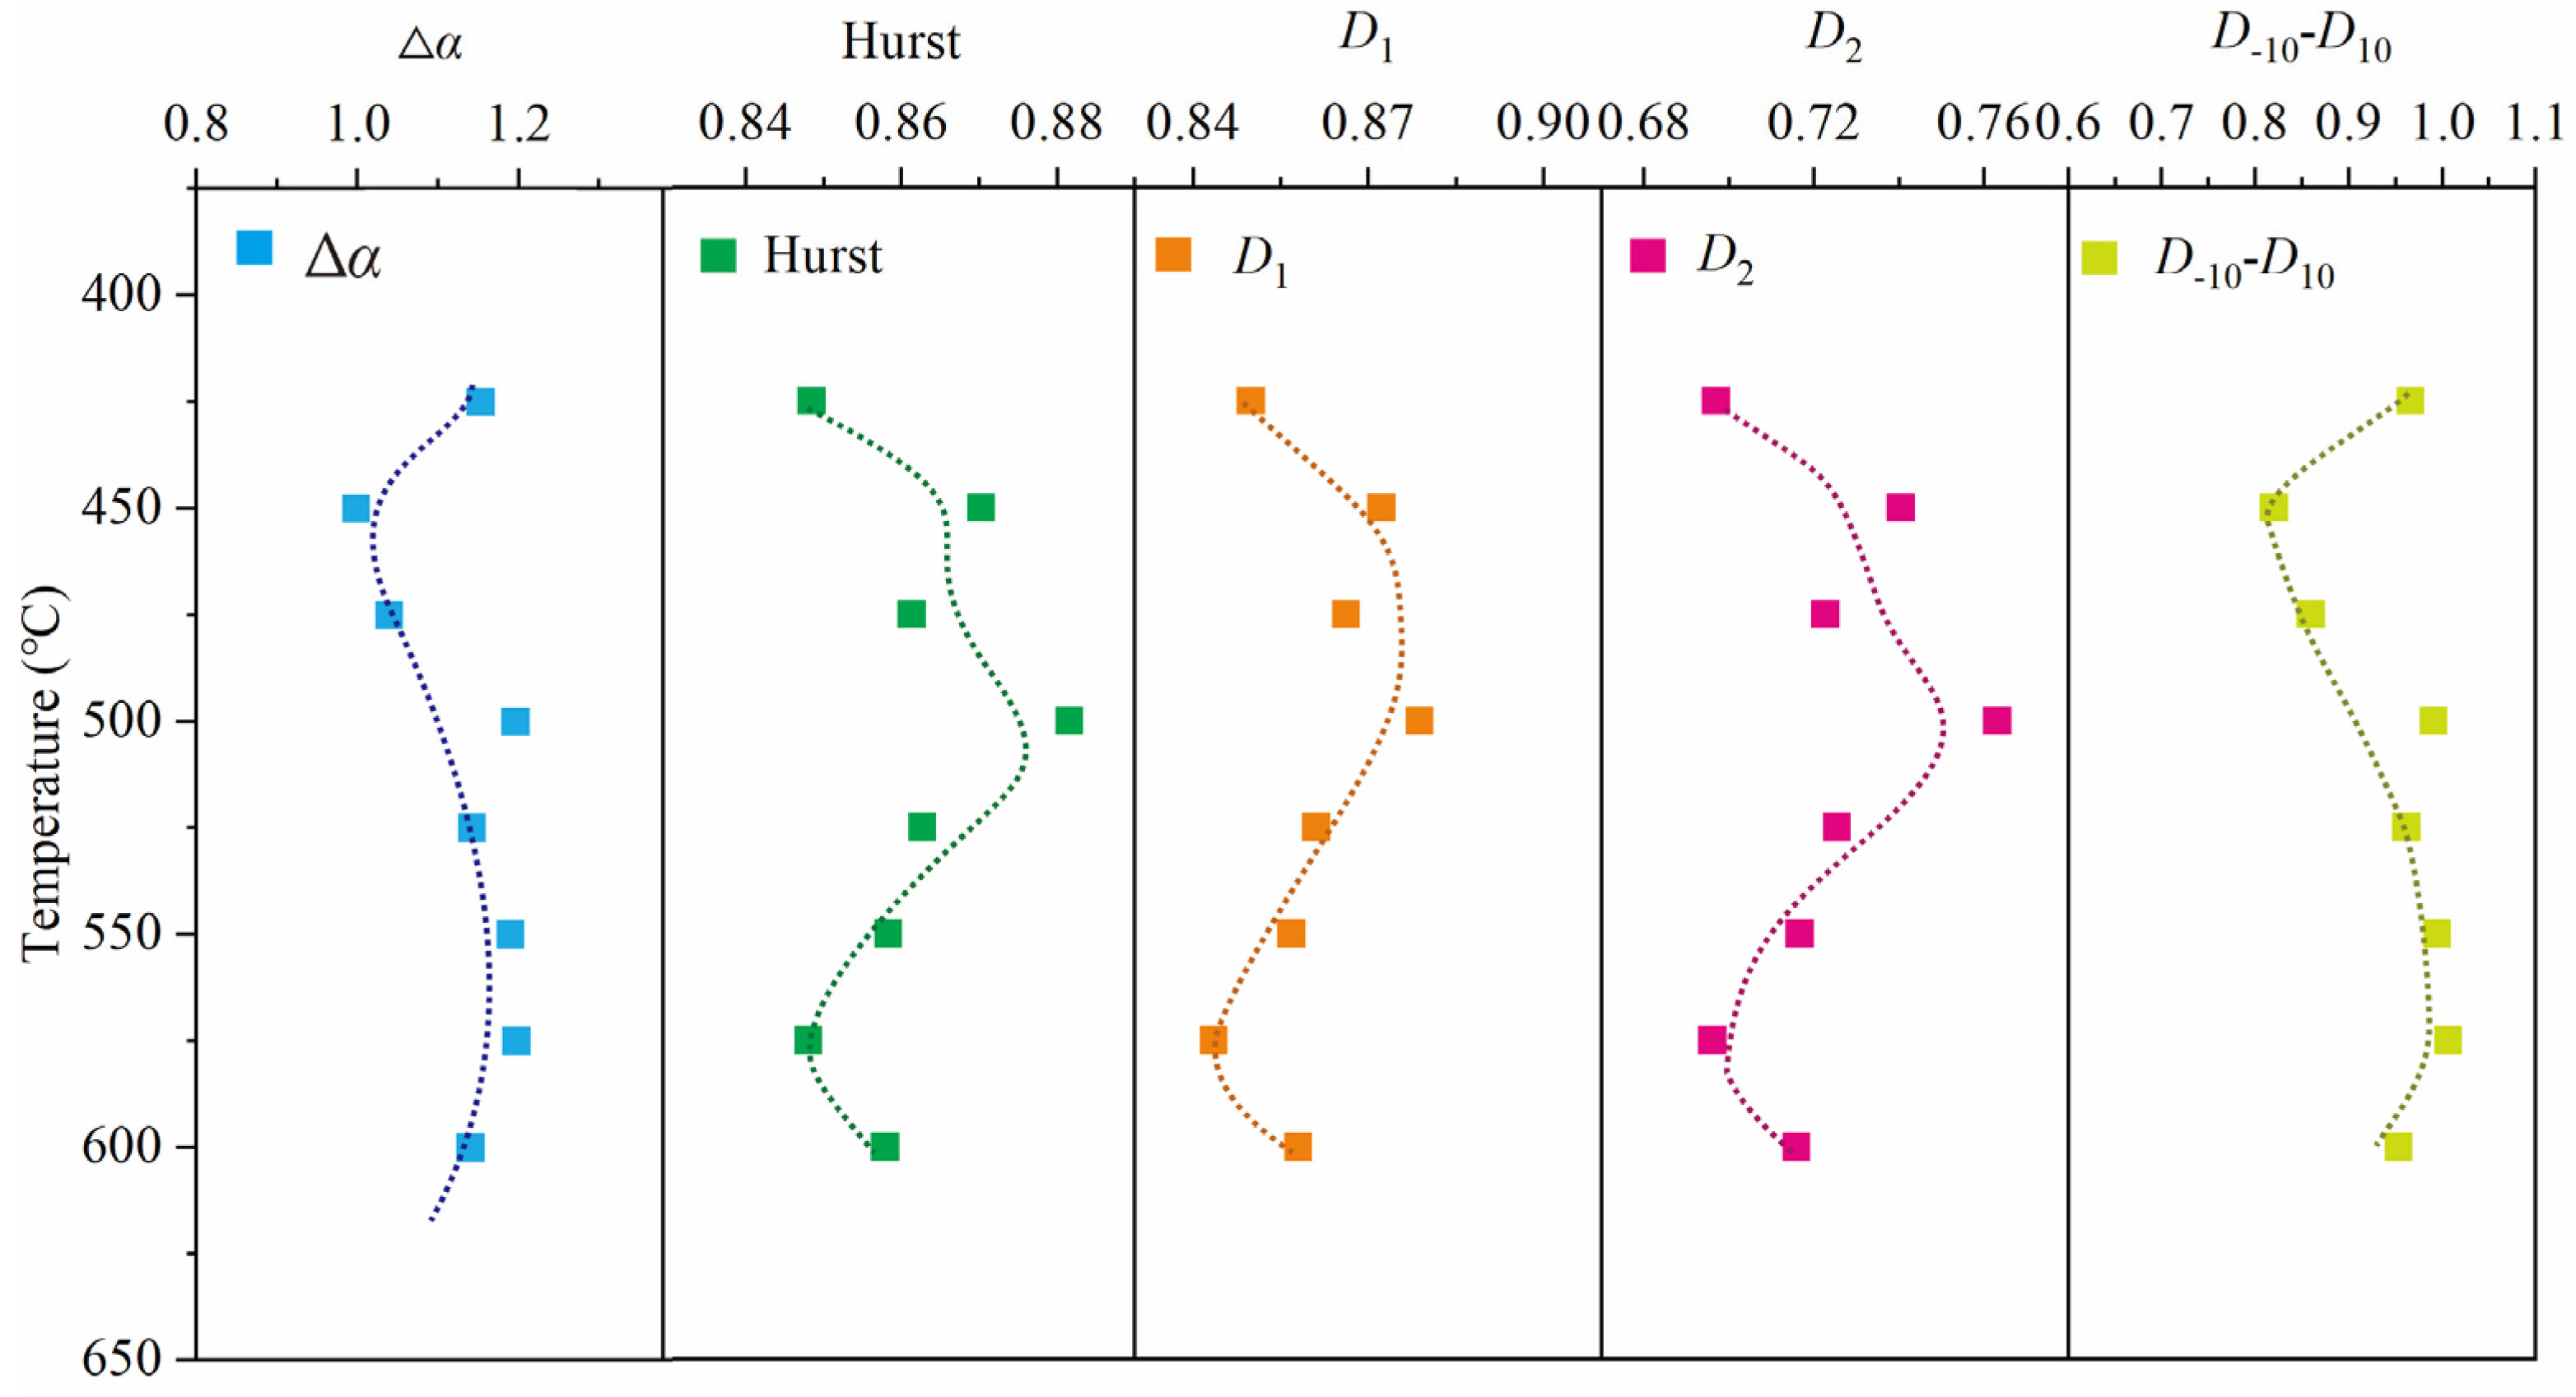
4.4. Multifractal Characteristics Based on NMR Experiments

Figure 5 displays the enthralling double logarithmic correlation between the partition function η(q, r) and the length scale r for the NMR data obtained from samples exhibiting distinct degrees of thermal evolution, with q ranging between −10 and 10. Upon observing Figure 4, it becomes evident that, at the same order, the pore structure of shale remarkably adheres to a segmented linear evolution law concerning log(δ) to log (x), demonstrating an overall first-order linear exponential tendency. This trend is particularly pronounced in the higher-order segment (q > 0), which impeccably exhibits strict linear distribution characteristics. Consequently, for a fixed value of q, the curve maintains a consistent slope, while varying q values correspond to distinct slopes. The fitted linear trend lines manifest negative slopes for q < 0 and positive slopes for q > 0. According to the scale-free and self-similarity of the fractal theory and combined with the lg(δ)~lg(x) curve, it can be seen that the pore structure precisely reflects the multifractal characteristic.
Figure 6 shows that, as thermal evolution varies, the generalized fractal dimension Dq follows an inverted “S” decreasing curve, where Dq decreases as q increases. The curve tends to bend in the opposite direction at q = 0, with generalized fractal dimensions at q < 0 surpassing those at q > 0. Specifically, D-10 ranges from 1.1577 to 1.5284, while D10 ranges from 0.4593 to 0.5379 (Table 4). Upon comparing different generalized fractal dimension curves, for the section with q < 0, Dq increases with higher stages of thermal evolution at the same q value. On the other hand, for the section with q > 0, Dq decreases with higher stages of thermal evolution at the same q value. This observation suggests that the pore structure of the shale reservoir becomes more intricate during advanced development, exhibiting a diversified trend. The D0 values remain similar across all samples, indicating fractal measures with non-empty boxes and density probabilities at varying scales [6,18,31]. D1 represents the information entropy dimension, often employed to characterize the concentration of shale pore distribution [31]. A larger D1 implies a more concentrated pore distribution. The results demonstrate a decline in D1 with increasing maturity, indicating a higher degree of localized pore concentration at high levels of maturity. D2, the correlation dimension, indicates pore spacing homogeneity, with greater D2 values indicating more uniform pore spacing [5,31]. The findings display a gradual decrease in D2 with increasing maturity, signifying a more heterogeneous pore interval.
Multifractal spectra serve to quantitatively delineate the intricacy and irregularity of pore distribution in rock samples [5,31,34]. As depicted in Figure 7, the multifractal spectral curves exhibit an upward trend of convexity, all reaching maximum values. The span of the multifractal spectral curves exhibits diverse degrees of variability. Δα, representing the spectral width of the multifractal spectra, depicts local characteristics of pores concerning their fractal structure and signifies the distribution of pore structures at different size scales [5,7,27,31]. In hydrocarbon thermal simulation conditions, Δα gradually increases with thermal maturity, indicating a complex distribution within the pores at high-maturity stage (Table 5).

5. Discussion

5.1. Organic Geochemical Variation during Thermal Maturation

As the temperature increases, various processes, such as organic matter transformation, hydrocarbon generation, retention, and exhaustion, as well as organic–inorganic interactions in shale, contribute to changes in pore structure heterogeneity. The thermal maturity of the shale increased from 1.22% to 4.07%, and Tmax rose from 515 °C to nearly 634 °C, signifying the peak of hydrocarbon production and the attainment of the overmature stage with increasing temperature (Figure 8). S1 represents the number of free hydrocarbons in the rock (mg HC/g rock); if S1 > 1 mg/g, it indicates that there may be oil. S2 represents the number of rock pyrolysis hydrocarbons (mg HC/g rock); S2 represents the hydrocarbon generation potential of the source rock during the burial/thermal evolution process. S1 + S2 is usually used to represent the hydrocarbon generation potential. Throughout this process, the TOC content showed a slight decrease from 2.55% to 2.14%, and the S1 + S2 index decreased from 18.74 mg/g to 3.95 mg/g, indicating significant hydrocarbon generation during thermal evolution. The S1 and S2 content demonstrated a slight decrease with increasing temperature. The S1 + S2 and Tmax gradually decreased, indicating secondary cracking of generated liquid hydrocarbons and the generation of numerous gas hydrocarbons (Figure 8).
During thermal evolution, notable changes occurred in the content of quartz, feldspar, and clay minerals. The quartz content decreased from 58% to 45% with increasing stages of thermal evolution (Figure 9). As thermal evolution enters the overmature stage and compaction increases with depth of burial, secondary quartz formed early in the diagenetic process experiences a partial dissolution process, resulting in a decrease in quartz content. Additionally, the heterogeneity of shale is believed to contribute to this phenomenon [54,55]. The overall change in feldspar content is not significant with increasing temperature. The organic acid produced by the hydrocarbon production process makes the feldspar content decrease. However, at the high evolutionary stage, the dissolving effect of organic acids in the samples is not strong, while recrystallization due to reverse dissolution results in small changes in feldspar content [56]. The clay content increases with maturity, primarily due to the reduction in montmorillonite content and an increase in illite content as thermal evolution progresses. Furthermore, feldspar and kaolinite are converted to illite when sufficient cations are present in the solution [54,55]. The transformation of smectite of the I/S to illite occurs extensively at 400–450 °C. However, due to the weak water–rock response and insufficient supply of K+ in the reservoir, the feldspar dissolution remains incomplete [35]. Similarly, smectite/illite is not completely converted to illite due to the closed nature of the reservoir and formation system.

5.2. The Variation of Pore Structure Heterogeneity during Thermal Maturation

Based on multifractal theory, this research selects various parameters to elucidate pore heterogeneity, connectivity, pore distribution concentration, uniformity of pore spacing, and localized variability at distinct evolutionary stages [5,6,7,14,27,31]. The thermal evolution findings demonstrate that the shale’s multifractal parameters Δα and ΔD exhibit relatively parallel evolutionary trends, while Hurst, D1, and D2 manifest similar trends (Figure 9). For the analysis, this study considers Δα and Hurst as representative parameters, indicating a notable enhancement of pore heterogeneity due to thermal evolution. At 400 °C, the Δα value is low, indicating a less heterogeneous pore structure in the original surface sample. As temperature increases, Δα rapidly rises, possibly attributable to an increase in large pores and a decrease in mesopores during this stage. Subsequently, Δα values experience some reduction, potentially due to the blockage of numerous micropores and mesopores by crude oil and bitumen, leading to a partial decline in pore heterogeneity [11,35]. In the late stage of oil production, the retained oil diminishes, expelled oil increases, certain pore volumes rise, and pore heterogeneity gradually escalates [18]. At temperatures up to 550 °C, extensive solid bitumen cracking generates gas, yielding complex cellular pores and augmenting the specific surface area, resulting in the highest Δα value. At 600 °C, a degree of pore heterogeneity reduction occurs, likely attributed to robust compaction, leading to a decrease in the volume of meso- and macropores.
Regarding pore connectivity, the initial stage of hydrocarbon thermal simulation exhibits a rapid decline in the Hurst value, indicating the accumulation of retained hydrocarbons in the pore space during the oil production stage, which leads to the blockage of meso–macropores and a decrease in pore connectivity (Figure 9). Reduced pore connectivity is linked to the diminished pore volume between various pore types associated with this stage [20,57]. As the evolution progresses, the generation of bitumen yields numerous OM pores, resulting in a gradual increase in pore connectivity. The Hurst index reaches its peak value at 500 °C and gradually decreases with rising temperature. Although kerogen pores primarily form network pores, connecting a portion of the inorganic pores and microcracks, the overall effect of increasing temperature leads to elevated pressure, resulting in the closure of some mesopores and macropores, causing partial destruction of the brittle mineral skeleton and, thus, contributing to lower pore connectivity [14,18,22].

5.3. The Effect of Thermal Maturity (Ro) on Pore Structure

Organic matter maturity evolved from low to high during the thermal simulation experiments, and the relationships between NMR porosity, T2 cutoff, FVI, BVI, and maturity are shown in Figure 10. As the maturity increases, the OM remains in the the hydrocarbon generation stage, and the OM pores develop in large quantities, resulting in a trend of decreasing and then increasing NMR porosity. Milliken et al. noted that shale porosity varies with thermal maturity due to OM pores [23]. From the stage of low maturity to maturity, the OM generates a large number of liquid hydrocarbons that block the pores, decreasing porosity. From the evolutionary stage of maturity to overmaturity, organic matter generates many pores, forming a network of pores, resulting in increasing porosity.
The T2 cutoff is commonly employed as a threshold to distinguish between movable and immovable fluids, serving as an indicator of fluid mobility within the shale (Figure 11). Higher T2 cutoff values signify a larger portion of bound fluid, indicating a higher degree of bound fluid saturation. With increasing thermal evolution, the T2 cutoff exhibits a rapid rise during maturation, reaches a peak, slightly decreases, and then begins to slowly increase at a Eq of 2.4%. Similarly, bound water porosity follows a similar trend as the T2 cutoff. During the maturation stage, some hydrocarbons obstruct the inorganic–organic pore space, resulting in pore throat narrowing and higher bound fluid saturation [20,22,40,58]. After reaching 2.0% maturity, the heavy hydrocarbons present in the organic matter persist in undergoing cracking, leading to a continuous augmentation of organic matter pores. Consequently, both the number and volume of mesopores and macropores, along with shale matrix hydrocarbon production, observe a steady ascent [1]. Concurrently, diverse pore types establish connections, such as the formation of reticulated pores within the organic matter, facilitating the linkage of inorganic–organic pores, ultimately resulting in a reduction in bound fluid saturation. Upon reaching a maturity level of 2.5%, the overall BVI (Bulk Volume Irreducible) and T2 parameters of the samples show marginal alterations, signifying the stabilization phase of kerogen gas and liquid hydrocarbon cracking gas [20,37,41]. In previous studies, it has been suggested that maturity levels greater than 3.5% result in more pronounced carbonization of OM, a decrease in the hydrocarbon production capacity of OM, and a reduction in the organic matter pore space [59,60]. In the present study, with a high level of maturity over 3.5%, gradually reduces at the rate of hydrocarbon evolution and porosity, causing the bound fluid saturation to also increase significantly, which is detrimental to the enrichment of hydrocarbons [59].

5.4. Pore Structure and Heterogeneity Evolution Model

A large number of studies have revealed the complex evolution process of the pore system during the hydrocarbon generation and formation stages of shale [6,27,34]. The pore structure characteristics of shale are mainly affected by the thermal development degree of the reservoir and are closely related to sedimentation, structure, and hydrocarbon generation (Figure 12). Previous studies have extensively studied the impact of thermal maturity on shale reservoirs, and various thermal simulation experiments have demonstrated the evolution of shale porosity [11,35,41].
This study focuses on the shale pore development and heterogeneity evolution process under mature-to-overmature conditions. At this stage (1.3% ≤ Ro < 2.0%), as the thermal evolution proceeds, some residual liquid hydrocarbons block the intra- and intergranular pores of inorganic mineral particles, causing a significant decrease in porosity. This may be a result of the decline in inorganic porosity of shale reservoirs due to cementation and compaction. The bound fluid saturation content is high and can reach a value higher than 60%. A large number of hydrocarbons results in smoother pore surfaces and reduced roughness, resulting in a reduction in Δα [20,21,22,29,57,58]. As the maturity level continues to increase, it is possible that less oil is retained in the shale reservoir and more oil is expelled, forming a large number of internal connecting pores [61]. Part of the bitumen fills the intergranular pores of brittle minerals and the intragranular pores of clay minerals. As the thermal maturity progresses, micropores begin to form, which enhances the heterogeneity of the pores. In the dry gas generation stage (Ro > 2.00%), OM reaches the overmature dry gas stage, kerogen and asphalt are cracked for a second time, accompanied by the appearance of a large number of connected organic pores, and the total porosity of the shale increases. At the same time, the bound fluid saturation also gradually decreases. As the organic matter pores gradually increase and the pore heterogeneity is enhanced, shale reaches its highest value of Δα [1,18]. As the maturity exceeds a level of 3.0%, the hydrocarbon generation ability of organic matter decreases, the total porosity of shale increases, and the formation of pore networks enhances pore connectivity. The reasons for this phenomenon could be that organic matter pores are compressed and closed by the gradual attenuation of compaction and hydrocarbon generation capacity. This may be contributed to pore volume’s decrease; the bound fluid saturation increases slightly and the Δα value decreases slightly [41,62].

6. Conclusions

In this study, multifractal theory was combined with NMR experiments to investigate the pore structure and heterogeneity evolution of shale from natural immature shale to mature shale via artificial thermal simulation. The control effects of organic hydrocarbon generation and removal and diagenetic processes on the pore structure and heterogeneity of OM are systematically analyzed.
As the temperature increases from 425 to 600 °C, the quartz content and clay mineral content show alternating trends, the unstable mineral content is reduced, and the clay mineral content rises. With an increase in pyrolysis intensity, the TOC, S1, and S2 content show a trend of decreasing, indicating that OM produces and discharges hydrocarbons during the simulation. With the advancement of thermal maturity, the porosity at the thermal evolution stage shows a pattern of decreasing first, then increasing, and finally decreasing again. At the maturity stage, hydrocarbon generation obstructs the pore space, leading to a higher bound fluid porosity as well as lower total porosity. With the further enhancement of maturity, a large number of liquid hydrocarbons undergo cracking to generate wet gas, and the generation of a large number of OM micropores enhances the moveable fluid porosity within the shale reservoir, increasing the overall porosity of the shale, which is conducive to the seepage process. When maturity reaches the overmature stage, the hydrocarbon generation capacity of OM decreases, while some OM pores are subject to compaction collapse and deformation, resulting in a decrease in porosity and pore structure heterogeneity.

Author Contributions

W.W.: Writing and Methodology, Data analyses. Z.L.: Writing and Methodology. X.T.: Resources, Supervision, Project administration. L.X. and Y.L. (Yi Li): Resources and Supervision. Y.Y.: Method and Writing. Y.C. and Y.L. (Yong Liu): Method, Resources. All authors have read and agreed to the published version of the manuscript.

Funding

This research received funding from the National Natural Science Foundation of China (No. 41872135, No. 42072151, No.42272137), the National Energy Shale Gas R & D (Experiment) Center Grant (No. 2022-KFKT-15), and the Strategic Cooperation Technology Projects of CNPC and CUPB (ZLZX2020-01).

Data Availability Statement

The data presented in this study are available upon request from the corresponding author. The data are not publicly available because some of the basic research involves confidentiality.

Acknowledgments

Many thanks to the State Key Laboratory of Petroleum Resources and Prospecting and the Unconventional Oil and Gas Science and Technology Research Institute. Furthermore, we sincerely appreciate all workers who worked hard with us. Finally, thanks to the reviewers and the editor for their critical input.

Conflicts of Interest

The authors declare that they have no known competing financial interests or personal relationships that could have appeared to influence the work reported in this paper.

References

  1. Curtis, M.E.; Cardott, B.J.; Sondergeld, C.H.; Rai, C.S. Development of organic porosity in the Woodford Shale with increasing thermal maturity. Int. J. Coal Geol. 2012, 103, 26–31. [Google Scholar] [CrossRef]
  2. Loucks, R.G.; Reed, R.M.; Ruppel, S.C.; Hammes, U. Spectrum of pore types and networks in mudrocks and a descriptive classification for matrix-related mudrock pores. AAPG Bull. 2012, 96, 1071–1098. [Google Scholar] [CrossRef]
  3. Yang, R.; He, S.; Yi, J.; Hu, Q. Nano-scale pore structure and fractal dimension of organic-rich Wufeng-Longmaxi shale from Jiaoshiba area, Sichuan Basin: Investigations using FE-SEM, gas adsorption and helium pycnometry. Mar. Pet. Geol. 2016, 70, 27–45. [Google Scholar] [CrossRef]
  4. Tang, X.; Jiang, Z.; Jiang, S.; Li, Z. Heterogeneous nanoporosity of the Silurian Longmaxi Formation shale gas reservoir in the Sichuan Basin using the QEMSCAN, FIB-SEM, and nano-CT methods. Mar. Pet. Geol. 2016, 78, 99–109. [Google Scholar] [CrossRef]
  5. Hou, X.; Zhu, Y.; Chen, S.; Wang, Y.; Liu, Y. Investigation on pore structure and multifractal of tight sandstone reservoirs in coal bearing strata using LF-NMR measurements. J. Pet. Sci. Eng. 2020, 187, 106757. [Google Scholar] [CrossRef]
  6. Liang, Z.; Jiang, Z.; Li, Z.; Song, Y.; Gao, F.; Liu, X.; Xiang, S. Nanopores Structure and Multifractal Characterization of Bulk Shale and Isolated Kerogen—An Application in Songliao Basin, China. Energy Fuels 2021, 35, 5818–5842. [Google Scholar] [CrossRef]
  7. Wang, Y.; Cheng, H.; Hu, Q.; Liu, L.; Jia, L.; Gao, S.; Wang, Y. Pore structure heterogeneity of Wufeng-Longmaxi shale, Sichuan Basin, China: Evidence from gas physisorption and multifractal geometries. J. Pet. Sci. Eng. 2022, 208, 109313. [Google Scholar] [CrossRef]
  8. Chen, K.; Yang, R.; Bao, H.; Dong, T.; Jia, A.; Hu, Q.; Guo, X.; He, S. Depositional-diagenetic process and their implications for pore development of Wufeng-Longmaxi shales in the Jiangdong block, Fuling shale gas field, SW China. Mar. Pet. Geol. 2023, 151, 106177. [Google Scholar] [CrossRef]
  9. Li, X.; Jiang, Z.; Jiang, S.; Wang, S.; Miao, Y.; Wu, F.; Cao, X. Synergetic effects of matrix components and diagenetic processes on pore properties in the Lower Cambrian shale in Sichuan Basin, South China. J. Nat. Gas Sci. Eng. 2021, 94, 104072. [Google Scholar] [CrossRef]
  10. Wang, Y.; Liu, L.; Hu, Q.; Hao, L.; Wang, X.; Sheng, Y. Nanoscale Pore Network Evolution of Xiamaling Marine Shale during Organic Matter Maturation by Hydrous Pyrolysis. Energy Fuels 2020, 34, 1548–1563. [Google Scholar] [CrossRef]
  11. Xu, L.; Yang, K.; Wei, H.; Liu, L.; Jiang, Z.; Li, X.; Chen, L.; Xu, T.; Wang, X. Pore evolution model and diagenetic evolution sequence of the Mesoproterozoic Xiamaling shale in Zhangjiakou, Hebei. J. Pet. Sci. Eng. 2021, 207, 109115. [Google Scholar] [CrossRef]
  12. Xu, L.; Yang, K.; Wei, H.; Liu, L.; Li, X.; Chen, L.; Xu, T.; Wang, X. Full-Scale Pore Structure Characteristics and the Main Controlling Factors of Mesoproterozoic Xiamaling Shale in Zhangjiakou, Hebei, China. Nanomaterials 2021, 11, 527. [Google Scholar] [CrossRef] [PubMed]
  13. Liu, H.; Zhang, S.; Song, G.; Xuejun, W.; Teng, J.; Wang, M.; Bao, Y.; Yao, S.; Wang, W.; Zhang, S.; et al. Effect of shale diagenesis on pores and storage capacity in the Paleogene Shahejie Formation, Dongying Depression, Bohai Bay Basin, east China. Mar. Pet. Geol. 2019, 103, 738–752. [Google Scholar] [CrossRef]
  14. Chen, L.; Jiang, Z.; Jiang, S.; Liu, K.; Yang, W.; Tan, J.; Gao, F. Nanopore Structure and Fractal Characteristics of Lacustrine Shale: Implications for Shale Gas Storage and Production Potential. Nanomaterials 2019, 9, 390. [Google Scholar] [CrossRef] [PubMed]
  15. Liang, C.; Cao, Y.; Liu, K.; Jiang, Z.; Wu, J.; Hao, F. Diagenetic variation at the lamina scale in lacustrine organic-rich shales: Implications for hydrocarbon migration and accumulation. Geochim. Et Cosmochim. Acta 2018, 229, 112–128. [Google Scholar] [CrossRef]
  16. Wang, X.P.; Mou, C.L.; Wang, Q.Y.; Ge, X.Y.; Chen, X.W.; Zhou, K.K.; Liang, W. Diagenesis of black shale in longmaxi formation, southern sichuan Basin and its periphery. Acta Pet. Sin. 2015, 36, 1035–1047. [Google Scholar]
  17. Zhang, S.; Liu, H.M.; Song, G.Q.; Wang, R.S.; Chen, S.Y.; Zhang, S.P. Genesis and control factors of shale oil reserving space in Dongying sag. Acta Pet. Sin. 2016, 37, 1495–1507. [Google Scholar] [CrossRef]
  18. Guan, M.; Liu, X.; Jin, Z.; Lai, J.; Sun, B.; Zhang, P.; Chen, K. The evolution of pore structure heterogeneity during thermal maturation in lacustrine shale pyrolysis. J. Anal. Appl. Pyrolysis 2022, 163, 105501. [Google Scholar] [CrossRef]
  19. Gao, Z.; Xuan, Q.; Hu, Q.; Jiang, Z.; Liu, X. Pore structure evolution characteristics of continental shale in China as indicated from thermal simulation experiments. AAPG Bull. 2021, 105, 2159–2180. [Google Scholar] [CrossRef]
  20. Löhr, S.C.; Baruch, E.T.; Hall, P.A.; Kennedy, M.J. Is organic pore development in gas shales influenced by the primary porosity and structure of thermally immature organic matter? Org. Geochem. 2015, 87, 119–132. [Google Scholar] [CrossRef]
  21. Wang, X.; Jiang, Z.; Jiang, S.; Chang, J.; Li, X.; Wang, X.; Zhu, L. Pore Evolution and Formation Mechanism of Organic-Rich Shales in the Whole Process of Hydrocarbon Generation: Study of Artificial and Natural Shale Samples. Energy Fuels 2019, 34, 332–347. [Google Scholar] [CrossRef]
  22. Zhang, Y.; Yu, B.; Pan, Z.; Hou, C.; Zuo, Q.; Sun, M. Effect of thermal maturity on shale pore structure: A combined study using extracted organic matter and bulk shale from Sichuan Basin, China. J. Nat. Gas Sci. Eng. 2020, 74, 103089. [Google Scholar] [CrossRef]
  23. Milliken, K.L.; Rudnicki, M.; Awwiller, D.N.; Zhang, T. Organic matter-hosted pore system, Marcellus Formation (Devonian), Pennsylvania. AAPG Bull. 2013, 97, 177–200. [Google Scholar] [CrossRef]
  24. Liu, J.; Zhou, Z.; Liu, X.H.; Ren, S.M.; Liu, Y.M. Geological conditions of the Mesoproterozoic shale gas accumulation in Yanshan area, North China. Acta Petrol. Sin 2019, 40, 268–278. [Google Scholar] [CrossRef]
  25. Wang, P.; Jiang, Z.; Ji, W.; Zhang, C.; Yuan, Y.; Chen, L.; Yin, L. Heterogeneity of intergranular, intraparticle and organic pores in Longmaxi shale in Sichuan Basin, South China: Evidence from SEM digital images and fractal and multifractal geometries. Mar. Pet. Geol. 2016, 72, 122–138. [Google Scholar] [CrossRef]
  26. Yang, F.; Ning, Z.; Wang, Q.; Liu, H. Pore structure of Cambrian shales from the Sichuan Basin in China and implications to gas storage. Mar. Pet. Geol. 2016, 70, 14–26. [Google Scholar] [CrossRef]
  27. Zhang, P.; Yin, Y.; Lu, S.; Li, J.; Chang, X.; Zhang, J.; Pang, Y.; Chen, G.; Liu, Y.; Li, Z. Insights into Pore Structures and Multifractal Characteristics of Shale Oil Reservoirs: A Case Study from Dongying Sag, Bohai Bay Basin, China. Energy Fuels 2022, 36, 8224–8237. [Google Scholar] [CrossRef]
  28. Zhang, S.; Yan, J.; Hu, Q.; Wang, J.; Tian, T.; Chao, J.; Wang, M. Integrated NMR and FE-SEM methods for pore structure characterization of Shahejie shale from the Dongying Depression, Bohai Bay Basin. Mar. Pet. Geol. 2019, 100, 85–94. [Google Scholar] [CrossRef]
  29. Ji, W.; Song, Y.; Jiang, Z.; Meng, M.; Liu, Q.; Chen, L.; Wang, P.; Gao, F.; Huang, H. Fractal characteristics of nano-pores in the Lower Silurian Longmaxi shales from the Upper Yangtze Platform, south China. Mar. Pet. Geol. 2016, 78, 88–98. [Google Scholar] [CrossRef]
  30. Huang, H.; Li, R.; Jiang, Z.; Li, J.; Chen, L. Investigation of variation in shale gas adsorption capacity with burial depth: Insights from the adsorption potential theory. J. Nat. Gas Sci. Eng. 2020, 73, 103043. [Google Scholar] [CrossRef]
  31. Liu, K.; Ostadhassan, M.; Zou, J.; Gentzis, T.; Rezaee, R.; Bubach, B.; Carvajal-Ortiz, H. Multifractal analysis of gas adsorption isotherms for pore structure characterization of the Bakken Shale. Fuel 2018, 219, 296–311. [Google Scholar] [CrossRef]
  32. Ji, W.; Song, Y.; Rui, Z.; Meng, M.; Huang, H. Pore characterization of isolated organic matter from high matured gas shale reservoir. Int. J. Coal Geol. 2017, 174, 31–40. [Google Scholar] [CrossRef]
  33. Li, Z.; Shen, X.; Qi, Z.; Hu, R. Study on the pore structure and fractal characteristics of marine and continental shale based on mercury porosimetry, N2 adsorption and NMR methods. J. Nat. Gas Sci. Eng. 2018, 53, 12–21. [Google Scholar] [CrossRef]
  34. Zheng, S.; Yao, Y.; Liu, D.; Cai, Y.; Liu, Y.; Li, X. Nuclear magnetic resonance T2 cutoffs of coals: A novel method by multifractal analysis theory. Fuel 2019, 241, 715–724. [Google Scholar] [CrossRef]
  35. Xu, L.; Yang, K.; Wei, H.; Liu, L.; Li, X.; Chen, L.; Xu, T.; Wang, X. Diagenetic evolution sequence and pore evolution model of Mesoproterozoic Xiamaling organic-rich shale in Zhangjiakou, Hebei, based on pyrolysis simulation experiments. Mar. Pet. Geol. 2021, 132, 715–724. [Google Scholar] [CrossRef]
  36. Zhao, J.; Jin, Z.; Jin, Z.; Hu, Q.; Hu, Z.; Du, W.; Yan, C.; Geng, Y. Mineral types and organic matters of the Ordovician-Silurian Wufeng and Longmaxi Shale in the Sichuan Basin, China: Implications for pore systems, diagenetic pathways, and reservoir quality in fine-grained sedimentary rocks. Mar. Pet. Geol. 2017, 86, 655–674. [Google Scholar] [CrossRef]
  37. Chen, J.; Xiao, X. Evolution of nanoporosity in organic-rich shales during thermal maturation. Fuel 2014, 129, 173–181. [Google Scholar] [CrossRef]
  38. Li, X.; Wang, J.; Li, Z.; Zhang, K.; Feng, X.; Wang, Z. Impact of Brittle Deformation on Pore Structure Evolution in Shale: Samples Collected from Different Fault Positions. Energy Fuels 2022, 36, 1441–1456. [Google Scholar] [CrossRef]
  39. Hu, G.; Pang, Q.; Jiao, K.; Hu, C.; Liao, Z. Development of organic pores in the Longmaxi Formation overmature shales: Combined effects of thermal maturity and organic matter composition. Mar. Pet. Geol. 2020, 116, 104314. [Google Scholar] [CrossRef]
  40. Wang, Y.; Qiu, N.; Borjigin, T.; Shen, B.; Xie, X.; Ma, Z.; Lu, C.; Yang, Y.; Yang, L.; Cheng, L.; et al. Integrated assessment of thermal maturity of the Upper Ordovician–Lower Silurian Wufeng–Longmaxi shale in Sichuan Basin, China. Mar. Pet. Geol. 2019, 100, 447–465. [Google Scholar] [CrossRef]
  41. Hu, H. Porosity evolution of the organic-rich shale with thermal maturity increasing. Acta Pet. Sin. 2013, 34, 820–825. [Google Scholar] [CrossRef]
  42. Ma, Z.; Zheng, L.; Xu, X.; Bao, F.; Yu, X. Thermal simulation experiment of organic matter-rich shale and implication for organic pore formation and evolution. Pet. Res. 2017, 2, 347–354. [Google Scholar] [CrossRef]
  43. Fan, W.B. Geological features and research progress of the Mesoproterozoic Xiamaling Formation in the North China Craton: A review after nearly one hundred years of study. Geol. Rev. 2015, 61, 1383–1406. [Google Scholar] [CrossRef]
  44. Luo, S.S.; Lv, Q.Q.; Shang, F.; Li, L.J. Characteristics of sedimentrary facies of Neoproterozoic Xiamaling formation reservoir in Xuanlong depression. FaultBlock Oil Gas Field 2011, 18, 26–29. [Google Scholar]
  45. Liu, Z.; Liu, D.; Cai, Y.; Yao, Y.; Pan, Z.; Zhou, Y. Application of nuclear magnetic resonance (NMR) in coalbed methane and shale reservoirs: A review. Int. J. Coal Geol. 2020, 218, 103261. [Google Scholar] [CrossRef]
  46. Jerry, J.S.; Alan, K.B. Evaluation of a Simple Model of Vitrinite Reflectance Based on Chemical Kinetics (1). AAPG Bull. 1990, 74, 1559–1570. [Google Scholar] [CrossRef]
  47. Chhabra, A.B.; Meneveau, C.; Jensen, R.V.; Sreenivasan, K.R. Direct determination of the f(alpha) singularity spectrum and its application to fully developed turbulence. Phys. Rev. A Gen. Phys. 1989, 40, 5284–5294. [Google Scholar] [CrossRef]
  48. Caniego, F.J.; Martí, M.A.; San José, F. Rényi dimensions of soil pore size distribution. Geoderma 2003, 112, 205–216. [Google Scholar] [CrossRef]
  49. Grassberger, P. Generalized dimensions of strange attractors. Phys. Lett. A 1983, 97, 227–230. [Google Scholar] [CrossRef]
  50. Wu, S.; Zhu, R.; Cui, J.; Cui, J.; Bai, B.; Zhang, X.; Jin, X.; Zhu, D.; You, J.; Li, X. Characteristics of lacustrine shale porosity evolution, Triassic Chang 7 Member, Ordos Basin, NW China. Pet. Explor. Dev. 2015, 42, 185–195. [Google Scholar] [CrossRef]
  51. Li, A.; Ding, W.; Wang, R.; He, J.; Wang, X.; Sun, Y.; Gu, Y.; Jiao, N. Petrophysical characterization of shale reservoir based on nuclear magnetic resonance (NMR) experiment: A case study of Lower Cambrian Qiongzhusi Formation in eastern Yunnan Province, South China. J. Nat. Gas Sci. Eng. 2017, 37, 29–38. [Google Scholar] [CrossRef]
  52. Zhang, Z.; Qin, Y.; Zhuang, X.; Li, G.; Wang, X. Poroperm characteristics of high-rank coals from Southern Qinshui Basin by mercury intrusion, SEM-EDS, nuclear magnetic resonance and relative permeability analysis. J. Nat. Gas Sci. Eng. 2018, 51, 116–128. [Google Scholar] [CrossRef]
  53. Martínez, G.A.; Davis, L.A. Petrophysical Measurements on Shales Using NMR. In Proceedings of the SPE/AAPG Western Regional Meeting, Long Beach, CA, USA, 19–22 June 2000. [Google Scholar]
  54. Huang, S.J.; Huang, K.K.; Feng, W.L.; Tong, H.P.; Liu, L.H.; Zhang, X.H. Mass exchanges among feldspar, kaolinite and illite and their influences on secondary porosity formation in clastic diagenesis: A case study on the Upper Paleozoic, Ordos Basin and Xujiahe formation, Western Sichuan depression. Geochimica 2009, 38, 498–506. [Google Scholar]
  55. Peltonen, C.; Marcussen, Ø.; Bjørlykke, K.; Jahren, J. Clay mineral diagenesis and quartz cementation in mudstones: The effects of smectite to illite reaction on rock properties. Mar. Pet. Geol. 2009, 26, 887–898. [Google Scholar] [CrossRef]
  56. Fan, M.; He, Z.L.; Li, Z.M.; Yu, L.J.; Zhang, W.T.; Liu, W.X.; Jiang, X.Q. Dissolution window of carbonate rocks and its geological significance. Oil Gas Geol. 2011, 32, 499–500. [Google Scholar]
  57. Zargari, S.; Canter, K.L.; Prasad, M. Porosity evolution in oil-prone source rocks. Fuel 2015, 153, 110–117. [Google Scholar] [CrossRef]
  58. Han, Y.; Horsfield, B.; Wirth, R.; Mahlstedt, N.; Bernard, S. Oil retention and porosity evolution in organic-rich shales. AAPG Bull. 2017, 101, 807–827. [Google Scholar] [CrossRef]
  59. Hou, Y.; Zhang, K.; Wang, F.; He, S.; Dong, T.; Wang, C.; Qin, W.; Xiao, Y.; Tang, B.; Yu, R.; et al. Structural evolution of organic matter and implications for graphitization in over-mature marine shales, south China. Mar. Pet. Geol. 2019, 109, 304–316. [Google Scholar] [CrossRef]
  60. Xue, Z.; Jiang, Z.; Wang, X.; Gao, Z.; Chang, J.; Nie, Z.; Li, H.; Wu, W.; Qiu, H.; Wang, Q.; et al. Genetic mechanism of low resistivity in high-mature marine shale: Insights from the study on pore structure and organic matter graphitization. Mar. Pet. Geol. 2022, 144, 105825. [Google Scholar] [CrossRef]
  61. Huang, C.; Ju, Y.; Zhu, H.; Lash, G.G.; Qi, Y.; Yu, K.; Feng, H.; Ju, L.; Qiao, P. Investigation of formation and evolution of organic matter pores in marine shale by helium ion microscope: An example from the Lower Silurian Longmaxi Shale, South China. Mar. Pet. Geol. 2020, 120, 104550. [Google Scholar] [CrossRef]
  62. Borjigin, T.; Lu, L.; Yu, L.; Zhang, W.; Pan, A.; Shen, B.; Wang, Y.; Yang, Y.; Gao, Z. Formation, preservation and connectivity control of organic pores in shale. Pet. Explor. Dev. 2021, 48, 798–812. [Google Scholar] [CrossRef]
Figure 1. Structure map of Zhangjiakou displaying the tectonic framework and comprehensive lithological column of the Mesoproterozoic Xiamaling shale in Zhangjiakou, Hebei Province (Modified from Xu et al. [12]).
Minerals 13 01340 g001
Figure 2. Flowchart of the experiment of this study.
Minerals 13 01340 g002
Figure 3. The model to heat cores at high-pressure and temperature.
Minerals 13 01340 g003
Figure 4. Typical NMR T2 spectra and effective porosity under fully saturated and centrifuged conditions of different-maturity samples. (a) Sample: Z1; (b) Sample: Z2; (c) Sample: Z3; (d) Sample: Z4; (e) Sample: Z5; (f) Sample: Z6; (g) Sample: Z7; (h) Sample: Z8.
Minerals 13 01340 g004
Figure 5. Log–log plot of partition function η(q, r) versus length scale r of the different-maturity samples. (a) Sample: Z1; (b) Sample: Z3; (c) Sample: Z6; (d) Sample: Z8.
Minerals 13 01340 g005
Figure 6. Generalized fractal dimension spectrum of the different-maturity samples.
Minerals 13 01340 g006
Figure 7. Multifractal singular spectrum of the different-maturity samples.
Minerals 13 01340 g007
Figure 8. Geochemical indices’ variation in the original shale sample and artificially thermal simulated samples.
Minerals 13 01340 g008
Figure 9. Mineral composition and content variation of the original shale sample and artificially thermal simulated samples.
Minerals 13 01340 g009
Figure 10. Multifractal parameters of pore structure evolution from the artificially thermal simulated samples.
Minerals 13 01340 g010
Figure 11. Petrophysical properties and pore structure parameter evolution from the original shale sample and artificially thermal simulated samples.
Minerals 13 01340 g011
Figure 12. Conceptual evolution model of the diagenetic evolution sequence and multifractal parameters of pore structure from the artificially thermal simulated samples.
Minerals 13 01340 g012
Table 1. Organic Geochemical Characteristics with different thermal maturities of the Xiamaling shale in Zhangjiakou, Hebei.
Sample IDTemperature (°C)EqRo (%)TOC (%)S1 (mg/g)S2 (mg/g)S1 + S2 (mg/g)Tmax (°C)
Z0-0.563.760.9825.4326.41431
Z14251.222.552.2116.5318.74515
Z24501.572.231.5313.3214.85578
Z34751.942.371.3211.8713.19584
Z45002.352.241.2310.2311.46596
Z55252.812.20.867.978.83603
Z65503.282.210.525.265.78610
Z75753.732.180.474.414.88623
Z86004.072.140.393.563.95634
Table 2. Mineralogical composition characteristics with different thermal maturities of the Xiamaling shale in Zhangjiakou, Hebei.
Sample IDQuartz
(%)
K-Feldspar
(%)
Plagioclase
(%)
Dolomite
(%)
Pyrite
(%)
Clay
(%)
Z-058.12.52.118.13.116.1
Z-152.72.4220.92.822
Z-252.72.41.918.32.422.7
Z-349.12.92.425.41.920.2
Z-452.42.52.225.11.616.2
Z-549.32.62.122.91.521.3
Z-645.72.5223.11.424.3
Z-748.42.62.120.31.523.8
Z-845.42.6222.31.427.7
Table 3. Results of shale movable and bound fluid saturation, T2 cutoff, and porosity by NMR.
Samples IDT2c (mc)FFI (%)BVI (%)ΦNMR (%)ΦF (%)ΦB (%)
Z10.5269.7330.279.16.352.75
Z20.9845.154.98.233.714.52
Z30.9134.0565.957.32.494.81
Z40.7948.1751.838.113.914.2
Z50.8544.3555.6593.995.01
Z61.0545.3154.699.574.345.23
Z70.9154.2345.7711.166.055.11
Z80.9147.9452.0610.455.015.44
Table 4. Characteristics of the generalized dimension from all the samples from NMR.
Samples IDTemperatureD0D1D2D0D1D−10D+10D−10D+10Hurst
Z0-10.89970.76820.10031.15770.51040.64720.8841
Z142510.84980.69690.15021.42500.45930.96570.8484
Z245010.87220.74040.12781.32680.50670.82010.8702
Z347510.86610.72260.13391.34140.48180.85960.8613
Z450010.87870.76310.12131.52840.53790.99040.8816
Z552510.86100.72530.13901.45030.48910.96120.8626
Z655010.85680.71650.14321.47860.48460.99400.8583
Z757510.84350.69600.15651.47050.46461.00590.8480
Z860010.85800.71580.14201.43300.48040.95270.8579
Table 5. Characteristics of the multifractal singularity spectra from NMR.
Samples IDTemperatureα0α1α2α−10α10α−10α0α0α+10Δα
Z0-1.07000.89970.64571.23560.45940.16550.61060.7761
Z14251.11530.84980.57181.56620.41340.45090.70191.1528
Z24501.09760.87220.62971.45400.45610.35640.64150.9979
Z34751.09880.86610.60191.47260.43360.37370.66521.0389
Z45001.10890.87870.66471.68070.48440.57180.62451.1963
Z55251.12060.86100.61081.58220.44030.46160.68031.1419
Z65501.11740.85680.60121.62590.43620.50850.68111.1897
Z75751.13140.84350.57661.61560.41820.48420.71321.1974
Z86001.11440.85800.59791.57270.43240.45820.68211.1403
Disclaimer/Publisher’s Note: The statements, opinions and data contained in all publications are solely those of the individual author(s) and contributor(s) and not of MDPI and/or the editor(s). MDPI and/or the editor(s) disclaim responsibility for any injury to people or property resulting from any ideas, methods, instructions or products referred to in the content.

