
Historic Underground Silver Mine Workings Detection Using 2D Electrical Resistivity Imaging (Durango, Mexico)


1
Cordillera Geo-Services, LLC, Cedar Park, TX 78613, USA
2
Department of Geosciences, College of Petroleum Engineering and Geosciences, King Fahd University of Petroleum and Minerals, Dhahran 31261, Saudi Arabia
*
Author to whom correspondence should be addressed.
Minerals 2022, 12(4), 491; https://doi.org/10.3390/min12040491
Submission received: 14 March 2022
/
Revised: 6 April 2022
/
Accepted: 15 April 2022
/
Published: 17 April 2022
(This article belongs to the Special Issue Electromagnetic Exploration: Theory, Methods and Applications)
Abstract
:This paper presents an underground silver mining operation outside Gomez Palacio, Durango, Mexico, terminated around the 1930s, of which previous knowledge of its operations was poor. Durango’s current silver exploration campaigns are likely to overlook historic silver mining sites due to interest in specific prospect regions. A two-dimensional (2D) Electrical Resistivity Imaging (ERI) survey coupled with reconnaissance of the area was performed at this historic silver mining site. The exploration campaign aimed to find the abandoned mineshaft, map its subsurface extent, and explore the occurrence of mineralization zones (silver ore). The ERI survey comprised five profiles measured with the extended dipole-dipole array with a consistent electrode spacing of 5 m. The smooth, robust, and damped least-squares inversion methods were used to invert the 2D data. Our field observations and ERI survey results collectively reveal the following findings: (a) reconnaissance reveals mining infrastructure consistent with historical mining activity; the infrastructure includes a complex of habitational rooms, an ore-processing pit near a concrete slab next to a dirt road, and two limestone-wall structures interpreted as the entrance of abandoned backfilled mineshafts named Mesquite and Lechuguilla; (b) high-resistivity anomalies suggest vestiges of shallow, underground mine workings including backfilled mineshafts that connect a mine gallery complex, and (c) various low-resistivity anomalies, juxtaposed against mine galleries, suggestive of unmined shallow vein-type and manto-type mineralization of hydrothermal origin. The imaging depth is estimated at ~65 m. Underground silver mining moved southwards and was limited to ~40 m depth.
1. Introduction
Thousands of years ago, humans started using metals, moving from the stone to the metal age. Therefore, they began searching for metals (the exploration phase) to utilize any available metallic mineral resources (e.g., gold, silver, copper, and iron). The outcropping ores were found, mined, and remained the primary metallic mineral sources [1]. Soon, the demands for metallic mineral resources increased, mainly since the beginning of the third industrial revolution, but at the same time, the outcropping ores were exhausted. Due to the new ore deposit conditions, theoretical (prediction), geological, geochemical, geophysical, and drilling methods have been developed to map concealed ore bodies [2,3,4,5,6]. The critical factor in mining exploration is knowing the mineralization’s nature, origin, and tectonic nature (faults, fractures, and shear zones) of the mineral deposit of interest. In general, mineralization is mainly controlled by all three factors mentioned above.
This research uses direct current (DC) Electrical Resistivity Imaging (ERI) and Induced Polarization (IP) methods for the present subsurface exploration among the geophysical prospecting methods used in mineral exploration. Electrical resistivity and IP imaging allow the spatial distribution of the low-frequency resistive and capacitive characteristics of subsurface earth materials such as mineral ores, weathered or fresh rock, unconsolidated sediments, and, respectively, uncontaminated and contaminated soils [7,8,9,10,11,12,13]. These methods are extensively utilized in mineral exploration campaigns, engineering and environmental investigations, hydrogeological studies, and archeological prospecting [7,14,15,16,17,18,19,20,21,22]. Both methods have proven successful in the mineral exploration arena worldwide because of their cost-effective and rapid ability to image natural shallow subsurface geologic structures with mineralization potential [7,8], with a certain degree of resolution dependent on the electrode spacing [23]. Specifically, underground mine workings, mainly air- and water-filled galleries, have been detected using the ERI [24,25].
Silver and other metals have been mined in Mexico since pre-colonial times [26]; however, the Spanish Empire catapulted silver mining during colonial times [27,28,29] until about the late 1880s [30]. Silver mining reshaped the economy of the Spanish Empire (e.g., the Old World) and was pivotal to creating the New World [28]. The (systematic) fall of silver mining in Mexico occurred between 1870 to 1910, coinciding with the onset of the Mexican Revolution [31]. Therefore, around the early 1900s, several mines in Durango and other states were inevitably abandoned due to economic and political unrest [28].
Currently, mineral (i.e., metallic and non-metallic) exploration efforts target many areas within northern Mexico, and Durango is one of them [29]. Currently, there are twenty-six mines extracting gold, silver, copper, lead, zinc, iron, and manganese in the State of Durango [29] in Mexico. Non-metallic minerals mined in Durango include bentonite, perlite, marble, fluorite, gypsum, clays, limestone, sands, and gravel [29]. Silver mining operations were still occurring in small proportions in the early 1900s in Durango [30,31]. An example is the (new) La Soledad mineral claim northwest of Gomez Palacio city within the Mapimi mining region. This new mining claim is adjacent to three neighboring mining districts, including Dinamita (gold, silver, and lead), Ojuela (silver, lead, and zinc), and La Platosa (iron, manganese, and marble). Historical accounts call for an unmarked, lost, abandoned mine shaft that likely stopped operation about a century ago. However, vague descriptions of the historic mining operations hampered the entire understanding of this historic silver mining site. The present two-dimensional (2D) ERI survey searched for an unmarked, old, and abandoned mineshaft within the La Soledad mineral claim limits. Field observations coupled with the 2D ERI strongly support the presence of anomalies consistent with historic underground mine workings, including two abandoned mineshafts, mine galleries, and shallow unmined mineralized zones.
2. Study Area
This section describes the study area by discussing the local geology and the findings of field observations. Figure 1 shows the geographic location of the geophysical survey.
2.1. Local Geology
The study area is within a broad carbonate-dominated region [32] and near the junction of significant tectonic terrain boundaries. In the geological map of the area (Figure 2), abandoned mines within the survey area as well as vein-type and manto-type mineralization of hydrothermal origin are reported [29,33,34]. A considerable alteration zone by oxidation affects the intrusive rocks and the limestones [34]. The study area comprises the Lower Cretaceous Aurora Formation, part of the Mezcalera Group-Baluarte Formation [34]. The Aurora Formation comprises folded, fossiliferous, weathered, gray limestones intercalated with minor thin shale horizons. Field observations reveal wide open fractures and dissolution features in the limestones and localized folding. Limestones of the Aurora Formation occur in long NW-SE-trending ridges that change into an E-W orientation. A NE-SW-striking, SE-dipping, and an NW-SE-striking, SW-dipping normal fault occur northeast and south of the survey area. Both normal faults uplifted the limestones of the Aurora Formation. Other normal and reverse faults and NW-SE-trending large-scale folds occur around the study area. The folds are overturned and recumbent, and only deformed Lower Cretaceous limestones are north and west of the survey area. The folds are a structural element of the Sierra Madre Occidental fold-thrust belt linked to the thin-skinned Sevier orogeny [33], comprised of Mesozoic marine sediments deformed during the Laramide orogeny in late Cretaceous-early Paleocene [35].
Exposed igneous rocks of granitic and dioritic composition yield an Eocene-Oligocene radiometric age and intrude the Aurora Formation [34]. The intrusive relationship is seen immediately north of the study area, separating the Sierras Mapimi and El Sarnoso (Figure 2). In particular, this pluton is part of an alkaline intrusive complex in northeast Mexico and Texas, USA [36]. Around the study area, including neighboring states of Chihuahua, Coahuila, Nuevo León, and Tamaulipas, these plutonic rocks are isolated and scarce, and their exposures are relatively small [36].
Depending on the regional tectonic observation framework, the study area is in the Sierra Madre Occidental terrane [34] or the Parral terrane [33]. A major terrain boundary separates the southern edge of the Parral terrain from the adjacent Mesa Central (MC) silicic volcanic province [33], which occurs as a wedge immediately south of the study area. The MC is an elevated plateau part of the southern Basin and Range extensional province, and the Sierra Madre Occidental volcanic province [35]. Much of the ore deposits and mineralization in the state of Durango are Mesozoic in age. The deposit types include Mississippi Valley-type (MVT) and intrusion-related deposits [33]. Ores of Zn-Pb, barite, celestine, and fluorite occur under the MVT around Gomez Palacio city [36]. The mineralization includes disseminated Cu skarns [32] and polymetallic skarn, porphyry Au-Ag, and porphyry Cu-Mo [33].
2.2. Field Observations
Reconnaissance identified anthropogenic structures in the historical mining context (Figure 3). In addition, numerous hand sample specimens of argentite ore are still found at the site. Collectively, all features support the hypothesis of a small-scale mining operation. The infrastructure includes two habitational room complexes, an ore processing pit, a work dirt road, and two mineshafts located north and south of the study area, Mesquite and Lechuguilla. The mineshafts are currently backfilled with dirt and debris. Each mine shaft is outlined by a 1.5 m tall wall circuit of limestone blocks and faces a habitation room complex. The mineshafts are immediately adjacent to the foothills of the limestone ridge and are separated by ~110 m apart. Figure 3 shows field photographs of the location of the historic mining infrastructure and their spatial relationship with the ERI survey layout.
3. Electrical Resistivity Imaging Survey
3.1. Data Acquisition
The survey area received rainfall before the first day of fieldwork which improved the data quality. A total of five (5) two-dimensional (2D) profiles, here labeled L1 to L5, were acquired. The survey layout was designed to confine the existing historic mining operations. All geoelectrical profiles were deployed within a surface area of approximately 33,280 m2 (3.33 hectares) and encompass a perimeter of ~800 m. In general, profiles L1, L2, and L3 strike east-west, while profiles L4 and L5 trend northwest-southeast (Figure 3). The inter-profile distance is not uniform. Profiles L1, L4, and L5 traverse the Mesquite mineshaft. Profiles L2 and L5 traverse the Lechuguilla mineshaft. The terrain conditions are rugged within and around the survey area. A limestone ridge dominates the eastern side of all geophysical profiles, while the western side slopes gently westwards. A differential GPS (Trimble Inc., Sunnyvale, CA, USA) was used to collect the location for each electrode for all acquired profiles, and proper topographic corrections were applied during the data inversion.
The SuperSting R8/IP/SP Resistivity meter with 56 electrodes capability (AGI Inc., Austin, TX, USA) was used to acquire resistivity and IP data with the extended dipole-dipole (DD) array and a consistent electrode spacing of 5.0 m. The electrode spacing was decided based on the desired resolution of the resulted anomalies and the expected depth of the targets. The DD protocol was selected for the data acquisition since lateral changes were mainly expected, and the DD protocol produces a better lateral extent of the subsurface features [37]. While L1, L2, and L4 were acquired in resistivity/IP mode, profiles L3 and L5 were only acquired in resistivity mode. Time constraints dictated this data acquisition restriction. The maximum electrode capability (i.e., 56 electrodes) was not possible in any of the profiles due to challenging terrain conditions for the last cable section (i.e., the end of the cable reached the edge of the limestone ridge or cliff). For all profiles, the first electrode (lowest number) was deployed on the west side of the survey area (i.e., lesser topography) so that the last electrode (highest number) and the instrument were deployed on the east side (i.e., rugged topography). This layout was due to the rugged topography. Especially for the IP survey, optimizing the IP survey’s geometry and maximizing the acquired signal by keeping at least one potential electrode between the current electrode’s pair [38] was attempted. Stainless steel electrodes were used [39] instead of the recommended porous pot (Cu-CuSO4). The resistivity meter can inject up to 2 amperes of current; however, the instruments regulate the current automatically since it is proven that more current is not always the best option [40]. An alternating polarity transmitter and hardware notch filter and stacking were used for the IP survey to minimize the noise [41].
The measurement settings were kept constant during the entire survey. Factors causing downtime included vegetation clearance along the profile path and galvanic coupling between the electrodes and the ground. Before each measurement, the resistivity data acquisition system was tested to ensure the system’s proper functioning. Instrument testing consisted of the relay test, the receiver test, and the contact resistance test. The relay test checks the performance of the relays in the switchbox. The receiver test checks that all the (eight) receivers operate correctly. The contact resistance test checks the quality of the galvanic contact between electrodes and ground before the measurement. Measurements for each profile did not begin until satisfactory and successful test results were obtained. Table 1 summarizes the data acquisition parameters.
3.2. Data Processing and Inversion
The ground contact resistance measured along each profile was favorable during the resistivity and IP survey campaign, with most contact resistances between 200–2000 Ohm (Ω) (Figure 4); however, high values occurred in profiles L1 and L3, but they amount to a small fraction of the readings. The high contact resistance clusters are attributed to poor electrode-soil contact that was difficult to improve. The low contact resistance values facilitated electrical current injection into the ground, suggesting that the area’s inter-site natural conditions are uniform. Thus, essential data reduction (noisy data removal) was made before further processing and inversion. After pre-processing the resistivity and IP data, even though most of the suggested ways were applied to improve the quality of the IP data mentioned above, the quality of the IP data was not found acceptable. It is concluded that the injection time for the IP data (500 ms, same as for the ERI survey) was not enough since a square pulse with an on-off duration of 1000 ms is suggested by Bérubé and Bérubé [42] for an IP survey. Thus, IP data were not used for the interpretation.
All 2D resistivity extended DD profiles required topographic corrections before the 2D inversion. Hence, proper topographic corrections were applied since a failure to correct local topographic effects leads to inaccuracies in the final electrical resistivity model that can affect further interpretations. Consequently, a 2D terrain file containing the electrode’s distance and elevation was created for each 2D raw data file. The finite element method was chosen for the forward modeling because it effectively handles local rugged topography.
The EarthImager 2D software (v2.1.6.503, AGI Inc., Austin, TX, USA) was used for data inversion and visualization. Three inversion methods were used to invert all the 2D resistivity data. These include smooth inversion, robust inversion, and damped least-squares inversion. While all three inversion methods were applied to all data sets, only the smooth inversion method was used for the IP data sets of profiles L1 and L2. Only the robust inversion method was applied to profile L4 due to the data mentioned above acquisition modes. Regardless of the selected 2D inversion method, the mesh transform method (i.e., damped transform) and the boundary topography (i.e., constant slope) terrain settings remain the same for all the inversions. In the damped mesh transform method, the vertical shift of nodes is gradually reduced from the ground surface to the bottom of the mesh. It is more applicable to terrains with ridges and valleys, which is the case in the present survey. The constant slope boundary topography extrapolates is based on the slope defined by two ending electrodes.
The stopping criteria for the 2D inversion for the resistivity profiles were based on the root-mean-square (RMS) percent error and the L2-Norm. The resulting RMS percent error and L2-Norm value determine the quality of the final solution, hence determining the quality factor. Three classes for the quality factor were used as follows: ok when RMS % error and L2-Norm are <20% and <10 respectively, good when RMS % error is <5% and L2-Norm is <10, and excellent in case of RMS % error is <5% and L2-Norm is about 1.
Specifically, even though three inversion methods were utilized to invert the 2D data sets of each profile, satisfactory results are not attributed to a single inversion method. For each profile, the best and most satisfactory results are based on the superior performance of the inversion method. Table 2 summarizes the resistivity inversion results (i.e., root-mean-square % error (RMS), L2-Norm, and iteration number). The RMS and L2-Norm constitute the criteria for the “quality factor” of the inversion. So, the geophysical interpreter can be confident that the interpretation of the 2D inverted resistivity is based on the best results possible for a given data set. It is expected to have variability in the quality factor of the inversion due to the unique site conditions, unique measurement conditions, and associated noise levels in the observed data sets. Each profile’s resulting inversion quality factor (Table 2) is used to judge the quality of the inversion and, in turn, final interpretations and conclusions. The resistivity inversion results from each profile, shown in Table 2, are presented on a profile-by-profile basis. As the IP data sets of L1, L2, and L4 yielded poor decay curves, their IP inversion yielded unsatisfactory results.
4. Results and Interpretation
The results and interpretations are presented on a profile-by-profile basis. However, the same color scale and resistivity values from 5 to 50,000 Ohm·m (Ω·m) were applied to all five electrical resistivity profiles for comparison purposes. The resulting shades of red color are assigned to high resistivities, and shades of blue are for low resistivities. Figure 5 presents the final inversion results for all five profiles (L1 to L5).
4.1. Profile L1
This northernmost east-west-trending profile runs near the Mesquite mineshaft and the northernmost adobe room complex and ore processing pit at a profile distance of ~143 and 167 m, respectively. It also interests profiles L5 and L4 at ~130 and ~150 m, respectively (Figure 5). The 2D inverted resistivity model, based on the smooth inversion method (Figure 5), yields an excellent quality factor. The depth of the investigation is ~60 m. The east side of the inverted resistivity model yields two semi-concentric high-resistivity anomalies at the depth range of ~3 to 45 m, labeled here as MG, interpreted as a mine gallery (MG). Both high-resistivity anomalies (MG) seem structurally connected by a drop in resistivity (~5000 Ω·m) at a 65–75 m distance along with the profile, so the MG complex length is estimated at 120 m in this profile. The relatively high-resistivity value that bisects both MG anomalies is interpreted as a tunnel (dashed lines in Figure 5, L1) that connects the mine galleries. Juxtaposed against the right-side of the high-resistivity anomalies is a shallow low-resistivity anomaly (shades of blue) interpreted as the Mesquite mineshaft’s geophysical expression. Field observations indicate that the mineshafts were backfilled with soils comprised of clay, silt, and debris (see Figure 3). However, the elongated shape of this low-resistivity anomaly is explained by moist clayey and silty soils scattered on the ground surface around the mineshaft.
4.2. Profile L2
This east-west-trending profile runs near the La Lechuguilla mineshaft at a profile distance of ~205 m, and intersects profiles L5 and L4 at ~100 and ~135 m, respectively. The 2D inverted resistivity model, based on the robust inversion method (Figure 5), yields an excellent quality factor. The depth of the investigation is nearly 70 m. The east side of the inverted resistivity model yields a shallow and elongated high-resistivity anomaly from 170 to 235 m along the profile interpreted as the Lechuguilla mineshaft connecting a shallow mine gallery (MG). A second moderately high-resistivity anomaly occurs at ~35 m, between 75 to 85 m along the profile.
4.3. Profile L3
This southernmost east-west-trending profile does not pass near any mineshaft; however, at a profile distance of 80 m, it intersects profile L4. The 2D inverted resistivity model, based on the smooth inversion method (Figure 5), yields a good quality factor and reaches an investigation depth of ~70 m. A semi-concentric high-resistivity anomaly labeled MG is centered at a depth of ~30 m, is ~15 m high, and ~30 m wide. Low-resistivity anomalies (labeled MZ) enclose it. These MZ low-resistivity anomalies have irregular geometries of larger sizes and are interpreted as unexcavated unmined mineralization zones (MZ) of significant proportions within the Lower Cretaceous limestone.
4.4. Profile L4
The northern end of this northwestern-southeastern-trending profile passes next to the southern adobe room complex and the Mesquite mineshaft at a profile distance of ~85 and ~200 m, respectively (Figure 5). It also intersects L3, L2, L1, and L5 profiles at a profile distance of ~75, 160, ~210, and ~220 m, respectively. The 2D inverted resistivity model, based on the robust inversion method (Figure 5), yields an excellent quality factor. At a profile distance of ~195 m, an elongated sub-vertical high-to-low-resistivity anomaly projects to the ground surface. The deeper have high-resistivity values that grade into low-resistivity values. This resistivity structure is indicative and explained by a vertical mineshaft backfilled with clayey and silty soils in the uppermost levels that trap moisture. The deeper levels of the mineshaft are still probably partially open. The adjacent and shallow low-resistivity anomalies around the entrance of the Mesquite mineshaft are interpreted as dispersed moist backfilled materials. A high-resistivity anomaly (labeled MG) is centered at a ~40 m depth and ~125 m distance. One side stretches towards the bottom of the mesquite mineshaft, suggesting a passage or tunnel. The opposite side connects to an inclined and elongated high-resistivity anomaly that projects to the ground surface from ~25 m depth to a profile distance of ~85 m, and it is suggestive of an inclined mineshaft that lacks a surface expression or structure. Juxtaposed against the possible inclined mineshaft are two broad low-resistivity anomalies (labeled MZ) that extend from a profile distance of 50 to ~85 m, and are thought to represent a crucial shallowly buried and unmined mineralized zone (MZ).
4.5. Profile L5
The northern end of this northwestern-southeastern-trending profile passes next to the Mesquite mineshaft at a profile distance of ~183 m, and it ends close to the concrete slab adjacent to the ore processing pit (Figure 3 and Figure 5). The backfilled Mesquite mineshaft shows a sub-vertical, ~10 m long, low-resistivity anomaly due to the clayey and silty soils that backfilled it and retained moisture after the rain predating the survey. The Lechuguilla mineshaft is 20 m away from profile L5 and is projected at a profile distance of 85–90 m (see Figure 5). Profile L5 also intersects profiles L3, L2, L1, and L4 at a profile distance of 3, ~120, ~170, and ~200 m, respectively. The 2D inverted resistivity model, based on the damped least-squares inversion method (Figure 5), yields a good quality factor. The imaging depth is estimated at ~63 m. Juxtaposed high- and low-resistivity values define broad high-resistivity (labeled MG) and low-resistivity (labeled MZ) anomalies of irregular shape. A sub-horizontal high-resistivity band interconnects the high-resistivity anomalies (MG) at the profile center. Additionally, two broad low-resistivity anomalies (MZ) wrap the MG anomalies. The high-resistivity MG anomalies extend from nearly 100 m across the profile, are ~35 m high, and occur between the Lechuguilla and Mesquite mineshafts.
The MG anomalies’ high-resistivity nature, together with the historic mining context of the site and the adjacent profiles, strongly suggests they are vestiges of historic silver mine galleries that might connect the Mesquite and Lechuguilla mineshafts. The immediately adjacent low-resistivity anomalies labeled MZ represent large unmined or abandoned mineralization zones (i.e., MZ).
5. Discussion
Underground silver mining in the study area straddled the 18th and 19th centuries; it was supported by infrastructures such as mineshafts and galleries developed within shallow depths (<~50 m), adobe room complexes for the mineworkers, and an ore processing area next to a work road (Figure 3). Unfortunately, technical documentation of the mining operation was either lost or never produced after mine closure or abandonment. This lack of information hampers our understanding of the whole historic operation. Furthermore, for nearly a century, this historic mine site has remained a rural brownfield in a highly mineralized region of Durango, Mexico, currently producing significant volumes of gold, silver, copper, iron, lead, and zinc. Therefore, to explore and re-evaluate this historic underground silver mine site’s economic potential, it was essential first to find the abandoned mineshaft and map the historic underground mine workings and any previously undiscovered or unexploited mineralized zones within the near-subsurface of the La Soledad mineral claim.
The present localized 2D ERI survey is the first prospecting work performed at this locality since its closure. There is no previously published geophysical work for this historic silver mining site; however, the Servicio Geológico Mexicano (Mexican Geological Survey) [29] carried out an airborne magnetic survey encompassing the entire state of Durango. Mining practices in colonial and post-colonial Mexico consisted of developing habitational room complexes nearby and facing the mine entrance (e.g., mineshaft) or the open pit, which is the case at this historic site. Therefore, the visual identification of historic crucial mining infrastructure (mineshafts in Figure 3) was pivotal in the survey design. Specifically, the mineshafts were expected to produce high-resistivity anomalies, a fact that was confirmed (see Mesquite and Lechuguilla mineshafts) in some of the collected profiles (Lines 2, 4, and 5). For example, it aided in the survey layout decision-making process, selecting the most optimal orientation and distributing the profiles within the rugged terrain highly vegetated with cacti flora.
The application of the three inversion methods produced consistent results. The final 2D inverted resistivity models detected anomalies consistent with both underground mine workings (high-resistivity anomalies) juxtaposed against mineralization zones (e.g., low-resistivity anomalies). These results show that underground silver mining started on the northern side of the area without reaching the southern side, containing a significant occurrence of still unmined silver ore. In particular, the south side is an excellent target (see Figure 5) for further geophysical prospecting and an exploration drilling campaign.
6. Conclusions
The present 2D ERI survey, aided by field observations, successfully detected the abandoned and undocumented historic silver mining infrastructure. While the detected high-resistivity anomalies represent abandoned underground mine workings (i.e., backfilled mineshafts and a mine gallery complex), the low-resistivity anomalies represent unmined mineralized zones. Underground silver mining was confined to shallow depths (<~50 m). Silver ore extraction was probably done from north to south, and there is still a significant underground untapped ore on the south side. This observation can be verified with exploration drilling. Geologic structures in the area include normal faults, reverse faults, strike-slip faults, fractures, fold axes, and present zones of alteration and mineralization. The adjacent intruding granite-diorite body might have brought and released the mineralized fluids. Although the current results detected underground mine workings and unmined mineralized zones of significant size, they are insufficient to accurately characterize their dimensions and geometries. Hence, a multiphysics exploration campaign is needed to enrich the ore-body understanding. The La Soledad mine claim is a prospect with the potential of hydrothermal origin’s vein-type and manto-type silver mineralization.
Author Contributions
Conceptualization, H.R.H. and P.S.; methodology, H.R.H.; software, H.R.H.; validation, H.R.H., P.K., and P.S.; formal analysis, H.R.H., P.K., and P.S.; investigation, H.R.H.; resources, H.R.H.; data curation, H.R.H.; writing—original draft preparation, H.R.H., P.K., and P.S.; writing—review and editing, H.R.H., P.K., and P.S.; visualization, H.R.H., P.K., and P.S.; supervision, H.R.H.; project administration, P.S.; funding acquisition, H.R.H. and P.S. All authors have read and agreed to the published version of the manuscript.
Funding
This research was funded in part by the start-up grant (SF18063) from the College of Petroleum Engineering and Geosciences (CPG) at King Fahd University of Petroleum and Minerals (KFUPM).
Institutional Review Board Statement
Not applicable.
Informed Consent Statement
Not applicable.
Data Availability Statement
Not applicable.
Acknowledgments
The authors gratefully acknowledge Heli Gomez for allowing the publication of this work and for his support in the data acquisition phase. We also thank Alejandro Camargo and Andres for their assistance with fieldwork.
Conflicts of Interest
The authors declare no conflict of interest. The funders had no role in the study’s design; in the collection, analyses, or interpretation of data; in the writing of the manuscript, or in the decision to publish the results.
References
- Cheng, H.J.; Chen, C.; Zhan, X.Z.; Chang, J.Y.; Ding, Y.L.; Kuwanixibieke, M.; Yang, R.H.; Jia, N.E.; Fu, H.Z. New progress in the prediction theory and prospecting method for concealed deposits. Geol. Explor. 2017, 53, 456–463. [Google Scholar]
- Fu, J.; Jia, S.; Wang, E. Combined Magnetic, Transient Electromagnetic, and Magnetotelluric Methods to Detect a BIF-Type Concealed Iron Ore Body: A Case Study in Gongchangling Iron Ore Concentration Area, Southern Liaoning Province, China. Minerals 2020, 10, 1044. [Google Scholar] [CrossRef]
- Alfouzan, F.A.; Alotaibi, A.M.; Cox, L.H.; Zhdanov, M.S. Spectral Induced Polarization Survey with Distributed Array System for Mineral Exploration: Case Study in Saudi Arabia. Minerals 2020, 10, 769. [Google Scholar] [CrossRef]
- Jorgensen, M.; Zhdanov, M. Recovering Magnetization of Rock Formations by Jointly Inverting Airborne Gravity Gradiometry and Total Magnetic Intensity Data. Minerals 2021, 11, 366. [Google Scholar] [CrossRef]
- Ihbach, F.-Z.; Kchikach, A.; Jaffal, M.; El Azzab, D.; Khadiri Yazami, O.; Jourani, E.-S.; Peña Ruano, J.A.; Olaiz, O.A.; Dávila, L.V. Geophysical Prospecting for Groundwater Resources in Phosphate Deposits (Morocco). Minerals 2020, 10, 842. [Google Scholar] [CrossRef]
- Stevens, R. Mineral Exploration and Mining Essentials; Pakawau Geomanagement Inc.: Vancouver, BC, Canada, 2011; ISBN 978-0-9867221-0-3. [Google Scholar]
- Loke, M.H.; Chambers, J.E.; Rucker, D.F.; Kuras, O.; Wilkinson, P.B. Recent developments in the direct-current geoelectrical imaging method. J. Appl. Geophys. 2013, 95, 135–156. [Google Scholar] [CrossRef]
- Binley, A.; Kemna, A. DC Resistivity and Induced Polarization Methods. In Hydrogeophysics; Springer: Dordrecht, The Netherlands, 2005; pp. 129–156. [Google Scholar]
- Simyrdanis, K.; Papadopoulos, N.; Soupios, P.; Kirkou, S.; Tsourlos, P. Characterization and monitoring of subsurface contamination from Olive Oil Mills’ waste waters using Electrical Resistivity Tomography. Sci. Total Environ. 2018, 637–638, 991–1003. [Google Scholar] [CrossRef]
- Edigbue, P.I.; Al-Mashhor, A.A.; Plougarlis, A.; Soupios, P.; Tranos, M.; Kaka, S.; Al-Shuhail, A.; Al-Garni, M. Geological and geophysical investigations of an engineering site characterization for construction purposes in Western Saudi Arabia. J. Appl. Geophys. 2021, 188, 104307. [Google Scholar] [CrossRef]
- McAnallen, L.; Doherty, R.; Donohue, S.; Kirmizakis, P.; Mendonça, C. Combined use of geophysical and geochemical methods to assess areas of active, degrading and restored blanket bog. Sci. Total Environ. 2018, 621, 762–771. [Google Scholar] [CrossRef] [Green Version]
- Kirmizakis, P.; Kalderis, D.; Ntarlagiannis, D.; Soupios, P. Preliminary assessment on the application of biochar and spectral-induced polarization for wastewater treatment. Near Surf. Geophys. 2020, 18, 109–122. [Google Scholar] [CrossRef]
- Siddiq, M.O.; Tawabini, B.; Kirmizakis, P.; Kalderis, D.; Ntarlagiannis, D.; Soupios, P. Combining geophysics and material science for environmental remediation: Real-time monitoring of Fe-biochar arsenic wastewater treatment. Chemosphere 2021, 284, 131390. [Google Scholar] [CrossRef] [PubMed]
- Power, C.; Gerhard, J.I.; Tsourlos, P.; Soupios, P.; Simyrdanis, K.; Karaoulis, M. Improved time-lapse electrical resistivity tomography monitoring of dense non-aqueous phase liquids with surface-to-horizontal borehole arrays. J. Appl. Geophys. 2015, 112, 1–13. [Google Scholar] [CrossRef]
- Ntarlagiannis, D.; Robinson, J.; Soupios, P.; Slater, L. Field-scale electrical geophysics over an olive oil mill waste deposition site: Evaluating the information content of resistivity versus induced polarization (IP) images for delineating the spatial extent of organic contamination. J. Appl. Geophys. 2016, 135, 418–426. [Google Scholar] [CrossRef]
- Demirci, İ.; Candansayar, M.E.; Vafidis, A.; Soupios, P. Two dimensional joint inversion of direct current resistivity, radio-magnetotelluric and seismic refraction data: An application from Bafra Plain, Turkey. J. Appl. Geophys. 2017, 139, 316–330. [Google Scholar] [CrossRef]
- Telford, W.M.; Geldart, L.P.; Sheriff, R.E. Applied Geophysics, 2nd ed.; Cambridge University Press: Cambridge, UK, 1990; ISBN 0-521-32693-1. [Google Scholar]
- Sağır, Ç.; Kurtuluş, B.; Soupios, P.; Ayrancı, K.; Düztaş, E.; Aksoy, M.E.; Avşar, Ö.; Erdem, G.; Pekkan, E.; Canoğlu, M.C.; et al. Investigating the Structure of a Coastal Karstic Aquifer through the Hydrogeological Characterization of Springs Using Geophysical Methods and Field Investigation, Gökova Bay, SW Turkey. Water 2020, 12, 3343. [Google Scholar] [CrossRef]
- Demirci, İ.; Gündoğdu, N.Y.; Candansayar, M.E.; Soupios, P.; Vafidis, A.; Arslan, H. Determination and Evaluation of Saltwater Intrusion on Bafra Plain: Joint Interpretation of Geophysical, Hydrogeological and Hydrochemical Data. Pure Appl. Geophys. 2020, 177, 5621–5640. [Google Scholar] [CrossRef]
- Zhdanov, M.; Endo, M.; Cox, L.; Sunwall, D. Effective-Medium Inversion of Induced Polarization Data for Mineral Exploration and Mineral Discrimination: Case Study for the Copper Deposit in Mongolia. Minerals 2018, 8, 68. [Google Scholar] [CrossRef] [Green Version]
- Oldenburg, D.W.; Li, Y.; Farquharson, C.G.; Kowalczyk, P.; Aravanis, T.; King, A.; Zhang, P.; Watts, A. Applications of geophysical inversions in mineral exploration. Lead. Edge 1998, 17, 461–465. [Google Scholar] [CrossRef] [Green Version]
- Saad, R.; Adli, I.; Mohamad, A.S. The study of iron ore prospect using 2-D resistivity and induced polarization (IP) method. Electron. J. Geotech. Eng. 2012, 17, 2981–2988. [Google Scholar]
- Griffiths, D.H.; Barker, R.D. Electrical Imaging in Archaeology. J. Archaeol. Sci. 1994, 21, 153–158. [Google Scholar] [CrossRef]
- Krishnamurthy, N.S.; Ananda Rao, V.; Kumar, D.; Singh, K.K.K.; Ahmed, S. Electrical Resistivity Imaging technique to delineate coal seam barrier thickness and demarcate water-filled voids. J. Geol. Soc. India 2009, 73, 639–650. [Google Scholar] [CrossRef]
- Das, P.; Pal, S.K.; Mohanty, P.R.; Priyam, P.; Bharti, A.K.; Kumar, R. Abandoned mine galleries detection using electrical resistivity tomography method over Jharia coal field, India. J. Geol. Soc. India 2017, 90, 169–174. [Google Scholar] [CrossRef]
- González-Sánchez, F.; Camprubí, A. La pequeña minería en México. Boletín La Soc. Geológica Mex. 2010, 62, 101–108. [Google Scholar] [CrossRef]
- Studnicki-Gizbert, D.; Schecter, D. The Environmental Dynamics of a Colonial Fuel-Rush: Silver Mining and Deforestation in New Spain, 1522 to 1810. Environ. Hist. Durh. N. C. 2010, 15, 94–119. [Google Scholar] [CrossRef] [Green Version]
- Moore, T.P. A brief history of early: Silver mining in Spanish America. Mineral. Rec. 2008, 39, 5–21. [Google Scholar]
- Servicio Geológico Mexicano (SGM). Panorama Minero del Estado de Durango; Servicio Gelogico Mexicano (Mexican Geological Survey): Pachuca, Mexico, 2020; pp. 1–65. [Google Scholar]
- Young, O.E. The Spanish Tradition in Gold and Silver Mining. J. Southwest Req. Permis. 1965, 7, 299–314. [Google Scholar]
- Pletcher, D.M. The Fall of Silver in Mexico, 1870–1910, and Its Effect on American Investments. J. Econ. Hist. 1958, 18, 33–55. [Google Scholar] [CrossRef]
- Barton, M.D.; Staude, J.-M.G.; Megaw, P.K.M. Porphyry Copper and Other Intrusion-Related Mineralization in Mexico. Arizona Geol. Soc. Dig. 1995, 20, 487–524. [Google Scholar]
- Camprubí, A. The metallogenic evolution in Mexico during the Mesozoic, and its bearing in the Cordillera of Western North America. Ore Geol. Rev. 2017, 81, 1193–1214. [Google Scholar] [CrossRef]
- Servicio Geológico Mexicano (SGM). Carta Geológico-Minera Torreón G13-9 (Scale1:250,000); Servicio Gelogico Mexicano (Mexican Geological Survey): Pachuca, Mexico, 2000. [Google Scholar]
- Tristán-González, M.; Aguirre-Díaz, G.J.; Labarthe-Hernández, G.; Torres-Hernández, J.R.; Bellon, H. Post-Laramide and pre-Basin and Range deformation and implications for Paleogene (55–25 Ma) volcanism in central Mexico: A geological basis for a volcano-tectonic stress model. Tectonophysics 2009, 471, 136–152. [Google Scholar] [CrossRef]
- Ortega-Gutiérrez, F.; Elías-Herrera, M.; Morán-Zenteno, D.J.; Solari, L.; Luna-González, L.; Schaaf, P. A review of batholiths and other plutonic intrusions of Mexico. Gondwana Res. 2014, 26, 834–868. [Google Scholar] [CrossRef]
- Neyamadpour, A.; Wan Abdullah, W.A.T.; Taib, S.; Neyamadpour, B. Comparison of Wenner and dipole–dipole arrays in the study of an underground three-dimensional cavity. J. Geophys. Eng. 2010, 7, 30–40. [Google Scholar] [CrossRef]
- Zarif, F.; Kessouri, P.; Slater, L. Recommendations for Field-Scale Induced Polarization (IP) Data Acquisition and Interpretation. J. Environ. Eng. Geophys. 2017, 22, 395–410. [Google Scholar] [CrossRef]
- Gündoğdu, N.Y.; Demirci, İ.; Özyildirim, Ö.; Aktarakçi, H.; Candansayar, M.E. Investigating the Use of Stainless Steel Electrodes with the IP Method: A Metallic Ore Deposit Example. Pure Appl. Geophys. 2022, 179, 265–274. [Google Scholar] [CrossRef]
- Malo-Lalande, C.; Desbiens, R.; Roger, S. Getting a better control of IP acquisitions with GDD’s new IP Post-Processing software. ASEG Ext. Abstr. 2018, 2018, 1–4. [Google Scholar] [CrossRef] [Green Version]
- John, P.; Copeland, A. Reduction of Noise in Induced Polarization Data using Full Time-Series Data. Explor. Geophys. 2003, 34, 225–228. [Google Scholar] [CrossRef]
- Bérubé, C.L.; Bérubé, P. Data-driven modeling of time-domain induced polarization. Geophysics 2022, 87, 135–146. [Google Scholar] [CrossRef]
Figure 1.
The satellite image shows the study area’s location in the State of Durango, Mexico (Google Earth).
Figure 1.
The satellite image shows the study area’s location in the State of Durango, Mexico (Google Earth).
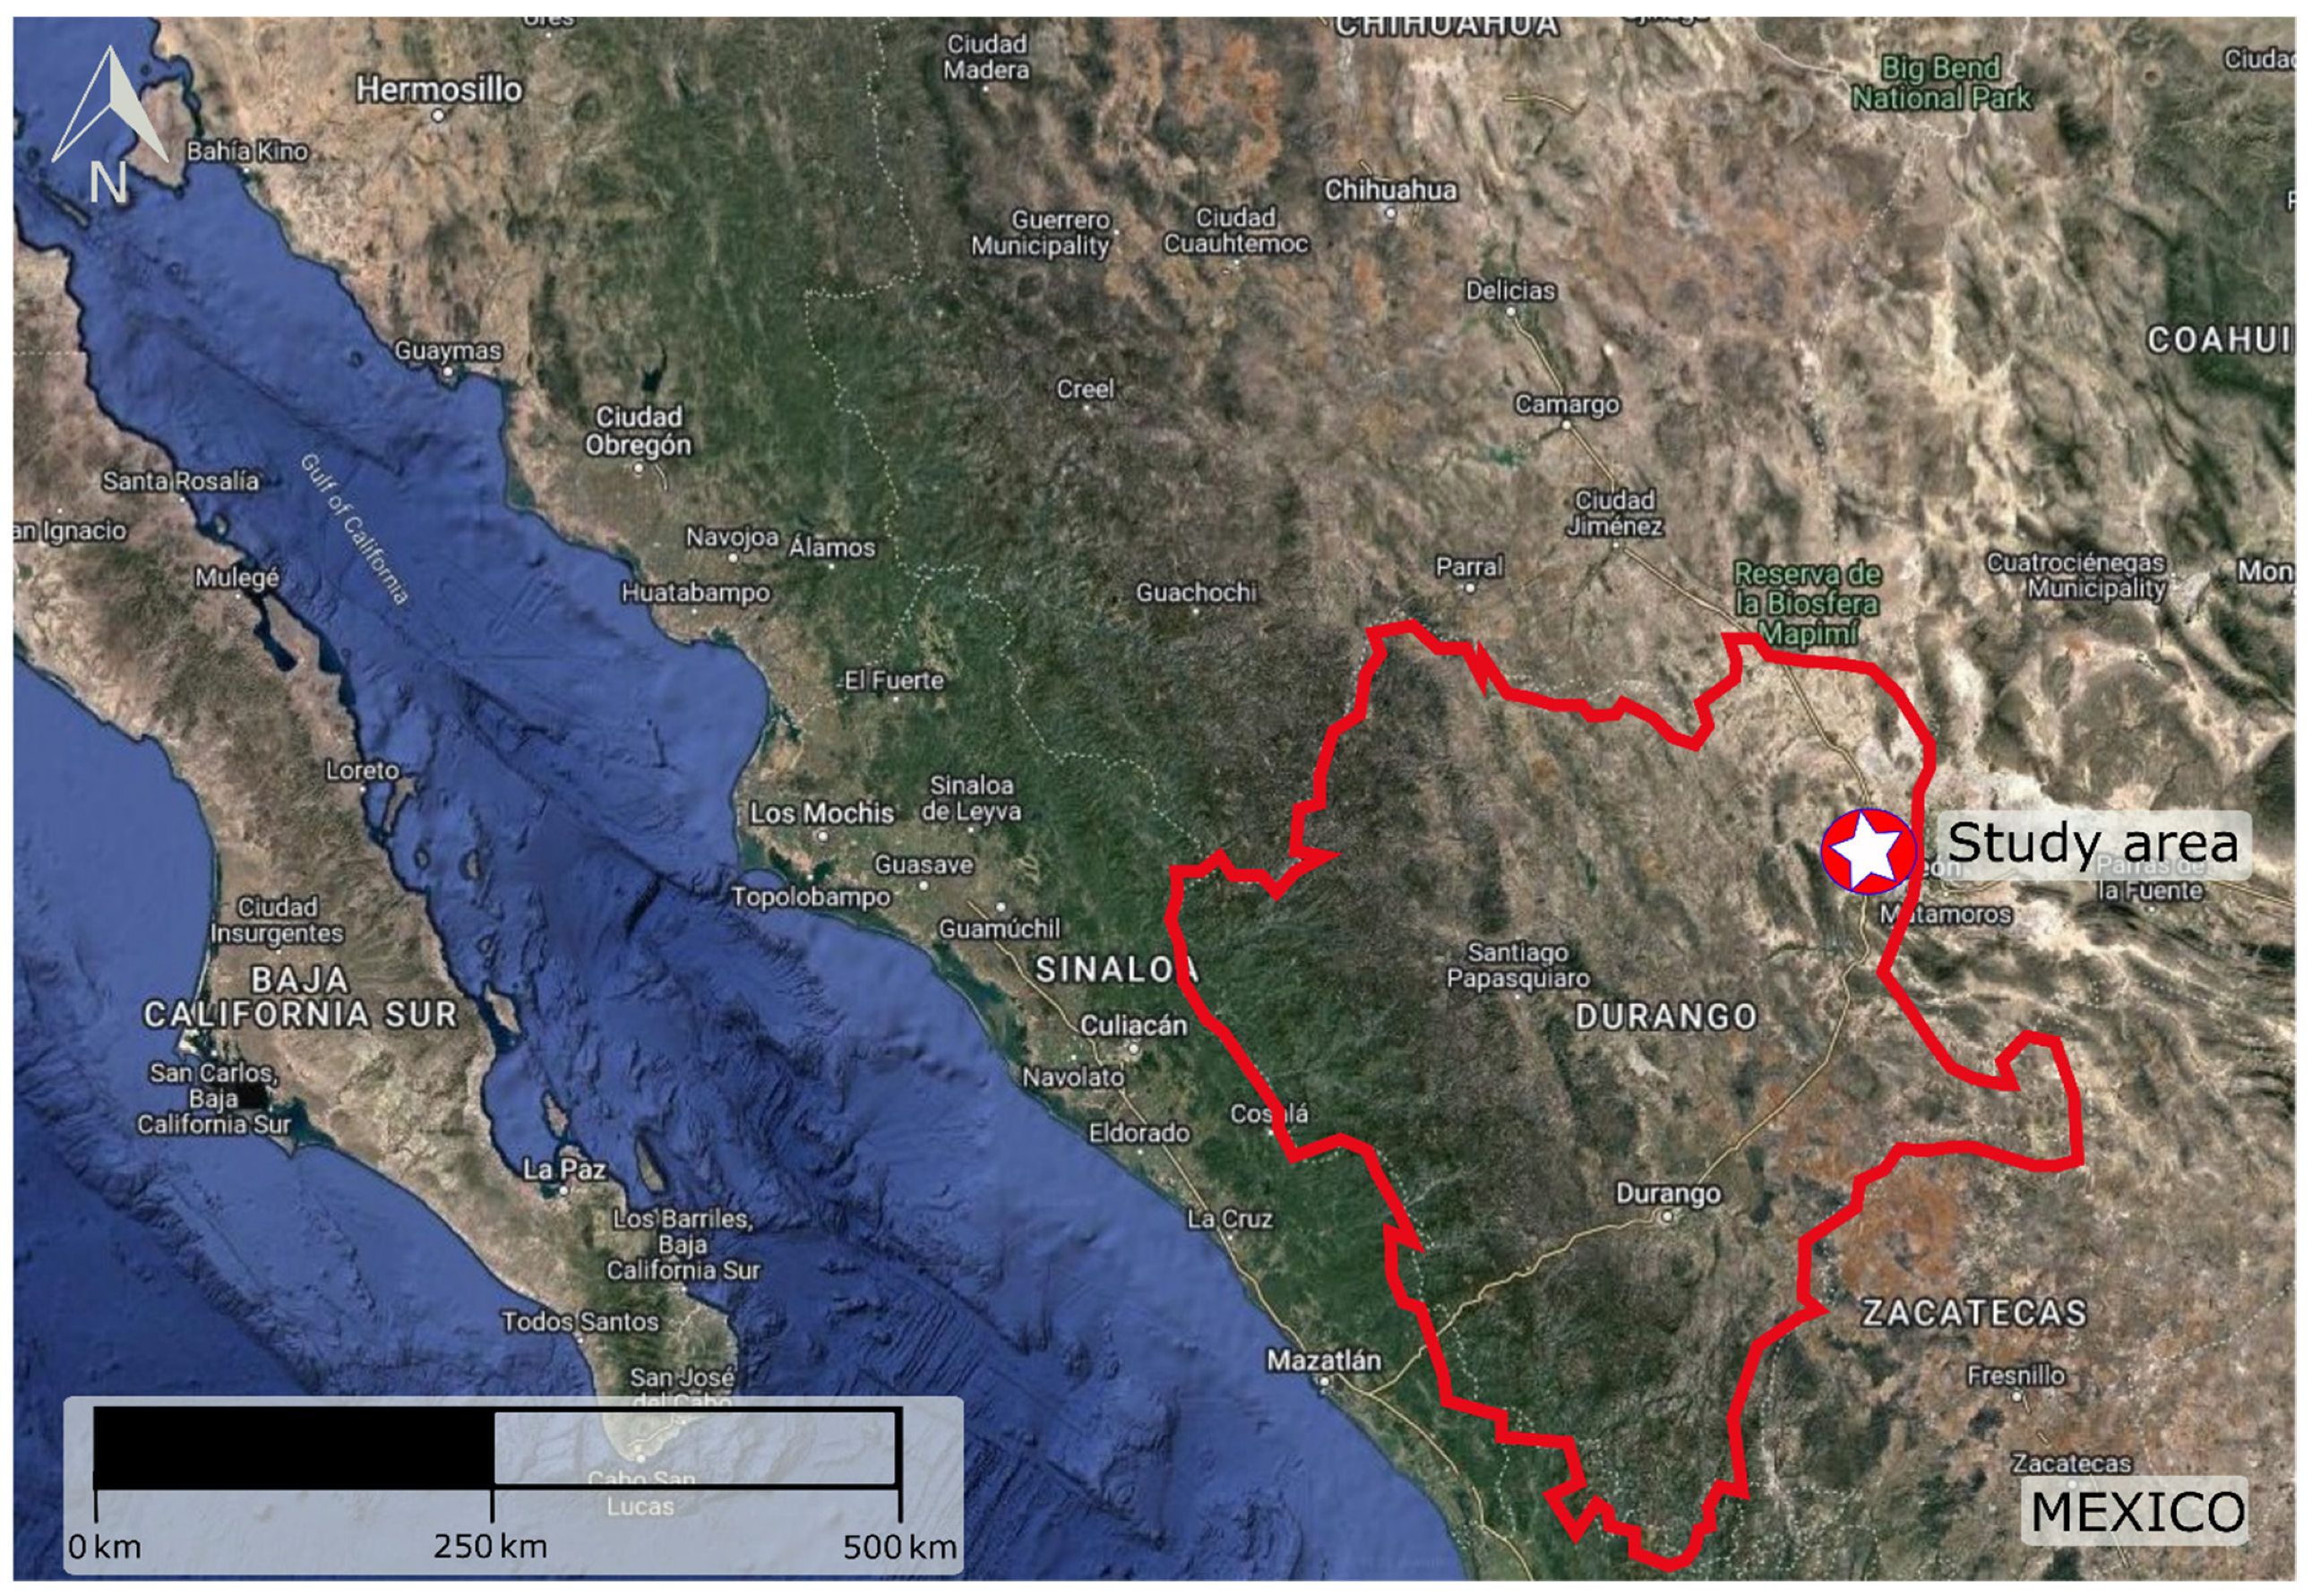
Figure 2.
The geological map of the study area (modified by Servicio Geológico Mexicano [34]). The study area is located within Lower Cretaceous limestones (white-red star) in the Sierra El Sarnoso, which comprises igneous and sedimentary rocks.
Figure 2.
The geological map of the study area (modified by Servicio Geológico Mexicano [34]). The study area is located within Lower Cretaceous limestones (white-red star) in the Sierra El Sarnoso, which comprises igneous and sedimentary rocks.
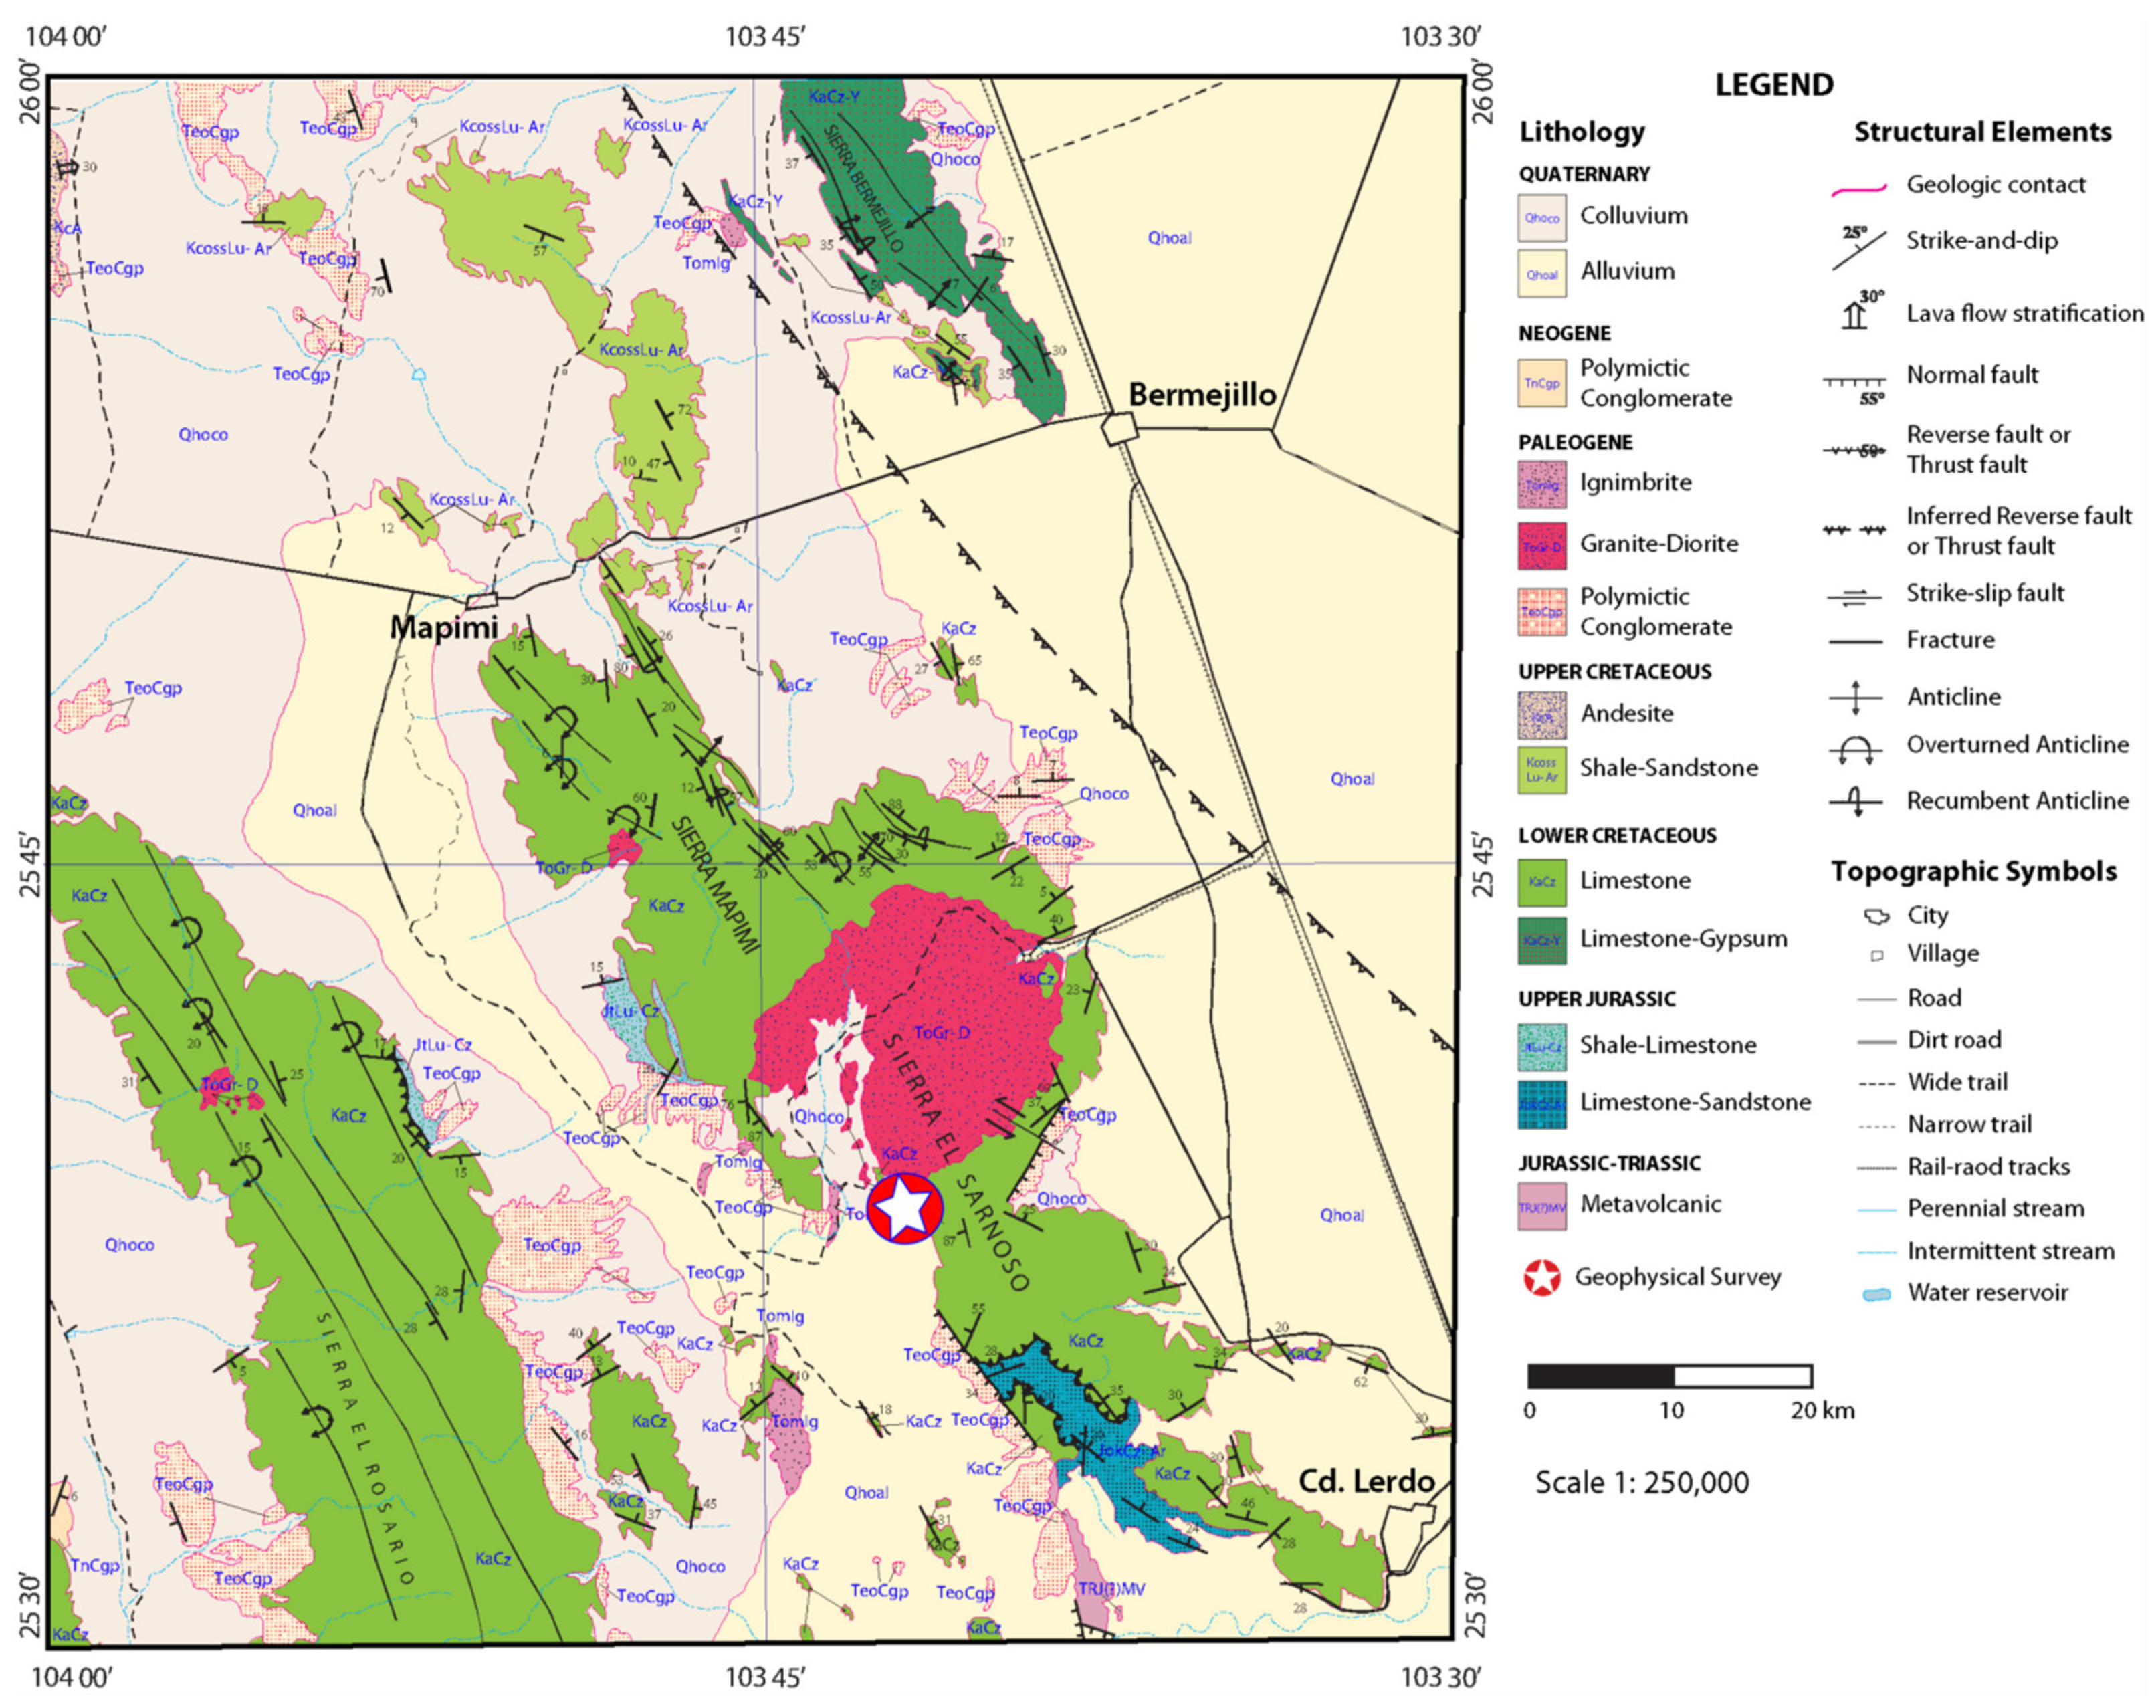
Figure 3.
Aerial photograph of the ERI survey layout around the abandoned historic mining infrastructure shown in white squares and yellow shapes (image from Google Earth). Field photographs (a–f) show the infrastructure that supported the underground silver mining operation: (a) a concrete slab near a (b) rock-and-brick ore processing pit, (c) an adobe and clay-brick room complex next to the (d) Mesquite mineshaft, and (e) an adobe room complex next to the (f) Lechuguilla mineshaft. Argentite ore hand sample collected by the ore processing pit (g). Notice that the adobe rooms are near the mineshafts for convenient surveillance.
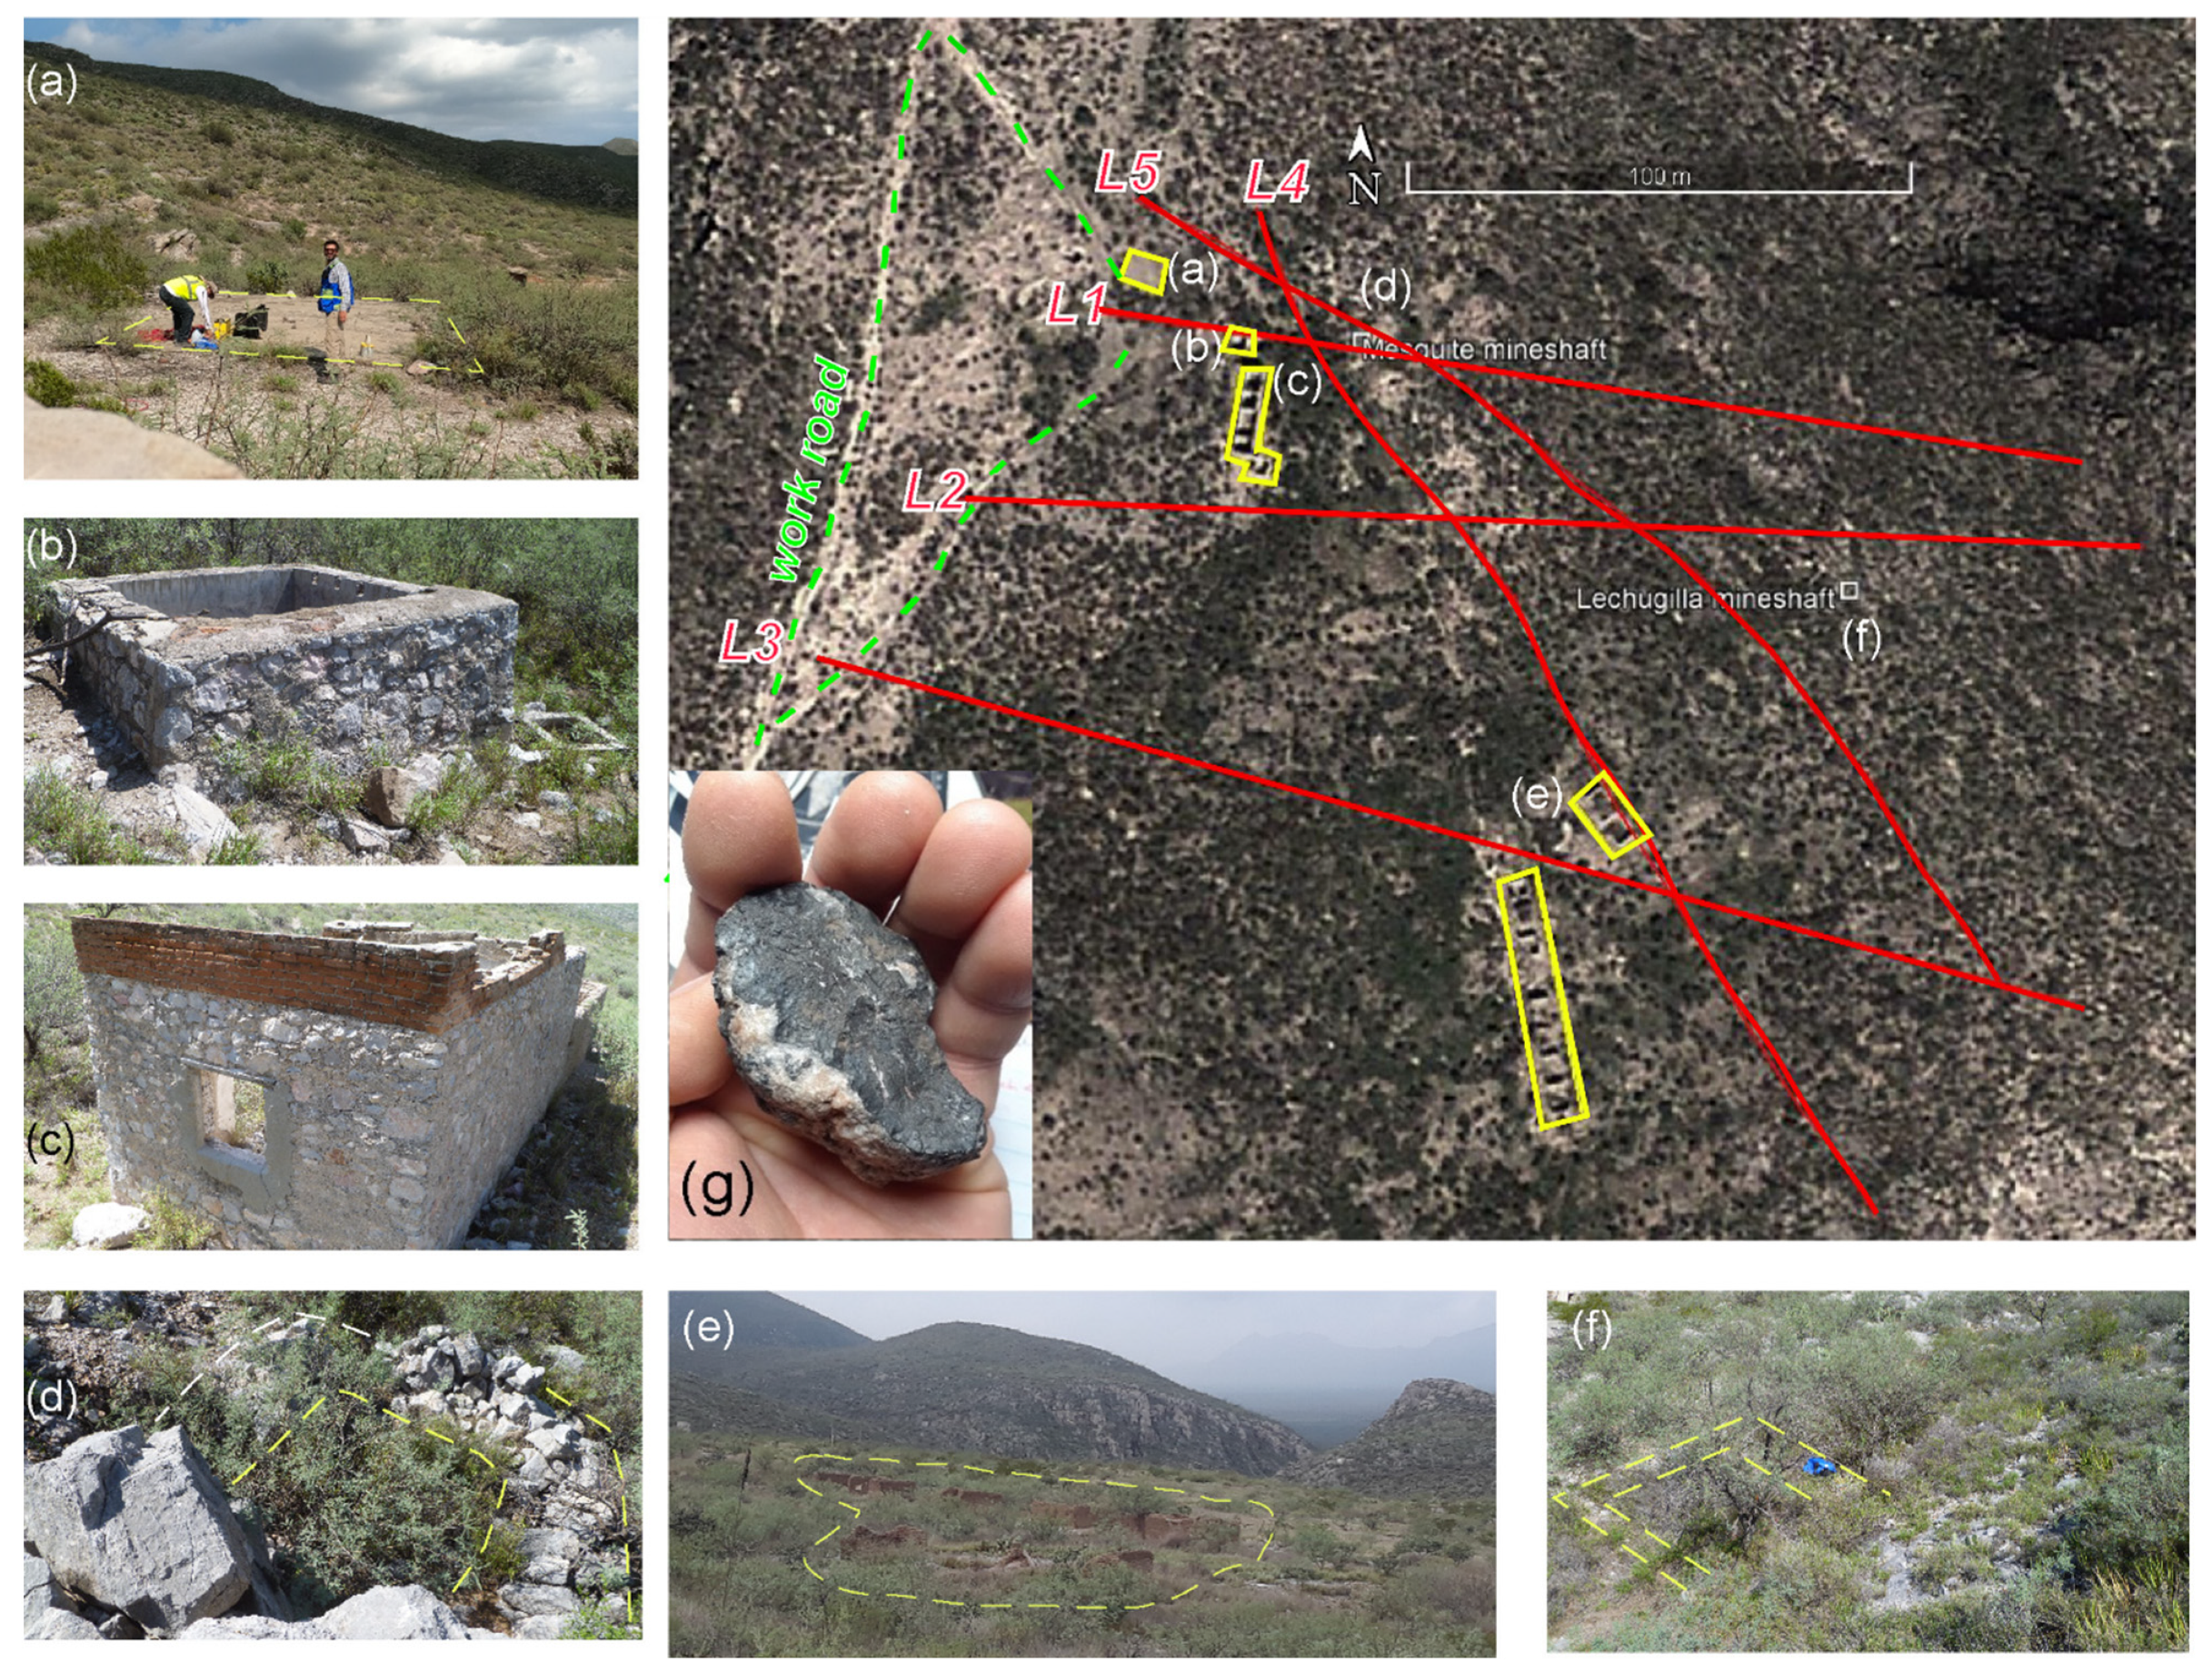
Figure 4.
Contact resistance plots of all profiles. All profiles are electrically conductive due to low contact resistance (<2000 Ω). Profiles L1 and L3 show a few measurements with high contact resistance.
Figure 4.
Contact resistance plots of all profiles. All profiles are electrically conductive due to low contact resistance (<2000 Ω). Profiles L1 and L3 show a few measurements with high contact resistance.

Figure 5.
Final inverted 2D resistivity models of profiles L1 to L5 based on Table 2 and survey layout results. The high-resistivity anomalies (shades of orange-to-red) are interpreted as abandoned historic silver mine galleries (MG). The low-resistivity anomalies labeled MZ are interpreted as unexploited mineralized zones (MZ) of silver ore. Other low-resistivity anomalies closest to the surface and the mineshafts are interpreted as water-saturated soils. The detected mineshafts were backfilled with soils and debris that trap moisture from rainwater; hence, this explains the low-resistivity values at the surface and around the mineshafts. The survey layout map also highlights a previously undiscovered and unexploited mineralization zone (dashed-green line).


Table 1.
Summary of the data acquisition parameters for all profiles (L1–L5) in the ERI survey.
| Parameter | L1 | L2 | L3 | L4 | L5 |
|---|---|---|---|---|---|
| Electrodes used | 42 | 52 | 50 | 48 | 50 |
| Profile length (m) | 205 | 255 | 245 | 235 | 245 |
| Terrain file and Y-offset | Acquired | Acquired | Acquired | Acquired | Acquired |
| Data acquired | ERI/IP | ERI/IP | ERI | ERI/IP | ERI |
Table 2.
Resistivity inversion method identifier. The selected result for final interpretation and reporting is in bold underscored letters.
Table 2.
Resistivity inversion method identifier. The selected result for final interpretation and reporting is in bold underscored letters.
| Profile | RMS % | L2-Norm | Iteration Number | Quality Factor | ||
|---|---|---|---|---|---|---|
| Yes/No | Value | Yes/No | Value | |||
| L1 | No | 7.68 a | Yes | 0.87 a | 8 | Excellent |
| No | 6.24 b | Yes | 4.32 b | 8 | ||
| No | 6.87 c | Yes | 0.81 c | 8 | ||
| L2 | Yes | 7.01 a | Yes | 1.96 a | 8 | Excellent |
| No | 5.48 b | Yes | 1.20 b | 8 | ||
| Yes | 6.32 c | No | 1.6 c | 7 | ||
| L3 | Yes | 6.11 a | No | 4.01 a | 8 | Good |
| Yes | 6.70 b | Yes | 4.85 b | 8 | ||
| Yes | 6.80 c | No | 5.01 c | 8 | ||
| L4 | Yes | 5.40 a | No | 3.24 a | 8 | Excellent |
| Yes | 3.80 b | No | 1.58 b | 8 | ||
| Yes | 3.81 c | No | 1.58 c | 8 | ||
| L5 | Yes | 9.34 a | No | 9.65 a | 8 | Good |
| Yes | 10.94 b | No | 13.29 b | 8 | ||
| Yes | 7.34 c | No | 5.99 c | 8 | ||
a = smooth; b = robust; c = damped least-squares.
Publisher’s Note: MDPI stays neutral with regard to jurisdictional claims in published maps and institutional affiliations. |
© 2022 by the authors. Licensee MDPI, Basel, Switzerland. This article is an open access article distributed under the terms and conditions of the Creative Commons Attribution (CC BY) license (https://creativecommons.org/licenses/by/4.0/).
Share and Cite
MDPI and ACS Style
Hinojosa, H.R.; Kirmizakis, P.; Soupios, P. Historic Underground Silver Mine Workings Detection Using 2D Electrical Resistivity Imaging (Durango, Mexico). Minerals 2022, 12, 491. https://doi.org/10.3390/min12040491
AMA Style
Hinojosa HR, Kirmizakis P, Soupios P. Historic Underground Silver Mine Workings Detection Using 2D Electrical Resistivity Imaging (Durango, Mexico). Minerals. 2022; 12(4):491. https://doi.org/10.3390/min12040491
Chicago/Turabian StyleHinojosa, Hector R., Panagiotis Kirmizakis, and Pantelis Soupios. 2022. "Historic Underground Silver Mine Workings Detection Using 2D Electrical Resistivity Imaging (Durango, Mexico)" Minerals 12, no. 4: 491. https://doi.org/10.3390/min12040491
Note that from the first issue of 2016, this journal uses article numbers instead of page numbers. See further details here.