Article

A Sustainable Bioleaching of a Low-Grade Chalcopyrite Ore

by
Lilian Velásquez-Yévenes
1,*,
Sebastián Malverde
2 and
Víctor Quezada
3
1
Facultad de Ingeniería, Universidad de Santiago, Av. Las Sophoras 175, Santiago 9170020, Chile
2
TRESIN SPA, Av. Vicuña Mackenna 4927, Santiago 8970117, Chile
3
Laboratorio de Investigación de Minerales Sulfurados, Departamento de Ingeniería Metalúrgica y Minas, Universidad Católica del Norte, Avenida Angamos 0610, Antofagasta 1270709, Chile
*
Author to whom correspondence should be addressed.
Minerals 2022, 12(4), 487; https://doi.org/10.3390/min12040487
Submission received: 10 February 2022 / Revised: 9 April 2022 / Accepted: 13 April 2022 / Published: 16 April 2022
(This article belongs to the Special Issue Mineral Processing and Extractive Metallurgy of Sulfide Ores)

Abstract

:
This paper reports on a study of column bioleaching of a low-grade chalcopyrite ore that is currently dump-leached under natural biological conditions without any control over microbial populations. The experimental methodology was focused on the effect of managing the bacterial populations in a raffinate solution sourced from a dump-leach operation. This study presents results from columns of two heights (0.45 and 1.0 m). We demonstrated that intermittent irrigation enhanced the chalcopyrite dissolution during column leaching, but excessively long rest periods negatively affected the chemical and bacterial activity due to the shortage of oxidizing agents and/or nutrients for microorganisms. The recovery of low-grade chalcopyrite ore was enhanced by increasing the microbial cell density. The addition of 1.5 × 10⁸ cells/mL to the 0.45 m column and 5.0 × 10⁷ cells/mL to the 1 m column resulted in increased extraction, with the copper dissolution increasing from 32% to 44% in the 0.45 m column and from 30% to 40% in the 1.0 m column over 70 days of leaching. Under these conditions, the pH level remained constant at ~1.8, and the redox potential was around 840 mV vs. the SHE throughout the experiment. These results provided useful insights for evaluating a sustainable controlled dump-based technology for mineral bioprocessing.

1. Introduction

Chalcopyrite represents approximately 70% of the world’s copper reserves [1,2,3]. It is the most abundant copper ore and one of the most refractory ores in hydrometallurgical treatment. Consequently, since the 19th century, 80% of global copper production has been generated from copper sulfide ores by conventional pyrometallurgical techniques, with the rest obtained mostly by heap leaching of copper oxide ores.
An important unresolved problem in the development of a leach process for copper sulfide ores is that chalcopyrite leaching is inhibited at ambient temperature. Numerous studies have reported the formation of a layer on the surface of chalcopyrite during dissolution. However, the nature of this "passivating layer" has not yet been established with certainty. The layer inhibits contact between the mineral and the oxidizing agents, which reduces the dissolution rate [4,5,6,7,8]. Several authors agree that sulfide mineral dissolution, particularly the passivation of chalcopyrite, is governed by redox potential-dependent reactions. Many studies have also been devoted to determining the redox potentials at which dissolution is possible and passivation occurs [9,10,11,12,13,14]. Many researchers have applied novel methods to overcome passivation in bioleaching, with strategies ranging from operating bioleaching under controlled redox potentials [15,16] to using different mixed strains of Acidithiobacillus ferroxidans and Acidithiobacillus thiooxidans, and using additives to enhance bioleaching [17,18,19].
Bioleaching is an established technique to process secondary copper sulfide ores. Efforts continue to find new applications in areas such as bioleaching metals from oxide and sulfide ores, wastewater treatment, and bioremediation of contaminated soils. Bioleaching is a natural process that leads to metal mobilization, while other biometallurgical techniques (such as sulfate reduction and others) lead to their immobilization and deposition. The microorganisms are acidophiles that can accelerate sulfide ore dissolution via the oxidation of Fe(II) and sulfur [20]. There are also neutrophilic chemolithotrophs that catalyze dissimilatory oxidation of iron and sulfur compounds [21].
Heap or dump bioleaching is a low-cost and natural microbe-assisted process that proceeds in an environment open to the atmosphere. Dump leaching is especially useful for extracting low-value mineral ores that cannot be economically processed by other methods. Sulfides are oxidized primarily by Fe(III), which is (re)generated by the activity of iron-oxidizing microorganisms. In an acidic environment, Fe(III) is reduced to Fe(II) as sulfide is oxidized to sulfate and intermediate sulfur species. The reoxidation of Fe(II) and further oxidation of intermediate sulfur species by oxygen is slow in the absence of microorganisms, but is accelerated by acidophiles that can be autotrophic and gain energy from the oxidation process, with sulfur and iron serving as electron donors. Dump leaching provides natural habitats for acidophilic microorganisms that, under acidic conditions, dissolve sulfides ores. Heterotrophic microbes that oxidize organic matter have also been detected in bioleaching heaps [22].
To date, bioleaching of chalcopyrite has not been successfully commercialized due to its slow copper dissolution rate compared to that of secondary copper sulfides [23,24,25]. Although the heap-bioleaching technique appears to be very simple in operation, the microbially catalyzed dissolution of metals inside the heap is quite complex and still not fully understood [26]. Several strategies have been proposed to increase the bioleaching of chalcopyrite, such as using photocatalysis through enhanced reduction of Fe3+ to Fe2+, with the latter serving as the substrate for microbes [27,28]. However, these methods are difficult to utilize in the practice of chalcopyrite bioleaching, especially in heap bioleaching.
The rate of copper extraction from chalcopyrite has been shown to be greatly dependent on microbial catalysis [29,30,31], with mesoacidophiles being the most broadly used microorganisms in industrial low-grade chalcopyrite heap-bioleaching operations, due to their ambient temperature optima and ranges. Metal sulfide oxidation is an exothermic process; therefore, the temperature inside heap-bioleaching systems increases, which can enhance the growth of thermophilic acidophiles [29]. According to Remonsellez et al. [32], Acidithiobacillus ferroxidans dominated during the first stages of heap bioleaching, followed by the proliferation of Leptospirillum ferriphilum and Ferroplasma Acidiphilum, which became most abundant after a few cycles, while the presence of Acidithiobacillus thioxidans was shown to be constant throughout the process.
Some acid-soluble metal sulfides such as chalcopyrite follow the polysulfide pathway. The metal sulfides are dissolved by protons, as the metal–sulfur bonds are broken at low pH, and the polysulfides oxidize the sulfur moiety to elemental sulfur [30]. Elemental sulfur can then be biologically oxidized to sulfuric acid to maintain the acidity of the bioleaching media. Equations (1)–(3) summarize the reactions:
MS + Fe3+ + H+ → M2+ + 0.5H2Sn + Fe2+ (n ≥ 2), M = metal ion
0.5H2Sn + Fe3+ → 0.125S8 + Fe2+ + H+
0.125 S 8 + 1.5 O 2 + H 2 O S O 4 2 + 2 H +
In addition, bioleaching of chalcopyrite is typically represented by the overall reaction shown in Equation (4), which occurs concurrently through a chemical attack by acid and ferric ion, as expressed by Equation (5) [26]. The Fe2+ and S in Equation (5) are subsequently oxidized by bacteria and/or archaea to generate ferric ions and sulfuric acid.
CuFeS2 + O2 + 4H+ → Cu2+ + Fe2+ + 2S0 + 2H2O
CuFeS2 + 4Fe3+ → Cu2+ + 2S + 5Fe2+
Environmental factors are critical in industrial bioleaching systems. As mentioned above, most metal sulfide oxidation reactions are exothermic, and the changes in temperature in heaps can alter the composition of microbial communities. When the temperature reaches values around 40 °C, mesophiles are replaced by thermophilic microorganisms, which in turn are replaced by extreme thermophiles at temperatures above 60 °C [26]. According to [33], the rate of metal sulfide oxidation by mesophilic acidophiles is slow compared to that catalyzed by thermophilic microorganisms. The pH level is also a key factor for microbial colonization and metabolism. According to [27], the growth of Leptospirillum ferriphilum is inhibited below pH 1.0 and above 3.0, with an optimum pH between 1.3 and 1.8 [30]; Sulfobacillus thermosulfidooxidans and Acidithiobacillus caldus are dominant at pH 2.0 and 2.5; and Leptospirillum ferriphilum and Sulfobacillus thermosulfidooxidans are often detected at pH 2.0 [30].
According to [30], archaea growing heterotrophically have played a significant role in bioleaching along with the autotrophs. Mesophiles that utilize organic substrates (but often not Fe(II)) belonging to the genera Acidiphillum, Acidocella, Acidisphaera, and Acidobacterium have been isolated from acidic environments along with chemolithotrophs such as Acidithiobacillus ferrooxidans. However, these heterotrophic and mixotrophic microorganisms also oxidize sulfur, causing the redox potential to oxidize metal sulfides and enhancing the bioleaching activities of the autotrophic metal sulfide oxidizers. Importantly, these microorganisms have also been shown to consume organic compounds inhibitory to the autotrophic species and support the growth and activity of acidophilic Fe(II) oxidizers by reduction of Fe(III) to Fe(II) [34].
This study presents the results of column bioleaching of a low-grade chalcopyrite ore that is currently processed through dump leaching under uncontrolled biological conditions, with the focus on the effect of intermittent irrigation.

2. Materials and Methods

2.1. Ore Samples

The chalcopyrite ore sample used for these experiments was provided by a dump-leaching operation in Chile. The chemical composition of the mineral was reported as 0.35% Cu and 3.5% Fe, using acid digestion followed by inductively coupled plasma atomic emission spectroscopy (ICP-AES) using an Optima 2000 DV (PerkinElmer, Überlinge, Germany).
The ore sample was analyzed mineralogically using Quantitative Evaluation of Minerals by Scanning Electron Microscopy (QEMSCAN), using a Zeiss EVO 50 (Zeiss, Oberkochen, Germany). The copper-bearing sulfide minerals in the ore were mainly composed of chalcopyrite (CuFeS2), with minor amounts of chalcocite (Cu2S), pyrite (FeS2), and traces of other copper minerals (Figure 1). The complete mineralogical composition of the ore is shown in Table 1. The sample was crushed to two different particle-size distributions: <6.35 mm and <19.05 mm. Figure 2 shows the particle-size distribution of the two samples used in all tests.

2.2. Bacterial Strains and Growth Conditions

An ore residue collected from a copper dump-leaching plant in Chile was loaded into a 0.45 m high column and irrigated with 4.5 K medium consisting of (NH4)2SO4 (2.0 g/L), K2HPO4 (0.25 g/L), MgSO4·7H2O (0.25 g/L), KCl (0.10 g/L), and FeSO4·7H2O (22 g/L) through a closed-cycle pumping system. Aeration (at a rate of 10 m3 m−2 h−1) was provided through a diffuser inserted at the base of the column. The percolated solution obtained from this process was recirculated to the column to maintain the natural conditions of the process, and thus increase the bacterial population density. The column system was operated for 75 days. The density of the microbial strain obtained was then diluted to 20% with a new nutrient solution. The pH of the media was adjusted with H2SO4 to the desired value. The cell concentration (planktonic cells) in liquid samples was directly analyzed by chamber counting under a phase-contrast microscope (Thoma chamber, depth 0.010 mm) after cell detachment.
Two ore samples (2 kg each) obtained from the mining operation were loaded into small columns. Subsequently, a solution with nutrients in a 4.5 K medium was recirculated through a controlled pumping system at a rate of 8 L/h/m2 Then, the industrial raffinate solution was adjusted with nutrients in a 4.5 K medium, and a controlled air flow was injected into this adjusted raffinate solution. After 20 days of this procedure, two solution samples obtained from the ore residues and a sample of the industrial raffinate were sent to the microbiology laboratory of the Fraunhofer Foundation. DNA was extracted from each sample, and duplicate sequencing was carried out. High-throughput sequencing was carried out on an Illumina Novaseq 6000 platform by reading 250 pair-ends of a 16SrRNA amplicon corresponding to the V3–V4 region of the gene to observe its bacterial biodiversity. The readings obtained were refined and analyzed bioinformatically to obtain the relative abundance percentages of the microorganisms present in each sample. On average, each sample exceeded 300,000 data points, except for the industrial raffinate sample, which generated less than half of that, which was mainly attributed to contaminating agents such as sulfates or salts in the solution. Table 2 shows the results according to the genes of the microorganisms present in the sample and their relative abundances. The samples obtained from the residue ore presented the genus Acidiphilium at 100% abundance, which is common in bioleaching [30]. On the other hand, the sample obtained from the industrial raffinate presented a greater diversity of microorganisms, but not all of them were related to the bioleaching process; we observed that the only genus that fulfills this function is also Acidiphilium.

2.3. Chalcopyrite Column Leaching

Leaching was carried out in two series in acrylic columns. The columns in the first series were 0.087 m in diameter and 0.45 m in height. Each column was filled with 3 kg of ore residue (the leaching conditions are listed in Table 3). The columns in the second series were 0.15 m in diameter and 1 m in height. These columns were filled with 25 kg of homogenised ore (the leaching conditions are listed in Table 4). A perforated acrylic disk was placed 2 cm above the bottom of each type of columns to support the ore. Filter cloth was fixed on the perforated disk to prevent fine particles from being washed out. Filter cloth was also placed on top of the ore to aid in the distribution of the solution. A column schematic and a picture of the actual leaching system are shown in Figure 3a,b, respectively. All leaching columns were irrigated with industrial raffinate solutions (from the mining operation) adjusted under the conditions summarized in Table 3 and Table 4. The composition of the raffinate solution was typical of that from many hydrometallurgical plants in Chile. The column irrigation rate was 6 L/h/m2 using a peristaltic pump. As shown in Table 3 and Table 4, irrigation days were followed in some columns by a rest period, then the irrigation was resumed for another 5 days (5 days of irrigation/20 days of a rest period or 5 days of irrigation/10 days of a rest period), with three cycles each involving three alternating irrigation and rest periods for each column test (tests 7, 8, 9, 14, 15, and 16). A 10 mL aliquot of pregnant leach solution was collected at regular intervals and analyzed for total copper and iron using atomic absorption spectrophotometry (AAS). Subsequently, the pregnant leach solutions (PLS) obtained from each column were sampled to microscopically count and monitor the bacteria. The solutions were loaded into the Neubauer chamber, where a microbial count was conducted. The inoculation process and bacterial count study were complemented with monitoring the pH and redox potential condition in the PLS solutions. The pH and redox solution potential were regularly measured using a pH-ORP meter (HANNA Instruments, HI-4222, St. Louis, MO, USA). The pH measurements were performed using an HI1332 Hanna electrode. The oxidation–reduction potential (ORP) measurements were performed by using an HI3230 Hanna electrode with platinum as the metal indicator and a silver wire coated with AgCl as the reference element. All solution potentials were converted to values against the standard hydrogen electrode (SHE).

3. Results

3.1. Enrichment of Strain

Figure 4 shows the growth curve of the bacterial population in the percolated solution obtained from the inoculation process. The microorganisms grew rapidly in the first 8 days after inoculation, reaching a bacterial population of close to 2.0 × 10⁸ cells/mL. Subsequently, there was an adaptation stage at around 20 days after inoculation, and then a period of continuous growth in the bacterial population up to 52 days after inoculation, when the microbial density stabilized at around 3.7 × 10⁸ cells/mL, at which point a solution enriched in microorganisms had been obtained, allowing the use of this bacterial medium with irrigation solutions of 1.5 × 10⁸ cells/mL for the columns 0.45 m in height and 5.0 × 10⁷ cells/mL for the columns 1.0 m in height. The lower number of microorganisms in the columns 1.0 m in height was due to the volume of inoculum required to prepare a large volume of raffinate to irrigate the columns with 25 kg of ore.

3.2. Leaching in Columns 0.45 m in Height with Continuous Irrigation

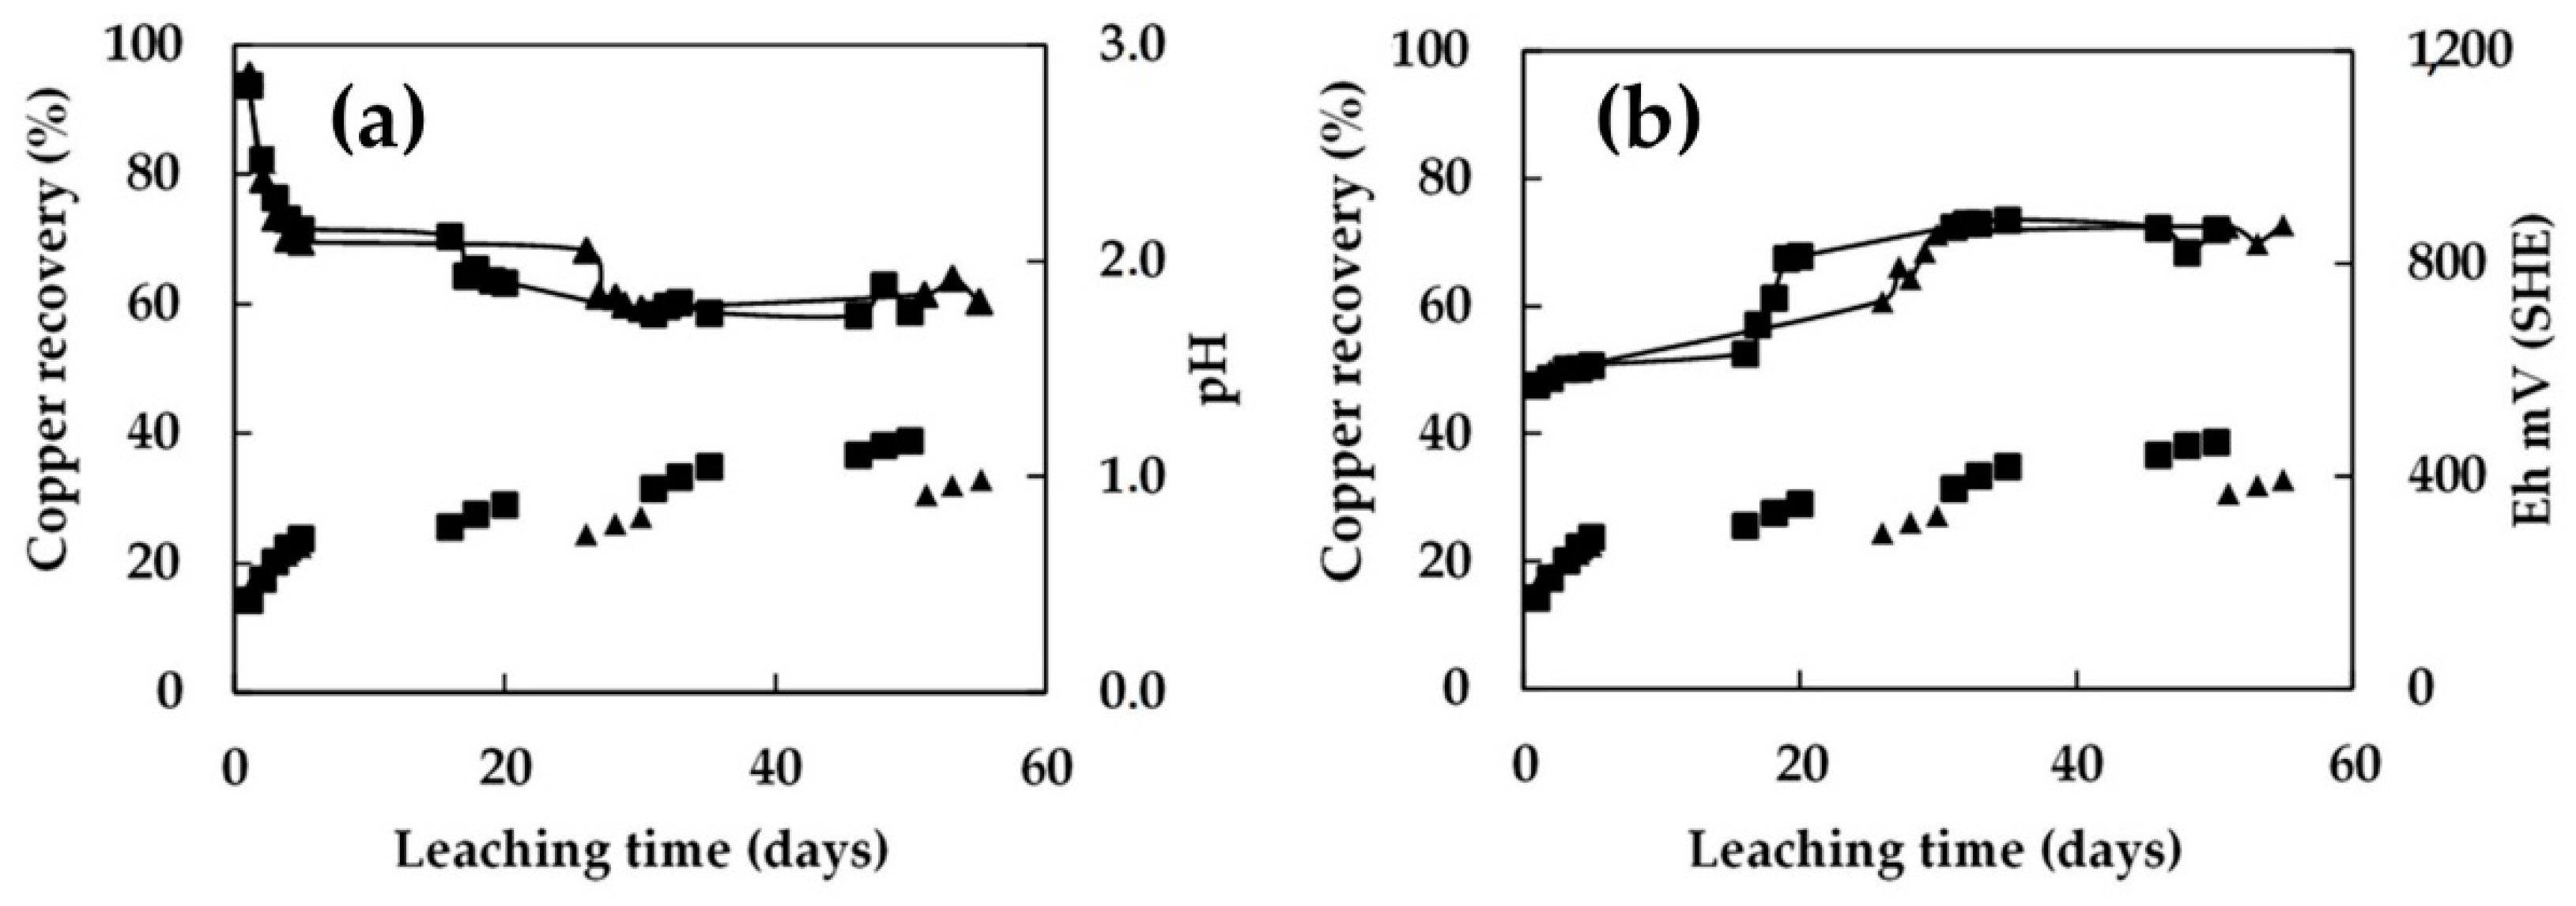
Figure 5 shows the results of the small-scale column leaching test with chalcopyrite. The tests employed the raffinate solution (Table 3) with continuous irrigation. The copper extraction rate clearly increased as the concentration of acid increased, reaching 33%, 39%, and 44% after 55 days with acid concentrations of 6 g/L, 10 g/L, and 20 g/L, respectively. Figure 5a shows the pH in the initial irrigation period (5 days). The pH of the PLS experienced a drop due to the conditioning of the medium, after which it remained stable between pH values of 1 and 1.4 in the three continuously irrigated columns. Figure 5b shows that the redox potential of the PLS solution remained steady after leaching day 5, stabilizing at close to 630 mV (SHE). The solution redox potential was an indication of bacterial activity in the system; Figure 5b shows high Eh values in all inoculated columns. However, the column with the lowest concentration of acid had a high redox potential of around 840 mV (SHE) after leaching day 20, perhaps as a result of a rapid reoxidation of Fe2+ ions at pH values between 1.2 and 1.4, which could also be an indicator of a natural growth of microorganisms.
Figure 6 shows the dissolution of the chalcopyrite ore during column leaching with continuous irrigation at different pH levels and with the addition of 1.5 × 10⁸ cells/mL. The highest dissolution extraction of around 44% was obtained at pH 2, while similar dissolutions of 35% and 34% were obtained at pH 1.8 and 1.5, respectively. Comparing these results to those shown in Figure 5, the addition of microorganisms to the raffinate with the lower concentration of acid slightly increased the dissolution of copper (Table 3). Concerning the variation in pH levels, Figure 6a shows that at the beginning of the process, all the pH levels increased as the result of the chemical reactions between the bioleaching medium and the chalcopyrite ore, and then stabilized at around day 20. Figure 6b shows that the redox potential increased in all the columns from 600 mV (SHE) to a stable value of around 880 mV (SHE) at leaching day 10, an indication of bacterial activity in the system.

3.3. Bioleaching in Columns 0.45 m in Height with Intermittent Irrigation

Figure 7 shows the results of a small-scale column leaching test on the chalcopyrite ore to study the effects of intermittent irrigation in three cycles for two test series, one with 5 days of irrigation and 10 days of rest (5/10), and the other with 5 days of irrigation and 20 days of rest (5/20). Clearly, the copper extraction was higher with a shorter rest period. The highest copper dissolution rate of 40% was obtained after 55 days of overall leaching with three 5/10-day cycles of intermittent irrigation, with a raffinate containing 2 g/L of acid, 0.5 g/L of copper (II), and 1.5 × 10⁸ cells/mL. The dissolution was 10% higher than the rate obtained with the column leached under the same conditions, but with an intermittent irrigation cycle of 5/20 days, and 5% higher than the extraction obtained with column leached at pH 1.8 with continuous irrigation (see Figure 6). These results reflected the positive effect of maintaining a short rest period (under 10 days) in copper extraction. During a more extended rest period, the bacterial activity was reduced, likely due to a decrease in the amount of nutrients in the mineral substrate, depleting the energy source of the bacteria. With a 20-day rest period, the quantity of nutrients in the mineral substrate decreased, depleting the energy source of the bacteria.
The pH level decreased progressively and consistently in both columns with every irrigation cycle. On leaching day 30, the pH level stabilized at around 1.8 and remained at that level until leaching day 55 (Figure 7a). Figure 7b shows variations in the solution redox potential, with a progressive increase in the solution redox potential of both columns, similar to the results shown in Figure 6b. The redox potential of the column leached with the 5/10-day irrigation cycle increased significantly on leaching day 15, rising from 630 mV (SHE) to 880 mV (SHE), and then remaining at that level until leaching day 50. At the same time, the behavior of the column with a 5/20-day irrigation cycle was similar to bioleaching day 26, reaching 880 mV (SHE).
Figure 8 shows the copper extraction, together with the variations in pH and redox potential in the PLS, respectively, for the columns irrigated intermittently with 1.5 × 10⁸ cells/mL in the raffinate solution from the second cycle of the intermittent irrigation. A lower copper recovery of 28% was obtained by leaching day 50, when the column was only irrigated in the second cycle with raffinate mixed with 1.5 × 10⁸ cell/mL. The addition of microorganisms in the second cycle resulted in a small increase of 4% in the copper extraction, indicating that the microorganisms required more extended adaptation periods to obtain more favorable results [31]. Figure 8b shows the possible variations in the redox potential, reflecting a progressive increase in the first 15 days of bioleaching, reaching 640 mV (SHE). As of leaching day 16, there was a significant increase in the redox potential from 640 mV (SHE) to 860 mV (SHE) due to more significant bacterial activity in the mineral bed and the irrigation solutions of the second cycle of the process. Following this period, the redox potential remained constant until bioleaching day 50.

3.4. Bioleaching in Columns 1.0 m in Height with Continuous Irrigation

Due to significant differences in scale, small-scale operations cannot be compared directly to heaps or dumps. Consequently, an intermediate scale was needed to validate the results from small-scale operations. Experiments were carried out under different conditions in seven columns 1.0 m in height. Table 4 shows the operating conditions for each column. Figure 9 shows the copper recovery rates of column bioleaching with continuous irrigation. The least favorable leaching condition was in the column irrigated directly with the raffinate from the plant dump containing only 107 cells/mL of bacteria, with a copper recovery rate of only 31% by leaching day 65.
The adjustments made to some conditions in the solution favored copper extraction. Figure 9 shows that the column irrigated with the same raffinate, but with an increased amount of 5.0 × 10⁷ cells/mL in bacterial density, resulted in a 6% increase in the copper dissolution rate, reaching 37% in 65 days. This result indicated that the conditions and initial bacterial population of 107 cells/mL were insufficient to efficiently bioleach copper from the chalcopyrite ore.
Two further columns were irrigated with adjusted raffinate solutions with 1.0 g/L total iron, 0.5 g/L Cu (II), and 5.0 × 10⁷ cells/mL. The pH levels were controlled at 1.5 in one column and at pH 2.0 in the other. Figure 9 shows that column bioleaching for 65 days at pH 1.5 achieved a 35% copper recovery, while at pH 2.0, the recovery was 32%. The PLS solutions with the highest pH levels were attributed to a higher activity of Acidiphilum, which stabilized the pH value (Figure 10a). These results indicated that the most suitable pH level in the raffinate was approximately 2.0. Higher pH values precipitated the iron in the solution and reduced the concentration of ferric ions, one of the most important ions in bioleaching. This precipitation decreased the Fe3+ concentration in the solution and thus reduced the metal extraction rate. The possible formation of a jarosite layer on the mineral surface could have inhibited the mineral ore dissolution. Jarosite formation is described below in Equation (6) [33]:
3 Fe 3 + + 2 S O 4 2 + 6 H 2 O + M + MFe 3 ( SO 4 ) 2 ( OH ) 6 + 6 H +
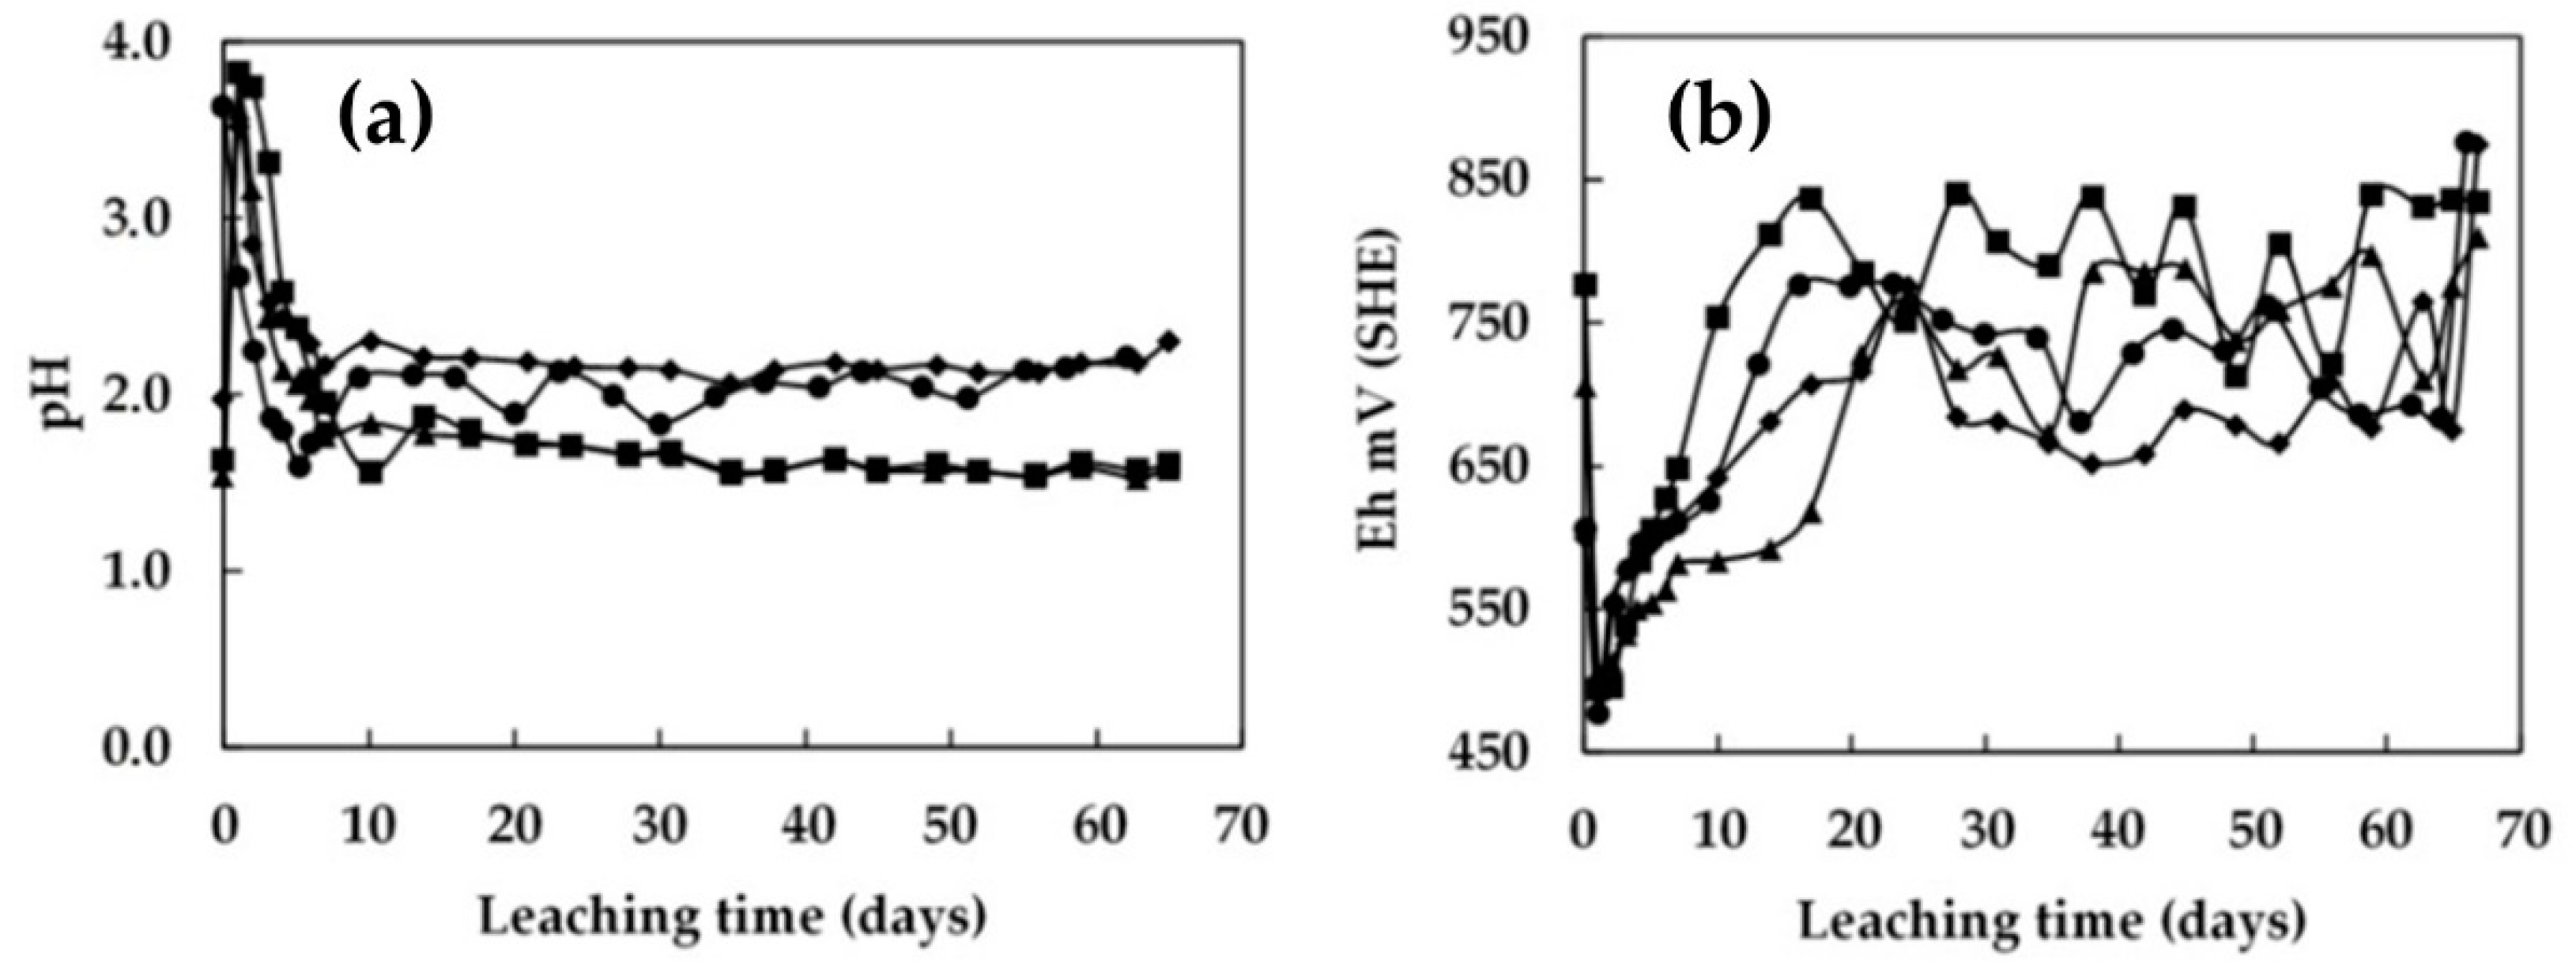
Figure 10 shows the variation in the pH (Figure 10a) and redox potential in the bioleaching columns (Figure 10b). The pH levels clearly increased in all four columns in the first days of bioleaching. The increase in pH was due to the most rapid copper dissolution occurring in the initial period of the leaching process, and this resulted in a significant consumption of acid, thus decreasing the acidity of the solution. After this period, the acidity of the solution increased due to the decrease in the copper dissolution kinetics, which stabilized on leaching day 10. In contrast, a variation in redox potential (Figure 10b) occurred in all four columns, with redox potential levels higher than 800 mV vs. the SHE, even in the column irrigated with the lowest bacterial population of 107 cells/mL. This reflected the fact that it took more time for the redox potential to increase than for the pH level to decrease, which could have indicated a progressive and sustained adaptation of microorganisms in the mineral bed.

3.5. Bioleaching in Columns 1.0 m in Height with Intermittent Irrigation

Figure 11 shows the copper recovery rate when the chalcopyrite ore was leached with intermittent irrigation by adding a raffinate containing 12 g/L of acid, 1.0 g/L of total iron, 0.5 g/L copper (II), and 5.0 × 10⁷ cells/mL. The column with three cycles of 5 days of continuous irrigation and 10 days of rest (5/10 days) reached a copper extraction of 38% in 75 days of leaching. The same results were obtained in the duplicate column. Both tests resulted in slightly higher recovery rates than in the columns that were leached with continuous irrigation (37%) and without controlling the pH level. The column irrigated with 5 days of continuous irrigation and 20 days of rest (5/20 days) achieved a 34% copper extraction in 70 days of leaching. We believe that the lower copper extraction in this case was an indication that the rest period was excessively long, and thus negatively affected the chemical and bacterial activity in the mineral bed, possibly due to a shortage of oxidizing agents and/or nutrients for the microorganisms.
Figure 12a shows the variations in the pH level in the metal-rich solution with intermittent irrigation. The pH level increased in all three columns in the first days of bioleaching, showing a similar trend to that in the columns with continuous irrigation. After the initial irrigation stage, the pH levels in the PLS solutions decreased until the fifth day of irrigation. The pH levels in all the columns irrigated intermittently increased cyclically, coinciding with the first irrigation cycle, which then declined, settling at a pH of around 1.4. Figure 12b shows the variations in redox potential in all the bioleaching columns. Interestingly, none of the columns exceeded 800 mV (SHE). The column operated with the 5/20-day cycle had the lowest redox potential. It should be observed that in both experiments with the shorter rest cycle, the redox potential increased during the irrigation, whereas it did not in the long rest cycle, indicating that the bioleaching culture had gone dormant and did not increase during active irrigation.

3.6. Evolution of Bacterial Growth

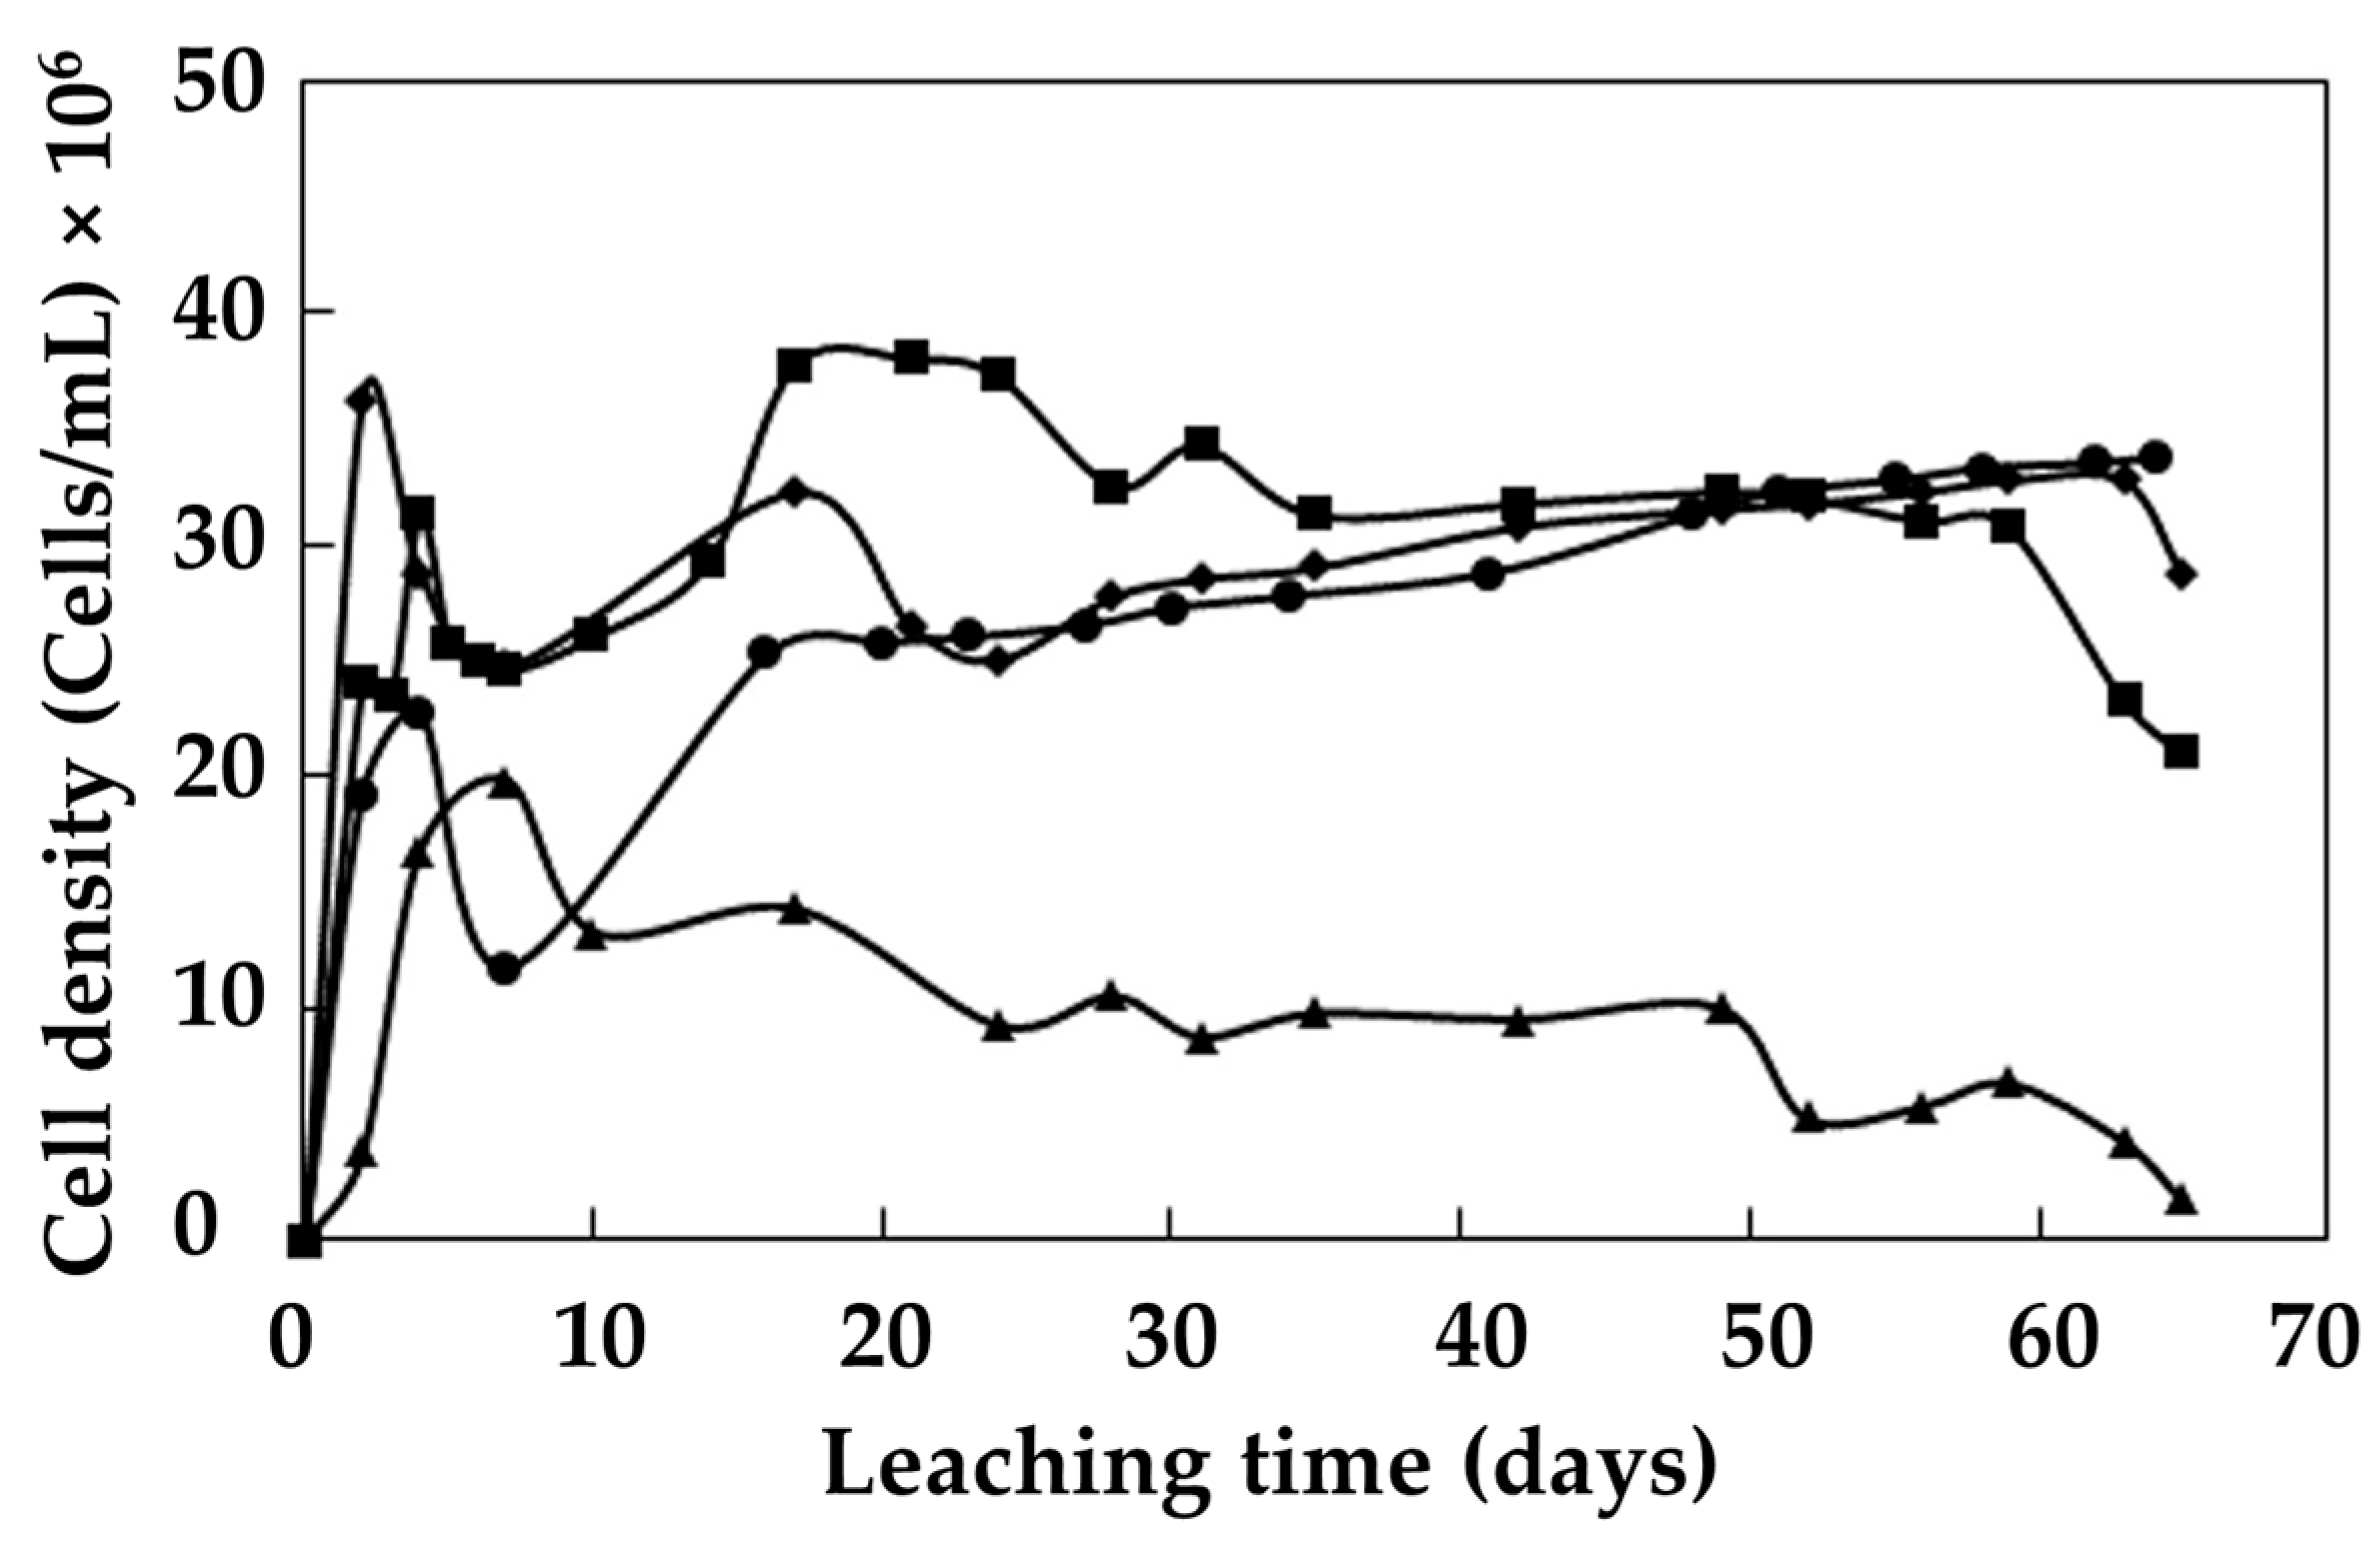
The pH, solution redox potential, and bacterial populations were determined for all the metal-rich solutions from the 1 m columns to identify the behaviour of the microorganisms and their adaptation periods. Figure 13 shows the growth of microbial density in the solution of the continuously irrigated columns. There was an initial 5-day stage in all the columns in which microbial density in the PLS solutions was high due to the irrigation with raffinate solutions that may have washed out the microorganisms that naturally resided in the dump. After this stage, there was a rapid decrease in the bacterial population in the solution in the first 10 days of the process. This behavior was attributed to an adaptation stage of the microorganisms to the leaching medium, after which the bacterial population grew progressively. The lowest bacterial presence in the metal-rich solution was observed in the column irrigated with the natural raffinate provided by the mine site operating the dump, which contained only 107 cells/mL. In contrast, the bacteria in the column maintained at pH 1.5 presented controlled growth for 15 days of processing, reaching a concentration of 3.5 × 10⁷ cells/mL, which was 1.5 × 10⁷ cells/mL less than in the initial raffinate solution. The bacterial population in the metal-rich solution of the column controlled at pH 2.0 varied from 4.0 × 10⁷ cells/mL to 3.0 × 10⁷ cells/mL over a period of 40 days.
Figure 14 shows the evolution of cell density in the PLS solutions in the column irrigated intermittently (5/10 days) with a raffinate solution containing 12 g/L of acid, 0.5 g/L of copper (II), 1.0 g/L of total iron, and 5.0 × 10⁷ cells/mL of bacteria. For comparison, two other continuously irrigated columns were also plotted. The bacterial population obtained in the metal-rich solution of the column irrigated with a 5/10-day cycle increased steadily after the resting cycles. In this process, no microbial adaptation period was observed. The transition stage occurred during the rest period, allowing better management of the pH and redox potential for the development of bacterial activity. The metal-rich solution in the column that received a raffinate solution with pH 1.5 established a pH level close to 2.0, which favored the growth of microorganisms, and which was only affected in the initial stage by the constant watering with solution.
Figure 15 shows the behavior of the redox potential values and the bacterial growth in the solution of the tested columns. It can be seen that 10 days of rest was beneficial to increasing the bacteria population. The redox potential increased steadily to between 670 and 820 mV (SHE). Similarly, the column with one of the highest redox potential values also had the highest bacterial density in the solution. It can be argued that continuous irrigation constantly washed bacteria out of the column, and their numbers increased again when the rest cycles allowed better local accumulation of the bacteria.

4. Conclusions

A comparative study of copper dissolution from low-grade chalcopyrite ore using microorganisms has been presented. The following conclusions were drawn from the experimental results:
  • The adaptation stage of an Acidiphilium strain from an ore occurred within the first 20 days after inoculation. Up to 52 days after inoculation, the bacterial population grew continuously, with the microbial density stabilizing at 3.7 × 10⁸ cells/mL. At this point, 60 days after cultivation, a microorganism-enriched solution was obtained.
  • The recovery of low-grade chalcopyrite ore was enhanced by increasing the microbial cell density. The addition of 1.5 × 10⁸ cells/mL to the 0.45 m column and 5.0 × 10⁷ cells/mL to the 1 m column resulted in a higher extraction. As a result, the copper dissolution increased from 32% to 44% in the 0.45 m column and from 30% to 40% in the 1.0 m column in 70 days of leaching. Under these conditions, the pH level was stable at around 1.8, and the redox potential was around 840 mV vs. SHE.
  • A shorter rest cycle allowed the redox potential to increase during the irrigation. By contrast, this was not observed after long rest cycles, indicating the bioleaching culture became dormant during these long rest periods. It was suggested that continuous irrigation constantly washed the bacteria out of the column, while the rest cycles allowed a better local accumulation of the bacteria.
  • It was demonstrated that intermittent irrigation enhanced the dissolution of the chalcopyrite ore, but excessively long rest periods negatively affected chemical and bacterial activity due to a shortage of acid and/or nutrients for the microorganisms. Five days of irrigation followed by ten days of rest period facilitated management of the pH and redox potential levels for the development of bacterial activity. This can be beneficial in an industrial-scale dump-leach operation as reducing the leaching cycle with less irrigation and promoting the continuity of hydrometallurgy plants (LX-SX-EW) would be both more economical and sustainable for a natural microbe-assisted dump-leach operation.
  • The bacterial population obtained in the metal-rich solution of the column irrigated using a 5/10-day cycle increased steadily after the resting cycles. In this process, no microorganism adaptation period was observed. The transition stage occurred during the rest period, allowing better management of the pH and redox potential for the development of bacterial activity. The metal-rich solution in the column that received a raffinate solution with pH 1.5 adjusted to 2.0 favored the growth of microorganisms, and was affected in the initial stage by the constant irrigation with solution.

Author Contributions

Conceptualization, L.V.-Y. and S.M.; methodology, L.V.-Y.; software, L.V.-Y.; validation, L.V.-Y., S.M. and V.Q.; formal analysis, L.V.-Y.; investigation, L.V.-Y.; resources, L.V.-Y. and S.M.; data curation, L.V.-Y.; writing—original draft preparation, L.V.-Y. and V.Q.; writing—review and editing, V.Q.; visualization, L.V.-Y.; supervision, L.V.-Y.; project administration, S.M.; funding acquisition, L.V.-Y. All authors have read and agreed to the published version of the manuscript.

Funding

This research received no external funding.

Data Availability Statement

Not applicable.

Conflicts of Interest

The authors declare no conflict of interest.

References

  1. Habashi, F. Chalcopyrite: Its Chemistry and Metallurgy; McGraw-Hill: New York, NY, USA, 1978; Volume 43. [Google Scholar]
  2. Ghorbani, Y.; Franzidis, J.P.; Petersen, J. Heap leaching technology—Current State, innovations, and future directions: A review. Miner. Process. Extr. Metall. Rev. 2016, 37, 73–119. [Google Scholar] [CrossRef] [Green Version]
  3. Veloso, T.C.; Peixoto, J.J.M.M.; Pereira, M.S.; Leao, V.A. Kinetics of chalcopyrite leaching in either ferric sulphate or cupric sulphate media in the presence of NaCl. Int. J. Miner. Process. 2016, 148, 147–154. [Google Scholar] [CrossRef]
  4. Debernardi, G.; Gentina, J.C.; Albistur, P.; Slanzi, G. Evaluation of processing options to avoid the passivation of chalcopyrite. Int. J. Miner. Process. 2013, 125, 1–4. [Google Scholar] [CrossRef]
  5. Li, Y.; Kawashima, N.; Li, J.; Chandra, A.P.; Gerson, A.R. A review of the structure, and fundamental mechanisms and kinetics of the leaching of chalcopyrite. Adv. Colloid Interface Sci. 2013, 197, 1–32. [Google Scholar] [CrossRef]
  6. Viramontes-Gamboa, G.; Peña-Gomar, M.M.; Dixon, D.G. Electrochemical hysteresis and bistability in chalcopyrite pas-sivation. Hydrometallurgy 2010, 105, 140–147. [Google Scholar] [CrossRef]
  7. Córdoba, E.M.; Muñoz, J.A.; Blázquez, M.L.; González, F.; Ballester, A. Leaching of chalcopyrite with ferric ion. Part IV: The role of redox potential in the presence of mesophilic and thermophilic bacteria. Hydrometallurgy 2008, 93, 106–115. [Google Scholar] [CrossRef]
  8. Velásquez-Yévenes, L.; Quezada-Reyes, V. Influence of seawater and discard brine on the dissolution of copper ore and copper concentrate. Hydrometallurgy 2018, 180, 88–95. [Google Scholar] [CrossRef]
  9. Nicol, M.J.; Lázaro, I. The role of EH measurements in the interpretation of the kinetics and mechanisms of the oxidation and leaching of sulphide minerals. Hydrometallurgy 2002, 63, 15–22. [Google Scholar] [CrossRef]
  10. Nicol, M.; Miki, H.; Velásquez-Yévenes, L. The dissolution of chalcopyrite in chloride solutions: Part 3. Mechanisms. Hydrometallurgy 2010, 103, 86–95. [Google Scholar] [CrossRef]
  11. Nicol, M.; Basson, P. The anodic behaviour of covellite in chloride solutions. Hydrometallurgy 2017, 172, 60–68. [Google Scholar] [CrossRef]
  12. Velásquez-Yévenes, L.; Miki, H.; Nicol, M. The dissolution of chalcopyrite in chloride solutions: Part 2: Effect of various parameters on the rate. Hydrometallurgy 2010, 103, 80–85. [Google Scholar] [CrossRef]
  13. Velásquez-Yévenes, L.; Nicol, M.; Miki, H. The dissolution of chalcopyrite in chloride solutions: Part 1. The effect of solution potential. Hydrometallurgy 2010, 103, 108–113. [Google Scholar] [CrossRef]
  14. Velásquez Yévenes, L. The Kinetics of the Dissolution of Chalcopyrite in Chloride Media. Doctoral Dissertation, Murdoch University, Murdoch, Australia, 2009. [Google Scholar]
  15. Petersen, J.; Dixon, D.G. Thermophilic heap leaching of a chalcopyrite concentrate. Miner. Eng. 2002, 15, 777–785. [Google Scholar] [CrossRef] [Green Version]
  16. Yu, R.L.; Zhong, D.L.; Miao, L.; Wu, F.D.; Qiu, G.Z.; Gu, G.H. Relationship and effect of redox potential, jarosites and extra-cellular polymeric substances in bioleaching chalcopyrite by acidithiobacillus ferrooxidans. Trans. Nonferrous Met. Soc. China Engl. Ed. 2011, 21, 1634–1640. [Google Scholar] [CrossRef]
  17. Feng, S.; Yang, H.; Xin, Y.; Gao, K.; Yang, J.; Liu, T.; Zhang, L.; Wang, W. A novel and highly efficient system for chalcopyrite bioleaching by mixed strains of Acidithiobacillus. Bioresour. Technol. 2013, 129, 456–462. [Google Scholar] [CrossRef] [PubMed]
  18. Feng, S.; Yang, H.; Zhan, X.; Wang, W. Novel integration strategy for enhancing chalcopyrite bioleaching by Acidithiobacillus sp. in a 7-L fermenter. Bioresour. Technol. 2014, 161, 371–378. [Google Scholar] [CrossRef] [PubMed]
  19. Feng, S.; Yang, H.; Wang, W. Improved chalcopyrite bioleaching by Acidithiobacillus sp. via direct step-wise regulation of microbial community structure. Bioresour. Technol. 2015, 192, 75–82. [Google Scholar] [CrossRef]
  20. Figueroa-Estrada, J.C.; Neria-González, M.I.; Rodríguez Vázquez, R.; Tec-Caamal, E.N.; Aguilar-López, R. Controlling a continuous stirred tank reactor for zinc leaching. Miner. Eng. 2020, 157, 106549. [Google Scholar] [CrossRef]
  21. Srichandan, H.; Mohapatra, R.K.; Singh, P.K.; Mishra, S.; Parhi, P.K.; Naik, K. Column Bioleaching Applications, Process Development, Mechanism, Parametric Effect and Modelling: A Review. J. Ind. Eng. Chem. 2020, 90, 1–16. [Google Scholar] [CrossRef]
  22. Rawlings, D.E. Microbially assisted dissolution of minerals and its use in the mining industry. Pure Appl. Chem. 2004, 76, 847–859. [Google Scholar] [CrossRef]
  23. Acar, S.; Brierley, J.A.; Wan, R.Y. Conditions for bioleaching a covellite-bearing ore. Hydrometallurgy 2005, 77, 239–246. [Google Scholar] [CrossRef]
  24. Watling, H.R. The bioleaching of sulphide minerals with emphasis on copper sulphides—A review. Hydrometallurgy 2006, 84, 81–108. [Google Scholar] [CrossRef]
  25. Panda, S.; Parhi, P.K.; Pradhan, N.; Mohapatra, U.B.; Sukla, L.B.; Park, K.H. Extraction of copper from bacterial leach liquor of a low grade chalcopyrite test heap using LIX 984N-C. Hydrometallurgy 2012, 121–124, 116–119. [Google Scholar] [CrossRef]
  26. Ojumu, T.V.; Petersen, J.; Searby, G.E.; Hansford, G.S. A review of rate equations proposed for microbial ferrous-iron oxidation with a view to application to heap bioleaching. Hydrometallurgy 2006, 83, 21–28. [Google Scholar] [CrossRef]
  27. Zhou, S.; Gan, M.; Zhu, J.; Li, Q.; Jie, S.; Yang, B.; Liu, X. Catalytic effect of light illumination on bioleaching of chalcopyrite. Bioresour. Technol. 2015, 182, 345–352. [Google Scholar] [CrossRef]
  28. Zhao, H.; Wang, J.; Gan, X.; Zheng, X.; Tao, L.; Hu, M.; Li, Y.; Qin, W.; Qiu, G. Effects of pyrite and bornite on bioleaching of two different types of chalcopyrite in the presence of Leptospirillum ferriphilum. Bioresour. Technol. 2015, 194, 28–35. [Google Scholar] [CrossRef]
  29. Pradhan, N.; Nathsarma, K.C.; Srinivasa Rao, K.; Sukla, L.B.; Mishra, B.K. Heap bioleaching of chalcopyrite: A review. Miner. Eng. 2008, 21, 355–365. [Google Scholar] [CrossRef]
  30. Panda, S.; Akcil, A.; Pradhan, N.; Deveci, H. Current scenario of chalcopyrite bioleaching: A review on the recent advances to its heap-leach technology. Bioresour. Technol. 2015, 196, 694–706. [Google Scholar] [CrossRef]
  31. Abhilash; Mehta, K.D.; Pandey, B.D. Bacterial Leaching Kinetics for Copper Dissolution from a Low- Grade Indian Chalcopyrite Ore. Rev. Esc. Minas 2013, 66, 245–250. [Google Scholar] [CrossRef] [Green Version]
  32. Remonsellez, F.; Galleguillos, F.; Moreno-Paz, M.; Parro, V.; Acosta, M.; Demergasso, C. Dynamic of active microorganisms inhabiting a bioleaching industrial heap of low-grade copper sulfide ore monitored by real-time PCR and oligonucleotide prokaryotic acidophile microarray. Microb. Biotechnol. 2009, 2, 613–624. [Google Scholar] [CrossRef]
  33. Zhou, H.B.; Zeng, W.M.; Yang, Z.F.; Xie, Y.J.; Qiu, G.Z. Bioleaching of chalcopyrite concentrate by a moderately thermophilic culture in a stirred tank reactor. Bioresour. Technol. 2009, 100, 515–520. [Google Scholar] [CrossRef] [PubMed]
  34. Donati, E.; Sand, W. Microbial Processing of Metal Sulfides; Springer: Dordrecht, The Netherlands, 2007; ISBN 9781119130536. [Google Scholar]
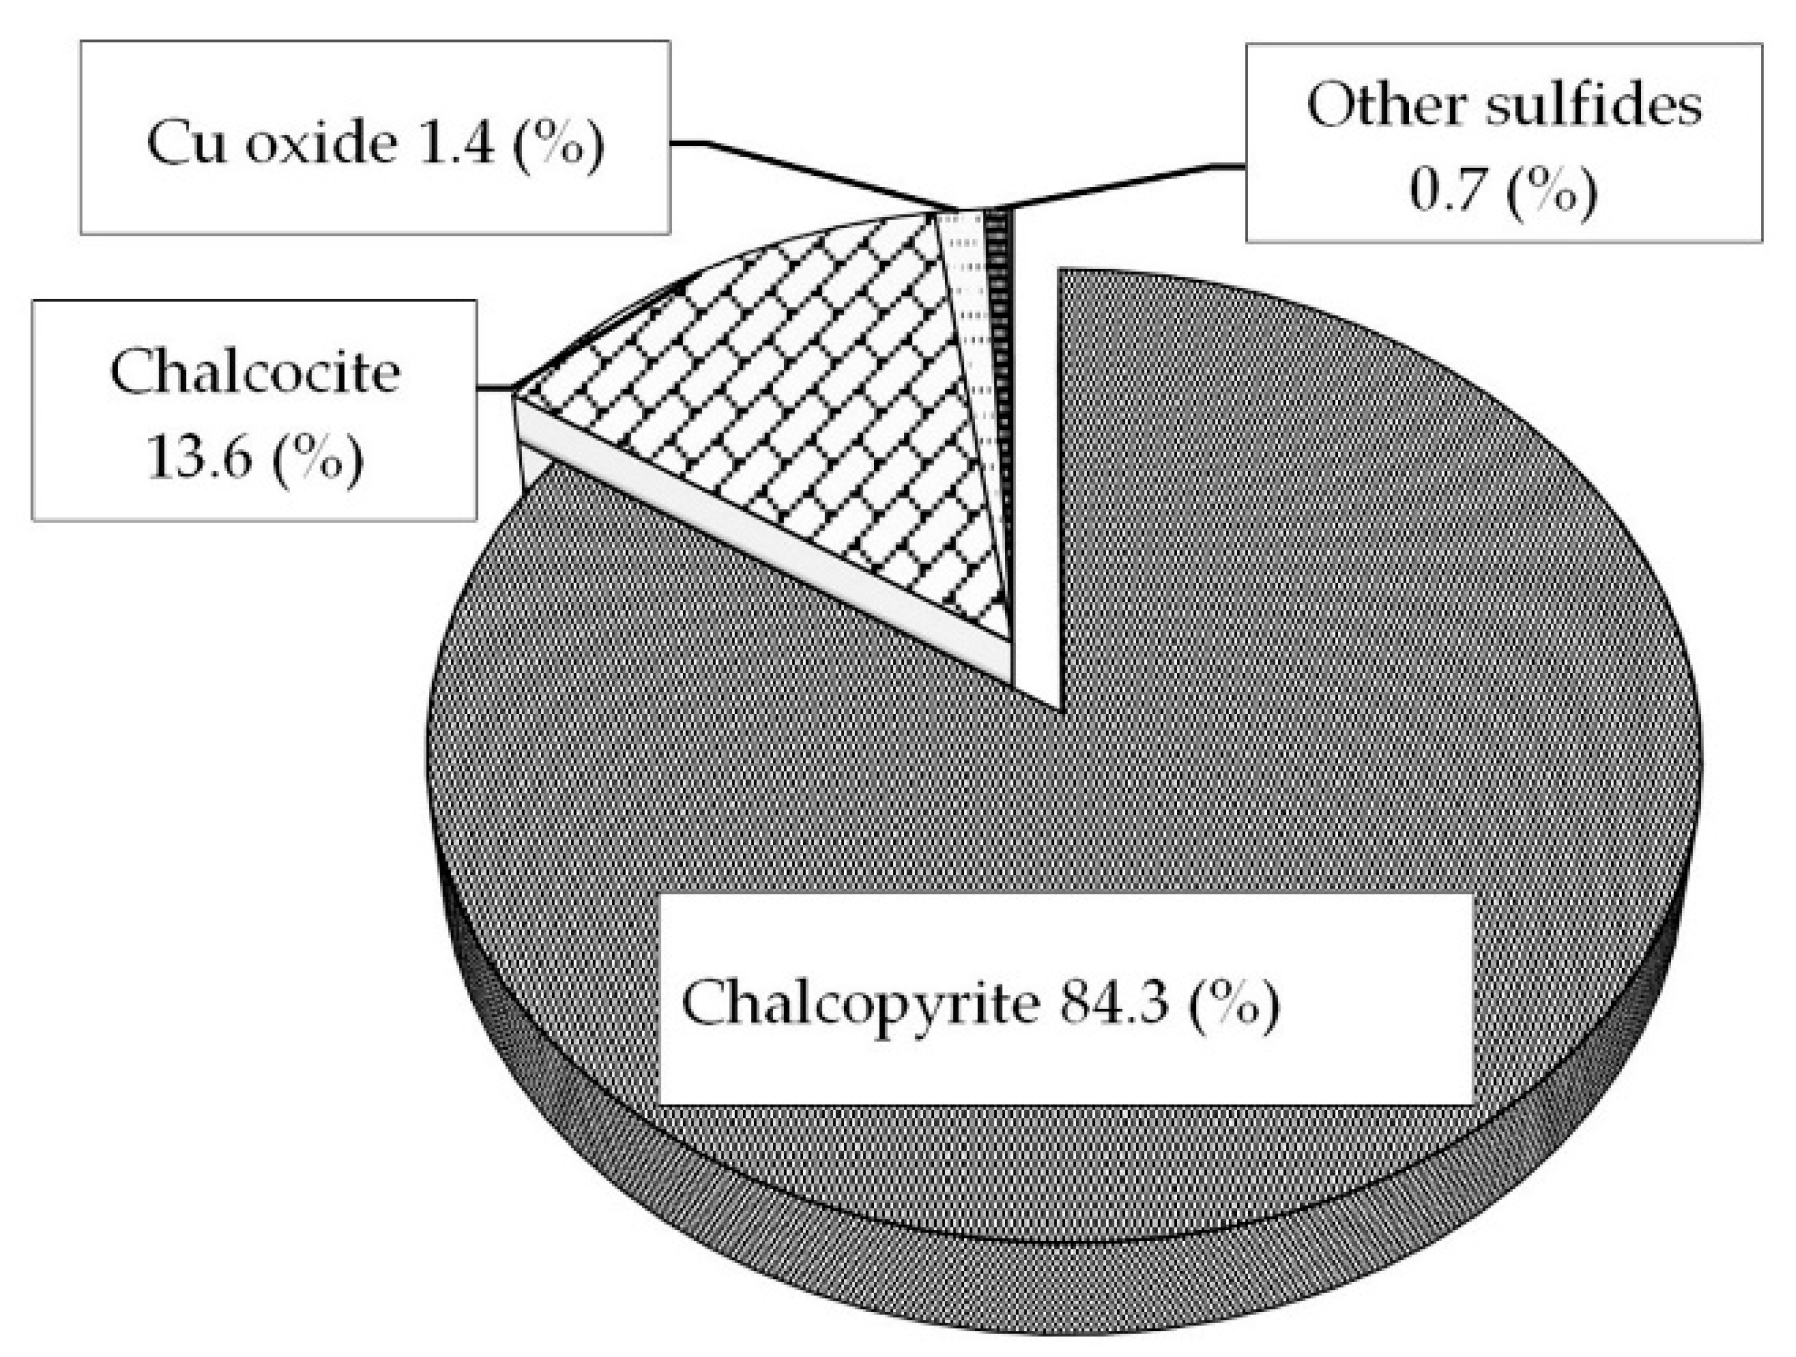
Figure 1. Mineralogical distribution of the copper-bearing sulfide minerals in the ore (amount in wt% and 100% base copper species).
Minerals 12 00487 g001
Figure 2. Particle size distribution of the chalcopyrite ore used in the column leaching tests. (a) columns 0.45 m high and (b) columns 1 m high.
Minerals 12 00487 g002
Figure 3. Schematic of the column leaching system (a) and real system (b).
Minerals 12 00487 g003
Figure 4. Growth of strain in 4.5 K medium.
Minerals 12 00487 g004
Figure 5. Effects of acid concentration and continuous irrigation on the extraction of column leaching of chalcopyrite ore. +, 6 g/L H+; □, 10 g/L H+; ◊, 20 g/L H+. (a) Variation in the pH level (dashed line); (b) variation in the redox potential (dashed line).
Minerals 12 00487 g005
Figure 6. Effects of adding 1.5 × 10⁸ cells/mL of microorganism on the rate of column leaching of the chalcopyrite ore at different pH levels with continuous irrigation. △ pH 2.0; ♦ pH 1.8; ○ pH 1.5. (a) Variation in pH (dashed line); (b) variation in Eh (dashed line).
Minerals 12 00487 g006
Figure 7. Effect of the irrigation cycle on the rate of column leaching of the chalcopyrite ore in a solution of 2 g/L acid, 0.5 g/L copper (II), and 15 × 107 cells/mL at ambient temperature, with an intermittent irrigation cycle. ■ pH 1.8 and a 5/10-day irrigation cycle; ▲ pH 1.8 and a 5/20-day irrigation cycle. (a) Variation in pH (dashed line); (b) variation in Eh (dashed line).
Minerals 12 00487 g007
Figure 8. Copper dissolution (●) from chalcopyrite ore in 10 g/L acid (pH 1.0), 0.5 g/L copper (II), and 1.5 × 10⁸ cells/mL from the second cycle at ambient temperature with three intermittent irrigation cycles of 5/10 days. (a) Variation in pH (dashed line); (b) variation in Eh (dashed line).
Minerals 12 00487 g008
Figure 9. Copper dissolution of chalcopyrite ore with continuous irrigation in 0.5 g/L copper (II) at ambient temperature, with the addition of ▲ 3.0 g/L of acid, 1.0 g/L total iron and 107 cells/mL, ■ 3.0 g/L of acid, 1.0 g/L total iron and 5.0 × 10⁷ cells/mL, ♦ pH-controlled at 2.0, 1.0 g/L of total iron and 5.0 × 10⁷ M cells/mL and ● pH-controlled at 1.5, 1.0 g/L of total iron and 5.0 × 10⁷ M cells/mL.
Minerals 12 00487 g009
Figure 10. Bioleaching of chalcopyrite ore at ambient temperature with continuous irrigation with different raffinate solutions. ▲ 3.0 g/L of acid, 1.0 g/L total iron, and 107 cells/mL; ■ 3.0 g/L of acid, 1.0 g/L total iron, and 5.0 × 10⁷ cells/mL; ♦ pH-controlled at 2.0, 1.0 g/L of total iron, and 5.0 × 10⁷ cells/mL; ● pH-controlled at 1.5, 1.0 g/L of total iron, and 5.0 × 10⁷ cells/mL. (a) Variation of pH and (b) variation in redox potential.
Minerals 12 00487 g010
Figure 11. Copper dissolution of chalcopyrite ore with continuous irrigation in 12 g/L of acid, 0.5 g/L copper (II), 1.0 g/L total iron, and 5.0 × 10⁷ cells/mL at ambient temperature, with three intermittent irrigation cycles of: ○ 5/10 days; ◇ 5/10 days (duplicate); and □ 5/20 days.
Minerals 12 00487 g011
Figure 12. Bioleaching of copper ore at ambient temperature with intermittent irrigation with different raffinate solutions. ○ 5/10 days; ◇ 5/10 days (duplicate); □ 5/20 days. (a) Variation in pH; (b) variation in redox potential.
Minerals 12 00487 g012
Figure 13. Evolution of cell density in the bioleaching solution of the chalcopyrite ore at ambient temperature with different raffinate solutions with 1.0 g/L total iron and continuous irrigation. ▲ 3.0 g/L of acid and 106 cells/mL; ■ 3.0 g/L of acid and 5.0 × 10⁷ cells/mL; ♦ pH-controlled at 2.0 and 5.0 × 10⁷ cells/mL; ● pH-controlled at 1.5 and 5.0 × 10⁷ cells/mL.
Minerals 12 00487 g013
Figure 14. Variation in pH in bioleaching solution during copper extraction from chalcopyrite at ambient temperature with different raffinate solutions. The evolution of cell density is also shown (dashed line). ▲ 3.0 g/L of acid and 106 cells/mL, continuous irrigation; ● pH-controlled at 1.5 and 5.0 × 10⁷ cells/mL, continuous irrigation; ○ 12 g/L of acid and 5.0 × 10⁷ cells/mL intermittent 5/10-day irrigation cycle.
Minerals 12 00487 g014
Figure 15. Variation of redox potential in bioleaching solution during copper extraction from chalcopyrite at ambient temperature with different raffinate solutions. The evolution of cell density is also shown (dashed line). ▲ 3.0 g/L of acid, 1.0 g/L total iron and 1.07 cells/mL, continuous irrigation, ■ 3.0 g/L of acid, 1.0 g/L total iron and 5.0 × 10⁷ cells/mL, continuous irrigation ♦ pH-controlled at 2.0, 1.0 g/L of total iron and 5.0 × 10⁷ cells/mL, continuous irrigation, ● pH-controlled at 1.5, 1.0 g/L of total iron and 5.0 × 10⁷ cells/mL, continuous irrigation; ○ 12 g/L of acid, 1.0 g/L of total iron and 5.0 × 10⁷ cells/mL intermittent 5/10-day irrigation cycle.
Minerals 12 00487 g015
Table 1. Mineralogical composition of the ore obtained by QEMSCAN analysis.
MineralAmount (wt%)
Chalcopyrite0.62
Chalcocite/digenite0.07
Cu oxide minerals0.01
Other sulfides0.04
Pyrite3.35
Quartz34.2
Plagioclase5.30
Albite14.2
Feldspars-K15.0
Biotite/phlogopite0.97
Sericite/muscovite18.1
Chlorite5.53
Tourmaline1.28
Fe oxides1.33
Total100
Table 2. Percentage of relative abundances of microorganisms in each sample.
Gene Abundance %Sample 1Sample 2Industrial Raffinate
Asticcacaulis0044.4
Acidiphilium10010036.8
Mycobacterium0011.9
Table 3. List of tests performed on the chalcopyrite ore using columns 0.45 m in height.
TestpHH2SO4 (g/L)Cu2+ (g/L)FeT (g/L)Cell Concentration (×106 cell/mL)Irrigation/Rest (day)
1-6.00.51.0Not addedContinuous
2-10.00.51.0Not addedContinuous
3-20.00.51.0Not addedContinuous
42.01.00.51.0150Continuous
51.82.00.51.0150Continuous
61.53.00.51.0150Continuous
71.82.00.51.01505/10
81.82.00.51.01505/20
91.010.00.51.0150 (from second cycle)5/10
Table 4. List of tests performed on the chalcopyrite ore using columns 1.0 m in height.
TestpHH2SO4 (g/L)Cu2+ (g/L)FeT (g/L)Cell Concentration (×106 cell/mL)Irrigation/Rest (day)
10-3.00.51.010Continuous
11-3.00.51.050Continuous
122.0-0.51.050Continuous
131.5-0.51.050Continuous
14-120.51.0505/10
15-120.51.0505/10
16-120.51.0505/20
Publisher’s Note: MDPI stays neutral with regard to jurisdictional claims in published maps and institutional affiliations.