
Halloysite-Zinc Oxide Nanocomposites as Potential Photocatalysts
by
 , ,
, ,
Balázs Zsirka
1,* ,
,
Veronika Vágvölgyi
1,
Erzsébet Horváth
1,
Tatjána Juzsakova
2,
Orsolya Fónagy
3,
Erzsébet Szabó-Bárdos
3 and
János Kristóf
1,* 1
Research Group of Analytical Chemistry/Laboratory for Surfaces and Nanostructures, Center for Natural Sciences, University of Pannonia, P.O. Box 158, 8201 Veszprem, Hungary
2
Sustainability Solutions Research Lab, University of Pannonia, P.O. Box 158, 8201 Veszprem, Hungary
3
Research Group of Environmental and Inorganic Photochemistry, Center for Natural Sciences, University of Pannonia, P.O. Box 158, 8201 Veszprem, Hungary
*
Authors to whom correspondence should be addressed.
Minerals 2022, 12(4), 476; https://doi.org/10.3390/min12040476
Submission received: 16 March 2022
/
Revised: 8 April 2022
/
Accepted: 10 April 2022
/
Published: 13 April 2022
(This article belongs to the Special Issue Nanotubular and Nanofibrous Clay Minerals)
Abstract
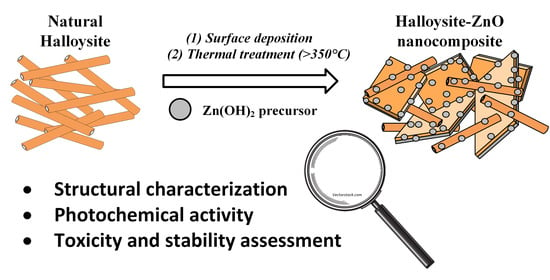
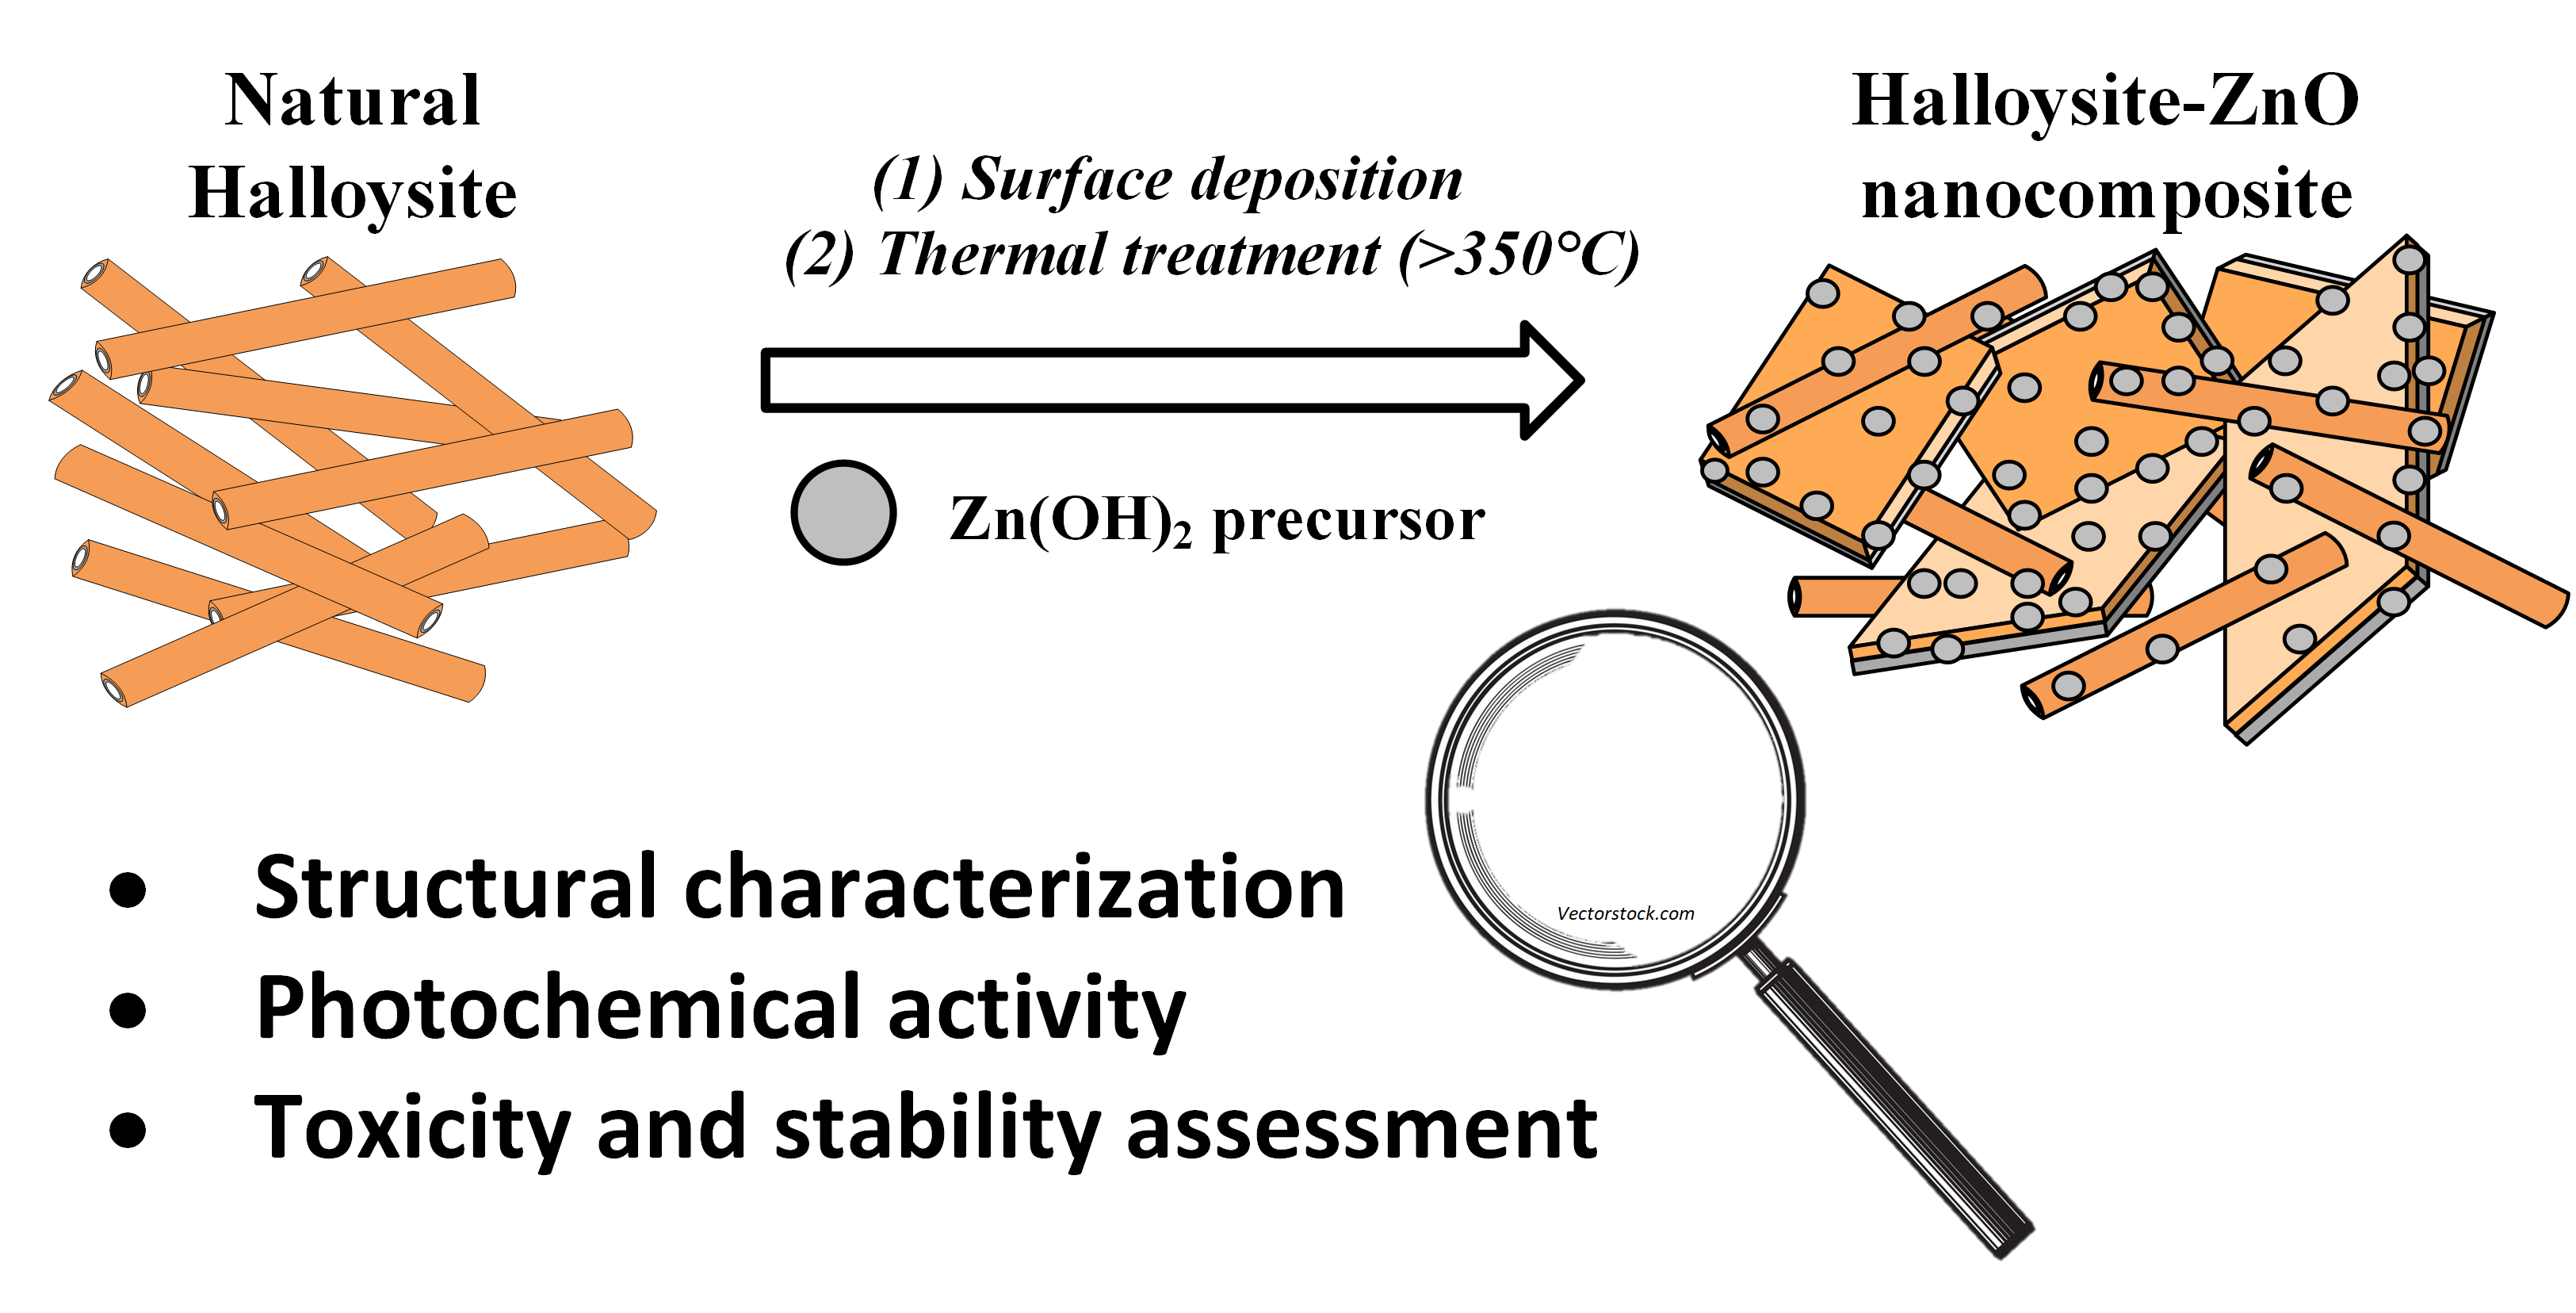
:The synthesis and structural characterization of synthetic zinc oxide and halloysite-based zinc oxide nanocomposites (with 2–28 m/m% ZnO content) are presented. The chemical precipitation of zinc hydroxide precursors and its subsequent drying at 80 °C yielded dominantly zinc oxide (zincite). Thermal treatment at 350 °C completely transformed the remaining precursor to ZnO without causing structural dehydroxylation of the halloysite support. The procedure yielded zinc oxide nanoparticles with 10–22 nm average size having quasi-spherical scale-like morphology. The specific surface area of the synthetic zinc oxide was found to be low (13 m2/g), which was significantly enhanced after nanocomposite preparation (27–47 m2/g). The photocatalytic activity of the prepared nanocomposites was probed by the degradation of a phenolic compound (4-nitrophenol) upon UV irradiation in liquid phase. Compared to their individual constituents, an increased activity of the nanocomposites was observed, while the SSA-normalized photocatalytic activity revealed a synergic effect in nanocomposites above 9 m/m% ZnO content. The nanocomposites were found to be stable at pH = 5.6, with a minor and major mobilization of zinc ions at pH = 12.4 and pH = 1.9, respectively. The toxicity of leachates in different pH environments by Vibrio fischeri bioluminescence indicated low toxicity for ZnO nanoparticles and insignificant toxicity for the nanocomposites. The enhanced photocatalytic activity together with the lower toxicity of the halloysite-ZnO nanocomposites highlight their application potential in water treatment.
1. Introduction
Halloysite, the hydrated polymorph of kaolinite, is an abundant natural clay mineral belonging to the serpentine-kaolin group of layered silicates (1:1 type phylloaluminosilicates). Its dual-layered structure consists of an interconnected silicon-centered tetrahedral (T) and an aluminum-centered octahedral (O) layers. The TO layers are typically charge-neutral to the external environment; however, local charges can be present, resulting from the protolysis of OH groups on their outer and fractured surfaces and rarely from the substitution of octahedral Al3+ ions. The TO layers have a dipole moment and are connected together by numerous weak hydrogen bonds perpendicular to their surface. In halloysites, interlayer water is usually present between the TO layers, giving rise to a hydrated halloysite structure (Al2Si2O5(OH)4·2H2O) which can be irreversibly removed to yield the dehydrated form (Al2Si2O5(OH)4). Consequently, halloysites most often display a typical nanoscrolled morphology due to the weakening effect of interlayer water molecules. Halloysite nanoscrolls typically have a cc. 50–200 nm thickness and 10–100 nm internal diameter (called the lumen), which results in a catalytically favorable porosity and specific surface area [1,2,3].
Clay minerals are considered to be very promising materials in the cleaning and remediation of environmental elements, especially in their use as adsorbents and photocatalysts [4]. A remarkable achievement of clay mineral research has been the report of the photochemical activity of 1:1 type clay minerals, which highlighted their potential application in the removal of environmental pollutants such as methylene-blue and toluene [5], potassium-benzene-sulfonate [6], dyes [7], and small molecule organic acids [8].
Due to their natural origin, mined clay minerals often contain varying amounts of mineral contaminants (such as Fe2O3, FeOOH, and TiO2) that can significantly affect their photocatalytic activity. Clay minerals with mineral oxide impurities can be regarded as natural composites. Iron-bearing kaolins are advantageously applied in the photocatalytic degradation of persistent pesticides [9] and their catalytic activity can be significantly improved by the modification of the constituents by means such as controlled acidification [10] or artificial introduction of transition-metal oxide impurities [11].
Nanoscrolled halloysites, with an advantageous porosity, are particularly promising supports for efficient, robust, and environmentally friendly photoactive catalysts. Halloysite nanocomposites can be artificially prepared by surface-attachment of photoactive transition metal oxides (e.g., TiO2, ZnO), resulting in a significant increase of photocatalytic activity [12,13,14,15]. The increased photoactivity is mostly due to their increased surface area, the more advantageous particle size distribution, and more favorable dispersity of the semiconductor components and the enhanced adsorption enabled by the clay mineral surface [16]. The controlled formation of structural aluminum defect sites via the generally applied heat-treatment during synthesis can also contribute to the enhancement of photoactivity [8,17].
Zinc oxide is an n-type metal-oxide photocatalyst with an optical band gap of 3.1–3.3 eV [18,19] and a wide-range adsorption property. ZnO nanoparticles can be advantageously used in heterogeneous photocatalysis in the degradation of various pollutants in aqueous phase such as aromatic and aliphatic organic compounds, dyes, pharmaceutical compounds, or persistent organics and pesticides [20,21,22]. Their major disadvantage is the susceptibility to photocorrosion. ZnO nanoparticles can be synthesized by various methods, such as sol gel [23], precipitation [24], hydrothermal [25], wet chemical [26], or biosynthesis [27], among others. Synthesis conditions significantly affect the properties of ZnO nanoparticles, influencing their morphology [28], band-gap [29], and consequently, their potential field of applications [30]. The synthesis of clay-based ZnO nanocomposites are currently in the focus of photocatalyst research [31,32].
The structural properties of halloysite-based ZnO nanocomposites, along with the toxicity of the constituents, are quite well understood [33]. Halloysite is considered a non-toxic biocompatible material [34,35,36], while the toxicity of zinc nanoparticles may be of concern to the biosphere and the environment [37,38]. The toxic nature of ZnO in nanocomposites can be beneficial due to the inherent antibacterial properties [39]; however, their impact on the aqueous phase is not yet well understood. The stability and toxicity of halloysite-based zinc oxide nanocomposites can be of outmost importance for a practical application by potentially decreasing the mobility of surface attached zinc nanoparticles in order to avoid liberation of secondary pollutants and to pose a risk to the biosphere. The aims of this study were (1) to synthesize surface deposited zinc oxide nanoparticles on a natural halloysite-based support in a relatively low concentration (2–28 m/m%) as potential photocatalysts, (2) investigate the structural and photocatalytic properties of the synthesized nanocomposites, and (3) investigate the stability and short-term toxicity of the synthesized nanocomposite photocatalysts in aqueous phase.
2. Materials and Methods
The following materials and methods were utilized during the research.
2.1. Samples and Prepared Composites
The used natural halloysite (Hal) was from Balikesir, Turplu (Turkey). Zinc-nitrate-hexahydrate (Zn(NO3)2∙6H2O, 99%, Sigma-Aldrich), sodium hydroxide (NaOH, 99%, Scharlab), and MilliQ water (conductivity <0.056 μS/cm) were used for the composite synthesis.
The prepared halloysite-ZnO composites are listed in Table 1. The designation of the samples is as follows: H-m%, where m% is the Zn content given in ZnO (m/m%), and is varied between 2–28%. The heat treatment of the composite samples (T = 350 °C) is not designated further. Any different heat treatment temperatures are given separately in brackets (T °C).
Samples were prepared by mixing the halloysite in 0.1 M Zn(NO3)2 solution and stirring for 30 min with a magnetic stirrer. Then 0.2 M NaOH was added to the solution and mixing was continued for an additional 60 min. After separation by centrifugation (5000 rpm, 5 min), the resulting solid phase was washed 3 times with MilliQ water, dried at room temperature for 12 h and 2 h at 80 °C, and carefully ground in an agate mortar. Nanocomposites were formed by subsequent heat treatment at 350 °C for 2 h. The heat treatment temperature was determined to be 350 °C (with 2 h isotherm) by thermal analysis (see Section 3.1.3) to ensure transformation without causing major structural changes in the halloysite. The applied synthesis route minimizes pollutant generation, with the by-products of soluble NaNO3 and H2O.
2.2. Analytical Methods
X-ray powder diffraction (XRD) measurements were carried out using a Philips PW 3710-type instrument (CuKα radiation, λ = 1.54056 Å, 50 kV, 40 mA) in the range of 4–70° 2θ with a scanning speed of 0.02°/s and 1 s dwell time. Preferential particle orientation was minimized by loading the finely ground samples into backpacked mounts. Calcined Al2O3 was used as standard sample for estimating the instrumental broadening in the calculation of average crystallite sizes.
Infrared spectra were recorded using a Bruker Vertex 70 type Fourier-transform infrared (FTIR) spectrometer equipped with a Bruker Diamond ATR sample compartment, operated at a resolution of 2 cm−1 with a room temperature DTGS detector. Final spectra were acquired by averaging 512 scans.
Thermoanalytical measurements were carried out in a Netzsch TG-209 type thermobalance. Grounds samples in ceramic crucibles were heated to 1000 °C (at 10 °C/min heating rate) in dynamic argon flow (99.998%), and the thermogravimetric (TG) and derivative thermogravimetric (DTG) curves were recorded.
The specific surface area (SSA) was determined by using the Brunauer-Emmett-Teller (BET) [40] and Barret–Joyner–Halenda (BJH) models [41], while the latter was used to determine the pore-volume distribution from nitrogen adsorption and desorption isotherms (N2, Messer 99.995%). SSA values were calculated utilizing the linear range (p/p0 = 0.0041–0.2123). The measurements were carried out using a Micromeritics ASAP 2000-type instrument. Prior to measurement, the samples were outgassed in vacuum at 60 °C until the vacuum dropped below 10 μtorr.
Transmission electron microscopic (TEM) measurement were carried out in a FEI Talos F200X type electron microscope (X-FEG electron source, operated at 200 kV accelerator potential). Samples were dispersed in MilliQ water and drop-dried at 60 °C onto a lacy carbon-coated copper grid. Images of the samples were recorded in transmission (TEM) and scanning (STEM) modes. Elemental composition was determined by recording the energy dispersive X-ray spectra, using SuperX EDX detectors.
UV-Vis absorbance spectra were recorded in a double-beam Thermo Nicolet Evolution 500 equipment using 0.5 cm quartz cuvettes, 1 nm resolution in the 190–800 nm range. W-lamp and deuterium lamp were the light sources in the visible and UV range, respectively, and MilliQ water was used as background.
Zn concentrations were determined by means of a Spectroflame Modula E type ICP-OES equipment (Spectro GmbH, Germany), applying a horizontal plasma torch with axial detection using the 213.856 nm emission line.
2.2.1. Investigation of the Photocatalytic Activity
The photocatalytic activity of the samples was investigated by the degradation of 4-nitrophenol (4-NF, O2NC6H4OH, >99%, Alfa Aesar) test compound in aqueous phase (at 40 ppm concentration) upon irradiation of λmax = 365 nm UV light. For the experiments, 50 mg catalyst sample was mixed into 50 mL of 4-NF solution and placed in an UV-transparent closed photoreactor under stirring at limited oxygen availability conditions without air purging. After 20 min allowing for adsorption equilibrium, the UV light was switched on. Samples were collected in 60 min intervals up to 300 min irradiation time. Collected samples were filtered (PTFE, 0.2 μm) before measurement by UV-Vis spectroscopy.
2.2.2. Investigation of Nanocomposite Stability by Zinc Dissolution
100 mg sample was suspended in 10 mL liquid and vigorously mixed for 1 h by a magnetic stirrer. The sample was then centrifuged and filtered through a 0.45 μm PTFE filter before measurement. The investigated liquids were: 0.01M HCl (pH = 1.9), 0.01M NaOH (pH = 12.4), and pure MilliQ water (<0.054 μS/cm, pH = 5.6).
2.2.3. Toxicology of Nanocomposites
The toxicity of the filtered leachates previously in contact with the catalysts was measured in liquid form. Samples were prepared similarly to as described in Section 2.2.2. The indirect antibacterial effect of the halloysite-metal oxide nanocomposite catalysts was evaluated by using a bioluminescence method in the presence of Vibrio fischeri strain, a Gram-negative marine bacterium. The test bacteria (NRRL-B-11177) suspension was prepared following the manufacturer’s instructions (Hach Lange Co.). Test solutions were prepared by adding 300 μL filtered leachate from the samples to 200 μL reconstitution solution containing the Vibrio fischeri promptly before measurement. The luminescent intensity of Vibrio fischeri was measured by a Toxalert 100 device after 0, 30, and 60 min of exposure.
3. Results and Discussion
3.1. Synthesis and Characterization of Nanocomposites
3.1.1. X-ray Diffraction
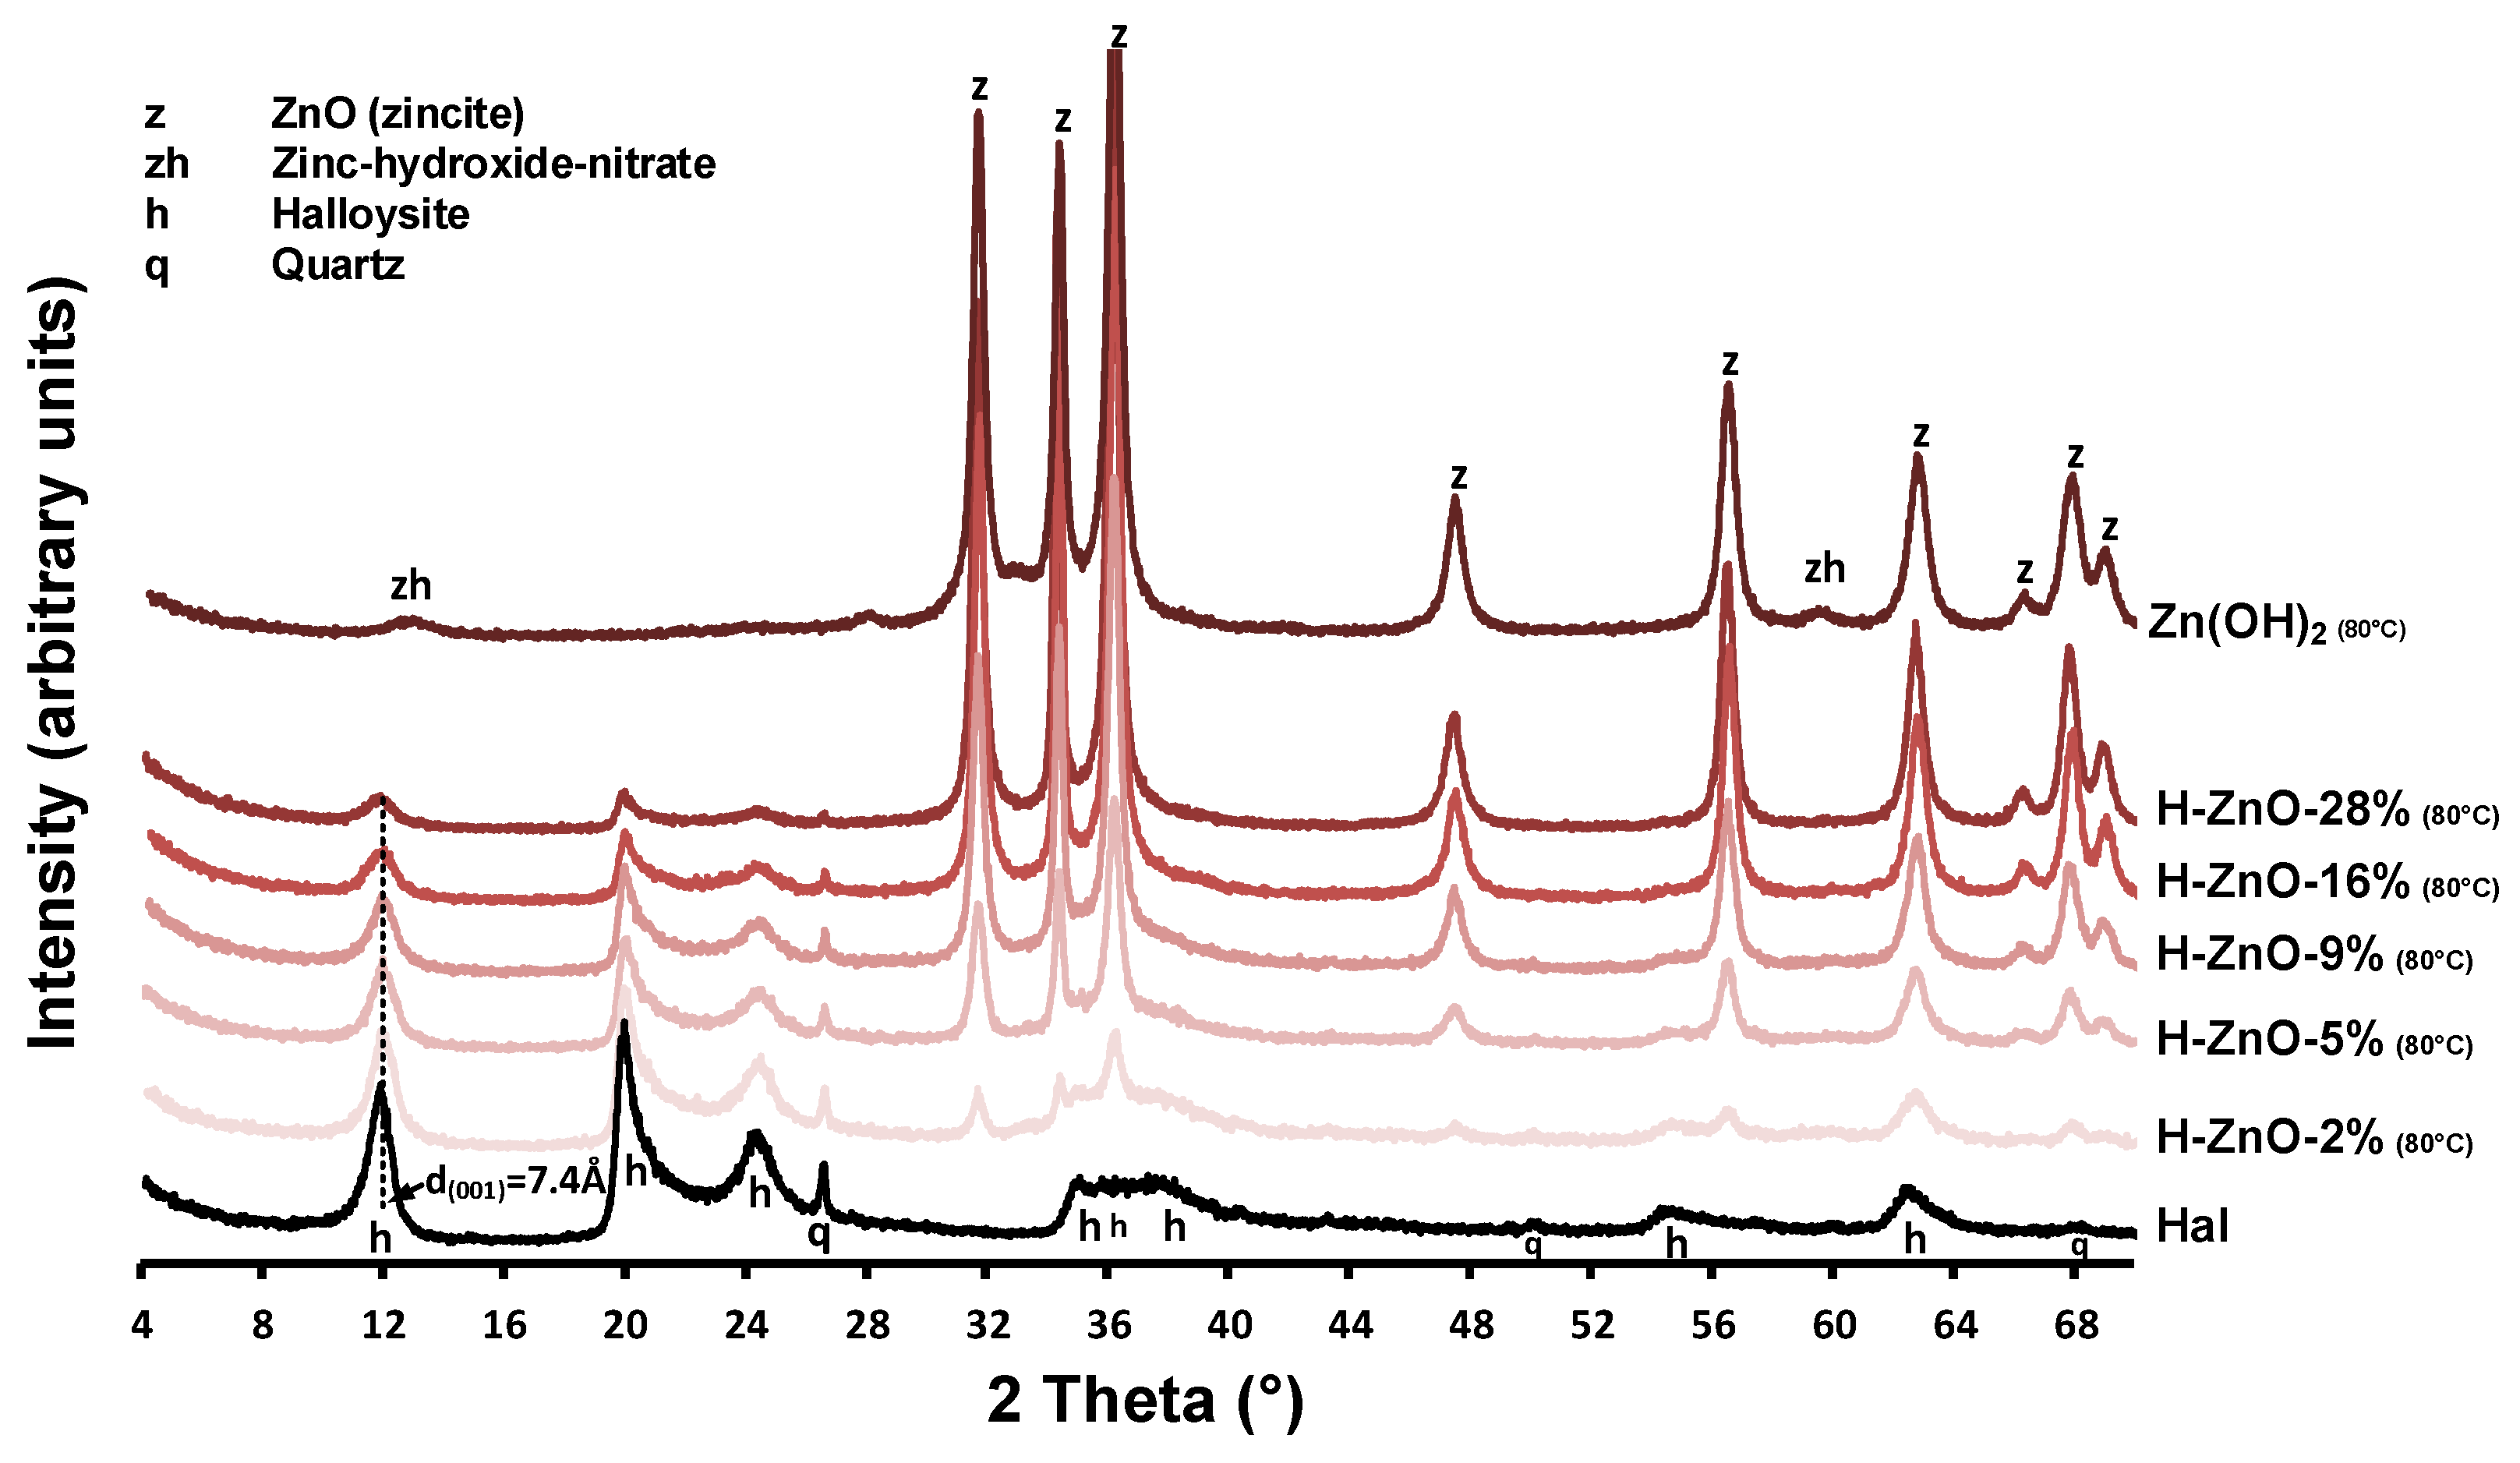
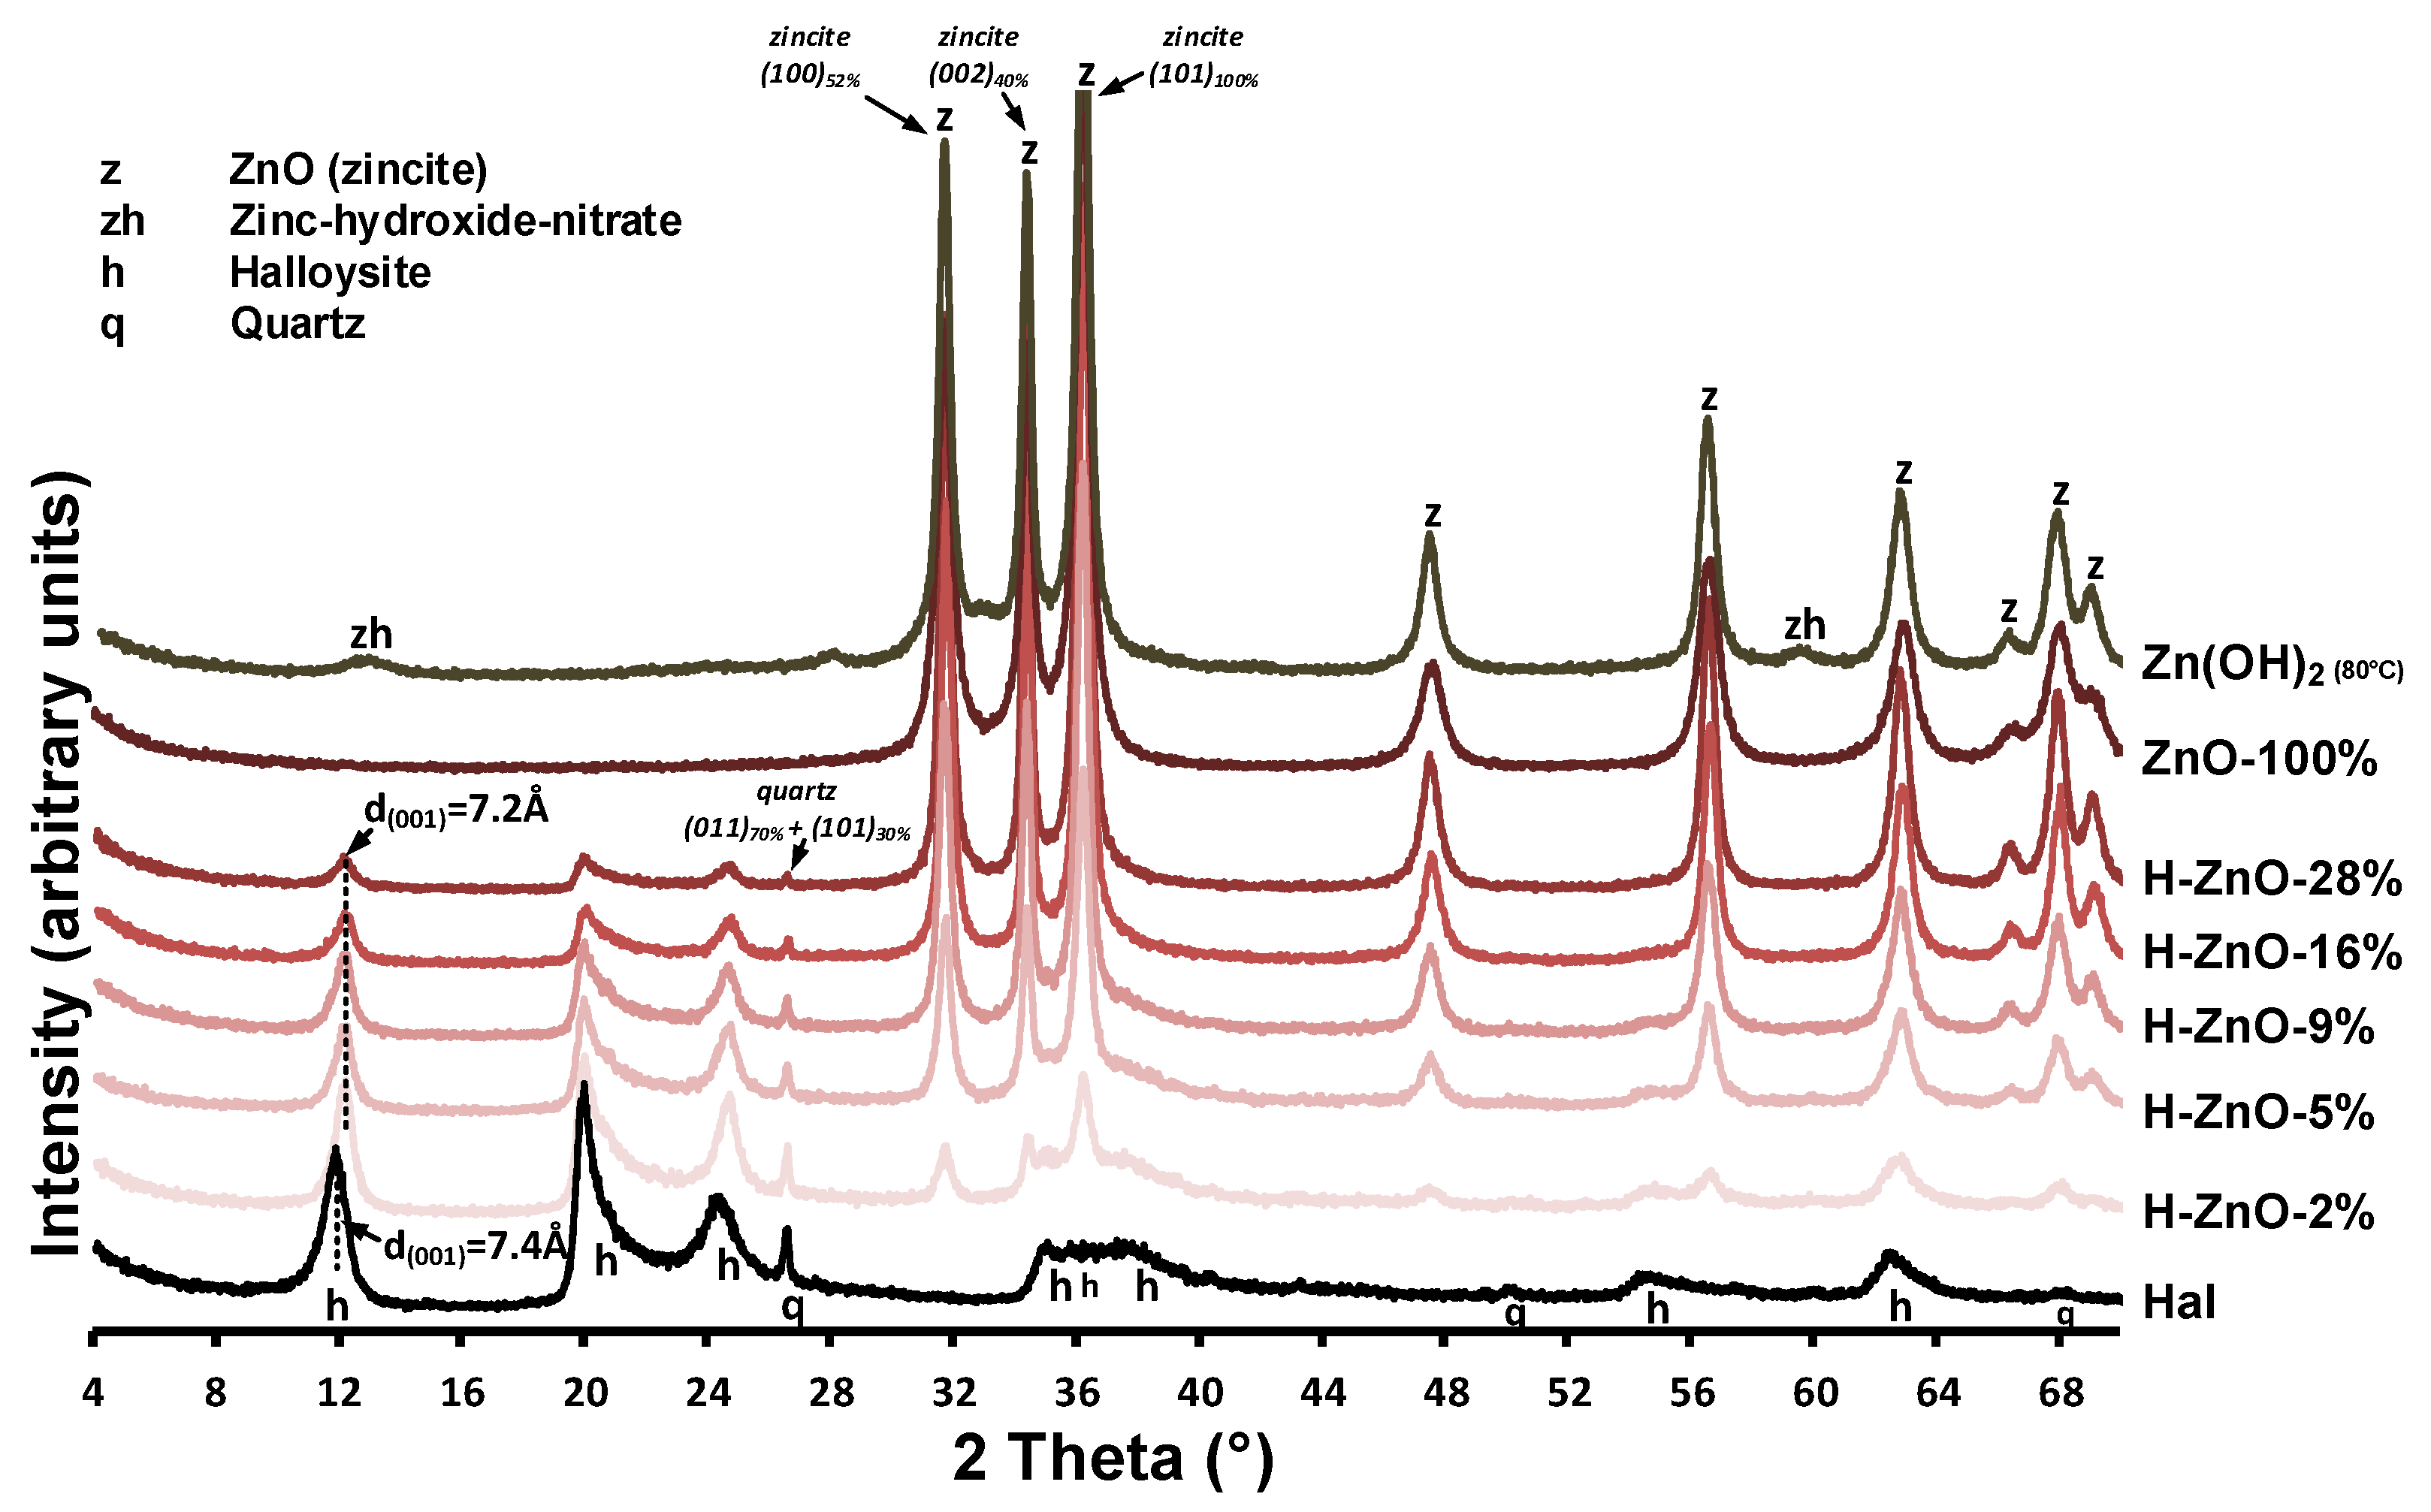
The XRD patterns of the untreated halloysite (Hal), the synthetic Zn(OH)2 sample and the various zinc-containing composites are given in Figure A1, while their 350 °C heat-treated derivatives are shown in Figure 1. Mineral composition was identified using the following Powder Diffraction File cards: halloysite (7Å: 00-029-1487), ZnO (zincite, 00-005-0664 and 01-075-7917), Zn(OH)2 (01-089-0138), and Zn3(OH)4(NO3)2 (00-052-0627) quartz (00-033-1161). Halloysite in its fully hydrated form (having a water monolayer in between the 1:1 double layers) can be characterized with a layer distance of d(001) = 10.0Å (Al2Si2O5(OH)4.2H2O). This water can be removed by drying or heating, yielding the dehydrated halloysite structure with d(001) = 7.2Å (Al2Si2O5(OH)4) [3]. The compositional analysis revealed that the natural halloysite sample (Figure 1/Hal) dominantly consisted of partially dehydrated halloysite, based on the position of the 001 reflection of halloysite (d(001) = 7.4Å, 11.95° 2theta). Only minor amounts of crystalline quartz was identified as mineral pollutant in the halloysite sample, as indicated by the 011 and 101 reflection of quartz, simultaneously detected at 26.6°2theta [42].
Surprisingly, the major intense reflections in the pure as-synthesized Zn(OH)2 sample (Figure 1/Zn(OH)2 (80 °C)) could be identified as zinc oxide in zincite form based on the presence of the intense 31.8°, 34.5°, 36.3°, and 47.5° 2theta reflections belonging to the 100, 002, 101, and 102 reflections of zincite [43]. The small intensity reflections at 12.84° and 59.58° 2theta could be indicative of a minor impurity, due to nitrate ions incorporating the zinc hydroxide structure to form zinc hydroxide-nitrate [44,45]. The simultaneous presence of both hydroxide and oxide phases can be explained by the low temperature solid-phase transformation of Zn(OH)2 to ZnO during the 80 °C heating of synthesis procedure [46].
After heat treatment at 350 °C, the reflections belonging to zinc hydroxide-nitrate disappeared and only the ZnO peaks remained visible (Figure 1/ZnO-100%). In case of the synthesized nanocomposites (Figure A1/H-ZnO-2%-28%), the presence of these ZnO reflections indicated successful synthesis [31]. Their intensity increased parallel with the increase of zinc content in the composites, as indicated by the 100% relative intensity reflection of ZnO at 36.3°2theta. The average crystallite size of the zinc oxides were calculated by the Scherrer equation [47] and given in Table A1. In case of the synthetic ZnO sample, the average crystallite size in the ‘a’-axis was found to be 20.5 nm, which gradually increased up to 42.5 nm when deposited in increasing mass onto the halloysite surface in the nanocomposites.
As expected at elevated temperatures [8,48], the gradual collapse of the partially hydrated halloysite structure to the dehydrated d(001) = 7.2 Å was observed as the interlayer water located between the halloysite TO layers were removed via the 350 °C heat treatment of composites (Figure 1/H-ZnO-2%-28%). The intensity loss of the halloysite 001 reflection at 12.26° 2theta and that of quartz at 26.6° 2theta was associated with the decreasing halloysite content of the composites (Figure A1/H-ZnO-2%-28%). The dehydrated halloysite 001 reflection could be utilized to estimate the average crystallite size of halloysite in the ‘c’-axis by the Scherrer equation [49] along with the number of TO layers in a crystallite [50]. As observed on the XRD patterns, the results indicated (Table A1, Figure 1) that besides the dehydration, insignificant structural changes and alterations related to the thermal treatment of halloysite were taking place.
3.1.2. Infrared Spectroscopy (FTIR-ATR)
Infrared spectra of the as-prepared samples are given in Figure 2 and in Figure A2. The unique features of the untreated halloysite (Figure 2/Hal) were the inner surface and inner hydroxyl stretching (3695 cm−1, 3625 cm−1) as well as the hydroxyl deformation (907 cm−1, 937 cm−1) vibrations of the alumina sheet, while the siloxane sheet could be identified by the Si-O stretching vibrations (1019 cm−1, 1025 cm−1, and 1003 cm−1) [8,51]. The broad band of hydroxyl stretching in the 3000–3600 cm−1 region and its deformation band at 1630 cm−1 indicated the water content of the halloysite sample. The absence of a clear (water) band around 3550 cm−1 consolidated the dominantly dehydrated halloysite form indicated by the XRD results (Figure 1/Hal, d(001) = 7.4 Å). The presence of quartz could not be identified in the spectra as its band overlapped with that of the Si-O vibrations of the halloysite [52].
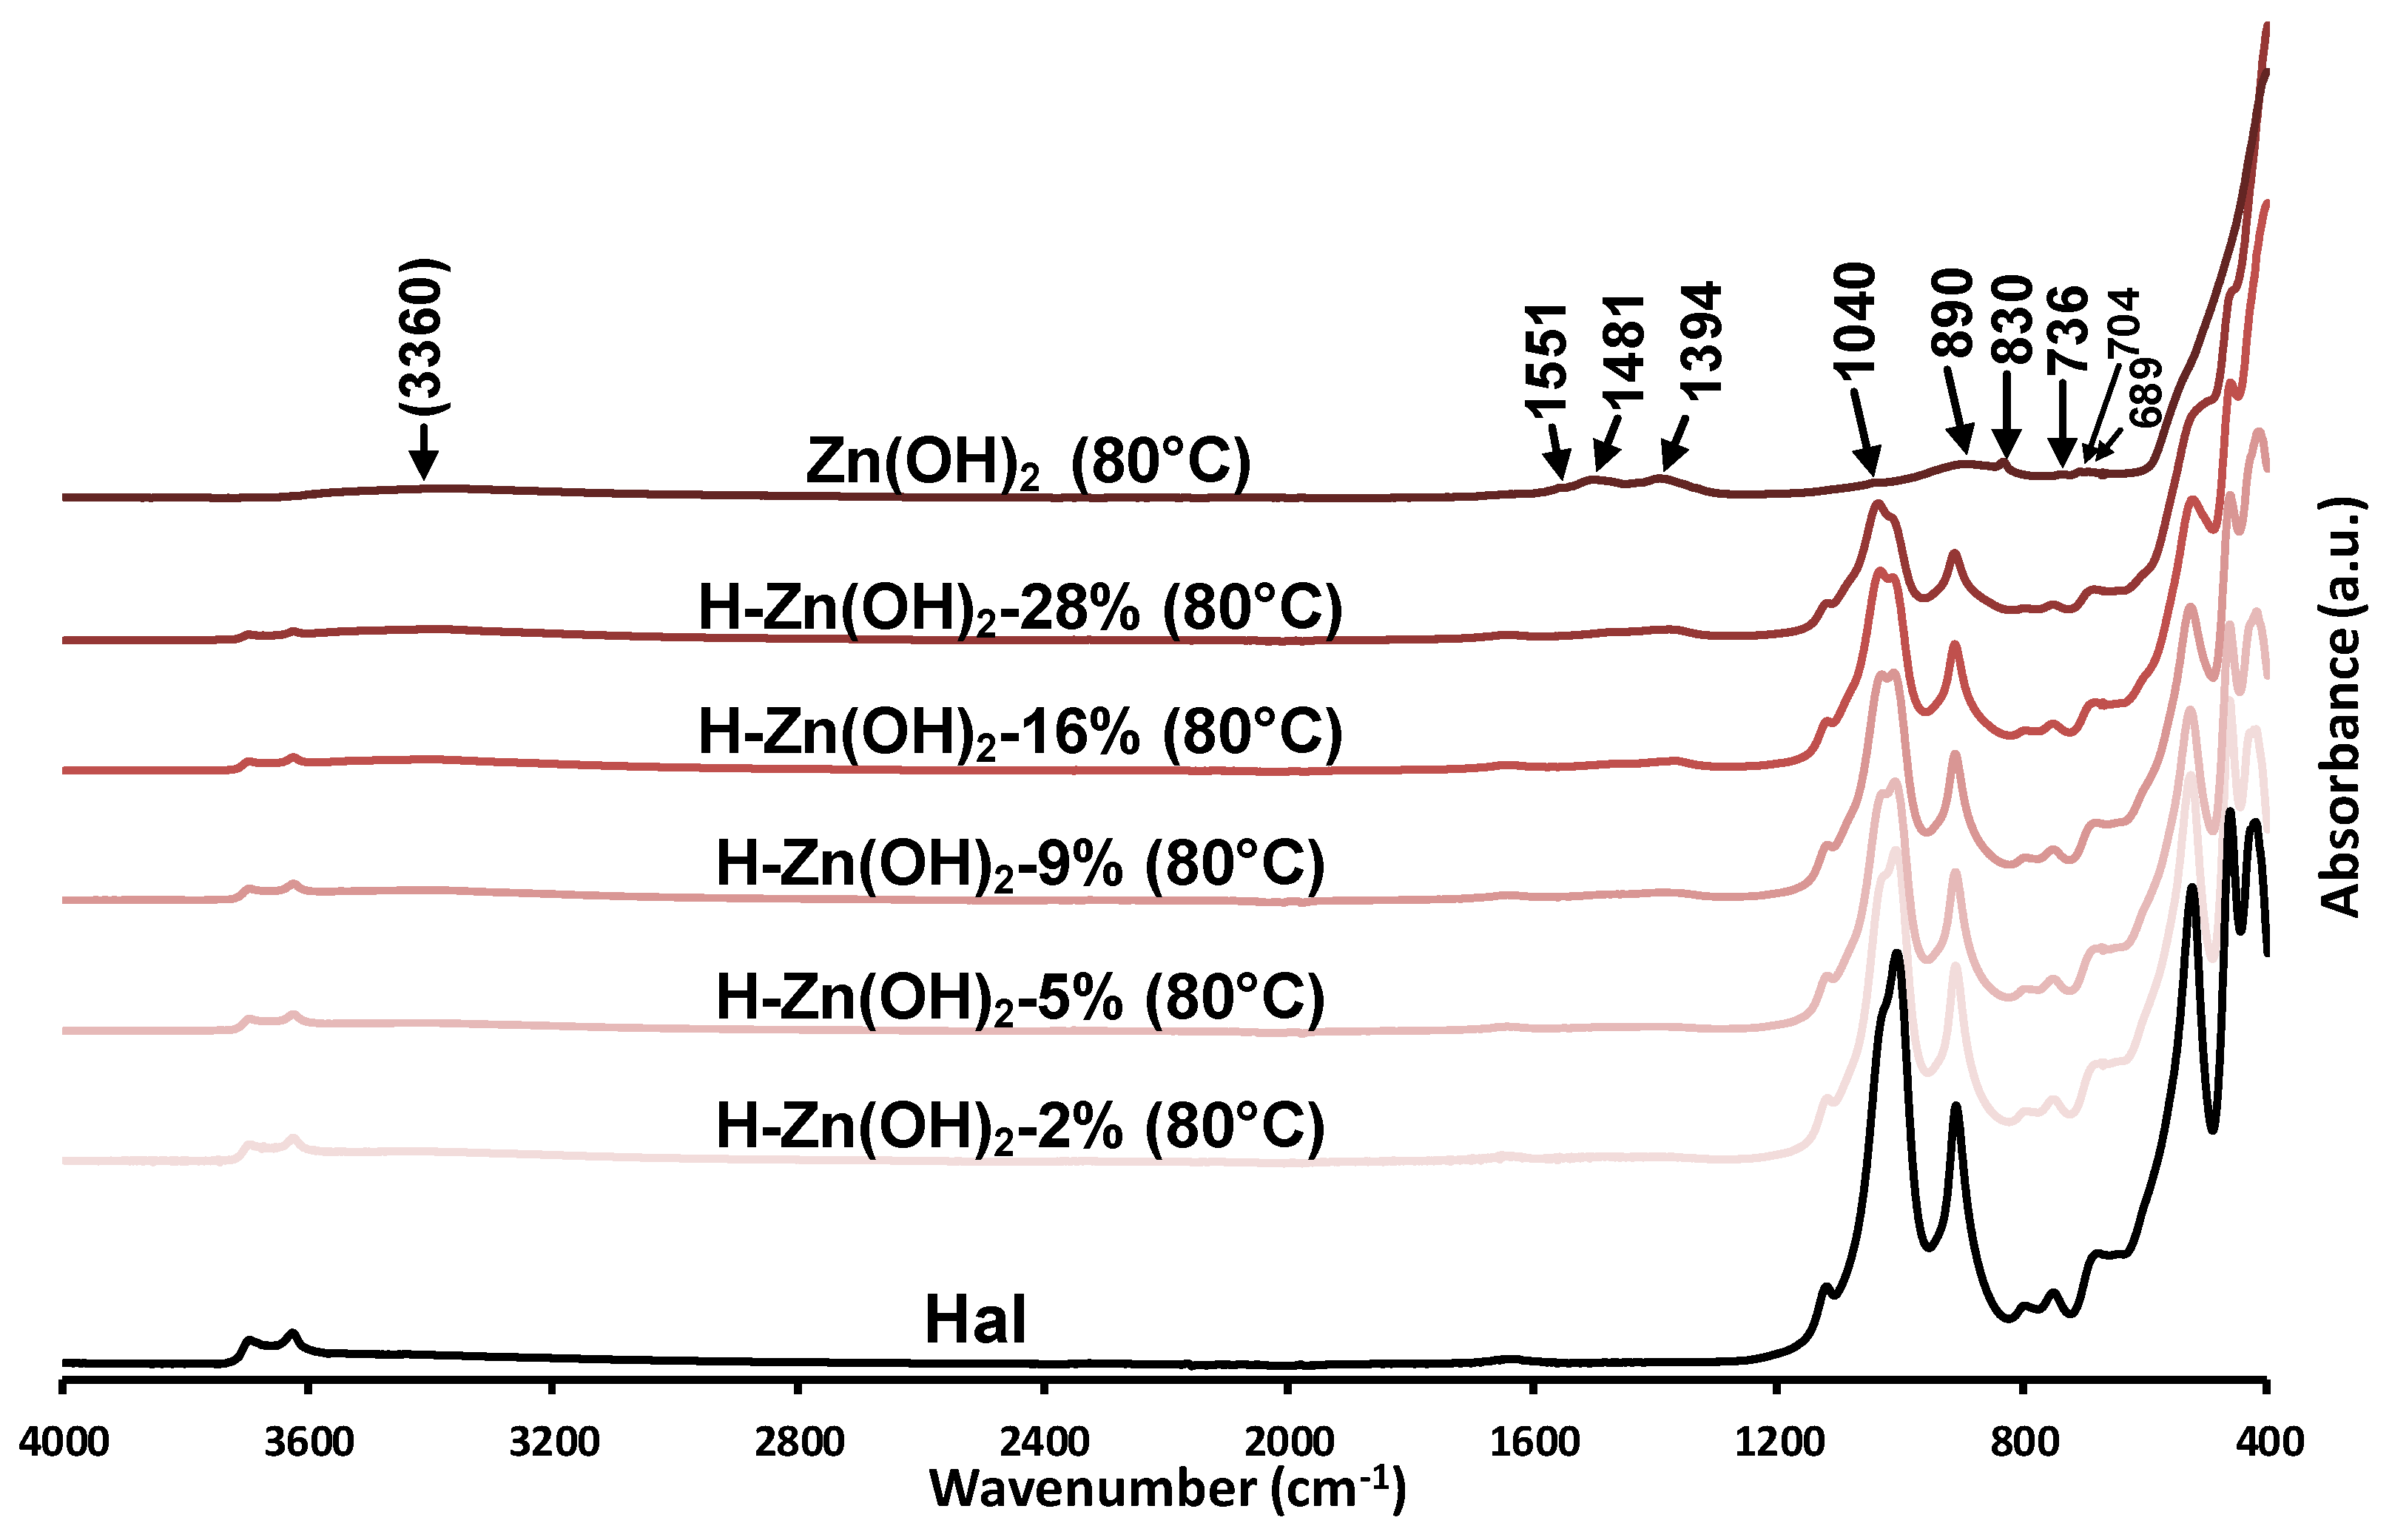
Based on the XRD results, the as-prepared synthetic zinc hydroxide dominantly consisted of zinc oxide, which was indicated by the high intensity baseline shift below 560 cm−1 assigned to the stretching vibrations of ZnO (Figure 2, Figure A2/Zn(OH)2). The broad band centered around 3360 cm−1 was indicative of the hydroxyl stretching vibrations of Zn(OH)2 [53], overlapped with the stretching vibration of surface-adsorbed water, while the hydroxyl deformation (libration) vibrations of Zn(OH)2 were observed in the 600–1200 cm−1 region [54,55] (Figure A2). The bands observed at 830, 1394, and 1481 cm−1 could be attributed to the presence of nitrate ions [56], incorporated into the Zn(OH)2 crystal structure during the hydroxyl preparation from the nitrate precursor salt [45].
The infrared spectra of the prepared composites display the spectral features of their constituents. The band intensities of the halloysite aluminosilicate framework decreased as the Zn content increased in the samples (Figure 2/H-Zn(OH)2-2% to 28%). The presence and attachment of Zn(OH)2/ZnO to the mineral was clearly indicated by the relative band intensity changes and small shift of the halloysite silica sheet vibrations (1025/1003 cm−1 to 1035/1012 cm−1). No similar phenomenon was observed for the hydroxyl vibrations of the alumina sheet.
3.1.3. Thermal Analysis (TG/DTG)
Results of the thermoanalytical measurements are given in Figure 3, while the detailed thermogravimetric data are summarized in Table A2.
The untreated halloysite sample showed three thermal decomposition stages (Figure 3/Hal). The removal of weakly bound and adsorbed water took place in stage I, while the low mass loss of stage II indicated the partially dehydrated halloysite structure with no prominent presence of interlayer water. Structural dehydroxylation of the aluminosilicate framework was observed as a major mass loss in stage III (340–650 °C), where the hydroxyl groups of the alumina sheet were removed via water liberation [57,58]. This structural alteration yielded amorphous meta-kaolinite (Al2Si2O7) [59] which was, in the current study, not desirable for nanocomposite preparation due to the major loss of surface hydroxyls and deteriorated porosity. However, a mild controlled dehydroxylation could significantly increase the potential photoactivity of the halloysite surface [8]. The dehydroxylation mass loss (Δm= −11.10%) could be utilized for assessing the halloysite content of the composite sample: for this purpose, dehydroxylation was related to the water-free dry sample mass (calculation is given in Appendix B). The dry sample-related dehydroxylation mass loss (11.83%) was lower than the theoretical value (13.96% [59]), indicating that another mineral, identified as quartz by XRD, was also present.
Three distinctive thermal stages were observed for the as-prepared Zn(OH)2 sample (Figure 3/Zn(OH)2 (80 °C)). The first stage was assigned to the removal of surface adsorbed water. Overlapping with this process, the thermal decomposition of zinc hydroxide [60] and zinc-hydroxide-nitrates was expected between 80–250 °C [61,62]. Considering that a similar solid-phase transformation () already took place during the synthesis (see Section 3.1.1), it was not surprising that the observed mass loss (2nd stage, Δm= −5.12%) was significantly lower than the theoretical value expected from a pure zinc hydroxide sample (Δmtheoretical= −18.12%).
The thermal behavior of the as-prepared halloysite-Zn(OH)2 precursors was also investigated (Figure 3/H-Zn(OH)2 (80 °C) 5–28%). The thermal decomposition step of zinc hydroxide was shifted to higher temperatures (Figure 3/H-Zn(OH)2 (80 °C) 5%, stage II), indicating that the reagent was strongly bonded with halloysite, resulting in its slightly increased thermal stability. This mass loss was increased and shifted to lower temperatures as the zinc-content of the composite samples was increasing, along with the parallel decreasing of the dehydroxylation mass loss with decreasing halloysite contents. The observed shift in the thermal stability of zinc hydroxide was indicative of a possible saturation of the binding sites on the halloysite surface and a subsequent formation of individual non-surface attached formations.
A low temperature chemical precipitation synthesis yielded halloysite-based nanocomposites with minor Zn(OH)2 and a major ZnO content. The heat treatment temperature of 350 °C was adequate for the remaining surface-deposited zinc hydroxide transformation to ZnO without thermal dehydroxylation of the halloysite structure. The heat-treatment should be supplemented with an isothermal stage (2 h) to provide sufficient time for the energy- and mass-transfer processes to proceed and achieve a suitable ZnO formation rate.
3.1.4. Porosity and Morphology
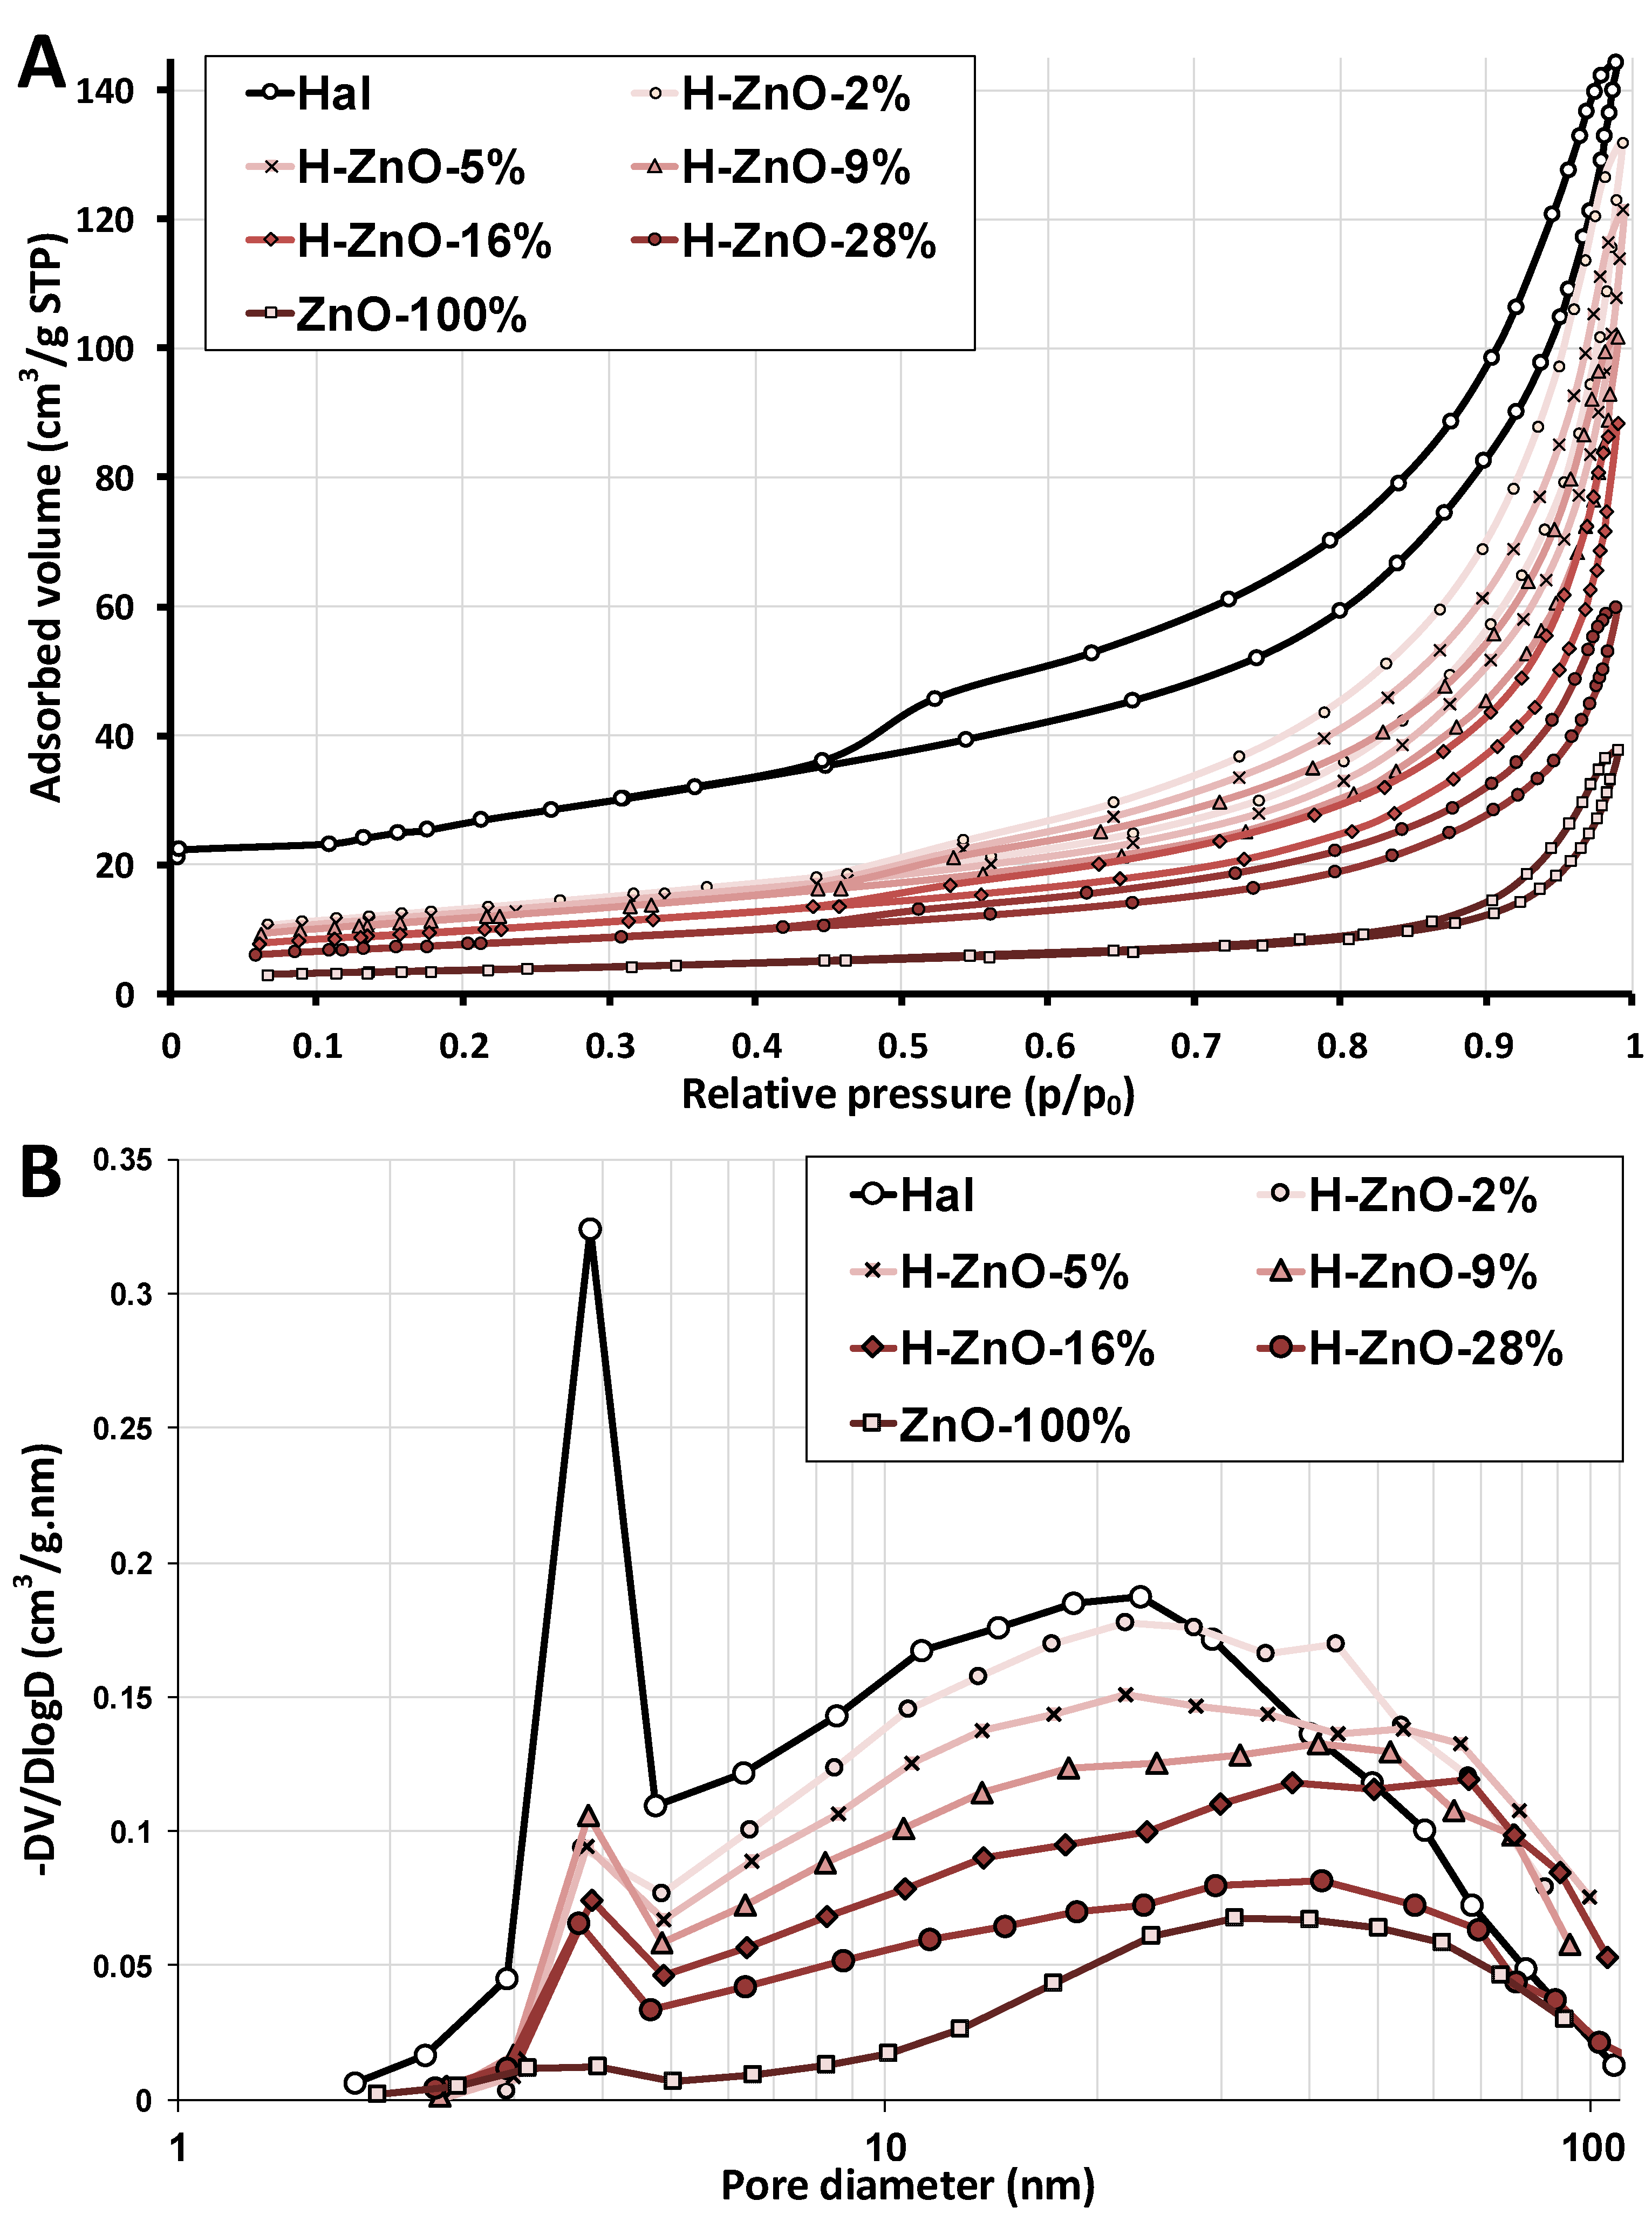
Specific surface area (SSA) and pore volumes, crucial attributes for any catalyst, were determined by nitrogen adsorption measurements (Figure A3A) utilizing the BET and BJH methods. The results are summarized in Table 2, while the pore-volume distribution is shown in Figure A3B. In harmony with reported values [63,64], the untreated halloysite displayed a catalytically favorable high SSA. The majority of the observed halloysite pores were mesopores (2–50 nm, Figure A3B), mostly due to the halloysite nanoscrolls having their lumen size in this range [3,8]. The specific surface area and pore volume of the nanocomposites increased as the synthetic ZnO content, generally having low-surface area and porosity [65,66], decreased. This increment can be explained by the increased population of mesopores (2–50 nm) due to the presence of halloysite and the formation of new macropores (>50 nm) in the halloysite nanocomposites as the cumulative pore-volumes were slightly shifted to the macropore range (Figure A3B). The differences in the BET- and BJH-SSA values can be explained as the BJH method [41] approximate pores with ideal cylindrical geometry, which would result in differences when pores with different geometries are present.
Overall, the SSA and pore volume of the halloysite nanocomposites were significantly greater than that of pure synthetic ZnO, which indicates a potential benefit in their photocatalytic application.
The morphology of the synthetized zinc oxide and its halloysite-based nanocomposites was investigated by transmission electron microscopy (TEM). The images are summarized in Figure 4.
Small quasi-spherical scale-like crystallites having 16 ± 6 nm average diameter and their aggregated structures were identified in the synthetic ZnO sample (Figure 4A–C). This is in good agreement with the calculated crystallite sizes determined from the XRD measurements (Table A1). Generally, the synthesis conditions determine the dominant morphology [60,67], while on the other hand, the morphology of ZnO nanoparticles strongly influences their aggregation behavior, with the quasi-spherical morphology displaying an increased tendency to aggregate [68]. However, the presence of both small, individual, and their aggregated structures can be catalytically advantageous in reduction and degradation processes [69]. According to the elemental mappings by EDX measurement, the ZnO-100% sample dominantly consisted of zinc and oxygen with minor impurities (Figure A4, Table A3/ZnO-100%). The halloysite-ZnO nanocomposites showed features of both the scroll-like tubular halloysite (Figure 4G) and the aggregated ZnO nanoparticles. The occurrence of uncoated halloysites by zinc oxide nanoparticles decreased as the Zn content increased in the composites (Figure 4D), which would increase the aggregation of particles, resulting in the observed decreased surface area of the composites having higher zinc content (Table 2).
3.2. Photochemical Characterization of Nanocomposites
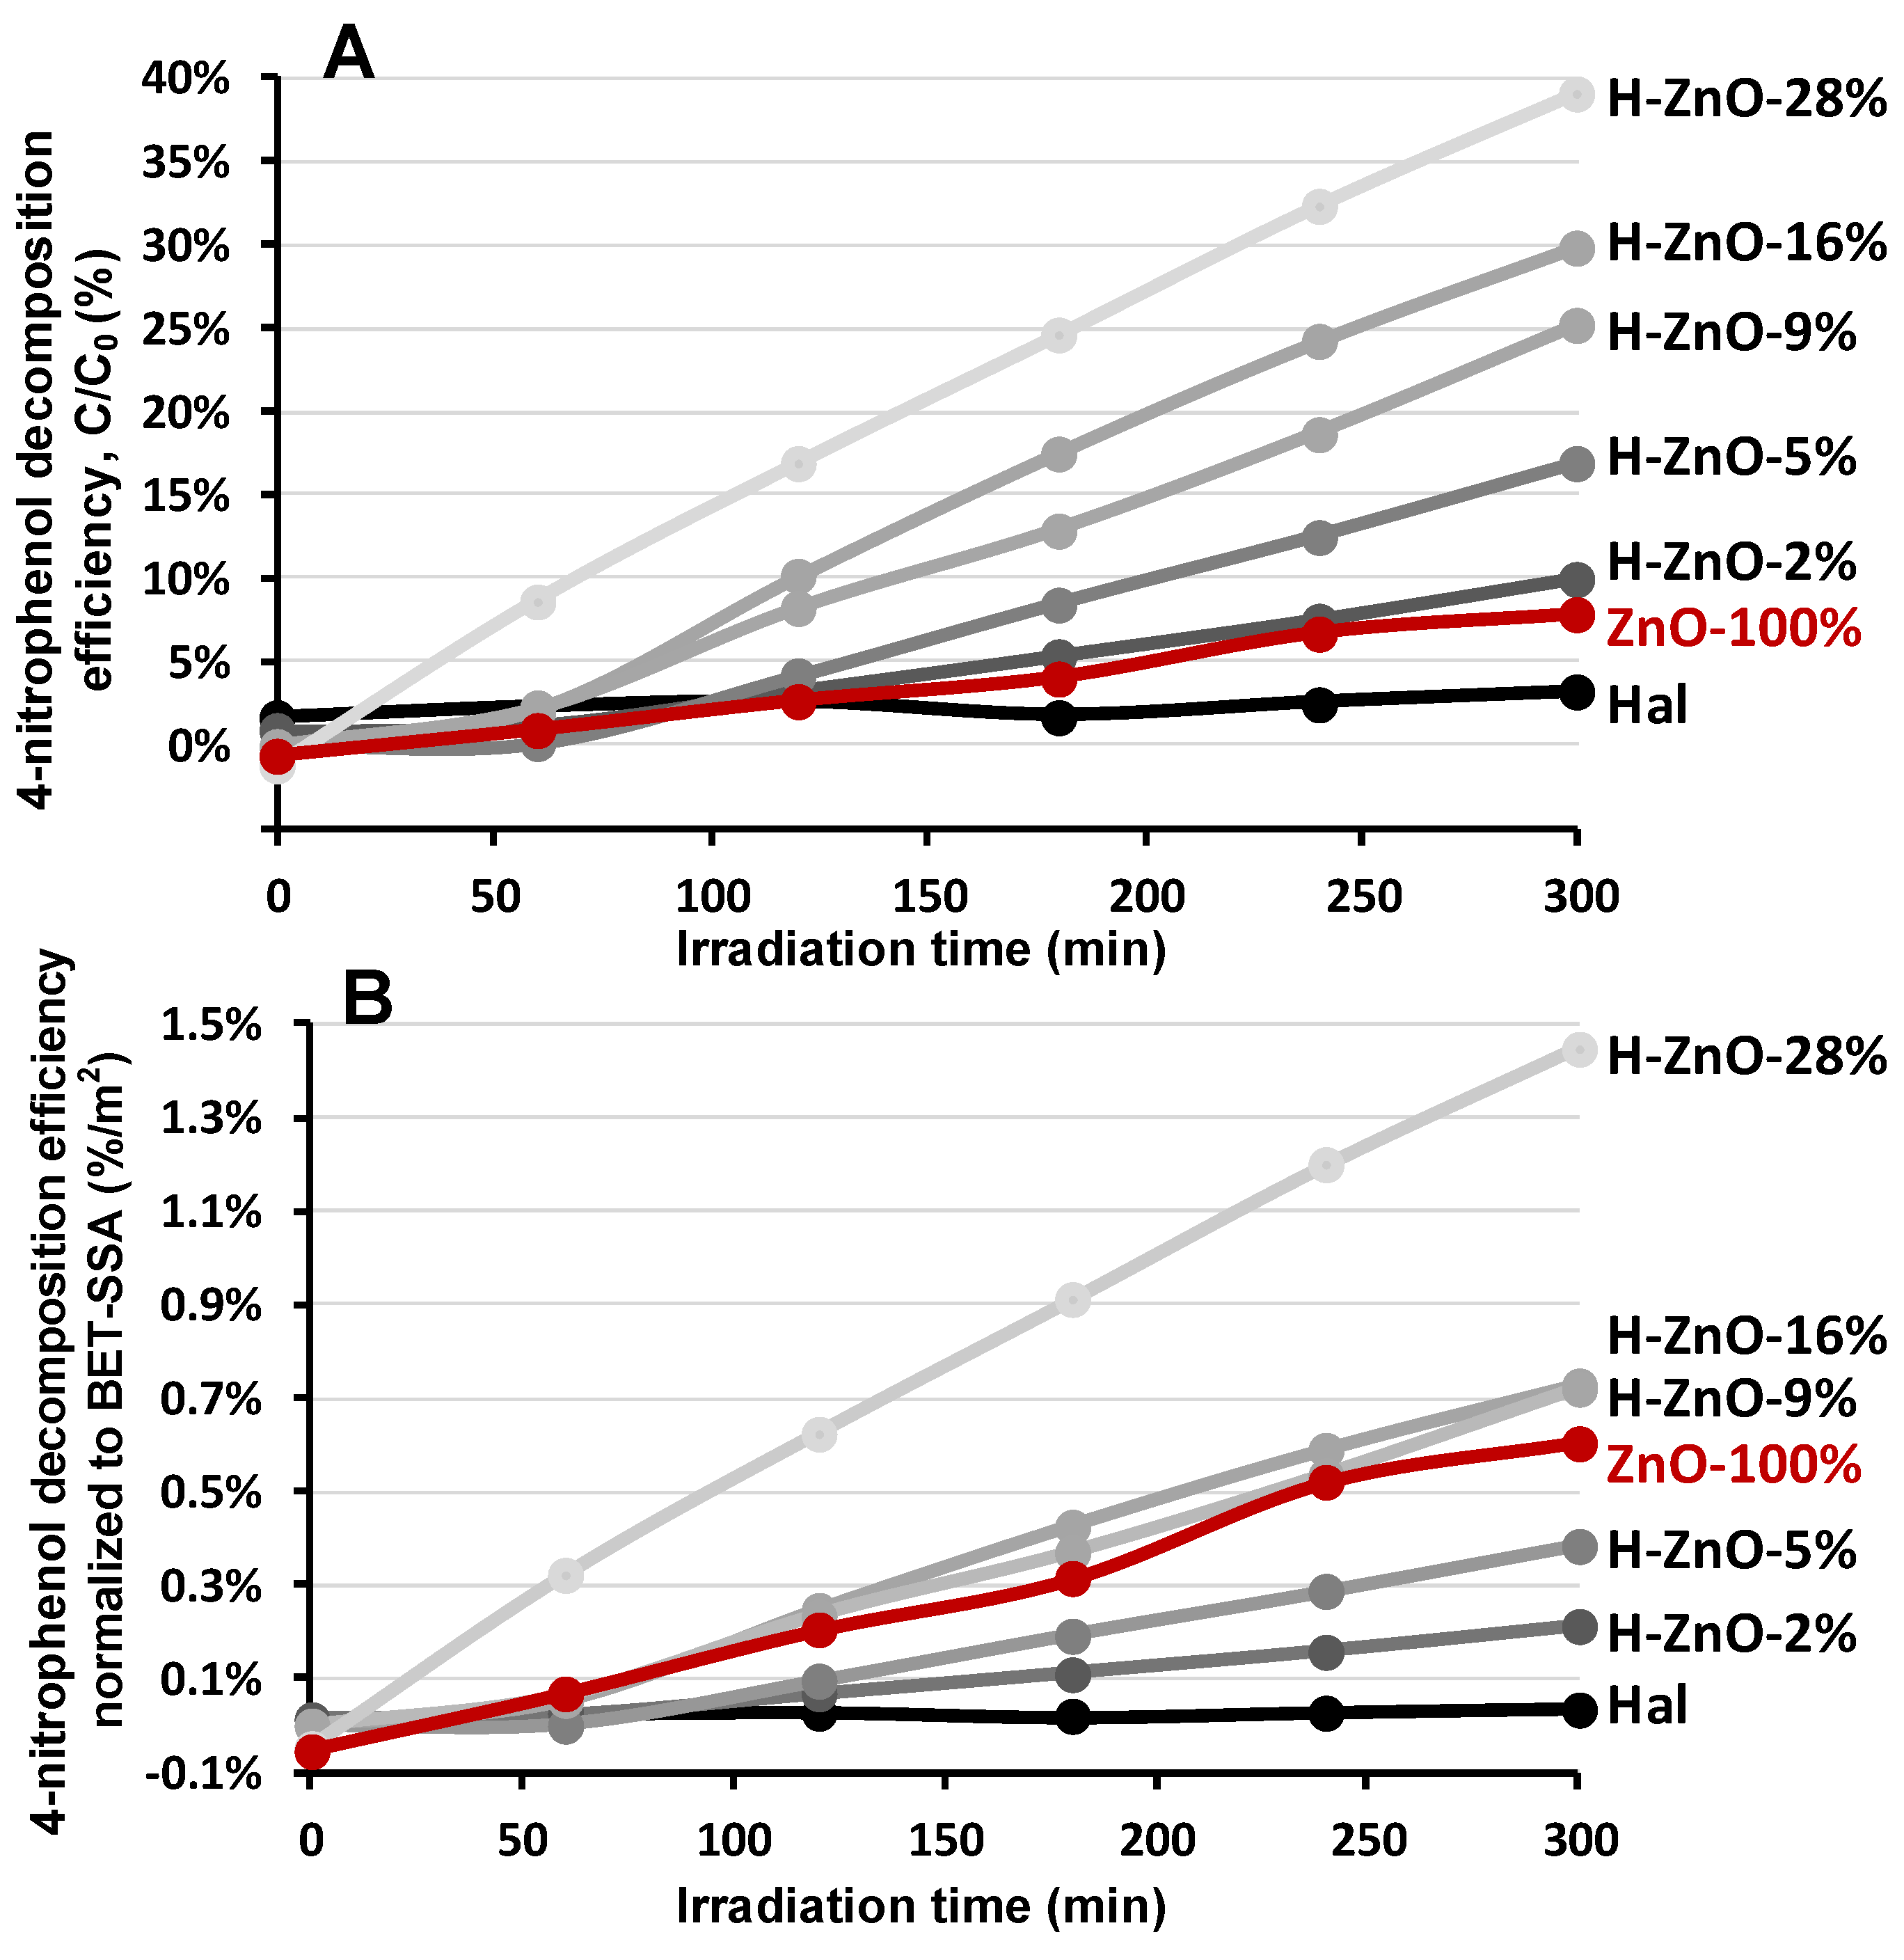
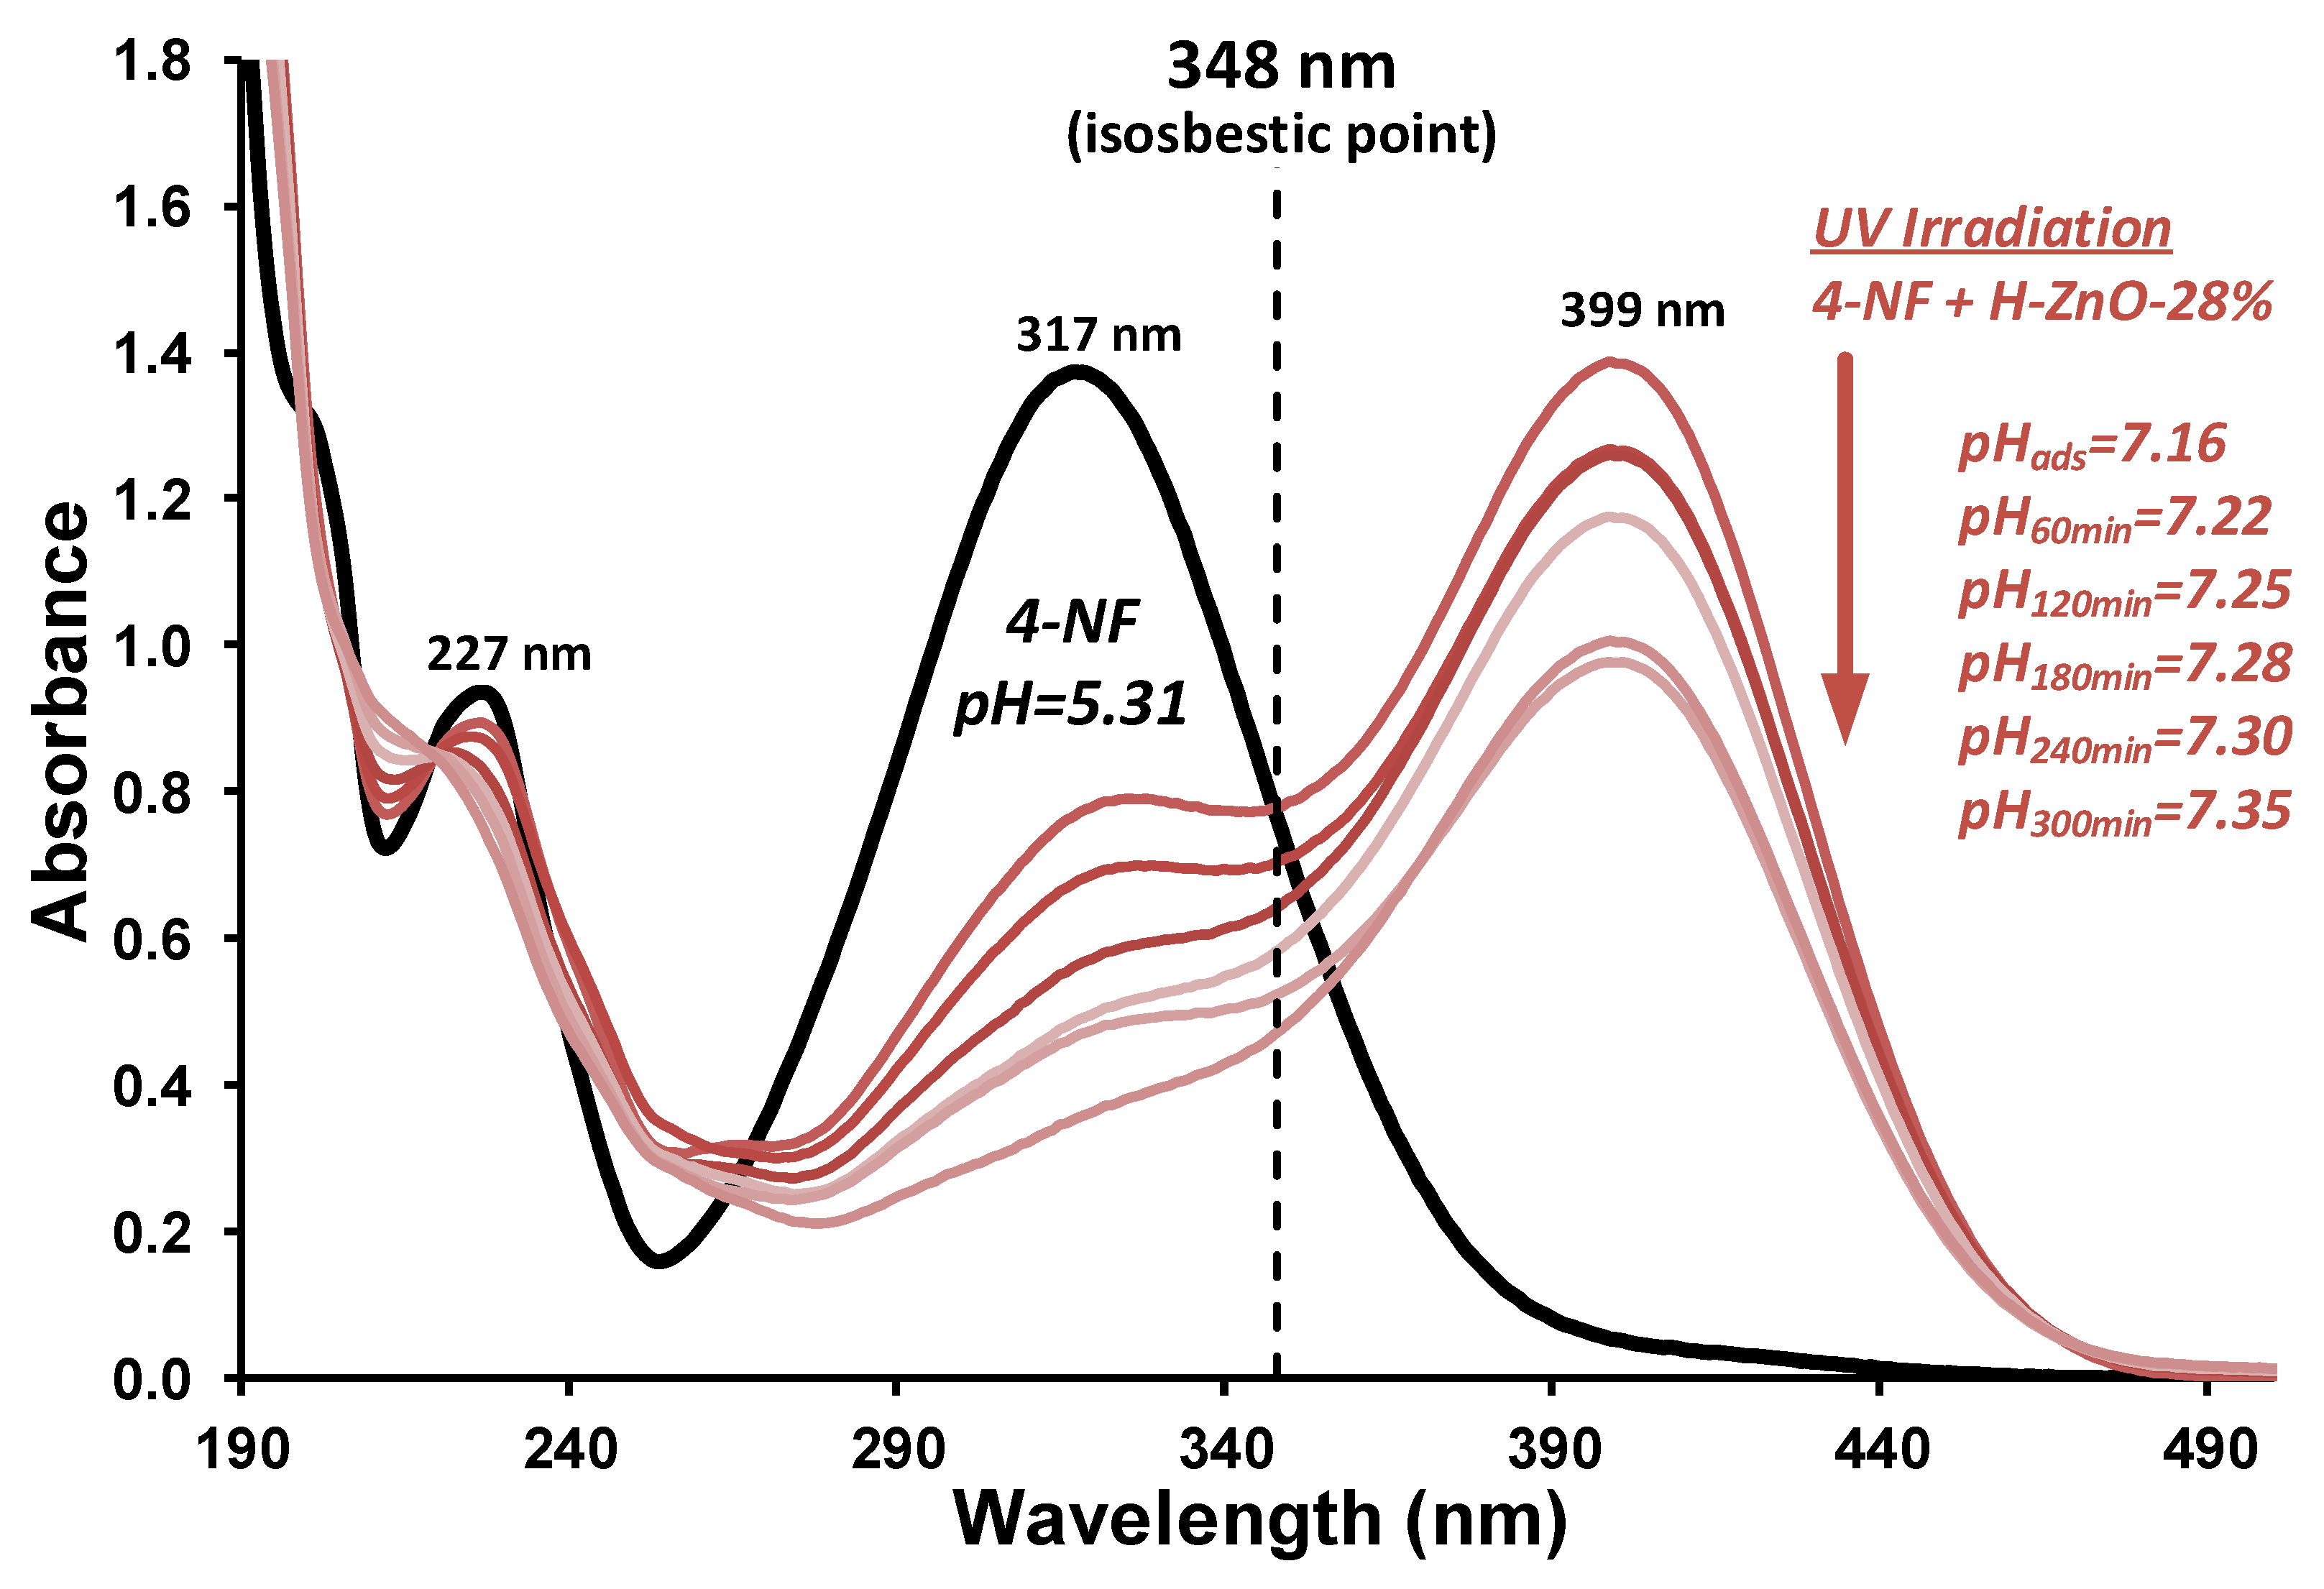
Photocatalytic degradation of 4-nitrophenol (4-NF) is a complex reaction, which can undergo oxidative or reductive photodegradation, depending on the reaction conditions [70,71]. The photochemical activity of the synthesized composite samples was investigated by the decomposition of 4-NF test compound upon 365 nm UV irradiation in a limited oxygen-availability system. Changes of the typical absorbance bands of the 4-NF could be observed after adsorption (Figure A5), as the adsorption maxima of 4-nitrophenol (317 nm) and 4-nitrophenolate (399 nm) was changed. This is due to its pH sensitivity as it can transform (4-nitrophenol↔4-nitrophenolate), which results in the change of its molar extinction coefficient and adsorption bands except in the isosbestic points [72,73]. This reduction in presence of ZnO nanoparticles is reported in the literature [74,75]; however, the importance of the isosbestic point is generally not highlighted, which could cause inconsistencies if the degradation is evaluated upon the changes of the 4-nitrophenol or 4-nitrophenolate absorption maxima rather than the isosbestic point. Therefore, the 348 nm isosbestic point was used for the monitoring of the test compound degradation (Figure A5). The results are given in Figure 5.
The untreated halloysite showed insignificant photoactivity while the pure ZnO nanoparticles displayed only minor activity (8%) in the degradation of the test compound (Figure 5A Hal, ZnO-100%). The photoactivity of the prepared nanocomposites were enhanced significantly as the zinc oxide content increased, which could be followed by the decline in the adsorption intensity at the isosbestic point of 348 nm (Figure A5). This could be explained by the advantageous effect of the aluminosilicate support enhancing the photoactivity, mostly by the dispersion of ZnO nanoparticles and more efficient adsorption of 4-NF [15,76]. The best performance was observed for the H-ZnO-28% sample by removing 39% of the initial 4-NF test compound after 300 min irradiation.
The photocatalytic activity of the samples were strongly linked to their surface area. Considering the decreasing tendency of their SSA as the ZnO content increased in the composites (Table 2), the specific surface normalized photocatalytic activity could be given (Figure 5B). This indicates the catalytic activity per unit surface and could be more beneficial for comparison and evaluation of the performance potential of catalyst samples having different SSA. The results indicated that the negligible photoactivity of halloysite could be significantly improved by nanocomposite preparation; however, only the nanocomposites having higher ZnO content (9–28%) could outperform the normalized activity of pure synthetic zinc nanoparticles. The highest ZnO content sample was clearly the best candidate for the photocatalytic 4-NF removal (Figure 5A,B).
3.3. Stability of the Nanocomposites and Their Toxicity
The stability of the halloysite-ZnO nanocomposites was tested via zinc dissolution under various pH conditions. Acidic (pH = 1.9) and basic (pH = 12.4) conditions were applied along with a pH = 5.6 simulating the slightly acidic natural conditions of unpolluted rain waters. Mostly, pH governs the solubility of zinc; however, crystallinity and particle size can also have an effect (increased solubility for nanoparticles [77]).
Independently of the zinc content of the samples, the mobilized Zn2+ content was found relatively high in acidic conditions, as zinc is dissolved in low pH environments (Table 3). ZnO nanoparticles were reported to be unstable in the pH 6–7 range [78,79]; however, the mobilized Zn2+ was found to be under the limit of detection in slightly acidic media (pH = 5.6) and rather low in basic environments (Table 3). The results indicated that the mobilization risk of zinc ions from the synthesized halloysite nanocomposites was negligible under short-term contact in the pH conditions of surface waters, promoting the possible use of these environmentally friendly photocatalysts in ambient applications.
The mobility of zinc also governs its toxicity to microorganisms in aqueous phase; therefore, its toxicity to aquatic microorganisms should also be assessed for a better evaluation of its potential use in environmental application such as wastewater treatment.
The indirect toxicity of leached samples in different pH environments was estimated by the bioluminescence suppression of a Vibrio fischeri bacteria strain. The commercially available bioluminescent Vibrio fischeri bacteria is widely used for toxicity assessments [80]; however, it is susceptible to environmental conditions such as pH, temperature, and salinity [81]. The acidic (pH = 1.9) and basic (pH = 12.4) conditions applied in the determination of zinc mobility were adverse due to the pH sensitivity and subsequent luminescence suppression; therefore, the toxicity measurements were focused on the pH = 5.6 environment. The results are summarized in Figure 6.
Zinc oxide nanoparticles are reported to have anti-bacterial and -microbial properties [37], which explains the luminescence suppression of pure zinc nanoparticles (Figure 6/ZnO-100%). Despite the slightly suboptimal pH of 5.6, only low toxicity was observed after 30 and 60 min of exposure most probably due to the minor amounts of mobilized Zn-ions [82] (Table 3). In harmony with the literature [34], no significant toxicity was observed for the halloysite sample. The toxicity of the halloysite-zinc-oxide nanocomposites was only marginal and within the uncertainty range of the measurement. This finding highlights the potential application of halloysite-zinc-oxide nanocomposites, as these materials showed increased photocatalytic efficiency with decreased toxicity compared to pure ZnO nanoparticles.
4. Conclusions
Halloysite nanocomposites containing surface-bound zinc oxide nanoparticles in low concentrations (2–28 m/m%) were synthesized via a hydroxide precursor prepared by chemical precipitation and subsequent thermal treatment. Structural elucidation investigation of the zinc hydroxide precursor revealed that besides zinc-hydroxides, zinc oxide could be dominantly synthesized via a low temperature (80 °C) heat treatment. Thermal analysis highlighted the importance of the final heat treatment step, as 350 °C was found to be adequate for the total zinc oxide transformation without causing major structural alteration to the halloysite structure due to thermal dehydroxylation. The specific surface area and porosity of halloysite-based zinc oxide nanocomposites increased advantageously after nanocomposite preparation.
The importance of the isosbestic point in the determination of 4-NF was highlighted. The halloysite-ZnO nanocomposites showed increased photocatalytic activity in the degradation of 4-NF test compound compared to pure zinc oxide nanoparticles or halloysite nanotubes. Specific surface area normalized photocatalytic activity enabled the direct comparison of catalysts having different SSA values, and highlighted the synergic effect above 9% ZnO content.
The stability of surface-bound zinc nanoparticles in the composites was investigated in different pH environments (pH = 1.9, 5.6, and 12.4). No correlation was found between the dissolved zinc ions and the zinc content of the composites as the pH mostly determined the dissolution. The mobilization of zinc ions was found to be high (pH = 1.9), low (pH = 12.4), and negligible at pH = 5.6, highlighting the application limits of the nanocomposites. The short-term toxicity of leachates of the nanocomposites were evaluated by the Vibrio fischeri bioluminescence suppression method, indicating that the low toxicity of ZnO nanoparticles could be significantly decreased by surface attachment in the nanocomposites. Considering the enhanced photocatalytic activity and their lower toxicity compared to pure ZnO nanoparticles, the halloysite-ZnO nanocomposites can be promising materials for environmental remediation applications.
Author Contributions
Investigation, B.Z., V.V., T.J., O.F. and E.S.-B.; Analysis: B.Z. and O.F.; Data curation: B.Z.; Writing—original draft: B.Z. and J.K.; Writing—review and editing: B.Z. and J.K.; Visualization: B.Z.; Resources: E.H. and J.K.; Supervision: E.H. and J.K.; Funding acquisition: B.Z., E.H. and J.K.; Project administration: E.H. and J.K. All authors have read and agreed to the published version of the manuscript.
Funding
The work of B.Z. was supported by the ÚNKP-20-4 New National Excellence Program of the Ministry for Innovation and Technology from the source of the National Research, Development and Innovation Fund. V.V acknowledges the support of TKP2020-NKA-10 project financed under the 2020-4.1.1-TKP2020 Thematic Excellence Programme by the National Research, Development and Innovation Fund of Hungary.
Data Availability Statement
Not applicable.
Acknowledgments
Access to powder X-ray diffraction and TEM microscopic (Nanolab) instrumentation at the University of Pannonia is gratefully acknowledged.
Conflicts of Interest
The authors declare no conflict of interest. The funders had no role in the design of the study; in the collection, analyses, or interpretation of data; in the writing of the manuscript, or in the decision to publish the results.
Appendix A
Figure A1.
Structural and compositional identification of the halloysite-Zn(OH)2 composite samples with different Zn content by powder X-ray diffraction measurements. The dashed line indicates the d(001) value of halloysite. The as-synthesized halloysite-Zn(OH)2 composite samples before heat-treatment at 350 °C are denoted with “(80 °C)”.

Table A1.
Average crystallite size (d) of halloysite and zincite. The determined d(001) interlayer distance values were applied when the average number of halloysite TO layers (N) were calculated by the Scherrer equation.
Table A1.
Average crystallite size (d) of halloysite and zincite. The determined d(001) interlayer distance values were applied when the average number of halloysite TO layers (N) were calculated by the Scherrer equation.
| Sample | Halloysite (001) | Zincite (100) | Zincite (102) | |||||||
|---|---|---|---|---|---|---|---|---|---|---|
| 2θ (°) | FWHM (°) | d (nm) | N | 2θ (°) | FWHM (°) | d (nm) | 2θ (°) | FWHM (°) | d (nm) | |
| Hal | 11.91 | 0.842 | 12.2 | 16.4 | - | - | - | - | - | - |
| Hal-ZnO-2% | 12.20 | 0.695 | 15.7 | 21.7 | 31.76 | 0.510 | 26.6 | 47.56 | 0.666 | 20.0 |
| Hal-ZnO-5% | 12.19 | 0.710 | 15.2 | 21.2 | 31.77 | 0.470 | 30.7 | 47.56 | 0.721 | 17.8 |
| Hal-ZnO-9% | 12.18 | 0.689 | 15.8 | 22.0 | 31.75 | 0.450 | 33.4 | 47.55 | 0.707 | 18.3 |
| Hal-ZnO-16% | 12.24 | 0.699 | 15.6 | 21.6 | 31.82 | 0.408 | 40.4 | 47.61 | 0.699 | 18.6 |
| Hal-ZnO-28% | 12.20 | 0.688 | 15.9 | 22.1 | 31.77 | 0.398 | 42.5 | 47.56 | 0.668 | 19.9 |
| ZnO-100% | - | - | - | - | 31.75 | 0.599 | 20.5 | 47.59 | 0.902 | 13.0 |
Figure A2.
Infrared spectra of the investigated precursor samples in the 4000–400 cm−1 spectral region. The bands of the as-prepared Zn(OH)2 sample are indicated.
Figure A2.
Infrared spectra of the investigated precursor samples in the 4000–400 cm−1 spectral region. The bands of the as-prepared Zn(OH)2 sample are indicated.

Table A2.
Thermoanalytical data readouts from Figure 5.
Table A2.
Thermoanalytical data readouts from Figure 5.
| Sample | Stage | Tinitial (°C) | Tend (°C) | Mass Loss Step |
|---|---|---|---|---|
| Hal | I. | 20 | 200 | 0.96 mg (4.98%) |
| II. | 200 | 340 | 0.23 mg (1.19%) | |
| III. | 340 | 650 | 2.13 mg (11.1%) | |
| IV. | 650 | 1000 | 0.12 mg (0.61%) | |
| Initial mass: 19.224 mg | ||||
| Total mass loss: 3.44 mg (17.88%) | ||||
| Zn(OH)2-100% (80 °C) | I. | 20 | 160 | 1.31 mg (2.27%) |
| II. | 160 | 350 | 2.95 mg (5.12%) | |
| III. | 350 | 1001 | 0.37 mg (0.64%) | |
| Initial mass: 57.534 mg | ||||
| Total mass loss: 4.63 mg (8.03%) | ||||
| H-Zn(OH)2-5% (80 °C) | I. | 20 | 200 | 0.81 mg (4.04%) |
| II. | 200 | 340 | 0.33 mg (1.66%) | |
| III. | 340 | 650 | 1.67 mg (8.32%) | |
| IV. | 650 | 1000 | 0.02 mg (0.09%) | |
| Initial mass: 20.062 mg | ||||
| Total mass loss: 2.83 mg (14.11%) | ||||
| H-Zn(OH)2-28% (80 °C) | I. | 20 | 85 | 0.25 mg (1.25%) |
| II. | 85 | 200 | 0.34 mg (1.67%) | |
| III. | 200 | 341 | 0.26 mg (1.29%) | |
| IV. | 341 | 1000 | 0.65 mg (3.24%) | |
| V. | 650 | 1001 | 0.01 mg (0.07%) | |
| Initial mass: 20.06 mg | ||||
| Total mass loss: 1.51 mg (7.52%) | ||||
Appendix B. Thermoanalytical Calculations
Initial sample mass: 19.224 mg
Adsorbed and interlayer water mass: 1.186 mg (20–340 °C)
Dry sample mass: 18.038 mg
Mass loss observed for the thermal dehydroxylation: 2.134 mg (340–650 °C)
Dehydroxylation related to dry sample mass:
Theoretical dehydroxylation mass loss [59]
liberated H2O mass ratio is 13.96%.
Figure A3.
(A): Nitrogen adsorption–desorption and (B): pore–volume distribution curves of the natural halloysite (Hal), synthetic zinc oxide (ZnO-100%), and their nanocomposite samples with varying ZnO content (H-ZnO-2%-28%). The peaks around 3.6–3.8 nm were considered artifacts due to capillary condensation and not related to pores of the sample [83].

Figure A4.
STEM images and EDX elemental composition maps from the designated areas of (A): ZnO-100%, (B): Hal, (C): H-ZnO-5%, (D): H-ZnO-28% samples.
Figure A4.
STEM images and EDX elemental composition maps from the designated areas of (A): ZnO-100%, (B): Hal, (C): H-ZnO-5%, (D): H-ZnO-28% samples.
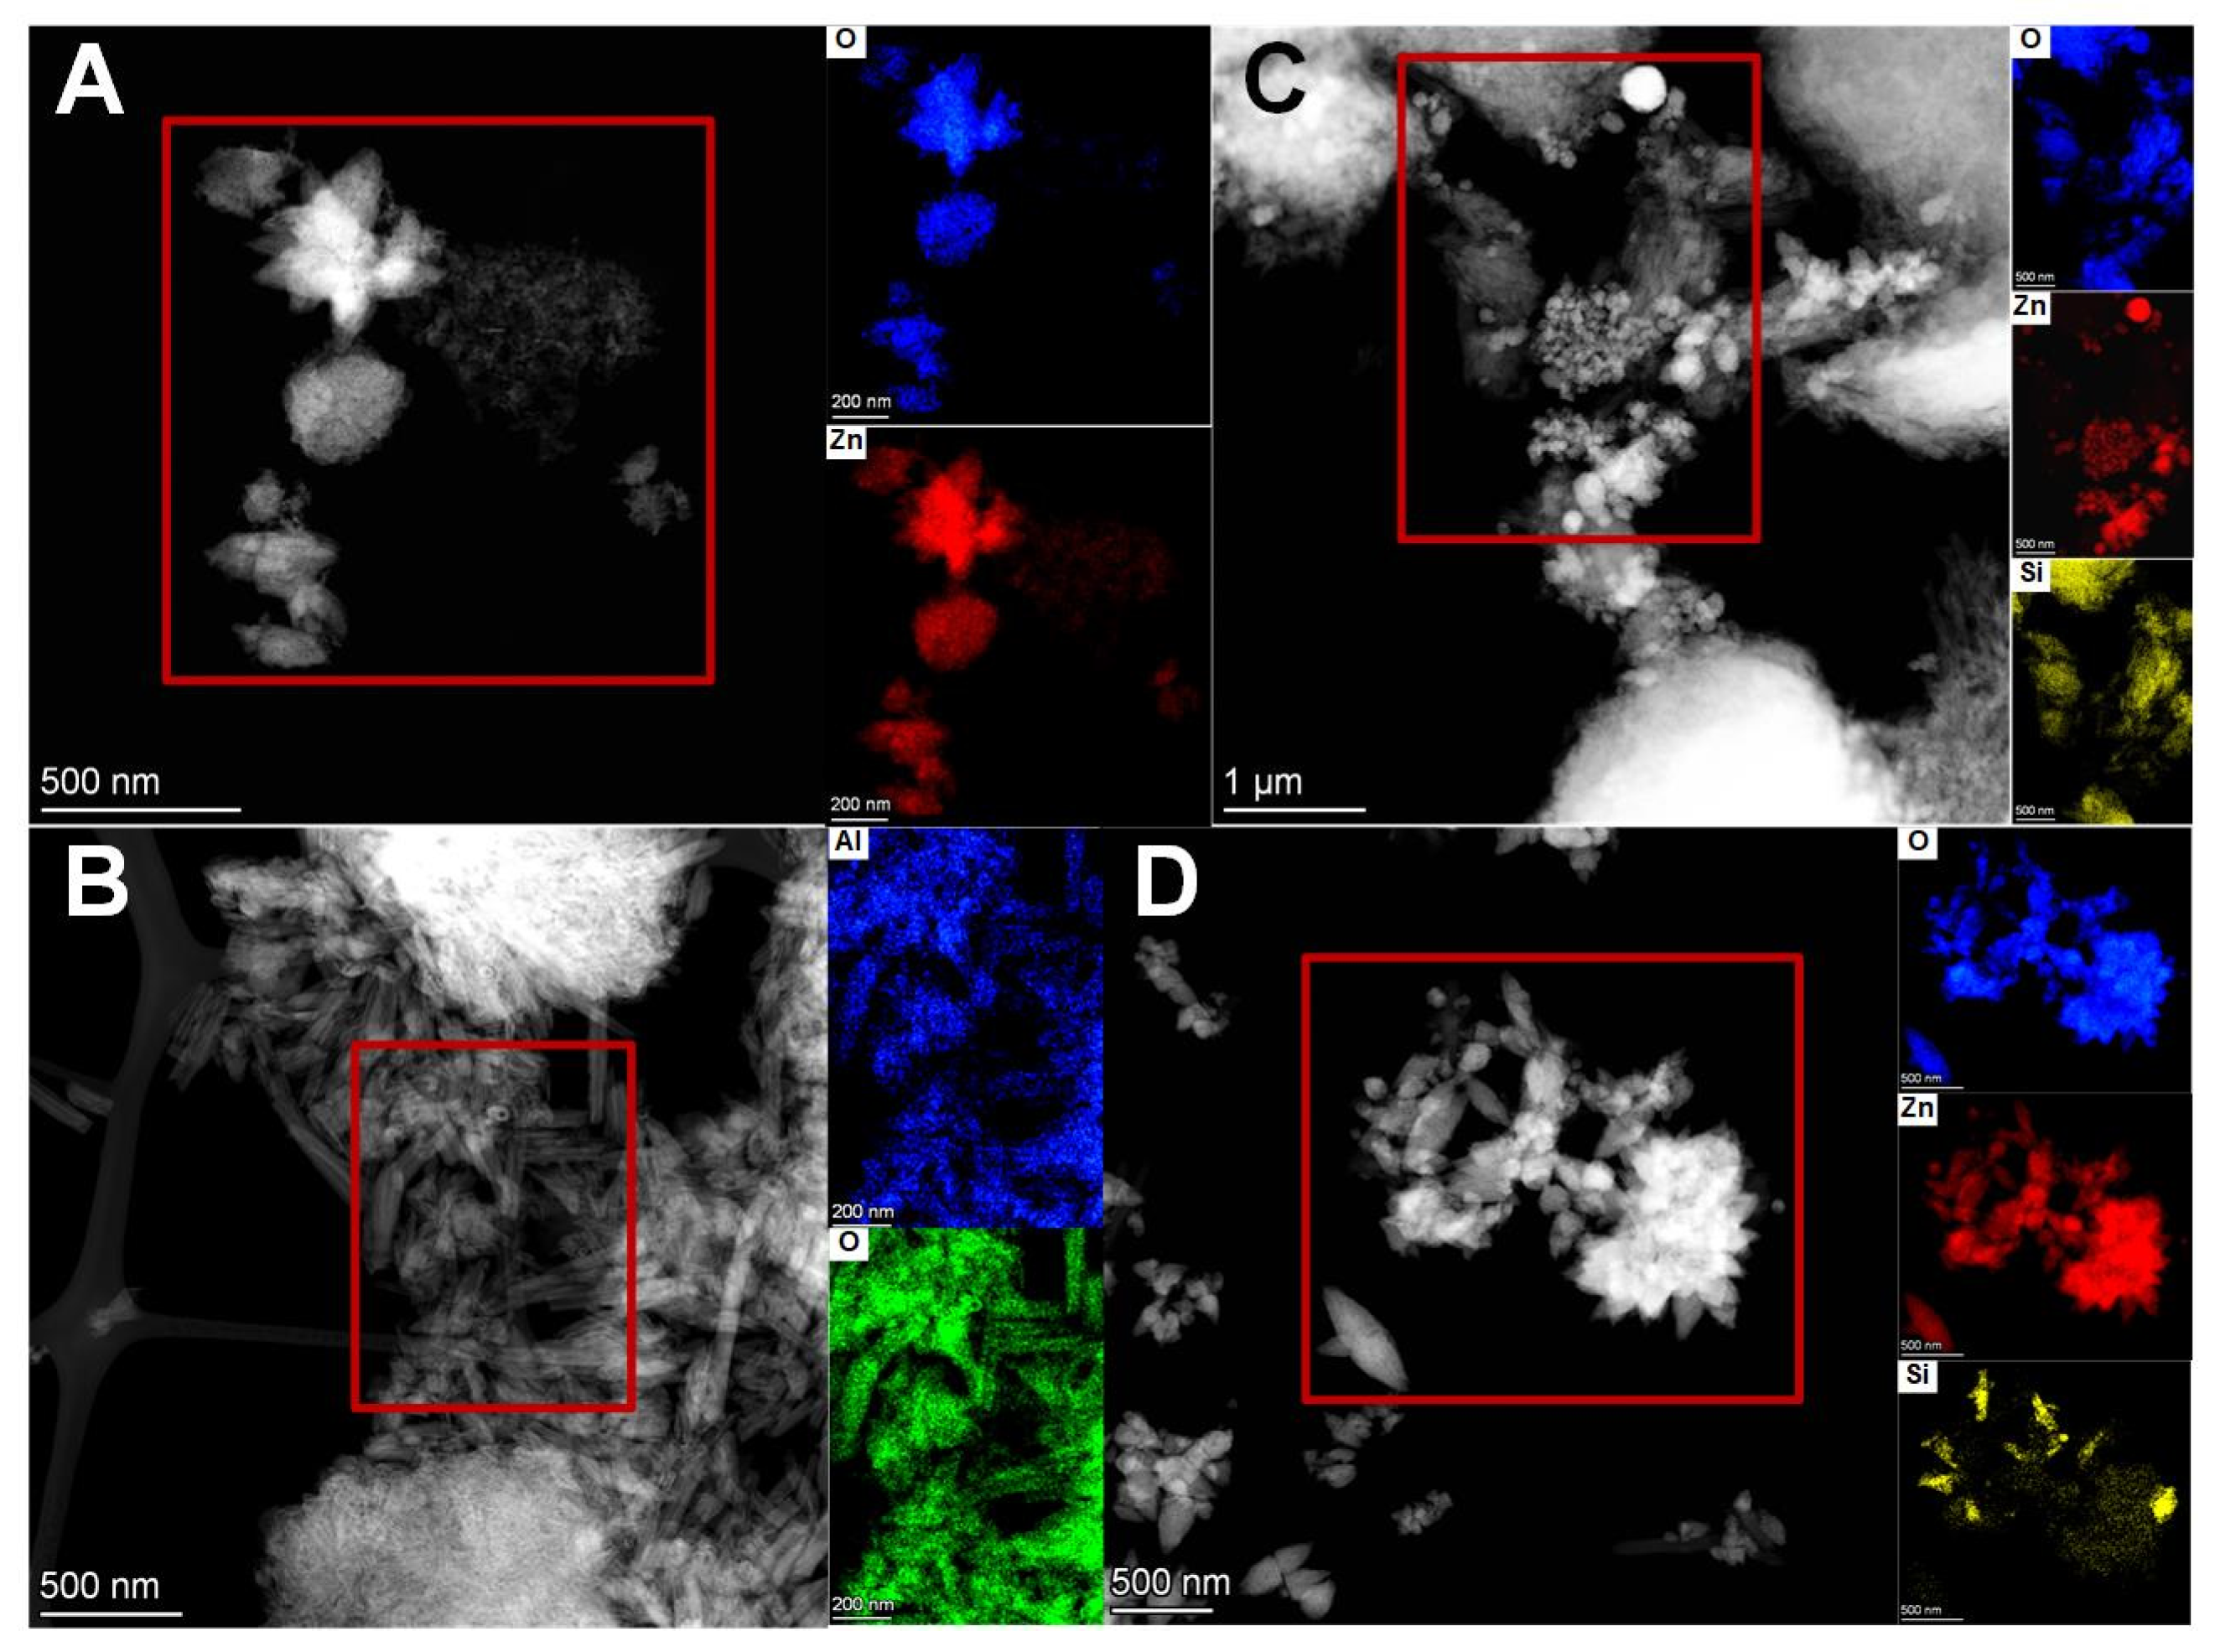
Table A3.
Elemental composition of samples determined by STEM-EDX measurements from the designated areas of Figure A3.
Table A3.
Elemental composition of samples determined by STEM-EDX measurements from the designated areas of Figure A3.
| Sample | Element | Atom% | Mass% |
|---|---|---|---|
| Hal | O | 69.97 ± 6.43 | 57.43 ± 3.34 |
| Al | 15.26 ± 3.32 | 21.12 ± 4.35 | |
| Si | 14.54 ± 3.1 | 20.95 ± 4.21 | |
| Ti | 0.01 ± 0 | 0.02 ± 0 | |
| Fe | 0.11 ± 0.02 | 0.31 ± 0.05 | |
| Zn | 0 ± 0 | 0 ± 0 | |
| ZnO-100% | O | 54.31 ± 8.56 | 22.65 ± 2.34 |
| Al | 0.07 ± 0.02 | 0.05 ± 0.01 | |
| Si | 0.47 ± 0.12 | 0.35 ± 0.08 | |
| Ti | 0.03 ± 0.01 | 0.04 ± 0.01 | |
| Fe | 0.06 ± 0.01 | 0.08 ± 0.01 | |
| Zn | 45.06 ± 9.29 | 76.83 ± 12.93 | |
| H-ZnO-28% | O | 51.61 ± 8.2 | 21.08 ± 2.18 |
| Al | 0.84 ± 0.21 | 0.58 ± 0.13 | |
| Si | 1.08 ± 0.27 | 0.77 ± 0.17 | |
| Ti | 0 ± 0 | 0 ± 0 | |
| Fe | 0.06 ± 0.01 | 0.08 ± 0.01 | |
| Zn | 46.42 ± 9.63 | 77.49 ± 13.08 | |
| H-ZnO-5% | O | 61.89 ± 5.72 | 38.4 ± 2.28 |
| Al | 12.34 ± 2.69 | 12.91 ± 2.66 | |
| Si | 11.45 ± 2.49 | 12.47 ± 2.56 | |
| Ti | 0.01 ± 0 | 0.01 ± 0 | |
| Fe | 0.17 ± 0.03 | 0.36 ± 0.05 | |
| Zn | 14.13 ± 2.29 | 35.84 ± 5.24 |
Figure A5.
Representative UV-Vis spectra at different irradiation times and change of the pH values of the 40 ppm 4-nitrophenol test compound and the H-ZnO-28% composite after adsorption (0 min) and upon 60–300 min λmax=365 nm UV irradiation. The 348 nm isosbestic point, utilized for the determination of decomposition, is indicated with a dashed line.

References
- Brigatti, M.F.; Galan, E.; Theng, B.K.G. Structures and Mineralogy of Clay Minerals. In Developments in Clay Science, Handbook of Caly Science; Bergaya, F., Lagaly, G., Vayer, M., Eds.; Elsevier: Amsterdam, The Netherlands, 2006; Volume 6, pp. 19–33, 35–48. ISBN 9780080441832. [Google Scholar]
- Schoomheydt, R.A.; Johnston, C.T. Surface and Interface Chemistry of Clay Minerals. In Developments in Clay Science, Handbook of Caly Science; Bergaya, F., Lagaly, G., Vayer, M., Eds.; Elsevier: Amsterdam, The Netherlands, 2006; pp. 87–99. ISBN 9780080441832. [Google Scholar]
- Joussein, E. Geology and Mineralogy of Nanosized Tubular Halloysite. In Developments in Clay Science (2016); Yuan, P., Thill, A., Bergaya, F., Eds.; Elsevier: Amsterdam, The Netherlands, 2016; pp. 12–48. ISBN 978-0-08-100293-3. [Google Scholar] [CrossRef]
- Guan, H.; Zhao, Y. 9—Decontamination application of nanoclays. In Micro and Nano Technologies; Cavallaro, G., Fakhrullin, R., Pasbakhsh, P.B.T.-C.N., Eds.; Elsevier: Amsterdam, The Netherlands, 2020; pp. 203–224. ISBN 978-0-12-816783-0. [Google Scholar]
- Kibanova, D.; Trejo, M.; Destaillats, H.; Cervini-Silva, J. Photocatalytic activity of kaolinite. Catal. Commun. 2011, 12, 698–702. [Google Scholar] [CrossRef]
- Szabó, P.; Zsirka, B.; Fertig, D.; Horváth, E.; Csizmadia, T.; Kristóf, J. Delaminated kaolinites as potential photocatalysts: Tracking degradation of Na-benzenesulfonate test compound adsorbed on the dry surface of kaolinite nanostructures. Catal. Today 2017, 287, 37–44. [Google Scholar] [CrossRef]
- Shawky, A.; El-Sheikh, S.M.; Rashed, M.N.; Abdo, S.M.; El-Dosoqy, T.I. Exfoliated kaolinite nanolayers as an alternative photocatalyst with superb activity. J. Environ. Chem. Eng. 2019, 7, 103174. [Google Scholar] [CrossRef]
- Zsirka, B.; Vágvölgyi, V.; Győrfi, K.; Horváth, E.; Szilágyi, R.K.; Szabó-Bárdos, E.; Balogh, S.; Kristóf, J. Compositional, structural, and surface characterization of heat-treated halloysite samples: Influence of surface treatment on photochemical activity. Appl. Clay Sci. 2021, 212, 106222. [Google Scholar] [CrossRef]
- Menager, M.; Sarakha, M. Simulated Solar Light Phototransformation of Organophosphorus Azinphos Methyl at the Surface of Clays and Goethite. Environ. Sci. Technol. 2013, 47, 765–772. [Google Scholar] [CrossRef] [PubMed]
- Győrfi, K.; Vágvölgyi, V.; Zsirka, B.; Horváth, E.; Szilágyi, R.K.; Baán, K.; Balogh, S.; Kristóf, J. Kaolins of high iron-content as photocatalysts: Challenges of acidic surface modifications and mechanistic insights. Appl. Clay Sci. 2020, 195, 105722. [Google Scholar] [CrossRef]
- dos Santos, L.R.; Mascarenhas, A.J.S.; Silva, L.A. Preparation and evaluation of composite with a natural red clay and TiO2 for dye discoloration assisted by visible light. Appl. Clay Sci. 2017, 135, 603–610. [Google Scholar] [CrossRef]
- Szczepanik, B. Photocatalytic degradation of organic contaminants over clay-TiO2 nanocomposites: A review. Appl. Clay Sci. 2017, 141, 227–239. [Google Scholar] [CrossRef]
- Lazzara, G.; Cavallaro, G.; Panchal, A.; Fakhrullin, R.; Stavitskaya, A.; Vinokurov, V.; Lvov, Y. An assembly of organic-inorganic composites using halloysite clay nanotubes. Curr. Opin. Colloid Interface Sci. 2018, 35, 42–50. [Google Scholar] [CrossRef]
- Ruiz-Hitzky, E.; Aranda, P.; Akkari, M.; Khaorapapong, N.; Ogawa, M. Photoactive nanoarchitectures based on clays incorporating TiO2 and ZnO nanoparticles. Beilstein J. Nanotechnol. 2019, 10, 1140–1156. [Google Scholar] [CrossRef] [Green Version]
- Papoulis, D. Halloysite based nanocomposites and photocatalysis: A Review. Appl. Clay Sci. 2019, 168, 164–174. [Google Scholar] [CrossRef]
- Li, C.; Zhu, N.; Yang, S.; He, X.; Zheng, S.; Sun, Z.; Dionysiou, D.D. A review of clay based photocatalysts: Role of phyllosilicate mineral in interfacial assembly, microstructure control and performance regulation. Chemosphere 2021, 273, 129723. [Google Scholar] [CrossRef] [PubMed]
- Vágvölgyi, V.; Győrfi, K.; Zsirka, B.; Horváth, E.; Kristóf, J. The role of thermal analysis in the development of high-iron-content kaolinite-based photocatalysts. J. Therm. Anal. Calorim. 2020, 142. [Google Scholar] [CrossRef] [Green Version]
- Srikant, V.; Clarke, D.R. On the optical band gap of zinc oxide. J. Appl. Phys. 1998, 83, 5447–5451. [Google Scholar] [CrossRef]
- Weerathunga, H.; Tang, C.; Brock, A.J.; Sarina, S.; Wang, T.; Liu, Q.; Zhu, H.-Y.; Du, A.; Waclawik, E.R. Nanostructure Shape-Effects in ZnO heterogeneous photocatalysis. J. Colloid Interface Sci. 2022, 606, 588–599. [Google Scholar] [CrossRef]
- Lee, K.M.; Lai, C.W.; Ngai, K.S.; Juan, J.C. Recent developments of zinc oxide based photocatalyst in water treatment technology: A review. Water Res. 2016, 88, 428–448. [Google Scholar] [CrossRef]
- Khan, S.H.; Pathak, B. Zinc oxide based photocatalytic degradation of persistent pesticides: A comprehensive review. Environ. Nanotechnology, Monit. Manag. 2020, 13, 100290. [Google Scholar] [CrossRef]
- Majumder, S.; Chatterjee, S.; Basnet, P.; Mukherjee, J. ZnO based nanomaterials for photocatalytic degradation of aqueous pharmaceutical waste solutions—A contemporary review. Environ. Nanotechnology, Monit. Manag. 2020, 14, 100386. [Google Scholar] [CrossRef]
- Arya, S.; Mahajan, P.; Mahajan, S.; Khosla, A.; Datt, R.; Gupta, V.; Young, S.-J.; Oruganti, S.K. Review—Influence of Processing Parameters to Control Morphology and Optical Properties of Sol-Gel Synthesized ZnO Nanoparticles. ECS J. Solid State Sci. Technol. 2021, 10, 023002. [Google Scholar] [CrossRef]
- Uribe-López, M.C.; Hidalgo-López, M.C.; López-González, R.; Frías-Márquez, D.M.; Núñez-Nogueira, G.; Hernández-Castillo, D.; Alvarez-Lemus, M.A. Photocatalytic activity of ZnO nanoparticles and the role of the synthesis method on their physical and chemical properties. J. Photochem. Photobiol. A Chem. 2021, 404, 112866. [Google Scholar] [CrossRef]
- Sansenya, T.; Masri, N.; Chankhanittha, T.; Senasu, T.; Piriyanon, J.; Mukdasai, S.; Nanan, S. Hydrothermal synthesis of ZnO photocatalyst for detoxification of anionic azo dyes and antibiotic. J. Phys. Chem. Solids 2022, 160, 110353. [Google Scholar] [CrossRef]
- Nguyen, N.T.; Nguyen, V.A. Synthesis, Characterization, and Photocatalytic Activity of ZnO Nanomaterials Prepared by a Green, Nonchemical Route. J. Nanomater. 2020, 2020, 1–8. [Google Scholar] [CrossRef]
- Mohd Yusof, H.; Abdul Rahman, N.; Mohamad, R.; Zaidan, U.H.; Samsudin, A.A. Biosynthesis of zinc oxide nanoparticles by cell-biomass and supernatant of Lactobacillus plantarum TA4 and its antibacterial and biocompatibility properties. Sci. Rep. 2020, 10, 19996. [Google Scholar] [CrossRef] [PubMed]
- Das, A.; Nikhil, S.K.; Nair, R.G. Influence of surface morphology on photocatalytic performance of zinc oxide: A review. Nano-Structures & Nano-Objects 2019, 19, 100353. [Google Scholar] [CrossRef]
- Davis, K.; Yarbrough, R.; Froeschle, M.; White, J.; Rathnayake, H. Band gap engineered zinc oxide nanostructures via a sol–gel synthesis of solvent driven shape-controlled crystal growth. RSC Adv. 2019, 9, 14638–14648. [Google Scholar] [CrossRef] [Green Version]
- Shaba, E.Y.; Jacob, J.O.; Tijani, J.O.; Suleiman, M.A.T. A critical review of synthesis parameters affecting the properties of zinc oxide nanoparticle and its application in wastewater treatment. Appl. Water Sci. 2021, 11, 48. [Google Scholar] [CrossRef]
- Freitas, W.A.; Soares, B.E.C.F.; Rodrigues, M.S.; Trigueiro, P.; Honorio, L.M.C.; Peña-Garcia, R.; Alcântara, A.C.S.; Silva-Filho, E.C.; Fonseca, M.G.; Furtini, M.B.; et al. Facile synthesis of ZnO-clay minerals composites using an ultrasonic approach for photocatalytic performance. J. Photochem. Photobiol. A Chem. 2022, 429, 113934. [Google Scholar] [CrossRef]
- Zou, Y.; Hu, Y.; Shen, Z.; Yao, L.; Tang, D.; Zhang, S.; Wang, S.; Hu, B.; Zhao, G.; Wang, X. Application of aluminosilicate clay mineral-based composites in photocatalysis. J. Environ. Sci. 2022, 115, 190–214. [Google Scholar] [CrossRef]
- Weldegebrieal, G.K. Synthesis method, antibacterial and photocatalytic activity of ZnO nanoparticles for azo dyes in wastewater treatment: A review. Inorg. Chem. Commun. 2020, 120, 108140. [Google Scholar] [CrossRef]
- Long, Z.; Wu, Y.-P.; Gao, H.-Y.; Zhang, J.; Ou, X.; He, R.-R.; Liu, M. In vitro and in vivo toxicity evaluation of halloysite nanotubes. J. Mater. Chem. B 2018, 6, 7204–7216. [Google Scholar] [CrossRef]
- Gkouma, E.; Gianni, E.; Avgoustakis, K.; Papoulis, D. Applications of halloysite in tissue engineering. Appl. Clay Sci. 2021, 214, 106291. [Google Scholar] [CrossRef]
- Vergaro, V.; Abdullayev, E.; Lvov, Y.M.; Zeitoun, A.; Cingolani, R.; Rinaldi, R.; Leporatti, S. Cytocompatibility and Uptake of Halloysite Clay Nanotubes. Biomacromolecules 2010, 11, 820–826. [Google Scholar] [CrossRef] [PubMed]
- Sirelkhatim, A.; Mahmud, S.; Seeni, A.; Kaus, N.H.M.; Ann, L.C.; Bakhori, S.K.M.; Hasan, H.; Mohamad, D. Review on Zinc Oxide Nanoparticles: Antibacterial Activity and Toxicity Mechanism. Nano-Micro Lett. 2015, 7, 219–242. [Google Scholar] [CrossRef] [PubMed] [Green Version]
- Ali, H.; Khan, E.; Ilahi, I. Environmental Chemistry and Ecotoxicology of Hazardous Heavy Metals: Environmental Persistence, Toxicity, and Bioaccumulation. J. Chem. 2019, 2019, 1–14. [Google Scholar] [CrossRef] [Green Version]
- Yang, F.; Wang, A. Recent researches on antimicrobial nanocomposite and hybrid materials based on sepiolite and palygorskite. Appl. Clay Sci. 2022, 219, 106454. [Google Scholar] [CrossRef]
- Brunauer, S.; Emmett, P.H.; Teller, E. Adsorption of gases in multimolecular layers. J. Am. Chem. Soc. 1938, 60, 309–319. [Google Scholar] [CrossRef]
- Barrett, E.P.; Joyner, L.G.; Halenda, P.P. The determination of pore volume and area distributions in porous substances. I. Computations from nitrogen isotherms. J. Am. Chem. Soc. 1951, 73, 373–380. [Google Scholar] [CrossRef]
- Chisholm, J. Comparison of Quartz Standards for X-ray Diffraction Analysis: HSE A9950 (Sikron F600) and NIST SRM 1878. Ann. Occup. Hyg. 2005, 49, 351–358. [Google Scholar] [CrossRef] [Green Version]
- Aguzzi, C.; Donnadio, A.; Quaglia, G.; Latterini, L.; Viseras, C.; Ambrogi, V. Halloysite-Doped Zinc Oxide for Enhanced Sunscreening Performance. ACS Appl. Nano Mater. 2019, 2, 6575–6584. [Google Scholar] [CrossRef]
- Hua, G.; Zhang, L.; Dai, J.; Hu, L.; Dai, S. Synthesis of dimension-tunable ZnO nanostructures via the design of zinc hydroxide precursors. Appl. Phys. A 2011, 102, 275–280. [Google Scholar] [CrossRef]
- Li, P.; Xu, Z.P.; Hampton, M.A.; Vu, D.T.; Huang, L.; Rudolph, V.; Nguyen, A. V Control Preparation of Zinc Hydroxide Nitrate Nanocrystals and Examination of the Chemical and Structural Stability. J. Phys. Chem. C 2012, 116, 10325–10332. [Google Scholar] [CrossRef]
- Nicholas, N.J.; Franks, G.V.; Ducker, W.A. The mechanism for hydrothermal growth of zinc oxide. CrystEngComm 2012, 14, 1232–1240. [Google Scholar] [CrossRef]
- Patterson, A.L. The Scherrer Formula for X-ray Particle Size Determination. Phys. Rev. 1939, 56, 978–982. [Google Scholar] [CrossRef]
- Santagata, M.; Johnston, C.T. A study of nanoconfined water in halloysite. Appl. Clay Sci. 2022, 221, 106467. [Google Scholar] [CrossRef]
- Christidis, G.; Makri, P. Determination of kaolinite and halloysite crystallite size with X-Ray diffraction: Implications for industrial applications. Bull. Geol. Soc. Greece 2001, 34, 1163. [Google Scholar] [CrossRef] [Green Version]
- Matusik, J.; Wisła-Walsh, E.; Gaweł, A.; Bielańska, E.; Bahranowski, K. Surface Area and Porosity of Nanotubes Obtained from Kaolin Minerals of Different Structural Order. Clays Clay Miner. 2011, 59, 116–135. [Google Scholar] [CrossRef]
- Táborosi, A.; Szilagyi, R.K.; Zsirka, B.; Fónagy, O.; Horváth, E.; Kristóf, J. Molecular treatment of nano-kaolinite generations. Inorg. Chem. 2018, 57, 7151–7167. [Google Scholar] [CrossRef]
- Müller, C.M.; Pejcic, B.; Esteban, L.; Piane, C.D.; Raven, M.; Mizaikoff, B. Infrared Attenuated Total Reflectance Spectroscopy: An Innovative Strategy for Analyzing Mineral Components in Energy Relevant Systems. Sci. Rep. 2015, 4, 6764. [Google Scholar] [CrossRef] [Green Version]
- Viñes, F.; Iglesias-Juez, A.; Illas, F.; Fernández-García, M. Hydroxyl Identification on ZnO by Infrared Spectroscopies: Theory and Experiments. J. Phys. Chem. C 2014, 118, 1492–1505. [Google Scholar] [CrossRef]
- Srivastava, O.K.; Secco, E.A. Studies on metal hydroxy compounds. II. Infrared spectra of zinc derivatives ϵ-Zn(OH)2, β-ZnOHCl, ZnOHF, Zn5(OH)8Cl2, and Zn5(OH)8Cl2 ·H2O. Can. J. Chem. 1967, 45, 585–588. [Google Scholar] [CrossRef]
- Gordeeva, A.; Hsu, Y.-J.; Jenei, I.Z.; Brant Carvalho, P.H.B.; Simak, S.I.; Andersson, O.; Häussermann, U. Layered Zinc Hydroxide Dihydrate, Zn5(OH)10 ·2H2O, from Hydrothermal Conversion of ε-Zn(OH)2 at Gigapascal Pressures and its Transformation to Nanocrystalline ZnO. ACS Omega 2020, 5, 17617–17627. [Google Scholar] [CrossRef] [PubMed]
- Hall, D.S.; Lockwood, D.J.; Poirier, S.; Bock, C.; MacDougall, B.R. Raman and Infrared Spectroscopy of α and β Phases of Thin Nickel Hydroxide Films Electrochemically Formed on Nickel. J. Phys. Chem. A 2012, 116, 6771–6784. [Google Scholar] [CrossRef] [PubMed] [Green Version]
- Zsirka, B.; Táborosi, A.; Szabó, P.; Szilágyi, R.K.; Horváth, E.; Juzsakova, T.; Fertig, D.; Kristóf, J. Surface Characterization of Mechanochemically Modified Exfoliated Halloysite Nanoscrolls. Langmuir 2017, 33, 3534–3547. [Google Scholar] [CrossRef] [PubMed] [Green Version]
- Heller-Kallai, L. Thermally modified clay minerals. In Developments in Clay Science, Handbook of Caly Science; Bergaya, F., Lagaly, G., Eds.; Elsevier: Amsterdam, The Netherlands, 2013; Volume 5, pp. 411–433. ISBN 9780080982588. [Google Scholar]
- Cheng, H.; Liu, Q.; Yang, J.; Ma, S.; Frost, R.L. The thermal behavior of kaolinite intercalation complexes-A review. Thermochim. Acta 2012, 545, 1–13. [Google Scholar] [CrossRef] [Green Version]
- Podlogar, M.; Rečnik, A.; Yilmazoglu, G.; Özer, I.Ö.; Mazaj, M.; Suvaci, E.; Bernik, S. The role of hydrothermal pathways in the evolution of the morphology of ZnO crystals. Ceram. Int. 2016, 42, 15358–15366. [Google Scholar] [CrossRef]
- Biswick, T.; Jones, W.; Pacuła, A.; Serwicka, E.; Podobinski, J. The role of anhydrous zinc nitrate in the thermal decomposition of the zinc hydroxy nitrates Zn5(OH)8(NO3)2·2H2O and ZnOHNO3·H2O. J. Solid State Chem. 2007, 180, 1171–1179. [Google Scholar] [CrossRef]
- Moezzi, A.; Lee, P.-S.; McDonagh, A.M.; Cortie, M.B. On the thermal decomposition of zinc hydroxide nitrate, Zn5(OH)8(NO3)2⋅2H2O. J. Solid State Chem. 2020, 286, 121311. [Google Scholar] [CrossRef]
- Liu, T.; Zhang, J.; Ouyang, P.; Fu, L.; Yang, H. The relation between nanotube diameter, length and surface area and pore volume of multi-walled spiral halloysite nanotubes: A theoretical study. Appl. Clay Sci. 2021, 215, 106303. [Google Scholar] [CrossRef]
- Yang, H.; Zhang, Y.; Ouyang, J. Physicochemical Properties of Halloysite. In Developments in Clay Science; Yuan, P., Thill, A., Bergaya, F., Eds.; Elsevier: Amsterdam, The Netherlands, 2016; pp. 67–91. ISBN 978-0-08-100293-3. [Google Scholar] [CrossRef]
- Thirumavalavan, M.; Huang, K.-L.; Lee, J.-F. Preparation and Morphology Studies of Nano Zinc Oxide Obtained Using Native and Modified Chitosans. Materials 2013, 6, 4198–4212. [Google Scholar] [CrossRef]
- Zhang, Q.P.; Xu, X.N.; Liu, Y.T.; Xu, M.; Deng, S.H.; Chen, Y.; Yuan, H.; Yu, F.; Huang, Y.; Zhao, K.; et al. A feasible strategy to balance the crystallinity and specific surface area of metal oxide nanocrystals. Sci. Rep. 2017, 7, 46424. [Google Scholar] [CrossRef] [Green Version]
- Demoisson, F.; Piolet, R.; Bernard, F. Hydrothermal Synthesis of ZnO Crystals from Zn(OH) 2 Metastable Phases at Room to Supercritical Conditions. Cryst. Growth Des. 2014, 14, 5388–5396. [Google Scholar] [CrossRef]
- Zhou, D.; Keller, A.A. Role of morphology in the aggregation kinetics of ZnO nanoparticles. Water Res. 2010, 44, 2948–2956. [Google Scholar] [CrossRef] [PubMed]
- Lin, Y.; Hu, H.; Hu, Y.H. Role of ZnO morphology in its reduction and photocatalysis. Appl. Surf. Sci. 2020, 502, 144202. [Google Scholar] [CrossRef]
- Zhang, W.; Xiao, X.; An, T.; Song, Z.; Fu, J.; Sheng, G.; Cui, M. Kinetics, degradation pathway and reaction mechanism of advanced oxidation of 4-nitrophenol in water by a UV/H2O2 process. J. Chem. Technol. Biotechnol. 2003, 78, 788–794. [Google Scholar] [CrossRef]
- Strachan, J.; Barnett, C.; Masters, A.F.; Maschmeyer, T. 4-Nitrophenol Reduction: Probing the Putative Mechanism of the Model Reaction. ACS Catal. 2020, 10, 5516–5521. [Google Scholar] [CrossRef]
- Pozun, Z.D.; Rodenbusch, S.E.; Keller, E.; Tran, K.; Tang, W.; Stevenson, K.J.; Henkelman, G. A Systematic Investigation of p -Nitrophenol Reduction by Bimetallic Dendrimer Encapsulated Nanoparticles. J. Phys. Chem. C 2013, 117, 7598–7604. [Google Scholar] [CrossRef]
- Dieckmann, M.S.; Gray, K.A. A comparison of the degradation of 4-nitrophenol via direct and sensitized photocatalysis in TiO2 slurries. Water Res. 1996, 30, 1169–1183. [Google Scholar] [CrossRef]
- Farooq, M.; Shujah, S.; Tahir, K.; Nazir, S.; Ullah Khan, A.; Almarhoon, Z.M.; Jevtovic, V.; Al-Shehri, H.S.; Tasleem Hussain, S.; Ullah, A. Ultra efficient 4-Nitrophenol reduction, dye degradation and Cr(VI) adsorption in the presence of phytochemical synthesized Ag/ZnO nanocomposite: A view towards sustainable chemistry. Inorg. Chem. Commun. 2022, 136, 109189. [Google Scholar] [CrossRef]
- Kadam, V.V.; Shanmugam, S.D.; Ettiyappan, J.P.; Balakrishnan, R.M. Photocatalytic degradation of p-nitrophenol using biologically synthesized ZnO nanoparticles. Environ. Sci. Pollut. Res. 2021, 28, 12119–12130. [Google Scholar] [CrossRef]
- Khatamian, M.; Divband, B.; Jodaei, A. Degradation of 4-nitrophenol (4-NP) using ZnO nanoparticles supported on zeolites and modeling of experimental results by artificial neural networks. Mater. Chem. Phys. 2012, 134, 31–37. [Google Scholar] [CrossRef]
- Avramescu, M.-L.; Rasmussen, P.E.; Chénier, M.; Gardner, H.D. Influence of pH, particle size and crystal form on dissolution behaviour of engineered nanomaterials. Environ. Sci. Pollut. Res. 2017, 24, 1553–1564. [Google Scholar] [CrossRef] [PubMed] [Green Version]
- Fatehah, M.O.; Aziz, H.A.; Stoll, S. Stability of ZnO Nanoparticles in Solution. Influence of pH, Dissolution, Aggregation and Disaggregation Effects. J. Colloid Sci. Biotechnol. 2014, 3, 75–84. [Google Scholar] [CrossRef]
- Mudunkotuwa, I.A.; Rupasinghe, T.; Wu, C.-M.; Grassian, V.H. Dissolution of ZnO Nanoparticles at Circumneutral pH: A Study of Size Effects in the Presence and Absence of Citric Acid. Langmuir 2012, 28, 396–403. [Google Scholar] [CrossRef] [PubMed]
- Jennings, V.L.K.; Rayner-Brandes, M.H.; Bird, D.J. Assessing chemical toxicity with the bioluminescent photobacterium (vibrio fischeri): A comparison of three commercial systems. Water Res. 2001, 35, 3448–3456. [Google Scholar] [CrossRef]
- Scheerer, S.; Gomez, F.; Lloyd, D. Bioluminescence of Vibrio fischeri in continuous culture: Optimal conditions for stability and intensity of photoemission. J. Microbiol. Methods 2006, 67, 321–329. [Google Scholar] [CrossRef]
- Heinlaan, M.; Ivask, A.; Blinova, I.; Dubourguier, H.-C.; Kahru, A. Toxicity of nanosized and bulk ZnO, CuO and TiO2 to bacteria Vibrio fischeri and crustaceans Daphnia magna and Thamnocephalus platyurus. Chemosphere 2008, 71, 1308–1316. [Google Scholar] [CrossRef]
- Groen, J.C.; Peffer, L.A.; Pérez-Ramıírez, J. Pore size determination in modified micro- and mesoporous materials. Pitfalls and limitations in gas adsorption data analysis. Microporous Mesoporous Mater. 2003, 60, 1–17. [Google Scholar] [CrossRef]
Figure 1.
Structural and compositional characterization of the untreated halloysite, Zn(OH)2 sample and their heat-treated composites (T = 350 °C) with different Zn content by powder X-ray diffraction measurements. The most intense reflections of quartz and zincite are designated along with the corresponding Miller indices while the dashed line indicates the d(001) value of halloysite and its shift upon dehydration.

Figure 2.
Infrared spectra of untreated halloysite and composite precursor samples prepared at 80 °C in the 3800–3000 cm−1, 1700–1300 cm−1, and 1200–850 cm−1 spectral region.
Figure 2.
Infrared spectra of untreated halloysite and composite precursor samples prepared at 80 °C in the 3800–3000 cm−1, 1700–1300 cm−1, and 1200–850 cm−1 spectral region.
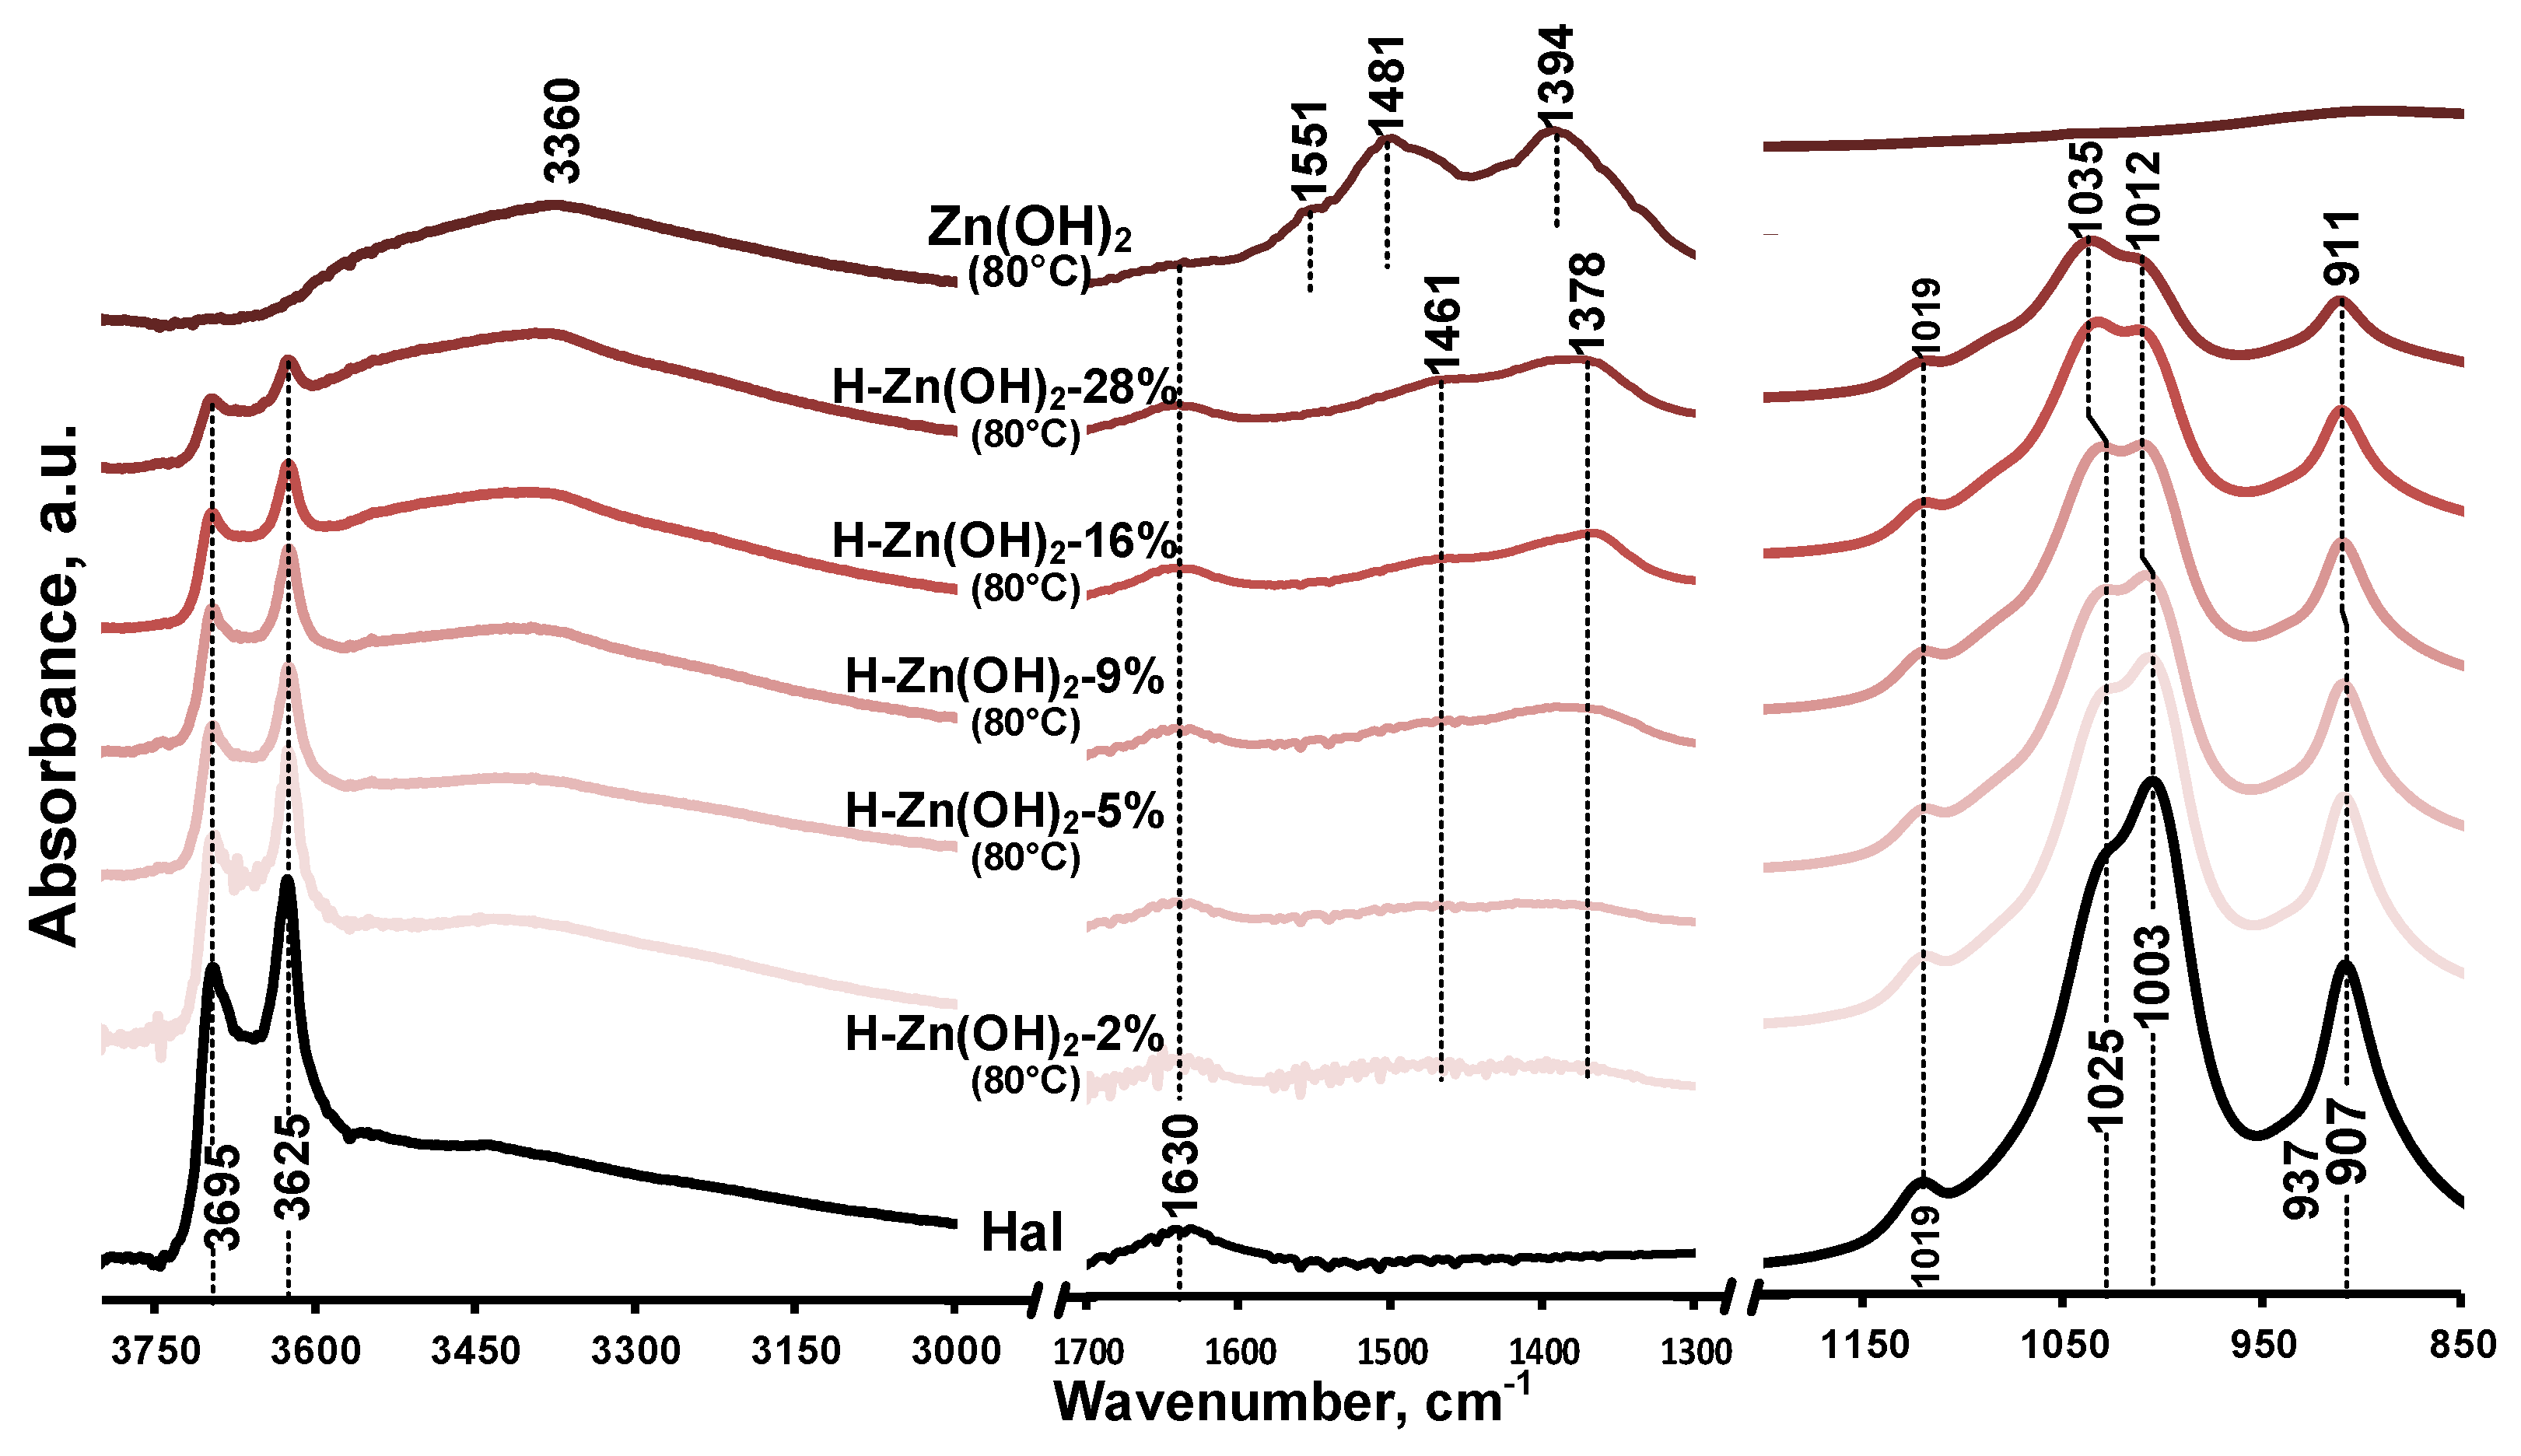
Figure 3.
Typical thermoanalytical curves (TG/DTG) of the investigated samples.
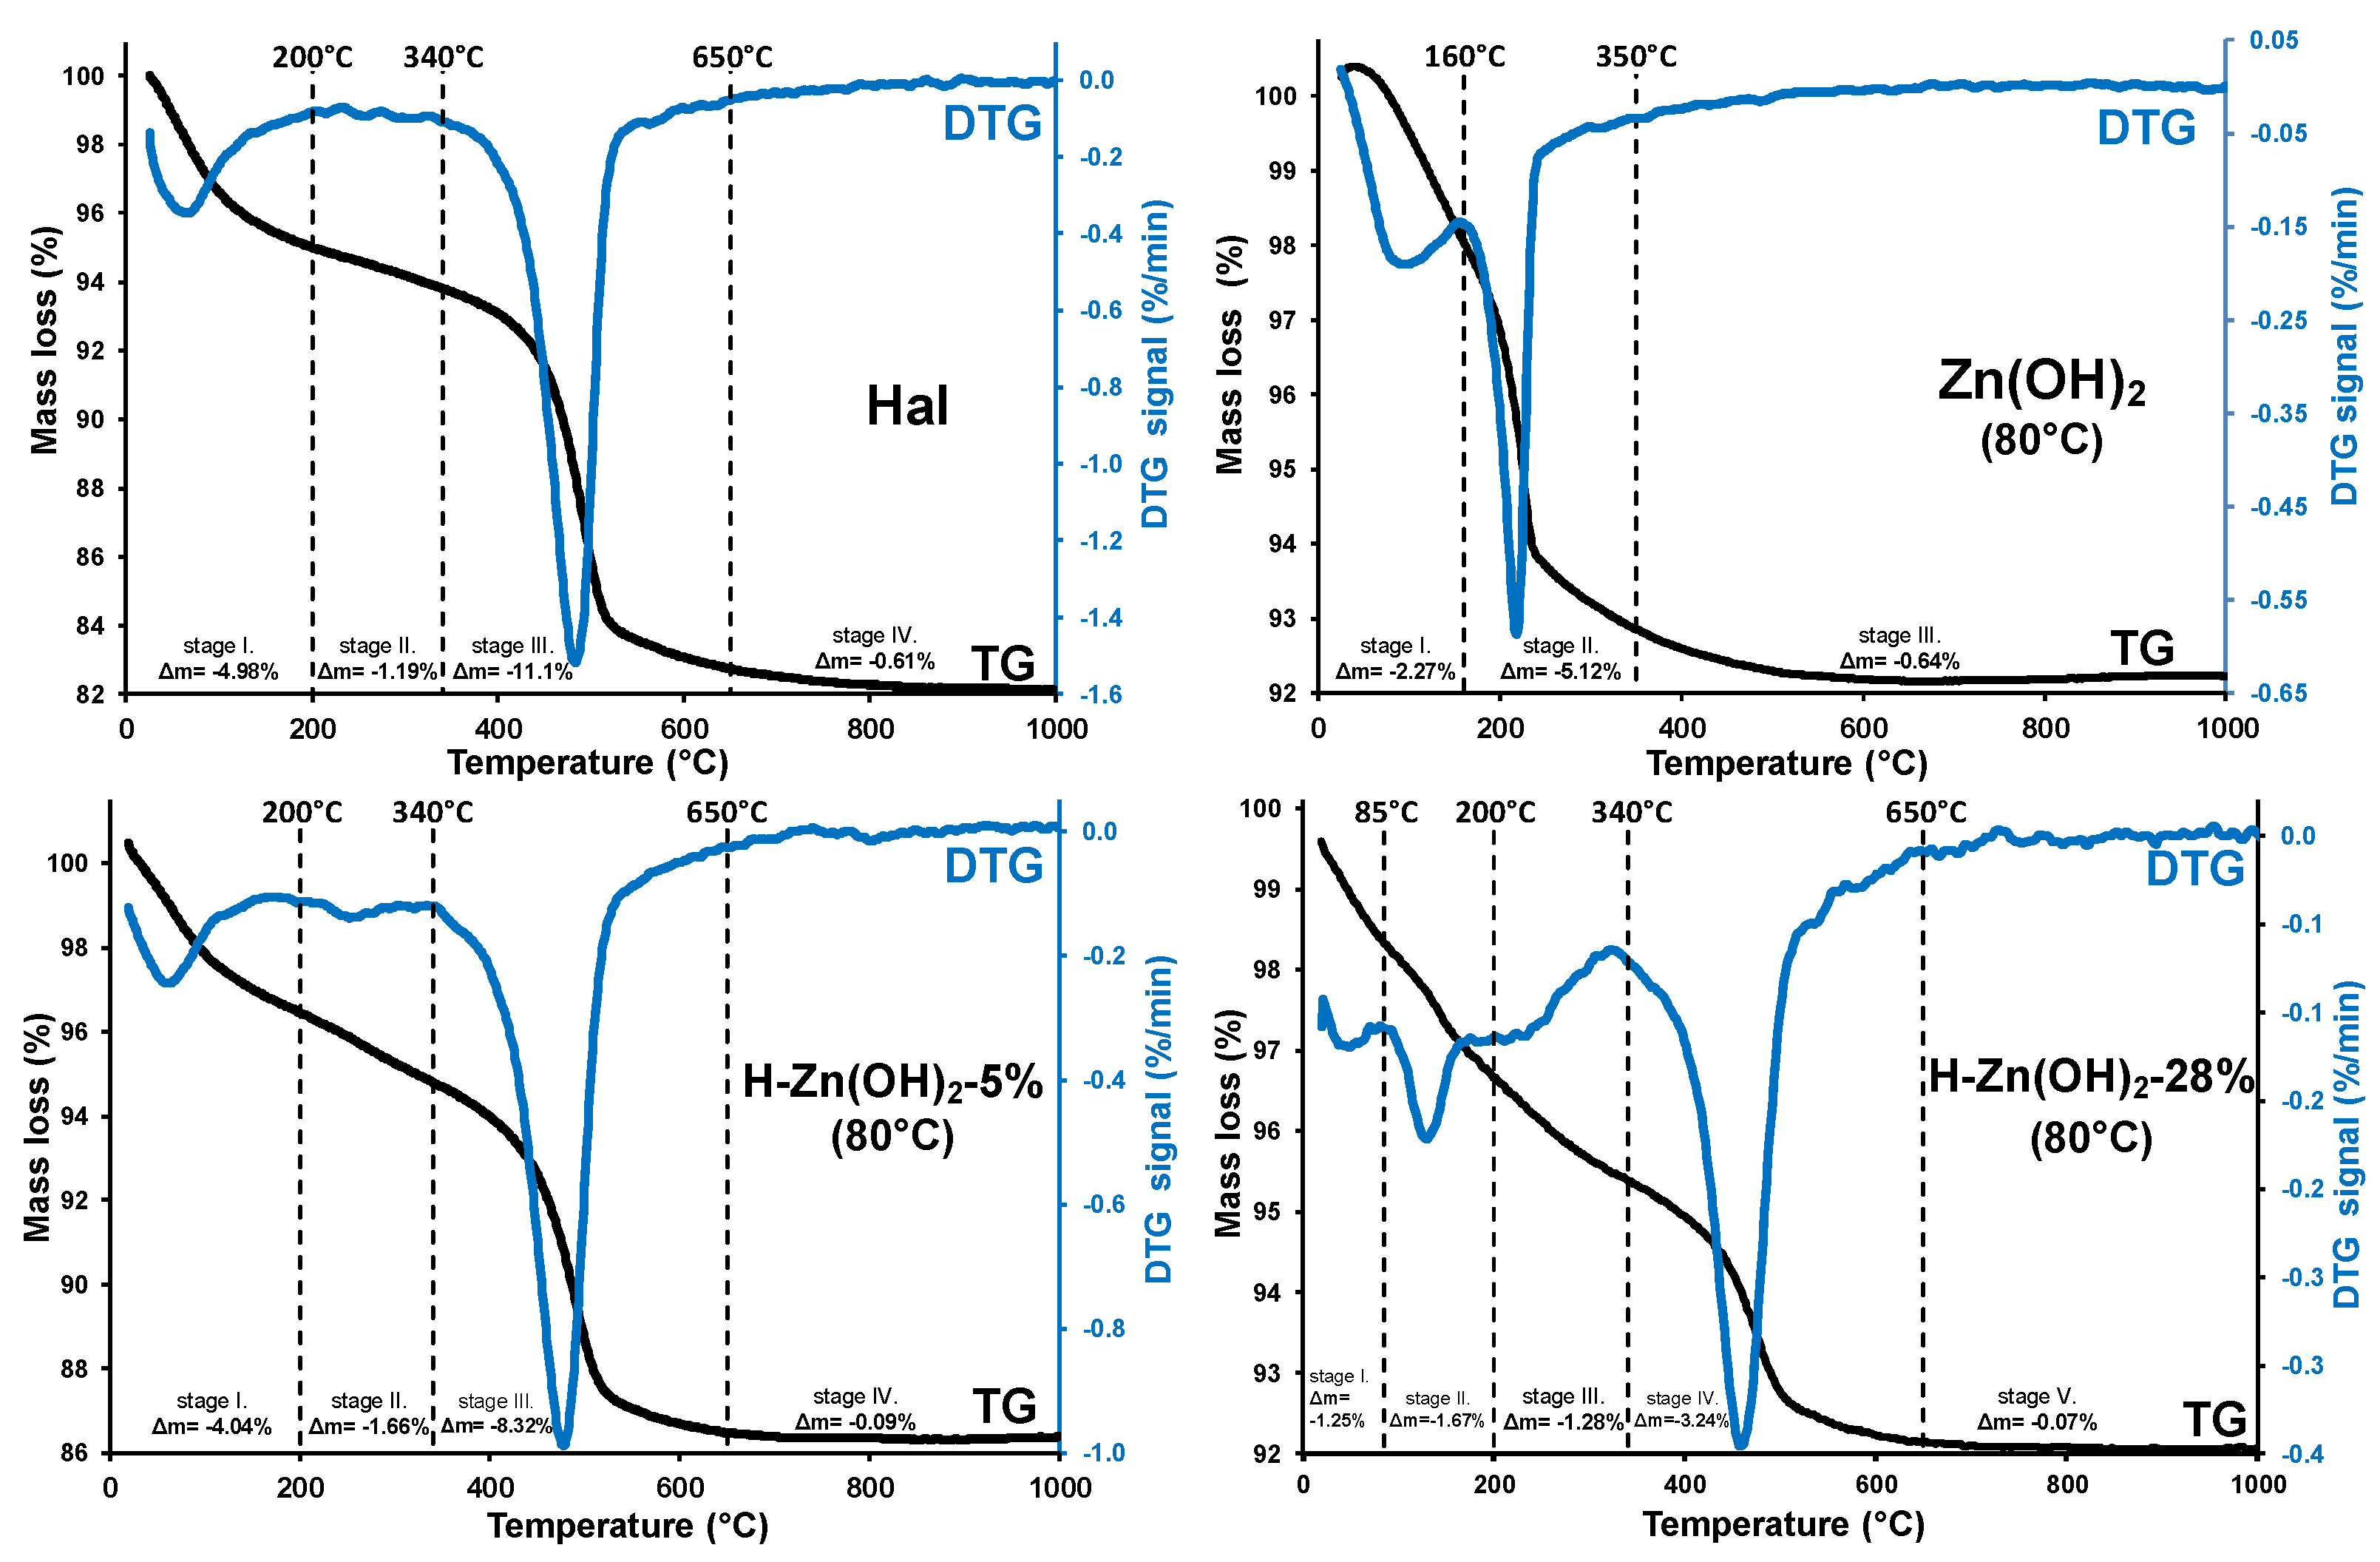
Figure 4.
TEM images of the investigated samples, (A–C): synthetic ZnO-100%, (D–F): H-ZnO-28%, and (G–I): H-ZnO-5%.
Figure 4.
TEM images of the investigated samples, (A–C): synthetic ZnO-100%, (D–F): H-ZnO-28%, and (G–I): H-ZnO-5%.
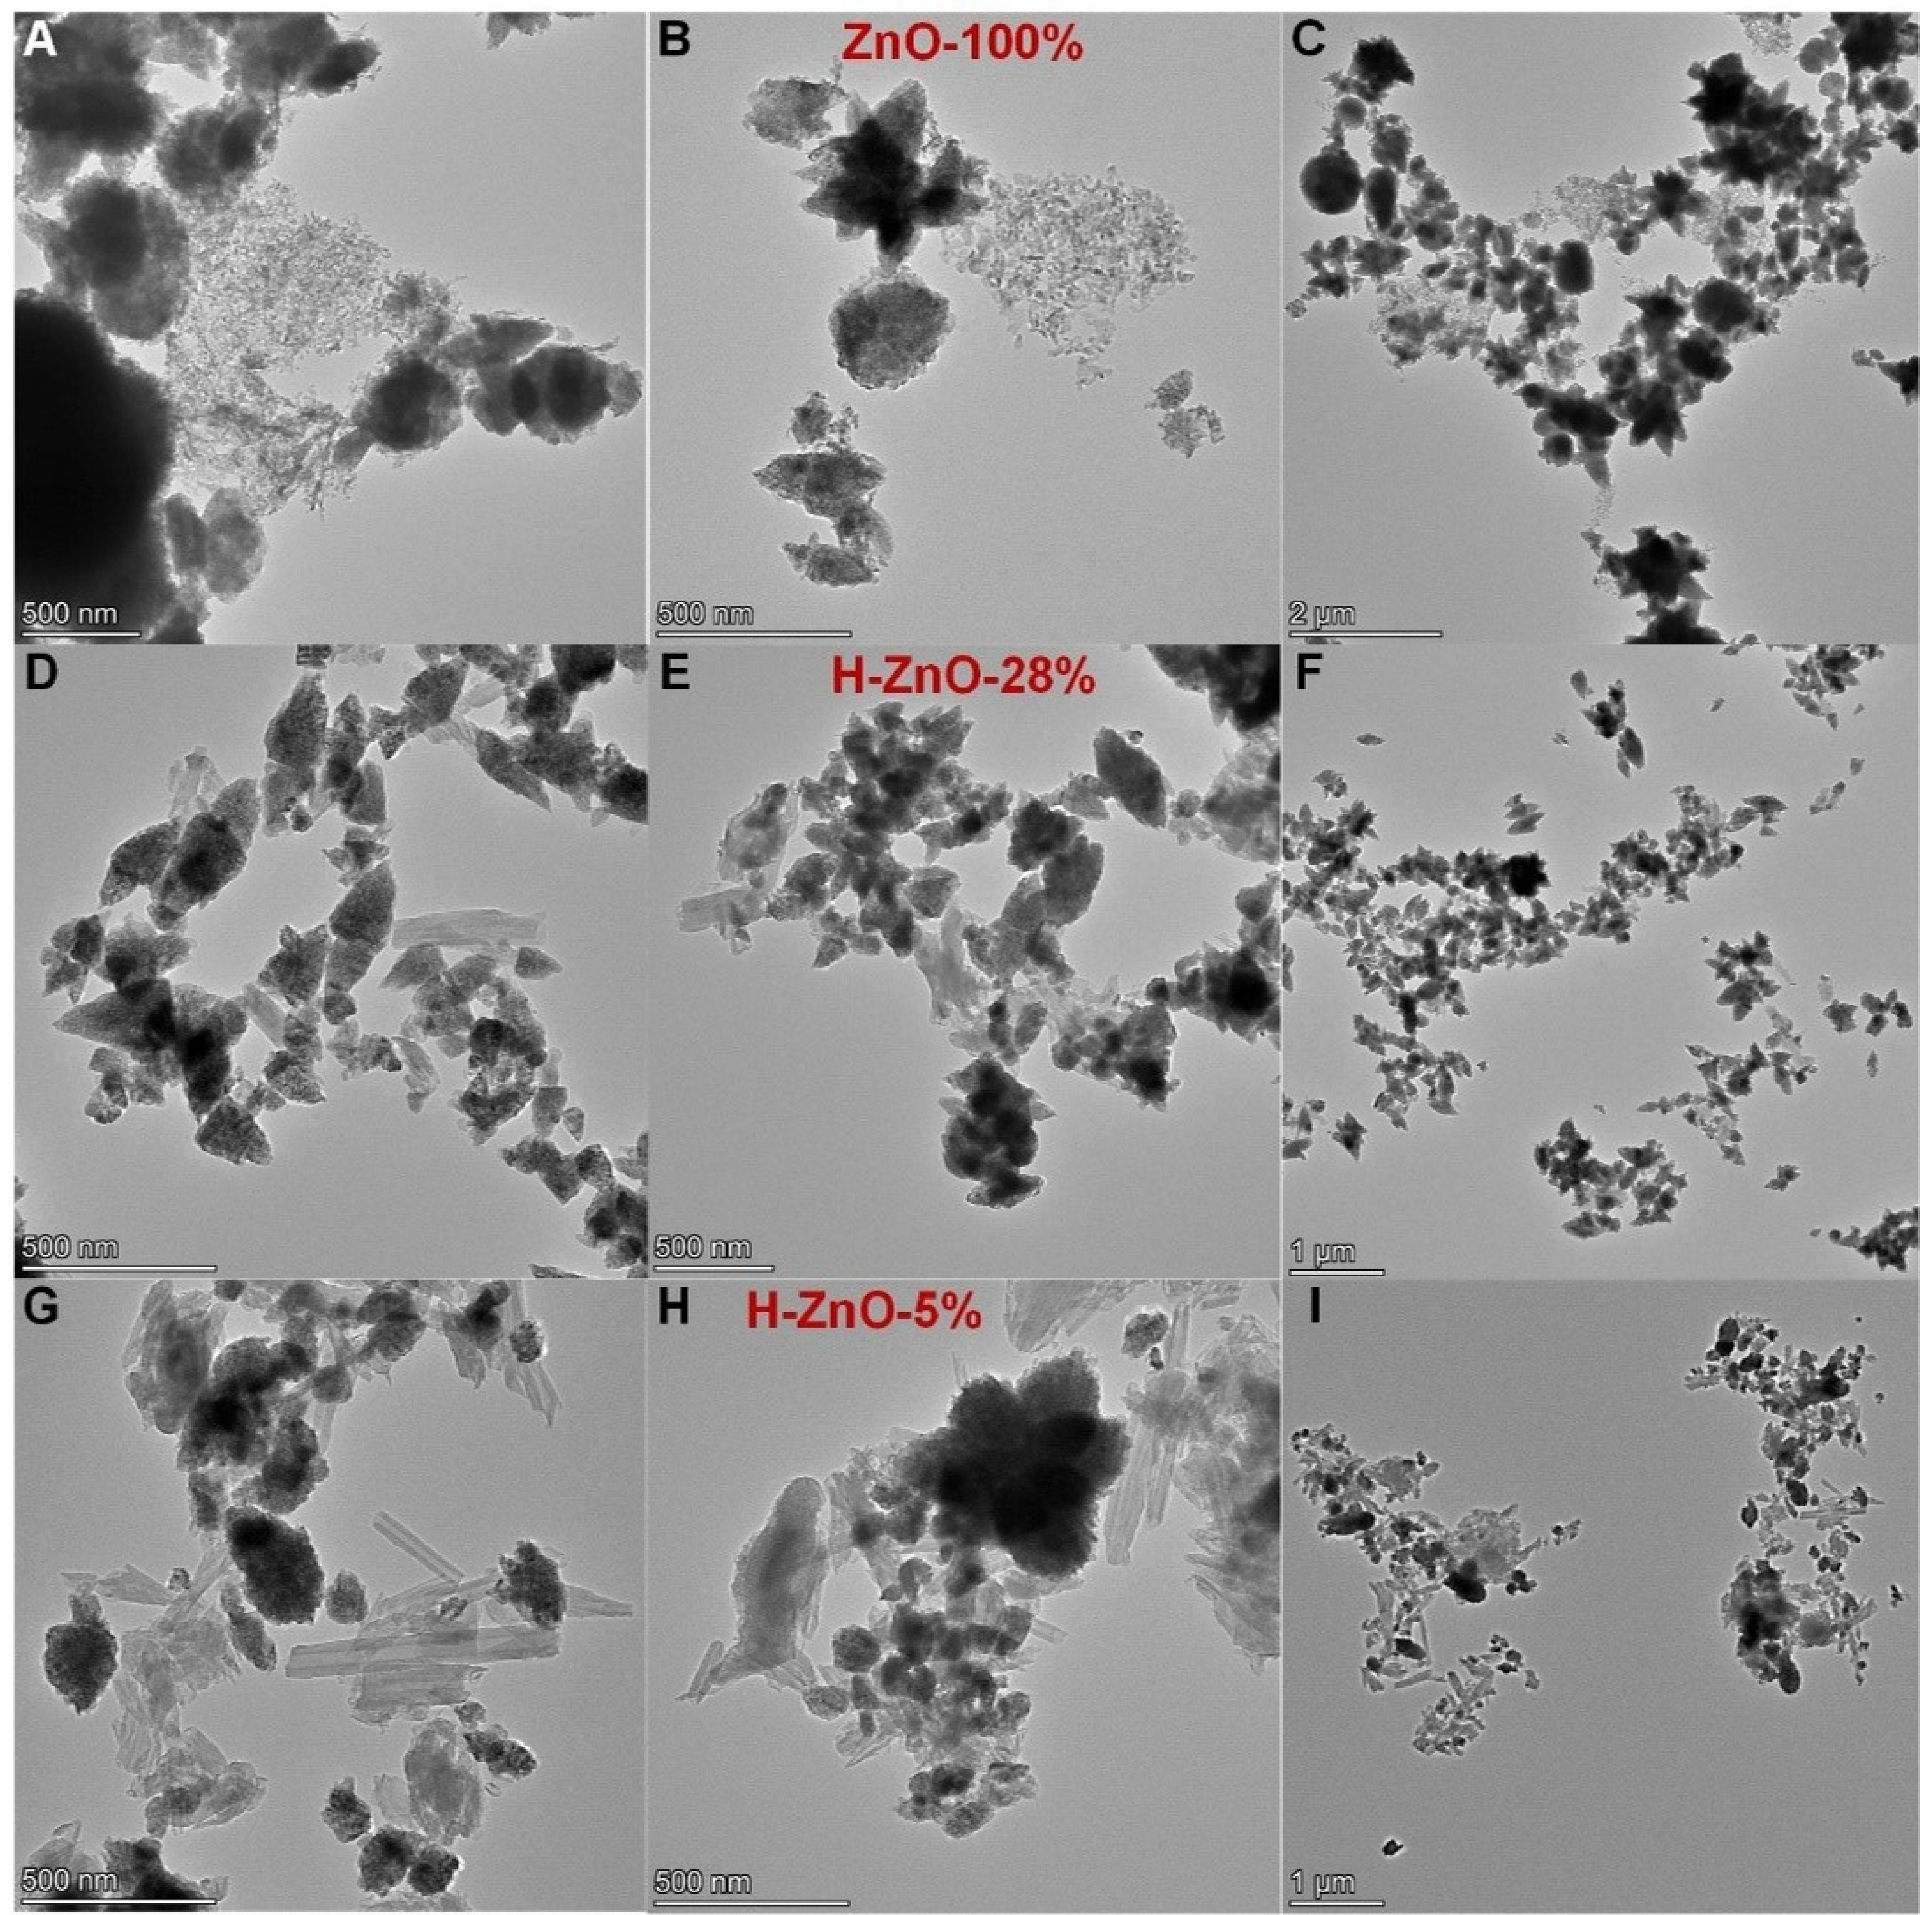
Figure 5.
Decomposition efficiency of 4-nitrophenol determined by UV absorption. (A): compared to initial concentration, (B): normalized to specific surface area (BET-SSA).
Figure 5.
Decomposition efficiency of 4-nitrophenol determined by UV absorption. (A): compared to initial concentration, (B): normalized to specific surface area (BET-SSA).

Figure 6.
Estimated toxicity of samples leached at pH = 5.6 for 1 h by bioluminescence suppression of Vibrio fischeri strain. Toxicity measurements were carried out after 0, 30, and 60 min of exposure to Vibrio fischeri. Estimated error of measurement was ± 5%.
Figure 6.
Estimated toxicity of samples leached at pH = 5.6 for 1 h by bioluminescence suppression of Vibrio fischeri strain. Toxicity measurements were carried out after 0, 30, and 60 min of exposure to Vibrio fischeri. Estimated error of measurement was ± 5%.
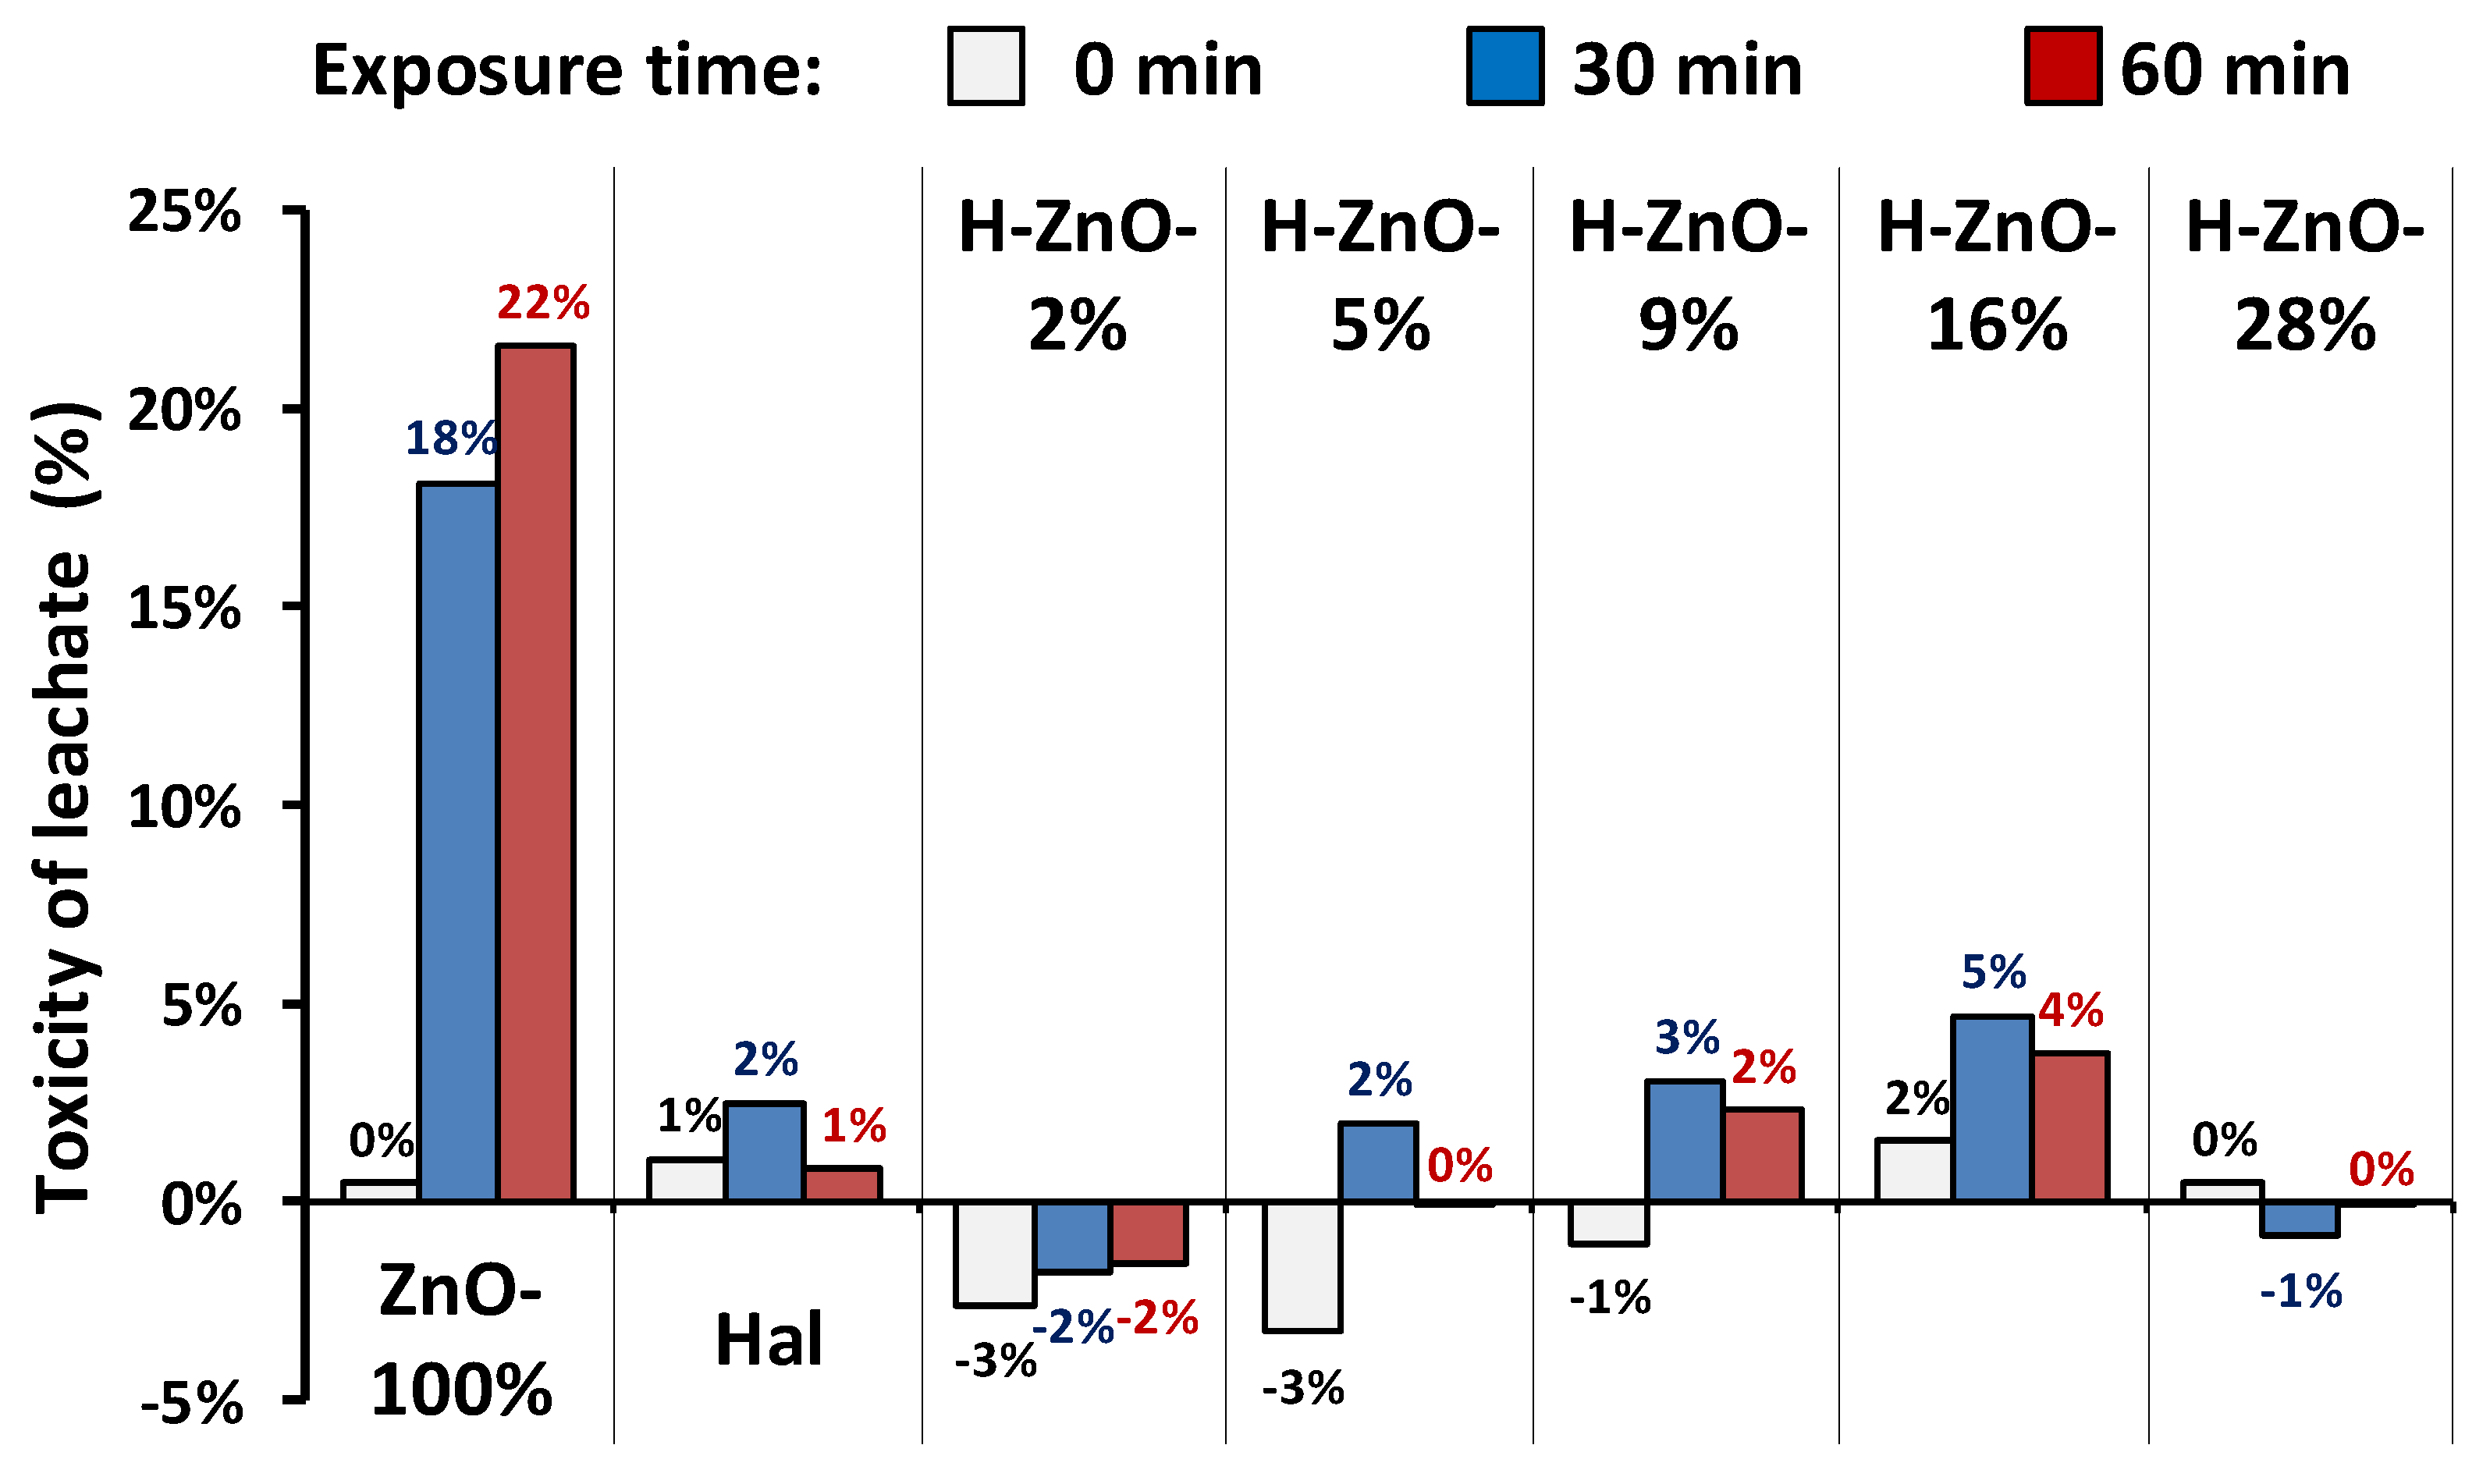
Table 1.
Designation and composition of samples.
| Sample Designation | Halloysite (mg) | ZnO (mg) | ZnO (m/m%) |
|---|---|---|---|
| ZnO-100% | - | 200 | 100% |
| H-ZnO-28% | 500 | 191 | 28% |
| H-ZnO-16% | 500 | 96 | 16% |
| H-ZnO-9% | 500 | 48 | 9% |
| H-ZnO-5% | 500 | 24 | 5% |
| H-ZnO-2% | 500 | 12 | 2% |
| Hal | 500 | - | - |
Table 2.
Specific surface area (SSA), pore-volume (V), and pore-size (D) data.
| Sample Designation | SSABET (m2/g) | SSABJH (m2/g) | SSAmicro1 (m2/g) | Vmicro1 (cm3/g) | Vmicro+meso1 (cm3/g) | Daverage (nm) |
|---|---|---|---|---|---|---|
| ZnO-100% | 13 | 13 | 2.0 | 0.0009 | 0.0562 | 17.4 |
| H-ZnO-28% | 27 | 30 | 3.4 | 0.0014 | 0.0932 | 12.5 |
| H-ZnO-16% | 35 | 38 | 4.4 | 0.0018 | 0.1344 | 14.0 |
| H-ZnO-9% | 41 | 48 | 4.4 | 0.0017 | 0.1550 | 12.8 |
| H-ZnO-5% | 44 | 53 | 4.7 | 0.0018 | 0.1811 | 13.6 |
| H-ZnO-2% | 47 | 59 | 5.7 | 0.0023 | 0.1968 | 13.4 |
| Hal | 94 | 94 | 14 | 0.0058 | 0.2203 | 9.4 |
1 Pore-sizes: micro (1.7–2 nm), meso (2–50 nm).
Table 3.
Mobility of Zn2+ ions determined by ICP-OES.
| Composite Designation | pH = 1.9 Zn2+ (mg/mL) | pH = 12.4 Zn2+ (mg/mL) | pH = 5.6 Zn2+ (mg/mL) |
|---|---|---|---|
| ZnO-100% | 317 | 0.73 | <0.46 |
| H-ZnO-28% | 320 | 0.71 | <0.46 |
| H-ZnO-16% | 308 | 1.03 | <0.46 |
| H-ZnO-9% | 316 | 0.66 | <0.46 |
| H-ZnO-5% | 305 | 0.94 | <0.46 |
| H-ZnO-2% | 320 | 1.11 | <0.46 |
Publisher’s Note: MDPI stays neutral with regard to jurisdictional claims in published maps and institutional affiliations. |
© 2022 by the authors. Licensee MDPI, Basel, Switzerland. This article is an open access article distributed under the terms and conditions of the Creative Commons Attribution (CC BY) license (https://creativecommons.org/licenses/by/4.0/).
Share and Cite
MDPI and ACS Style
Zsirka, B.; Vágvölgyi, V.; Horváth, E.; Juzsakova, T.; Fónagy, O.; Szabó-Bárdos, E.; Kristóf, J. Halloysite-Zinc Oxide Nanocomposites as Potential Photocatalysts. Minerals 2022, 12, 476. https://doi.org/10.3390/min12040476
AMA Style
Zsirka B, Vágvölgyi V, Horváth E, Juzsakova T, Fónagy O, Szabó-Bárdos E, Kristóf J. Halloysite-Zinc Oxide Nanocomposites as Potential Photocatalysts. Minerals. 2022; 12(4):476. https://doi.org/10.3390/min12040476
Chicago/Turabian StyleZsirka, Balázs, Veronika Vágvölgyi, Erzsébet Horváth, Tatjána Juzsakova, Orsolya Fónagy, Erzsébet Szabó-Bárdos, and János Kristóf. 2022. "Halloysite-Zinc Oxide Nanocomposites as Potential Photocatalysts" Minerals 12, no. 4: 476. https://doi.org/10.3390/min12040476
Note that from the first issue of 2016, this journal uses article numbers instead of page numbers. See further details here.