Article

Paste Backfilling Longwall Mining Technology for Thick Coal Seam Extraction under Buildings and above Confined Aquifers: A Case Study

1
School of Energy Science and Engineering, Henan Polytechnic University, Jiaozuo 454000, China
2
Henan Key Laboratory for Green and Efficient Mining & Comprehensive Utilization of Mineral Resources, Henan Polytechnic University, Jiaozuo 454003, China
3
State Collaborative Innovative Center of Coal Work Safety and Clean-Efficiency Utilization, Jiaozuo 454000, China
*
Author to whom correspondence should be addressed.
Minerals 2022, 12(4), 470; https://doi.org/10.3390/min12040470
Submission received: 8 March 2022 / Revised: 1 April 2022 / Accepted: 8 April 2022 / Published: 12 April 2022

Abstract

:
Backfill mining is an effective measure to control surface subsidence and restrain floor water inrush. It is an essential part of green mining technology. To solve the problem of confined water in mines under buildings, this study was carried out by combining theoretical analysis, laboratory simulation, and numerical simulation, taking the Liangbei coal mine as the research area. The coal seam floor failure characteristics of traditional longwall caving and paste filling mining methods were compared and analyzed. Based on the relevant mining theory, the key parameters, such as mining thickness and filling rate under the critical state of water inrush, were obtained. Then, the feasibility of backfill mining was expounded, and the surface subsidence of paste backfill mining was predicted and measured on site. The results demonstrated that the longwall caving mining method not only had the risk of water inrush, but also the possibility of step cracks at the surface, with the potential to result in serious damage to buildings. However, the backfill mining method reduced the floor damage depth of the coal seam from 12 m to 7 m, which reduced the water inrush coefficient by 12%, the maximum vertical concentrated stress by 42.1%, and the displacement subsidence value by 78.8%. These parameters correlated negatively with backfill strength. Meanwhile, the maximum subsidence, maximum inclined deformation, and horizontal displacement deformation were estimated as 730 mm, 2.5 mm/m, and 1.1 mm/m, respectively, consistent with the measured values (608 mm, 2.1 mm/m, and 0.9 mm/m, respectively). More relevantly, there were no obvious cracks found in the surface buildings, ensuring the safety of mining above confined water on the working face, and realizing the effective protection of surface buildings.

1. Introduction

Coal mining under buildings in areas of confined water can induce damage to the overlying strata and floor of the working face of the coal mine, dilapidate the surface buildings (structures), and encourage water inrush from the floor [1,2,3,4]. The influence of the longwall caving mining method on surface buildings and confined water is related to coal seam mining depth, mining thickness, overburden lithology, and working face advancing speed. Although the mining depth of the Liangbei mine is deep, the coal seam is thick, and the mining depth is not enough to eliminate impact on the surface. Such a scenario threatens safe mining, worsens the relationship between industry and agriculture in mining areas, and degrades the surface ecological environment [5,6]. Therefore, it is imperative to control surface subsidence and prevent floor water inrush by adopting reasonable mining technological measures from the source. The filling mining method aims to fill the goal area in time before the roof collapses, maintaining stability with the filling body as the bearing support body. Only the plastic zone of the coal wall in front of the working face and the top control area can have slight subsidence, which is an important part of the green mining technology of coal mines [7]. This mainly includes paste filling [8,9], solid filling [10,11], ultra-high water filling [12,13], etc.
Using paste filling mining methods, Doherty et al. [14] presented in stope measurements of total stress and pore–water pressure at strategic locations within three underground stopes at the Raleigh mine site (Western Australia), filled with cemented paste backfill. Behera et al. [15] provided a critical review on industrial wastes’ utilization for backfilling underground mine voids. Elsewhere, Jafari et al. [16,17] studied the properties and behavior of cemented paste backfill for different cement contents and specimen curing times. Based on the theory of beams on elastic foundation, Chang et al. [18] set up a filling mining roof rock mechanical model. Using differential equations and the FLAC3D numerical calculation model, they analyzed the main impact factor of filling mining roof strata. The failure law and evolution characteristics of the backfill mining floor were studied. The backfill mining floor’s failure range and water inrush were predicted, revealing the mechanical mechanism of the backfill mining floor failure control. Fall et al. [19] studied the hydraulic conductivity of the cemented paste backfill and developed a model for predicting its evolution over time. In another study, Chen et al. [20] studied the influence of chlorine on the strength of coal gangue-cemented paste backfill by a uniaxial compression test. The water inrush from mining floors above confined water increases annually. Therefore, it is desirable to study the stress evolution law of floor rock mass and failure characteristics in stopes [4,21,22].
Wu [23] established a prediction model of water inrush based on GIS and a hierarchical analytical process. Zhu [24] studied the bottom plate’s stress distribution and failure characteristics based on the support pressure distribution of the working face, whereas Yin et al. [25] elucidated the mechanism of water inrush in an Ordovician limestone aquifer. The authors proposed a corresponding risk assessment equation. Song et al. [26] researched the mechanism inducing groundwater outbursts through floor faults using analytical and numerical simulation methods. Moreover, Zhang et al. [27] studied the hydrogeological conditions of coal mines and the potential water inrush disaster from aquifers under the coal seam, proposing a water inrush mechanism. Feng [28] used a pressure water bag to simulate confined water in a simulation test, and analyzed the deformation and failure characteristics of the coal floor.
Presently, many studies on floor failure mechanisms and coal mining under buildings are available. However, few studies on coal mining exist under complex conditions concerning confined water under buildings.
Taking the working face 32,021 of Liangbei coal mine as a case study, this paper compares and analyzes the roof and floor failure laws and water intrusion risks of the longwall caving and paste filling methods, with specific reference to coal seam mining under complex conditions.

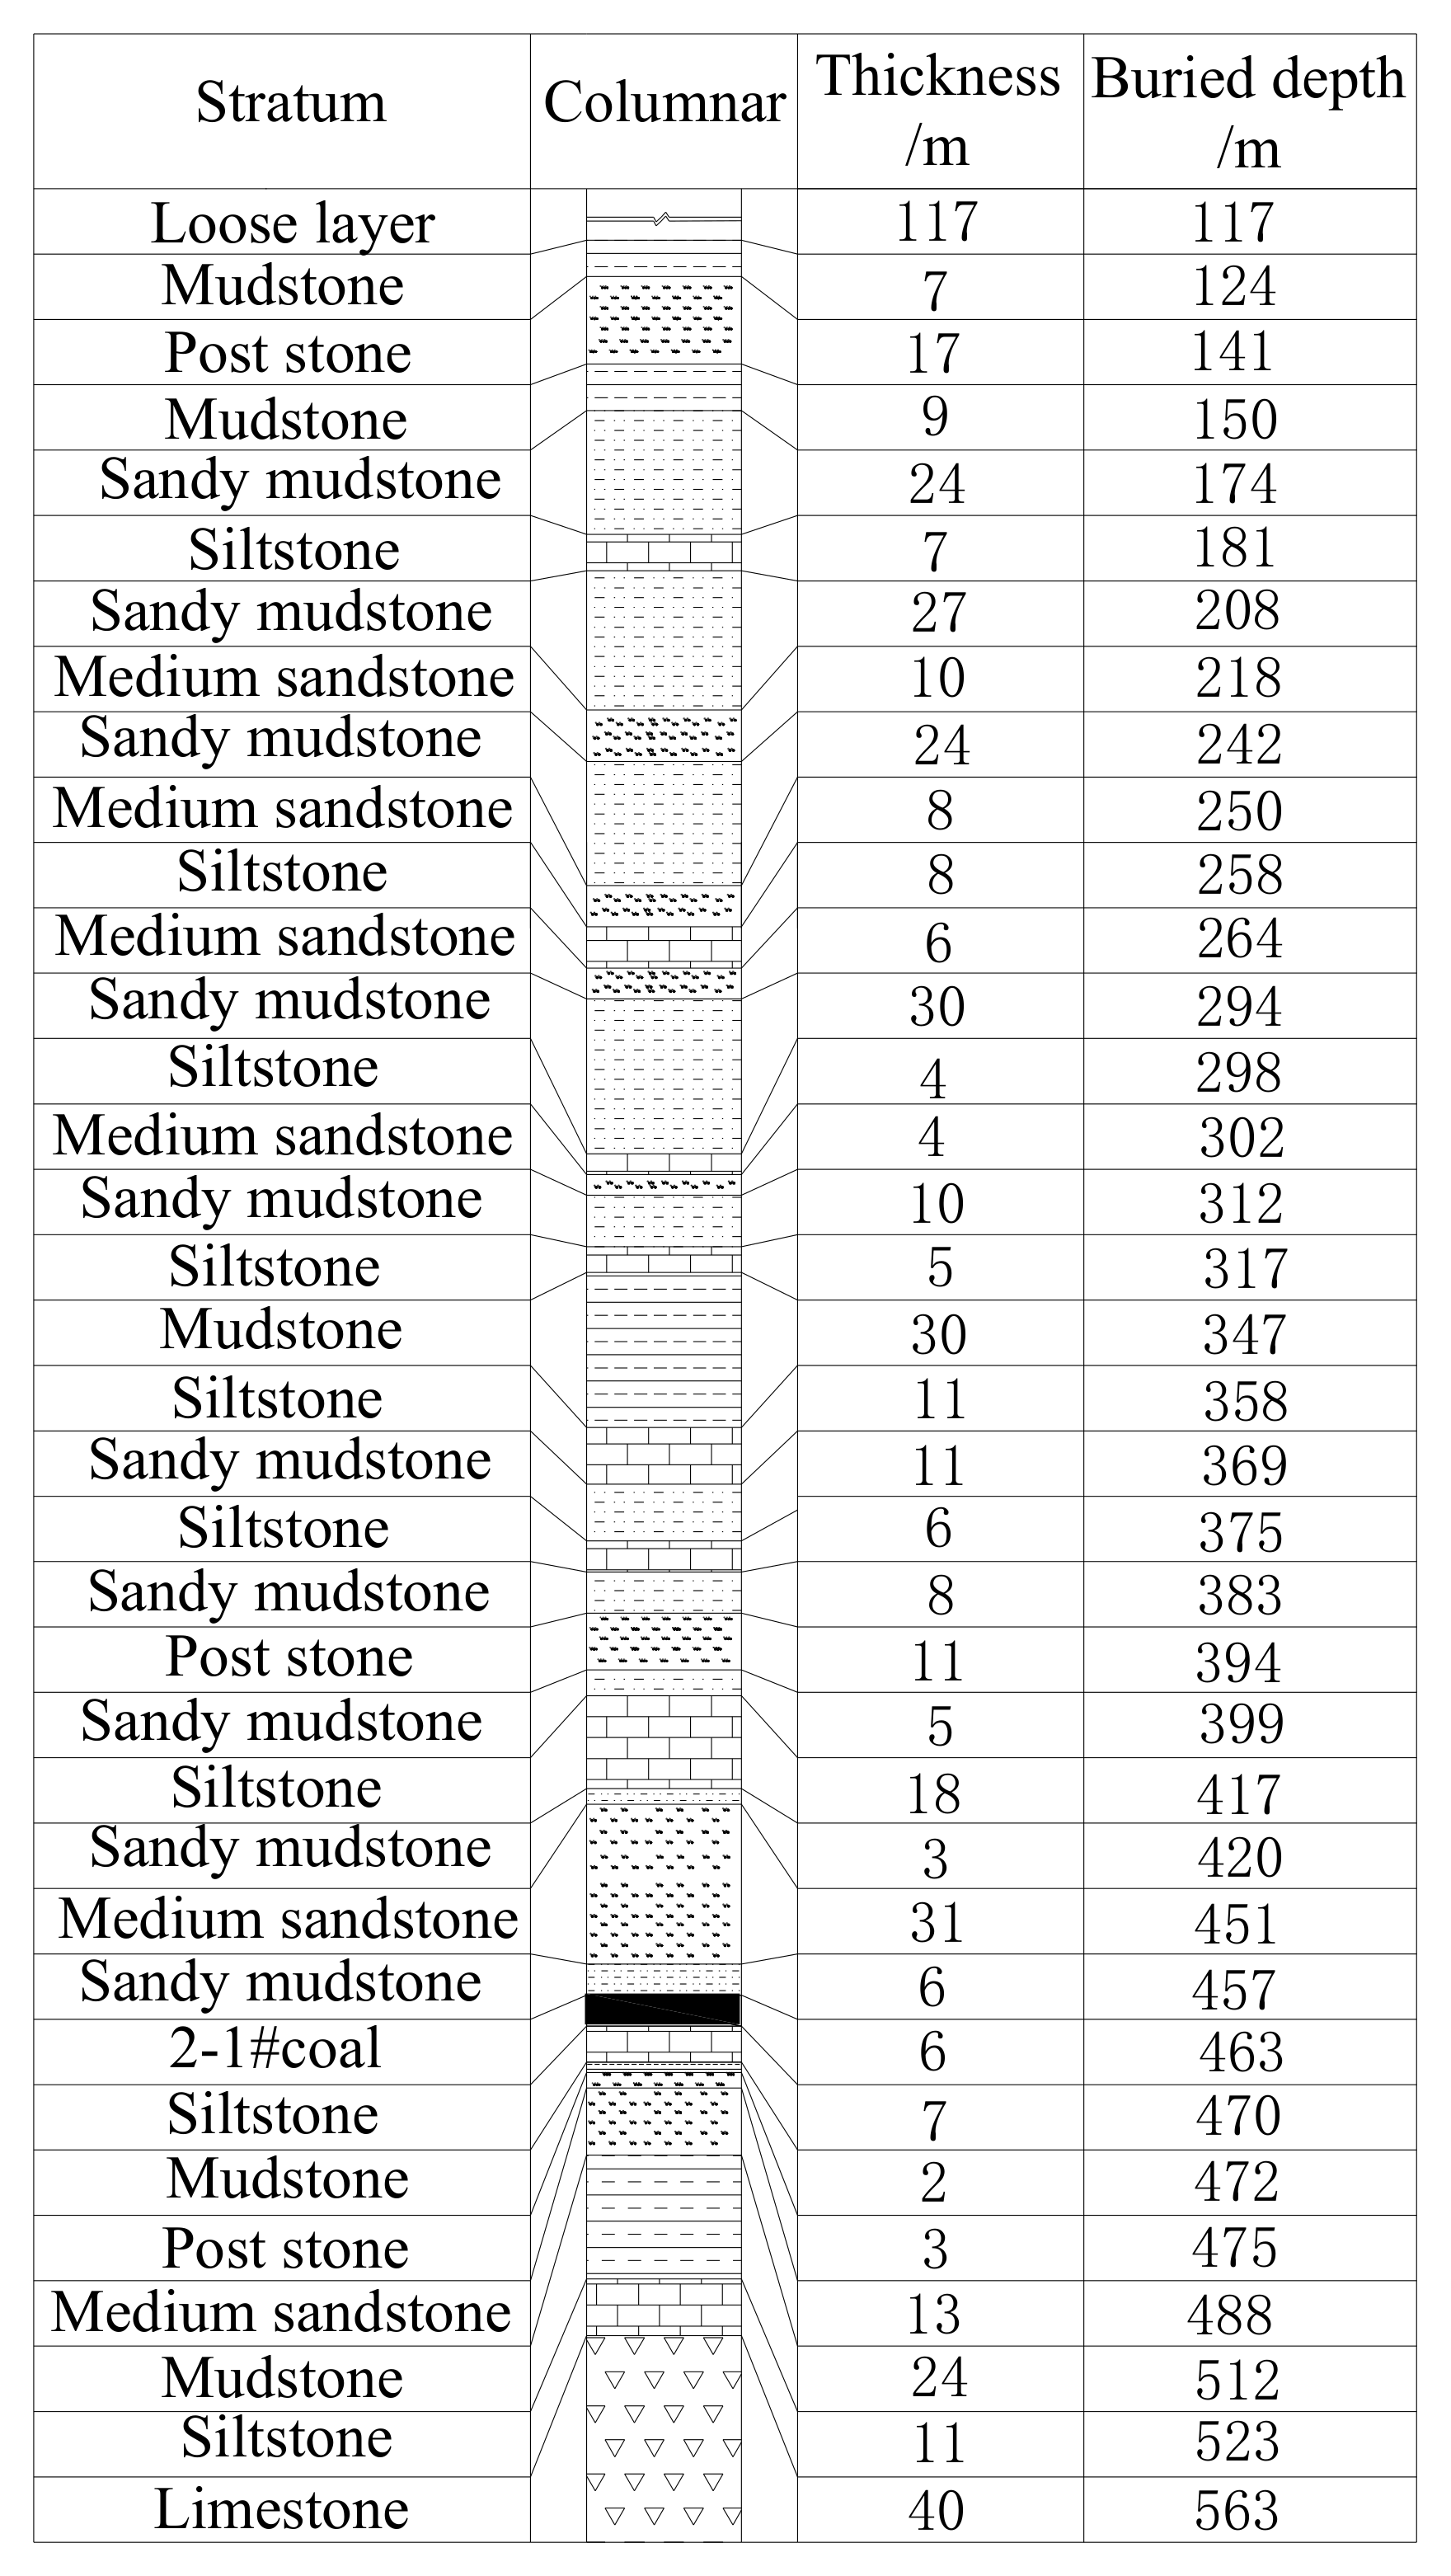
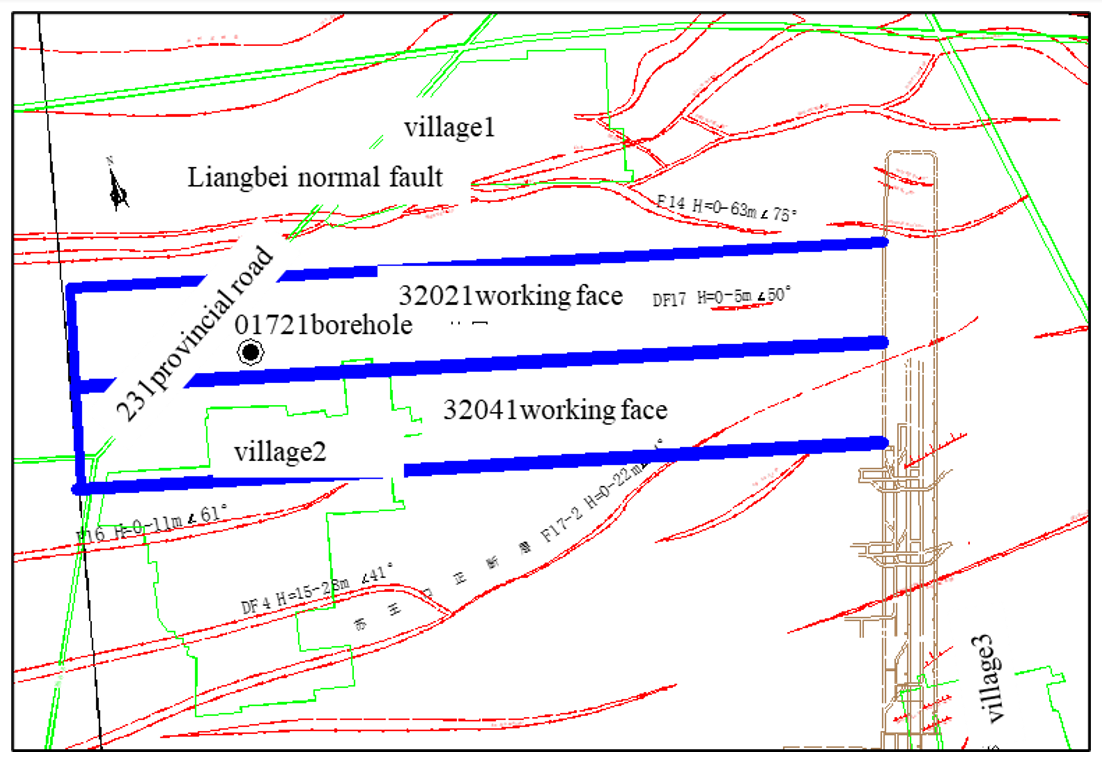
2. Engineering Background

The working face 32,021 of Liangbei coal mine has a strike length, inclination length, and average mining depth of about 900, 200, and 500 m, respectively. The coal seam structure is simple, with an average thickness of 6 m, and an inclination angle of 3.5°~11° (mean = 7°). The mining reserves are about 2.07 million tons. The coal seam floor is siltstone with a thickness of 7 m and a total thickness of 60 m from the aquifer and the pressure of the floor is about 5 MPa. Figure 1 shows the columnar diagram of some overlying rocks. The surfaces of the two villages predominantly comprise brick and concrete structures. The relative position between the working face and the village and the position of borehole 01721 are shown in Figure 2.
The mining near the working face of Liangbei mine affects the surface buildings, which are possibly threatened by the confined water. Therefore, we studied the failure depth of the roof and floor and the failure law of the surrounding rock of working face 32,021 in 32 mining areas.

3. Failure Analysis of Floor Water Inrush and Surrounding Rock by the Longwall Caving Method

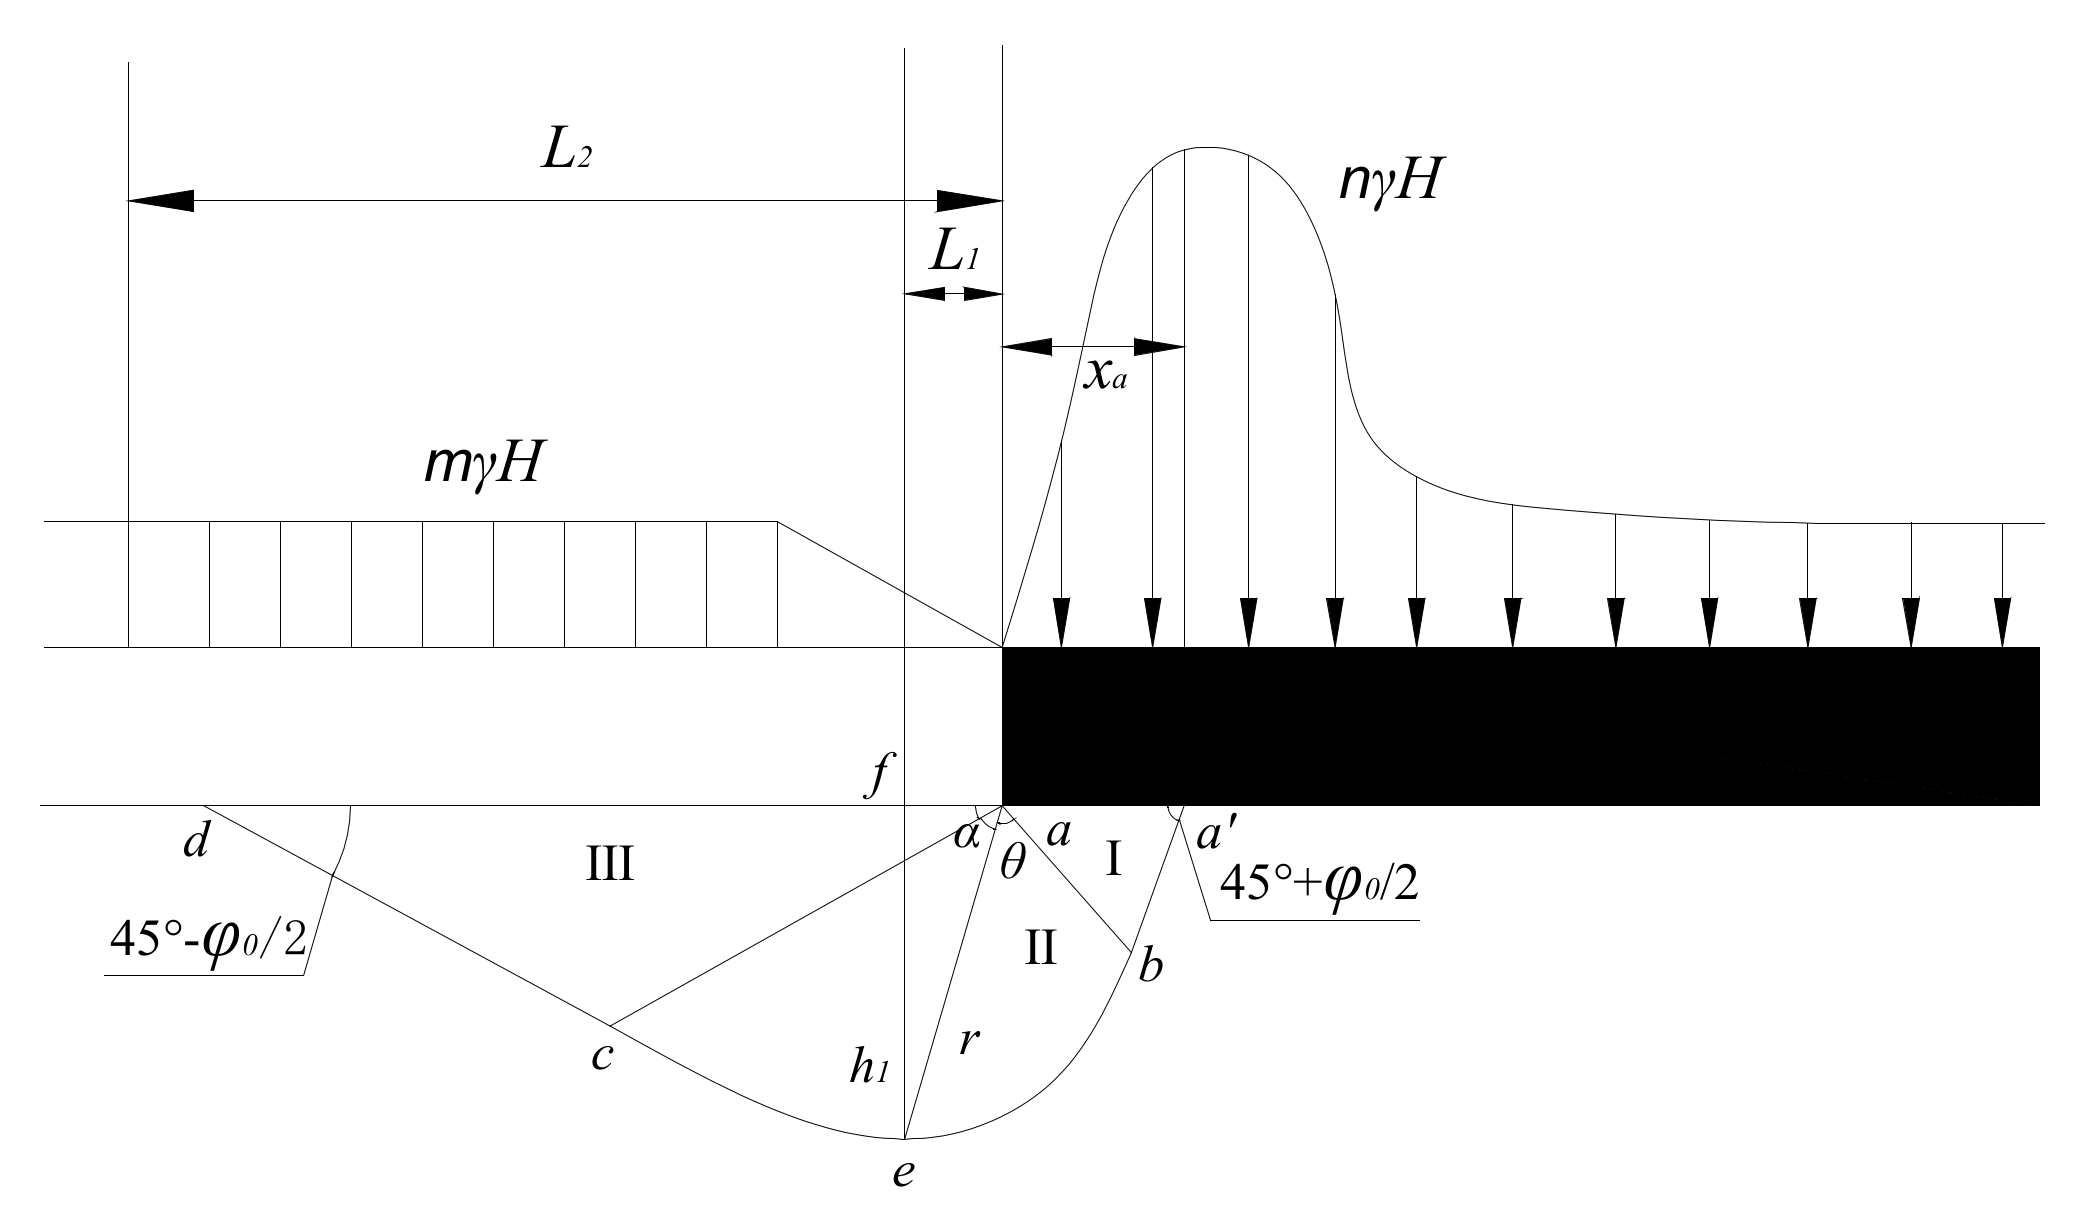
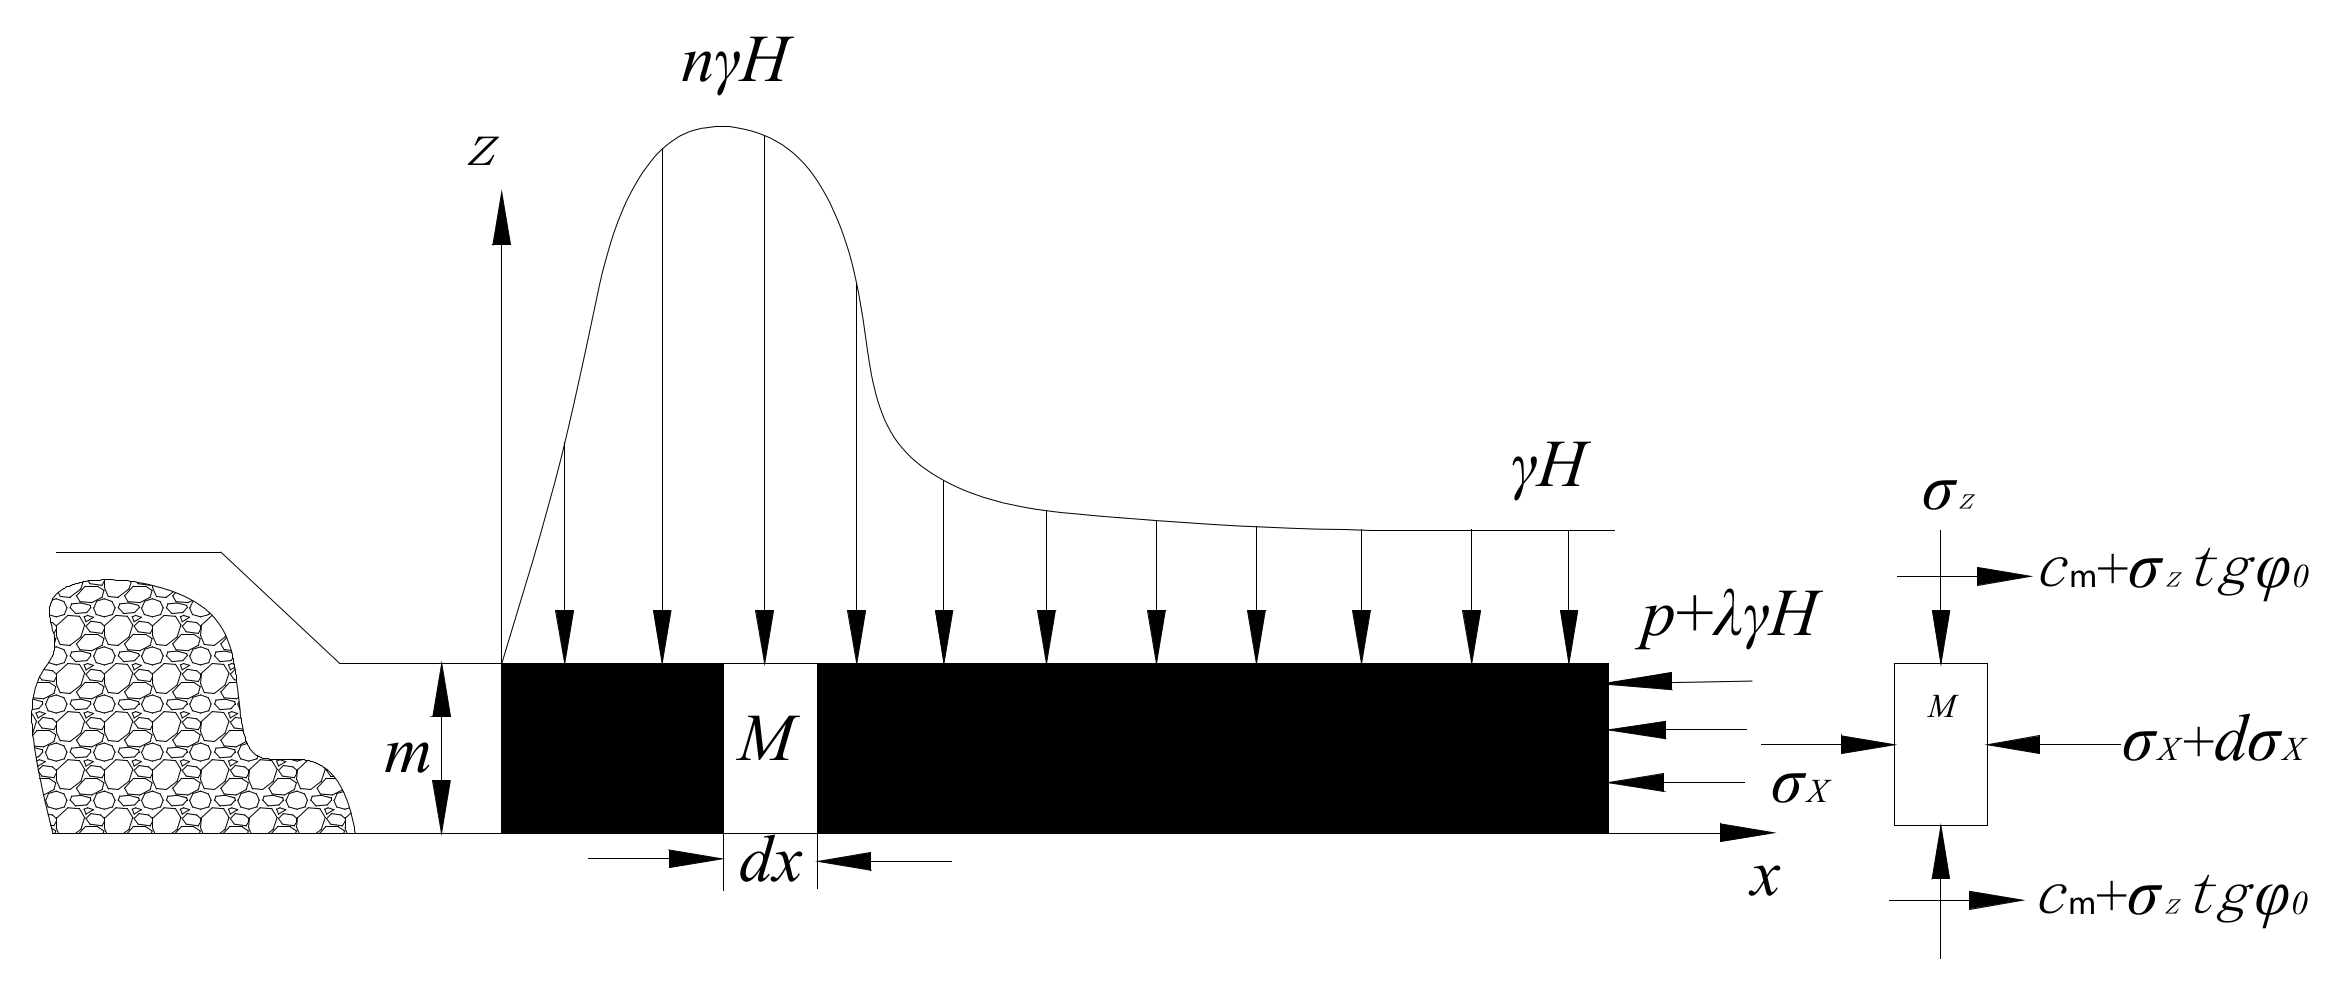
3.1. Theoretical Analysis of the Failure of the Floor and Surrounding Rock by the Longwall Caving Method

The stress distribution of the surrounding rock is shown in Figure 3, and the equilibrium state stress model (Figure 4) was established based on this.
  • aa’b(Ⅰ), Active limit region. abc(Ⅱ),Transition region. acd(Ⅲ)Passive limit region.
  • r, The distance from a to bc, m. θ, The included angle between r and ab, °.
  • ϕ0, Angle of friction in floor strata, °. e, Maximum depth point of floor failure.
  • h1, Maximum failure height of floor, m. L1, Horizontal distance between the maximum failure height of bottom plate and the end of working face, m. L2, Maximum length of floor rock mass failure zone along horizontal direction, m. γ, Mean volumetric forces of overlying strata.
  • H, The depth of a cell from the surface, m. m, n, Stress coefficient. xa, Plastic zone width, m.
In Figure 3, the plastic failure of the floor is divided into three parts: main bearing zone (I), transition zone (II), and plastic swept zone (III). The area enclosed by triangle acd is the passive limit area, corresponding to the upper goaf. The internal friction angle of floor rock mass is denoted as φ0. The cd and a’e lines are boundaries of the slip fracture surface at an angle of (45 − φ0/2) to the coal seam floor. When the floor stress of the working face exceeds its maximum bearing capacity, the overburden experiences plastic deformation, resulting in floor heave and other phenomena, represented as the abcd area in Figure 3. However, a slip surface can be easily formed at the plastic zone boundary (abd line), leading to confined water entering the working face through the fracture zone of the slip surface, threatening the safety of the working face. The strata stress outside area III gradually balances. The abcd line is composed of irregular curves, where lines ab and cd are linear, and line bc is a logarithmic spiral line. The boundary radius r can be expressed as:
r = r 0 e θ   tan   φ 0
where φ0 is the friction angle, r0 is the radius of curvature, and θ is the included angle between r and r0. By analyzing the geometric dimension relationship, the plastic range of the surrounding rock can be obtained as follows:
In Δaba’ and Δaef,
a b = r 0 = x a / 2 cos ( π 4 + φ 0 2 )
h = r 0 e θ tan φ 0 cos ( θ + φ 0 2 π 4 )
θ = π 4 + φ 0 2 follows from d h d θ = 0 .
Therefore, the maximum depth h1 of the floor failure zone is:
h = r 0 e θ tan φ 0 cos ( θ + φ 0 2 π 4 )
The horizontal distance l1 from the maximum failure depth of the floor surrounding rock to the working surface, and maximum failure length l2 in the plastic zone of the surrounding rock are:
h = r 0 e θ tan φ 0 cos ( θ + φ 0 2 π 4 )
l 2 = x a tan ( π 2 + φ 0 4 ) e π 2 tan φ 0
To calculate the failure range of the surrounding rock, it is necessary to calculate the width of plastic zone xα caused by advanced support stress during coal mining. As shown in Figure 4, M of the unit width is arbitrarily taken as the differential element body. When in stress balance, the resultant force along the horizontal direction is 0, obtained as:
l 2 = x a tan ( π 2 + φ 0 4 ) e π 2 tan φ 0
Through the limit equilibrium condition and the Mohr–Coulomb criterion,
2 ( C m + 2 σ z tan φ 0 ) d x + σ x m ( σ x + d σ x d x ) m = 0
The stress balance conditions of coal seam should meet the following condition:
σ z + C m cot φ 0 σ x + C m cot φ 0 = 1 + s i n φ 0 1 s i n φ 0 m = k 1
By solving the differential equation, the boundary condition is x = 0, σx = 0. Hence, we obtained [18]:
σ z = k 1 C m cot φ 0 e 2 k 1 x tan φ 0 m C m cot φ 0
The maximum stress of the coal seam was σz = nγH, and its plastic zone width xα could be obtained from Equation (10):
x a = m 2 k 1 tan φ 0 ln n γ H + C m cot φ 0 k 1 C m cot φ 0
where γ is the average bulk density of the rock mass (25,000 KN/m³), H is the average buried depth (500 m), φ0 is the friction coal seam angle (25°), Cm is the cohesion of coal seam (0.6 MPa), and n is the stress concentration coefficient (4).
According to Equations (4) and (11), the width of the plastic zone of the coal body xa is 7.3 m. The maximum failure depth of the coal floor h1 is 16 m when mined using the longwall caving method. Equation (12) provides the formula for the water inrush coefficient stipulated in coal mine water prevention and control:
T = P h D h 1
where T is the water inrush coefficient, MPa/m, P is the head pressure of aquifer (5 MPa), hD is the distance between the upper boundary of the aquifer and coal seam floor (60 m), and h1 is the failure depth of the coal floor (16 m).
According to Equation (12), the water inrush coefficient T of the longwall caving mining coal floor is 0.114 MPa/m, and the regional limit of water inrush coefficient Ts is 0.1 MPa/m when T > Ts. This indicates that adopting the longwall caving mining method endangers the working face with water inrush.

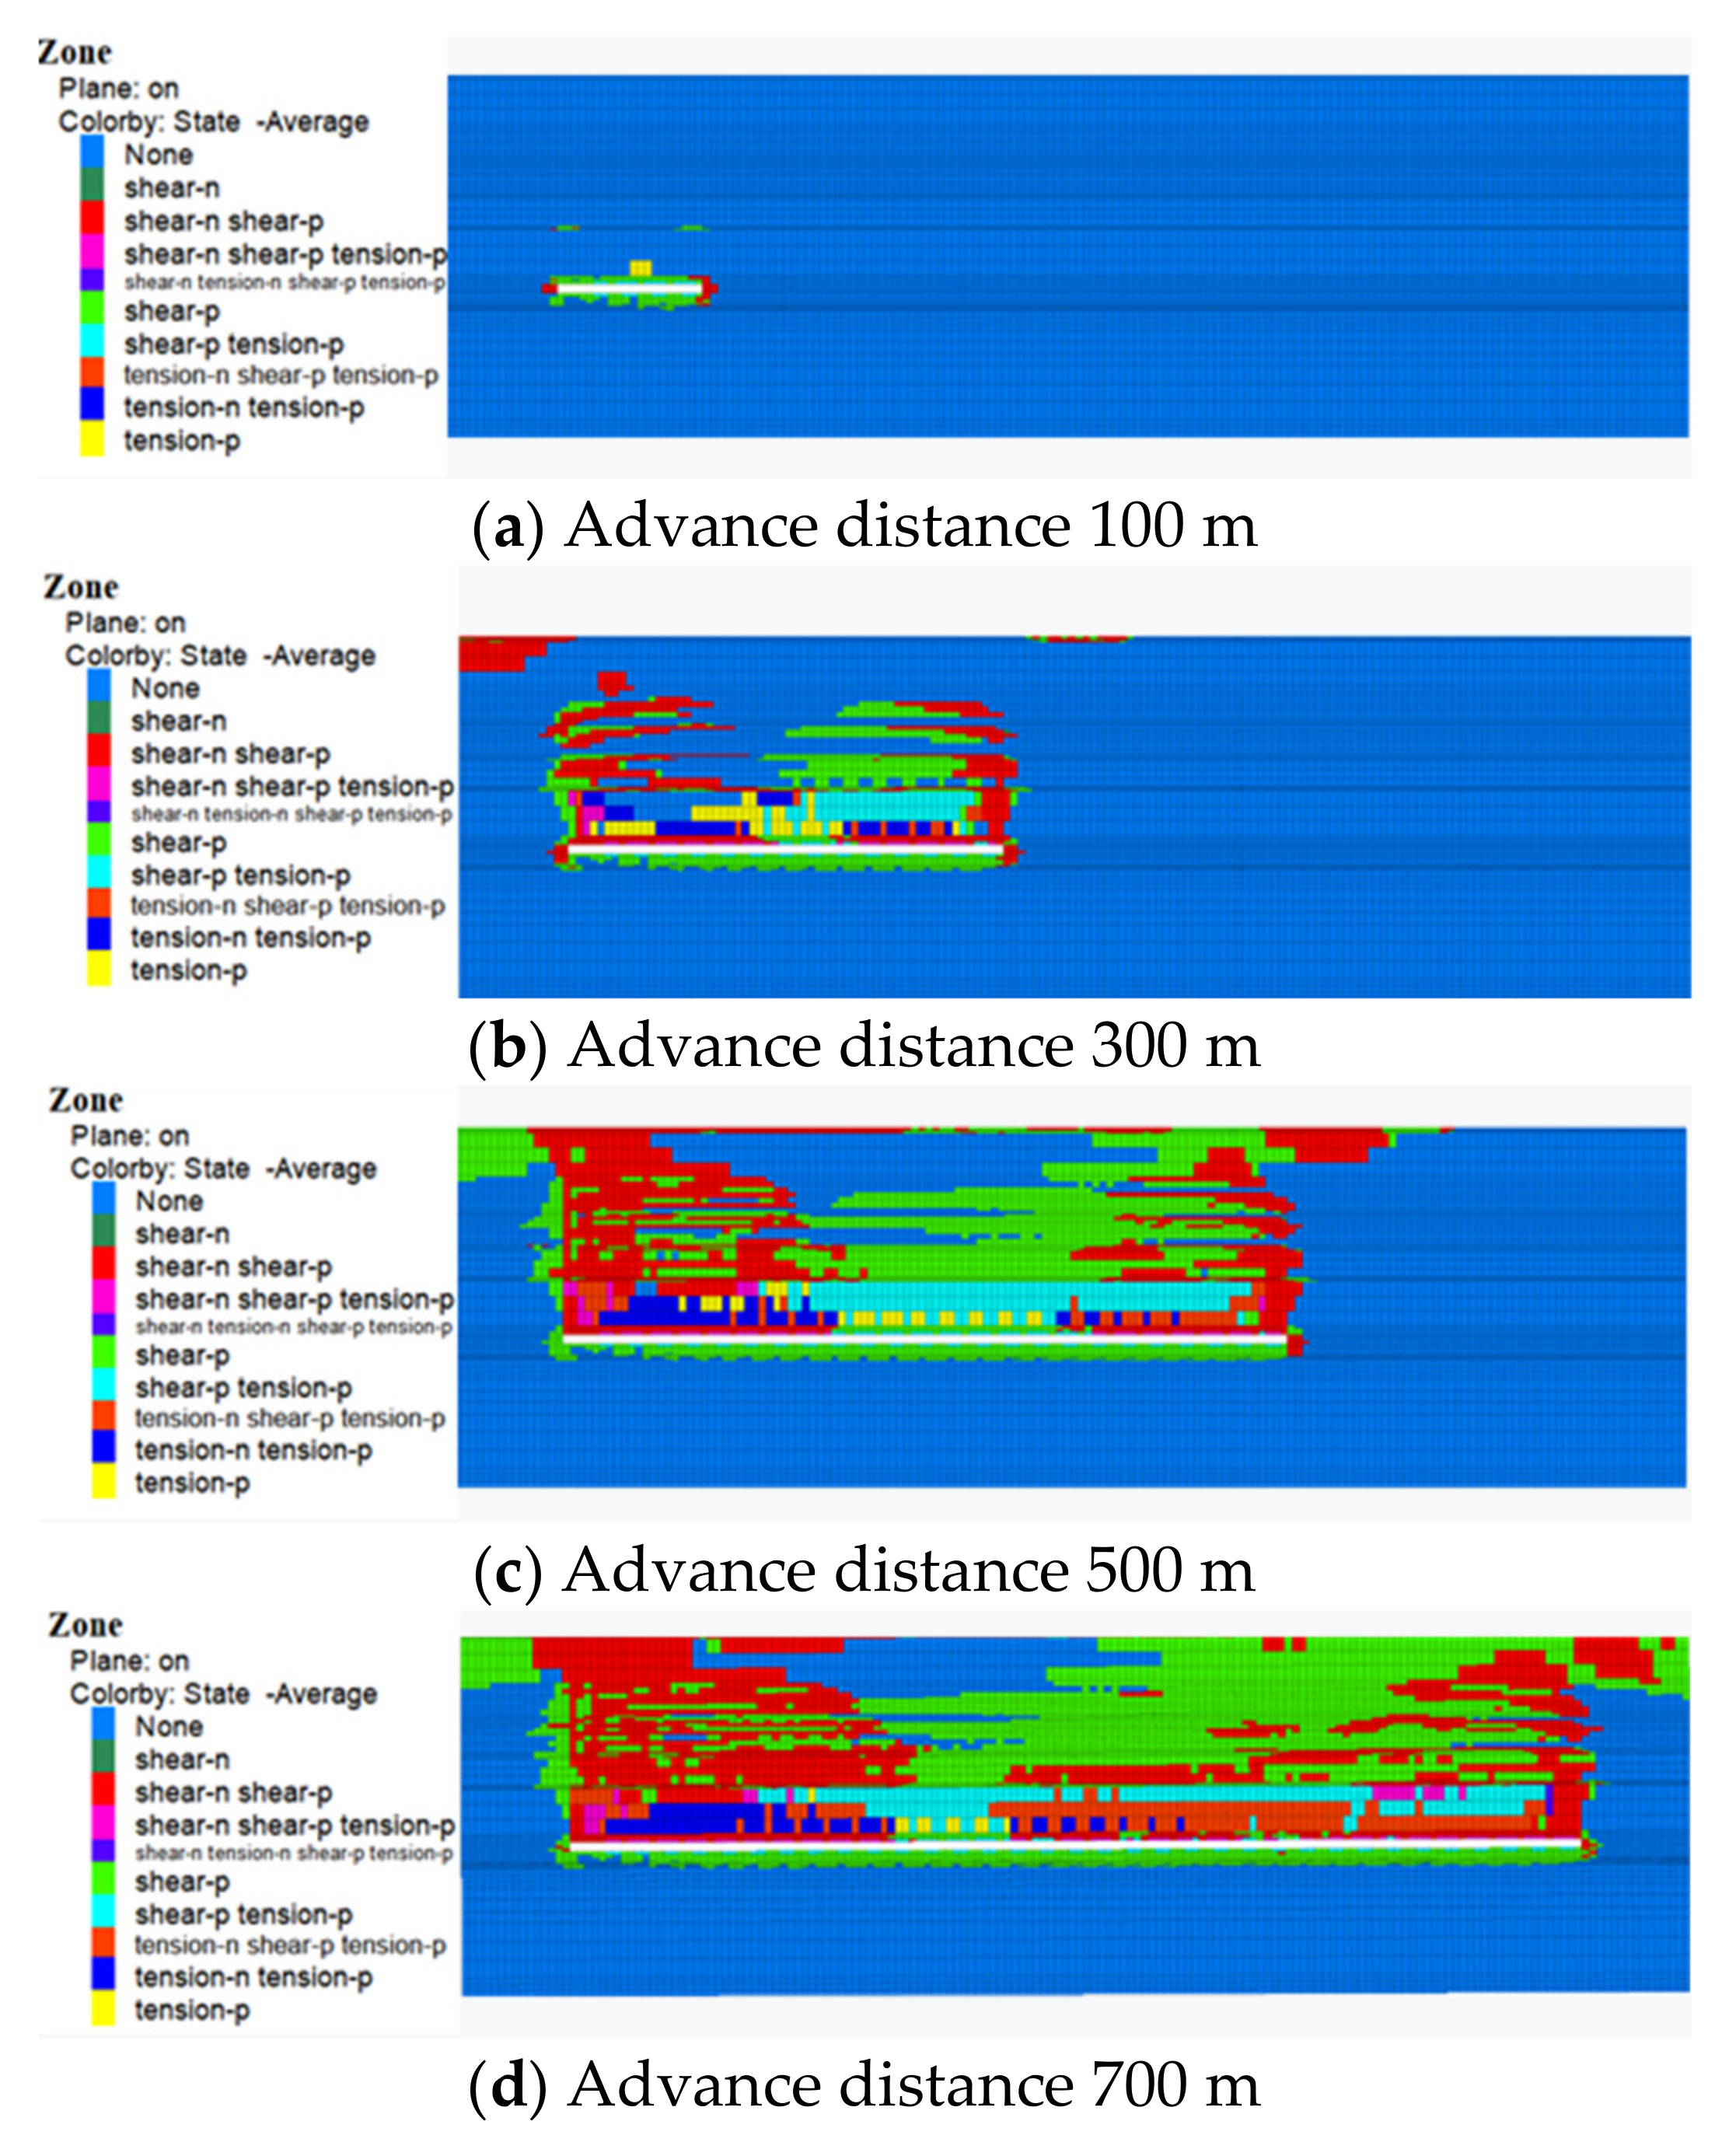
3.2. Numerical Simulation of Floor and Surrounding Rock Failure by Longwall Caving Method

The 32,021 working face of the Liangbei coal mine is subject to pressure mining and situated on confined water. Therefore, finite difference FlAC3D numerical simulation software was used to simulate the mining deformation of rock mass for the 2-1# coal floor, and analyze whether the roof and floor broke the rules. The finite difference method starts from the constitutive relation of rock mass; therefore, the yield criterion, flow law and stress, strain, and deformation failure of the floor rock mass in the dynamic mining process can be obtained by time step. The deformation and failure range of the coal floor can be simulated. According to the research purpose, the model can simulate longwall caving mining and paste filling mining accordingly.
The rock strata parameters in the model refer to the engineering geological data of drilling hole 01721 in mining area 32, and the mechanical test results of the rock core. The 2-1# coal is a mined coal seam with a thickness of 6 m. The direct roof is sandy mudstone and the direct floor is siltstone. Based on the geological conditions of the study area, the model parameters were as follows. The strike length of the model was set as 850 m. According to the full mining conditions of the working face, the advancing distance of the working face was 700 m, and 75 m mining boundaries were set outside the mining range. The inclined length was 380 m, the inclined advance distance was 230 m, and 75 m boundaries were also set outside the mining range. The design model was 250 m high, 100 m below the coal seam floor, 6m thick, and 144 m above the roof. Uniformly distributed load was applied to the overburden, and the volume force was taken as 25 kN/m³. The applied uniform load was 7.075 MPa, Therefore, the design model size (length × width × height) was 850 m × 380 m × 250 m. To simulate the caving mining method, the mining length was 700 m, and a coal thickness of 6 m was mined at one time. To determine the displacement subsidence value, stress distribution and plastic zone width of the roof in the caving method mining, the monitoring point was 20 m away from the coal seam roof. The numerical simulation model diagram is shown in Figure 5.
According to the regional rock conditions, the rock parameters in the model are shown in Table 1.
With the advance in the long wall caving face, the subsidence value of the rock stratum increased gradually. The variation in the displacement subsidence of the roof with the advance distance is shown in Figure 6. The maximum displacement and subsidence of the caving mining method was 3.02 m, and the mining influence spread to the upper boundary of the model. The cloud diagram of displacement change is shown in Figure 7.
The stress above the working face will be released with the advance in the working area and the working face. When the overburden is far away from the working face, the stress value decreases gradually, and the stress cloud diagram is symmetrically distributed in a “butterfly shape”. The axis of symmetry is roughly the middle of the working face. The distribution of the roof stress of the working face with advancing distance is shown in Figure 8. There was stress concentration on the coal wall, behind the front of the working face, and the peak value of vertical stress was 21.6 MPa at the end of mining. After coal mining, the overburden weight of the goaf roof was transferred to the coal body in front of the working face, resulting in an increased pressure area of the floor rock mass under the coal wall. As mining advanced, the overburden stress gradually recovered to the original rock stress level. The vertical stress nephogram around the working face during caving mining is shown in Figure 9.
The original rock equilibrium state was destroyed with the mining of the working face, and the rock stratum produces damaging movement. Under the mining conditions of caving mining, the surrounding rock is seriously damaged, and the range of the plastic zone gradually increases with the advance in the working face. When the working face advances to 300 m, the damage depth of the bottom plate reaches 12 m, and the damage of the overlying rock stratum becomes serious. The distribution of the plastic zone in the caving mining method is shown in Figure 10. The failure range in front of the working face was 15 m, calculated by Formula (12), and the water inrush coefficient was 0.104. At this time, when T > Ts, the working face is in danger of water inrush, and the correctness of the theoretical calculation can be verified. The damage range of the plastic zone was extended to the upper boundary of the model (90 m away from the coal seam). If effective measures are not taken, the coal seam mining will pose a threat to the ground buildings (structures).

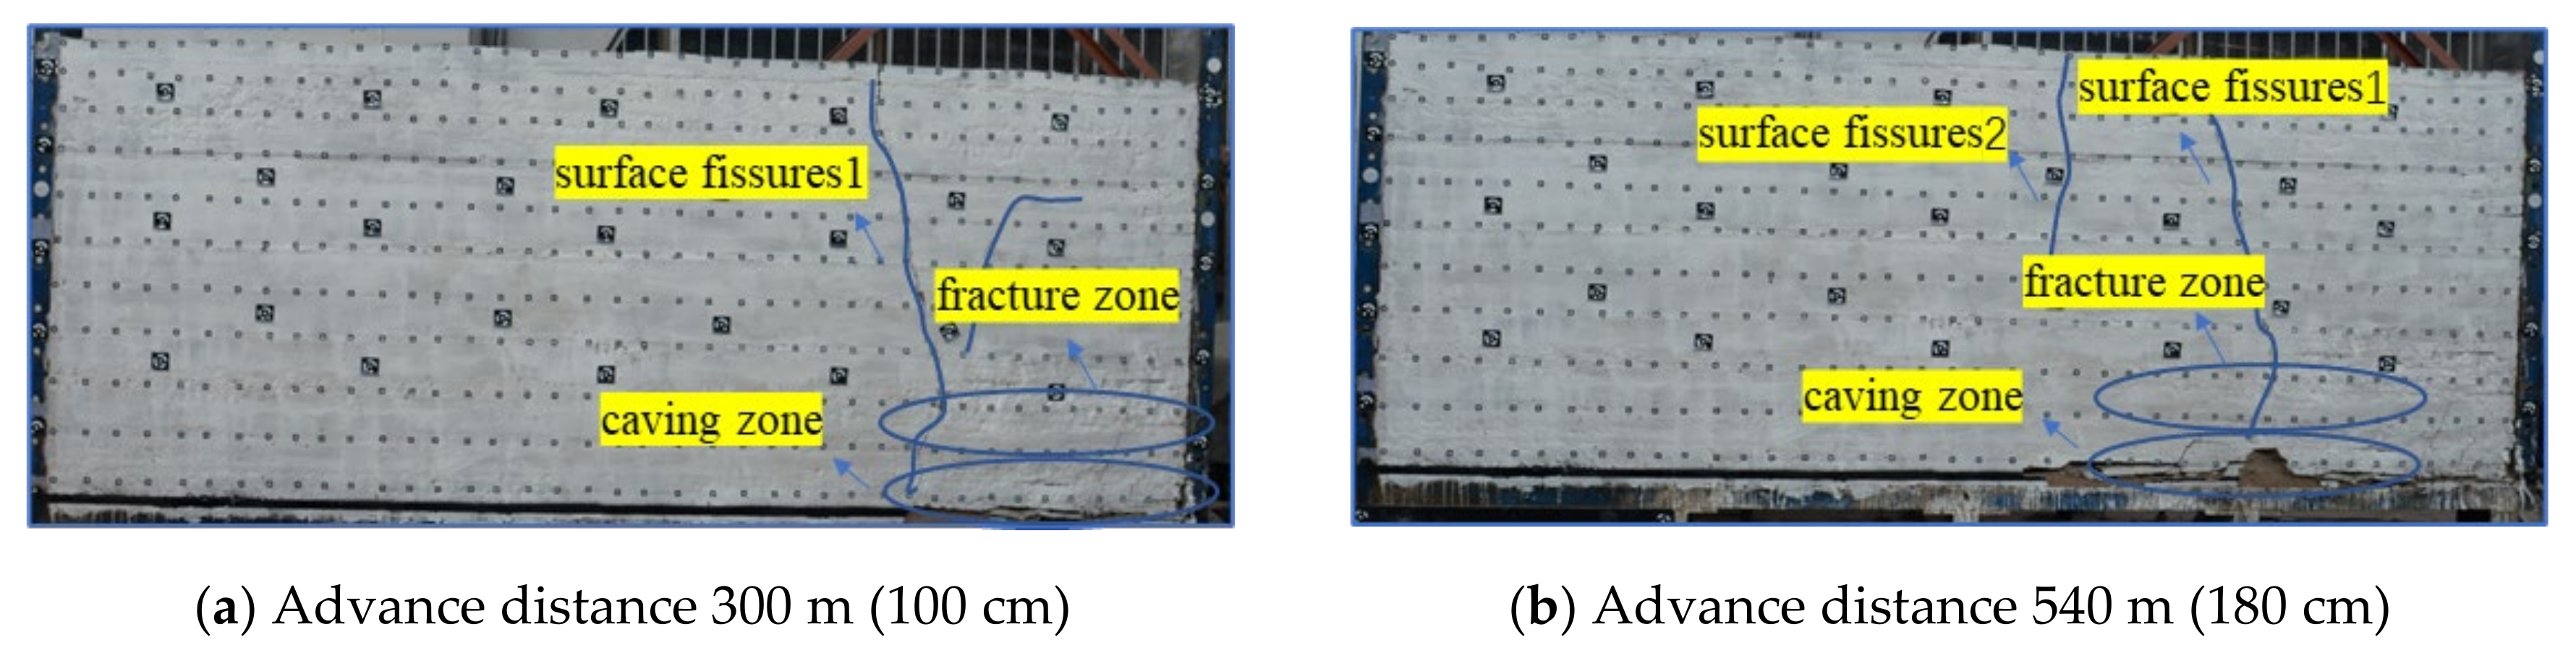
3.3. Longwall Caving Method Physical Simulation

Combined with the geological conditions of the working face, the size of the model test bench was 4 m × 0.3 m × 2 m, simulated to the surface. The model material included sand (as aggregate), calcium carbonate, and gypsum (as cementing materials).
(1)
Model geometric similarity coefficient (geometric similarity ratio)
The geometric similarity coefficient is:
α L = L m / L p = 1 / 300
where Lm is the model size and Lp is the prototype size.
(2)
Time similarity coefficient (time similarity ratio)
The time similarity coefficient is:
α t = t m / t p = α L = 1 / 300 = 0.058
where Tm is the model process time and TP is the prototype process time.
(3)
Unit weight similarity coefficient (unit weight similarity ratio)
The similarity coefficient of bulk density is:
α t = γ m / γ p = 0.6
where γm is the model bulk density, taken as 1.5 × 10⁴ N/m3, and γP is the prototype bulk density, taken as 2.5 × 10⁴ N/m3.
(4)
Similarity coefficient of other mechanical parameters (similarity ratio of other mechanical parameters)
The similarity coefficients of the other mechanical parameters are:
  • Strength ratio: α σ = σ m σ p = γ m × L m γ p × L p = α γ × α L = 0.002 .
  • External force ratio: α p = α γ × α L 3 = 2 × 10 8
  • Elastic modulus ratio: α E = α γ × α L = 0.002
  • Poisson’s ratio: α μ = 1
The model’s geometric similarity ratio was 1:300; the time similarity ratio was 1:17; the bulk density similarity ratio was 3:5; Poisson’s ratio and internal friction angle similarity ratio was 1; strength and elastic modulus similarity ratio was 1:500; and external force similarity ratio was 2 × 10⁻⁸. In addition, the migration of overlying rock and surface during coal mining was observed by digital close-range photography. In order to observe the surface cracks and subsidence, a similar material simulation model reached the surface. The thickness and mechanical parameters of the rock strata are shown in Table 2.
The model was excavated at intervals of 30 min, and each step was 15 cm. The mining sequence moved from right to left for full height mining; a 300 m (100 cm) coal pillar was on the left. To better understand the actual coal seam overburden failure, the actual prototype values are described.
When mining reached 105, 165, 240, 315, and 390 m (Figure 11), the coal seam roof appeared periodically, and the periodic weighting interval was 45, 60, 75, 75, and 75 m, respectively. When mining to 150 m, the ground fissure 1 appeared at 180 m of the advanced working face, while the surface stepped fissure appeared with a displacement distance of 0.9 cm. When mining at 390 m, it was connected with the fracture zone of the working face, and the displacement distance of the site surface stepped fissure was 2.6 m, consistent with the model. At 420 m, ground crack 2 appeared 90 m ahead of the working face. Furthermore, ground fracture 3 appeared 135 m ahead of the working face when mining at 540 m. The fracture was connected with the fracture zone of the working face when mining at 780 m, and the evolution law similar to that of ground fracture 1 appeared. At 720 m, ground crack 4 appeared 144 m ahead of the working face. For ground fissure 1, ground fissure 2, and the goaf direction fissure, the separation tended to be close.
Longwall caving mining results in overburden cracks, separated strata, and surface cracks. The surface cracks were connected with overburden separated strata and cracks, and a step crack with a drop of 0.5 m appeared on the surface cracks. There were close to 32,051 working faces at the surface crack with consistent gaps of 0.46 m steps, showing that the mining working face affected the surface buildings (Figure 12).

4. Analysis of Water Inrush Safety and Surrounding Rock Failure of the Backfill Method

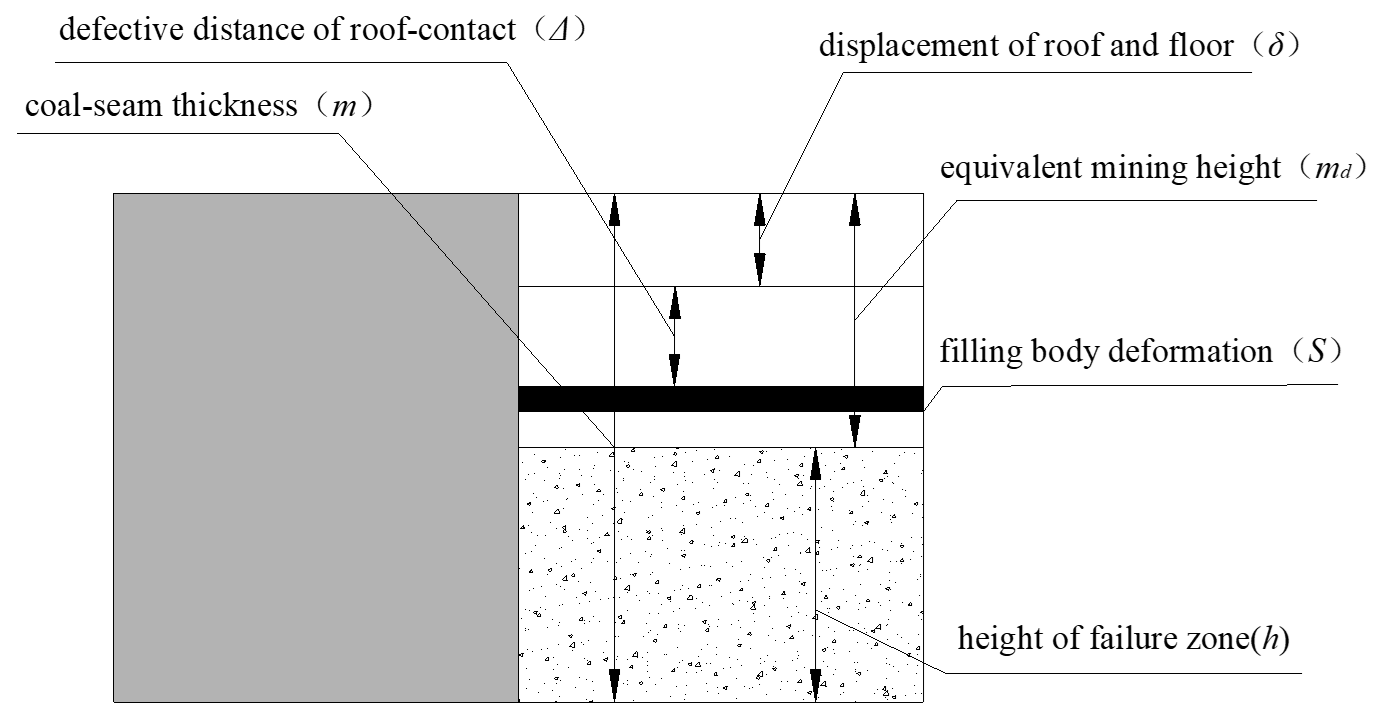
4.1. Theoretical Analysis of the Failure of the Backfill Floor and Surrounding Rock

When considering the influence of water inrush on the working face, we found that filling mining effectively prevents water inrush. After filling mining, water inrush and the safety of the working face were analyzed.
The floor failure range of the paste filling working face was calculated by equivalent mining height, i.e., the filling mining thickness was converted to the equivalent mining thickness of the longwall caving method. According to the calculation method of longwall caving mining, the failure degree of the floor surrounding the rock during the mining of the working face was analyzed. The surface subsidence generated after the strata movement was stabilized. It consisted of five parts: the amount of roof and floor movement; the amount of underfilling; the deformation of the filling body; the amount of roof and floor rock compression; and the remaining floating coal compression of the floor. The theoretical mining height model of equivalent mining thickness is shown in Figure 13.
Equivalent mining height, corresponding to paste filling mining, is expressed as follows:
md = δ + Δ + S
where δ is the amount of roof and floor movement (120 mm), S is the amount of filling body deformation, the compression rate is 1%, and Δ is the amount of filling under connection (not considered in this study).
Through formula combination, we obtained the following expression:
A = cos φ 0 / cos ( π 4 + φ 0 2 ) e ( π 4 + φ 0 2 ) tan φ 0 1 k 1 tan φ ln n γ H + C m cot φ k 1 C m cot φ
The relationship between filling rate η and water inrush coefficient T can be obtained through Equation (14):
η = P / T H D m A + 1
where m is mining thickness (6 m), A = 2.7 (after calculation), HD is the waterproof layer thickness (60 m), and Ts is the regional limit water inrush coefficient (0.1 MPa/m).
According to Equation (14), the filling rate η ≥ 36.7%, the critical mining thickness of coal seam of water inrush was 3.8 m (i.e., the maximum equivalent mining thickness of the coal seam was 3.8 m), and the minimum thickness of the backfill was 2.2 m.

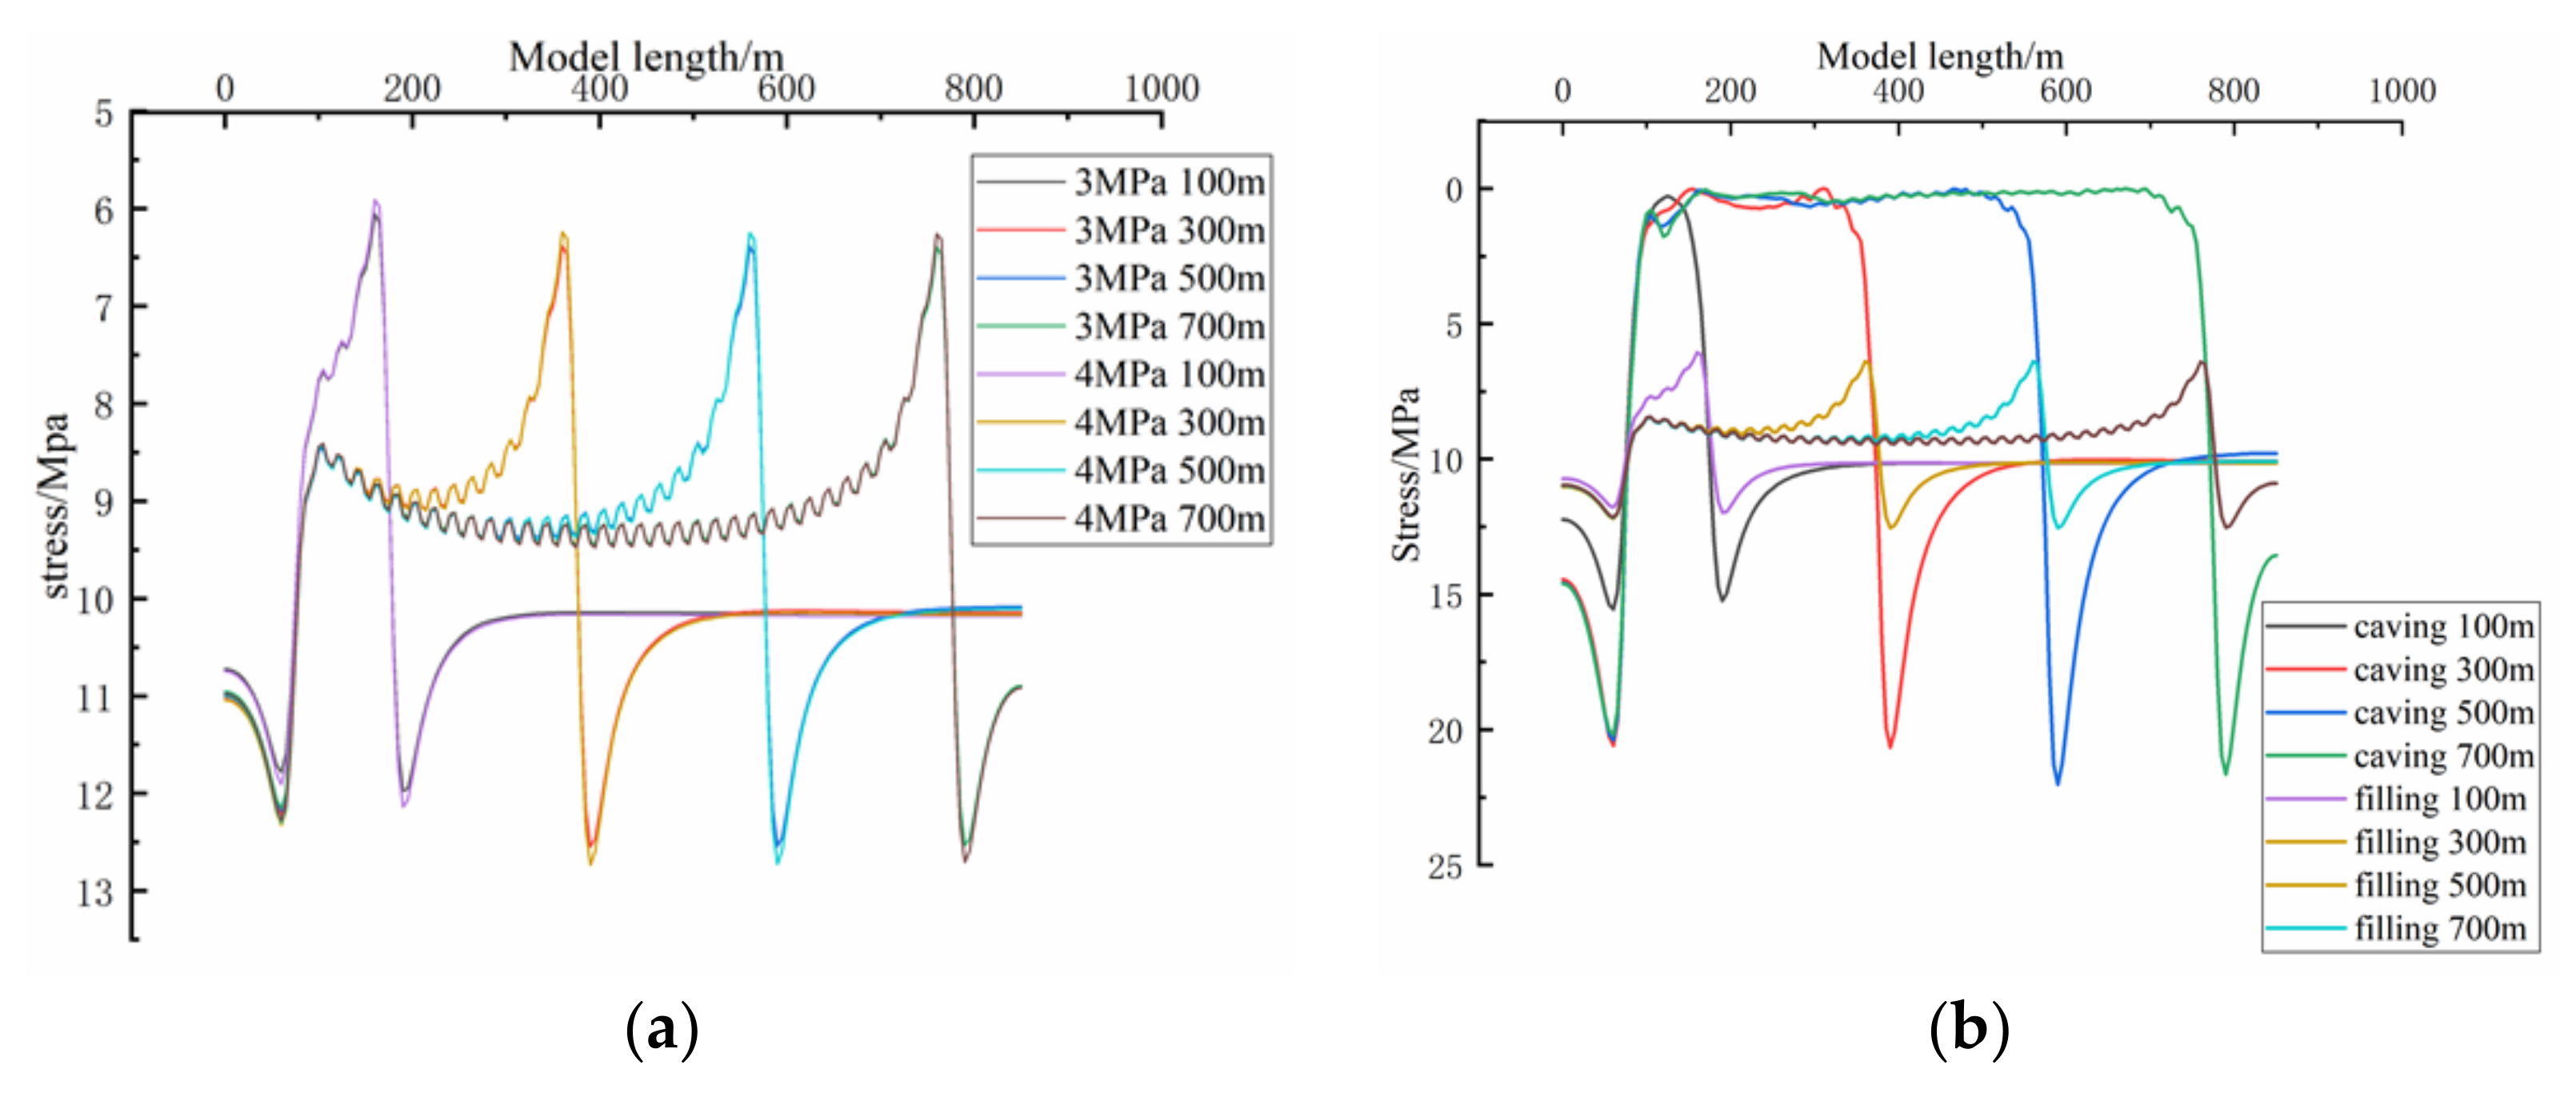
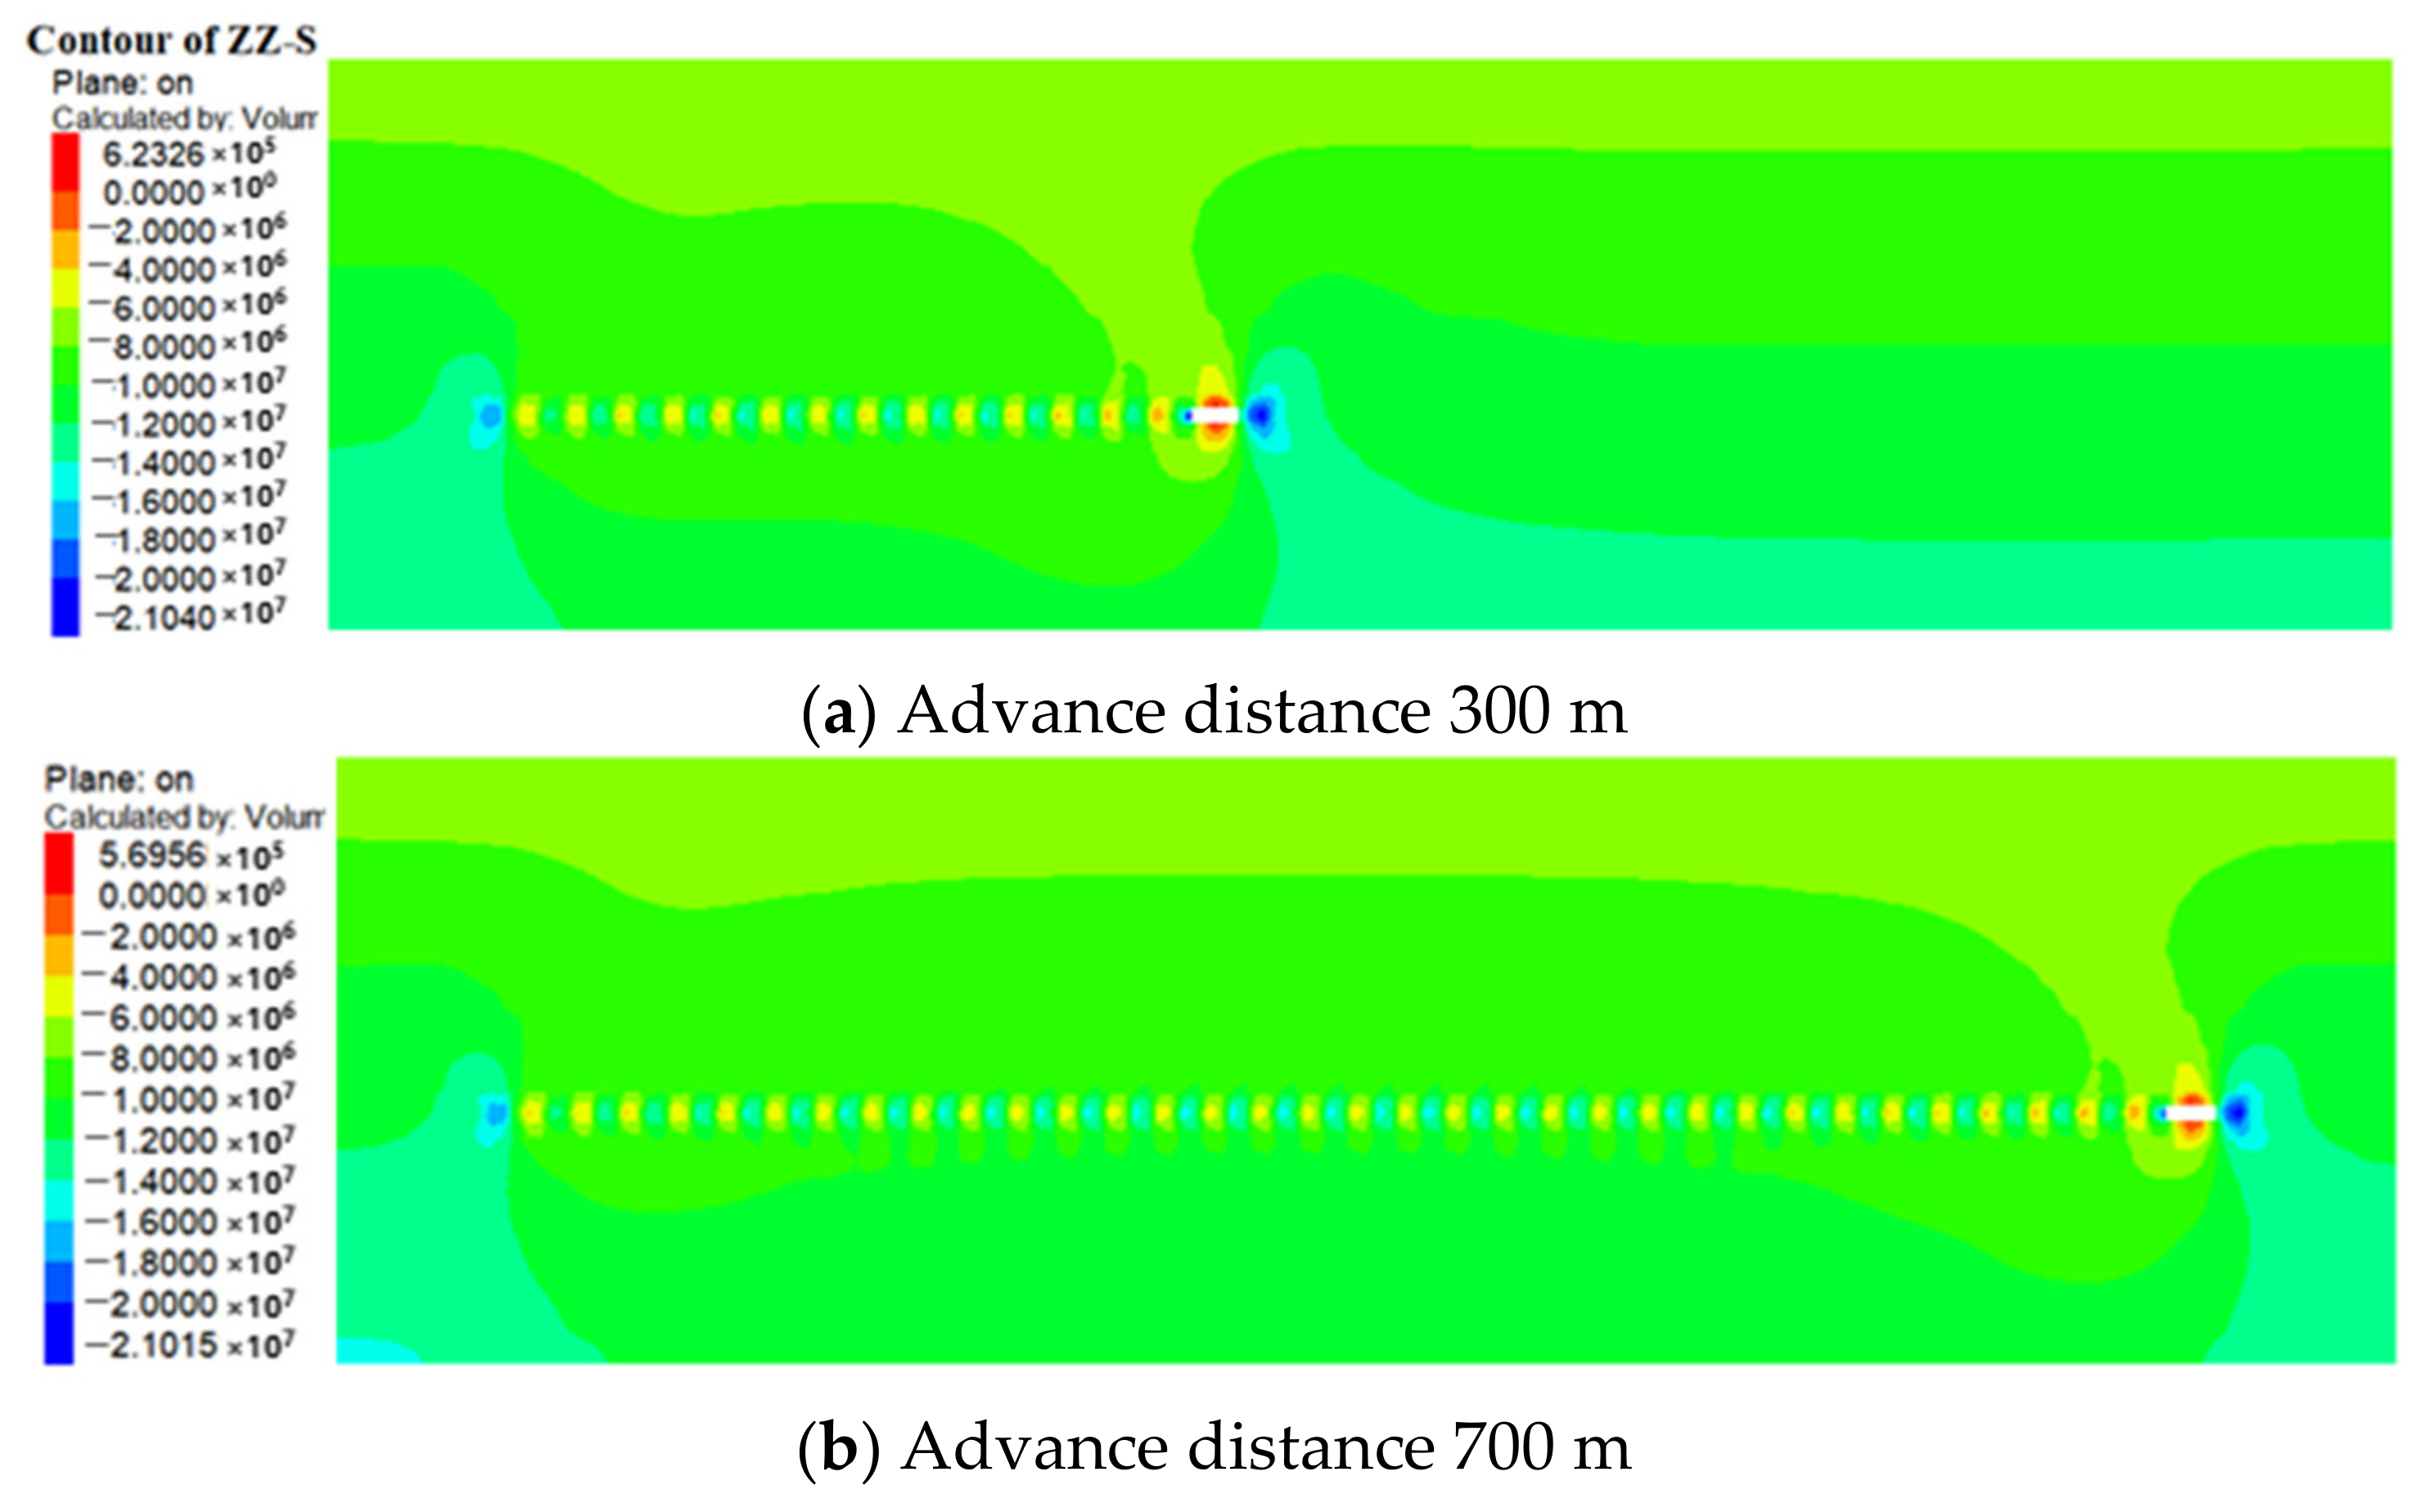
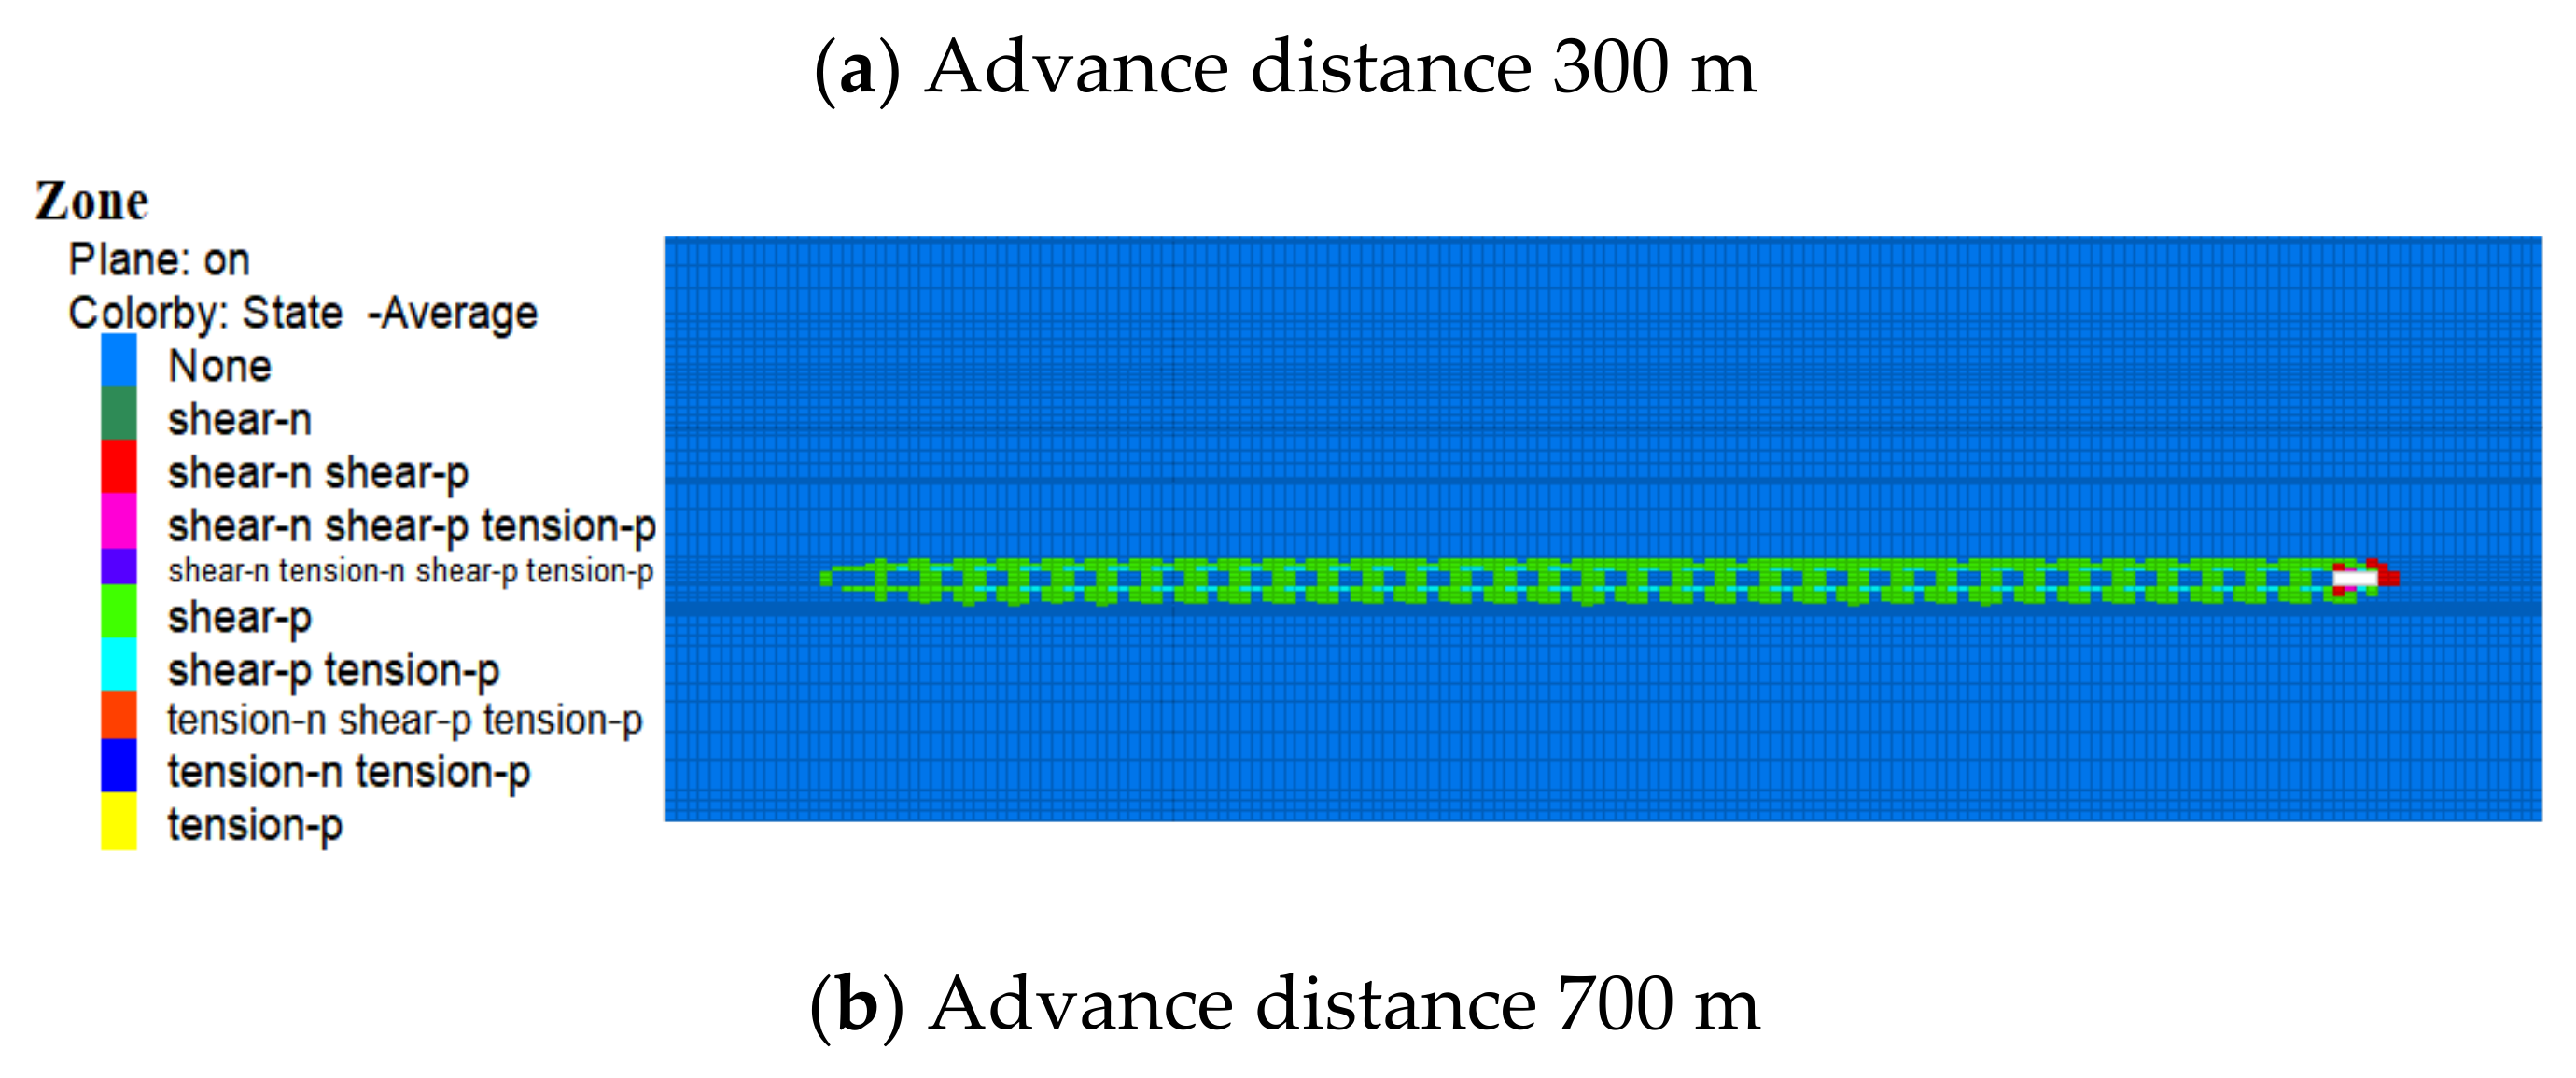
4.2. Numerical Simulation of the Failure of Backfill Floor and Surrounding Rock

The strength of the filling body determines the filling effect and cost, and it is a crucial parameter to guarantee the safe mining of the working face. Based on the physical tests of rock and backfill strength in 32 mining areas, the failure law of the surrounding rock of the filling mining method was numerically simulated and analyzed. In the simulation, a backfilling interval of 20 m was adopted, and the backfilling was performed step wise. We simulated the failure law of the surrounding rock under different strengths of 3 MPa and 4 MPa, respectively.
When the strength of the filling body was 3 MPa, filling mining still had the same characteristics as caving mining. As shown in Figure 14b, when the advancing distance was 300 m, the maximum displacement settlement value of overburden was 55.6 mm, and the caving mining method in the same advancing section was 91.9 mm. Compared with the caving method, it was reduced by 39%. When the advancing distance was 700 m, the maximum displacement settlement value of overburden was 64 mm, and the caving mining method in the same advancing degree was 302.2 mm. Compared with the caving method, it was reduced by 78.8%. As shown in Figure 14a and Figure 15, the displacement subsidence value of the 4 MPa overburden was lower than that of 3 MPa. The strength between 3 MPa and 4 MPa had little effect on the displacement and settlement. The displacement nephogram and displacement curve under different filling strengths are shown in Figure 15 (due to limitations on space, the relevant pictures depicting 4 MPa strength are not displayed separately).
Paste filling mining was adopted. With the advance in the working face, the stress of the coal wall behind the working face was released due to the existence of the filling body, and therefore it became a low-stress area. As shown in Figure 16a and Figure 17, the small stress in front of the working face was concentrated in the next filling step, so that the stress was released. In this cycle, there was no stress concentration for the whole mining process of the working face, and the maximum vertical stress in front of the working face was 12.5 MPa, as shown in Figure 16b. Under the same conditions, the maximum vertical stress of the caving mining method was 21.6 MPa. Compared with caving mining, the filling body effectively reduced the overload stress and transferred stress concentration. During the filling mining method, the goaf was filled with filling materials, and the filling body occupied the goaf. After full compaction, the filling material restored the bearing capacity, limited the roof subsidence, effectively controls the movement of the overlying strata, and reduced the surface subsidence [29]. The overburden displacement, subsidence and stress of the 4 MPa strength backfill were slightly lower than that of the 3 MPa backfill, but this was not significant.
The failure range of the surrounding rock in the backfill mining method was smaller than that of the longwall caving method. The observed failure distribution of the plastic zone in the surrounding rock after mining with the 3 MPa filling bodies is shown in Figure 18. When the backfill strength was 3 MPa, the floor failure depth and the failure range in front of the working face were 7 m and 10 m. When the strength of the filling body was too high, the filling cost was higher. Therefore, the strength of the filling body in mining area 32 of Liangbei mine was 3 MPa, while the effective waterproof layer thickness was 53 m. The water inrush coefficient T was 0.094 MPa less than Ts, ensuring the safe mining of the working face.

5. Engineering Case Analysis

According to the paste filling experience, the filling rate is usually 80%. Therefore, the filling rate of this working face was calculated as 80%, and the equivalent mining thickness was 1.2 m. Based on the comprehensive analysis of the data from the mine surface movement observation station, the surface movement parameters of the paste filling mining method were as follows: subsidence factor q = 0.18; tangent of major influence angle tan β = 2; angle of maximum θ = 87.3°; displacement factor b = 0.29.
Table 3 and Figure 19 show that the predicted maximum subsidence value, maximum inclined deformation value, and maximum horizontal deformation value of the surface after the filling mining of the working face were consistent with the measured values. All the values were within the allowable surface deformation values of brick–concrete structures and followed the guidelines for coal pillar retention and the coal pressing mining of buildings, water bodies, railways, main shafts, and roadways. This indicates that past backfilling mining guaranteed the safe mining of working face and protected the surface buildings.

6. Conclusions

The paste backfilling technology proposed in this paper is of great practical significance for mining coal in areas where there is confined water under surface buildings. The method for determining the filling rate and filling strength can control floor water and protect surface buildings with greater efficacy than traditional methods. Our specific conclusions are as follows:
(1)
The characteristics of floor water inrush at the working face 32,021 of the Liangbei coal mine were studied under different caving and filling methods. The water inrush coefficient of the caving method was greater than the regional critical water inrush coefficient, which is dangerous for water inrush. In contrast, the filling method coefficient was less than the critical water inrush coefficient. The relationship between the water inrush coefficient and the filling rate was established. The floor’s failure depth and the water inrush coefficient of the filling method were significantly reduced, compared with the longwall caving method. Thereby, this can ensure the safe mining of the working face. The minimum filling rate to ensure the safe mining of the working face was given;
(2)
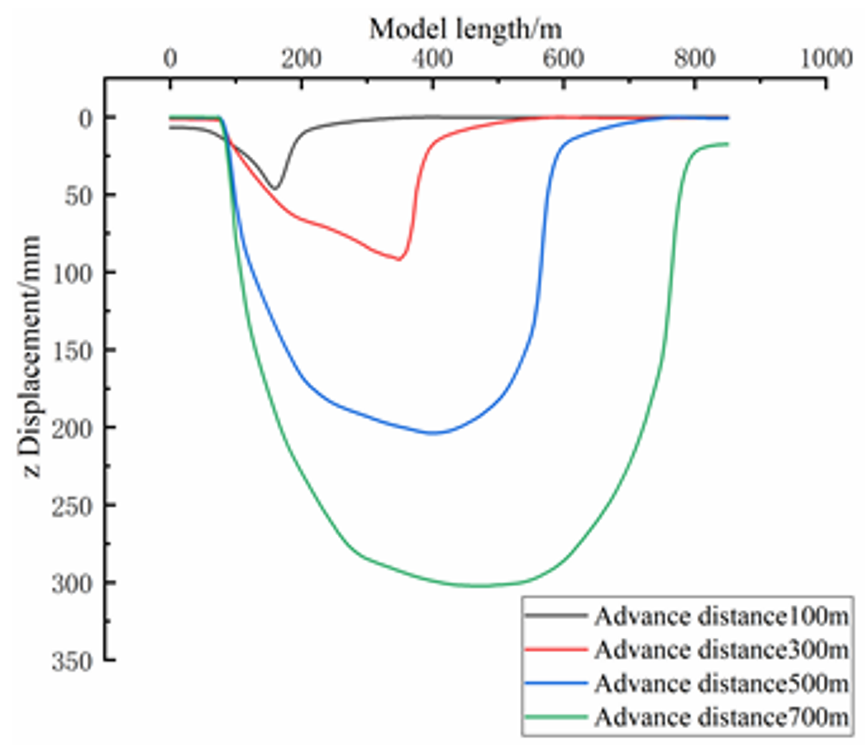
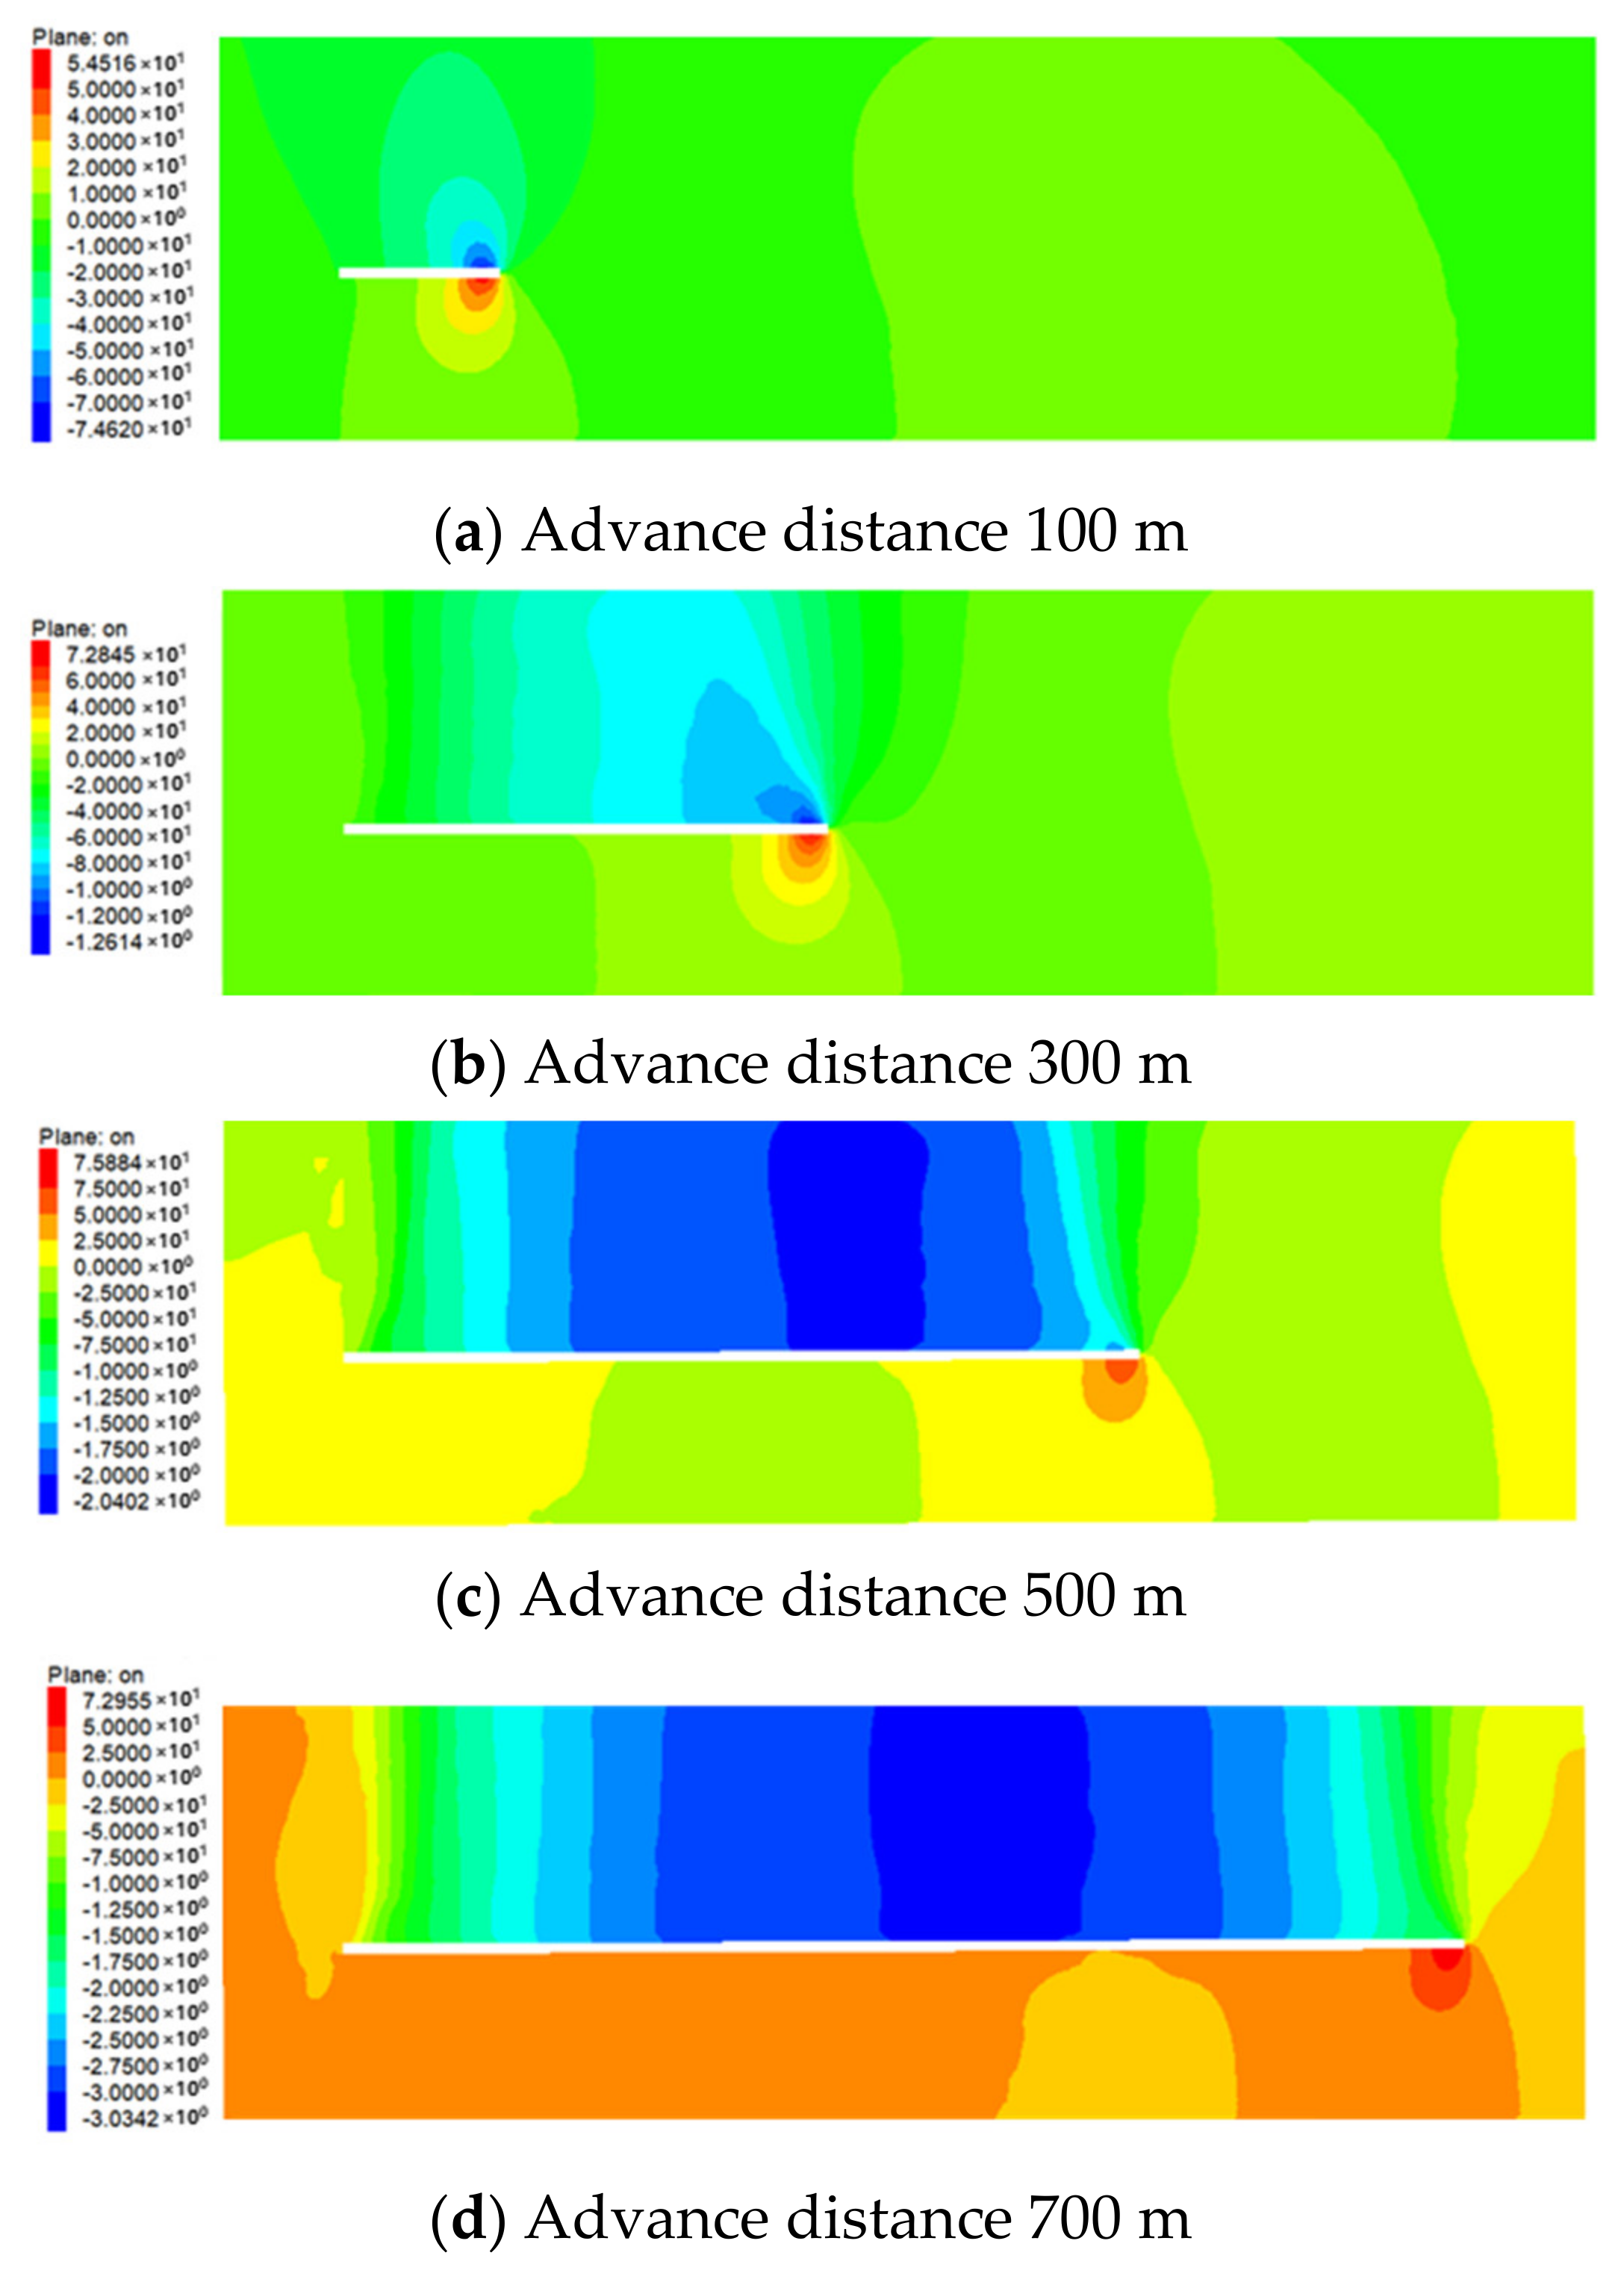
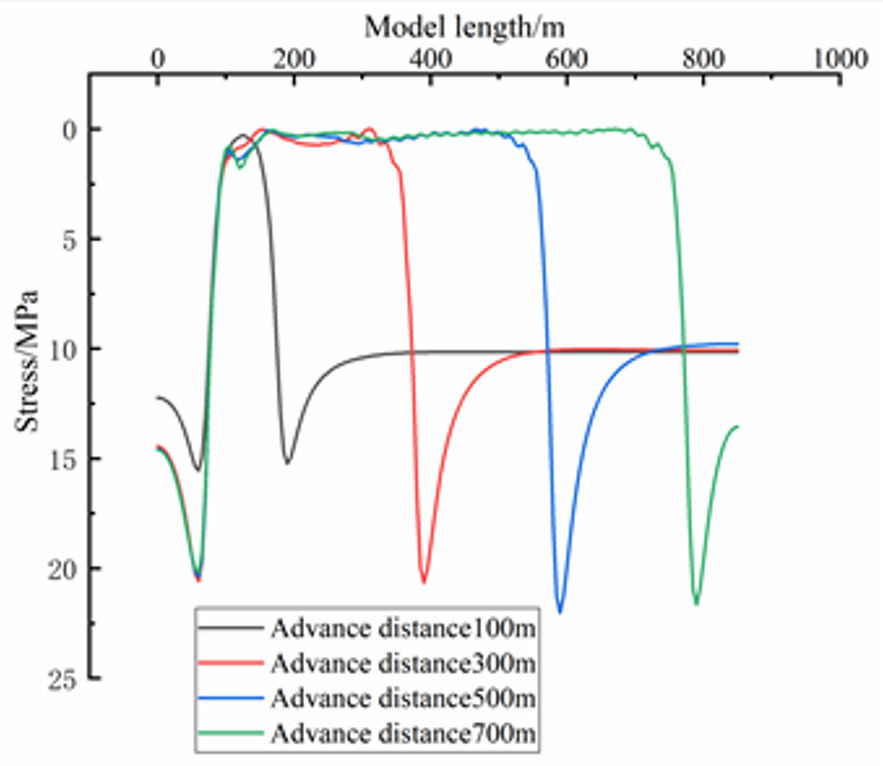
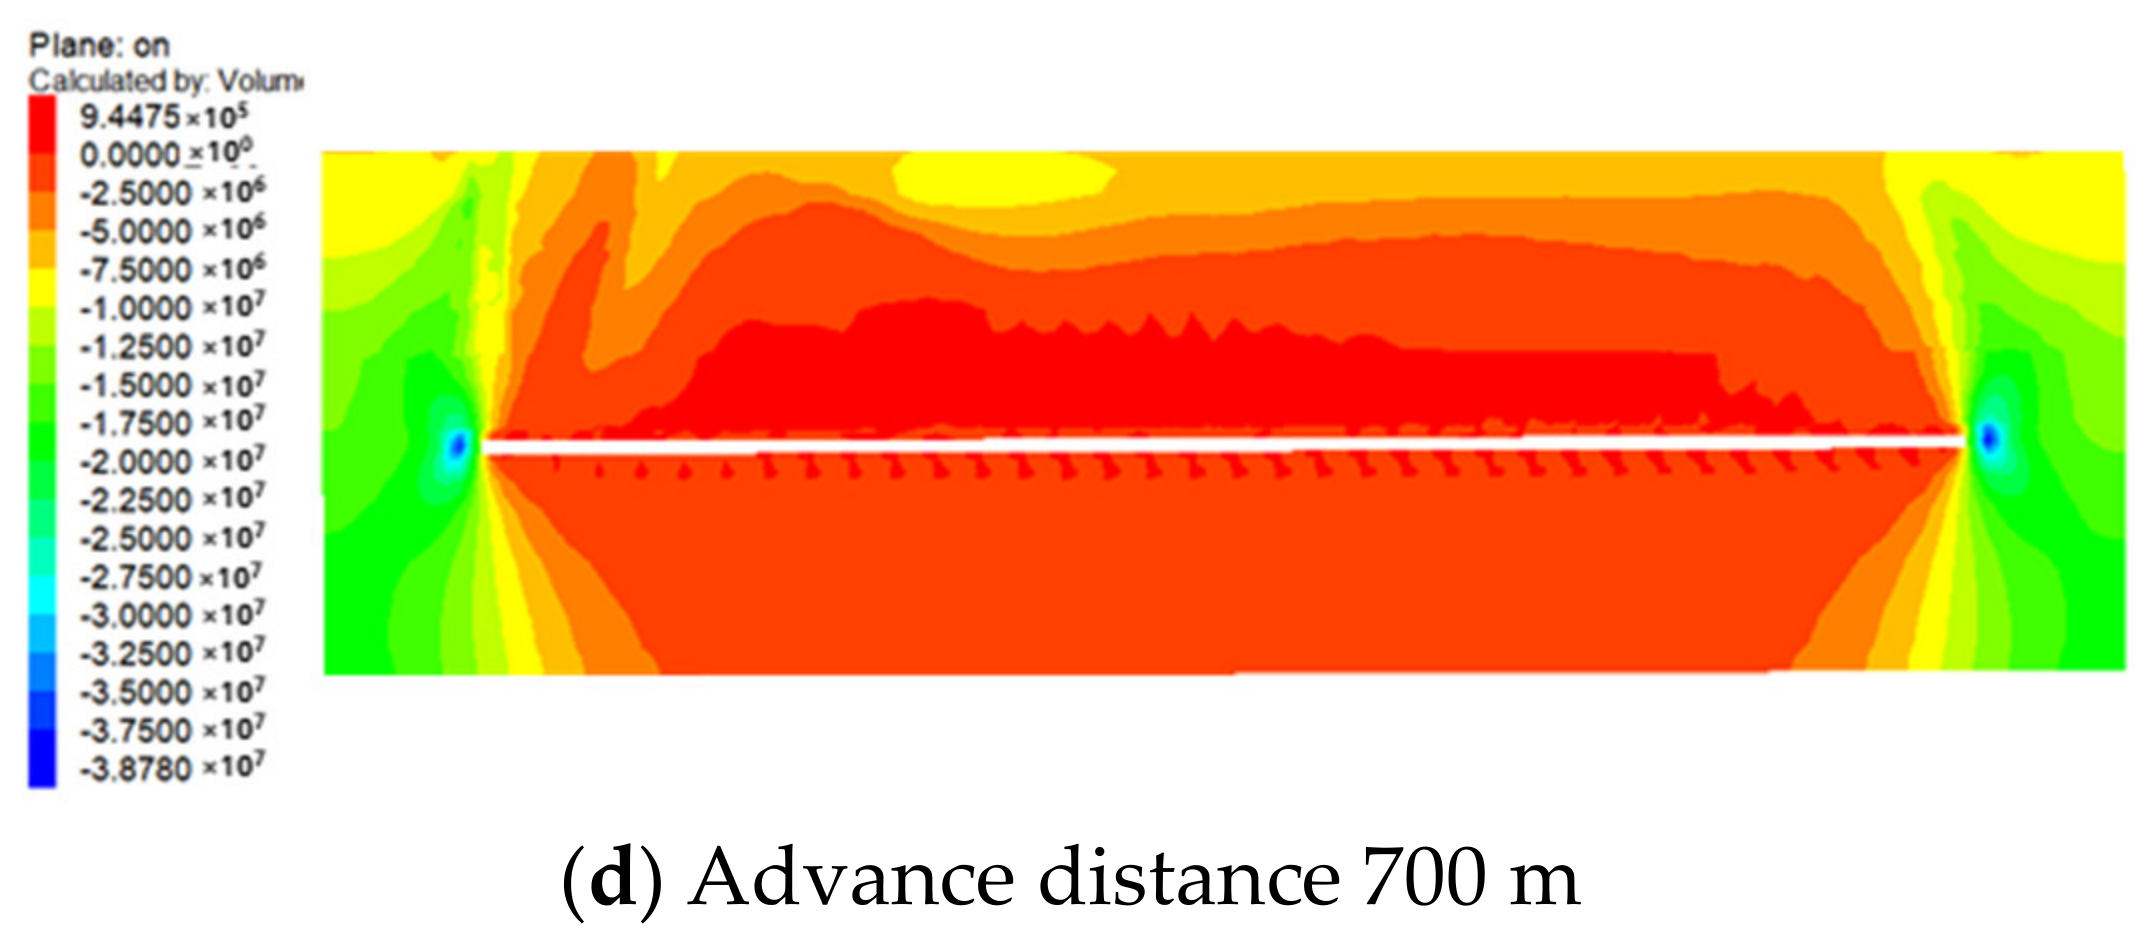
The longwall caving mining method had the risk of water inrush. Many strata and cracks appeared in the roof of the working face. During working face propulsion, stepped dislocation connected with fracture zone advancement occurs, which influences the surface. Under the conditions of filling mining, the failure depth of the working face floor, the width of the plastic zone, the displacement subsidence value of the overburden, and the vertical stress values were greater. Moreover, the wall caving mining was significantly reduced, which was negatively correlated with the strength of the filling body. Backfill effectively reduced overburden stress and transferred stress concentration. Through comparative analysis, it was determined that the strength of the filling body was 3 MPa;
(3)
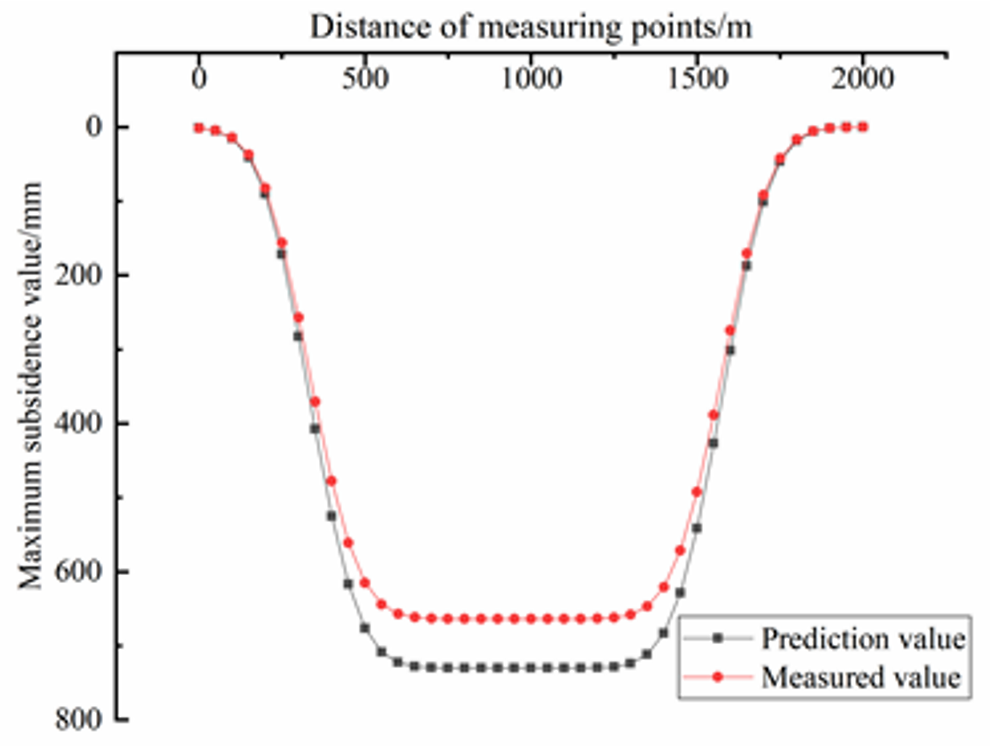
The maximum values of horizontal deformation, tilt deformation, and subsidence were 1.1 mm/m, 2.5 mm/m, and 730 m, respectively. These values were within the allowable deformation range of the building and were consistent with the measured results from the surface; therefore, these can be used to protect surface buildings.

Author Contributions

Conceptualization, P.W., W.G. and Y.T.; methodology, W.G. and E.B.; validation, P.W., W.G. and E.B.; formal analysis, P.W. and W.Y.; investigation, P.W., Y.T., Z.M. and D.W.; data curation, P.W. and Z.M.; writing—original draft preparation, P.W., Z.M. and D.W.; writing—review and editing, P.W., W.G., Y.T. and E.B.; supervision, W.G. All authors have read and agreed to the published version of the manuscript.

Funding

This research was funded by Key Project of the National Natural Science Foundation of China (U21A20108, U1810203), National Natural Science Foundation of China (52104127, 52174108, 51974105), Henan Science and Technology Research Project (212102310399,222102320058), Project of Science and Technology Innovation Leading Talent in Central Plains (24200510012), Henan Excellent Youth Science Foundation (222300420045), Sponsored by Program for Science & Technology Innovation Talents in Universities of Henan Province(21HASTIT024), Scientific and technological innovation research team of Henan Polytechnic University (T2021-5), Key Scientific Research Projects of Colleges and Universities in Henan Province (21A440003) and Research fund of Henan Key Laboratory for Green and Efficient Mining & Comprehensive Utilization of Mineral Resources (Henan Polytechnic University) (KCF202002).

Data Availability Statement

The data used to support the findings of this study are included within the article.

Acknowledgments

This research was financially supported by the Key Project of the National Natural Science Foundation of China (U21A20108, U1810203), National Natural Science Foundation of China (52104127, 52174108, 51974105), Henan Science and Technology Research Project (212102310399, 222102320058), Project of Science and Technology Innovation Leading Talent in Central Plains (24200510012), Henan Excellent Youth Science Foundation (222300420045), Sponsored by Program for Science & Technology Innovation Talents in Universities of Henan Province (21HASTIT024), Scientific and technological innovation research team of Henan Polytechnic University (T2021-5), Key Scientific Research Projects of Colleges and Universities in Henan Province (21A440003) and Research fund of Henan Key Laboratory for Green and Efficient Mining & Comprehensive Utilization of Mineral Resources (Henan Polytechnic University) (KCF202002). The authors thank the anonymous reviewers for their careful work and thoughtful suggestions that have helped improve this paper substantially.

Conflicts of Interest

The authors declare no conflict of interest.

References

  1. Xu, J.L.; Xuan, D.Y.; Zhu, W.B.; Wang, X. Partial backfilling coal mining technology based on key strata control. J. Min. Strata Control Eng. 2019, 1, 69–76. [Google Scholar]
  2. Lu, H.F.; Yao, D.X.; Hu, Y.B.; Sun, J. Elasticity solution for failure depth of mining floor under water pressure. J. Min. Saf. Eng. 2017, 34, 452–458. [Google Scholar]
  3. Luo, L.P.; Peng, S.P. Mechanism study on water-inrush hazard of floor strata in mining on confined aquifer. J. China Coal Soc. 2005, 30, 459–462. [Google Scholar]
  4. Gui, H.R.; Lin, M.L. Types of water hazards in China coalmines and regional characteristics. Nat. Hazards 2016, 84, 1501–1512. [Google Scholar] [CrossRef]
  5. Li, X.S.; Yang, W.B.; Wang, Y.M.; Nie, W.; Liu, Z.F. Macro-micro response characteristics of surrounding rock and overlying strata towards the transition from open pit to underground mining. Geofluids 2021, 2021, 5582218. [Google Scholar] [CrossRef]
  6. Guo, W.B.; Zhao, G.B.; Bai, E.H.; Guo, M.; Wang, Y. Effect of overburden bending deformation and alluvium mechanical parameters on surface subsidence due to longwall mining. Bull. Eng. Geol. Environ. 2021, 80, 2751–2764. [Google Scholar] [CrossRef]
  7. Zhou, H.Q.; Hou, C.J.; Sun, X.K.; Qu, Q.; Chen, D. Solid waste paste filling for None-Village-Relocation coal mining. J. China Univ. Min. Technol. 2004, 33, 30–34. [Google Scholar]
  8. Ma, D.; Kong, S.B.; Li, Z.H.; Zhang, Q.; Wang, Z.H.; Zhou, Z.L. Effect of wetting drying cycle on hydraulic and mechanical properties of cemented paste backfill of the recycled solid wastes. Chemosphere 2021, 280, 131163. [Google Scholar] [CrossRef]
  9. Ke, X.; Zhou, X.; Wang, X.S.; Wang, T.; Hou, H.B.; Zhou, M. Effect of tailings fineness on the pore structure development of cemented paste backfill. Constr. Build. Mater. 2016, 126, 345–350. [Google Scholar] [CrossRef]
  10. Li, M.; Zhang, J.X.; Huang, Y.L.; Zhou, N. Effects of particle size of crushed gangue backfill materials on surface subsidence and its application under buildings. Environ. Earth Sci. 2017, 76, 603. [Google Scholar] [CrossRef]
  11. Jirina, T.; Jan, S. Reduction of surface subsidence risk by fly ash exploitation as filling material in deep mining areas. Nat. Hazards. 2010, 53, 251–258. [Google Scholar] [CrossRef]
  12. Bai, E.H.; Guo, W.B.; Tan, Y.; Huang, G.S.; Guo, M.J.; Ma, Z.B. Roadway backfill mining with super-high-water material to protect surface buildings: A case study. Appl. Sci. 2020, 10, 107. [Google Scholar] [CrossRef] [Green Version]
  13. Wang, X.F.; Zhang, D.S.; Sun, C.D.; Wang, Y. Surface subsidence control during bag filling mining of super high-water content material in the Handan mining area. Int. J. Oil Gas Coal Technol. 2016, 13, 87–102. [Google Scholar] [CrossRef]
  14. Doherty, J.P.; Hasan, A.; Suazo, G.H.; Fourie, A. Investigation of some controllable factors that impact the stress state in cemented paste backfill. Can. Geotech. J. 2015, 52, 1901–1912. [Google Scholar] [CrossRef]
  15. Behera, S.K.; Mishra, D.P.; Singh, P.; Mishra, K.; Mandal, S.K.; Ghosh, C.N.; Kumar, R.; Mandal, P.K. Utilization of mill tailings, fly ash and slag as mine paste backfill material: Review and future perspective. Constr. Build. Mater. 2021, 309, 125120. [Google Scholar] [CrossRef]
  16. Jafari, M.; Grabinsky, M. Effect of hydration on failure surface evolution of low sulfide content cemented paste backfill. Int. J. Rock Mech. Min. Sci. 2021, 144, 104749. [Google Scholar] [CrossRef]
  17. Jafari, M.; Shahsavari, M.; Grabinsky, M. Experimental study of the behavior of cemented paste backfill under high isotropic compression. J. Geotech. Geoenviron. Eng. 2020, 146, 06020019. [Google Scholar] [CrossRef]
  18. Chang, Q.L.; Sun, X.K.; Dong, X.J.; Shao, S. Stability analysis of cemented paste backfill false roof in highwall mining: A case study. Desalin. Water Treat. 2021, 219, 96–102. [Google Scholar] [CrossRef]
  19. Fall, M.; Adrien, D.; Celestin, J.C.; Pokharel, M.; Toure, M. Saturated hydraulic conductivity of cemented paste backfill. Miner. Eng. 2009, 22, 1307–1317. [Google Scholar] [CrossRef]
  20. Chen, S.J.; Du, Z.W.; Zhang, Z.; Zhang, H.; Xia, Z.; Feng, F. Effects of chloride on the early mechanical properties and microstructure of gangue-cemented paste backfill. Constr. Build. Mater. 2020, 235, 117504. [Google Scholar] [CrossRef]
  21. Liu, S.L.; Liu, W.T.; Shen, J.J. Stress evolution law and failure characteristics of mining floor rock mass above confined water. KSCE J. Civ. Eng. 2017, 21, 2665–2672. [Google Scholar] [CrossRef]
  22. Sun, J.; Hu, Y.; Zhao, G.M. Relationship between water inrush from coal seam floors and main roof weighting. Int. J. Min. Sci. Technol. 2017, 27, 873–881. [Google Scholar] [CrossRef]
  23. Wu, Q.; Liu, Y.Z.; Liu, D.H. Prediction of floor water inrush: The application of GIS-Based AHP Vulnerable Index method to Donghuantuo coal mine, China. Rock Mech. Rock Eng. 2011, 44, 591–600. [Google Scholar] [CrossRef]
  24. Zhu, S.Y.; Jiang, Z.Q.; Zhou, K.J.; Peng, G.; Yang, C. The characteristics of deformation and failure of coal seam floor due to mining in Xinmi coal field in China. Bull. Eng. Geol. Environ. 2014, 73, 1151–1163. [Google Scholar] [CrossRef]
  25. Yin, H.C.; Xu, B.; Yin, S.X.; Tian, W.; Yao, H.; Meng, H. Prevention of water inrushes in deep coal mining over the Ordovician aquifer: A case study in the Wutongzhuang Coal Mine of China. Geofluids 2021, 2021, 5208670. [Google Scholar] [CrossRef]
  26. Song, W.C.; Liang, Z.Z. Theoretical and numerical investigations on mining-induced fault activation and groundwater outburst of coal seam floor. Bull. Eng. Geol. Environ. 2021, 80, 5757–5768. [Google Scholar] [CrossRef]
  27. Zhang, J.C. Investigations of water inrushes from aquifers under coal seams. Int. J. Rock Mech. Min. Sci. 2005, 42, 350–360. [Google Scholar] [CrossRef]
  28. Yin, S.X.; Zhang, J.C.; Liu, D.M. A study of mine water inrushes by measurements of in situ stress and rock failures. Nat. Hazards 2015, 79, 1961–1979. [Google Scholar] [CrossRef]
  29. Wang, J.; Fu, J.X.; Song, W.D.; Zhang, Y.F. Viscosity and strength properties of cemented tailings backfill with fly ash and its strength predicted. Minerals 2021, 11, 78. [Google Scholar] [CrossRef]
Figure 1. Column of some rock strata in the drilling face.
Minerals 12 00470 g001
Figure 2. Schematic diagram of the working face location.
Minerals 12 00470 g002
Figure 3. Boundary model diagram of surrounding rock stress and plastic zone.
Minerals 12 00470 g003
Figure 4. The equilibrium stress model. M, The cell cube. m, Thickness of coal seam. Cm, Cohesion of rock mass.
Minerals 12 00470 g004
Figure 5. Numerical calculation model diagram.
Minerals 12 00470 g005
Figure 6. Displacement curve of different mining distances in caving mining.
Minerals 12 00470 g006
Figure 7. Displacement cloud map of different mining distances in caving mining.
Minerals 12 00470 g007
Figure 8. Vertical stress curve of different mining distances in caving mining.
Minerals 12 00470 g008
Figure 9. Vertical stress cloud map of different mining distances in caving mining.
Minerals 12 00470 g009aMinerals 12 00470 g009b
Figure 10. Nephogram of plastic zone change at different mining distances in caving mining.
Minerals 12 00470 g010
Figure 11. Fracture evolution diagram of overburden and surface physical simulation experiment.
Minerals 12 00470 g011aMinerals 12 00470 g011b
Figure 12. Comparison of field and model stepped fracture.
Minerals 12 00470 g012
Figure 13. Equivalent mining height model diagram of paste filling.
Minerals 12 00470 g013
Figure 14. Displacement curve under different conditions. (a) Displacement curve of different filling strengths, (b) Comparison of displacement curves between the caving method and the filling method.
Minerals 12 00470 g014
Figure 15. Displacement cloud map of different mining distances in filling mining.
Minerals 12 00470 g015
Figure 16. Vertical stress curve under different conditions. (a) Vertical stress curve of different filling strengths, (b) Comparison of vertical stress curves between the caving method and the filling method.
Minerals 12 00470 g016
Figure 17. Vertical stress of coal seam floor monitoring line with different backfill strengths.
Minerals 12 00470 g017
Figure 18. Nephogram of plastic zone change at different mining distances in filling mining.
Minerals 12 00470 g018aMinerals 12 00470 g018b
Figure 19. Predicted and measured curves of surface subsidence.
Minerals 12 00470 g019
Table 1. Rock physical parameters of the numerical simulation.
StratumThickness
(m)
Density
(kg/m3)
Bulk Modulus
(GPa)
Shear Modulus
(GPa)
Cohesive Force
(MPa)
Frictional Angle
(°)
Tensile Strength
(MPa)
Siltstone426001.560.392.3532.13.9
Mudstone3026003.10.92.5404.2
Siltstone1126001.560.392.3532.13.9
Sandy mudstone1125000.90.311.8332.92
Siltstone626001.560.392.3532.13.9
Sandy mudstone825000.90.311.8332.92
Post stone1126001.520.32.335.12.92
Sandy mudstone525000.90.311.8332.92
Siltstone1826001.560.392.3532.13.9
Sandy mudstone325000.90.311.8332.92
medium sandstone3126001.550.352.35343.4
Sandy mudstone625000.90.311.8332.92
2-1#coal615001.50.42150.8
Siltstone726001.560.392.3532.13.9
Mudstone226003.10.92.5404.2
Post stone326001.520.32.335.12.92
Medium sandstone1326001.550.352.35343.4
Mudstone2426003.10.92.5404.2
Siltstone1126001.560.392.3532.13.9
Limestone4027203.221.122.56334.16
Table 2. Similar simulation material ratio and model mechanical parameters.
StratumThickness
(m)
Density
(kg/m3)
Bulk Modulus
(GPa)
Shear Modulus
(GPa)
Cohesive Force
(MPa)
Frictional Angle
(°)
Tensile Strength
(MPa)
The clay11725001.510.331.7832.53.3
Mudstone726003.10.92.5404.2
Post stone1726001.520.32.335.12.92
Mudstone926003.10.92.5404.2
Sandy mudstone2425000.90.311.8332.92
Siltstone726001.560.392.3532.13.9
Sandy mudstone2725000.90.311.8332.92
Medium sandstone1026001.550.352.35343.4
Sandy mudstone2425000.90.311.8332.92
Medium sandstone826001.550.352.35343.4
Siltstone826001.560.392.3532.13.9
Medium sandstone626001.550.352.35343.4
Sandy mudstone3025000.90.311.8332.92
Siltstone426001.560.392.3532.13.9
Medium sandstone426001.550.352.35343.4
Sandy mudstone1025000.90.311.8332.92
Siltstone526001.560.392.3532.13.9
Mudstone3026003.10.92.5404.2
Siltstone1126001.560.392.3532.13.9
Sandy mudstone1125000.90.311.8332.92
Siltstone626001.560.392.3532.13.9
Sandy mudstone825000.90.311.8332.92
Post stone1126001.520.32.335.12.92
Sandy mudstone525000.90.311.8332.92
Siltstone1826001.560.392.3532.13.9
Sandy mudstone325000.90.311.8332.92
Medium sandstone3126001.550.352.35343.4
Sandy mudstone625000.90.311.8332.92
2-1#coal615001.50.42150.8
Siltstone726001.560.392.3532.13.9
Table 3. Surface subsidence values.
Maximum Subsidence Value
(mm)
Maximum Dip Deformation
(mm/m)
Maximum Horizontal Deformation (mm/m)
Predicted value7302.51.1
Measured value6082.10.9
Publisher’s Note: MDPI stays neutral with regard to jurisdictional claims in published maps and institutional affiliations.

