Review

Some Remarks on the Electrical Conductivity of Hydrous Silicate Minerals in the Earth Crust, Upper Mantle and Subduction Zone at High Temperatures and High Pressures

1
Key Laboratory of High-Temperature and High-Pressure Study of the Earth’s Interior, Institute of Geochemistry, Chinese Academy of Sciences, Guiyang 550081, China
2
Institute of Atomic and Molecular Physics, Sichuan University, Chengdu 610065, China
3
College of Material Science and Engineering, Guizhou Minzu University, Guiyang 550025, China
4
Center for High Pressure Science and Technology Advanced Research, Beijing 100094, China
5
Department of Earth and Space Sciences, Southern University of Science and Technology, Shenzhen 518055, China
6
Centre for High Pressure Research, School of Physics, Bharathidasan University, Tiruchirappalli 620024, India
*
Authors to whom correspondence should be addressed.
Minerals 2022, 12(2), 161; https://doi.org/10.3390/min12020161
Submission received: 30 December 2021 / Revised: 21 January 2022 / Accepted: 26 January 2022 / Published: 28 January 2022
(This article belongs to the Special Issue High-Pressure Physical and Chemical Behaviors of Minerals and Rocks)

Abstract

:
As a dominant water carrier, hydrous silicate minerals and rocks are widespread throughout the representative regions of the mid-lower crust, upper mantle, and subduction zone of the deep Earth interior. Owing to the high sensitivity of electrical conductivity on the variation of water content, high-pressure laboratory-based electrical characterizations for hydrous silicate minerals and rocks have been paid more attention to by many researchers. With the improvement and development of experimental technique and measurement method for electrical conductivity, there are many related results to be reported on the electrical conductivity of hydrous silicate minerals and rocks at high-temperature and high-pressure conditions in the last several years. In this review paper, we concentrated on some recently reported electrical conductivity results for four typical hydrous silicate minerals (e.g., hydrous Ti-bearing olivine, epidote, amphibole, and kaolinite) investigated by the multi-anvil press and diamond anvil cell under conditions of high temperatures and pressures. Particularly, four potential influence factors including titanium-bearing content, dehydration effect, oxidation−dehydrogenation effect, and structural phase transition on the high-pressure electrical conductivity of these hydrous silicate minerals are deeply explored. Finally, some comprehensive remarks on the possible future research aspects are discussed in detail.

1. Introduction

As an important volatile matter, water is widely exists in the mid-lower crust, upper mantle, and subduction zone of the deep Earth interior, which is present as two main species in the water-bearing silicate minerals: (i) molecular water (H2O) and structural hydroxyl (OH) [1]. For the existence of water as molecular water (H2O), some typical minerals (e.g., chlorite, epidote, amphibole, kaolinite, et al.) are included, which are crucial to affect the water circulation in these regions of mid-lower crust, upper mantle, and subduction zones. As for some nominally anhydrous minerals (NAMs) (e.g., feldspar, quartz, olivine, clinopyroxene, orthopyroxene, garnet, wadsleyite, ringwoodite), most of them belong to a type of crucial silicate rock-forming minerals of the Earth’s interior, in which the existence of water is as a form of the point defect of structural hydroxyl (OH) in the hydrous minerals. As usual, it is well known that the hydrous minerals and rocks are the major carrier of water in the subducted geotectonic environment and NAMs can carry trace amounts of water into the deep uppermost mantle. Since the first theoretical calculations of electrical conductivity on hydrous olivine from Karato (1990) based on the proton diffusion of Nernst–Einstein equation, there are a large quantity of electrical conductivity results to be reported from the laboratory-based electrical conductivity experiments, theoretical calculations of molecular dynamics, and filed geophysical observation of magnetotellurics (or electromagnetic depth soundings) [2,3,4,5,6,7,8]. Furthermore, by virtue of these acquired high-pressure laboratory-based conductivity results, we can extrapolate the water content, distribution state, storage form, and migration mechanism of water in the deep Earth interior.
Recently, some available research found that the presence of water, either the trace molecular water (H2O) or the structural hydroxyl (OH) in hydrous mineral, plays a crucial role in many pressure-dependent physicochemical properties and their corresponding transport processes of deep Earth interior, such as electrical conductivity [9,10], elastic wave dispersion and its attenuation [11,12], grain–growth kinetics [13,14], elemental diffusion coefficient [15,16], dislocation creep [17,18], and dynamic recrystallization [19,20]. Whereas, the electrical conductivity of hydrous silicate minerals and rocks are highly sensitive to temperature, pressure, oxygen fugacity, crystallographic anisotropy, water-bearing content, dehydration effect, iron content, trace element of titanium-bearing content, oxidation–dehydrogenation effect, structural phase transition, etc. As pointed out by Karato (1990) [2], Huang et al. (2005a, b; 2017) [21,22,23], Wang et al. (2006) [24], Dai and Karato (2009a, b, c; 2014a, b, c, d; 2020) [25,26,27,28,29,30,31], Karato and Dai (2009) [32], Hu et al. (2017, 2018) [33,34], Dai et al. (2020) [35], and He et al. (2021) [36], water content is one of most important influential factor on the electrical properties of minerals and rocks at high-temperature and high-pressure conditions. Water can enhance several orders of magnitude in the electrical conductivity of hydrous minerals and rocks, and its effect is substantial.
With the improvement and development of high-pressure experimental techniques and measurement methods for electrical conductivity, more and more conductivity results were obtained in order to systematically investigate the mineralogical composition, the electrical conductivity—depth profile, and discontinuity of cycle-layered structure of Earth interior in the globally and regionally geotectonic units. In the last several decades, the electrical conductivity of hydrous minerals and rocks have been performed by virtue of electrochemical alternating current (AC) impedance spectroscopy using all of these available high-pressure pieces of equipment, including autoclave, piston-cylinder, multi-anvil press, and diamond anvil cell. In this work, we focused some of the most recent developments in electrical conductivity of hydrous minerals in the multi-anvil press and diamond anvil cell. In this review paper, some potential influence ingredients from the titanium-bearing content, dehydration effect, oxidation−dehydrogenation effect, and structural phase transition on the electrical conductivity of hydrous minerals are discussed in detail.

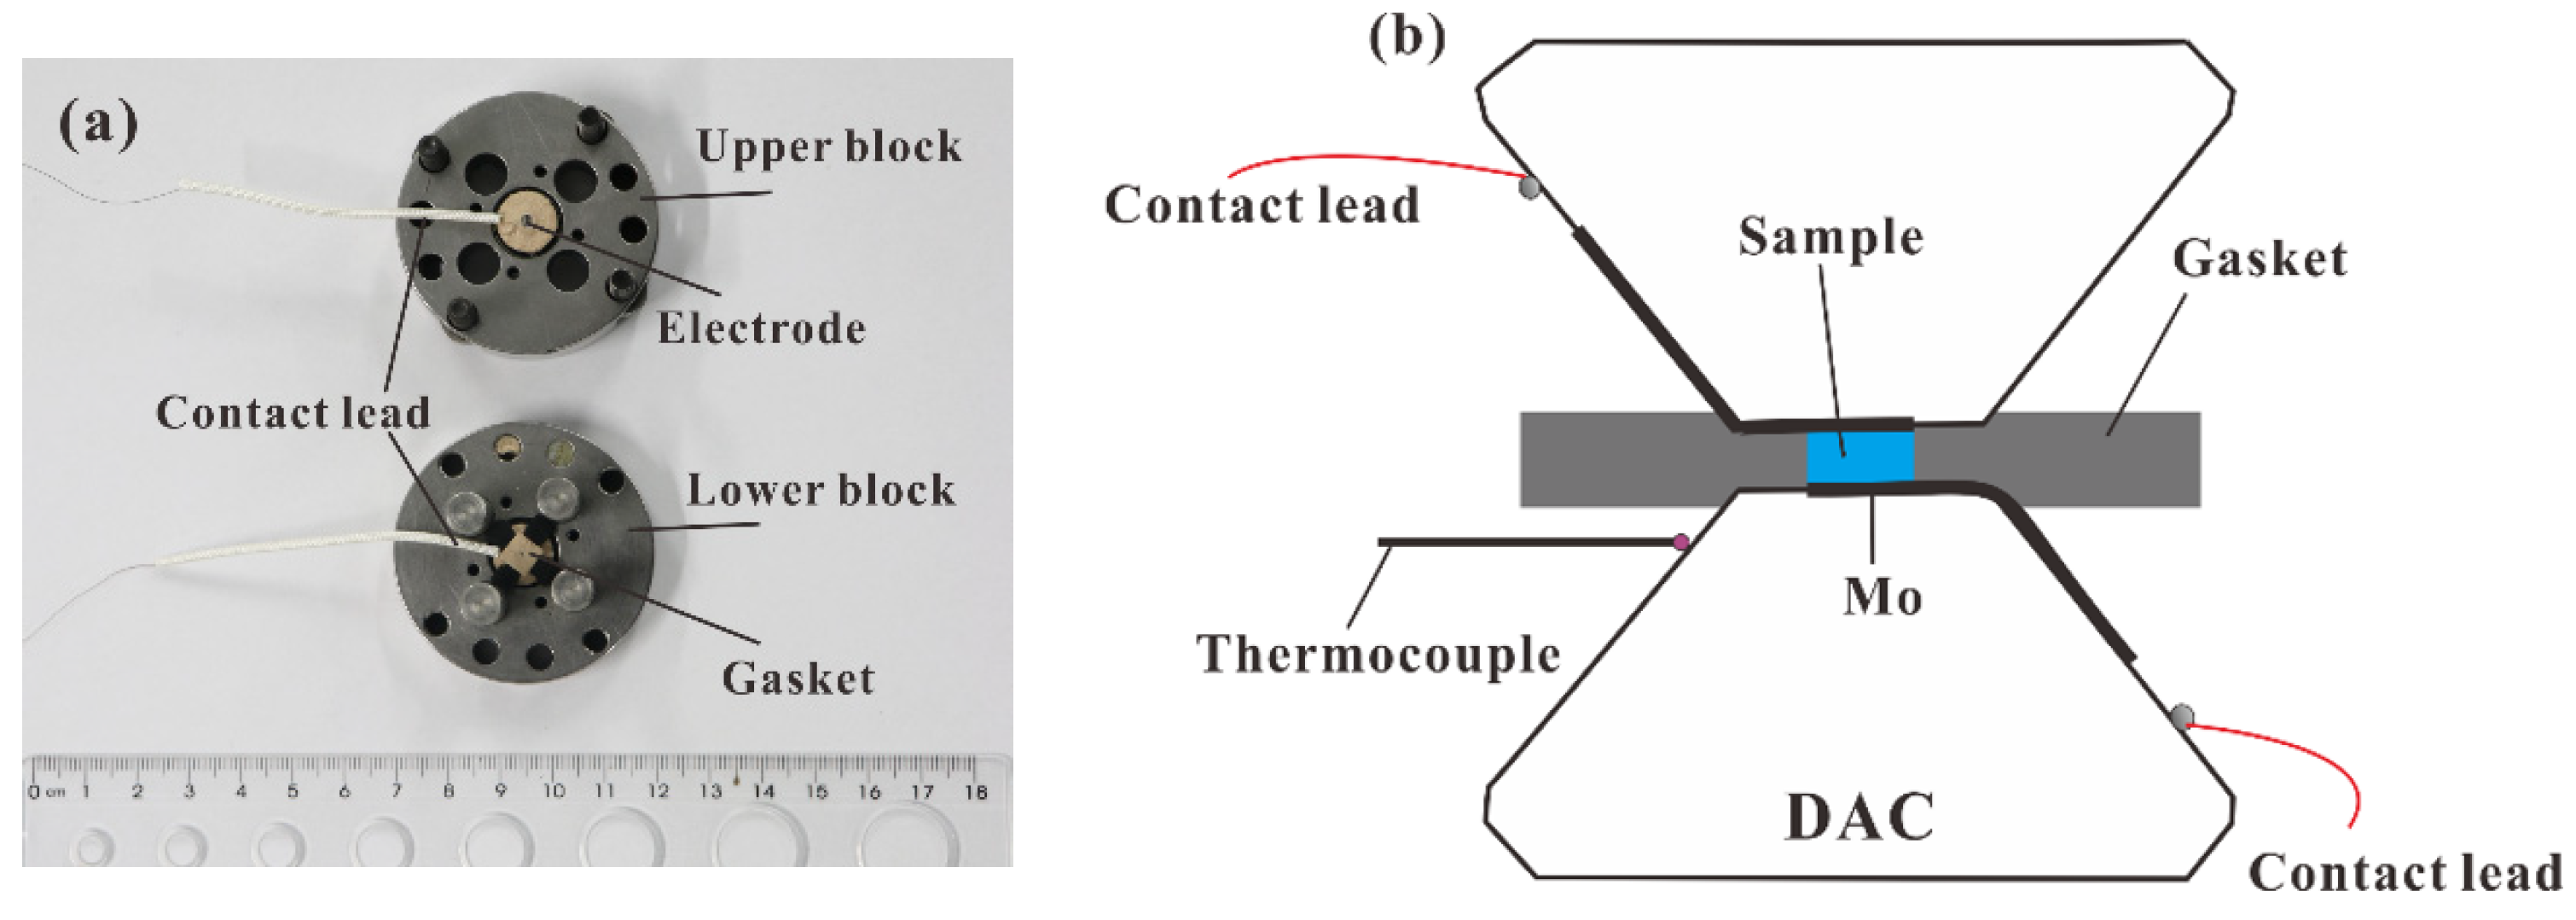
2. High-Pressure Apparatus for the EC Measurements and FT-IR Observation

In the last several decades, in order to realize the electrical conductivity measurements of hydrous minerals and rocks at HP-HT conditions, many researchers have already designed and developed their high-pressure experimental platforms, such as autoclave, piston-cylinder, multi-anvil press, and diamond anvil cell.
Recently, Shan et al. (2021) from the Key Laboratory of High-Temperature and High-Pressure Study of the Earth’s Interior (HTHPSEI), Institute of Geochemistry, Chinese Academy of Sciences, successfully designed and developed one new high-pressure experimental platform for the measurement of electrical conductivity for water-bearing porous rocks using autoclave, which can be widely applied to a shallow Earth crustal environments under conditions of high temperature, high pressure, and controlling the liquid water saturation [37]. In order to test its accuracy and precision, the electrical conductivity of water-bearing sandstone were performed under controlled temperature ranges from 303 to 423 K and the fixed saturation degree ranges from 36 to 100% in the liquid water at 2.0 MPa. Shan et al. (2021) found that the electrical characterization technique under the relatively lower-temperature and lower-pressure conditions is widely applicable to a series of high porosity-containing hydrous rocks in the geothermal/oil research.
Early in 2009, Dai and his collaborators have already set up one high-pressure platform of high-pressure electrical conductivity measurement in order to check the influence of oxygen fugacity on the grain boundary electrical conductivity of rocks using YJ-3000t multi-anvil high-pressure apparatus in HTHPSEI, at the Institute of Geochemistry, Chinese Academy of Sciences [38]. In their designed experimental method, as an example of dry peridotite, the grain interior, grain boundary, and total electrical conductivities for dry synthetic peridotite were performed by virtue of the electrochemical AC impedance spectroscopy technique at high temperature, high pressure, and controlled oxygen fugacities. To efficiently adjust and control the oxygen fugacity during the process of electrical conductivity measurements in the sample chamber, five typical solid buffers were employed, i.e., Fe3O4 + Fe2O3, Ni + NiO, Fe + Fe3O4, Fe + FeO, and Mo + MoO2. With the rise of oxygen fugacity, the grain boundary electrical conductivity of dry peridotite will increase, accordingly. Further, the functional relationship between the grain boundary electrical conductivity of dry peridotite and oxygen fugacity was successfully established under conditions of fixed pressure of 2.0 GPa and temperature of 1173 K. One detailed experimental measurement platform was displayed in Figure 1, which is adopted to measure the electrical conductivity of minerals and rocks in HTHPSEI, conducted at the Institute of Geochemistry, Chinese Academy of Sciences, in HP-HT conditions. For this representative conductivity measurement platform, there are three dominant pieces of equipment to be used. The high-temperature and high-pressure environments were realized by the YJ-3000t multi-anvil press, as shown in Figure 1a. Figure 1b stands for our Solartron-1260 impedance/gain-phase analyzer, which is also in conjunction with Solartron-1296 impedance spectroscopy analyzer interface in order to enhance the measurement range of sample resistance up to 1012 Ohm. As usual, the variation of water content is checked for the initial and recovered samples before and after each electrical conductivity experiments, and thus, the Vertex-70V vacuum high-resolution and high-precision Fourier-transform infrared spectroscopy (FT-IR) analyzer will be employed to efficiently determine the trace structural water in minerals and rocks, as displayed in Figure 1c.
It is well known that many high-pressure mineral physiochemical properties for minerals and rocks are extremely sensitive to the variation of trace structural water at HP-HT conditions. To precisely check the water content in the sample, the high-resolution and high-precision FT-IR measurement is indispensable to outline it. During each electrical conductivity measurement, the FT-IR analysis is performed within the wide wavenumber ranging from 600 to 8000 cm−1. In this FT-IR measurement platform, it consists of two corresponding pieces of the vacuum Vertex-70V spectrometer and the high-resolution Hyperion-1000 infrared microscope. For each representative FT-IR measurement, the sample must be cut thinner and polished enough so as to assure enough of the transmitted light across the experimental sample. Thus, the thickness in the sample was determined according to the different transparency of each corresponding mineral, whose magnitude is also determined by the high-precision Olympus microscope. The water content of sample was acquired using the unpolarized radiation of mid-IR light source with the IR absorption mode. Then, the square of IR aperture is adjusted to the magnitude of 100 × 100 μm2, which is equipped with a high-performance infrared detector composed of a MCT (Mercury-Cadmium-Telluride) pseudobinary alloy semiconducting material. In the stage of the Hyperion-1000 infrared microscope, one circular slice of white and transparent calcium fluoride (CaF2) or potassium bromide (KBr) with its diameter of 5 cm and thickness of 1 mm was installed as the beam splitter in our IR measurement. In order to efficiently avoid the inevitable effect from the heterogeneity of water distribution in the sample, at least five sets of FT-IR spectra were gathered from different selected positions in each corresponding mineral surface, and then the water content is precisely determined according to the averaging value. For a selected total absorbance of OH groups between wavenumber ranges of 3000–3800 cm−1, each FT-IR spectroscopy of mineral was conducted at a predetermined 64, 128, 256, and 512 scans accumulated for each sample surface. Except for high-pressure electrical conductivity measurements, the ultrasonic elastic wave velocity and synchrotron X-ray diffraction of hydrous mineral are also determined the water content before and after high-temperature and high-pressure experiments, as illustrated in detail by Gwanmesia et al. (2020) for hydrous wadsleyite using our FT-IR experimental platform [39].
Figure 2 shows the representative FT-IR spectra for hot-pressed sintering polycrystalline olivine aggregates within the wavenumber range from 3000 to 3800 cm−1. According to the detailed calculating method of water content for hydrous olivine single crystals and hot-pressed sintering polycrystalline aggregates from Dai and Karato (2014a, b, c, d), some hydrogen-related defects are displayed at the wavenumber ranges from 3000 to 3750 cm−1 [28,29,30,31]. Therefore, the integration of FT-IR spectroscopy is conducted at a given wavenumber range, and the water content in the hot-pressed sintering polycrystalline olivine aggregates was determined using an equation proposed by Paterson (1982) [40],
C OH = B i 150 ξ K ( ν ) ( 3780 ν ) d ν
where, COH is the molar concentration of the OH group (its correspondent unit is the ppm wt% or H/106 Si of water), Bi is the density factor (4.39 × 104 cm H/106 Si), ξ is the orientation factor (In case of the hot-pressed sintering polycrystalline aggregates or rock sample, the value is assigned as 1/3; Whereas, in case of mineral single crystal sample, the value is assigned as 1/2), and K(ν) is the absorption coefficient in cm−1 at the wavenumber ν (cm−1). The integration was conducted over the wavenumber ranges from 3100 to 3750 cm−1. The measurement error of water content is less than 10%, which is mainly originated from the uncertainty of sample thickness measurement and the inevitable heterogeneity of each averaging FTIR spectroscopy of a standard water content calibration for hydrous hot-pressed sintering polycrystalline olivine aggregates.
In the last several years, many electrical conductivity results of hydrous minerals and rocks (e.g., Fe-bearing amphibole, epidote, garnet, gabbro, basalt, mudstone, phyllite, et al.) in the mid-lower Earth crust and subduction zone have already investigated on this YJ-3000t multi-anvil high-pressure apparatus in conjunction with the electrochemical AC impedance spectroscopy and FT-IR spectroscopy measurements at high temperatures and high pressures [34,35,41,42,43,44,45]. The influences of dehydration effect and dehydrogenation effect on hydrous minerals and rocks were explored in detail, for which, all of them were widely applied to disclose the high conductivity anomalies in the regions of subduction zone and stable continental crust. Except for all of these acquired electrical conductivities of hydrous minerals and rocks, a series of electrical conductivities of dry geological specimens from the Earth’s crust and upper mantle were paid much attention at high temperature and high pressure, such as albite, K-feldspar, alkali feldspar solid solutions, anorthite, olivine, orthopyroxene, diopside, almandine-rich garnet, peridotite, lherzolite, pyroxenite, pyroxene andesite, quartz andesite, granite, carbonaceous slate, schist, granulite, gneiss, eclogite, etc., in this multi-anvil high-pressure apparatus [46,47,48,49,50,51,52,53,54,55,56,57,58,59,60,61,62,63,64,65,66,67,68,69,70,71]. All of these influential factors (e.g., frequency, temperature, oxygen partial pressure, pressure, water-bearing content, iron-bearing content, anisotropy of crystallographic axis, segregation effect of grain boundary, content of alkali metallic ion, salinity-bearing, water-bearing fluids, etc.) have systematically been investigated on the basis of this in-situ multi-anvil high-pressure apparatus.
In addition, in order to realize the electrical conductivity measurements at much higher pressure conditions, we successfully designed and constructed a new experimental platform of electrical conductivity using diamond anvil cell in HTHPSEI, at the Institute of Geochemistry, Chinese Academy of Sciences. A detailed experimental setup and its corresponding cross-sectional assembly diagram of diamond anvil cell for high-pressure electrical conductivity measurements, as displayed in detail in Figure 3. A detailed experimental method and measurement procedure is presented in Dai et al. (2019) [72]. Furthermore, we well combined this in-situ high-pressure EC measurement system with other crucial research means, including high-pressure Raman spectroscopy, high-resolution transmission electron microscopy, atomic force microscopy, and first-principles theoretical calculations in order to check high-pressure electrical transport, vibrational, and structural properties. Some representative pressure mediums including the mixture of volume ratio (4:1) for the methanol and ethanol, liquid argon, liquid helium, etc., were selected to realize different hydrostatic environments in the sample chamber of diamond anvil cell. To note, more detailed high-pressure research was deeply explored during the process of both compression and decompression. By virtue of these electrical, spectroscopic, and theoretically calculating studies, a series of physiochemical behaviors of the pressure-induced structural phase transformation and dehydration effect on the hydrous minerals (e.g., kaolinite, epsomite, goethite, chalcanthite, gypsum, etc.) have already studied from Dai Lidong’s high-pressure research group in HTHPSEI, at the Institute of Geochemistry, Chinese Academy of Sciences [73,74,75,76,77]. In addition, some important semiconducting materials including the binary metallic oxides, AB-type structural layered metallic compounds, AB2-type structural transition-metal dichalcogenides (TMDs), and ABO3-type structural perovskite compounds are paid attention in regards to their structural phase transition, amorphization, and metallization, and investigated under conditions of HP-HT conditions in detail [78,79,80,81,82,83,84,85,86,87,88,89,90,91,92,93,94,95,96,97].

3. Experimental Theory and Measurement Methods

It is well known that the electrochemical AC impedance spectroscopy method is one of most efficient technique to measure the electrical conductivity of hydrous minerals and rocks at conditions of high temperatures and high pressures [98,99,100,101,102,103,104,105,106]. Before we launched a complex impedance spectroscopy measurement, the AC signal voltage ranges from 10 mV to 3 V and the scanning frequency ranges from 10−5 Hz to 3.2 × 10⁷ Hz need to be predesignated by virtue of Z-Plot program in the complex impedance spectroscopy analyzer. The measurement mode of controlling signal voltage and scanning frequency was selected to obtain the complex impedance spectroscopy of sample. As usual, for a typical single-crystal mineral, the acquired complex impedance spectroscopy consisted of one semi-circular arc of grain interior, as well as the electric transport process of sample—electrode interface polarization. However, for a special polycrystalline aggregates or rock, the acquired complex impedance spectroscopy consists of one semi-circular arc of grain interior, one semi-circular arc of grain boundary, as well as the electric transport process of sample—electrode interface polarization. Accordingly, by fitting all of these acquired complex impedance spectra using the appropriate equivalent electric circuit, the grain interior electrical conductivity, grain boundary electrical conductivity and the sample—electrode interface polarization resistance will be successfully obtained in turns. For each individual complex impedance spectroscopy, four characteristic parameters including the real part (Z′), the imaginary part (Z″), magnitude (|Z|), and phase angel (θ) will be obtained at the same time. The relationship between the real part, the imaginary part, magnitude, and phase angel can be expressed as,
θ = | tan 1 ( Z / Z )
| Z | = [ ( Z ) 2 + ( Z ) 2 ] 1 / 2
Representative complex impedance spectra for natural hydrous Fe-bearing amphibole single crystals from Sichuan province of southwest China at conditions of 1.0 GPa, 623–1173 K, and frequency range of 10−1–106 Hz before and after the occurrence of the oxidation–dehydrogenation reactions, which are illustrated in Figure 4 in detail.
More detailed descriptions on experimental theory and measurement methods for the impedance spectroscopy are presented in our previous review paper [35]. The equivalent electric circuit was selected to fit the impedance spectroscopy of sample, which is composed of some fundamental electronic elements (e.g., resistor, capacitor, inductor, constant phase element (CPE), gerischer element, Warburg element, etc.) [107,108,109]. After that, the electrical conductivity of sample was obtained, and the calculating formula is expressed as,
σ = 1 ρ = L (R × S )
Here, σ stands for the electrical conductivity (S/m), ρ stands for the electrical resistivity (m/S), L stands for the sample height (m), and S stands for the cross-sectional area of sample (m2). As usual, the relationship between the electrical conductivity of hydrous mineral and temperature satisfied with an Arrhenius relation, i.e., with the rise of temperature, and the electrical conductivity of sample will be increased, accordingly. As noted from a modified Arrhenius relation reported by Dai and Karato (2020) [9], the influences of water content and oxygen fugacity on the electrical conductivity of dry and hydrous Ti-doped polycrystalline olivine aggregates can be expressed as,
σ = σ 0 ( Dry ) ( f O 2 f O 2 0 ) q Dry exp ( Δ H Dry k T ) + σ 0 ( Hydrous ) ( C W C W 0 ) r ( f O 2 f O 2 0 ) q Hydrous exp ( Δ H Hydrous k T )
where σ0(Dry) and σ0(Dry) stand for the pre-exponential factor of dry and hydrous Ti-bearing olivine aggregates (S/m), respectively; ΔHDry and ΔHHydrous stands for the activation enthalpy of dry and hydrous titanium-bearing olivine aggregates (eV), respectively; f O 2 stands for the oxygen fugacity as a standardized oxygen buffer ( f O 2 0 ); qDry and qHydrous stands for the exponential factor characterizing the dependence of oxygen fugacity on the electrical conductivity of dry and hydrous Ti-bearing olivine aggregates, respectively; Cw stands for the water content as the standardized reference water-bearing content ( C w 0 ); r stands for the exponential factor of water content; T stands for the absolute temperature (Kelvin); and k stands for the Boltzmann constant.

4. Electrical Conductivity of Hydrous Minerals

In this section, recently reported results of the EC of Ti-bearing hydrous olivine aggregates from the KIWI 1000-ton Kawai-type multi-anvil apparatus in the Karato High-pressure Laboratory, Department of Earth and Planetary Sciences, Yale University, by Dai and Karato (2020) were chosen as examples to investigate the effect of structural hydroxyl (OH) and transition metallic element of titanium on the electrical conductivity hydrous minerals at high temperatures and high pressures [9]. By virtue of YJ-3000t multi-anvil press and Solartron-1260 impedance analyzer in HTHPSEI, Institute of Geochemistry, Chinese Academy of Sciences, the EC measurements of epidote and amphibole by Hu et al. (2017; 2018) were performed in order to study the influences of dehydration effect and oxidation−dehydrogenation effect from the molecular structural water (H2O) on the electrical conductivity of hydrous minerals at HP-HT conditions [33,34]. In the end, Hong et al. (2022) conducted the electrical conductivity of hydrous kaolinite in conjunction with in-situ high-temperature and high-pressure electrochemical AC impedance spectroscopy and Raman scattering results using the diamond anvil cell in HTHPSEI, Institute of Geochemistry, Chinese Academy of Sciences, and the pressure-induced structural phase transition for hydrous minerals was explored in detail [73].

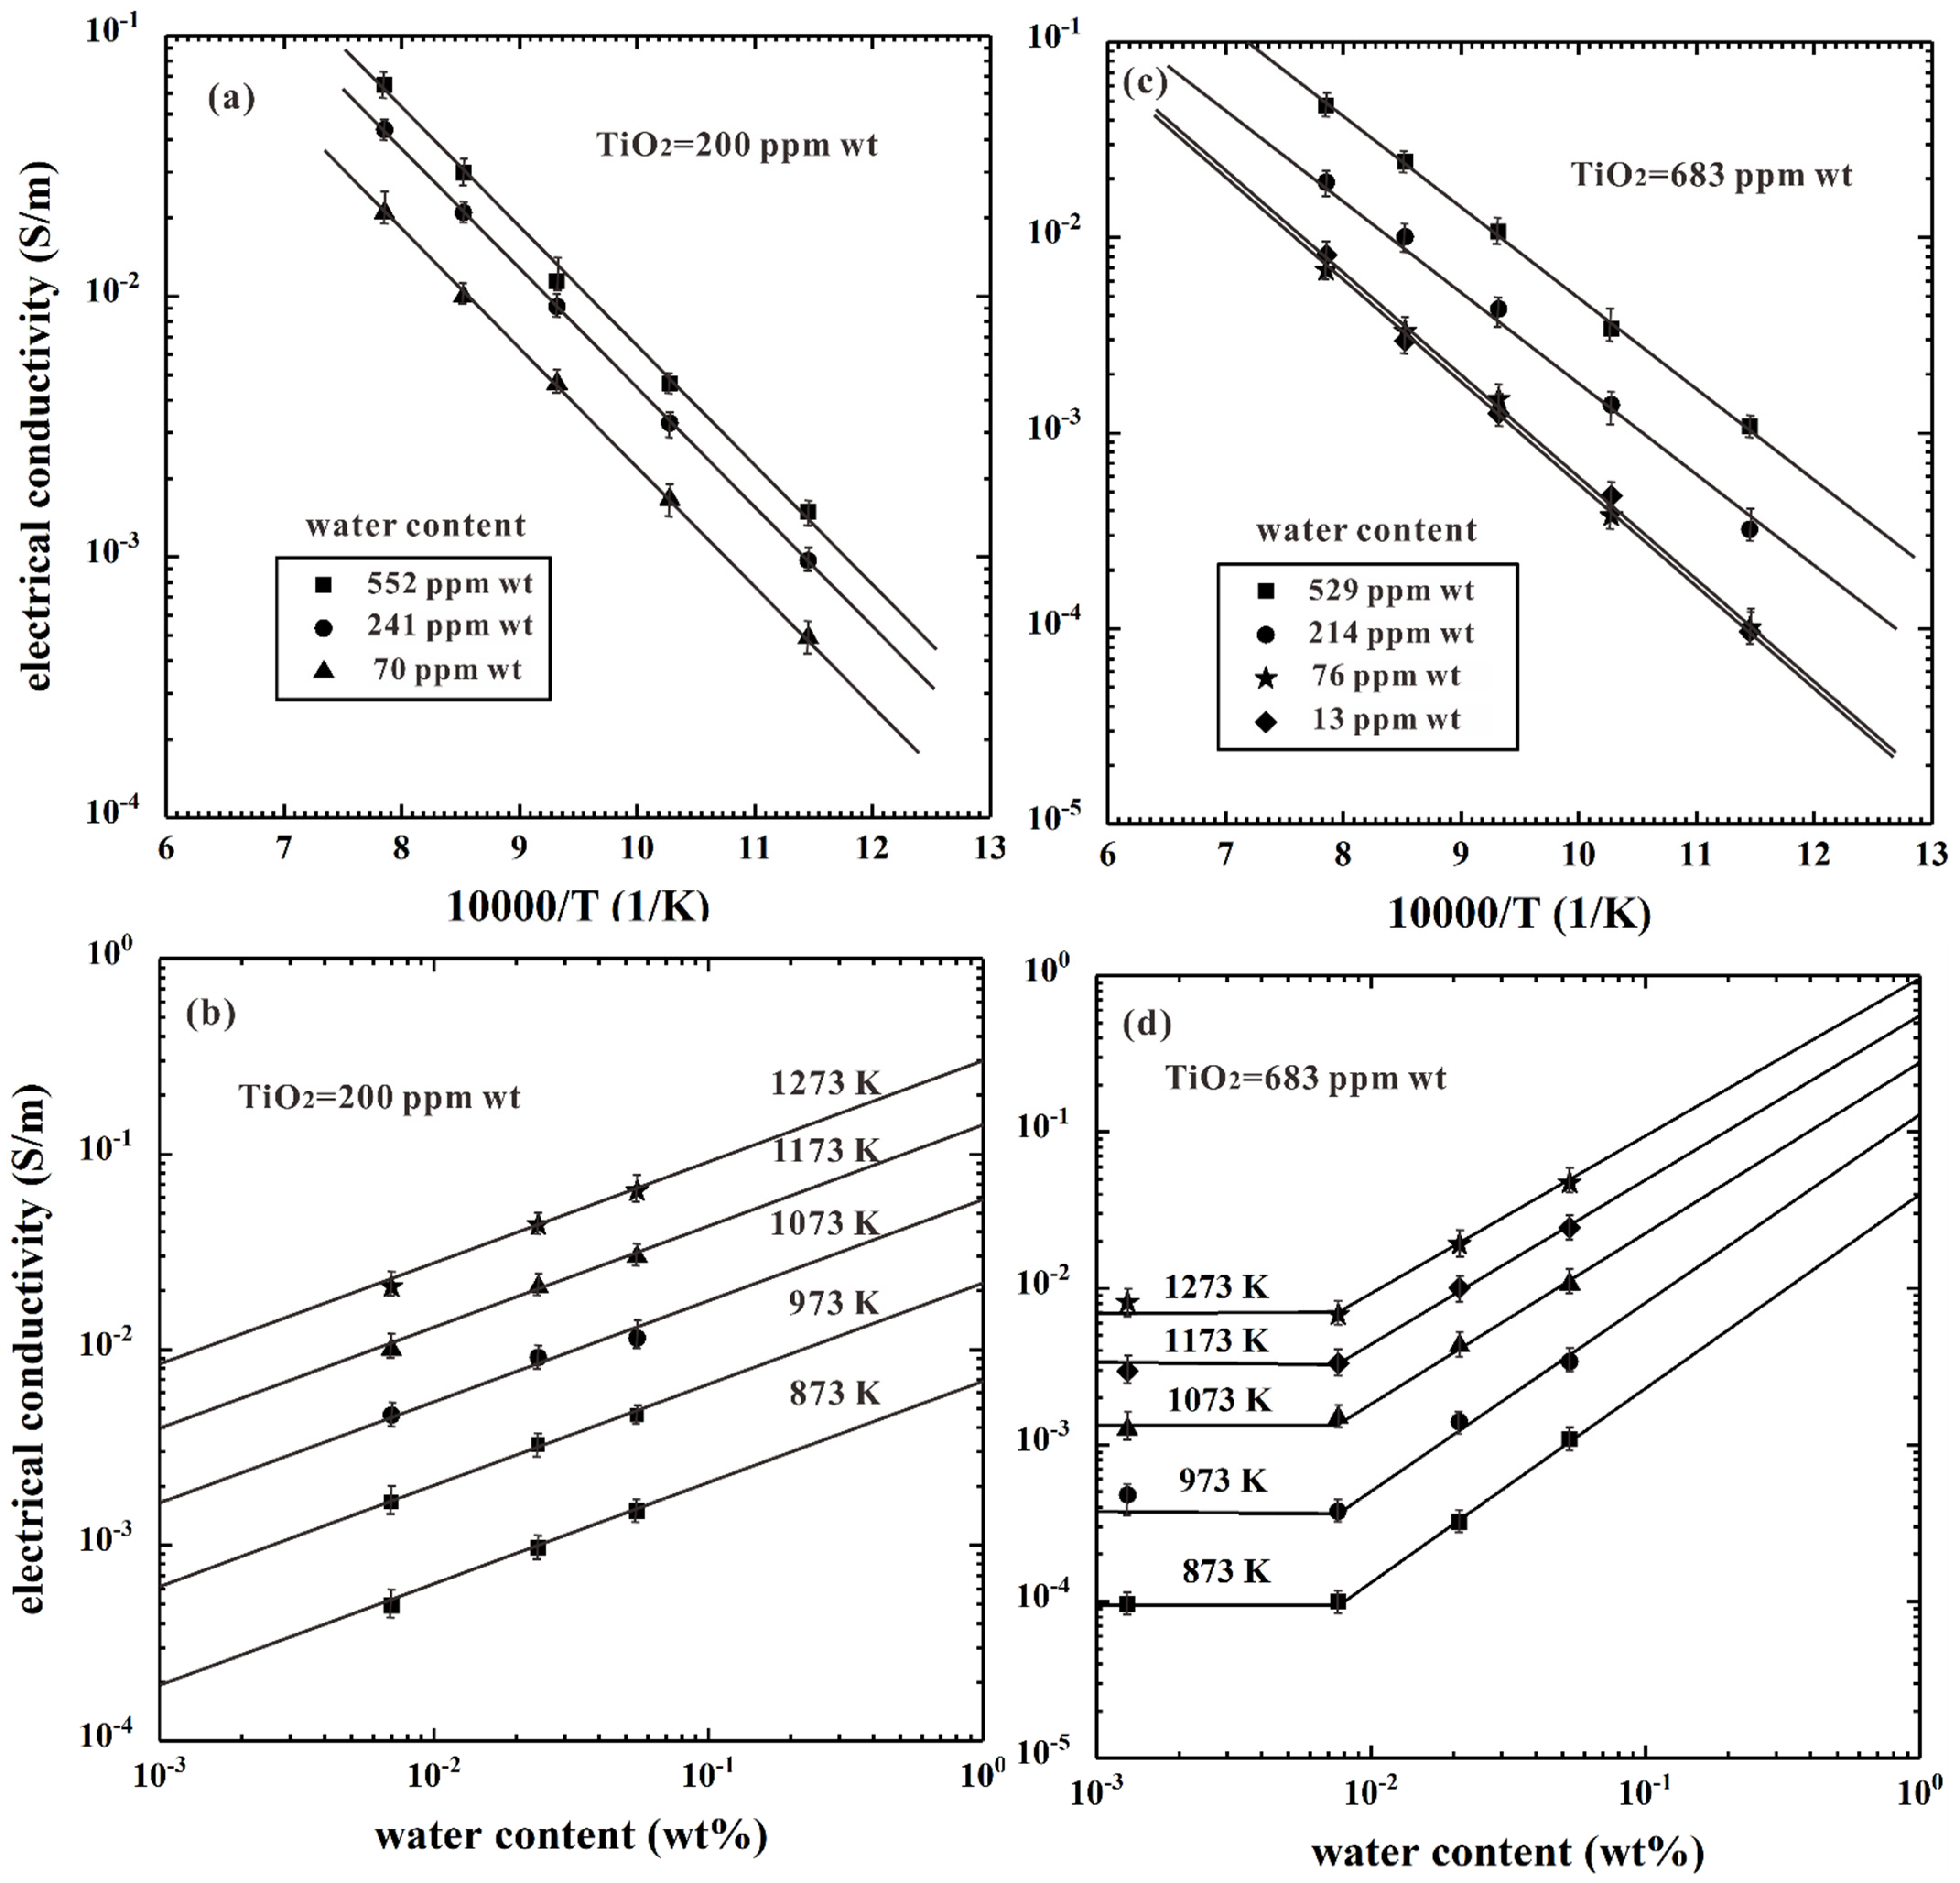
4.1. Electrical Conductivity of Ti-Bearing Hydrous Olivine

As major rock-forming NAMs, silicate mineral of olivine’s volume proportion occupies approximately up to 60% in a representative upper-mantle mineralogical composition. Thus, a large number of previously available reported electrical transport characterization—depth profiles were successfully established on the base of the laboratory-based electrical conductivity of olivine results at conditions of high temperature and high pressure. In recent decades, all of those potential influence factors including frequency, temperature, oxygen partial pressure, pressure, segregation effect of grain boundary, interconnected high conductive impurity phases (e.g., magnetite, chromite, etc.), salinity-bearing fluid, Ti-bearing content, water-bearing content, iron-bearing content, anisotropy of crystallographic axis, etc. have been paid more attention in regards to natural preferred olivine single crystal, polycrystalline olivine aggregates, and hot-pressed sintering synthetic olivine aggregates. According to these acquired electrical conductivity results on the EC of hydrous olivine, the cause of high conductivity anomaly in some typical regions of asthenosphere of Earth mantle and subduction zone was explored in detail.
Hydrogen as a form of point defect dissolved in the crystalline structure of olivine can enhance several magnitude of orders in the electrical conductivity by virtue of the diffusion of some hydrogen-related defects [30]. Due to the complexity of the concentration and its corresponding mobility in the electric charge carrying species for these hydrogen-related defects, the electrical conductivity of hydrous single crystals along with [100], [010], and [001] of three main crystallographic orientations exists as an obvious anisotropy when the experimental temperature is higher than 1000 K at the given pressure of 4.0 GPa [28]. However, recent research results on the redox-influenced elastic wave velocity of upper-mantle mineral reported by Cline et al. (2018) find that some anionic impurities of transition metallic elements including the charged tetravalent titanium (Ti4+) and trivalent chromium (Cr3+) dissolved in the hydrous olivine are possibly responsible for low-velocity or high-attenuation behaviors in the upper mantle under conditions of the confining pressure of 200 MPa and temperatures up to 1473 K [110]. As pointed out from the experimental results of water solubility at 3.0 GPa and 1323 K reported by Tollan et al. (2017), the defect reaction of dissolved titanium as a rutile form, and hydrogen in olivine can be expressed as [111],
TiO 2 + H 2 O + Olivine = [ Ti M + ( 2 H ) Si ] Olivine + Mg 2 Si 2 O 6
where the mark signal of [ Ti M + ( 2 H ) Si ] Olivine stands for two titanium electrons on the lattice of metallic site in olivine and two hydrogen vacancies on the lattice of silicon site in olivine. If this defect reaction occurs, the interaction between titanium and hydrogen becomes stronger, and the mobility and concentration of hydrogen in olivine will be reduced, accordingly. Thus, Dai and Karato (2020) firstly synthesized the high-purity polycrystalline olivine aggregates with two different TiO2-bearing contents of 200 and 683 ppm wt using the Ar + H2/CO2 mixed gas controlling oxygen fugacity at the high-temperature furnace [9]. Then, the mixtures of brucite and talc with its correspondent weight ratio of 1:6 as the water source were employed to perform a hot-pressed sintering in the KIWI 1000-ton Kawai-type multi-anvil apparatus at conditions of 4.0 GPa and 1373 K for 3 hrs. A series of initial polycrystalline olivine aggregates with different water-bearing and titanium-bearing contents were successfully synthesized. Electrical conductivities of water-poor and water-rich polycrystalline olivine aggregates with two different TiO2-bearing contents of 200 ppm wt and 683 ppm wt were performed under conditions of 4 GPa, 873–1273 K, and the Ni–NiO oxygen buffer, respectively. The influence of water contents on the electrical conductivity of polycrystalline olivine aggregates with its correspondent TiO2-bearing content of 200 ppm wt are shown in Figure 5a,b, and the influence of water contents on the electrical conductivity of polycrystalline olivine aggregates with its correspondent TiO2-bearing content of 683 ppm wt were displayed in Figure 5c,d, respectively.
All of these obtained electrical conductivity result dependencies on the water content and oxygen fugacity for Ti-doped polycrystalline olivine aggregates were fitted by virtue of Equation (5). The exponential factors between the electrical conductivity along with the variation of water content for Ti-poor and Ti-rich samples (r) were determined as 0.51 ± 0.18 and 0.98 ± 0.21, respectively. In comprehensive considerations with previously available electrical conductivity results with different water contents from the natural San Carlos olivine reported by Wang et al. (2006) [24], as well as hot-pressed sintering titanium-free olivine aggregates reported by Dai and Karato (2014d) [31], the effect of titanium content on the electrical conductivity of dry polycrystalline olivine aggregates is very larger, and whereas, the effect of titanium content on the electrical conductivity of hydrous polycrystalline olivine aggregates becomes extremely feeble.
On the other hand, Dai and Karato (2020) also performed the EC measurements for the anhydrous and hydrous polycrystalline olivine aggregates with a fixed TiO2 content of 683 ppm wt under conditions of 4.0 GPa, 873–1273 K and different oxygen fugacities, as illustrated in detail in Figure 6 [9]. The water contents in the anhydrous and hydrous olivines are 13 and 458 ppm wt, respectively. Three representative solid oxygen buffers including Re–ReO2, Ni–NiO, and Mo–MoO2 were selected in order to control oxygen fugacity in the sample chamber during the process of electrical conductivity measurements. Completely different dependence relations of water-free and water-rich electrical conductivity in the Ti-rich polycrystalline aggregate olivines on the variation of oxygen fugacity were observed. In the case of anhydrous condition, the electrical conductivity of sample increased with the rise of oxygen fugacity. On the contrary, the electrical conductivity of the sample reduced with the rise of oxygen fugacity under hydrous condition. Furthermore, the average exponential factor values for the electrical conductivity of anhydrous and hydrous polycrystalline olivine aggregates along with the variation of oxygen fugacity (q) are determined as 0.097 ± 0.008 and -0.089 ± 0.006, respectively.
In addition, in order to reasonably explain all of the above-mentioned high-pressure electrical conductivity results, it is the first time for some titanium-related defects (such as T i M , T i M , etc. Here, T i M denotes the trivalent titanium ion of metallic site in the olivine crystalline lattice, T i M denotes the tetravalent titanium ion of metallic site in the olivine crystalline lattice) and hydrogen-related defects (such as (3H)′Si, (4H)″Si, etc. Here, (3H)′Si denotes three hydrogen vacancies of silicon site in the olivine crystalline lattice, ( 4 H ) Si denotes four hydrogen vacancies of silicon site in the olivine crystalline lattice) in Ti-doped and hydrogen-doped olivine aggregates, as put forward by Dai and Karato (2020) [9]. All of these available positive and negative dependence relations of oxygen fugacity on the electrical conductivity Ti-bearing olivine aggregates with different water contents are resulted in the distinction of electrical transport conduction, which is in consistent with the previously reported electrical conductivity results for San Carlos olivine, orthopyroxene, diopside, pyrope-rich garnet, and almandine-rich garnet in the upper mantle, as well as for wadsleyite in the mantle transition zone [25,27,41,51,58,59].

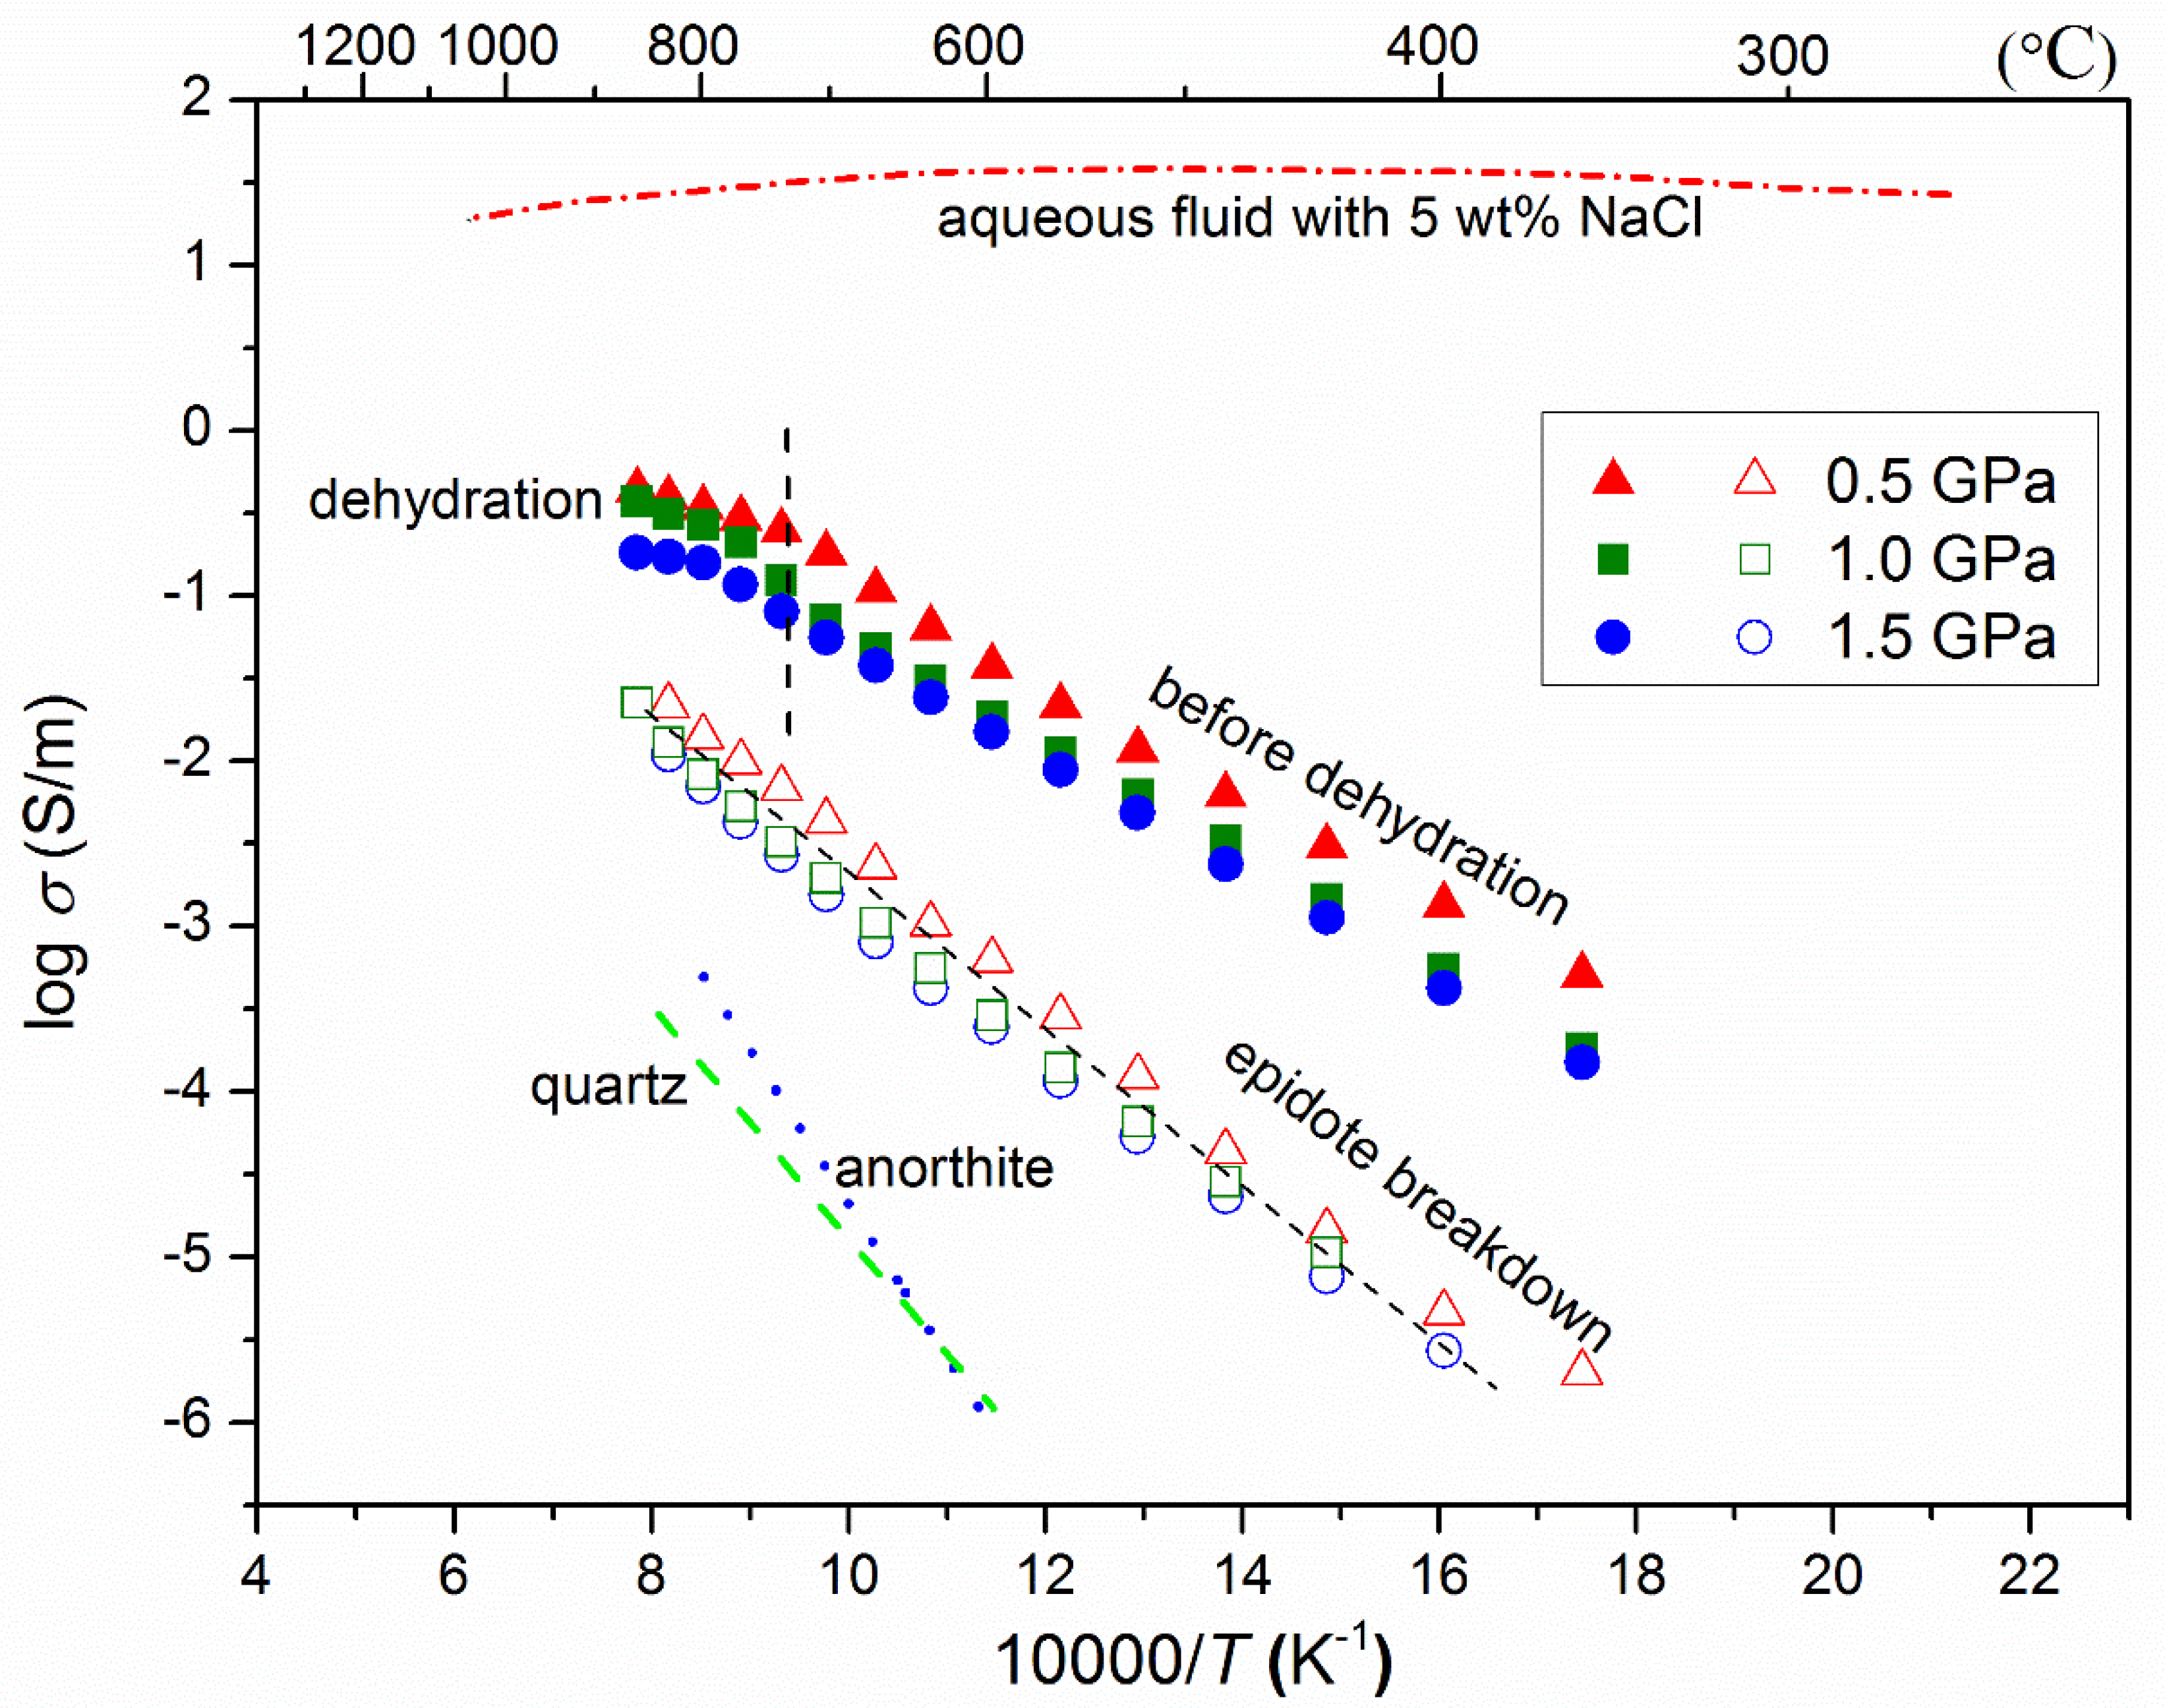
4.2. Electrical Conductivity of Hydrous Epidote

As a typical hydrous rock-forming mineral, the episode belongs to a nesosilicate structural epidote family with the Ca−rich and Al−rich complex chemical compositions, whose corresponding chemical molecular formula can be expressed as Ca2Al3−xFexSi3O13H (The value of x is fell in between the range from 0 to 1.0). As usual, hydrous epidote is of the dominant reaction product during the process of the phase transformation between greenschist to blueschist facies among the regional metamorphism process. At the same time, the abundance of epidote will be progressively increased with the rise of pressure, and its volume percentage of highest abundance can reach up to 35%, occurring in epidote-blueschist facies. At a depth higher than 80 km in the region of subducting oceanic crust, the hydrous epidote is still stabilized, which was considered as an important water reservoir to be responsible for the fluid flux within the depth ranges of 100−120 km of the deep mantle wedge region [112]. Thus, the released water-bearing fluid from the dehydration effect of epidote is crucial to reasonably explain the high conductivity anomaly in the region of the deep mantle wedge.
Hu et al. (2017) measured the electrical conductivity of hydrous epidote at the pressure ranges from 0.5 to 1.5 GPa and temperatures ranges from 573 to 1273 K, as displayed in detail in Figure 7 [33]. A relatively feeble pressure effect on the electrical conductivity of hydrous epidote was observed in comparison with the experimental temperature. The occurrence on the dehydration reaction of sample was well confirmed by virtue of the moderate discontinuity at the critical temperature point of ~1073 K. The dehydration of hydrous epidote results in the breakdown of sample and the increase of electrical conductivity up to 1 S/m when the experimental temperature was enhanced to 1273 K. Such a high electrical conductivity value (1 S/m) is owing to the released water-bearing fluid during the process of initial dehydration reaction of epidote. After the dehydration of hydrous epidote was thoroughly completed, a remarkable reduction in the electrical conductivity of the sample is highly related to the appearance of newly coexisting multi-phase mineralogical assemblage (grossular garnet, anorthite, quartz, and hematite) with a high electrical resistivity, as well as the escape of water-bearing fluid from the dehydration product of residual epidote.
At the same time, Hu et al. (2017) also found that the electrical conductivity of hydrous epidote is well reproducible before and after the occurrence of dehydration reaction at given pressure ranges from 0.5 to 1.5 GPa [33]. In comprehensive comparisons with previously acquired electrical conductivity results on the hot-pressed sintering polycrystalline quartz reported by Bagdassarov and Delépine (2004) [113], synthetic polycrystalline anorthite reported by Hu et al. (2015) [60], as well as the pure aqueous fluid of sodium chloride with the 5% of weight percentage reported by Sinmyo and Keppler (2017) [114], one new origin for the explanation of high conductivity anomaly at the depth ranges from 70 to 120 km was put forward on the base of the released water-bearing fluid during the process of epidote dehydration at high temperature and high pressure. Furthermore, some recently reported electrical conductivity and elastic wave velocity results on hydrous halogen-bearing amphibole, glaucophane, Liebermannite, chlorite, and lawsonite from Manthilake et al. [98,99,100,101,102] also confirmed that the dehydration of hydrous minerals will release a large amount of the water-bearing fluids, which can be used to reasonably explain the anomalously seismic and electrical transport behaviors in the region of hot subduction of deep mantle wedges.

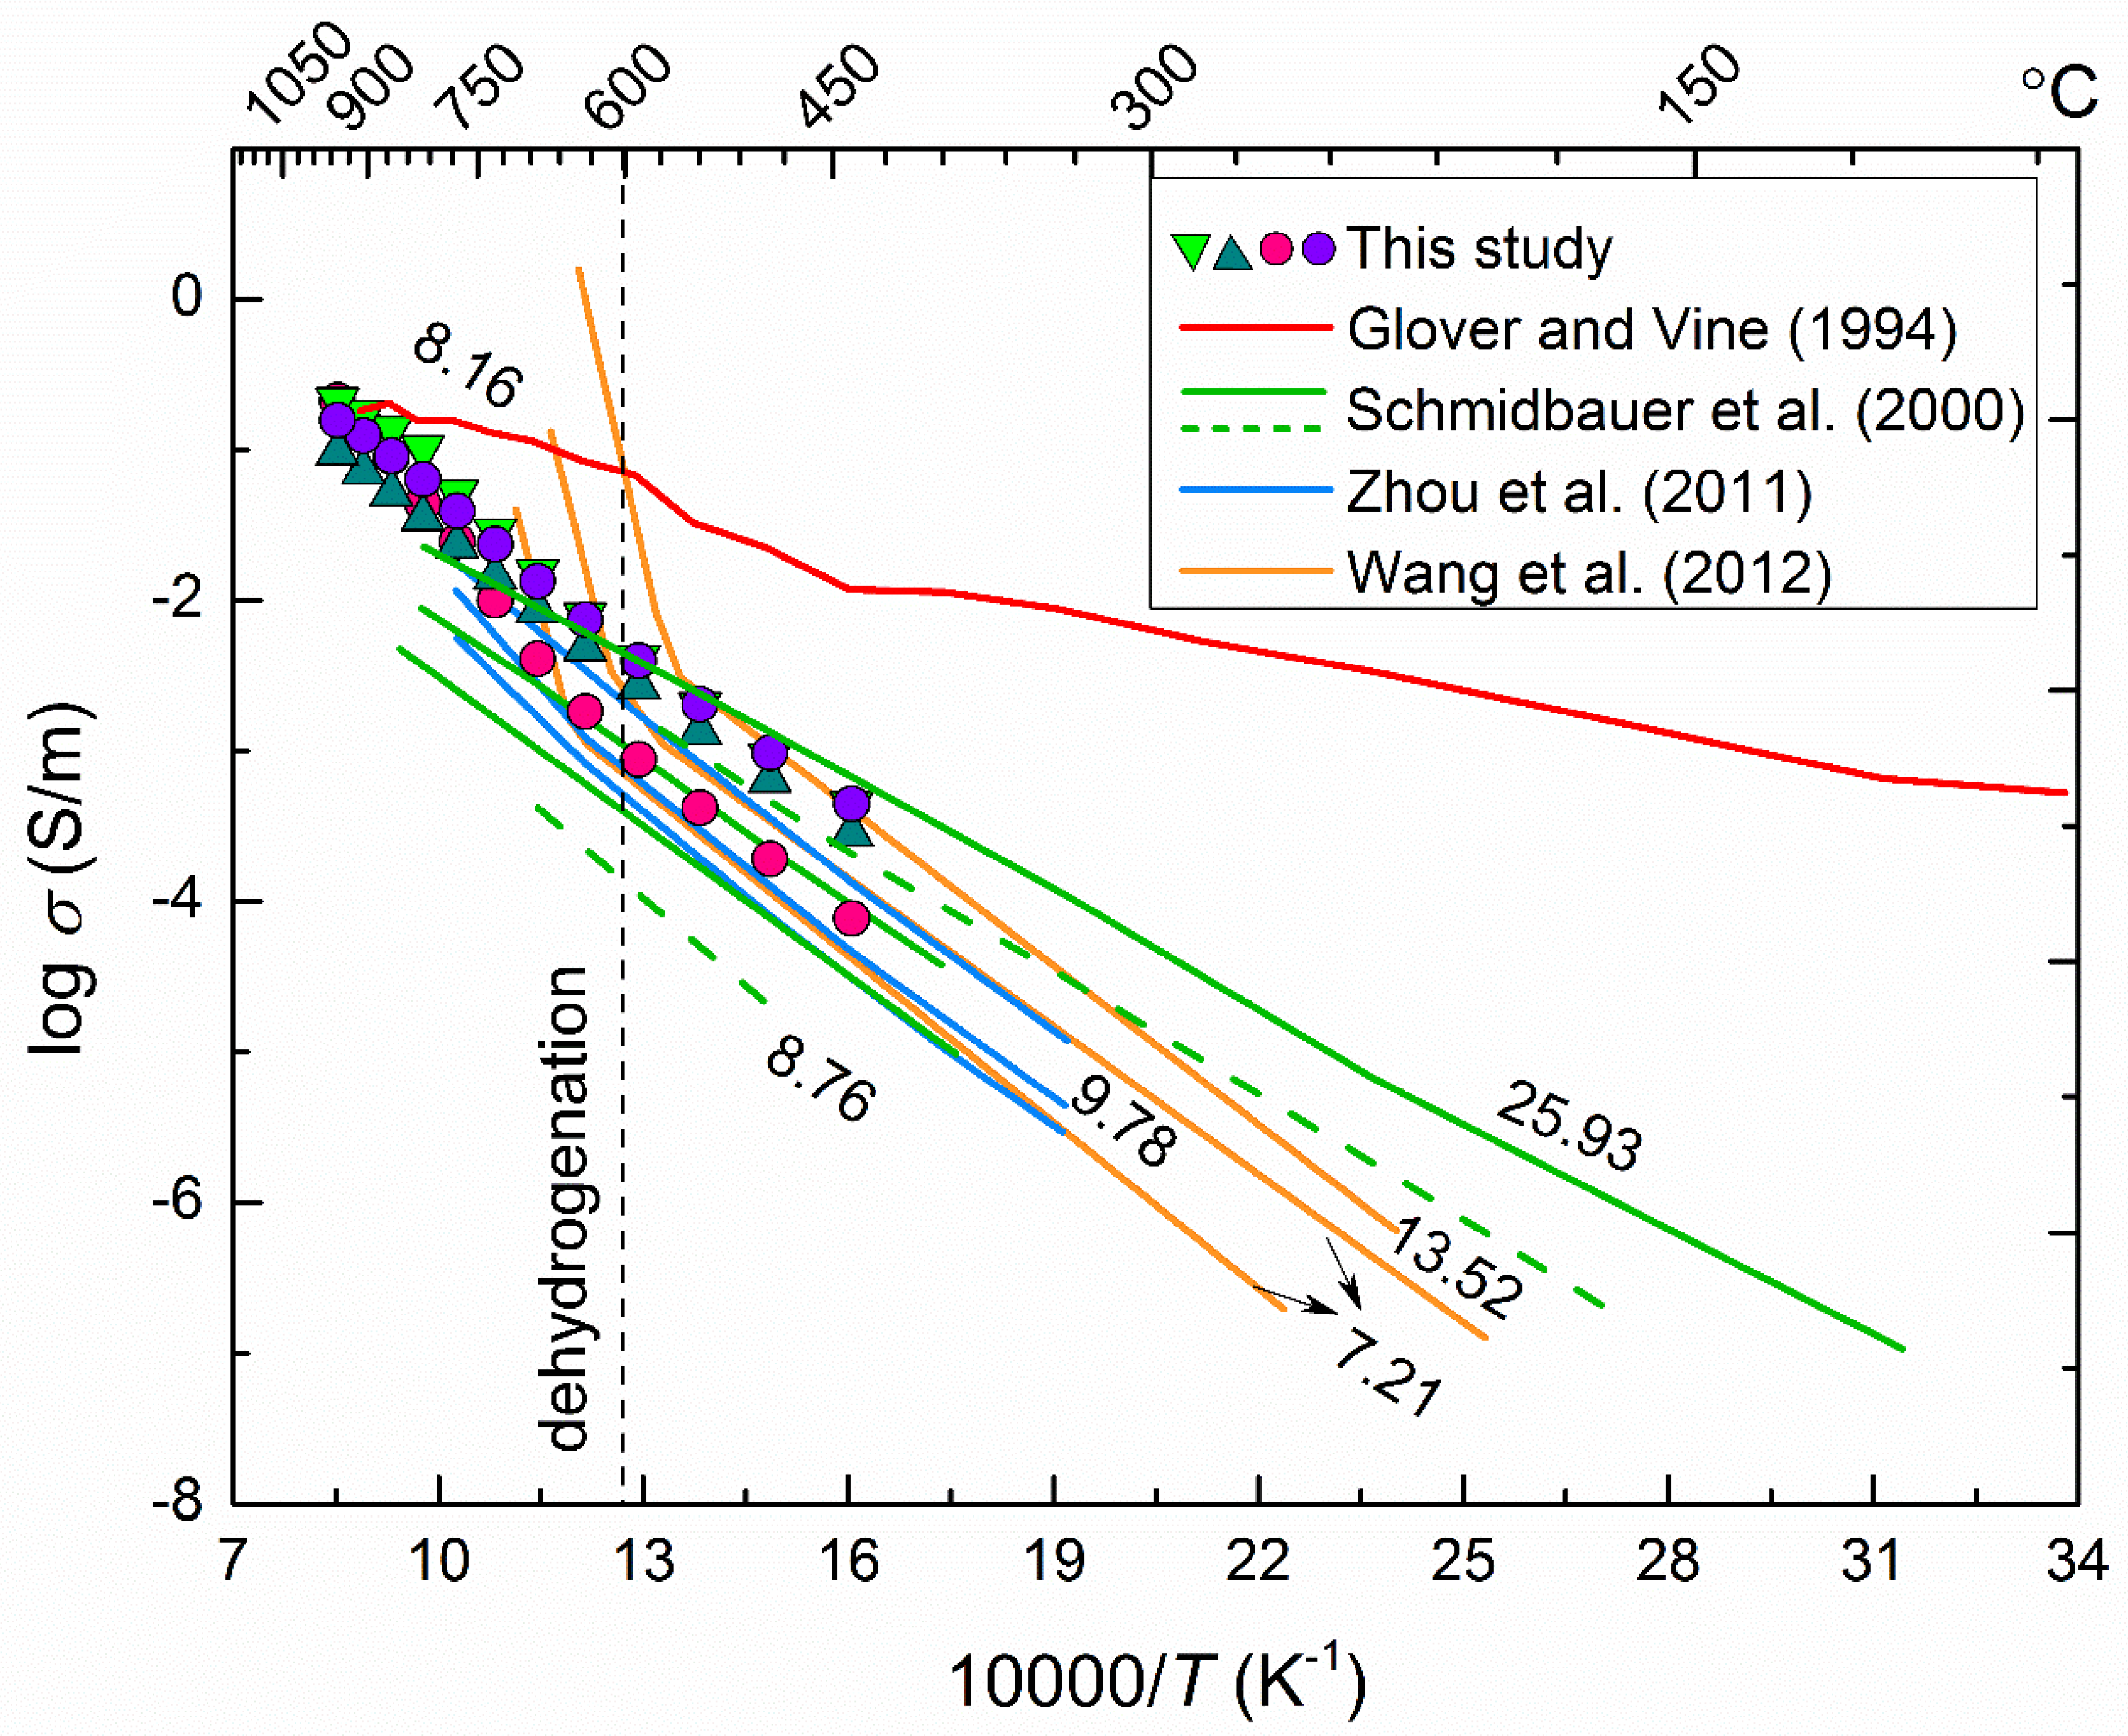
4.3. Electrical Conductivity of Hydrous Amphibole

Global magnetotelluric (MT) results confirmed that the phenomenon of anomalously high electrical conductivity with its correspondent values of 10−2−1 S/m is widely present in the regions of stable mid-lower Earth crust, the forearc of subduction zone, as well as the back arc of subduction zone. To interpret for the regionally anomalously high conductivity, several causes of formation models have already been presented, such as the salinity-bearing (or water-bearing) fluid, partial melting, graphite film in the grain boundary, as well as the impurity of high conductive mineral. Among them, the salinity-bearing (or water-bearing) fluid, as the most potential candidate, is mainly originated the released fluid phases during the process of the dehydration of hydrous minerals at high temperatures and pressures. Amphibole is of the most representative chain-structural silicate minerals, which can be stably existed the continental mid-crust region with its volume content of mineralogical composition up to 35–40% at the depth ranges from 15 to 30 km. Likewise, it is one of the crucial carriers for water transport with the volume percentage of highest abundance up to 50% outcropped at some epidote-amphibolite and amphibolite facies of the subduction zone [115].
Previous available investigations on the high-temperature 57Fe Mossbauer spectra for the Fe-bearing calcic amphiboles observed that the amphibole dehydration occurred at the temperature ranges from 573 to 1073 K, which was accompanied by the loss of molecular structural hydroxyl as a form of either the hydrogen gas or molecular water [116]. Some researchers think that the high-temperature dehydration-induced hydrogen gas in Fe-bearing amphibole is produced at atmospheric pressure condition by virtue of the occurrence of the oxidation–dehydrogenation reaction (i.e., the electron jump between the ferrous ion and neighboring hydroxyl in the crystalline structure of hydrous amphibole),
2 Fe 2 + + 2 ( OH ) 2 Fe 3 + + 2 O 2 + H 2
However, on the contrary, other researchers think that the high-temperature dehydration in Fe-bearing amphibole was resulted in the molecular water at atmospheric pressure condition originated from the heating in an oxidizing atmosphere results in a reaction at the sample surface, i.e., the dehydrogenation reaction,
2 [ Fe 2 + + ( OH ) ] + O 2 4 [ Fe 3 + + O 2 ] + 2 H 2 O
In order to systematically reveal the dehydration process of hydrous mineral, the electrical conductivity of iron-bearing amphibole was performed by Hu et al. (2018) at the temperature ranges from 623 to 1173 K and pressure ranges from 0.5 to 2.0 GPa within the frequency ranges of 10−1 to 106 Hz, as illustrated in detail in Figure 8 [34]. When the experimental temperature is lower than 873 K, a linear increase between the logarithmic electrical conductivity of iron-bearing amphibole and temperature was observed. Subsequently, one moderate electrical conductivity of sample with pressure is confirmed, and an available discontinuous change of activation enthalpy before and after the dehydration reaction at the temperature around 873 K. Combined with the FT-IR measurements on the initial samples and recovered products, the dehydration temperature points of hydrous amphibole were verified as 843 ± 20 K. Thus, the electrical transport conduction of sample for the oxidation–dehydrogenation behavior was characterized by the variation of activation enthalpy in the Arrhenius equation before and after the dehydration reaction at high temperatures and pressures.
On the other hand, in comprehensive considerations of a relatively feeble discontinuity between the electrical conductivity of iron-bearing amphibole along with the temperature as well as some microscopic observations from the FT-IR measurement, optical microscope, and scanning electronic microscopy results before and after the electrical conductivity experiments, it is the first time that Hu et al. (2018) put forward that the dehydration reaction belongs to a oxidation–dehydrogenation process according to our obtained in-situ high-pressure electrical conductivity results [34]. Resembling previous temperature-induced dehydrogenation at the atmospheric pressure [117], the occurrence of oxidation–dehydrogenation reaction in hydrous amphibole can be described as,
Fe 2 + + OH = Fe 3 + + O 2 + 1 2 H 2
In light of the oxidation–dehydrogenation reaction of Equation (9), the high-temperature dehydration-induced hydrogen gas in Fe-bearing amphibole was produced by the electron jump between the ferrous ion and neighboring hydroxyl in the crystalline structure of sample rather than the loss of molecular water at high pressure. Comparing these presently acquired measurement results, four previous high-pressure electrical conductivity data for iron-bearing amphibole from Glover and Vine (1994) [118]; Schmidbauer et al. (2000) [116]; Zhou et al. (2011) [119]; and Wang et al. (2012) [120] are also listed in Figure 8. Obviously, it makes clear that the electrical conductivity of hydrous Fe-bearing amphibole will increase with the rise of total iron content at HP-HT conditions (Figure 9). It is also observed that some available discrepancies between the previous and present electrical conductivity results may be originated from the different iron contents of Fe-bearing hydrous amphibole during the process of the occurrence of oxidation–dehydrogenation at high temperature and pressure.
Figure 8. Comparisons between the acquired electrical conductivity of Fe-bearing hydrous amphibole electrical conductivity of amphibole and four previous high-pressure electrical conductivity data for iron-bearing amphibole from Glover and Vine (1994) [118]; Schmidbauer et al. (2000) [116]; Zhou et al. (2011) [119]; and Wang et al. (2012) [120]. The numbers represent the weight percentage (wt %) total ferrous and ferric iron in amphibole (reproduced with permission from the reference of Hu et al. [34]; published by Elsevier, 2018).
Minerals 12 00161 g008

4.4. Electrical Conductivity of Hydrous Kaolinite

As a typical aluminosilicate clay mineral, the hydrous kaolinite (its correspondent chemical molecular formula can be expressed as Al2Si2O5(OH)4) is widespread outcropped in the surface of Earth, as well as many different geological bodies and deep geodynamic processes, such as the kaolinization of hydrothermal mineral deposit, the natural alternation of representative rock-forming mineral (e.g., feldspar, et al.) and Meso-Cenozoic sedimentation basins. In the oceanic sedimentary products, kaolinite is one of the most important constituent compositions of water-bearing mineral, and its highest mineralogical content can reach up to 60%, which is possibly carrying a large amount of water to migrate in the subduction zone and resulting in the water cycle of the Earth interior [124,125]. Therefore, a systematic investigation on the physiochemical properties on the natural hydrous kaolinite at HP-HT conditions are crucial to deeply disclose its phase structure, storage state, and migration mechanism in the deep Earth interior.
Recently, Hong et al. (2022) performed the electrical conductivity and Raman spectroscopy experiments on natural hydrous kaolinite and its high-pressure polymorphs in order to explore the high-pressure phase structure and its phase stability during the process of compression and decompression under conditions of temperature ranges of 293–673 K and pressure ranges of 0.4–10.0 GPa [73]. By virtue of diamond anvil cell, the detailed experimental procedure and measurement method for the in-situ high-pressure electrical transport, structural and vibrational characterizations are previously displayed in the reference of Dai et al. (2019) [72]. Based on the acquired HP-HT electrical conductivity and Raman scattering results, the phase diagram was established at conditions of 2.3–6.5 GPa and 293–673 K within a depth range of 38–200 km, as detailed illustrated in Figure 10.
In this present study, the initial sample is nominated as the kaolinite I phase at ambient conditions. With increasing pressure up to 2.9 GPa, another new phase of kaolinite II appeared, and subsequently, the phase transformation from kaolinite II to kaolinite III phases occurred at the critical pressure point of 6.5 GPa at atmospheric temperature. Upon decompression, a direct phase transformation of sample from kaolinite III to kaolinite I phases was occurred at the pressure point of 0.8 GPa rather than a continuous phase transition from kaolinite III to kaolinite II to kaolinite I phases. An obvious hysteresis effect of the structural phase transformation is also observed during the decompressed process. All of these available structural phase transformations in hydrous kaolinite upon compression and decompression were well characterized by the pressure-induced from those obviously discontinuous variations in the electrical conductivity and Raman shift at room temperature.
High-temperature and high pressure electrical conductivity and Raman spectroscopy results also confirmed that the critical pressure points of structural phase transition for natural hydrous kaolinite are strongly dependent on the experimental temperature. With increasing temperature, the pressure points of structural phase transformation for natural hydrous kaolinite gradually reduced. Further, it is the first time that the temperature–pressure phase boundary based on the acquired high-pressure electrical conductivity and Raman scattering results on natural hydrous kaolinite was successfully constructed at conditions of pressure ranges of 2.3–6.5 GPa, temperature ranges of 293–673 K, and depth ranges of 38–200 km. In addition, the fitted results for the structural phase transitions between the respective kaolinite I–II and kaolinite II–III phase boundaries can be expressed as,
P   ( GPa ) = 4.298 0.00462 T   ( K )
P   ( GPa ) = 8.895 0.00799 T   ( K )
By virtue of the obtained phase diagram, the high-pressure phase structure and its stability for natural hydrous kaolinite and its high-pressure polymorphs was well extrapolated by the laboratory-based electrical conductivity and Raman spectroscopy results within the depth range of 200 km under HP-HT conditions. Two representative geothermal gradients of 5 and 10 K/km are selected to model the corresponding cold and hot subduction environments, and it can provide a crucial constraint on the high-pressure behaviors of other kaolin-group minerals.

5. Concluding Remarks

In the past of several decades, with the rapid development of experimental techniques in the electrical conductivity measurement and high-pressure equipment, there are more and more electrical conductivity results to be reported on the hydrous silicate minerals in the Earth crust, upper mantle, and subduction zone at conditions of high temperatures and high pressures. In particular, some recent productions paid more attention on the investigations on electrical conductivity of nominally anhydrous and hydrous minerals at high temperature and high pressure. Two dominant presence species of molecular water and structural hydroxyl influence on the electrical conductivity of hydrous minerals are of the research point in the field of high-pressure mineral physics. In conjunction with those acquired experimental results from the laboratory-based high-pressure electrical conductivity, first-principle theoretical calculations and the observation of the field experimental rock, it can be efficiently applied to disclose the reason of high electrical conductivity from the global and regional field observations of magnetotelluric and geomagnetic deep sounding data.
For the main conduction mechanism, several typical electrical transport models occupying the position of crystalline lattice, such as hydrogen-related defects, iron-related defects, titanium-related defects, alkali-related defects, vacancy of interstitial ion, etc. have been already put forward on the base of high-temperature and high-pressure electrical conductivity on the hydrous silicate minerals. Owing to the presence of these complicated intrinsic crystalline defects, the dependence of the electrical conductivity of hydrous silicate minerals on the variations of influential factors (e.g., temperature, pressure, oxygen fugacity, structural phase transition, water content, dehydration effect, oxidation–dehydrogenation effect, crystallographic orientation, trace element of titanium content, iron content, alkali ion content, etc.) are overall working out. On the other hand, some external influential factors also possibly play a crucial role on the electrical conductivity of hydrous silicate minerals under conditions of high temperatures and high pressures, such as graphite layer of grain boundary, the impurity of magnetite, the impurity of chromite, the presence of some sulfide-bearing compounds, as well as salinity-bearing (or water-bearing) fluids in hydrous minerals. In addition, more and more attention has been paid to the electrical conductivity of hydrous minerals in the lower mantle, core-mantle boundary and Earth core using the diamond anvil cell in order to disclose the water cycling in the deep Earth interior.
In summary, in order to explore high conductivity anomaly in the deep Earth interior, we need to comprehensively consider all of these potential influential factors on the electrical conductivity of hydrous minerals at high temperature and high pressure, as well as geological background of a really regionally geotectonic unit. For example, just as pointed out by Dai and Karato (2020) [9], when we applied the laboratory-based electrical conductivity results from titanium-rich hydrous upper-mantle minerals to the titanium-poor real Earth (The titanium content is only ~50 ppm wt% in the upper mantle), it needs to be made with great care.

Author Contributions

All the authors contributed equally to this review paper. H.H. and L.D. designed the project. H.H., L.D., W.S., Y.Z., K.L., L.Y., C.P., M.H., M.W., Z.H., C.J., C.L., C.Y. and S.P. wrote the initial draft of the work, interpreted the results and the final version. All authors discussed the results and commented on the manuscript. All authors have read and agreed to the published version of the manuscript.

Funding

This research was funded by the NSF of China (grant numbers 42072055, 41774099 and 41772042), Youth Innovation Promotion Association of CAS (grant number 2019390), and Special Fund of the West Light Foundation of CAS.

Acknowledgments

Almost all listed original high-pressure electrical conductivity data were already obtained by Lidong Dai and his collaborators at the Chinese Academy of Sciences and Yale University. Here, please accept my honest thanks and greetings to Heping Li at the Key Laboratory of High-Temperature and High-Pressure Study of the Earth’s Interior (HTHPSEI), Institute of Geochemistry, Chinese Academy of Sciences, the People’s Republic of China, and Shun-ichiro Karato in the Karato High-pressure Laboratory, Department of Earth and Planetary Sciences, Yale University, United States.

Conflicts of Interest

The authors declare no conflict of interest.

References

  1. Zheng, Y.; Hermann, J. Geochemistry of continental subduction-zone fluids. Earth Planets Space 2014, 66, 93. [Google Scholar] [CrossRef] [Green Version]
  2. Karato, S. The role of hydrogen in the electrical conductivity of the upper mantle. Nature 1990, 347, 272–273. [Google Scholar] [CrossRef]
  3. Selway, K.; O’Donnell, J.; Özaydin, S. Upper mantle melt distribution from petrologically constrained magnetotellurics. Geochem. Geophys. Geosyst. 2019, 20, 3328–3346. [Google Scholar] [CrossRef]
  4. Selway, K. Negligible effect of hydrogen content on plate strength in East Africa. Nat. Geosci. 2015, 8, 543–546. [Google Scholar] [CrossRef]
  5. Selway, K. On the causes of electrical conductivity anomalies in tectonically stable lithosphere. Sur. Geophys. 2014, 35, 219–257. [Google Scholar] [CrossRef]
  6. Selway, K.; Hand, M.; Heinson, G.; Payne, J. Magnetotelluric constraints on subduction polarity: Reversing reconstruction models for Proterozoic Australia. Geology 2009, 37, 799–802. [Google Scholar] [CrossRef]
  7. Förster, M.; Selway, K. Melting of subducted sediments reconciles geophysical images of subduction zones. Nat. Commun. 2021, 12, 1320. [Google Scholar] [CrossRef]
  8. Yang, B.; Egbert, G.; Zhang, H.; Meqbel, N.; Hu, X. Electrical resistivity imaging of continental United States from three-dimensional inversion of EarthScope USArray magnetotelluric data. Earth Planet. Sci. Lett. 2021, 576, 117244. [Google Scholar] [CrossRef]
  9. Dai, L.; Karato, S. Electrical conductivity of Ti-bearing hydrous olivine aggregates at high temperature and high pressure. J. Geophys. Res. Solid Earth 2020, 125, e2020JB020309. [Google Scholar] [CrossRef]
  10. Liu, H.; Zhu, Q.; Xu, X.; Fei, H.; Yang, X. High electrical conductivity of olivine at oxidizing conditions of the shallow mantle and geophysical implications. J. Geophys. Res. Solid Earth 2021, 126, e2021JB022739. [Google Scholar] [CrossRef]
  11. Sun, C.; Tang, G.; Fortin, J.; Borgomano, J.V.; Wang, S. Dispersion and attenuation of elastic wave velocities: Impact of microstructure heterogeneity and local measurements. J. Geophys. Res. Solid Earth 2020, 125, e2020JB020132. [Google Scholar] [CrossRef]
  12. Horikawa, T.; Katsura, M.; Yokota, T.; Nakashima, S. Effects of pore water distributions on P-wave velocity–water saturation relations in partially saturated sandstones. Geophys. J. Int. 2021, 226, 1558–1573. [Google Scholar] [CrossRef]
  13. Mohiuddin, A.; Karato, S.; Girard, J. Slab weakening during the olivine to ringwoodite transition in the mantle. Nat. Geosci. 2020, 13, 170–174. [Google Scholar] [CrossRef]
  14. Zhang, Z.; Karato, S. The effect of pressure on grain-growth kinetics in olivine aggregates with some geophysical applications. J. Geophys. Res. Solid Earth 2021, 126, e2020JB020886. [Google Scholar] [CrossRef]
  15. Sun, W.; Yoshino, T.; Sakamoto, N.; Yurimoto, H. Supercritical fluid in the mantle transition zone deduced from H–D interdiffusion of wadsleyite. Earth Planet. Sci. Lett. 2018, 484, 309–317. [Google Scholar] [CrossRef]
  16. Fei, H.; Koizumi, S.; Sakamoto, N.; Hashiguchi, M.; Yurimoto, H.; Marquardt, K.; Miyajima, N.; Katsura, T. Pressure, temperature, water content, and oxygen fugacity dependence of the Mg grain-boundary diffusion coefficient in forsterite. Am. Mineral. 2018, 103, 1354–1361. [Google Scholar] [CrossRef]
  17. Tielke, J.; Mecklenburgh, J.; Mariani, E.; Wheeler, J. The influence of water on the strength of olivine dislocation slip systems. J. Geophys. Res. Solid Earth 2019, 124, 6542–6559. [Google Scholar] [CrossRef]
  18. Zhang, G.; Mei, S.; Song, M. Effect of water on the dislocation creep of enstatite aggregates at 300 MPa. Geophys. Res. Lett. 2020, 47, e2019GL085895. [Google Scholar] [CrossRef]
  19. Précigout, J.; Prigent, C.; Palasse, L.; Pochon, A. Water pumping in mantle shear zones. Nat. Commun. 2017, 8, 15736. [Google Scholar] [CrossRef]
  20. Speciale, P.; Behr, W.; Hirth, G.; Tokle, L. Rates of olivine grain growth during dynamic recrystallization and postdeformation annealing. J. Geophys. Res. Solid Earth 2020, 125, e2020JB020415. [Google Scholar] [CrossRef]
  21. Huang, X.; Xu, Y.; Karato, S. Water content in the transition zone from electrical conductivity of wadsleyite and ringwoodite. Nature 2005, 434, 746–749. [Google Scholar] [CrossRef] [PubMed]
  22. Huang, X.; Bai, W.; Xu, Y.; Karato, S. Influence of hydrogen on electrical conductivity of wadsleyite and ringwoodite with its geodynamics implications. Acta Petrol. Sin. 2005, 21, 1743–1748. [Google Scholar]
  23. Huang, X.; Wang, X.; Chen, Z.; Bai, W. The experimental research on electrical conductivity for minerals and rocks under condition of upper mantle. Sci. Sin. Terrae 2017, 47, 518–529. [Google Scholar]
  24. Wang, D.; Mookherjee, M.; Xu, Y.; Karato, S. The effect of water on the electrical conductivity of olivine. Nature 2006, 443, 977–980. [Google Scholar] [CrossRef]
  25. Dai, L.; Karato, S. Electrical conductivity of wadsleyite at high temperatures and high pressures. Earth Planet. Sci. Lett. 2009, 287, 277–283. [Google Scholar] [CrossRef]
  26. Dai, L.; Karato, S. Electrical conductivity of pyrope-rich garnet at high temperature and high pressure. Phys. Earth Planet. Inter. 2009, 176, 83–88. [Google Scholar] [CrossRef]
  27. Dai, L.; Karato, S. Electrical conductivity of orthopyroxene: Implications for the water content of the asthenosphere. Proc. Jpn. Acad. 2009, 85, 466–475. [Google Scholar] [CrossRef] [Green Version]
  28. Dai, L.; Karato, S. High and highly anisotropic electrical conductivity of the asthenosphere due to hydrogen diffusion in olivine. Earth Planet. Sci Lett. 2014, 408, 79–86. [Google Scholar] [CrossRef]
  29. Dai, L.; Karato, S. The effect of pressure on the electrical conductivity of olivine under the hydrogen-rich conditions. Phys. Earth Planet. Inter. 2014, 232, 51–56. [Google Scholar] [CrossRef]
  30. Dai, L.; Karato, S. Influence of oxygen fugacity on the electrical conductivity of hydrous olivine: Implications for the mechanism of conduction. Phys. Earth Planet. Inter. 2014, 232, 57–60. [Google Scholar] [CrossRef]
  31. Dai, L.; Karato, S. Influence of FeO and H on the electrical conductivity of olivine. Phys. Earth Planet. Inter. 2014, 237, 73–79. [Google Scholar] [CrossRef]
  32. Karato, S.; Dai, L. Comments on “Electrical conductivity of wadsleyite as a function of temperature and water content” by Manthilake et al. Phys. Earth Planet. Inter. 2009, 174, 19–21. [Google Scholar] [CrossRef]
  33. Hu, H.; Dai, L.; Li, H.; Hui, K.; Sun, W. Influence of dehydration on the electrical conductivity of epidote and implications for high-conductivity anomalies in subduction zones. J. Geophys. Res. Solid Earth 2017, 122, 2751–2762. [Google Scholar] [CrossRef]
  34. Hu, H.; Dai, L.; Li, H.; Sun, W.; Li, B. Effect of dehydrogenation on the electrical conductivity of Fe-bearing amphibole: Implications for high conductivity anomalies in subduction zones and continental crust. Earth Planet. Sci Lett. 2018, 498, 27–37. [Google Scholar] [CrossRef]
  35. Dai, L.; Hu, H.; Jiang, J.; Sun, W.; Li, H.; Wang, M.; Vallianatos, F.; Saltas, V. An overview of the experimental studies on the electrical conductivity of major minerals in the upper mantle and transition zone. Materials 2020, 13, 408. [Google Scholar] [CrossRef] [Green Version]
  36. He, Y.; Dai, L.; Kim, D.Y.; Li, H.; Karato, S. Thermal ionization of hydrogen in hydrous olivine with enhanced and anisotropic conductivity. J. Geophys. Res. Solid Earth 2021, 126, e2021JB022939. [Google Scholar] [CrossRef]
  37. Shan, S.; Xiao, C.; Li, H.; Xu, L.; Lin, S.; Li, S. In Situ electrical conductivity measurements of porous water-containing rock materials under high temperature and high pressure conditions in an autoclave. Rev. Sci. Instrum. 2021, 92, 095104. [Google Scholar] [CrossRef]
  38. Dai, L.; Li, H.; Hu, H.; Shan, S. Novel technique to control oxygen fugacity during high-pressure measurements of grain boundary conductivities of rocks. Rev. Sci. Instrum. 2009, 80, 033903. [Google Scholar] [CrossRef]
  39. Gwanmesia, G.; Whitaker, M.; Dai, L.; James, A.; Chen, H.; Triplett, R.; Cai, N. The elastic properties of β-Mg2SiO4 containing 0.73 wt.% of H2O to 10 GPa and 600 K by ultrasonic interferometry with synchrotron x-radiation. Minerals 2020, 10, 209. [Google Scholar] [CrossRef] [Green Version]
  40. Paterson, M. The determination of hydroxyl by infrared absorption in quartz, silicate glass and similar materials. Bull. De Minéralogie 1982, 105, 20–29. [Google Scholar] [CrossRef]
  41. Dai, L.; Li, H.; Hu, H.; Shan, S.; Jiang, J.; Hui, K. The effect of chemical composition and oxygen fugacity on the electrical conductivity of dry and hydrous garnet at high temperatures and pressures. Contrib. Mineral. Petrol. 2012, 163, 689–700. [Google Scholar] [CrossRef]
  42. Dai, L.; Hu, H.; Li, H.; Hui, K.; Jiang, J.; Li, J.; Sun, W. Electrical conductivity of gabbro: The effects of temperature, pressure and oxygen fugacity. Eur. J. Mineral. 2015, 27, 215–224. [Google Scholar] [CrossRef]
  43. Dai, L.; Jiang, J.; Li, H.; Hu, H.; Hui, K. Electrical conductivity of hydrous natural basalt at high temperatures and high pressures. J. Appl. Geophys. 2015, 112, 290–297. [Google Scholar] [CrossRef]
  44. Sun, W.; Dai, L.; Li, H.; Hu, H.; Wu, L.; Jiang, J. Electrical conductivity of mudstone (before and after dehydration at high PT) and a test of high conductivity layers in the crust. Am. Mineral. 2017, 102, 2450–2456. [Google Scholar] [CrossRef]
  45. Sun, W.; Dai, L.; Li, H.; Hu, H.; Jiang, J.; Hui, K. Effect of dehydration on the electrical conductivity of phyllite at high temperatures and pressures. Mineral. Petrol. 2017, 111, 853–863. [Google Scholar] [CrossRef]
  46. Dai, L.; Hu, H.; Sun, W.; Li, H.; Liu, C.; Wang, M. Influence of high conductive magnetite impurity on the electrical conductivity of dry olivine aggregates at high temperature and high pressure. Minerals 2019, 9, 44. [Google Scholar] [CrossRef] [Green Version]
  47. Dai, L.; Sun, W.; Li, H.; Hu, H.; Wu, L.; Jiang, J. Effect of chemical composition on the electrical conductivity of gneiss at high temperatures and pressures. Solid Earth 2018, 9, 233–245. [Google Scholar] [CrossRef] [Green Version]
  48. Dai, L.; Hu, H.; Li, H.; Sun, W.; Jiang, J. Influence of anisotropy on the electrical conductivity and diffusion coefficient of dry K-feldspar: Implications for the mechanism of conduction. Chin. Phys. B 2018, 27, 028703. [Google Scholar] [CrossRef]
  49. Dai, L.; Hu, H.; Li, H.; Wu, L.; Hui, K.; Jiang, J.; Sun, W. Influence of temperature, pressure, and oxygen fugacity on the electrical conductivity of dry eclogite, and geophysical implications. Geochem. Geophys. Geosyst. 2016, 17, 2394–2407. [Google Scholar] [CrossRef]
  50. Dai, L.; Hu, H.; Li, H.; Jiang, J.; Hui, K. Influence of temperature, pressure, and chemical composition on the electrical conductivity of granite. Am. Mineral. 2014, 99, 1420–1428. [Google Scholar] [CrossRef]
  51. Dai, L.; Li, H.; Hu, H.; Jiang, J.; Hui, K.; Shan, S. Electrical conductivity of Alm82Py15Grs3 almandine-rich garnet determined by impedance spectroscopy at high temperatures and high pressures. Tectonophysics 2013, 608, 1086–1093. [Google Scholar] [CrossRef]
  52. Dai, L.; Li, H.; Hu, H.; Shan, S. In-Situ control of oxygen fugacity for laboratory measurements of electrical conductivity of minerals and rocks in multi-anvil press. Chin. Phys. B 2011, 20, 049101. [Google Scholar] [CrossRef]
  53. Dai, L.; Li, H.; Li, C.; Hu, H.; Shan, S. The electrical conductivity of dry polycrystalline olivine compacts at high temperatures and pressures. Mineral. Mag. 2010, 74, 849–857. [Google Scholar] [CrossRef]
  54. Dai, L.; Li, H.; Hu, H.; Shan, S. Experimental study of grain boundary electrical conductivities of dry synthetic peridotite under high-temperature, high-pressure, and different oxygen fugacity conditions. J. Geophys. Res. Solid Earth 2008, 113, B12211. [Google Scholar] [CrossRef] [Green Version]
  55. Dai, L.; Li, H.; Deng, H.; Liu, C.; Su, G.; Shan, S.; Zhang, L.; Wang, R. In-Situ control of different oxygen fugacity experimental study on the electrical conductivity of lherzolite at high temperature and high pressure. J. Phys. Chem. Solids 2008, 69, 101–110. [Google Scholar] [CrossRef]
  56. Dai, L.; Li, H.; Liu, C.; Su, G.; Shan, S. Experimental measurement on the electrical conductivity of pyroxenite at high temperature and high pressure under different oxygen fugacities. High Press. Res. 2006, 26, 193–202. [Google Scholar] [CrossRef]
  57. Dai, L.; Li, H.; Liu, C.; Cui, T.; Shan, S.; Yang, C.; Liu, Q.; Deng, H. Experimental measurement on the electrical conductivity of single crystal olivine at high temperature and high pressure under different oxygen fugacities. Prog. Nat. Sci. 2006, 16, 387–393. [Google Scholar] [CrossRef]
  58. Dai, L.; Li, H.; Liu, C.; Shan, S.; Cui, T.; Su, G. Experimental study on the electrical conductivity of orthopyroxene at high temperature and high pressure under different oxygen fugacities. Acta Geol. Sin. Engl. 2005, 79, 803–809. [Google Scholar]
  59. Dai, L.; Li, H.; Liu, C.; Su, G.; Cui, T. In Situ control of oxygen fugacity experimental study on the crystallographic anisotropy of the electrical conductivities of diopside at high temperature and high pressure. Acta Petrol. Sin. 2005, 21, 1737–1742. [Google Scholar]
  60. Hu, H.; Dai, L.; Li, H.; Hui, K.; Li, J. Temperature and pressure dependence of electrical conductivity in synthetic anorthite. Solid State Ion. 2015, 276, 136–141. [Google Scholar] [CrossRef]
  61. Hu, H.; Dai, L.; Li, H.; Jiang, J.; Hui, K. Electrical conductivity of K-feldspar at high temperature and high pressure. Mineral. Petrol. 2014, 108, 609–618. [Google Scholar] [CrossRef]
  62. Hu, H.; Li, H.; Dai, L.; Shan, S.; Zhu, C. Electrical conductivity of alkali feldspar solid solutions at high temperatures and high pressures. Phys. Chem. Mineral. 2013, 40, 51–62. [Google Scholar] [CrossRef]
  63. Hu, H.; Li, H.; Dai, L.; Shan, S.; Zhu, C. Electrical conductivity of albite at high temperatures and high pressures. Am. Miner. 2011, 96, 1821–1827. [Google Scholar] [CrossRef]
  64. Hui, K.; Dai, L.; Li, H.; Hu, H.; Jiang, J.; Sun, W.; Zhang, H. Experimental study on the electrical conductivity of pyroxene andesite at high temperature and high pressure. Pure Appl. Geophys. 2017, 174, 1033–1041. [Google Scholar] [CrossRef]
  65. Hui, K.; Zhang, H.; Li, H.; Dai, L.; Hu, H.; Jiang, J.; Sun, W. Experimental study on the electrical conductivity of quartz andesite at high temperature and high pressure: Evidence of grain boundary transport. Solid Earth 2015, 6, 1037–1043. [Google Scholar] [CrossRef] [Green Version]
  66. Sun, W.; Dai, L.; Hu, H.; Jiang, J.; Wang, M.; Hu, Z.; Jing, C. Influence of saline fluids on the electrical conductivity of olivine aggregates at high temperature and high pressure and its geological implications. Front. Earth Sci. 2021, 9, 749896. [Google Scholar] [CrossRef]
  67. Sun, W.; Jiang, J.; Dai, L.; Hu, H.; Wang, M.; Qi, Y.; Li, H. Electrical properties of dry polycrystalline olivine mixed with various chromite contents: Implications for the high-conductivity anomalies in subduction zones. Geosci. Front. 2021, 12, 101178. [Google Scholar] [CrossRef]
  68. Sun, W.; Dai, L.; Li, H.; Hu, H.; Jiang, J.; Wang, M. Electrical conductivity of clinopyroxene-NaCl-H2O system at high temperatures and pressures: Implications for high-conductivity anomalies in the deep crust and subduction zone. J. Geophys. Res. Solid Earth 2020, 125, e2019JB019093. [Google Scholar] [CrossRef]
  69. Sun, W.; Dai, L.; Li, H.; Hu, H.; Jiang, J.; Liu, C. Experimental study on the electrical properties of carbonaceous slate: A special natural rock with unusually high conductivity at high temperatures and pressures. High Temp. High Press. 2019, 48, 455–467. [Google Scholar] [CrossRef]
  70. Sun, W.; Dai, L.; Li, H.; Hu, H.; Liu, C. Effect of temperature, pressure and chemical composition on the electrical conductivity of granulite and geophysical implications. J. Mineral. Petrol. Sci. 2019, 114, 87–98. [Google Scholar] [CrossRef] [Green Version]
  71. Sun, W.; Dai, L.; Li, H.; Hu, H.; Liu, C.; Wang, M. Effect of temperature, pressure and chemical compositions on the electrical conductivity of schist: Implications for electrical structures under the Tibetan plateau. Materials 2019, 12, 961. [Google Scholar] [CrossRef] [PubMed] [Green Version]
  72. Dai, L.; Pu, C.; Li, H.; Hu, H.; Liu, K.; Yang, L.; Hong, M. Characterization of metallization and amorphization for GaP under different hydrostatic environments in diamond anvil cell up to 40.0 GPa. Rev. Sci. Instrum. 2019, 90, 066103. [Google Scholar] [CrossRef] [PubMed]
  73. Hong, M.; Dai, L.; Hu, H.; Yang, L.; Zhang, X. Pressure-induced structural phase transitions in natural kaolinite investigated by Raman spectroscopy and electrical conductivity. Am. Mineral. 2022, in press. [Google Scholar] [CrossRef]
  74. Liu, K.; Dai, L.; Li, H.; Hu, H.; Zhuang, Y.; Yang, L.; Pu, C.; Hong, M. Pressure-induced phase transitions for goethite investigated by Raman spectroscopy and electrical conductivity. High Press. Res. 2019, 39, 106–116. [Google Scholar] [CrossRef]
  75. Pu, C.; Dai, L.; Li, H.; Hu, H.; Zhuang, Y.; Liu, K.; Yang, L.; Hong, M. High–pressure electrical conductivity and Raman spectroscopic study of chalcanthite. Spectrosc. Lett. 2018, 51, 531–539. [Google Scholar] [CrossRef]
  76. Yang, L.; Dai, L.; Li, H.; Hu, H.; Hong, M.; Zhang, X. The phase transition and dehydration in epsomite under high temperature and high pressure. Crystals 2020, 10, 75. [Google Scholar] [CrossRef] [Green Version]
  77. Yang, L.; Dai, L.; Li, H.; Hu, H.; Zhuang, Y.; Liu, K.; Pu, C.; Hong, M. Pressure-induced structural phase transition and dehydration for gypsum investigated by Raman spectroscopy and electrical conductivity. Chem. Phys. Lett. 2018, 706, 151–157. [Google Scholar] [CrossRef]
  78. Dai, L.; Liu, K.; Li, H.; Wu, L.; Hu, H.; Zhuang, Y.; Yang, L.; Pu, C.; Liu, P. Pressure-induced irreversible metallization accompanying the phase transitions in Sb2S3. Phys. Rev. B 2018, 97, 024103. [Google Scholar] [CrossRef]
  79. Dai, L.; Zhuang, Y.; Li, H.; Wu, L.; Hu, H.; Liu, K.; Yang, L.; Pu, C. Pressure-induced irreversible amorphization and metallization with a structural phase transition in arsenic telluride. J. Mater. Chem. C 2017, 5, 12157–12162. [Google Scholar] [CrossRef]
  80. Dai, L.; Wu, L.; Li, H.; Hu, H.; Zhuang, Y.; Liu, K. Evidence of the pressure-induced conductivity switching of yttrium-doped SrTiO3. J. Phys Condens. Matt. 2016, 28, 475501. [Google Scholar] [CrossRef]
  81. Dai, L.; Wu, L.; Li, H.; Hu, H.; Zhuang, Y.; Liu, K. Pressure-induced phase-transition and improvement of the micro dielectric properties in yttrium-doped SrZrO3. Europhys. Lett. 2016, 114, 56003. [Google Scholar] [CrossRef]
  82. Hong, M.; Dai, L.; Hu, H.; Zhang, X. Pressure-induced structural phase transition and metallization in Ga2Se3 up to 40.2 GPa under non-hydrostatic and hydrostatic environments. Crystals 2021, 11, 746. [Google Scholar] [CrossRef]
  83. Hong, M.; Dai, L.; Li, H.; Hu, H.; Liu, K.; Yang, L.; Pu, C. Structural phase transition and metallization of nanocrystalline rutile investigated by high-pressure Raman spectroscopy and electrical conductivity. Minerals 2019, 9, 441. [Google Scholar] [CrossRef] [Green Version]
  84. Liu, K.; Dai, L.; Li, H.; Hu, H.; Yang, L.; Pu, C.; Hong, M. Evidences for phase transition and metallization in β-In2S3 at high pressure. Chem. Phys. 2019, 524, 63–69. [Google Scholar] [CrossRef]
  85. Liu, K.; Dai, L.; Li, H.; Hu, H.; Yang, L.; Pu, C.; Hong, M. Phase transition and metallization of orpiment by Raman spectroscopy, electrical conductivity and theoretical calculation under high pressure. Materials 2019, 12, 784. [Google Scholar] [CrossRef] [Green Version]
  86. Liu, K.; Dai, L.; Li, H.; Hu, H.; Wu, L.; Zhuang, Y.; Pu, C.; Yang, L. Migration of impurity level reflected in the electrical conductivity variation for natural pyrite at high temperature and high pressure. Phys. Chem. Miner. 2018, 45, 85–92. [Google Scholar] [CrossRef]
  87. Pu, C.; Dai, L.; Li, H.; Hu, H.; Liu, K.; Yang, L.; Hong, M. Pressure-induced phase transitions of ZnSe under different pressure environments. AIP Adv. 2019, 9, 025004. [Google Scholar] [CrossRef] [Green Version]
  88. Wu, L.; Dai, L.; Li, H.; Hu, H.; Zhuang, Y.; Liu, K. Anomalous phase transition of Bi-doped Zn2GeO4 investigated by electrical conductivity and Raman spectroscopy under high pressure. J. Appl. Phys. 2017, 121, 125901. [Google Scholar] [CrossRef]
  89. Wu, L.; Dai, L.; Li, H.; Zhuang, Y.; Liu, K. Pressure-induced improvement of grain boundary properties in Y-doped BaZrO3. J. Phys. D Appl. Phys. 2016, 49, 345102. [Google Scholar] [CrossRef]
  90. Yang, L.; Jiang, J.; Dai, L.; Hu, H.; Hong, M.; Zhang, X.; Li, H.; Liu, P. High-pressure structural phase transition and metallization in Ga2S3 under non-hydrostatic and hydrostatic conditions up to 36.4 GPa. J. Mater. Chem. C 2021, 9, 2912–2918. [Google Scholar] [CrossRef]
  91. Yang, L.; Dai, L.; Li, H.; Hu, H.; Hong, M.; Zhang, X.; Liu, P. High-pressure investigations on the isostructural phase transition and metallization in realgar with diamond anvil cells. Geosci. Front. 2021, 12, 1031–1037. [Google Scholar] [CrossRef]
  92. Yang, L.; Dai, L.; Li, H.; Hu, H.; Liu, K.; Pu, C.; Hong, M.; Liu, P. Characterization of the pressure-induced phase transition of metallization for MoTe2 under different hydrostatic environments. AIP Adv. 2019, 9, 065104. [Google Scholar] [CrossRef]
  93. Yang, L.; Dai, L.; Li, H.; Hu, H.; Liu, K.; Pu, C.; Hong, M.; Liu, P. Pressure-induced metallization in MoSe2 under different pressure conditions. RSC Adv. 2019, 9, 5794–5803. [Google Scholar] [CrossRef] [Green Version]
  94. Zhang, X.; Dai, L.; Hu, H.; Hong, M. Pressure-induced metallic phase transition in gallium arsenide up to 24.3 GPa under hydrostatic conditions. Mod. Phys. Lett. B 2021, 35, 2150460. [Google Scholar] [CrossRef]
  95. Zhuang, Y.; Dai, L.; Li, H.; Hu, H.; Liu, K.; Yang, L.; Pu, C.; Hong, M. Pressure induced reversible metallization and phase transition in Zinc Telluride. Mod. Phys. Lett. B 2018, 34, 1850342. [Google Scholar] [CrossRef]
  96. Zhuang, Y.; Dai, L.; Li, H.; Hu, H.; Liu, K.; Yang, L.; Pu, C.; Hong, M.; Liu, P. Deviatoric stresses promoted metallization in rhenium disulfide. J. Phys. D Appl. Phys. 2018, 51, 165101. [Google Scholar] [CrossRef]
  97. Zhuang, Y.; Dai, L.; Wu, L.; Li, H.; Hu, H.; Liu, K.; Yang, L.; Pu, C. Pressure-induced permanent metallization with reversible structural transition in molybdenum disulfide. Appl. Phys. Lett. 2017, 110, 122103. [Google Scholar] [CrossRef]
  98. Manthilake, G.; Koga, K.; Peng, Y.; Mookherjee, M. Halogen bearing amphiboles, aqueous fluids, and melts in subduction zones: Insights on halogen cycle from electrical conductivity. J. Geophys. Res. Solid Earth 2021, 126, e2020JB021339. [Google Scholar] [CrossRef]
  99. Manthilake, G.; Peng, Y.; Koga, K.; Mookherjee, M. Tracking slab surface temperatures with electrical conductivity of glaucophane. Sci. Rep. 2021, 11, 18014. [Google Scholar] [CrossRef]
  100. Manthilake, G.; Schiavi, F.; Zhao, C.; Mookherjee, M.; Bouhifd, M.; Jouffret, L. The electrical conductivity of Liebermannite: Implications for water transport into the Earth’s lower mantle. J. Geophys. Res. Solid Earth 2020, 125, e2020JB020094. [Google Scholar] [CrossRef]
  101. Manthilake, G.; Bolfan-Casanova, N.; Novella, D.; Mookherjee, M.; Andrault, D. Dehydration of chlorite explains anomalously high electrical conductivity in the mantle wedges. Sci. Adv. 2016, 2, e1501631. [Google Scholar] [CrossRef] [PubMed] [Green Version]
  102. Manthilake, G.; Mookherjee, M.; Bolfan-Casanova, N.; Andrault, D. Electrical conductivity of lawsonite and dehydrating fluids at high pressures and temperatures. Geophys. Res. Lett. 2015, 42, 7398–7405. [Google Scholar] [CrossRef] [Green Version]
  103. Saltas, V.; Pentari, D.; Vallianatos, F. Complex electrical conductivity of biotite and muscovite micas at elevated temperatures: A comparative study. Materials 2020, 13, 3513. [Google Scholar] [CrossRef]
  104. Saltas, V.; Fitilis, I.; Vallianatos, F. A combined complex electrical impedance and acoustic emission study in limestone samples under uniaxial loading. Tectonophysics 2014, 637, 198–206. [Google Scholar] [CrossRef]
  105. Saltas, V.; Chatzistamou, V.; Pentari, D.; Paris, E.; Triantis, D.; Fitilis, I.; Vallianatos, F. Complex electrical conductivity measurements of a KTB amphibolite sample at elevated temperatures. Mater. Chem. Phys. 2013, 139, 169–175. [Google Scholar] [CrossRef]
  106. Saltas, V.; Vallianatos, F.; Gidarakos, E. Charge transport in diatomaceous earth studied by broadband dielectric spectroscopy. Appl. Clay Sci. 2013, 80–81, 226–235. [Google Scholar] [CrossRef]
  107. Huebner, J.; Dillenburg, R. Impedance spectra of hot, dry silicate minerals and rock: Qualitative interpretation of spectra. Am. Mineral. 1995, 80, 46–64. [Google Scholar] [CrossRef]
  108. Macdonald, J.; Barsoukov, E. Impedance Spectroscopy: Theory, Experiment, and Applications, 2nd ed.; Wiley-Interscience: New York, NY, USA, 2005; pp. 1–595. [Google Scholar]
  109. Ter Heege, J.; Renner, J. In situ impedance spectroscopy on pyrophyllite and CaCO3 at high pressure and temperature: Phase transformations and kinetics of atomistic transport. Phys. Chem. Miner. 2007, 34, 445–465. [Google Scholar] [CrossRef]
  110. Cline, C., II; Faul, U.; David, E.; Berry, A.; Jackson, I. Redox-influenced seismic properties of upper-mantle olivine. Nature 2018, 555, 355–358. [Google Scholar] [CrossRef]
  111. Tollan, P.; Smith, R.; O’Neill, H.; Hermann, J. The responses of four main substitution mechanisms of H in olivine to H2O activity at 1050 °C and 3 GPa. Prog. Earth Planet. Sci. 2017, 4, 14. [Google Scholar] [CrossRef]
  112. Poli, S.; Schmidt, M. Experimental subsolidus studies on epidote minerals. Rev. Mineral. Geochem. 2004, 56, 171–195. [Google Scholar] [CrossRef]
  113. Bagdassarov, N.; Delépine, N. αβ inversion in quartz from low frequency electrical impedance spectroscopy. J. Phys. Chem. Solids 2004, 65, 1517–1526. [Google Scholar] [CrossRef]
  114. Sinmyo, R.; Keppler, H. Electrical conductivity of NaCl-bearing aqueous fluids to 600 °C and 1 GPa. Contrib. Mineral. Petrol. 2017, 172, 4. [Google Scholar] [CrossRef]
  115. Christensen, N.; Mooney, W. Seismic velocity structure and composition of the continental crust: A global view. J. Geophys. Res. Solid Earth 1995, 100, 9761–9788. [Google Scholar] [CrossRef]
  116. Schmidbauer, E.; Kunzmann, T.; Fehr, T.; Hochleitner, R. Electrical resistivity and 57Fe Mossbauer spectra of Fe-bearing calcic amphiboles. Phys. Chem. Miner. 2000, 27, 347–356. [Google Scholar] [CrossRef]
  117. Phillips, M.; Popp, R.; Clowe, C. Structural adjustments accompanying oxidation-dehydrogenation in amphiboles. Am. Mineral. 1988, 73, 500–506. [Google Scholar]
  118. Glover, P.; Vine, F. Electrical conductivity of the continental crust. Geophys. Res. Lett. 1994, 21, 2357–2360. [Google Scholar] [CrossRef]
  119. Zhou, W.; Fan, D.; Liu, Y.; Xie, H. Measurements of wave velocity and electrical conductivity of an amphibolite from southwestern margin of the Tarim Basin at pressures to 1.0 GPa and temperatures to 700 °C: Comparison with field observations. Geophys. J. Int. 2011, 187, 1393–1404. [Google Scholar] [CrossRef] [Green Version]
  120. Wang, D.; Guo, Y.; Yu, Y.; Karato, S. Electrical conductivity of amphibole-bearing rocks: Influence of dehydration. Contrib. Mineral. Petrol. 2012, 164, 17–25. [Google Scholar] [CrossRef]
  121. Reynard, B.; Mibe, K.; de Moortèle, B.V. Electrical conductivity of the serpentinised mantle and fluid flow in subduction zones. Earth Planet. Sci. Lett. 2011, 307, 387–394. [Google Scholar] [CrossRef]
  122. Wang, D.; Karato, S. Electrical conductivity of talc aggregates at 0.5 GPa: Influence of dehydration. Phys. Chem. Miner. 2013, 40, 11–17. [Google Scholar] [CrossRef]
  123. Guo, X.; Yoshino, T. Pressure-induced enhancement of proton conduction in brucite. Geophys. Res. Lett. 2014, 41, 813–819. [Google Scholar] [CrossRef]
  124. Balan, E.; Calas, G.; Bish, D. Kaolin-group minerals: From hydrogen-bonded layers to environmental recorders. Elements 2014, 10, 183–188. [Google Scholar] [CrossRef]
  125. Schroeder, P.; Erickson, G. Kaolin: From ancient porcelains to nanocomposites. Elements 2014, 10, 177–182. [Google Scholar] [CrossRef]
Figure 1. High-pressure experimental platform for the measurements of electrical properties of minerals and rocks using the electrochemical AC impedance spectroscopy in HTHPSEI, Institute of Geochemistry, Chinese Academy of Sciences. In here, (a) stands for the YJ-3000t multi-anvil apparatus, (b) stands for the combined interface of Solartron-1260 and Solatron-1296 Impedance/Gain-phase analyzers, and (c) stands for the Vertex-70V vacuum high-resolution and high-precision FT-IR analyzer, respectively.
Minerals 12 00161 g001
Figure 2. Representative FTIR spectra for hot-pressed sintering polycrystalline olivine aggregates within the wavenumber range from 3000 to 3800 cm−1. Here, (a) displays a series of Ti-poor sample with three different water contents (552, 241, and 70 ppm wt); (b) displays a series of Ti-rich sample with four different water contents (529, 214, 76, and 13 ppm wt). The titanium content in polycrystalline olivine aggregates (200 and 683 ppm wt) was precisely checked by the inductively coupled plasma mass spectrometry (ICP-MS) analysis in the Department of Earth and Planetary Sciences, Yale University (reproduced with permission from the reference of Dai and Karato [9]; published by the American Geophysical Union, 2020).
Minerals 12 00161 g002
Figure 3. Measurement assemblage of sample for electrical conductivity measurements in the diamond anvil cell (DAC) at high pressure. In here, (a) stands for a detailed configuration for two symmetric plate electrodes integrated between upper and lower blocks of diamond anvils; (b) stands for the cross-sectional diagram of the DAC used for high-pressure impedance spectroscopy measurements.
Minerals 12 00161 g003
Figure 4. Representative complex impedance spectra for natural hydrous Fe-bearing amphibole single crystals from Sichuan province of southwest China at conditions of 1.0 GPa, 623–1173 K and the frequency ranges from 10−1 to 106 Hz. Here, (a,b) represent complex impedance spectra during the 1st heating cycle before the dehydrogenation process, respectively; (c,d) represent complex impedance spectra during the equivalent state of 3rd cooling cycle after the oxidation−dehydrogenation reaction, respectively. It is clear that the variation of impedance semi-circular arc from the inductive loop to normally “standardized” small tail within the low frequency regime of ~10−1−103 Hz at the critical temperature of ~873 K reveals the occurrence of an oxidation−dehydrogenation reaction. The equivalent circuit composed of two individually parallel resistance and constant phase element in the series connection was chosen to fit these impedance arcs for (a,c,d), respectively; the equivalent circuit composed of two individually parallel resistance and inductive reactance in the series connection was chosen to fit these impedance arcs for (b) (reproduced with permission from the reference of Hu et al. [34]; published by Elsevier, 2018).
Minerals 12 00161 g004
Figure 5. Electrical conductivity of hot-pressed polycrystalline olivine aggregates with different TiO2 contents under conditions of 4 GPa, 873−1273 K, and the Ni–NiO oxygen buffer. Here, (a,c) stand for the dependence of electrical conductivity on the inverse temperature for olivines with its correspondent TiO2 contents of 200 and 683 ppm wt, respectively; (b,d) stand for the dependence of electrical conductivity on the water content for olivine samples with its correspondent TiO2 contents of 200 and 683 ppm wt, respectively. The exponential factors between the electrical conductivity for Ti-poor and Ti-rich olivines along with the variation of water content were determined as 0.51 ± 0.18 and 0.98 ± 0.21, respectively (reproduced with permission from the reference of Dai and Karato [9]; published by the American Geophysical Union, 2020).
Minerals 12 00161 g005
Figure 6. The electrical conductivity of dry (13 ppm wt) and hydrous (458 ppm wt) polycrystalline olivine aggregates with the correspondent TiO2 content of 683 ppm wt as a function of the variation of oxygen fugacity at 4.0 GPa, temperatures range from 873 to 1273 K and controlled different oxygen fugacities. In here, (a) stands for the high Ti-doped hydrous sample, and as well as (b) stands for the high Ti-doped dry sample, respectively. The oxygen fugacity is efficiently controlled by three solid oxygen buffers including the rehnium and rehnium dioxide (Re–ReO2), nickel and nickel oxide (Ni–NiO), and molybdenum and molybdenum dioxide (Mo–MoO2). The FTIR measurement results indicated that the water contents of dry and hydrous polycrystalline olivine aggregates are 13 and 458 ppm wt, respectively (reproduced with permission from the reference of Dai and Karato [9]; published by the American Geophysical Union, 2020).
Minerals 12 00161 g006
Figure 7. Pressure dependent electrical conductivity of hydrous epidote at the pressure ranges from 0.5 to 1.5 GPa and temperatures ranges from 573 to 1273 K. The dehydration reaction of hydrous epidote occurred at the critical temperature point of ~1073 K. The electrical conductivity of hydrous epidote is well reproducible before and after the occurrence of dehydration reaction at given pressure ranges from 0.5 to 1.5 GPa. Previously, acquired electrical conductivity results on the hot-pressed sintering polycrystalline quartz from Bagdassarov and Delépine (2004) [113], the synthetic polycrystalline anorthite from Hu et al. (2015) [60], as well as the pure aqueous fluid with the 5% of weight percentage of sodium chloride from Sinmyo and Keppler (2017) [114] are also compared in detail (reproduced with permission from the reference of Hu et al. [33]; published by the American Geophysical Union, 2017).
Minerals 12 00161 g007
Figure 9. The electrical conductivity–depth profile according to these presently obtained electrical conductivity results on the Fe-bearing hydrous amphibole within the depth ranges from 20 to 40 km (a), and at the same time, several electrical conductivity results of some dominant hydrous minerals (e.g., NaCl-bearing saturated amphibole, antigorite, talc, brucite, and chlorite) in the subduction zone are also comprehensively compared (b). Data resource: the electrical conductivity of saturated amphibole with 0.5 sodium chloride from Glover and Vine (1994) [118], antigorite from Reynard et al. (2011) [121]; talc from Wang and Karato (2013) [122]; brucite from Guo and Yoshino (2014) [123], and chlorite from Manthilake et al. (2016) [101] (reproduced with permission from the reference of Hu et al. [34]; published by Elsevier, 2018).
Minerals 12 00161 g009
Figure 10. The temperature–pressure phase boundary based on the acquired high-pressure electrical conductivity and Raman scattering results on natural hydrous kaolinite at conditions of pressure ranges of 2.3–6.5 GPa, temperature ranges of 293–673 K, and depth ranges of 38–200 km. In here, two representative geothermal gradients of 5 and 10 K/km are selected to model the cold and hot subduction, respectively (reproduced with permission from the reference of Hong et al. [73]; published by Geoscience World, 2022).
Minerals 12 00161 g010
Publisher’s Note: MDPI stays neutral with regard to jurisdictional claims in published maps and institutional affiliations.

