
Are Coal-Hosted Gallium-Rich Ores Elastically Detectable: A Rock-Physics Modeling Perspective

1
Laboratory of Coalbed Methane Resources & Reservoir Formation Process, Ministry of Education, China University of Mining and Technology, Xuzhou 221008, China
2
School of Resource and Earth Science, China University of Mining and Technology, Xuzhou 221116, China
*
Author to whom correspondence should be addressed.
Minerals 2022, 12(12), 1619; https://doi.org/10.3390/min12121619
Submission received: 17 October 2022
/
Revised: 24 November 2022
/
Accepted: 12 December 2022
/
Published: 15 December 2022
(This article belongs to the Special Issue Critical Metal Minerals in Coal)
Abstract
:Coal-hosted gallium-rich ores are mainly explored with geochemical analyses, and their elasticities lack research. This paper incorporated core testing, rock-physics modeling, and Monte Carlo simulations to characterize the elastic parameters of gallium-rich cores and discuss whether coal-hosted gallium-rich ores are elastically detectable. The measured cores from No. 6 coal in the Heidaigou mine showed that the gallium contents strongly correlate to the boehmite contents with a 0.96 correlation coefficient. The rock-physics modeling results showed that mineral compositions and contents are critical factors influencing elastic parameters, and elastic parameters in No. 6 coal showed profound heterogeneities as mineral compositions and contents. The preferred parameters for classifying and grouping different mineral-rich cores are the bulk modulus and moduli ratio. Cross-plotting bulk modulus vs. moduli ratio can qualitatively group measured cores and Monte-Carlo simulated realizations into different mineral-rich and saturation states properly. Concerning the factors of boehmite content, porosity, and saturation state, an interpretation template for boehmite-rich coal was proposed and used. As the template interpreted readings close to the measured contents, the built templates can quantitatively interpret boehmite and gallium contents in coal-hosted ores with high precision. In summary, the coal-hosted gallium-rich ores are elastically detectable.
1. Introduction
Coal resources have been widely deposited in China over a long geological period and distributed widely across China. Under specific geological conditions, various strategic metals, including gallium, aluminum, magnesium, lithium, germanium, uranium, zirconium, and niobium, are enriched in coalbeds and form coal-type strategic metal deposits [1,2]. For metal gallium in coal, its distributions are mainly in the Carboniferous-Permian coal seams in North China, the Jurassic coal seams in Northwest China, and the Permian coal seams in South China. Compared with other coal-bearing areas, the Junggar coalfield in Inner Mongolia province has been extensively studied [3,4,5,6,7,8]. Due to the considerable thickness and high gallium enrichment in coal, the Junggar Coalfield has deposited a large amount of metal gallium, which can partly offset China’s gallium reserve shortage. Among the mines in the Junggar Coalfield, No. 6 coal of the Heidaigou and Haerwusu mines in the coalfield’s central area is extra thick (30 m and 21 m on average respectively) and has deposited high gallium contents (44.8 ppm and 18.0 ppm on average, respectively) [4,5]. These make them become one of the most preferred gallium reserves in China. The coalbeds in the Junggar coalfield coexists with metal aluminum and lithium, making the coalfield a sweet spot for strategic metals.
Although metal gallium is rich in the Jungar coalfield, its lateral and vertical distributions are highly heterogeneous, its carrier minerals are relatively diverse (mainly boehmite followed by kaolinite), and its spatial and temporal configurations are complex [4,5,9]. So far, geochemistry is the primary tool to understand the gallium deposits in coalbeds. As a direct exploration, a geochemical survey intensely relies on field core sampling and lab testing [10]. Its workload is extremely high, its exploration density is ordinarily limited, and its survey efficiency is usually low. With only the geochemical survey, it is generally tough to figure out the ore distributions correctly. Geophysical explorations, including wireline logging and seismic surveying, are indirect survey methodologies with high exploration densities and efficiencies [10]. For coal-hosted metal uranium deposits, gamma-ray logging has been used to characterize ore distributions incorporating uranium’s naturally radioactive characteristics [11,12,13,14]. However, few geophysical methodologies have explored nonradioactive metal deposits in coalbeds. It can be hypothesized that geophysical surveys constrained by geochemical measurement can identify nonradioactive mental deposits such as gallium-rich coal and characterize ore distributions in coal-bearing strata. To this end, the elasticities of No. 6 coal in the Heidaigou mine were analyzed in this study.
The existence of elasticity contrasts among subsurface media is the basis of acoustic wireline logging and seismic exploration on discovering subsurface structures, lithology, and fluid saturation [15,16]. As the literature reveals, many factors, including lithology, porosity, grain contact, microstructure, cementation, diagenesis, fluid saturation, temperature, wave frequency, and geo stress, affect the elasticities of crust rocks [17,18,19,20,21,22,23,24]. However, geophysical explorations are limited to elastic properties, including velocities, impedances, moduli, Poisson’s ratio, anisotropy, and attenuation. The imbalanced associations between influencing factors and available properties can cause interpretation uncertainties and make subsurface surveys hard. Rock physics methodologies, including lab testing and theoretical modeling, are the most used tools to reveal the associations between individual factors and elastic properties [25]. Lab testing typically uses ultrasonic wave and stress–strain measurement on sampled cores to understand high- and low-frequency velocities and attenuations [26,27,28]. The theoretical modeling adopts mathematic equations, such as bound theories, equivalent medium models, and fluid substitution methodologies, to uncover the influences of rock composition, porosity, geometry, and fluid on rock elasticities [15,25]. With rock physical analyses, researchers can minimize the interpretation uncertainty and improve the depiction accuracy of geological anomalies.
As a typical sedimentary rock, coal is complex in mineral composition and content, pore size and structure, grain size and contacts, and coal rank. Coal rank plays a leading role in influencing coal’s elasticities. Generally, density, velocities, moduli, and anisotropy are positively correlated to coal rank, but Poisson’s ratio has an inverse variation trend [29]. As bituminous coal, No. 6 coal in the Junggar coalfield has moderate velocities and Poisson’s ratio. Grain size and contact influence coal elasticities as well. Highly deformed coal, including mylonite and wrinkle coals, have small grain sizes and weak contacts. Their velocities, moduli, and anisotropy are far lower than primary coals [30,31,32]. However, undeformed coal and low-level deformed cataclastic coal have high velocities, moduli, and anisotropy. Pore size and structure affect coal elasticities [33,34,35,36]. Suppose coal has sparse and near-round pores, its velocities and moduli are high, and its Poisson’s ratio and anisotropy are relatively low. When coal is rich in low aspect ratio cracks, its velocities are highly orientation related, i.e., high-velocity anisotropy [30,37]. Last, mineral composition and content affect coal elasticities [29,38]. Coal velocities, density, impedance, and modulus are usually high when coal contains notable heavy minerals.
In this study, we characterize the elastic parameters of different mineral-rich cores, qualitatively discuss the elastically detectable of coal-hosted gallium-rich ores, and propose a quantitative interpretation template for coal-hosted gallium-rich ores incorporating core testing, rock-physics modeling, Monte Carlo simulation, and interpretation template building.
2. Geological Background
2.1. Geological Setting
The Heidaigou mine is a significant producing mine of the Jungar coalfield, located on the northeast margin of the Ordos basin, North China (Figure 1). Its mining area is 42.36 km2, and its coal reserve is 1.5 billion tonnes. Along with the Jungar coalfield, the study area is generally an uplift terrace in the east and a depression in the west [4,5,6,7]. The geological structures in the area are generally simple, and the sediment strata are generally flat (<10°). The developed low-dense folds and faults are small in scale and mainly trend along the NE direction. As the characteristics of the North China plate, most faults in the region are normal faults [7].
The total thickness of coal-bearing strata in the region is approximately 150 m, including the Benxi and Taiyuan formations of the Carboniferous age and the Shanxi Formation of the Permian period [5]. The overlying layers of the coal-bearing strata are sandstone and mudstone of the Shihezi Formation, and the underlying layer is the Ordovician limestone strata. Among all coal seams, No. 6 coal of the uppermost Taiyuan formation is the thickest (~30 m). The coal type of No. 6 coal is bituminous coal, and the buried depth of No. 6 coal is 80–100 m. As recent research, No. 6 coal is a strategic metal ore of metal gallium in the Junggar coalfield [4,5,6,7]. As revealed, the gallium in No. 6 coal is mainly derived from the bauxite of the underlying Benxi formation. As Dai, Ren, and Li [5] reported, boehmite is the leading carrier mineral of metal gallium in No. 6 coal.
2.2. Core Samples
Dai, Ren, and Li [5] sampled seven cores from No. 6 coal in the Heidaigou mine following the Chinese Standard Method GB482-1985, as shown in Figure 2. Coalbed thickness of the sample location is 30 m, and the cores are numbered from the roof to the floor sequentially. After the measurement of instrumental neutron activation analysis (INAA), inductively coupled plasma mass spectrometry (ICP-MS), X-ray fluorescence spectrometry (XRF), scanning electron microscope equipped with an energy-dispersive X-ray spectrometer (SEM-EDX), and X-ray diffraction spectrometer (XRD), the mineral compositions and gallium concentrations of the cores have been analyzed. In this paper, we reorganized the results and listed them in Table 1.
2.3. Mineral Enrichment Characteristics
Table 1 shows that organics, minerals, and gallium (Ga) enrichments in sampled cores are strongly heterogeneous. Organic matter accounts for most cores, where the contents of cores 6–4 and 6–5 are relatively high, and the contents of cores 6–1, 6–2, and 6–6 are relatively low. In comparison, mineral contents in cores are relatively low. The leading mineral in core 6–1 is quartz; in cores 6–2, 6–3, and 6–4 is boehmite; in cores 6–5, 6–6, and 6–7 is clay (kaolinite). Gallium contents in coal are high in cores 6–2, 6–3, 6–4, and 6–6, especially in core 6–3. These phenomena revealed a correlation between gallium and boehmite contents. As Dai, Ren, and Li [5] reported, the minerals in cores 6–6 and 6–7 are dominated by clay minerals of terrigenous origin as the most coalfield in the Ordos basin. However, the extremely high concentration of boehmite and gallium in cores 6–2, 6–3, 6–4, and 6–5 are related to the Middle Proterozoic moyite of the Yinshan Oldland. As the fitted determination coefficient R2 in Figure 3 is high (0.96), it is confident that the gallium content is directly related to boehmite and can be calculated from one to the other in the area.
Calculating the cross-correlation coefficients of all listed microscopic components (organic matter and minerals) among cores in Table 1 and listing the results in Table 2, the results show that cores 6–2, 6–3, and 6–4 have over 0.99 cross-correlation coefficients and more significant than the coefficients to other cores. As these three cores have high boehmite and gallium contents, it is reasonable to conclude that the gallium-rich cores in No. 6 coal have very similar mineral compositions and contents, which differ from other cores. These phenomena are the basis for the rock-physics modeling of this research.
Calculating the cross-correlation coefficients of all contents in Table 1 and listing the results in Table 3, the results show organic matters have a robust negative correlation with calcite, a moderate negative correlation with quartz, and a moderate positive correlation with pyrite, indicating a coal-prone deposition environment in the peat. The clay has a strong negative correlation with boehmite and a strong positive correlation with pyrite. The boehmite contents are negatively correlated with clay and pyrite but strongly and positively correlated with gallium. These characteristics indicate that boehmite and clay contents vary in the opposite trends in cores from No. 6 coal, and boehmite is the leading carrier of metal gallium [5]. Therefore, this study treats boehmite as the carrier mineral of gallium and uses boehmite content to model rock-physics characteristics of gallium-rich coal.
3. Methods
3.1. VRH Average
Coal is a complex mixture of organic matter and minerals. Because the composition geometries and grain contacts of coal components are complex, it is hard to estimate every specific component’s effects on coal moduli. However, the effective modulus of solid mixture will fall between the upper Voigt bound MV and the lower Reuss bound MR, as shown in Equation (1). Physically, Voigt bound assumes all components are connected in parallel, and Reuss bound assumes all components are connected in series. As the Voigt–Reuss–Hill (VRH) average does not assume any mixing geometry, its estimate MVRH is the most commonly used equivalent modulus of solid mixtures [15,39]. Generally, the VRH average has high accuracy when the components have similar moduli.
where N ≥ 2, fi is the volume ratio of the ith component, Mi is the modulus of the ith component.
3.2. DEM Model
Besides organic matter and minerals, coal is also complex in pore structures. The differential equivalent medium (DEM) model simulates two-phase mixtures by gradually adding inclusions to the solid mineral phase and is one of the most commonly used methods for calculating the equivalent modulus of porous media at high frequency [15,40,41,42]. The expression is
where K* and μ* are the effective bulk and shear moduli, K*(0) = K1 and μ*(0) = μ1 are the bulk and shear moduli of the initial host material (phase one), K2 and μ2 are the bulk and shear moduli of the incrementally added inclusions (phase two), y is the concentration of phase two, and P*2 and Q*2 are the geometric factors of inclusions. As a model of equivalent medium theory, the calculated moduli of a DEM model are a high-frequency approximation. If the inclusions are pores and cracks, the approximation is correct only when the pores and cracks are dry. In this paper, we sequentially embedded stiff pores and soft cracks with a DEM model to compute the equivalent moduli of dry cores.
3.3. Gassmann Fluid Replacement
As DEM embedding is only suitable for calculating the moduli of dry coal, the dry pores and cracks in coal must be replaced with water to achieve the approximate moduli of water-saturated coal. As the crack porosity in coal is usually far smaller than pore porosity, this research uses the conventional Gassmann’s equation below for fluid replacement [15,43].
where K0, Ksat1, and Ksat2 are the bulk moduli of coal matrix, fluid one saturated coal, and fluid two saturated coal, respectively; μsat1 and μsat2 are the shear moduli of fluid one and fluid two saturated coals, respectively; Kfl1 and Kfl2 are the bulk moduli of fluid one and fluid two, respectively; ϕ is the porosity.
3.4. Rock-Physics Modeling Workflow
Since the elastic properties of gallium-rich coal are understudied, in this paper, we use the rock-physics methodologies mentioned above to model the elastic properties of gallium-rich cores and compare them with the elastic properties of other cores [39,40,44]. Figure 4 presents the schematic flowchart of the procedures. The procedures first mix the organic matter and minerals with the VRH average for every core and form the corresponding coal matrices. Then, the procedures embed dry pores and cracks (with near-zero moduli infill) into the coal matrix and form the dry coal, where the porosity is assumed as the measured porosity of No. 6 coal. Finally, following Gassmann fluid replacement workflow, the procedures saturate the pores and cracks in the dry core with water and form the water-saturated core. After the above procedures, the elastic properties for core matrices, dry cores, and water-saturated cores are achieved correspondingly. The elastic properties include bulk modulus (K), shear modulus (μ), P-impedance (IP), S-impedance (IS), P-velocity (VP), S-velocity (VS), moduli ratio (K/μ), and velocity ratio (VP/VS).
3.5. Monte Carlo Simulation
The number of sampled cores is generally limited for surveys, which may bias the understanding of the elastic characteristics of target layers. Monte Carlo simulation is a multiple probability simulation used to estimate the possible occurrences of an uncertain event by drawing samples xi from a known cumulative probability distribution function (CDF) F(x). In most surveys, the analytical CDF is unknown, but it can be approximated from observed data by computing the nonparametric CDF [15], as shown in Figure 5. For correlated variables, the regression among variables is a mainly used procedure for simulations.
4. Results
4.1. Contents in Volume
Different from geochemical measurement, rock-physics modeling uses volume content as input. The transformation equations from weight content to volume content are expressed below.
where N is the number of compositions, ρi is the density of the ith component, ρall is the average density of all components, Wi is the weight content of the ith component, and Vi is the volume content of the ith component. After calculation, the weight contents, listed in Table 1, were transformed into volume contents as listed in Table 4. Compared with Table 1, the volume contents of organic and clay components are higher than the weight contents because of their low-density nature, and the volume contents of the other components are lower than the weight contents because of their high-density nature. Ignoring the unit difference, the computed moduli of cores may be biased.
4.2. Component Moduli and Density
Component moduli and densities are essential inputs for rock-physics modeling and are a fundamental challenge for research. As the vitrinite reflectance of No. 6 coal is low (~0.6%), this study uses elastic moduli of low coalification kerogen for the organic component [15]. The clay contents in all cores are mainly kaolinite, and its elastic moduli are used for clay components. As well-studied minerals, the elastic moduli of pyrite, quartz, and calcite are well known. In this paper, we use the most recognized values in literature as their moduli [15,45]. For siderite, in this paper, we use the computed moduli by density functional theory; for boehmite, in this paper, we use the mean moduli of atomic force microscopy experiment and molecular dynamic finite element simulation [46,47]. All the used moduli and densities are listed in Table 5.
4.3. Elastic Parameters of Cores
Following the rock-physics modeling workflow in Section 3.4, in this study, we first calculate the bulk and shear moduli of the mixed matrices for all cores using the VRH average. Then, we calculate the bulk and shear moduli for dry cores using the DEM model. As the measured porosity of No. 6 coal in the Heidaigou mine is 4%, coal porosity is assumed to be 4% when embedding pores and cracks into core matrices. As most porosities in coal are stiff pores with near round shape, we set the pores (account for 97% porosity) as stiff pores with a 1.0 aspect ratio (the vertical to horizontal scale) and set the rest porosity as penny-shaped soft cracks with a 0.001 aspect ratio [41,42,48]. During calculation, we first embedded the dry stiff pores into the core matrices and then embedded the dry soft cracks into the porous core to achieve the equivalent bulk and shear moduli. After that, we calculate bulk and shear moduli of water-saturated cores using Gassmann fluid replacement. Finally, with the calculated moduli, the study calculates other elastic parameters following Equations (5) and (6).
where, ρavg is the density mean, ρm is the matrix density, ρf is the fluid density, and ϕ is porosity.
where the variables are the same as in Section 3.4. Following the above procedures, the study calculated all mentioned elastic parameters and showed the results in Figure 6. Comparing the computed elastic parameters with the measured values of bituminous coal by Morcote et al. [29], the results show they have similar moduli, velocities, and velocity ratios. This consistency is proof of the proposed modeling approach.
As core-content variations, the elastic parameters are heterogeneous across the cores. Generally, moduli, impedances, and velocities among the cores have similar variation trends but differ in specific values. Cores 6–1, 6–2, 6–3, and 6–4 have higher moduli, impedance, and velocities, and cores 6–1, 6–5, 6–6, and 6–7 have smaller modulus ratios and velocity ratios except for dry conditions. Under dry conditions, the modulus and velocity ratios of core 6–1 are smaller than other cores. The reasons caused these phenomena are related to elasticity and content differences of core components. For example, quartz is the leading mineral of core 6–1, whose Poisson’s ratio (0.08) is lower than kaolinite (0.14) and boehmite (0.21). These differences cause core 6–1 to have the least modulus and velocity ratios.
Comparing elastic parameters among core matrices, dry cores, and water-saturated cores, their values sort differently. Core matrices have the largest values in moduli, impedances, and velocities and the least values in modulus ratios and velocity ratios. Dry cores have the least values in moduli, impedances, and P-velocities and the intermediate values in modulus ratios and velocity ratios. Water-saturated cores have intermediate values in moduli, impedances, and P-velocity, the least values in S-velocity, and the largest values in modulus ratios and velocity ratios.
4.4. Cross-Plot Characteristics of Cores
The computed elastic parameters of moduli, impedances, and velocities show similar variation trends across cores under the same computed conditions, and bulk modulus has an enormous variation scope. Similarly, the modulus and velocity ratios have similar variation trends across cores under the same computed conditions, and the modulus ratio has the most extensive variation scope. As a result, the cross-plot of bulk modulus vs. modulus ratio has the most significant variation scope and can probably distinguish cores from each other with the highest confidence. Therefore, in this study, we use the cross plot to reveal the classification characteristics of cores, as shown in Figure 7.
The scattering points calculated for core matrices, dry cores, and water-saturated cores show prominent grouping distribution characteristics in the cross-plot. Considering bulk modulus, the scattering characteristics for core matrices and water-saturated cores are similar but differ from dry cores. Under a specific state, the quartz-rich core 6–1 is group one, located in the middle-bottom area under all situations. The boehmite-rich cores 6–2, 6–3, and 6–4 are group two, located near the top-right corner for core matrices and water-saturated cores but located in the middle-right sider for dry cores. The clay-rich cores 6–5, 6–6, and 6–7 are group three, located near the bottom-left corner for core matrices and water-saturated cores but located near the top-left corner for dry cores. As a result, the cross-plots between bulk modulus vs. modulus ratio can classify and group different mineral-rich cores under matrix, dry, and water-saturated situations. With these cross-plots, one can qualitatively interpret different mineral-rich cores from each other. As core matrices are not applicable for practical applications, this research ignores them in the following sections.
Since different mineral-rich cores in a specific state can be appropriately grouped, in this paper, we further study the possibility of simultaneously classifying and grouping cores under different states. As Figure 7 shows, water-saturated cores are in the topmost subsection, dry cores are in the middle subsection, and core matrices are in the bottom subsection. The gap between two states is larger than the gaps between groups at a given state. After pore embedded (PE) and fluid replacement (FR), the magnitudes and variation scopes of scattering points differ notably from coal matrices, and the variations follow the marked PE and FR trends. As the relative positions and distribution characteristics of scattering points are unchanged during state changing, the cross-plot of bulk modulus vs. modulus ratio can simultaneously classify and group different mineral-rich cores under different states.
5. Discussion
5.1. Cross-Plot Characteristics after Monte Carlo Simulations
As the number of sampled cores in this study is limited, the cross-plot characteristics of different mineral-rich cores may be biased during analysis. The authors overcome this disadvantage using the calculated nonparametric CDFs and Monte Carlo simulations to draw all possible distributions of every kind of mineral-rich coal. The nonparametric CDFs of boehmite-rich and clay-rich cores under a dry state are directly calculated from their precalculated bulk and shear moduli. However, this study only has one quartz-rich core, and it is impossible to compute its nonparametric CDF. Therefore, in this paper, we assume the quartz-rich core has the same CDF variation range as the boehmite-rich cores but differs in specific moduli values. After this assumption, this study simulated 1000 realizations for every type of mineral-rich coal under a dry state using their corresponding nonparametric CDFs. Then, we use Gassmann fluid replacement to saturate dry pores and cracks and achieve the corresponding bulk moduli of a water-saturated state for all realizations. As the shear modulus for dry and water-saturated states are the same, we directly calculate the modulus ratios and show the results in Figure 8.
As measured cores, the cross-plot of realizations has group distribution characteristics and similar variation trends. Dry-state realizations are in the lower half, and water-saturated realizations are in the upper half. The gap between dry and water-saturated states is more significant than between groups in a dry or water-saturated state. After fluid replacement, the magnitude and variation scope of scattering points are magnified and follow the marked fluid replacement (FR) trend. Therefore, the cross-plot of bulk modulus vs. modulus ratio can distinguish realizations into different groups as measured cores did and can be used to qualitatively interpret mineral-rich and saturation states.
5.2. Interpretation Template for Boehmite Content
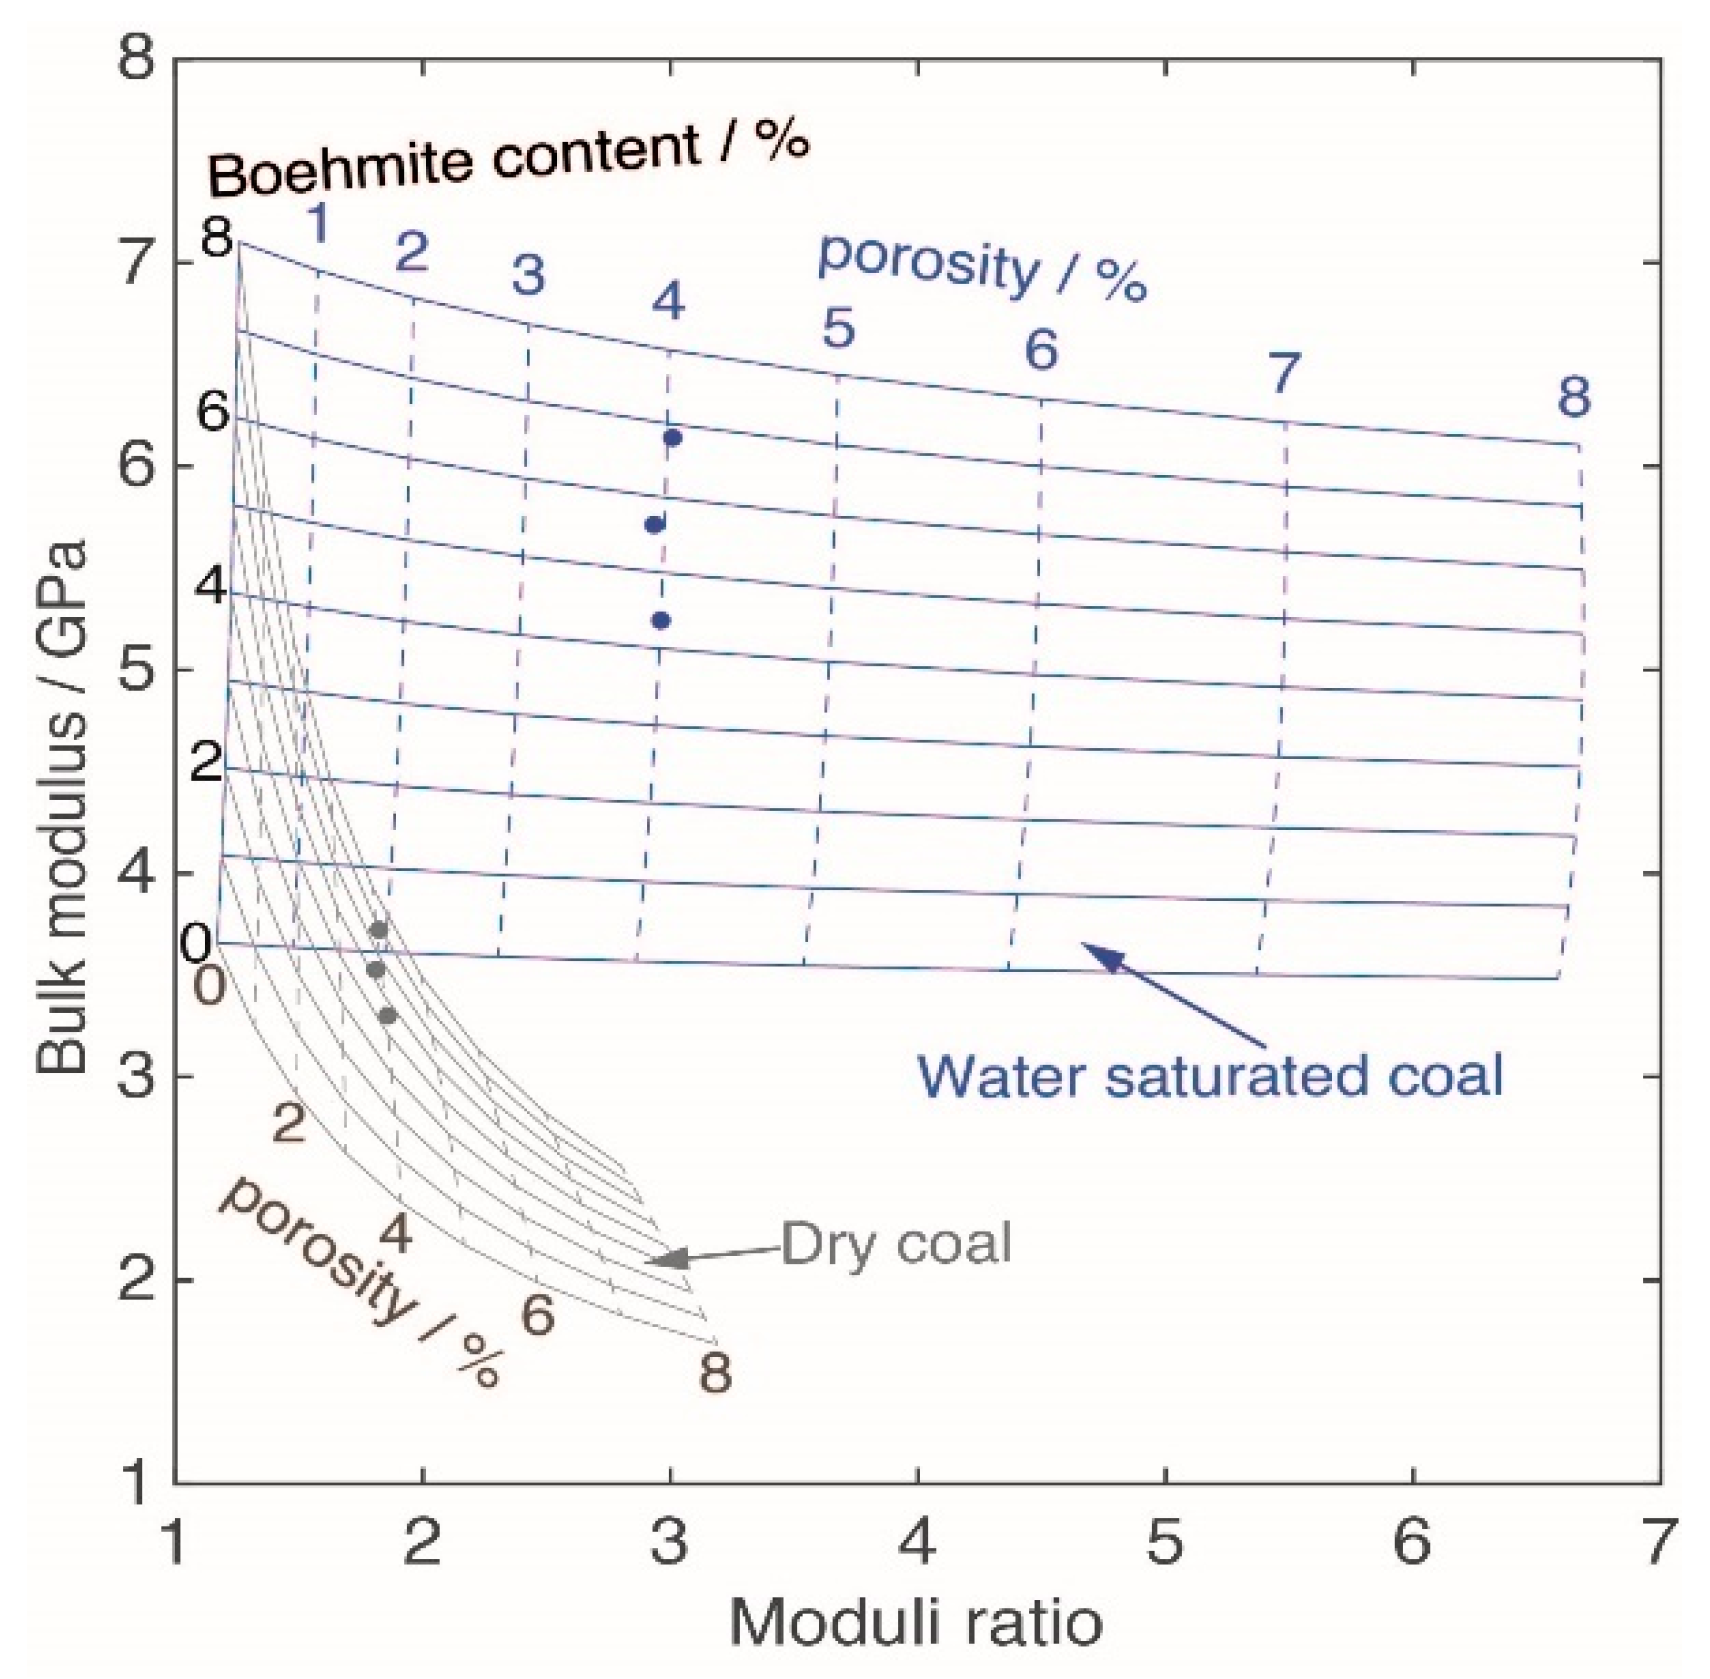
To quantitatively interpret boehmite (gallium) contents, the authors propose a workflow to build an interpretation template referencing the rock-physics modeling procedure [39,49,50]. As shown in Figure 9, the workflow first calculates the mean contents of organic, clay, pyrite, quartz, calcite, siderite, and rutile of boehmite-rich cores and assumes that the boehmite is the only mineral variable. Second, the workflow adds 0%~8% (volume content) boehmite to the mixture and computes the equivalent moduli and densities of coal matrices with the VRH average. Third, 0%~8% pores and cracks are embedded into the coal matrices with the DEM model to compute the equivalent moduli and densities of dry cores. The parameters of pores and cracks are the same as those in Section 4.3. Fourth, Gassmann fluid replacement is used to achieve the equivalent moduli and densities of water-saturated cores. Finally, the workflow contours the pairs of bulk modulus vs. moduli ratio concerning the factors of boehmite, porosity, and saturation state variations and forms the interpretation template, as shown in Figure 10.
Generally, the templates have zonation distribution characteristics. The water-saturated-state template is in the upper part, and the dry-state template is on the lower-left side. When coal porosity is low (<2.2%), the water-saturated-state template is overlapped with the dry-state template. Luckily, the measured porosity of No. 6 coal is 4.0%. This overlapping phenomenon has little influence on the interpretation of boehmite content for No. 6 coal.
To discuss the interpretation accuracy of the templates, the authors cross-plot the calculated bulk modulus vs. modulus ratio of three boehmite-rich cores (6–2, 6–3, and 6–4) under dry and water-saturated (WS) states and superpose the scattering points on the built templates. The results show that the boehmite content readings in the templates are near the actual calculated values, and the interpreted errors of gallium contents are small under dry and WS states (Table 6). These phenomena proved the applicability of the proposed method for interpreting coal-hosted gallium content.
Although the errors are small, they are non-negligible. The reasons that caused these errors may mainly come from the content variations of organic matter and nonboehmite minerals. Therefore, if the nonboehmite mineral and organic variations are insignificant, the templates are accurate and suited for quantitatively interpreting boehmite and gallium contents for No. 6 coal in the Heidaigou mine and other coalbeds with similar mineral compositions and contents. However, the interpretation template must be rebuilt if the coal components differ far from this case.
6. Conclusions
In this study, we characterize the elastic parameters of boehmite-rich, quartz-rich, and clay-rich cores and discussed whether coal-hosted gallium-rich ores are elastically detectable by incorporating core testing, rock-physics modeling, Monte Carlo simulation, and interpretation template building. The conclusions include the followings.
- (1)
- The gallium contents in cores of No. 6 coal correlate to boehmite content.
- (2)
- Mineral compositions and contents are critical factors influencing the elastic parameters of cores. Although the elastic parameters in No. 6 coal have vertical heterogeneities, their values are still within the range of bituminous coal [29].
- (3)
- The preferred parameters for distinguishing different mineral-rich cores are the bulk modulus and moduli ratio. The cross plot of bulk modulus vs. moduli ratio can qualitatively distinguish measured cores and Monte-Carlo simulated realizations into different mineral-rich and saturation states properly.
- (4)
- Interpretation templates can quantitatively interpret the boehmite contents in the boehmite-rich cores with acceptable errors considering dry and water-saturated states. With the correlation between boehmite and gallium, researchers can quantitatively interpret the gallium content in cores.
- (5)
- Coal-hosted gallium-rich ores in No. 6 coal and coalbeds with similar mineral composition are elastically detectable, but the detectability of ores hosted in other coalbeds needs further study.
Author Contributions
Conceptualization, T.C.; methodology, T.C. and X.S.; software, T.C.; validation, X.S.; formal analysis, T.C.; investigation, T.C. and X.S.; resources, T.C. and X.S.; data curation, X.S.; writing—original draft preparation, T.C. and X.S.; writing—review and editing, T.C.; visualization, X.S. All authors have read and agreed to the published version of the manuscript.
Funding
This research was funded by the National Key R&D Project of China, grant number 2021YFC2902003, the National Natural Science Foundation of China, grant number 41774128, and a project funded by the Priority Academic Program Development of Jiangsu Higher Education Institutions.
Data Availability Statement
Not applicable.
Acknowledgments
The authors acknowledge the anonymous reviewers for their constructive suggestions and Dai Shifeng for assisting with the measured core data in the Heidaigou mine.
Conflicts of Interest
The authors declare no conflict of interest.
References
- Qin, S.; Sun, Y.; Li, Y.; Wang, J.; Zhao, C.; Gao, K. Coal deposits as promising alternative sources for gallium. Earth-Sci. Rev. 2015, 150, 95–101. [Google Scholar] [CrossRef]
- Dai, S.; Finkelman, R.B. Coal as a promising source of critical elements: Progress and future prospects. Int. J. Coal Geol. 2018, 186, 155–164. [Google Scholar] [CrossRef]
- Dai, S.; Jiang, Y.; Ward, C.R.; Gu, L.; Seredin, V.V.; Liu, H.; Zhou, D.; Wang, X.; Sun, Y.; Zou, J.; et al. Mineralogical and geochemical compositions of the coal in the Guanbanwusu Mine, Inner Mongolia, China: Further evidence for the existence of an Al (Ga and REE) ore deposit in the Jungar Coalfield. Int. J. Coal Geol. 2012, 98, 10–40. [Google Scholar] [CrossRef]
- Dai, S.; Li, D.; Chou, C.-L.; Zhao, L.; Zhang, Y.; Ren, D.; Ma, Y.; Sun, Y. Mineralogy and geochemistry of boehmite-rich coals: New insights from the Haerwusu Surface Mine, Jungar Coalfield, Inner Mongolia, China. Int. J. Coal Geol. 2008, 74, 185–202. [Google Scholar] [CrossRef]
- Dai, S.; Ren, D.; Li, S. Discovery of the superlarge gallium ore deposit in Jungar, Inner Mongolia, North China. Chin. Sci. Bull. 2006, 51, 2243–2252. [Google Scholar] [CrossRef]
- Li, J.; Zhuang, X.; Yuan, W.; Liu, B.; Querol, X.; Font, O.; Moreno, N.; Li, J.; Gang, T.; Liang, G. Mineral composition and geochemical characteristics of the Li-Ga-rich coals in the Buertaohai-Tianjiashipan mining district, Jungar Coalfield, Inner Mongolia. Int. J. Coal Geol. 2016, 167, 157–175. [Google Scholar] [CrossRef]
- Wang, W.; Qin, Y.; Liu, X.; Zhao, J.; Wang, J.; Wu, G.; Liu, J. Distribution, occurrence and enrichment causes of gallium in coals from the Jungar Coalfield, Inner Mongolia. Sci. China Earth Sci. 2011, 54, 1053–1068. [Google Scholar] [CrossRef]
- Zhang, P.; Han, Z.; Jia, J.; Wei, C.; Liu, Q.; Wang, X.; Zhou, J.; Li, F.; Miao, S. Occurrence and Distribution of Gallium, Scandium, and Rare Earth Elements in Coal Gangue Collected from Junggar Basin, China. Int. J. Coal Prep. Util. 2017, 39, 389–402. [Google Scholar] [CrossRef]
- Dai, S.; Yan, X.; Ward, C.R.; Hower, J.C.; Zhao, L.; Wang, X.; Zhao, L.; Ren, D.; Finkelman, R.B. Valuable elements in Chinese coals: A review. Int. Geol. Rev. 2016, 60, 590–620. [Google Scholar] [CrossRef]
- Gandhi, S.M.; Sarkar, B. Essentials of Mineral Exploration and Evaluation; Elsevier: Amsterdam, The Netherlands, 2016. [Google Scholar]
- Chen, J.; Chen, P.; Yao, D.; Huang, W.; Tang, S.; Wang, K.; Liu, W.; Hu, Y.; Li, Q.; Wang, R. Geochemistry of uranium in Chinese coals and the emission inventory of coal-fired power plants in China. Int. Geol. Rev. 2017, 60, 621–637. [Google Scholar] [CrossRef]
- Dai, S.; Yang, J.; Ward, C.R.; Hower, J.C.; Liu, H.; Garrison, T.M.; French, D.; O’Keefe, J.M. Geochemical and mineralogical evidence for a coal-hosted uranium deposit in the Yili Basin, Xinjiang, northwestern China. Ore Geol. Rev. 2015, 70, 1–30. [Google Scholar] [CrossRef]
- Scheller, K.W.; Elliott, W.S. Geochemical and γ ray characterization of Pennsylvanian black shales: Implications for elevated home radon levels in Vanderburgh County, Indiana. J. Environ. Radioact. 2015, 148, 154–162. [Google Scholar] [CrossRef]
- Zhao, J.; Tang, D.; Qin, Y.; Xu, H. Experimental study on structural models of coal macrolithotypes and its well logging responses in the Hancheng area, Ordos Basin, China. J. Pet. Sci. Eng. 2018, 166, 658–672. [Google Scholar] [CrossRef]
- Mavko, G.; Mukerji, T.; Dvorkin, J. The Rock Physics Handbook, 3rd ed.; Cambridge University Press: Cambridge, UK, 2019. [Google Scholar]
- Avseth, P.; Mukerji, T.; Mavko, G. Quantitative Seismic Interpretation: Applying Rock Physics Tools to Reduce Interpretation Risk, Paperback ed.; Cambridge University Press: Cambridge, UK; New York, NY, USA, 2010. [Google Scholar]
- Chen, T.; Wang, X.; Mukerji, T. In situ identification of high vertical stress areas in an underground coal mine panel using seismic refraction tomography. Int. J. Coal Geol. 2015, 149, 55–66. [Google Scholar] [CrossRef]
- Chen, T.; Lin, Z.; Liu, Z.; Mukerji, T. A Comparative Experiment on Heterogeneous Distributions of Stress Field for Underground Panels With Different Geological Setting in North China. IEEE Trans. Geosci. Remote Sens. 2021, 60, 1–15. [Google Scholar] [CrossRef]
- Zhao, L.; Chen, T.; Mukerji, T.; Tang, G. Bulk modulus for fluid-saturated rocks at high frequency: Modification of squirt flow model proposed by Mavko & Jizba. Geophys. J. Int. 2021, 225, 1714–1724. [Google Scholar] [CrossRef]
- Zhao, L.; Chen, T.; Mukerji, T.; Zhang, M.; Xing, T. Brown and Korringa’s expression for the saturated bulk modulus at high frequencies: Modification of Mavko and Jizba’s squirt flow model. Geophysics 2022, 87, MR201–MR208. [Google Scholar] [CrossRef]
- Zhao, L.; Chen, T.; Tang, G. Bulk modulus for fluid-saturated rocks at intermediate frequencies: Modification of squirt flow model proposed by Gurevich et al. Geophys. J. Int. 2021, 226, 246–255. [Google Scholar] [CrossRef]
- Batzle, M.; Wang, Z. Seismic properties of pore fluids. Geophysics 1992, 57, 1396–1408. [Google Scholar] [CrossRef] [Green Version]
- Han, D.-H. Effects of Porosity and Clay Content on Acoustic Properties of Sandstones and Unconsolidated Sediments; Stanford University: Stanford, CA, USA, 1987. [Google Scholar]
- Karimpouli, S.; Tahmasebi, P.; Saenger, E.H. Estimating 3D elastic moduli of rock from 2D thin-section images using differential effective medium theory. Geophysics 2018, 83, MR211–MR219. [Google Scholar] [CrossRef]
- Bagdassarov, N. Fundamentals of Rock Physics; Cambridge University Press: Cambridge, UK; New York, NY, USA, 2021. [Google Scholar]
- Li, Z.; Ouyang, F.; Xiao, Z.J.; Liu, X.Z.; He, Y.X.; Zhao, J.G. Experimental and theoretical verification of the effect of fluid viscosity on the dispersion and decay of sandstone elastic modulus. Chin. J. Geophys.-Ch. 2022, 65, 2179–2197. [Google Scholar] [CrossRef]
- Krawiec, K. Dynamic elastic properties of the hard coal seam at a depth of around 1260 m. Gospod. Surowcam. Min. 2021, 37, 159–175. [Google Scholar] [CrossRef]
- Ambati, V.; Sharma, S.; Babu, M.N.; Nair, R.R. Laboratory measurements of ultrasonic wave velocities of rock samples and their relation to log data: A case study from Mumbai offshore. J. Earth Syst. Sci. 2021, 130, 176. [Google Scholar] [CrossRef]
- Morcote, A.; Mavko, G.; Prasad, M. Dynamic elastic properties of coal. Geophysics 2010, 75, E227–E234. [Google Scholar] [CrossRef]
- Chen, H.; Jiang, B.; Chen, T.; Xu, S.; Zhu, G. Experimental study on ultrasonic velocity and anisotropy of tectonically deformed coal. Int. J. Coal Geol. 2017, 179, 242–252. [Google Scholar] [CrossRef]
- Chen, T.; Ma, G.; Wang, X.; Cui, R. Deformation Degree Estimate for Coal Seam using Well Logs as Input: A Case Study. J. Environ. Eng. Geophys. 2018, 23, 89–101. [Google Scholar] [CrossRef]
- Wang, X.; Li, Y.; Chen, T.; Yan, Q.; Ma, L. Quantitative thickness prediction of tectonically deformed coal using Extreme Learning Machine and Principal Component Analysis: A case study. Comput. Geosci. 2017, 101, 38–47. [Google Scholar] [CrossRef]
- Liu, J.; Liu, D.; Cai, Y.; Gan, Q.; Yao, Y. Effects of water saturation on P-wave propagation in fractured coals: An experimental perspective. J. Appl. Geophys. 2017, 144, 94–103. [Google Scholar] [CrossRef]
- Wang, H.; Pan, J.; Wang, S.; Zhu, H. Relationship between macro-fracture density, P-wave velocity, and permeability of coal. J. Appl. Geophys. 2015, 117, 111–117. [Google Scholar] [CrossRef]
- Liu, D.; Li, L.; Zhao, Z.; Chen, W.; Cai, Y.; Qiu, Y.; Zhou, Y. P-wave and S-wave response of coal rock containing gas-water with different saturation: An experimental perspective. Front. Earth Sci. 2022, 1–9. [Google Scholar] [CrossRef]
- Wang, G.; Li, J.; Liu, Z.; Qin, X.; Yan, S. Relationship between wave speed variation and microstructure of coal under wet conditions. Int. J. Rock Mech. Min. Sci. 2020, 126, 104203. [Google Scholar] [CrossRef]
- Dong, S.H.; Wu, H.B.; Li, D.H.; Huang, Y.P. Experimental Study of Ultrasonic Velocity and Anisotropy in Coal Samples. J. Seism. Explor. 2016, 25, 131–146. [Google Scholar]
- Huang, Y.; Wei, M.; Malekian, R.; Zheng, X. CBM Reservoir Rock Physics Model and Its Response Characteristic Study. IEEE Access 2017, 5, 1. [Google Scholar] [CrossRef]
- Ba, J.; Hu, P.; Tan, W.; Müller, T.M.; Fu, L.-Y. Brittle mineral prediction based on rock-physics modelling for tight oil reservoir rocks. J. Geophys. Eng. 2021, 18, 970–983. [Google Scholar] [CrossRef]
- Ghosh, R.; Sarkar, P.; Singh, K.H. Elastic Anisotropy Modeling of Organic-Rich Lower Gondwana Shale in Eastern India (Nov, 10.1007/s00024-020-02620-y, 2020). Pure Appl. Geophys. 2021, 178, 689. [Google Scholar] [CrossRef]
- David, E.; Zimmerman, R. Elastic moduli of solids containing spheroidal pores. Int. J. Eng. Sci. 2011, 49, 544–560. [Google Scholar] [CrossRef]
- Johansen, J.L.; David, M.-F.; Ekelund, F.; Vestergård, M. Wood ash decreases cadmium toxicity to the soil nematode Caenorhabditis elegans. Ecotoxicol. Environ. Saf. 2019, 172, 290–295. [Google Scholar] [CrossRef]
- Markov, M.; Levine, V.; Mousatov, A.; Kazatchenko, E. Elastic properties of double-porosity rocks using the differential effective medium model. Geophys. Prospect. 2005, 53, 733–754. [Google Scholar] [CrossRef]
- Misaghi, A.; Negahban, S.; Landrø, M.; Javaherian, A. A comparison of rock physics models for fluid substitution in carbonate rocks. Explor. Geophys. 2010, 41, 146–154. [Google Scholar] [CrossRef]
- Fender, T.D.; Rouainia, M.; Van Der Land, C.; Jones, D.M.; Mastalerz, M.; Hennissen, J.; Graham, S.P.; Wagner, T. Geomechanical properties of coal macerals; measurements applicable to modelling swelling of coal seams during CO2 sequestration. Int. J. Coal Geol. 2020, 228, 103528. [Google Scholar] [CrossRef]
- Fankhänel, J.; Silbernagl, D.; Khorasani, M.G.Z.; Daum, B.; Kempe, A.; Sturm, H.; Rolfes, R. Mechanical Properties of Boehmite Evaluated by Atomic Force Microscopy Experiments and Molecular Dynamic Finite Element Simulations. J. Nanomater. 2016, 2016, 91–117. [Google Scholar] [CrossRef]
- Zhang, C.; Li, L.; Yuan, Z.; Xu, X.; Song, Z.; Zhang, Y.R. Mechanical properties of siderite and hematite from DFT calculation. Miner. Eng. 2019, 146, 106107. [Google Scholar] [CrossRef]
- Berryman, J.G.; Milton, G.W. Exact results for generalized Gassmann’s equations in composite porous media with two constituents. Geophysics 1991, 56, 1950–1960. [Google Scholar] [CrossRef]
- Ba, J.; Cao, H.; Carcione, J.M.; Tang, G.; Yan, X.-F.; Sun, W.-T.; Nie, J.-X. Multiscale rock-physics templates for gas detection in carbonate reservoirs. J. Appl. Geophys. 2013, 93, 77–82. [Google Scholar] [CrossRef]
- Pang, M.; Ba, J.; Carcione, J.M.; Picotti, S.; Zhou, J.; Jiang, R. Estimation of porosity and fluid saturation in carbonates from rock-physics templates based on seismic. Q. Geophys. 2019, 84, M25–M36. [Google Scholar] [CrossRef]
Figure 1.
Coal-bearing basins in the Northern China plate and the Heidaigou mine location.

Figure 2.
Geological column of No. 6 coal and the sampled core locations and numbers.
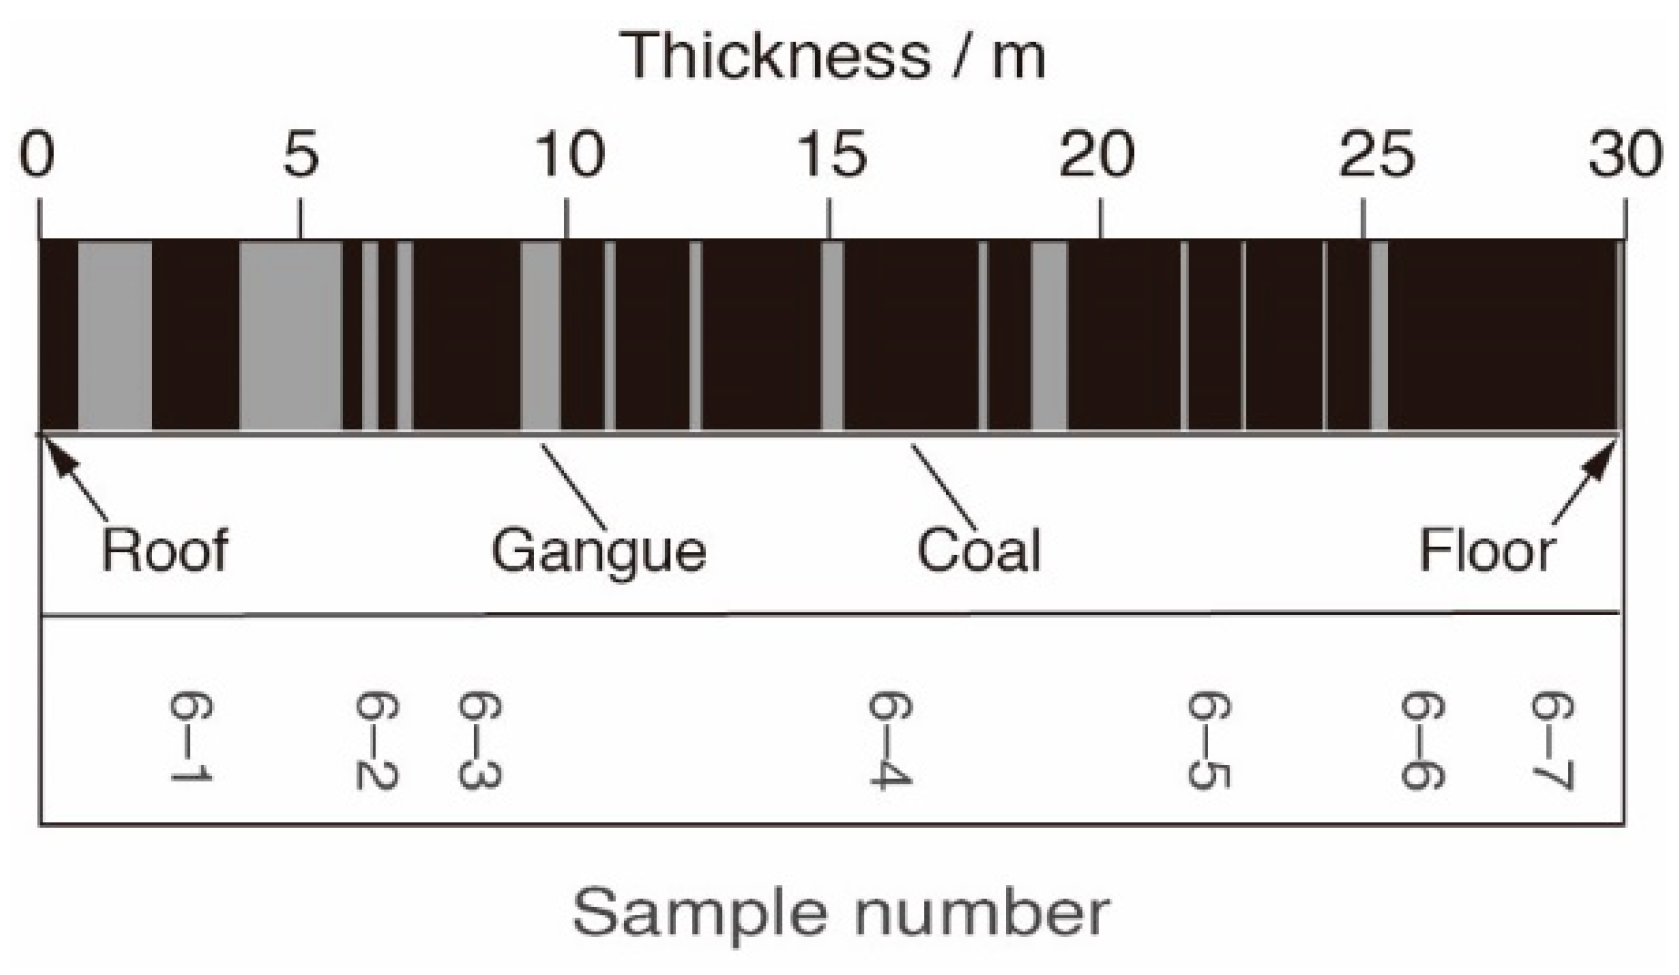
Figure 3.
Cross plots of boehmite vs. gallium contents for cores.
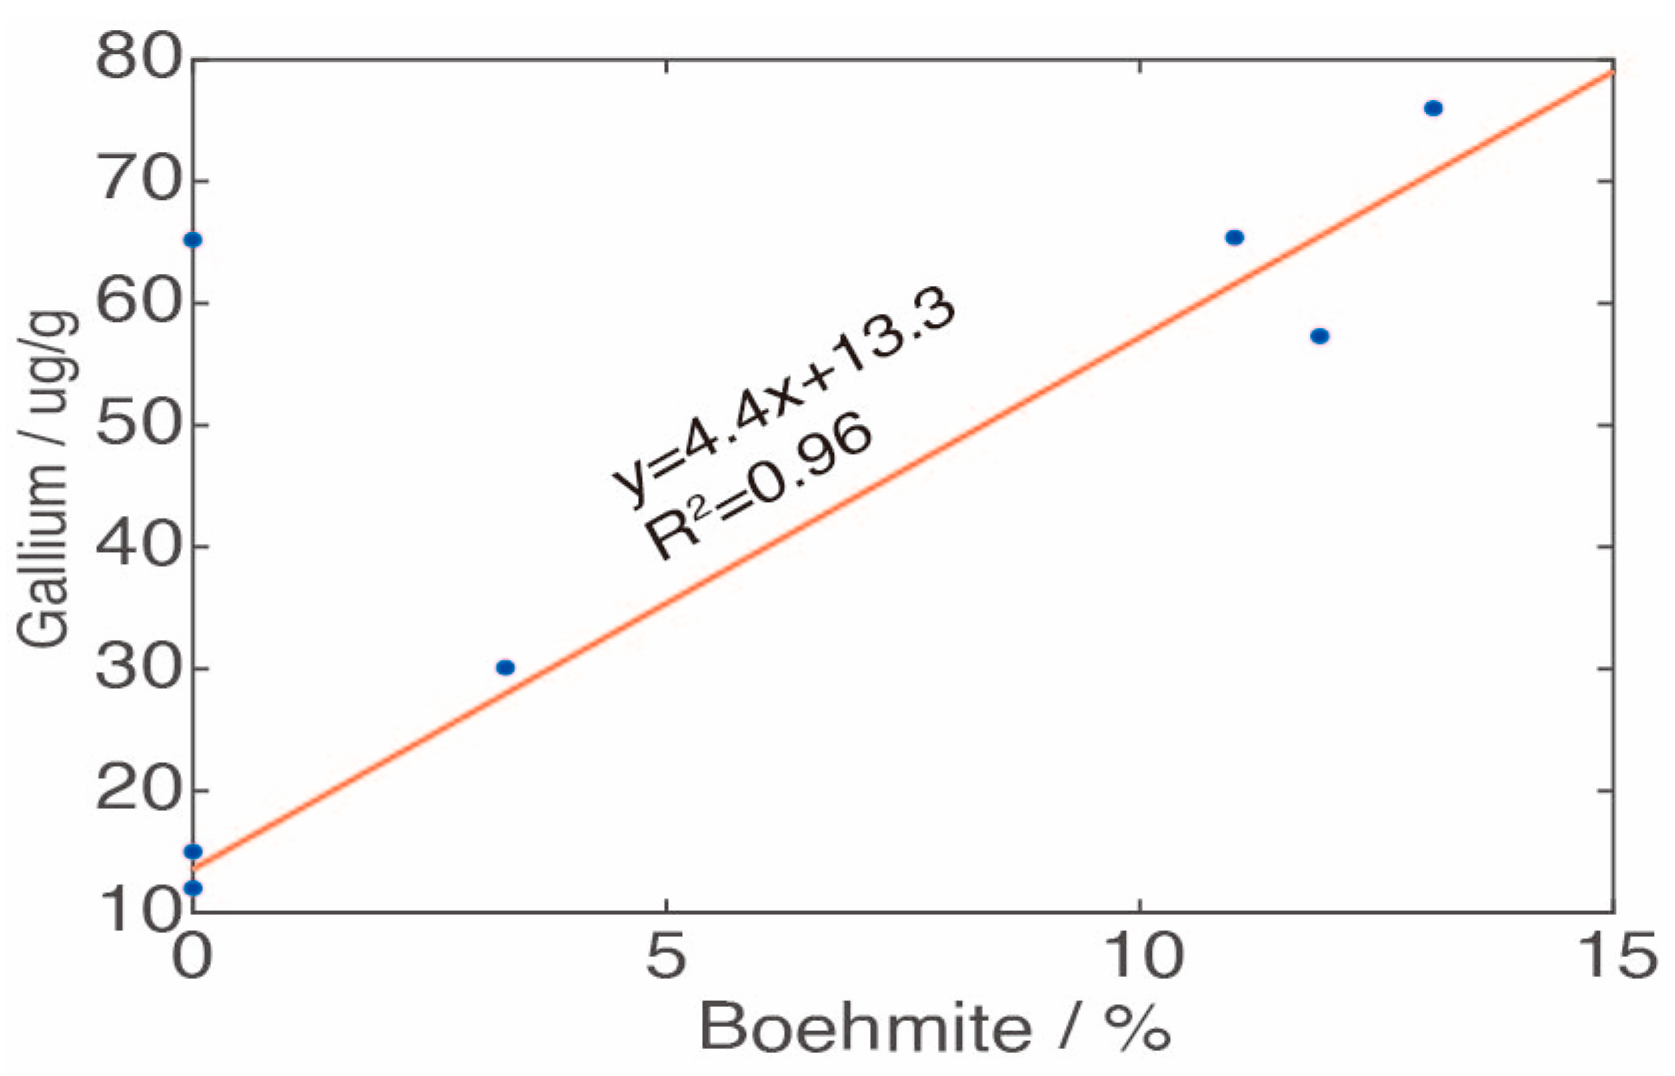
Figure 4.
Schematic flowchart for rock-physics modeling of mineral-rich cores.

Figure 5.
Schematic plot of a univariate Monte Carlo simulation. The solid points are the measured values.
Figure 5.
Schematic plot of a univariate Monte Carlo simulation. The solid points are the measured values.

Figure 6.
Calculated bulk and shear moduli (a), P- and S-impedances (b), P- and S-velocities (c), and modulus and velocity ratios (d) for core matrices, dry cores, and water-saturated cores.
Figure 6.
Calculated bulk and shear moduli (a), P- and S-impedances (b), P- and S-velocities (c), and modulus and velocity ratios (d) for core matrices, dry cores, and water-saturated cores.

Figure 7.
Cross-plots of bulk modulus vs. modulus ratio for core matrices, dry cores, and water-saturated cores. Blue dots are group one, indicating quartz-rich cores; green dots are group two, indicating boehmite-rich cores; and red dots are group three, indicating clay-rich cores. Transforming among states, the groups vary following pore embedding (PE) and fluid replacement (FR) trends.
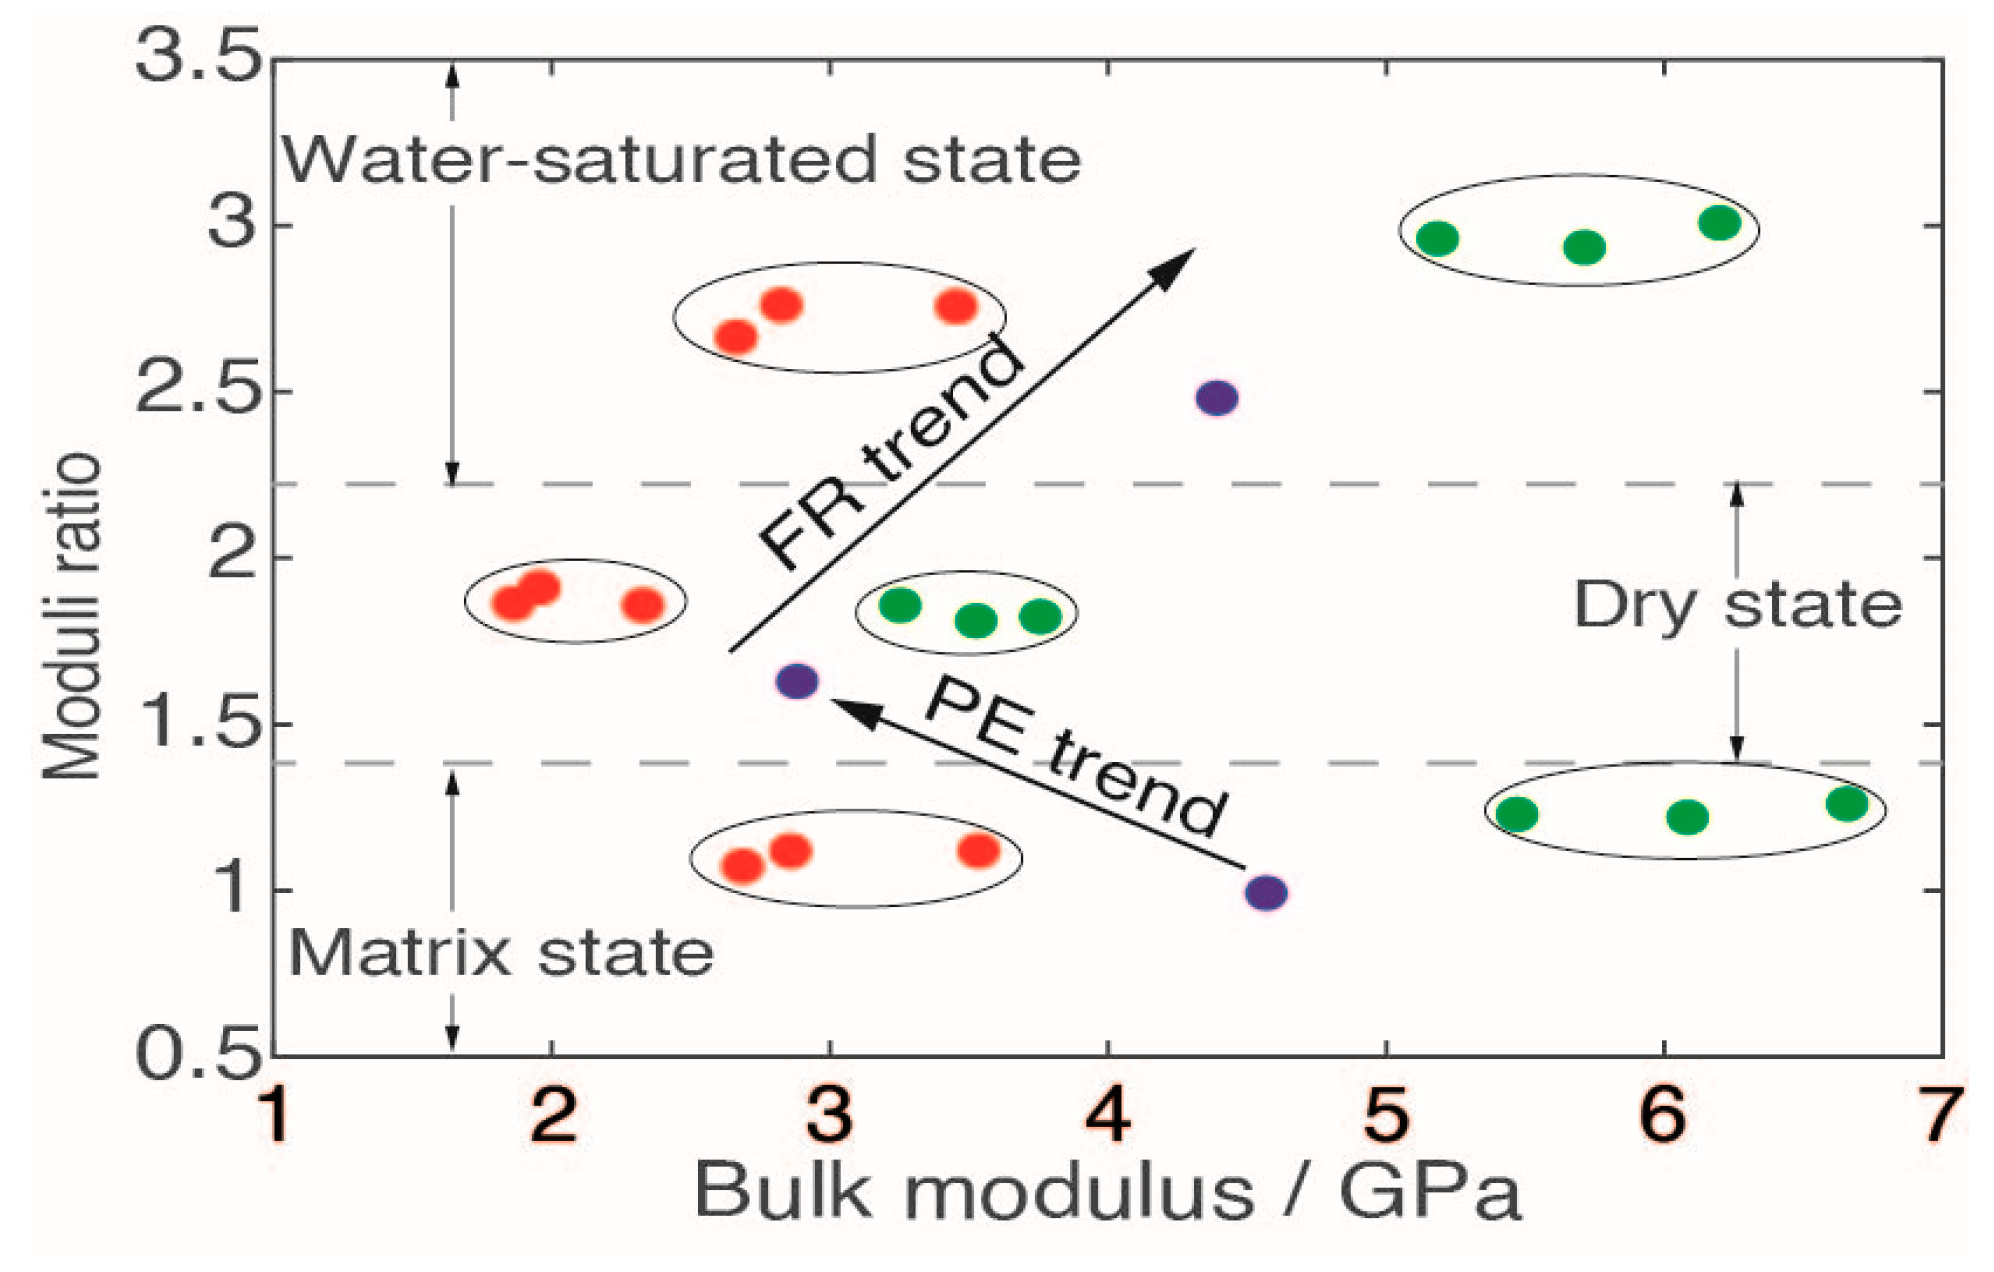
Figure 8.
The cross-plot of bulk modulus vs. modulus ratio of Monte Carlo simulated realizations for different mineral-rich coals. Group one is quartz-rich cores, group two is boehmite-rich cores, and group three is clay-rich cores.
Figure 8.
The cross-plot of bulk modulus vs. modulus ratio of Monte Carlo simulated realizations for different mineral-rich coals. Group one is quartz-rich cores, group two is boehmite-rich cores, and group three is clay-rich cores.
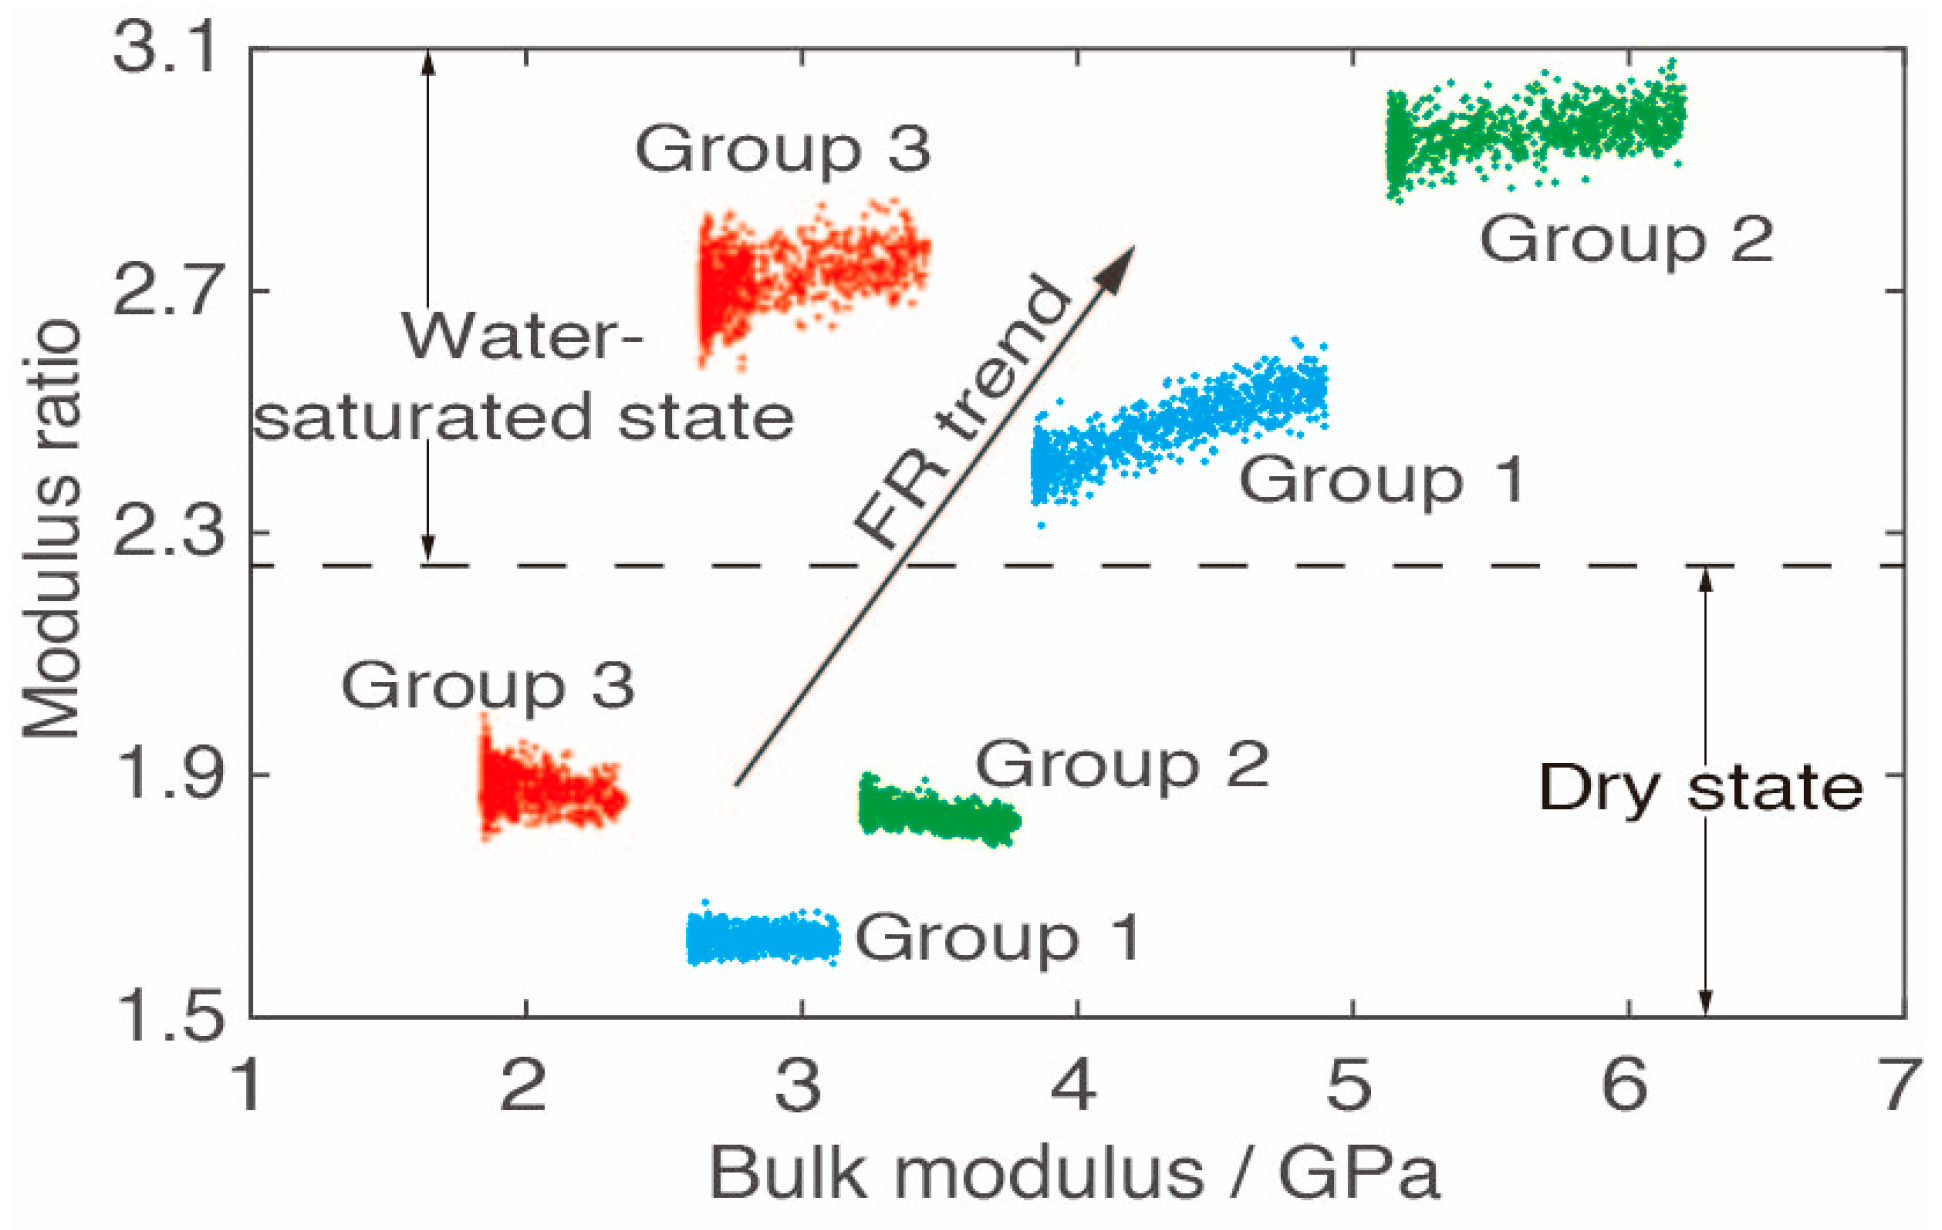
Figure 9.
Schematic flowchart for building interpretation template for gallium-rich cores.

Figure 10.
Interpretation templates for dry and water-saturated coal. The scatter points are gallium-rich cores 6–2, 6–3, and 6–4. The blue color indicates a water-saturated state, and the gray color indicates a dry state.
Figure 10.
Interpretation templates for dry and water-saturated coal. The scatter points are gallium-rich cores 6–2, 6–3, and 6–4. The blue color indicates a water-saturated state, and the gray color indicates a dry state.

Table 1.
Weight contents of measured components in cores from No. 6 coal (edited from [5]). The unit for organic and mineral contents is weight percentage, and the unit for gallium is ppm.
Table 1.
Weight contents of measured components in cores from No. 6 coal (edited from [5]). The unit for organic and mineral contents is weight percentage, and the unit for gallium is ppm.
| Core | 6–1 | 6–2 | 6–3 | 6–4 | 6–5 | 6–6 | 6–7 | |
|---|---|---|---|---|---|---|---|---|
| Content | ||||||||
| Organic | 77.5 | 76.7 | 80.1 | 82.9 | 84.4 | 76.3 | 79.9 | |
| Clay | 5.5 | 4.3 | 3.6 | 4.4 | 11.4 | 22.0 | 19.5 | |
| Pyrite | 0.0 | 0.0 | 0.0 | 0.0 | 0.9 | 0.4 | 0.4 | |
| Quartz | 16.3 | 4.7 | 1.6 | 0.9 | 0.0 | 0.2 | 0.2 | |
| Calcite | 0.7 | 0.8 | 0.8 | 0.0 | 0.0 | 1.1 | 0.0 | |
| Siderite | 0.0 | 0.0 | 0.8 | 0.0 | 0.0 | 0.0 | 0.0 | |
| Rutile | 0.0 | 1.6 | 0.0 | 0.8 | 0.0 | 0.0 | 0.0 | |
| Boehmite | 0.0 | 11.9 | 13.1 | 11.0 | 3.3 | 0.0 | 0.0 | |
| Gallium | 12.0 | 57.3 | 76.0 | 65.4 | 30.1 | 65.4 | 15.0 | |
Table 2.
The cross-correlation coefficients of all cores appear in Table 1.
Table 2.
The cross-correlation coefficients of all cores appear in Table 1.
| Core | 6–1 | 6–2 | 6–3 | 6–4 | 6–5 | 6–6 | 6–7 |
|---|---|---|---|---|---|---|---|
| 6–1 | 1 | ||||||
| 6–2 | 0.83 | 1 | |||||
| 6–3 | 0.74 | 0.99 | 1 | ||||
| 6–4 | 0.80 | 1.00 | 0.99 | 1 | |||
| 6–5 | 0.95 | 0.93 | 0.88 | 0.92 | 1 | ||
| 6–6 | 0.77 | 0.96 | 0.97 | 0.97 | 0.91 | 1 | |
| 6–7 | 0.96 | 0.84 | 0.76 | 0.83 | 0.98 | 0.84 | 1 |
Table 3.
The cross-correlation coefficients of all contents appear in Table 1.
Table 3.
The cross-correlation coefficients of all contents appear in Table 1.
| Content | Organic | Clay | Pyrite | Quartz | Calcite | Siderite | Rutile | Boehmite | Gallium |
|---|---|---|---|---|---|---|---|---|---|
| Organic | 1 | ||||||||
| Clay | −0.18 | 1 | |||||||
| Pyrite | 0.46 | 0.60 | 1 | ||||||
| Quartz | −0.42 | −0.41 | −0.46 | 1 | |||||
| Calcite | −0.83 | 0.00 | −0.40 | 0.30 | 1 | ||||
| Siderite | 0.06 | −0.37 | −0.31 | −0.14 | 0.29 | 1 | |||
| Rutile | −0.19 | −0.47 | −0.45 | 0.00 | 0.06 | −0.24 | 1 | ||
| Boehmite | 0.18 | −0.75 | −0.52 | −0.22 | 0.05 | 0.54 | 0.62 | 1 | |
| Gallium | −0.07 | −0.24 | −0.34 | −0.47 | 0.42 | 0.50 | 0.34 | 0.72 | 1 |
Table 4.
Volume contents of all cores sampled from No. 6 coal in the Heidaigou mine.
| Core Number | 6–1 | 6–2 | 6–3 | 6–4 | 6–5 | 6–6 | 6–7 |
|---|---|---|---|---|---|---|---|
| Organic | 85.77 | 86.66 | 88.89 | 90.2 | 88.44 | 80.2 | 83.1 |
| Clay | 5.01 | 4.00 | 3.29 | 3.94 | 9.83 | 19.03 | 16.69 |
| Pyrite | 0.00 | 0.00 | 0 | 0 | 0.25 | 0.11 | 0.11 |
| Quartz | 8.85 | 2.61 | 0.87 | 0.48 | 0 | 0.1 | 0.1 |
| Calcite | 0.37 | 0.43 | 0.43 | 0 | 0 | 0.55 | 0 |
| Siderite | 0.0 | 0.0 | 0.3 | 0 | 0 | 0 | 0 |
| Rutile | 0.0 | 0.55 | 0 | 0.27 | 0 | 0 | 0 |
| Boehmite | 0.0 | 5.75 | 6.22 | 5.12 | 1.48 | 0 | 0 |
Table 5.
Moduli (GPa) and densities (g/cc) of organic matter and minerals observed in No. 6 coal.
| Content | Organic | Clay | Pyrite | Quartz | Calcite | Siderite | Rutile | Boehmite |
|---|---|---|---|---|---|---|---|---|
| Bulk modulus | 2.9 | 1.5 | 147.4 | 37.0 | 76.8 | 136.4 | 244.8 | 87.5 |
| Shear modulus | 2.7 | 1.4 | 132.5 | 44.0 | 32.0 | 66.5 | 63.5 | 64.03 |
| Density | 1.3 | 1.58 | 4.93 | 2.65 | 2.71 | 3.8 | 4.25 | 3.04 |
Table 6.
True and interpreted gallium contents of gallium-rich cores from No. 6 coal.
| Core Number | True Contents | Interpreted Contents | Absolute Errors | |||
|---|---|---|---|---|---|---|
| Boehmite /vol% | Gallium /ppm | Ga (WS) /ppm | Ga (dry) /ppm | Ga (WS) /ppm | Ga (dry) /ppm | |
| 6–2 | 5.8 | 57.3 | 65.3 | 63.6 | 8.0 | 6.3 |
| 6–3 | 6.2 | 76.0 | 76.1 | 77.7 | 0.1 | 1.7 |
| 6–4 | 5.1 | 65.4 | 54.5 | 53.7 | 10.9 | 11.7 |
Publisher’s Note: MDPI stays neutral with regard to jurisdictional claims in published maps and institutional affiliations. |
© 2022 by the authors. Licensee MDPI, Basel, Switzerland. This article is an open access article distributed under the terms and conditions of the Creative Commons Attribution (CC BY) license (https://creativecommons.org/licenses/by/4.0/).
Share and Cite
MDPI and ACS Style
Chen, T.; Song, X. Are Coal-Hosted Gallium-Rich Ores Elastically Detectable: A Rock-Physics Modeling Perspective. Minerals 2022, 12, 1619. https://doi.org/10.3390/min12121619
AMA Style
Chen T, Song X. Are Coal-Hosted Gallium-Rich Ores Elastically Detectable: A Rock-Physics Modeling Perspective. Minerals. 2022; 12(12):1619. https://doi.org/10.3390/min12121619
Chicago/Turabian StyleChen, Tongjun, and Xiong Song. 2022. "Are Coal-Hosted Gallium-Rich Ores Elastically Detectable: A Rock-Physics Modeling Perspective" Minerals 12, no. 12: 1619. https://doi.org/10.3390/min12121619
Note that from the first issue of 2016, this journal uses article numbers instead of page numbers. See further details here.