
A Study on the Raman Spectral Characteristics of Garnet from the Jiama Copper Polymetallic Deposit in Tibet
1
Ministry of Natural Resources Key Laboratory of Metallogeny and Mineral Assessment, Institute of Mineral Resources, Chinese Academy of Geological Sciences, Beijing 100037, China
2
Chinese Academy of Geological Sciences, China University of Geosciences, Beijing 100083, China
*
Author to whom correspondence should be addressed.
Minerals 2022, 12(12), 1578; https://doi.org/10.3390/min12121578
Submission received: 17 October 2022
/
Revised: 1 December 2022
/
Accepted: 5 December 2022
/
Published: 9 December 2022
(This article belongs to the Special Issue Microbeam Analysis Characterization in Petrogenesis and Ore Deposit)
Abstract
:Raman spectroscopy is an important method to analyze and measure mineral composition and structure, which has the advantages of being non-destructive and rapid. This study considered garnet from the Jiama copper polymetallic deposit in Tibet to carry out micro-Raman spectrum and electron microprobe research to analyze the Raman spectrum characteristics of garnet with different components to reveal its indicative significance for garnet composition and skarn mineralization. The results showed that the Raman peaks T, X, A1, A2, and A3 shift toward lower wavenumber with the increase in andradite (And) content. The variations in T, X, and A2 are more obvious than those of A1 and A3. When And > 50%, the three Raman peaks (T, X, and A2) range are 173–174, 234–239, 513–525 cm−1; when And < 50%, they are 177–178, 240–244, 527–543 cm−1. The Raman peaks also shift with the cation radius and relative atomic mass. Different peaks moved in the low-frequency direction with the increase in the X2+ and Y3+ radius, and the X2+ atomic mass. The Raman spectrum can indicate the composition change in garnet. Raman spectrum analysis of garnet is of great significance for skarn zoning and prospecting.
1. Introduction
Garnet is a tesseral nesosilicate mineral, and its general chemical formula is X3Y2[SiO4]3, in which X represents divalent cations, mainly Ca2+, Mg2+, Fe2+, Mn2+, etc., and Y represents trivalent cations, mainly Al3+, Fe3+, and Cr3+, and sometimes Ti3+, Zr3+, V3+, Y3+, etc. [1]. The garnet group is divided into two series comprising the six more common terms: ugrandite, where X = Ca and Y = Cr, Al, Fe3+ (uvarovite Ca3Cr2Si3O12, grossular Ca3Al2Si3O12, andradite Ca3Fe2Si3O12) and pyralspite, where Y = Al and X = Mg, Fe2+, Mn (pyrope Mg3Al2Si3O12, almandine Fe3Al2Si3O12, spessartine Mn3Al2Si3O12) [2]. Its structural feature is a [YO6] octahedron with a trivalent cation as the central ion connecting [SiO4] tetrahedron; a [XO8] dodecahedral gap is formed between the [SiO4] tetrahedron and [YO6] octahedron, which divalent cations occupy [1]. Garnet is an important “indicator” mineral in skarn deposits. In many skarn polymetallic deposits, the color, content, and chemical composition of garnet change significantly in different parts of each contact zone and mineralization zone [3,4,5,6,7], which is one an important sign indicating skarn zoning and mineralization.
Vibrational spectroscopy is a useful, non-destructive and rapid analysis method for distinguishing between different solid solutions as the spectra change as a function of the garnet composition [8]. Among them, Raman spectroscopy can provide more structural information about various normal vibrational frequencies and related vibrational energy levels inside the molecule. The Raman shift in the spectrum depends on the change in the molecular vibration energy level. At the same time, the change in the Raman shift is reflected in the change in material composition [9,10,11,12,13,14,15,16,17,18].
Previous studies on garnet in skarn have mostly focused on composition, and Raman spectroscopy has been rare [19,20,21,22,23]. The few garnet Raman spectroscopy studies are also rarely associated with specific deposits [2,8]. The Jiama copper polymetallic deposit in Tibet is a super large deposit with notable economic value and scientific research significance. Skarn deposits are the most important deposit type, accounting for 65% of the industrial ore reserves [24]. Garnet is a widely distributed main skarn mineral with complex composition changes, and garnet skarn mineralization is good [25,26,27].Therefore, this paper undertook an electron probe analysis and Raman spectrum research on Jiama garnet in Tibet, exploring the Raman spectrum characteristics of garnet, analyzing the relationship between garnet composition and Raman shift, that is, the relationship between composition and structure, and discussing the indicative significance of garnet Raman analysis for Jiama skarn mineralization.
2. Geological Background
The Jiama copper polymetallic deposit is located in the eastern part of the Gangdise metallogenic belt in the Tethys tectonic domain, Tibet. The exposed stratum is mainly composed of an Upper Jurassic Duodigou formation (J3d), lower Cretaceous Linbuzong formation (K1l), and a small amount of Quaternary (Q) (Figure 1). The Duodigou formation is mainly composed of limestone and marble, which serves as the floor of the skarn; the Linbuzong formation is mainly slate and hornstone, which is the roof of the skarn. The structure of the mining area is mainly nappe, sliding nappe structure, and the resulting interlayer structure, and the interlayer expansion structure is the main occurrence space of the skarn ore body [26]. The structure is generally in the NWW direction, which is consistent with the stratum trend. NEE, NS, and NNW secondary faults control a large number of exposed dikes on the surface [25]. The magmatic activity in the mining area is frequent, there are many magmatic rock types and intrusion periods, and the ore-bearing magmatic rocks are mainly neutral porphyry. Magmatic rocks are mainly produced as vein rocks, among which granite porphyry, granodiorite porphyry, and monzonitic granite porphyry are the most commonly exposed [28]. The main ore body occurs in skarn, and the skarn runs through the whole mining area. The thick skarn can be seen in the No. 24 exploration line. The section of No. 24 exploration line reveals the skarn main ore body, which is large in scale and mostly occurs in a layered, stratoid, or thick plate shape. The overall trend is northwest, extending about 3000 m, leaning toward northeast, and extending about 2600 m (Figure 1b). The mineralization types of the deposit are mainly chalcopyrite, pyrite, bornite, molybdenite and galena, and sphalerite mineralization (Figure 2).
3. Measurement Methods
The samples were from different boreholes on the No. 24 exploration line of the Jiama deposit, including ZK2404, ZK2407, ZK2409, ZK2412, ZK2413, ZK2418, and ZK2420. Core samples with strong skarnization were taken. First, mineral composition and structural characteristics were observed under a microscope, and representative garnet sample areas were marked. Then, the electron probe microanalysis (EPMA) measurement and micro-Raman spectroscopy measurement were carried out successively in the same micro-area of garnet to determine the content of major elements and the micro-Raman spectra. Two to three points were selected for each area and the selection of test points shall avoid cracks and unevenness around them as much as possible. Finally, the correlation between the EPMA data and the Raman spectrum was analyzed by using the IBM Statistical Product and Service Solutions (SPSS) Statistics software to verify the close correlation between the composition of garnet and the Raman spectrum. An electron probe test was completed in the Electron Probe Laboratory of the Institute of Mineral Resources, Chinese Academy of Geological Sciences. The experimental instrument model was JXA-8230 (Jeol, Akishima, Japan). The experimental conditions were acceleration voltage 15 kV, excitation current 20 nA, and electron beam diameter 5 μm. A ZAF matrix-correction was applied during data reduction. The following standards and crystals were used for microanalyses: Jadeite (Si, Na, and Al), forsterite (Mg), orthoclase (K), apatite (P), orthoclase (K), wollastonite (Ca), rutile (Ti), and synthetic oxides (Cr, Mn, Fe, and Ni). The detection limit of most elements is 40×10−6–200×10−6 wt%. The micro-Raman spectroscopy experiment was carried out in the Laboratory of Environmental Mineralogy of Peking University. The test instrument was an inVia Reflex (Renishaw, UK) Raman spectrometer. A solid-state laser was used in the experiment, with an excitation wavelength of 532 nm, laser emission power of 50 mW, and excitation wavelength range of 50–9000 cm−1, each excitation wavelength was equipped with interference filter and two edge Rayleigh filters, and the slit width was 65 μm. In addition, there were 50 times Leica objective lens, numerical aperture of 0.75, and spot diameter of 1 μm and 2400 line grating. The single scanning time of sample was 30 s, the cumulative times was 25, the spectral resolution was 1 cm−1, and the data scanning range was 50–4000 cm−1. The data acquisition range was 50–1300 cm−1, and the application range of data processing in this experiment was 100–1200 cm−1.
4. Results
4.1. Electron Probe Results
The garnet samples from the skarn layer in seven drill holes (ZK2404, ZK2407, ZK2409, ZK2412, ZK2413, ZK2418, and ZK2420) on the No. 24 exploration line are the experimental objects. Table 1 displays the results of some major elements. The total iron content in the sample is calculated using divalent ions because the electron probe cannot measure the valence state of iron. Table 1 showed that the main components were SiO2, CaO, FeO, and Al2O3, with the variation range of SiO2 content being 36.011%–40.148%, CaO being 31.033%–35.505%, and the overall content of SiO2 and CaO changing little, which was positively correlated. FeO variation ranged from 1.784% to 29.433%, while Al2O3 variation ranged from 0% to 21.086%. The overall content of FeO and Al2O3 changed greatly, showing a negative correlation. According to Muhling (1991) [30], garnet is mainly composed of andradite (0%–94.17%), followed by grossular (0%–93.15%), and a small amount of almandine (0%–5.45%), belonging to andradite–grossular solid solution series. From ZK2404, ZK2407 to ZK2409, the content of FeO increases, and the proportion of andradite increases; the content of FeO in ZK2412 and ZK2413 decreases relatively, and the content of andradite decreases accordingly; the content of FeO in ZK2418 and ZK2420 increases again, and the garnet is almost mainly andradite.
4.2. Raman Spectrum Results
There are two main types of Raman spectra of the garnets obtained in the experiment: one is mainly andradite (And > 50%), and the other is mainly grossular (And < 50%), which have essentially similar spectral morphology, which can be divided into three parts: a low-wavenumber part from 100 to 400 cm−1, medium wavenumber part (400–650 cm−1), and high wavenumber part between 800 and 1050 cm−1. The difference between them mainly lies in the range from 800 to 1050 cm−1. The former has three peaks in high wavenumber region of spectra, while the latter has only two peaks (Figure 3). The symmetry of the garnet structure specifies 25 Raman bands: 3A1g + 8Eg + 14F2g, but it is usually impossible to see all 25 bands in one figure [15,31]. For example, the Raman active vibration mode of the X-position cation and [SiO4] tetrahedron in the garnet structure is shown in Figure 3, and the Y-position cation does not produce a Raman active vibration. The regions 800–1050 cm−1 and 400–650 cm−1 are related to the Si–O stretching vibrations (ν1, ν3) and Si–O bending vibrations (ν2, ν4), correspondingly (internal vibration of [SiO4] tetrahedra), which mainly belong to the A1g mode. These vibrations also exist in the Eg and F2g modes, but the signals in this part of Figure 3 are invisible. The range from 300 to 400 cm−1 is associated with the rotation of [SiO4] tetrahedra, which also belongs to the A1g mode. The peak near 240 cm−1 belongs to the F2g mode, and is caused by the translational vibrations of X2+ dodecahedral cations. The peak near 175 cm−1 belongs to the Eg and F2g modes and is caused by the translation of [SiO4] tetrahedron [31,32,33]. According to the degree of variation in Raman activity, structural characteristics and Raman shifts of garnets, the five Raman peaks of T, X, A1, A2, and A3 in Figure 3 were selected for the study. They are shown in Table 2. T and X represent the translation of [SiO4] tetrahedron and X2+ dodecahedral cations, respectively. A1, A2, and A3 represent the rotation vibration, the Si−O bending vibration, and the Si−O stretching vibration of [SiO4] tetrahedron, respectively.
5. Discussion
5.1. Raman Spectra of End Member Garnet
Figure 4 shows the Raman spectra and Raman peaks positions of five end member garnets (andradite, grossular, spessartine, almandine, and pyrope) [14,19,34]. As can be seen from the figure, there are variations in the Raman spectral characteristics of different end member garnets, including spectral morphology, peak intensity, peak positions, etc. [35]. The main difference lies in the number of peaks ranging from 800 to 1050 cm−1, of which only andradite has three peaks. The other end groups, including grossular, spessartine, almandine, and pyrope, have two peaks with a large difference in peak intensity between the two peaks. It should be noted that the peak intensity of one of the two peaks of almandine and spessartine is relatively small, sometimes showing only one peak. In addition, the spectral morphology of the other regions is basically the same, but there are differences between peak positions.
The variation in the peak positions of end member garnets is closely related to the composition and structure of the garnets. For the same X2+ and different Y3+ in the chemical formula of garnet (andradite and grossular), it was found that as the Y3+ radius increases (Fe3+ > Al3+), the size of the [YO6] octahedron increases, leading to a decrease in the bond energy of the Si–O bond to which it is attached [18], so that all the Raman peaks are shifted toward lower wavenumber. When X2+ is different and Y3+ is the same in the chemical formula of garnet (grossular, spessartine, almandine, and pyrope), there are two cases: (1) With the atomic mass of X2+ increasing (Fe2+ > Mn2+ > Ca2+ > Mg2+), the Raman peaks (T, X, A1) shift to lower frequency, indicated by almandine (167, 216, 342 cm−1), spessartine (175, 221, 350 cm−1), grossular (177, 240, 365 cm−1), and pyrope (222, –, 364 cm−1). Pyrope has some particularity because it shows only two Raman peaks, T and A1. The X Raman peak is in the lowest F2g mode, corresponding to the “translation” of the cation in the [SiO4] tetrahedra cage in silicates. Due to the small size of the Mg2+ ion vibrating in its large dodecahedral cage, it cannot be measured and only the T Raman peak is displayed [36]. These peaks (T, X, A1) move to a higher wavenumber with the increase in X2+ atomic mass because the energy generated by the vibration itself (X) decreases, and because the [SiO4] tetrahedron vibration obstacle increases due to the increased dodecahedron mass, so the [SiO4] tetrahedron translation (T) and rotational vibration (A1) decrease in energy. Assuming that, the total energy promoting the vibration of functional groups is certain, the results are also consistent with the vibration energy model of A. M. Hofmeister (1991) [11]. The greater the energy, the greater the peak intensity, and the greater the frequency. (2) As the X2+ radius increases (Ca2+ > Mn2+ > Fe2+ > Mg2+), the Raman peaks A2 and A3 shift to lower wavenumber, which is manifested as grossular (540, 874 cm−1), spessartine (552, 905 cm−1), almandine (556, 916 cm−1), and pyrope (563, 926 cm−1). The larger the X2+ radius, the larger the [XO8] dodecahedron, so the Si–O bond energy connected to it is relatively low, and the Raman shifts of A2 and A3 move in the low-frequency direction [11,18,19].
5.2. Raman Spectral Characteristics of Jiama Garnet and Its Relationship with Composition
Jiama garnet belongs to the andradite–grossular solid solution series. Nine groups of Raman spectra were selected and sorted according to the order of increasing andradite content (Figure 5). It can be seen from the figure that the position of the Raman peaks shifts to lower frequency with the increase in andradite content, which is consistent with the above discussion. Since the Raman peaks of andradite are concentrated in the low-frequency part, the increase in andradite content means an increase in the proportion of low-frequency Raman peaks of andradite–grossular solid solution, which is shown as a Raman shift to lower frequency.
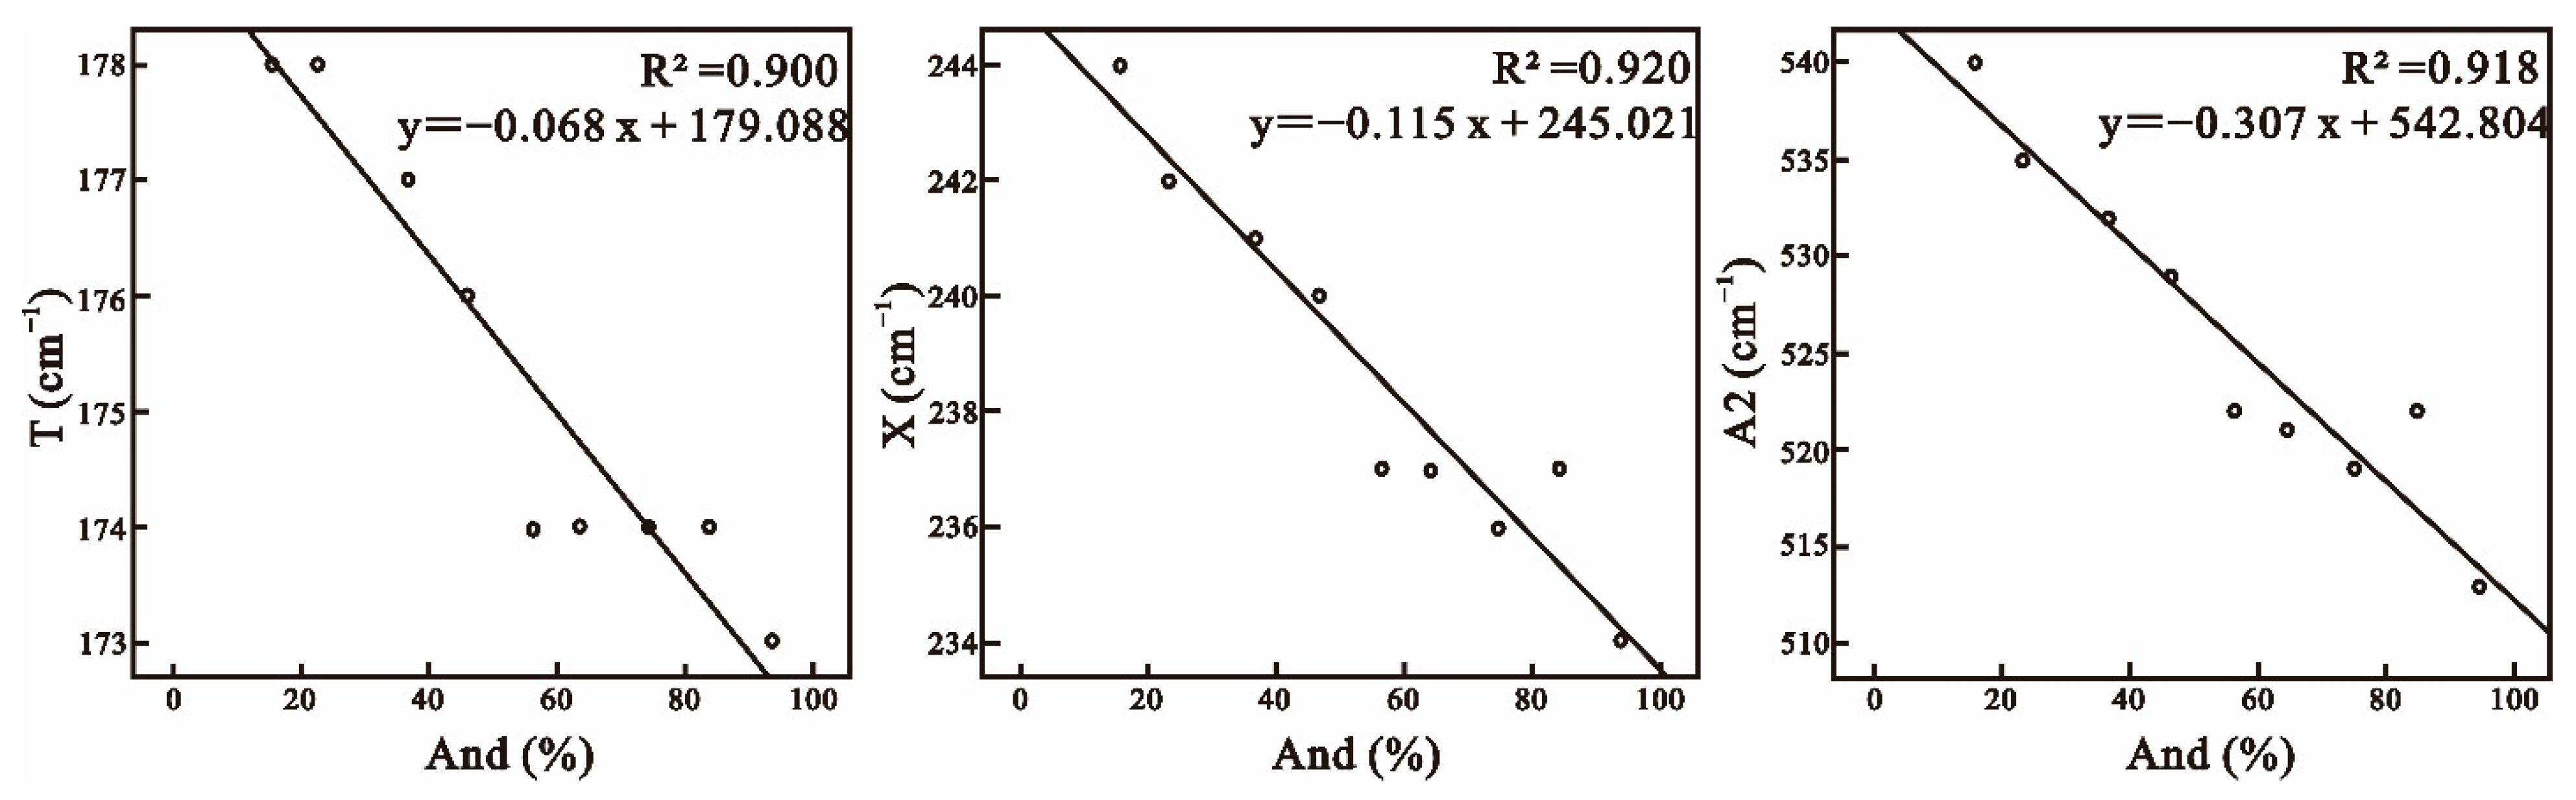
In Figure 5, it can be seen that the Raman peaks T, X, A1, A2, and A3 vary with the content of andradite. The variation in the T, X and A2 Raman peaks is more obvious than that of A1 and A3, as evidenced by the electron probe data and Raman peak positions of the nine groups extracted in Table 3. To find out why the T, X, and A2 Raman peaks can better reflect the characteristics of garnet, the correlation between the five Raman peaks, and the principal component content and andradite content was analyzed by SPSS. The results are shown in Table 4. The results showed that the five Raman peaks significantly correlated with the principal component content of garnet, but the significant correlations of T, X, and A2 were greater than those of A1 and A3. Thus, the T, X, and A2 Raman peaks show more pronounced changes in the figure. Among them, SiO2, CaO, Al2O3, and FeO were significantly correlated with the Raman peaks. Al2O3 was significantly positively correlated with the Raman peaks, while FeO was significantly negatively correlated. Similarly, the content of andradite was also significantly negatively correlated with the Raman peaks, that is, the frequency of Raman peaks decreases with the increase in andradite content. In addition, there is essentially no correlation between MnO, MgO, TiO2, and the Raman peaks, but MnO has a certain degree of correlation with X and A2, which confirms the special situation of pyrope in the above discussion. Combined with the vibration mechanism represented by X and A2, it is speculated that Mn2+ partially replaces Ca2+, which is also consistent with Wu’s findings (2015) [18]. In the crystal structure of garnet, there are two oxygen in the [SiO4] tetrahedron contributions to the divalent cations forming dodecahedron, so the divalent cations affect the vibration of the [SiO4] tetrahedron. The Raman peaks T, X, and A2 with the best correlation were taken and a linear fitting result with the andradite content was produced (Figure 6). It is found that the fitting result is very good. It can also be seen that the three Raman peaks are positively correlated, which shows that the change in the garnet Raman peaks is overall and the difference lies in the magnitude of the variation.
Table 5 shows the relationship between the garnet end member content and Raman peaks: when And > 50%, the five Raman peaks (T, X, A1, A2, and A3) ranges are 173–174, 234–239, 365–371, 513–525, and 872–876 cm−1; when And < 50%, they are 177–178, 240–244, 368–373, 527–543, and 875–878 cm−1. The range of Raman peak positions corresponding to A1 and A3 are overlapped with respect to T, X, and A2, which also proves that the latter three are indeed more correlated than the former two and that the end composition of garnets can be determined based on specific Raman peaks.
5.3. Relationship between Garnet and Mineralization
Referring to Figure 1 and Table 1, from the proximal skarn ZK2404, ZK2407, and ZK2409 which are close to the wall rock, and to the distal skarn ZK2420 which is far from the wall rock, the content of andradite increases and the Raman peaks shift to the lower wavenumber, and the mineralization type changes from chalcopyrite and bornite to molybdenum mineralization, indicating that the distal andradite-rich garnets have Raman peaks with a small wavenumber, generally 173–174 cm−1, 234–239 cm−1, 365–371 cm−1, 513–525 cm−1, and 872–876 cm−1, which are easily mineralized with copper; the proximal grossular-rich garnets have large wavenumber Raman peaks, usually 177–178 cm−1, 240–244 cm−1, 368–373 cm−1, 527–543 cm−1, and 875–878 cm−1, which are easily mineralize molybdenum. Compared with the three proximal boreholes, andradite content is lower in ZK2412 and ZK2413 and developing pyrite. It is speculated that the formation of porphyry at the bottom promoted the consumption of iron.
Previous results [37,38,39] showed that grossular forms mainly in a weakly oxidizing–weakly reducing environment of 550–700 °C, medium-acid solution, and low oxygen fugacity (logfO2 = −28.637~−16.514, Eh = −1.15–0.27 V, [39]), and andradite is generally formed at 450–600 °C, pH = 4.0–11.0, in an oxidizing–weakly oxidizing environment with high oxygen fugacity (logfO2 = −21.763~−11.066, Eh = 0.13–0.97 V, [39]). Garnets with high grossular composition form under more reducing and acidic conditions than those with high andradite composition. Relatively speaking, the formation of andradite under alkaline conditions is common; that is, alkaline conditions are conducive to iron mineralization. Grossular is best formed in an acidic medium, while lead–zinc mineralization and molybdenum mineralization are also formed in relatively acidic environments. Andradite are formed in almost the same amount as grossular under neutral conditions conducive to copper mineralization. The garnets in the Jiama deposit are similar to those in many skarn deposits in China; they are mainly composed of andradite–grossular series, such as Shizhuyuan in Hunan, Daye in Hubei, and Tiantang in Guangdong copper polymetallic deposits, which are formed in a relatively oxidized or weakly oxidized environment [40,41]. From the center of the rock mass to the far end, the garnets in the Jiama deposit are mainly grossular to andradite, reflecting the transformation from acidic to alkaline metallogenic solution, from weak oxidation–weak reduction to oxidation–weak oxidation metallogenic environment, and from copper to lead–zinc and molybdenum mineralization type.
6. Conclusions
(1) The Raman peaks of garnet in the Jiama deposit are negatively correlated with the content of andradite. The peaks shift toward a lower wavenumber with the andradite content increasing. This is also closely related to the cation radius and relative atomic mass. When X2+ is the same and Y3+ is different, all the Raman peaks (T, X, A1, A2, and A3) move in the low-frequency direction with the increase in the Y3+ radius. When X2+ is different and Y3+ is the same, some peaks (T, X, and A1) move in the low-frequency direction as the X2+ radius increases, while some peaks (A2 and A3) move in the low-frequency direction with the increase in the X2+ atomic mass.
(2) The correlations of T, X, and A2 are greater than those of A1 and A3. We can judge that garnet belongs to andradite (And > 50%) or grossular (And < 50%) by the former three Raman peaks when the garnet Raman spectrum is determined. When And > 50%, the three Raman peaks (T, X, and A2) range are 173–174, 234–239, 513–525 cm−1; when And < 50%, they are 177–178, 240–244, and 527–543 cm−1.
(3) Grossular is mostly formed in an acidic, weakly oxidizing–weakly reducing environment, while andradite is generally formed in an alkaline, oxidizing–weakly oxidizing environment. The change in garnet composition reflects the variation in the metallogenic environment, and the Raman spectrum can indicate the change in garnet composition. The Raman spectrum analysis of garnet can be used to study skarn mineralization, which is of great significance for deposit exploration.
Supplementary Materials
The following supporting information can be downloaded at: https://www.mdpi.com/article/10.3390/min12121578/s1, Table S1: EPMA results, garnet end member content and Raman peak position; Data S1: the Raman spectral files in the format.txt.
Author Contributions
Conceptualization, J.D. and M.F.; methodology, M.F. and J.D.; software, M.F. and L.Z.; validation, M.F., J.D. and L.Z.; formal analysis, M.F. and L.Z.; writing—original draft preparation, M.F.; writing—review and editing, M.F., J.D. and L.Z.; visualization, M.F., and J.D.; funding acquisition, J.D. All authors have read and agreed to the published version of the manuscript.
Funding
This research was funded by the National Key Research and Development Program of China (2022YFC2905001); the General program of National Natural Science Foundation of China (42172332); the Special fund for basic scientific research business expenses of central public welfare scientific research institutes (KK2102); and the China Geological Survey Project (DD20221684).
Data Availability Statement
Data are contained within the article.
Acknowledgments
We gratefully thank three anonymous reviewers for their helpful comments and insightful reviews, which have greatly improved the manuscript.
Conflicts of Interest
The authors declare no conflict of interest.
References
- Dai, J.J.; Zhao, L.X.; Jiang, Q.; Wang, H.Y.; Liu, T.Y. Review of thermal-infrared spectroscopy applied in geological ore exploration. Acta Geol. Sin. 2020, 94, 2520–2533. [Google Scholar]
- Bersani, D.; Andò, S.; Vignola, P.; Moltifiori, G.; Marino, I.G.; Lottici, P.P.; Diella, V. Micro-Raman spectroscopy as a routine tool for garnet analysis. Spectrochim. Acta 2009, 73, 484–491. [Google Scholar] [CrossRef] [PubMed]
- Zhao, B.; Barton, M.D. Compositional characteristics of garnets and pyroxenes in contact-metasomatic skarn deposits and their relationship to metallization. Chin. J. Geochem. 1987, 7, 329–335. [Google Scholar]
- Li, J.X.; Qin, K.Z.; Li, G.M.; Lin, J.D.; Xiao, B.; Jiang, H.Z.; Han, F.J.; Huang, S.F.; Chen, L.; Zhao, J.X. Zircon U-Pb geochronology and garnet composition of the Qiangdui Cu-Mo deposit in the eastern section of Gangdese and their significances. Geol. Explor. 2011, 47, 11–19. [Google Scholar]
- Zhang, W.; Zhang, X.C.; Leng, C.B.; Su, W.C.; Qin, C.J.; Cao, J.L.; Yan, J.H. Zoning and genesis of garnets in the Seleteguole reduced porphyry-skarn deposit of West Tianshan Mountains, Xinjiang. Miner. Depos. 2017, 36, 412–428. [Google Scholar]
- Shi, W.X.; Yi, J.J.; Wang, H.; Tian, R.J. Study on the characteristics of the infrared spectrum and the alteration zoning of drill core in the Makeng iron deposit. Rock Miner. Anal. 2020, 39, 934–943. [Google Scholar]
- Laukamp, C.; Legras, M.; Montenegro, V.; Windle, S.; Mcfarlane, A. Grandite-based resource characterization of the skarn-hosted Cu-Zn-Mo deposit of Antamina, Peru. Miner. Depos. 2021, 57, 107–128. [Google Scholar] [CrossRef]
- Kos, S.; Dolenec, M.; Lux, J.; Dolenec, S. Raman Microspectroscopy of Garnets from S-Fibulae from the Archaeological Site Lajh (Slovenia). Minerals 2020, 10, 325. [Google Scholar] [CrossRef] [Green Version]
- Cai, X.C.; Fu, Y.D.; Kan, X.M.; Peng, W.S.; Liu, G.K.; Tang, R.B. Mineral spectroscopy and genetic mineralogy. J. Mineral. Petrol. 1981, Z1, 1–19. [Google Scholar]
- Zhang, H.F. Lecture 20 of modern mineralogy application of laser Raman spectroscopy in mineralogical research. Earth Environ. 1984, 12, 59–64+58. [Google Scholar]
- Hofmeister, A.M.; Chopelas, A. Vibrational spectroscopy of end-member silicate garnets. Phys. Chem. Miner. 1991, 17, 503–526. [Google Scholar] [CrossRef]
- Xie, X.D.; Cha, F.B. Vibrational spectral study of borates—I: Raman spectroscopy. Acta Miner. Sin. 1993, 2, 130–136. [Google Scholar]
- Cha, F.B.; Xie, X.D.; Peng, W.S. A vibrational spectral study of borates—II: Infrared spectroscopy. Acta Miner. Sin. 1993, 3, 230–236. [Google Scholar]
- Kolesov, B.A.; Geiger, C.A. Raman scattering in silicate garnets: An investigation of their resonance intensities. J. Raman Spectrosc. 1997, 28, 659–662. [Google Scholar] [CrossRef]
- Kolesov, B.A.; Geiger, C.A. Raman spectra of silicate garnets. Phys. Chem. Miner. 1998, 25, 142–151. [Google Scholar] [CrossRef]
- Wu, L.; Ouyang, Z.H.; Cao, S.C.; Yi, D.L.; Sun, S.X.; Liu, X. Research development and application of Raman scattering technology. J. Light Scatt. 2005, 2, 180–186. [Google Scholar]
- Makreski, P.; Runcevski, T.; Jovanovski, G. Minerals from Macedonia. XXVI. Characterization and spectra-structure correlations for grossular and uvarovite. Raman study supported by IR spectroscopy. J. Raman Spectrosc. 2011, 42, 72–77. [Google Scholar] [CrossRef]
- Wu, F.; Zhang, X.C.; Zhu, Z.L. Quantitative relation between Raman shift and metal ion content in garnets. J. Light Scatt. 2015, 27, 350–354. [Google Scholar]
- Fan, J.L.; Liu, X.L.; Guo, S.G.; Yang, M.Y. Study on Raman spectra of garnets and relative identification. Appl. Laser 2007, 27, 310–313+299. [Google Scholar]
- Zhu, Q.Q.; Xie, G.Q.; Li, W.; Zhang, F.; Wang, J.; Zhang, P.; Yu, B.F. In situ analysis of garnets from the Jingshandian iron skarn deposit, Hubei Province, and its geological implications. Geol. China 2014, 41, 1944–1963. [Google Scholar]
- Liu, J.; Yang, M.X.; Di, J.R.; He, C. Spectra characterization of the uvarovite in anorthitic jade. Spectrosc. Spectr. Anal. 2018, 38, 1758–1762. [Google Scholar]
- Wang, Y.C. Raman scattering of grossular-andradite solid solution. Chin. J. High Pressure Phys. 2020, 34, 3–11. [Google Scholar]
- Chen, Y.M.; Yu, X.Y.; Yang, Y.; Ruan, C.T. A study of gemological and mineralogical characteristics and color zonation of garnets from Jinan, Shandong Province. Acta Mineral. Petrol. 2021, 40, 581–592. [Google Scholar]
- Tang, J.X.; Wang, Q.; Yang, H.H.; Gao, X.; Zhang, Z.B.; Zou, B. Mineralization, exploration and resource potential of porphyry-skarn-epithermal copper polymetallic deposits in Tibet. Acta Geosci. Sin. 2017, 38, 571–613. [Google Scholar]
- Ying, L.J.; Tang, J.X.; Wang, D.H.; Wang, W.P. Features of garnet in the Jiama super-large Cu polymetallic deposit and its genetic significance. Acta Geol. Sin. 2012, 86, 1735–1747. [Google Scholar]
- Tang, X.Q.; Wang, G.Z.; Qin, Z.P.; Yao, X.F.; Zhou, Y.X. Mineralogical characteristics and genesis of garnet in the Jiama (Gyama) copper-polymetallic deposit of Tibet. Acta Geosci. Sin. 2012, 33, 633–640. [Google Scholar]
- Jia, Y.H.; Qian, J.P. Study on REE distribution and mineralogical characteristics of different garnets by electron probe and inductively coupled plasma-mass spectrometry. Rock Miner. Anal. 2020, 39, 886–895. [Google Scholar]
- Qin, Z.P.; Duo, J.; Wang, X.W.; Liu, H.F.; Zhou, Y.; Peng, H.J. Characteristics and significance of magmatic-hydrothermal transition in Jiama (Gyama) monzonite granite-porphyry, Tibet. Acta Geosci. Sin. 2012, 33, 501–509. [Google Scholar]
- Leng, Q.F. Skarn Diagenesis and Mineralization of Jiama Copper Polymetallic Deposit in Tibet. Ph.D. Thesis, Chengdu University of Technology, Chengdu, China, 2015. [Google Scholar]
- Muhling, J.R.; Griffin, B.J. On recasting garnet analyses into end-member molecules-revisited. Comput. Geosci. 1991, 17, 161–170. [Google Scholar] [CrossRef]
- Peng, M.S.; Mao, H.K.; Li, D.E.; Chao, E.C.T. Raman spectra of garnet-group minerals. Spectrosc. Spectr. Anal. 1991, 5, 16–21. [Google Scholar]
- Liu, G.K.; Peng, W.S. Infrared spectral study of cookeite. Acta Miner. Sin. 1987, 1, 52–57. [Google Scholar]
- Li, J.; Lu, L.N.; Cui, Y.J.; Xie, C.; Du, J.G.; Si, Z.S. Raman spectra features of the garnet in elcogite from the Dabie mountain and its geological significances. J. Miner. Petrol. 2016, 36, 17–21. [Google Scholar]
- Enami, M. Influence of garnet hosts on the Raman spectra of quartz inclusions. J. Miner. Pet. Sci. 2012, 107, 173–180. [Google Scholar] [CrossRef] [Green Version]
- Laukamp, C.; Rodger, A.; Legras, M.; Lampinen, H.; Lau, I.C.; Pejcic, B.; Stromberg, J.; Francis, N.; Ramanaidou, E. Mineral physicochemistry underlying feature-based extraction of mineral abundance and composition from shortwave, mid and thermal infrared reflectance spectra. Minerals 2021, 11, 347. [Google Scholar] [CrossRef]
- Maschio, L.; Kirtman, B.; Salustro, S.; Zicovich-Wilson, C.M.; Orlando, R.; Dovesi, R. Raman Spectrum of Pyrope Garnet. A Quantum Mechanical Simulation of Frequencies, Intensities, and Isotope Shifts. J. Phys. Chem. A 2013, 117, 11464–11471. [Google Scholar] [CrossRef]
- Ai, Y.F.; Jin, L.N. Preliminary study on the relationship between garnet composition and mineralization. Acta Sci. Nat. Univ. Pekin. 1981, 1, 83–90. [Google Scholar]
- Zhao, B.; Li, T.J.; Li, Z.P. Experimental study of physico-chemical conditions of the formation of skarns. Geochimica 1983, 3, 256–267+331. [Google Scholar] [CrossRef]
- Liang, X.J. Characteristics and metasomatic mechanism of grossular-andradite series garnet. Acta Petrol. Miner. 1994, 4, 342–352. [Google Scholar]
- Zhao, H.J.; Xie, G.Q.; Wei, K.T.; Ke, Y.F. Skarn mineral and stable isotopic characteristics of Tonglushan Cu-Fe deposit in Hubei Province. Geol. Rev. 2012, 58, 379–395. [Google Scholar]
- Zheng, W.; Chen, M.H.; Zhao, H.J.; Xu, L.G.; Zhang, D.Y.; Ling, S.B.; Yao, L.; Yu, M.; Chang, L.Z. Skarn mineral characteristics of the Tiantang Cu-Pb-Zn polymetallic deposit in Guangdong Province and their geological significance. Acta Petrol. Mineral. 2013, 32, 23–40. [Google Scholar]
Figure 1.
(a) Geological map of the Jiama deposit mining area. (b) Profile of the No.24 exploration line (modified according to [29]).
Figure 1.
(a) Geological map of the Jiama deposit mining area. (b) Profile of the No.24 exploration line (modified according to [29]).
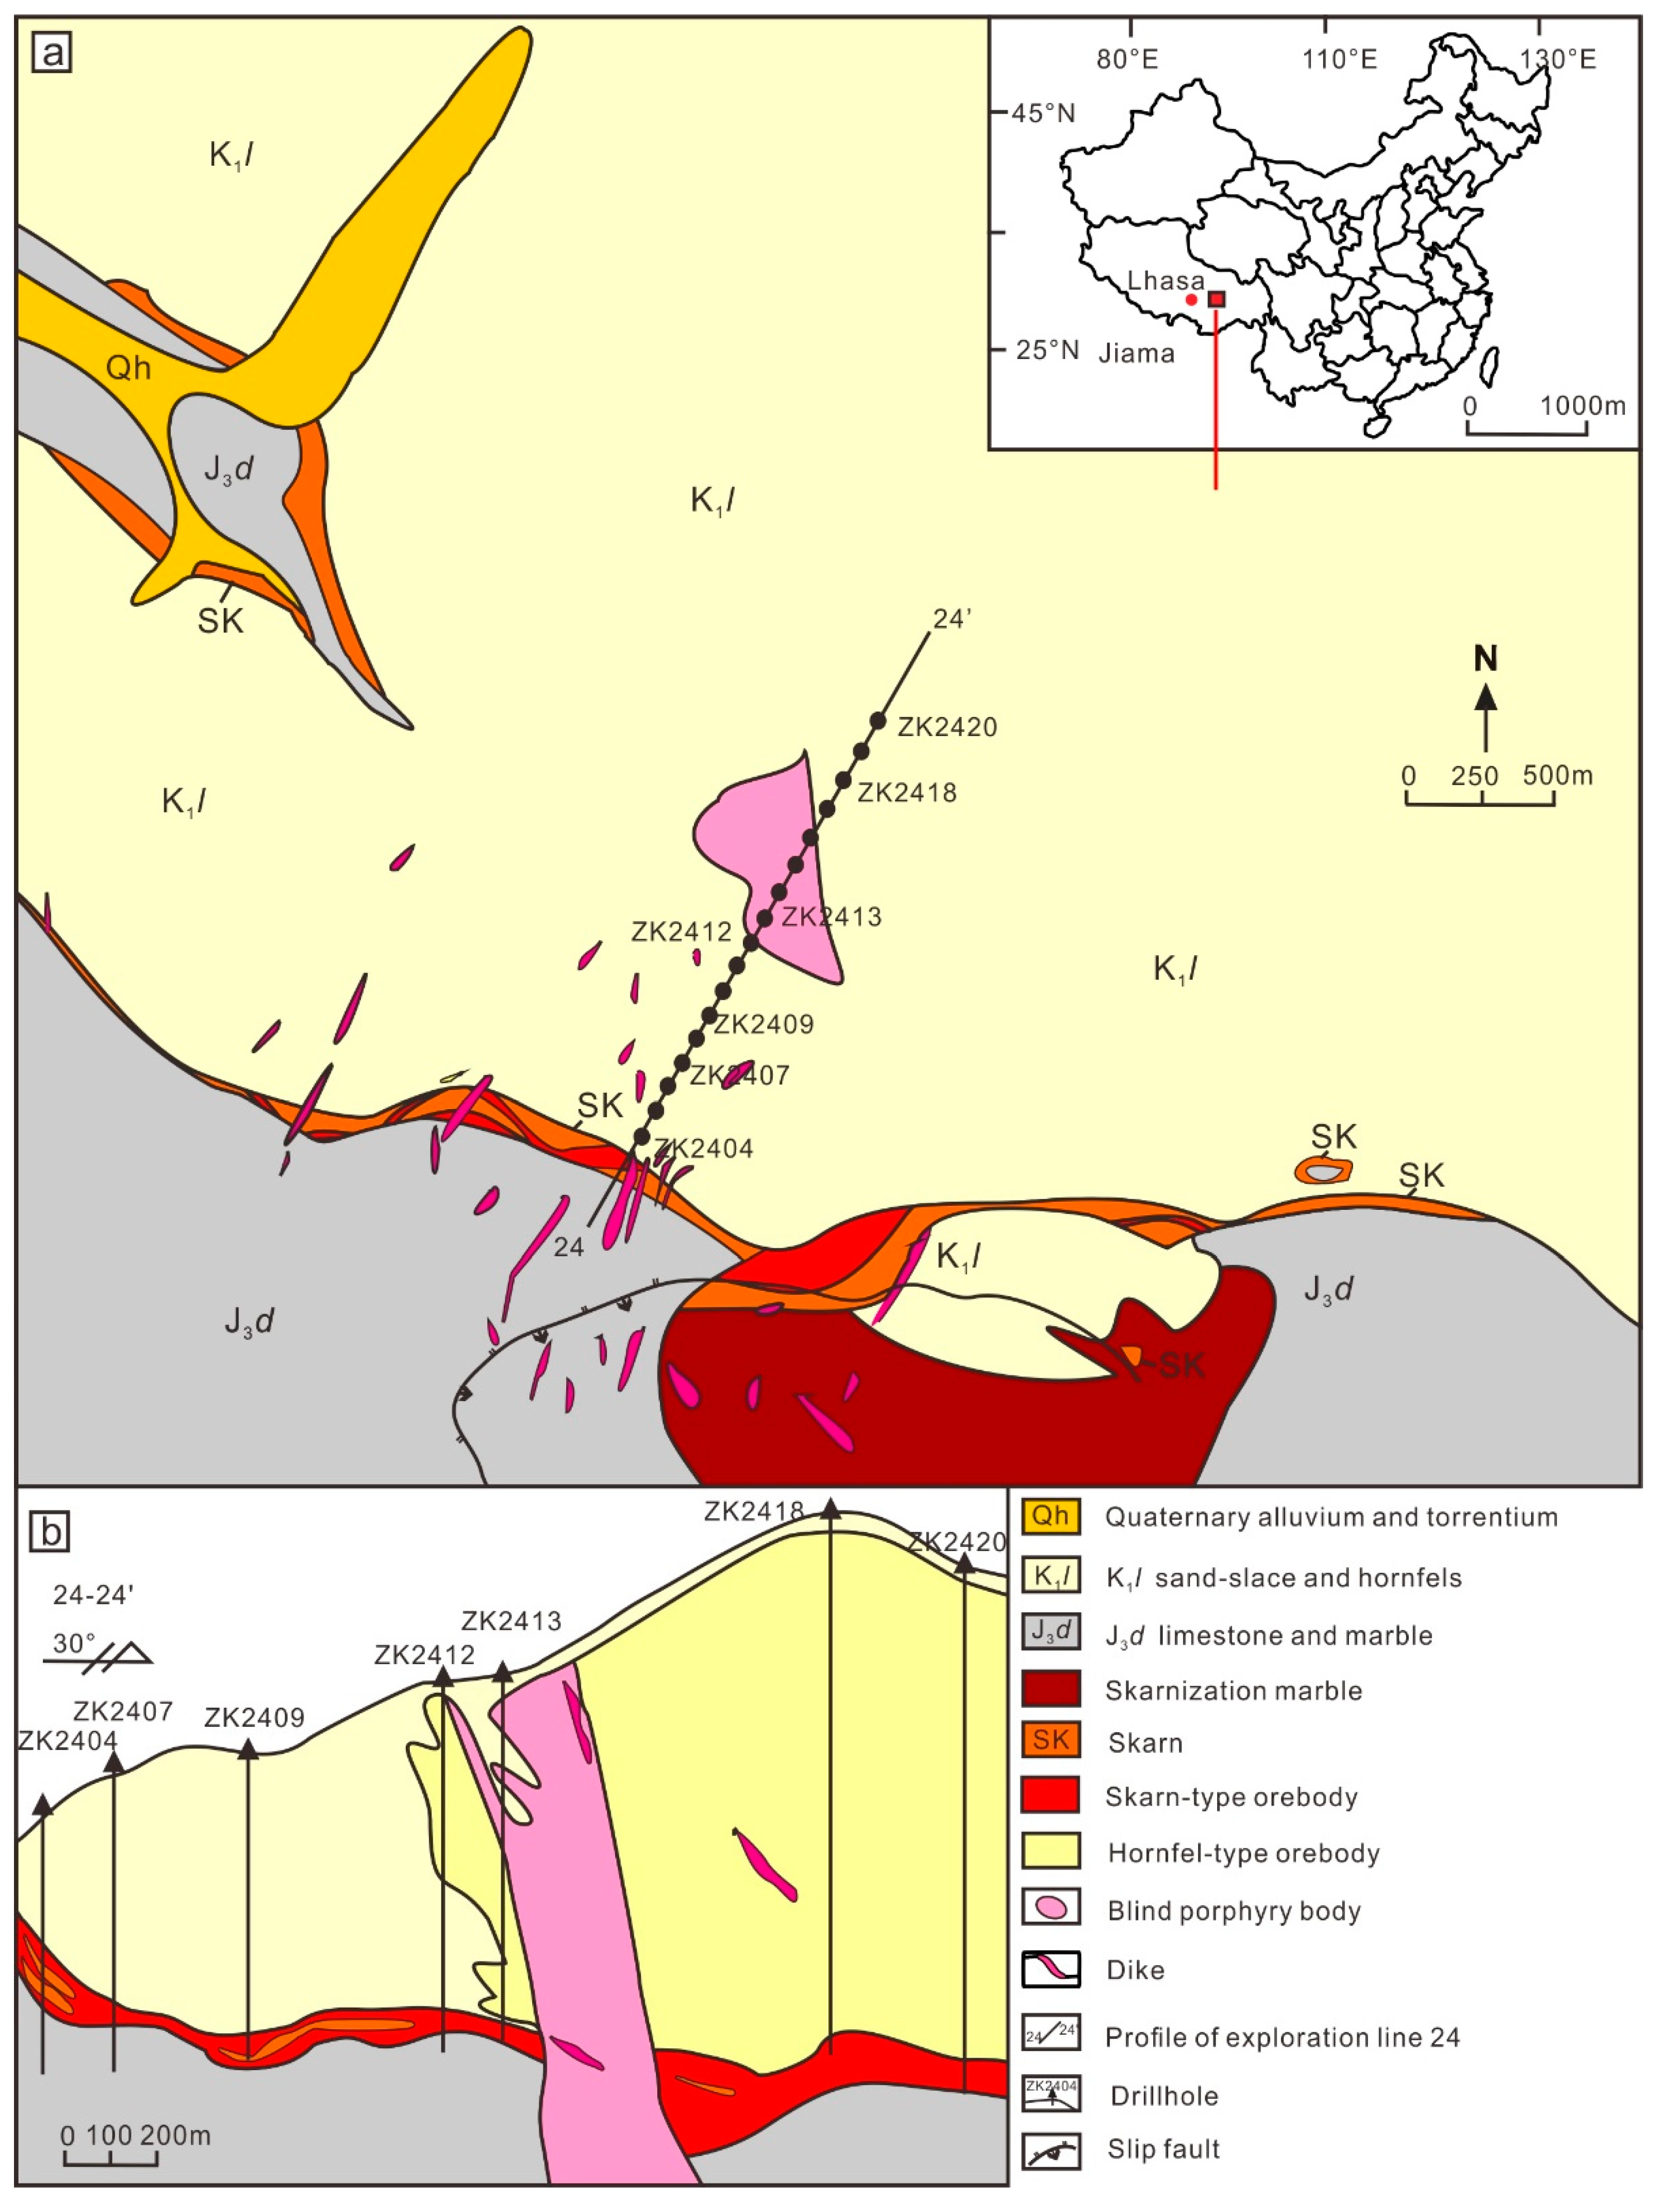
Figure 2.
Hand specimen photos and microphotographs from the No. 24 exploration line in Jiama deposit. (a) Green garnet. (b) Red brown garnet. (c) Yellow green garnet. (d) Disseminated chalcopyrite. (e) Vein-shaped molybdenite. (f) Granular garnet. (g) Zoned garnet. (h) Broken garnet. (i) Vein-shaped garnet. (j) Chalcopyrite, bornite, pyrite symbiosis. (k) Chalcopyrite, bornite are filled in the garnet gaps and fissures. (l) Molybdenite filled in garnet gaps. Grt: garnet; Ccp: chalcopyrite; Mol: molybdenite; Cal: calcite; Py: pyrite; Bn: bornite.
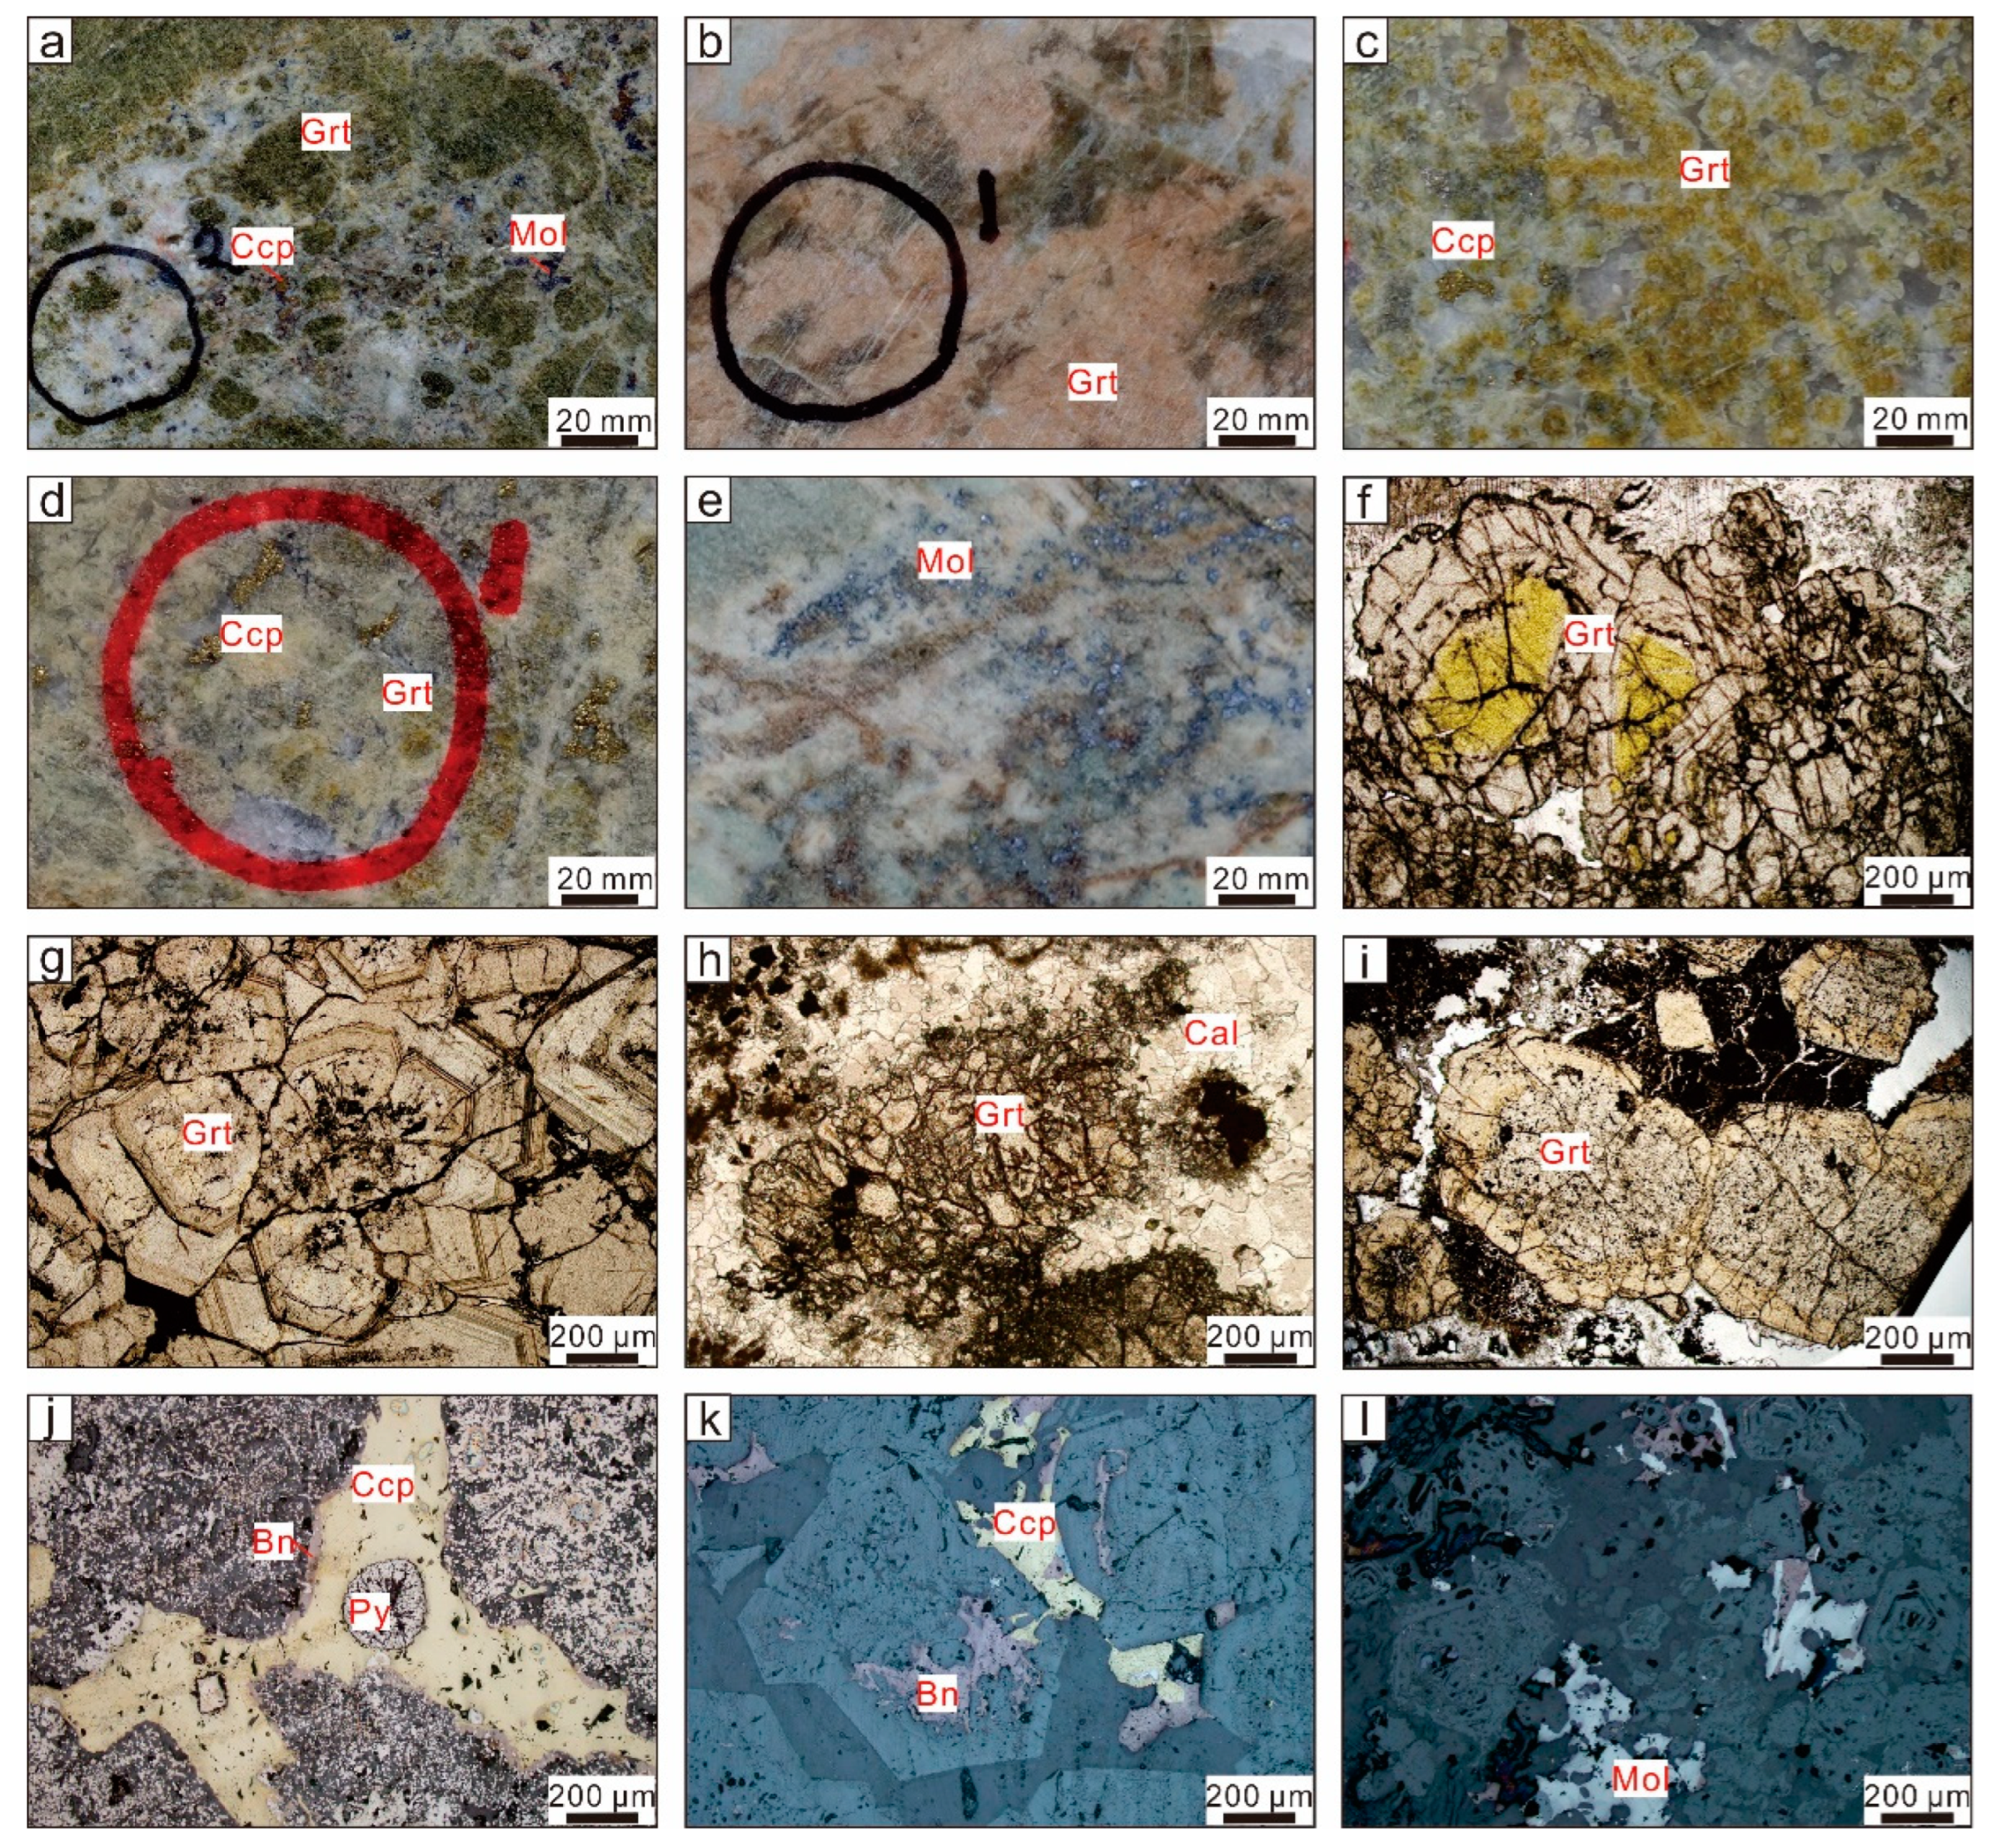
Figure 3.
Two typical Raman spectra of the garnets from Jiama. The A1g, Eg, and F2g means the Raman peak is visible in the modes. Many vibration bands of the Eg and F2g modes are not visible. T, X, A1, A2, and A3 refer to a specific Raman peak, where T and X represent the translation of [SiO4] tetrahedron and dodecahedral cations, respectively, A1, A2, and A3 represent the rotation vibration (R[SiO4]), the Si−O bending vibration (Si−O bend) and the Si−O stretching vibration (Si−O str) of [SiO4] tetrahedron, respectively.


Figure 5.
Relationship between the content of andradite and the Raman peaks: (1) 2412-11 (And94.14Gro0); (2) 2412-2 (And84.34Gro0); (3) 2412-12 (And74.70Gro6.15); (4) 2412-10 (And64.10Gro17.11); (5) 2412-1 (And56.52Gro25.59); (6) 2412-8 (And46.57Gro32.73); (7) 2412-4 (And36.79Gro54.98); (8) 2412-7 (And23.18Gro62.53); (9) 2412-5 (And15.79Gro71.52).
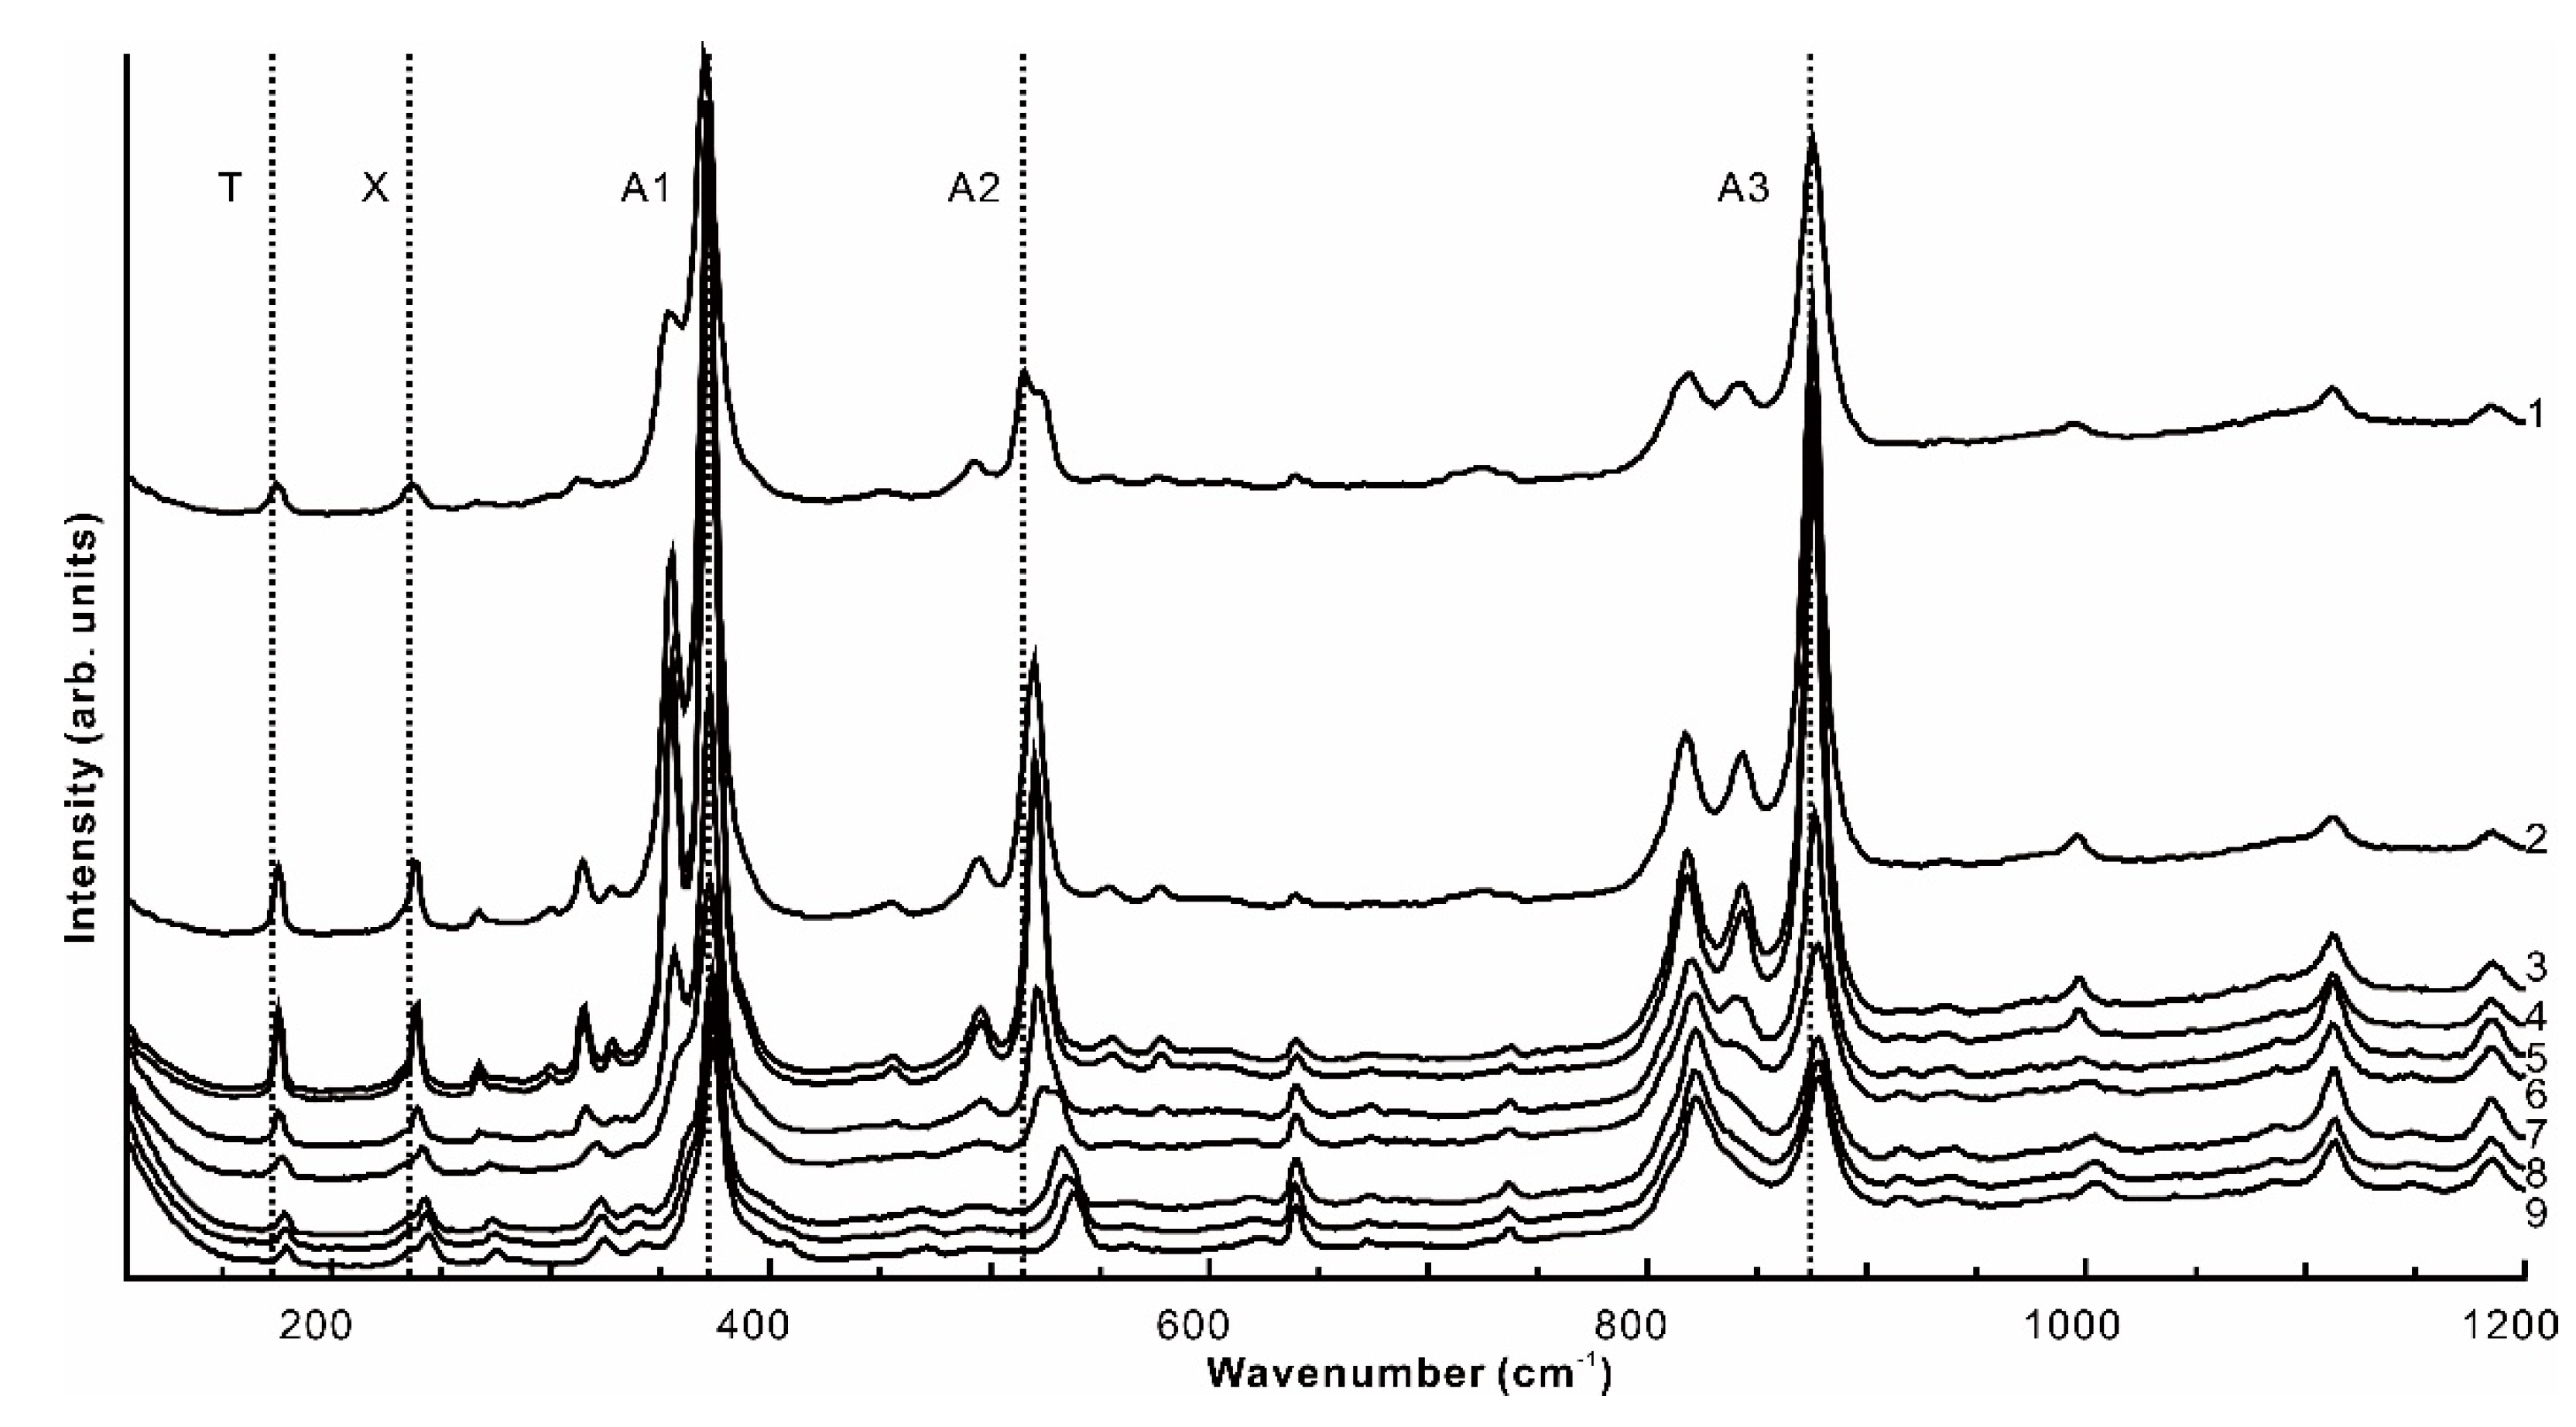
Figure 6.
The linear fitting results between andradite content and Raman peaks (T, X, and A2).

Table 1.
Selected major element contents (wt%) by EPMA, in garnet.
| No. | 2404-1 | 2404-2 | 2404-3 | 2404-4 | 2404-5 | 2407-1 | 2407-2 | 2407-3 | 2407-4 | 2407-5 | 2407-6 | 2407-7 |
| SiO2 | 37.691 | 38.506 | 38.798 | 38.545 | 38.909 | 39.164 | 38.393 | 36.709 | 38.457 | 36.675 | 37.006 | 37.194 |
| Al2O3 | 0.601 | 0.394 | 10.094 | 12.102 | 9.115 | 11.786 | 12.15 | 6.919 | 7.377 | 0.179 | 2.316 | 3.011 |
| FeO | 26.818 | 27.865 | 14.556 | 12.867 | 15.48 | 13.472 | 13.03 | 18.387 | 17.187 | 26.281 | 23.221 | 22.763 |
| MnO | 0.126 | 0.103 | 0.362 | 0.367 | 0.17 | 0.371 | 0.526 | 0.292 | 0.412 | 0.076 | 0.084 | 0.095 |
| MgO | 0.058 | 0.079 | 0.094 | 0.081 | 0.021 | 0.111 | 0.088 | 0.072 | 0.062 | 0.09 | 0.108 | 0.061 |
| CaO | 32.234 | 32.201 | 33.262 | 34.848 | 33.006 | 33.012 | 32.984 | 31.93 | 32.13 | 31.572 | 31.483 | 31.969 |
| Total | 97.528 | 99.148 | 97.166 | 98.81 | 96.701 | 97.916 | 97.171 | 94.309 | 95.625 | 94.873 | 94.218 | 95.093 |
| Number of ions on the basis of 12O | ||||||||||||
| Si | 3.145 | 3.174 | 3.123 | 3.032 | 3.163 | 3.114 | 3.07 | 3.075 | 3.158 | 3.153 | 3.176 | 3.155 |
| Al | 0.059 | 0.038 | 0.958 | 1.122 | 0.874 | 1.105 | 1.146 | 0.683 | 0.714 | 0.018 | 0.234 | 0.301 |
| Fe2+ | 0.046 | 0.063 | 0.045 | 0.014 | 0.055 | 0.056 | 0.044 | 0.042 | 0.056 | 0.041 | 0.05 | 0.044 |
| Fe3+ | 0.164 | 0.162 | 0.079 | 0.082 | 0.08 | 0.066 | 0.069 | 0.107 | 0.092 | 0.162 | 0.137 | 0.137 |
| Mn | 0.016 | 0.013 | 0.043 | 0.043 | 0.021 | 0.044 | 0.063 | 0.036 | 0.05 | 0.01 | 0.011 | 0.012 |
| Mg | 0.004 | 0.006 | 0.006 | 0.005 | 0.001 | 0.007 | 0.006 | 0.005 | 0.004 | 0.007 | 0.008 | 0.004 |
| Ca | 2.882 | 2.844 | 2.869 | 2.937 | 2.875 | 2.813 | 2.826 | 2.866 | 2.827 | 2.909 | 2.895 | 2.906 |
| Gro | 0 | 0 | 43.98 | 54.36 | 39.9 | 49.45 | 51.96 | 30.04 | 31.23 | 0 | 8.37 | 12.16 |
| And | 82.26 | 80.38 | 38.11 | 39.05 | 39.34 | 31.46 | 33.15 | 53.92 | 45.34 | 83.85 | 70.61 | 69.68 |
| No. | 2407-8 | 2407-9 | 2409-1 | 2409-2 | 2409-3 | 2409-4 | 2409-5 | 2412-1 | 2412-2 | 2412-3 | 2412-4 | 2412-5 |
| SiO2 | 36.107 | 37.421 | 39.4 | 38.261 | 38.464 | 37.703 | 38.126 | 38.591 | 38.056 | 38.116 | 39.037 | 40.148 |
| Al2O3 | 0.031 | 0.829 | 5.295 | 0.132 | 1.529 | 2.1 | 2.548 | 6.593 | 0.258 | 5.797 | 12.5 | 16.974 |
| FeO | 27.369 | 26.846 | 22.049 | 27.579 | 26.427 | 24.927 | 25.238 | 20.668 | 28.462 | 21.231 | 12.923 | 7.929 |
| MnO | 0.201 | 0.046 | 0.191 | 0.177 | 0.127 | 0.198 | 0.119 | 0.43 | 0.213 | 0.345 | 0.314 | 0.472 |
| MgO | 0.038 | 0.029 | 0.053 | 0.052 | 0.092 | 0.045 | 0.091 | 0 | 0.005 | 0.026 | 0.014 | 0.015 |
| CaO | 31.273 | 32.129 | 33.33 | 32.418 | 32.6 | 32.368 | 32.663 | 32.742 | 32.057 | 32.695 | 34.725 | 34.781 |
| Total | 95.019 | 97.3 | 100.318 | 98.619 | 99.239 | 97.341 | 98.785 | 99.024 | 99.051 | 98.21 | 99.513 | 100.319 |
| Number of ions on the basis of 12O | ||||||||||||
| Si | 3.032 | 3.134 | 3.141 | 3.166 | 3.148 | 3.138 | 3.126 | 3.1 | 3.141 | 3.073 | 3.049 | 3.058 |
| Al | 0.003 | 0.082 | 0.498 | 0.013 | 0.148 | 0.206 | 0.246 | 0.624 | 0.025 | 0.551 | 1.151 | 1.524 |
| Fe2+ | 0 | 0.045 | 0.058 | 0.052 | 0.052 | 0.046 | 0.048 | 0.054 | 0.057 | 0.056 | 0.023 | 0.042 |
| Fe3+ | 0.19 | 0.164 | 0.124 | 0.166 | 0.158 | 0.15 | 0.151 | 0.117 | 0.17 | 0.12 | 0.078 | 0.034 |
| Mn | 0.025 | 0.006 | 0.023 | 0.022 | 0.015 | 0.025 | 0.015 | 0.051 | 0.026 | 0.041 | 0.037 | 0.054 |
| Mg | 0.003 | 0.002 | 0.004 | 0.004 | 0.006 | 0.003 | 0.006 | 0 | 0 | 0.002 | 0.001 | 0.001 |
| Ca | 2.814 | 2.883 | 2.847 | 2.874 | 2.859 | 2.887 | 2.87 | 2.818 | 2.835 | 2.825 | 2.906 | 2.839 |
| Gro | 0 | 0.51 | 20.04 | 0 | 3 | 6.7 | 8.03 | 25.59 | 0 | 22.28 | 54.98 | 71.52 |
| And | 94.17 | 82.66 | 59.68 | 82.48 | 77.72 | 75.28 | 74.63 | 56.52 | 84.34 | 58.25 | 36.79 | 15.79 |
| No. | 2412-6 | 2412-7 | 2412-8 | 2412-9 | 2412-10 | 2412-11 | 2412-12 | 2413-1 | 2413-2 | 2413-3 | 2413-4 | 2413-5 |
| SiO2 | 39.242 | 39.754 | 39.322 | 37.026 | 38.137 | 36.011 | 38.444 | 37.347 | 36.907 | 39.633 | 39.706 | 39.863 |
| Al2O3 | 21.086 | 14.93 | 8.323 | 0.202 | 4.354 | 0.083 | 1.954 | 0.404 | 0.149 | 8.487 | 6.929 | 8.671 |
| FeO | 1.784 | 10.698 | 18.573 | 29.433 | 22.269 | 29.327 | 25.254 | 27.469 | 27.474 | 18.443 | 19.364 | 17.922 |
| MnO | 0.359 | 0.342 | 0.284 | 0.298 | 0.132 | 0.217 | 0.157 | 0.077 | 0.154 | 0.171 | 0.171 | 0.269 |
| MgO | 0.211 | 0.009 | 0.064 | 0.036 | 0.038 | 0 | 0.038 | 0.118 | 0.144 | 0.112 | 0.131 | 0.144 |
| CaO | 35.505 | 34.158 | 32.915 | 31.033 | 32.554 | 31.312 | 32.935 | 32.398 | 32.06 | 33.47 | 33.411 | 33.367 |
| Total | 98.187 | 99.891 | 99.481 | 98.028 | 97.484 | 96.95 | 98.782 | 97.813 | 96.888 | 100.316 | 99.712 | 100.236 |
| Number of ions on the basis of 12O | ||||||||||||
| Si | 3.005 | 3.068 | 3.124 | 3.094 | 3.144 | 3.045 | 3.154 | 3.119 | 3.109 | 3.128 | 3.167 | 3.143 |
| Al | 1.904 | 1.358 | 0.78 | 0.02 | 0.423 | 0.008 | 0.189 | 0.04 | 0.015 | 0.79 | 0.652 | 0.806 |
| Fe2+ | 0.009 | 0.049 | 0.064 | 0.057 | 0.051 | 0.038 | 0.049 | 0.039 | 0.037 | 0.058 | 0.06 | 0.061 |
| Fe3+ | 0.008 | 0.05 | 0.097 | 0.176 | 0.129 | 0.185 | 0.151 | 0.172 | 0.173 | 0.099 | 0.105 | 0.094 |
| Mn | 0.041 | 0.039 | 0.034 | 0.037 | 0.016 | 0.027 | 0.019 | 0.01 | 0.019 | 0.02 | 0.02 | 0.032 |
| Mg | 0.014 | 0.001 | 0.004 | 0.003 | 0.003 | 0 | 0.003 | 0.008 | 0.01 | 0.007 | 0.009 | 0.01 |
| Ca | 2.914 | 2.824 | 2.802 | 2.779 | 2.876 | 2.837 | 2.895 | 2.9 | 2.894 | 2.831 | 2.855 | 2.819 |
| Gro | 93.15 | 62.53 | 32.73 | 0 | 17.11 | 0 | 6.15 | 0 | 0 | 33.98 | 27.84 | 34.42 |
| And | 3.69 | 23.18 | 46.57 | 88.67 | 64.1 | 94.14 | 74.7 | 86.12 | 87.52 | 47.24 | 50.32 | 44.62 |
| No. | 2418-1 | 2418-2 | 2418-3 | 2418-4 | 2418-5 | 2418-6 | 2418-7 | 2420-1 | 2420-2 | 2420-3 | 2420-4 | 2420-5 |
| SiO2 | 37.592 | 38.447 | 37.403 | 37.665 | 38.478 | 37.417 | 36.7 | 37.71 | 37.974 | 38.151 | 37.78 | 37.2 |
| Al2O3 | 2.135 | 11.133 | 6.528 | 4.99 | 10.054 | 0.518 | 0.051 | 0 | 1.933 | 1.985 | 0.064 | 0.01 |
| FeO | 25.709 | 14.562 | 20.179 | 21.606 | 16.059 | 27.066 | 28.267 | 28.311 | 26.167 | 25.577 | 27.841 | 28.43 |
| MnO | 0.134 | 0.506 | 0.361 | 0.299 | 0.494 | 0.206 | 0.278 | 0.334 | 0.175 | 0.118 | 0.357 | 0.315 |
| MgO | 0.02 | 0.069 | 0.042 | 0 | 0.046 | 0.039 | 0.022 | 0.042 | 0.103 | 0.074 | 0.027 | 0.03 |
| CaO | 32.103 | 34.564 | 32.579 | 32.545 | 34.159 | 31.792 | 31.563 | 31.583 | 32.375 | 32.537 | 31.141 | 31.24 |
| Total | 97.693 | 99.281 | 97.092 | 97.105 | 99.29 | 97.038 | 96.881 | 97.98 | 98.727 | 98.442 | 97.21 | 97.225 |
| Number of ions on the basis of 12O | ||||||||||||
| Si | 3.124 | 3.009 | 3.065 | 3.096 | 3.029 | 3.143 | 3.099 | 3.149 | 3.124 | 3.136 | 3.177 | 3.131 |
| Al | 0.209 | 1.027 | 0.631 | 0.484 | 0.933 | 0.051 | 0.005 | 0 | 0.187 | 0.192 | 0.006 | 0.001 |
| Fe2+ | 0.051 | 0.017 | 0.035 | 0.041 | 0.027 | 0.047 | 0.044 | 0.059 | 0.049 | 0.042 | 0.066 | 0.055 |
| Fe3+ | 0.153 | 0.093 | 0.123 | 0.13 | 0.098 | 0.165 | 0.175 | 0.168 | 0.158 | 0.157 | 0.161 | 0.171 |
| Mn | 0.017 | 0.059 | 0.044 | 0.037 | 0.058 | 0.026 | 0.035 | 0.042 | 0.021 | 0.014 | 0.045 | 0.04 |
| Mg | 0.001 | 0.005 | 0.003 | 0 | 0.003 | 0.003 | 0.002 | 0.003 | 0.007 | 0.005 | 0.002 | 0.002 |
| Ca | 2.859 | 2.898 | 2.861 | 2.866 | 2.882 | 2.861 | 2.855 | 2.826 | 2.854 | 2.866 | 2.806 | 2.817 |
| Gro | 5.85 | 48.77 | 27.31 | 20.37 | 43.36 | 0 | 0 | 0 | 4.64 | 5.98 | 0 | 0 |
| And | 76.73 | 43.74 | 60.59 | 64.34 | 46.7 | 83.39 | 88.92 | 84.34 | 77.97 | 77.53 | 81.36 | 86.41 |
Note: Gro: Grossular; And: Andradite.
Table 2.
Raman peaks (cm−1) of garnets.
| Samples | Eg + F2g | F2g | A1g + Eg + F2g | A1g | A1g + Eg | Samples | Eg + F2g | F2g | A1g + Eg + F2g | A1g | A1g + Eg |
| T | X | A1 | A2 | A3 | T | X | A1 | A2 | A3 | ||
| 2404-1 | 174 | 236 | 370 | 518 | 874 | 2412-6 | 177 | 240 | 370 | 543 | 877 |
| 2404-2 | 173 | 236 | 369 | 517 | 872 | 2412-7 | 178 | 242 | 372 | 535 | 876 |
| 2404-3 | 177 | 241 | 372 | 531 | 876 | 2412-8 | 176 | 240 | 372 | 529 | 876 |
| 2404-4 | 177 | 241 | 373 | 533 | 876 | 2412-9 | 173 | 235 | 369 | 516 | 873 |
| 2404-5 | 177 | 241 | 371 | 530 | 876 | 2412-10 | 174 | 237 | 370 | 521 | 876 |
| 2407-1 | 177 | 241 | 372 | 533 | 876 | 2412-11 | 173 | 234 | 365 | 513 | 873 |
| 2407-2 | 177 | 241 | 372 | 531 | 876 | 2412-12 | 174 | 236 | 371 | 519 | 874 |
| 2407-3 | 175 | 239 | 371 | 527 | 876 | 2413-1 | 173 | 236 | 367 | 516 | 873 |
| 2407-4 | 175 | 240 | 372 | 528 | 875 | 2413-2 | 173 | 236 | 371 | 515 | 873 |
| 2407-5 | 173 | 236 | 369 | 517 | 872 | 2413-3 | 176 | 240 | 372 | 527 | 875 |
| 2407-6 | 174 | 237 | 370 | 519 | 874 | 2413-4 | 176 | 239 | 371 | 525 | 875 |
| 2407-7 | 174 | 237 | 371 | 522 | 875 | 2413-5 | 176 | 240 | 372 | 528 | 876 |
| 2407-8 | 173 | 235 | 369 | 516 | 874 | 2418-1 | 173 | 236 | 369 | 517 | 874 |
| 2407-9 | 173 | 236 | 371 | 517 | 873 | 2418-2 | 174 | 237 | 369 | 523 | 875 |
| 2409-1 | 176 | 239 | 371 | 523 | 875 | 2418-3 | 173 | 235 | 369 | 517 | 874 |
| 2409-2 | 174 | 237 | 371 | 520 | 875 | 2418-4 | 174 | 237 | 370 | 522 | 875 |
| 2409-3 | 174 | 236 | 371 | 518 | 874 | 2418-5 | 176 | 240 | 367 | 532 | 876 |
| 2409-4 | 176 | 239 | 371 | 523 | 875 | 2418-6 | 173 | 236 | 370 | 517 | 875 |
| 2409-5 | 174 | 237 | 371 | 522 | 875 | 2418-7 | 173 | 235 | 369 | 516 | 873 |
| 2412-1 | 174 | 237 | 369 | 522 | 876 | 2420-1 | 173 | 235 | 369 | 515 | 874 |
| 2412-2 | 174 | 237 | 370 | 522 | 875 | 2420-2 | 174 | 236 | 371 | 518 | 874 |
| 2412-3 | 174 | 237 | 370 | 523 | 876 | 2420-3 | 174 | 236 | 371 | 518 | 874 |
| 2412-4 | 177 | 241 | 372 | 532 | 876 | 2420-4 | 173 | 235 | 369 | 516 | 873 |
| 2412-5 | 178 | 244 | 373 | 540 | 877 | 2420-5 | 173 | 235 | 369 | 516 | 873 |
Table 3.
EPMA data (wt%) and Raman peaks (cm−1) of nine groups of garnets.
| No. | SiO2 | TiO2 | Al2O3 | FeO | MnO | MgO | CaO | Gro | And | T | X | A1 | A2 | A3 |
|---|---|---|---|---|---|---|---|---|---|---|---|---|---|---|
| 1 | 36.011 | 0.038 | 0.083 | 29.327 | 0.217 | 0 | 31.312 | 0 | 94.14% | 173 | 234 | 365 | 513 | 873 |
| 2 | 38.056 | 0.023 | 0.258 | 28.462 | 0.213 | 0.005 | 32.057 | 0 | 84.34% | 174 | 237 | 370 | 522 | 875 |
| 3 | 38.444 | 0.03 | 1.954 | 25.254 | 0.157 | 0.038 | 32.935 | 6.15% | 74.70% | 174 | 236 | 371 | 519 | 874 |
| 4 | 38.137 | 0 | 4.354 | 22.269 | 0.132 | 0.038 | 32.554 | 17.11% | 64.10% | 174 | 237 | 370 | 521 | 876 |
| 5 | 38.591 | 0.187 | 6.593 | 20.668 | 0.43 | 0 | 32.742 | 25.59% | 56.52% | 174 | 237 | 369 | 522 | 876 |
| 6 | 39.322 | 0.163 | 8.323 | 18.573 | 0.284 | 0.064 | 32.915 | 32.73% | 46.57% | 176 | 240 | 372 | 529 | 876 |
| 7 | 39.037 | 0.041 | 12.5 | 12.923 | 0.314 | 0.014 | 34.725 | 54.98% | 36.79% | 177 | 241 | 372 | 532 | 876 |
| 8 | 39.754 | 0.228 | 14.93 | 10.698 | 0.342 | 0.009 | 34.158 | 62.53% | 23.18% | 178 | 242 | 372 | 535 | 876 |
| 9 | 40.148 | 0.176 | 16.974 | 7.929 | 0.472 | 0.015 | 34.781 | 71.52% | 15.79% | 178 | 244 | 373 | 540 | 877 |
Table 4.
Correlation results.
| SiO2 | TiO2 | Al2O3 | FeO | MnO | MgO | CaO | Gro | And | |
|---|---|---|---|---|---|---|---|---|---|
| T | 0.856 ** | 0.621 | 0.958 ** | −0.953 ** | 0.625 | 0.065 | 0.915 ** | 0.959 ** | −0.948 ** |
| X | 0.903 ** | 0.616 | 0.954 ** | −0.953 ** | 0.674 * | 0.097 | 0.909 ** | 0.952 ** | −0.959 ** |
| A1 | 0.948 ** | 0.385 | 0.725 * | −0.757 * | 0.355 | 0.420 | 0.832 ** | 0.715 * | −0.796 * |
| A2 | 0.912 ** | 0.626 | 0.951 ** | −0.950 ** | 0.686 * | 0.074 | 0.911 ** | 0.949 ** | −0.958 ** |
| A3 | 0.856 ** | 0.542 | 0.788 * | −0.803 ** | 0.619 | 0.166 | 0.728* | 0.776 * | −0.843 ** |
** When the confidence level is 0.01, the correlation is significant; * when the confidence level is 0.05, the correlation is significant.
Publisher’s Note: MDPI stays neutral with regard to jurisdictional claims in published maps and institutional affiliations. |
© 2022 by the authors. Licensee MDPI, Basel, Switzerland. This article is an open access article distributed under the terms and conditions of the Creative Commons Attribution (CC BY) license (https://creativecommons.org/licenses/by/4.0/).
Share and Cite
MDPI and ACS Style
Fu, M.; Dai, J.; Zhao, L. A Study on the Raman Spectral Characteristics of Garnet from the Jiama Copper Polymetallic Deposit in Tibet. Minerals 2022, 12, 1578. https://doi.org/10.3390/min12121578
AMA Style
Fu M, Dai J, Zhao L. A Study on the Raman Spectral Characteristics of Garnet from the Jiama Copper Polymetallic Deposit in Tibet. Minerals. 2022; 12(12):1578. https://doi.org/10.3390/min12121578
Chicago/Turabian StyleFu, Minghai, Jingjing Dai, and Longxian Zhao. 2022. "A Study on the Raman Spectral Characteristics of Garnet from the Jiama Copper Polymetallic Deposit in Tibet" Minerals 12, no. 12: 1578. https://doi.org/10.3390/min12121578
Note that from the first issue of 2016, this journal uses article numbers instead of page numbers. See further details here.