Article

Synthesis, Characterization, and Application of Geopolymer/TiO2 Nanoparticles Composite for Efficient Removal of Cu(II) and Cd(II) Ions from Aqueous Media

1
Laboratoire de Recherche en Développement Durable et Santé, Faculté des Sciences et Techniques, Université Cadi Ayyad, Marrakech 40000, Morocco
2
Centre d’Agroalimentaire et Bioingénierie, Unité de Recherche Labélisée CNRST (Centre AgroBiotech, URL-CNRST 05) Université Cadi Ayyad, Marrakech 40000, Morocco
*
Author to whom correspondence should be addressed.
Minerals 2022, 12(11), 1445; https://doi.org/10.3390/min12111445
Submission received: 21 September 2022 / Revised: 3 November 2022 / Accepted: 9 November 2022 / Published: 15 November 2022
(This article belongs to the Topic Geopolymers: Synthesis, Characterization and Applications)

Abstract

:
The use of fly ash wastes as inexpensive sorbents, mostly for heavy metal cations, is one method of recycling the millions of tons of fly ash waste produced each year. In this paper, a fly ash-based geopolymer was used as an adsorbent for Cu2+ and Cd2+ from an aqueous solution. To improve geopolymer sorption efficiency, fly ash was modified by incorporating titanium oxide (TiO2) nanoparticles that were synthesized hydrothermally and annealed at a temperature of 500 °C. The adsorbents were characterized before and after adsorption by X-ray diffraction (XRD), Fourier transform infrared (FT-IR), and scanning electron microscopy (SEM-EDX). Regarding the developed materials, Cu2+ and Cd2+ adsorption equilibria (Langmuir model and Freundlich model) and kinetics (pseudo-first-order and pseudo-second-order model) were investigated. The results show that geopolymer-NanoTiO2 adsorbs heavy metal cations better, which is superior to geopolymer. The maximum experimental adsorption capacity of geopolymer-NanoTiO2 composite for Cu2+ and Cd2+ was 1708.2 mg/g and 706.9 mg/g, respectively. Therefore, geopolymer-NanoTiO2 composite has shown great application prospects in the prevention and control of heavy metal pollution.

1. Introduction

Heavy metallic pollutants are an extreme hazard to aquatic ecosystems because some of these metals can be toxic even at very low concentrations [1]. Furthermore, heavy metals are not biodegradable and tend to accumulate in organisms, which can cause serious problems for human health [2]. These metals occur naturally in the earth’s crust and are found in soils, rocks, sediments, fluids, and microorganisms. Anthropogenic releases of them can give rise to higher concentrations of metals in the environment. The majority of heavy metals come from processes such as metal finishing and plating operations, insect repellents from textile manufacture, herbicides, pesticides, etc. [3].
Copper, cadmium, lead, and mercury are examples of toxic metals that are ubiquitous in industries [4]. Copper (II) or Cu2+ has short-term and long-term adverse effects on organisms. Additionally, even very low concentrations of very toxic metals can affect other organisms [5]. The World Health Organization (WHO) recommends a maximum authorized Cu2+ content in drinking water of 1.3 mg/L [6]. Cadmium (II) Cd2+ is one of the most toxic heavy metals in the environment. It is also known to be a human carcinogenic and can cause pulmonary insufficiency, bone lesions, and hypertension. According to the World Health Organization (WHO), the permissible limit for cadmium in drinking water is between 0.001–0.002 mg/L [7].
There are various methods to remove heavy metals from wastewater, namely membrane filtration [8], chemical precipitation [9], coagulation[10], ion exchange, and adsorption [11]. Among these techniques, the adsorption method is one of the most direct and efficient deletion methods. High-performance and low-cost adsorbent techniques have been developed and have become a hot research topic [12]. Among these adsorbents, those prepared from industrial waste, such as fly ash, seem to display very high performance.
Fly ash is a pulverized by-product that results from coal combustion, mostly, in a thermal power plant. Its main components are unburned carbons, aluminosilicates, and iron oxides [13]. In short, fly ash is an industrial waste that is commonly disposed of in landfills, causing serious environmental problems [14]. Annual fly ash production is reported to have reached about 600 million tons [15]. Fly ash has shown potential application as an adsorbent for the removal of heavy metal cations from the aqueous environment [16]. This does not only favor the solution of heavy metal cation pollution, but it also reduces the problem of fly ash accumulation as industrial waste. Fly ash is viewed as a convenient alternative to traditional sorbents due to its low cost and ready availability in large quantities. Nevertheless, the adsorption capacity of fly ash is still low unless it is activated using chemical treatment. One common chemical treatment of fly ash is alkali activation. In this process, fly ash is mixed with an alkaline solution and cured at a low temperature to form an amorphous solid, a so-called fly ash-based geopolymer [17]. Geopolymer synthesis generally involves two processes: (1) the dissolution of the raw material composed of aluminosilicate minerals in alkali solution and (2) the condensation of these aluminosilicate oligomers into a covalently bonded network. The Si/Al ratio is very important; in fact, an increasing Si/Al ratio can cause a faster diffusion of all components, originating from the weakened interfacial interaction and decreased cross-linking degree of geopolymer [18]. They have an interconnected open porous structure and a net negative charge, which is a great advantage for adsorption processes. Fly ash-based geopolymers are recognized as environmentally friendly, efficient, and inexpensive adsorbent materials [5].
In order to improve retention and use this geopolymer on a large scale, researchers have recently incorporated nanoparticles into geopolymer. Generally, it is suggested that nanoparticles act as effective additives and voids-fillers to promote early hydration as well as accelerate the development of hydrated products, producing matrices with a higher density [19]. Herein, we have synthesized TiO2 nanoparticles and incorporated them within the fly ash-based geopolymer matrix in order to study their adsorption performance.
The purpose of this work is rather focused on the application of the composite to eliminate heavy metals. In addition, the incorporation of NPs has been optimized in order to use the smallest possible quantity while having good adsorptive performance.
Previous work that used geopolymer-nanoparticle composites did so mainly for photocatalysis applications, and to improve the mechanical properties and thermal resistance for use in civil engineering.
Titanium dioxide (TiO2) has also been investigated for evaluating its potential to remove metal ions and has shown promising results. There is a growing consensus that TiO2 possesses a high potential for environmental applications due to its physical and chemical stability, lower cost, nontoxicity, and resistance to corrosion [20,21,22,23,24].
The objective of this study was to synthesize and characterize geopolymer and geopolymer-NanoTiO2 composite and examine its adsorptive capacity for the removal of Cu2+ and Cd2+ from aqueous solution. The experimental results were analyzed by several kinetic and isotherm models. The kinetic model and isotherm models of the adsorption of Cu2+ and Cd2+ ions are intended in this study.

2. Materials and Methods

2.1. Materials

The fly ash that was used comes from the combustion of coal in the boilers of a cement company in Morocco, and the cement factory of M’zoudia (Marrakech, Morocco). Its major chemical components are listed (Table 1). In the current study, sodium hydroxide in pellet form (Sigma-Aldrich, Saint Louis, MO, USA, purity 98%) and silica gel (Sigma-Aldrich, purity 98%) were used for the synthesis of geopolymer materials.
Titanium chloride (Alfa-Aesar, purity 99%) and hydroxylammonium chloride (Sigma-Aldrich, purity 98%) were used as the principal constituents for the synthesis of TiO2 nanoparticles.
Copper Sulfate pentahydrate (Sigma-Aldrich, purity 98%, M.W. 249.69 g/mol) and cadmium nitrate tetrahydrate (HIMEdia Laboratories, Mumbai, India, purity 98%, M.W. 308.47 g/mol) were used for the study of the adsorption of metal ions Cu2+ and Cd2+, respectively.

2.2. Synthesis of TiO2 Nanoparticles

The synthesis of the TiO2 nanoparticles was conducted using equimolar titanium chloride (TiCl4) and hydroxylammonium chloride (NH2OH, HCl), which were added to the cold distilled water. The mixed solution was stirred for 1 h at room temperature and then for 3 h at 50 °C; a gel-type precursor was formed by evaporation of water in a beaker. Subsequently, the as-formed gel precursor was heated in a regular box furnace for 4 h at a temperature 500 °C. Finally, the sample was collected by naturally cooling the furnace to room temperature.

2.3. Synthesis of Geopolymer and Geopolymer-NanoTiO2 Composites

Geopolymer was formed by mixing fly ash with an alkaline solution (NaOH 10 mol/L, Na2SiO3 5 mol/L) in a mechanical mixer for 10 min, with a liquid/solid ratio of 0.5, and a Si/Al ratio of 2.56. The paste was cured at a temperature of 60 °C for 24 h. The geopolymer obtained was ground and washed several times until the pH of the filtrate was neutral.
Geopolymer-NanoTiO2 composite was prepared using the same synthetic geopolymer method with 5% nanoTiO2 added during preparation, the remaining process remained unchanged.

2.4. Characterization

The sample structure was characterized via X-ray diffraction spectroscopy operated with a diffractometer (Rigaku) and Cu-Ka radiation ( λ = 1.5418 Å), 40 kV, 2θ scan interval of 10–80° (step size was 5°/min). The data obtained were interpreted using the Highscore software; the phase composition was evaluated using database COD2021 (Crystallography open database). Fourier transform infrared spectroscopy (FTIR) (Versex Scientific, Los Angeles, CA, USA, Nicolet 380) in the range of 4000–400 cm−1 was used to identify the functional groups. The surface morphology was observed via scanning electron microscopy (SEM; VEGA3 TESCAN). These analyses were carried out at the Center for Analysis and Characterization (CAC) (Cadi Ayyad University, Marrakesh, Morocco).

2.5. Adsorption Experiments

Batch adsorption experiments were carried out on the samples to remove Cu2+ and Cd2+ from aqueous solutions. The adsorption conditions in all the experiments were: volume of the adsorbate solution (15 mL), mass of the adsorbent (0.3 g), pH (6.8), ambient temperature, and stirring speed (250 rpm). The effects, contact time, and initial concentration of Cu2+ and Cd2+ were studied in the kinetic and isothermal adsorption parts. After each completed adsorption test, the sample was separated by centrifuge at 9000 rpm for 20 min to separate the solid phase from the liquid phase. The UV-Vis absorbance spectroscopy (UV-3100PC Spectrophotometer) was utilized to determine the concentration of metal ions using the calibration method.
Adsorption capacity at time t, Qt (mg/g), was obtained as follows:
Q t = ( C 0 C t ) m × V
where C0 represents the initial concentration (mg/L) of the metal solution, Ct represents the solution concentration after adsorption (mg/L), m represents the adsorbent mass (g), and V represents the solution volume (L).

3. Results and Discussion

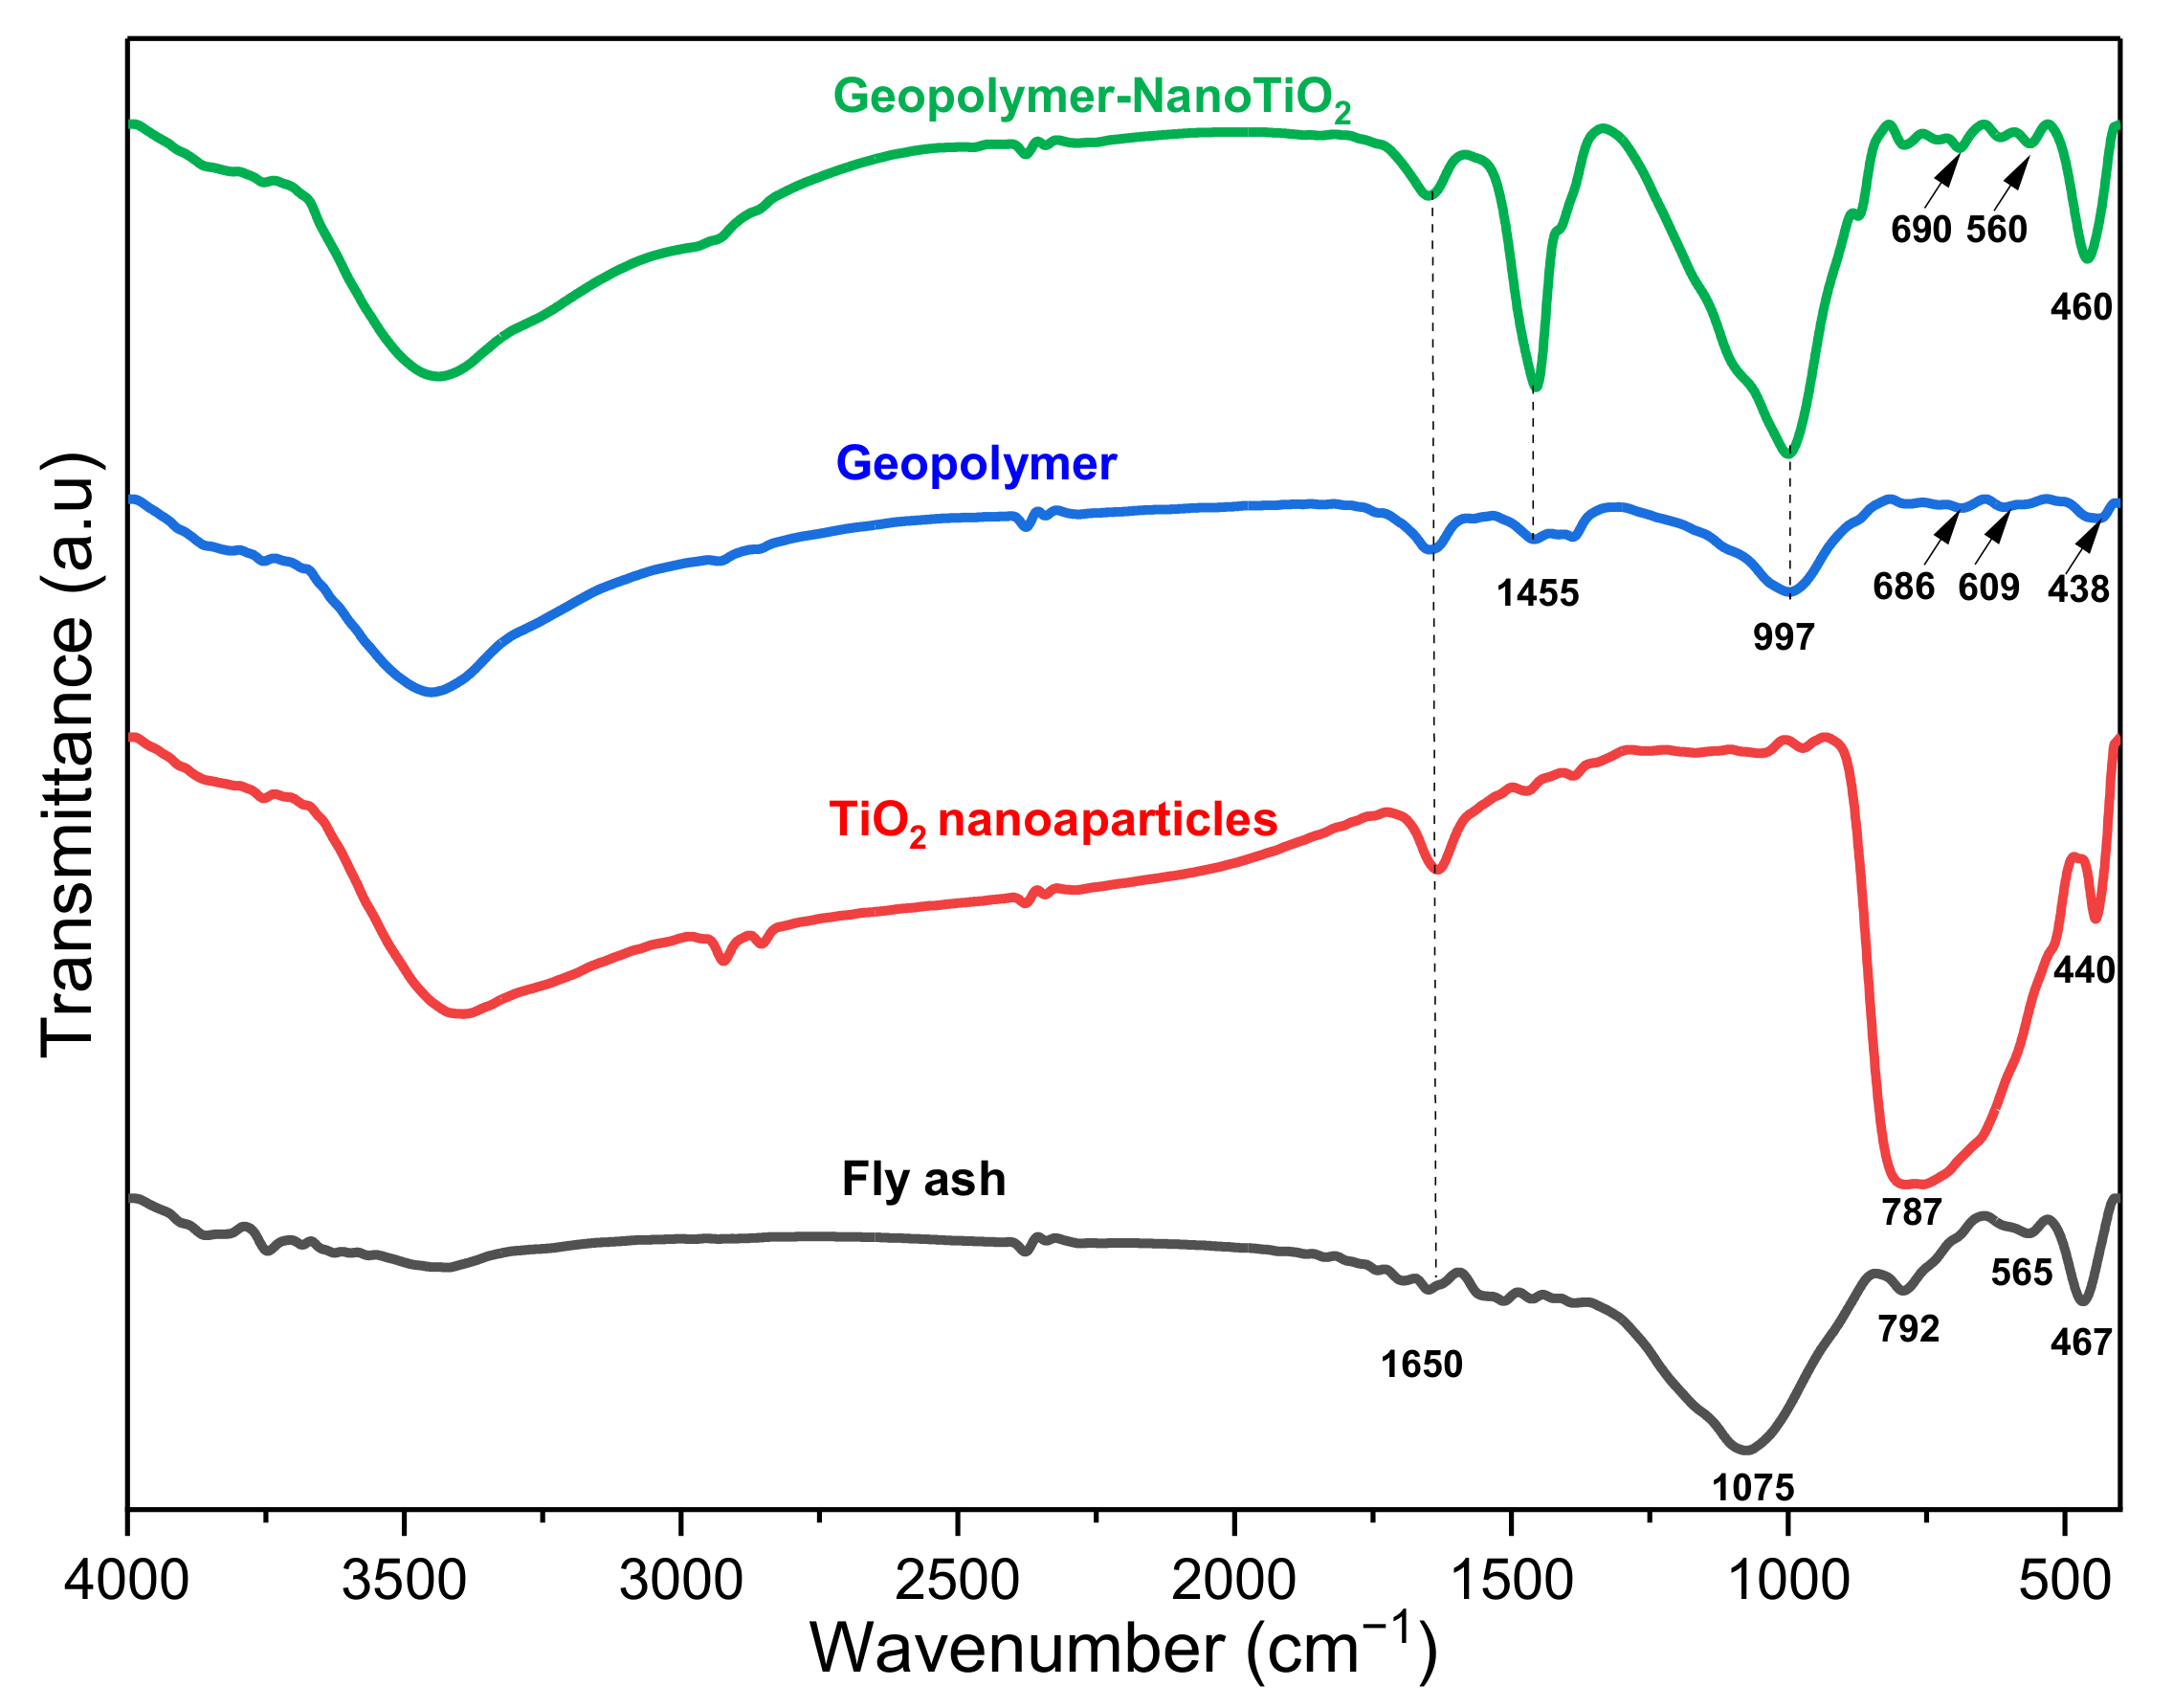
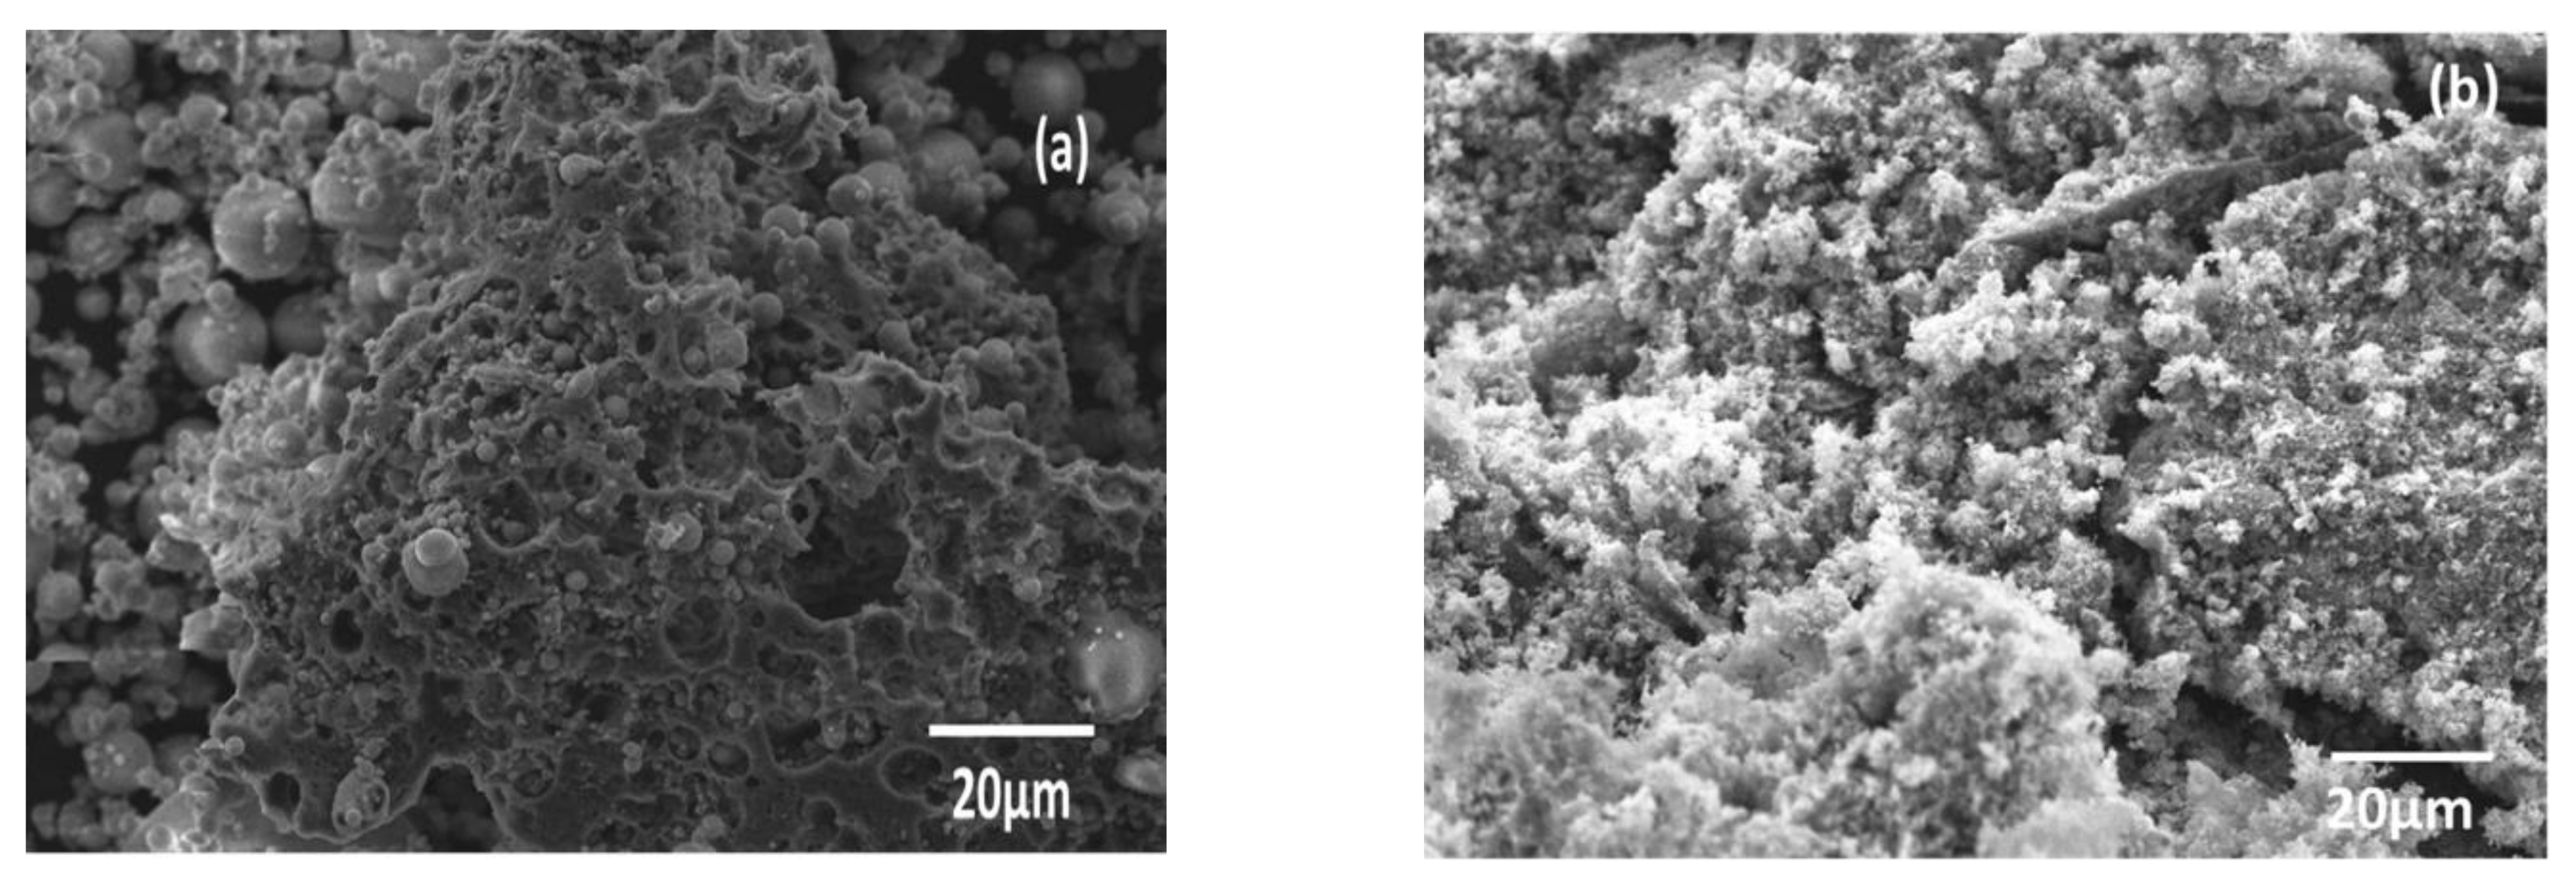
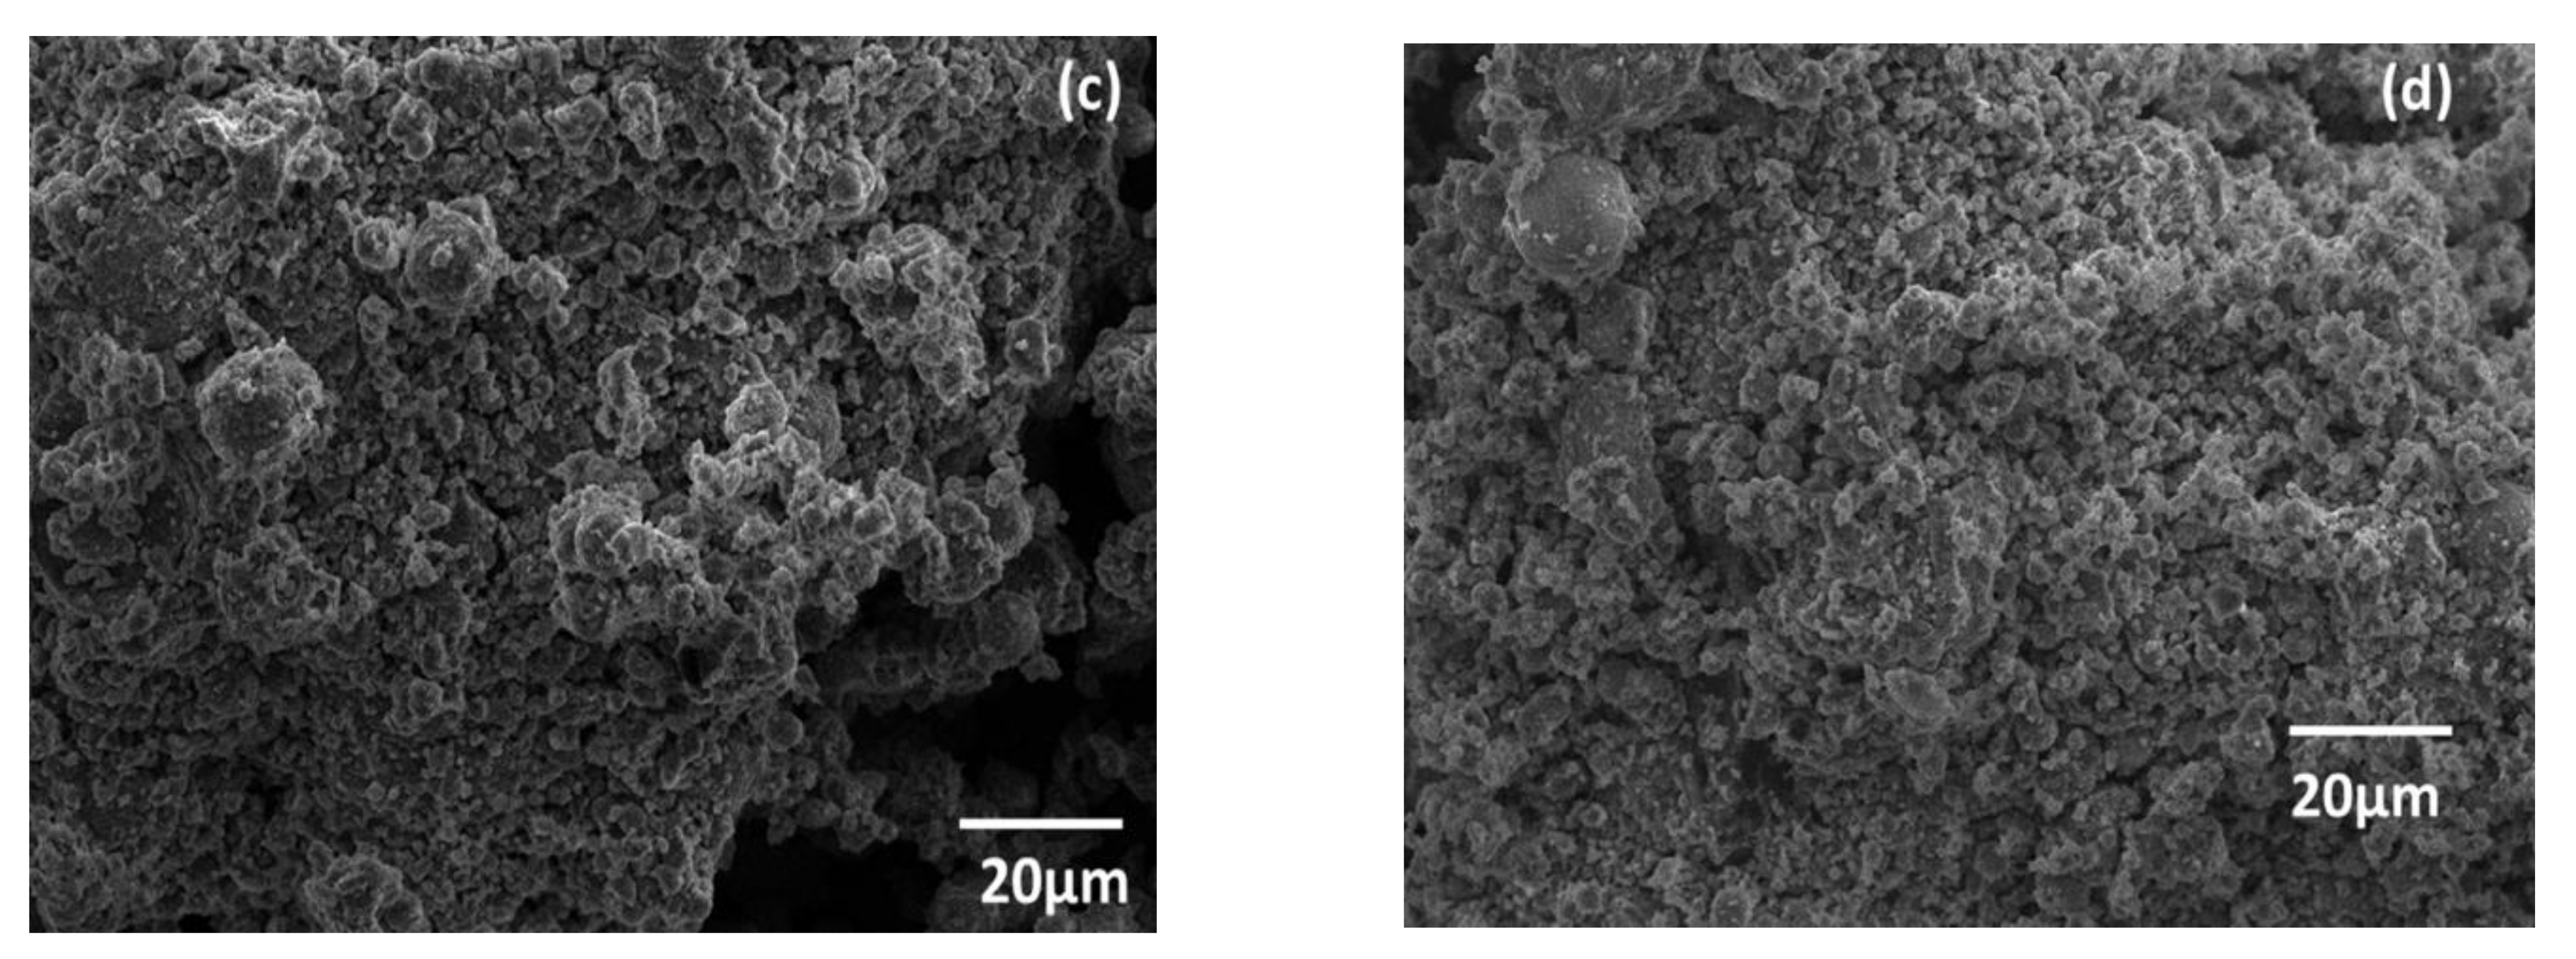
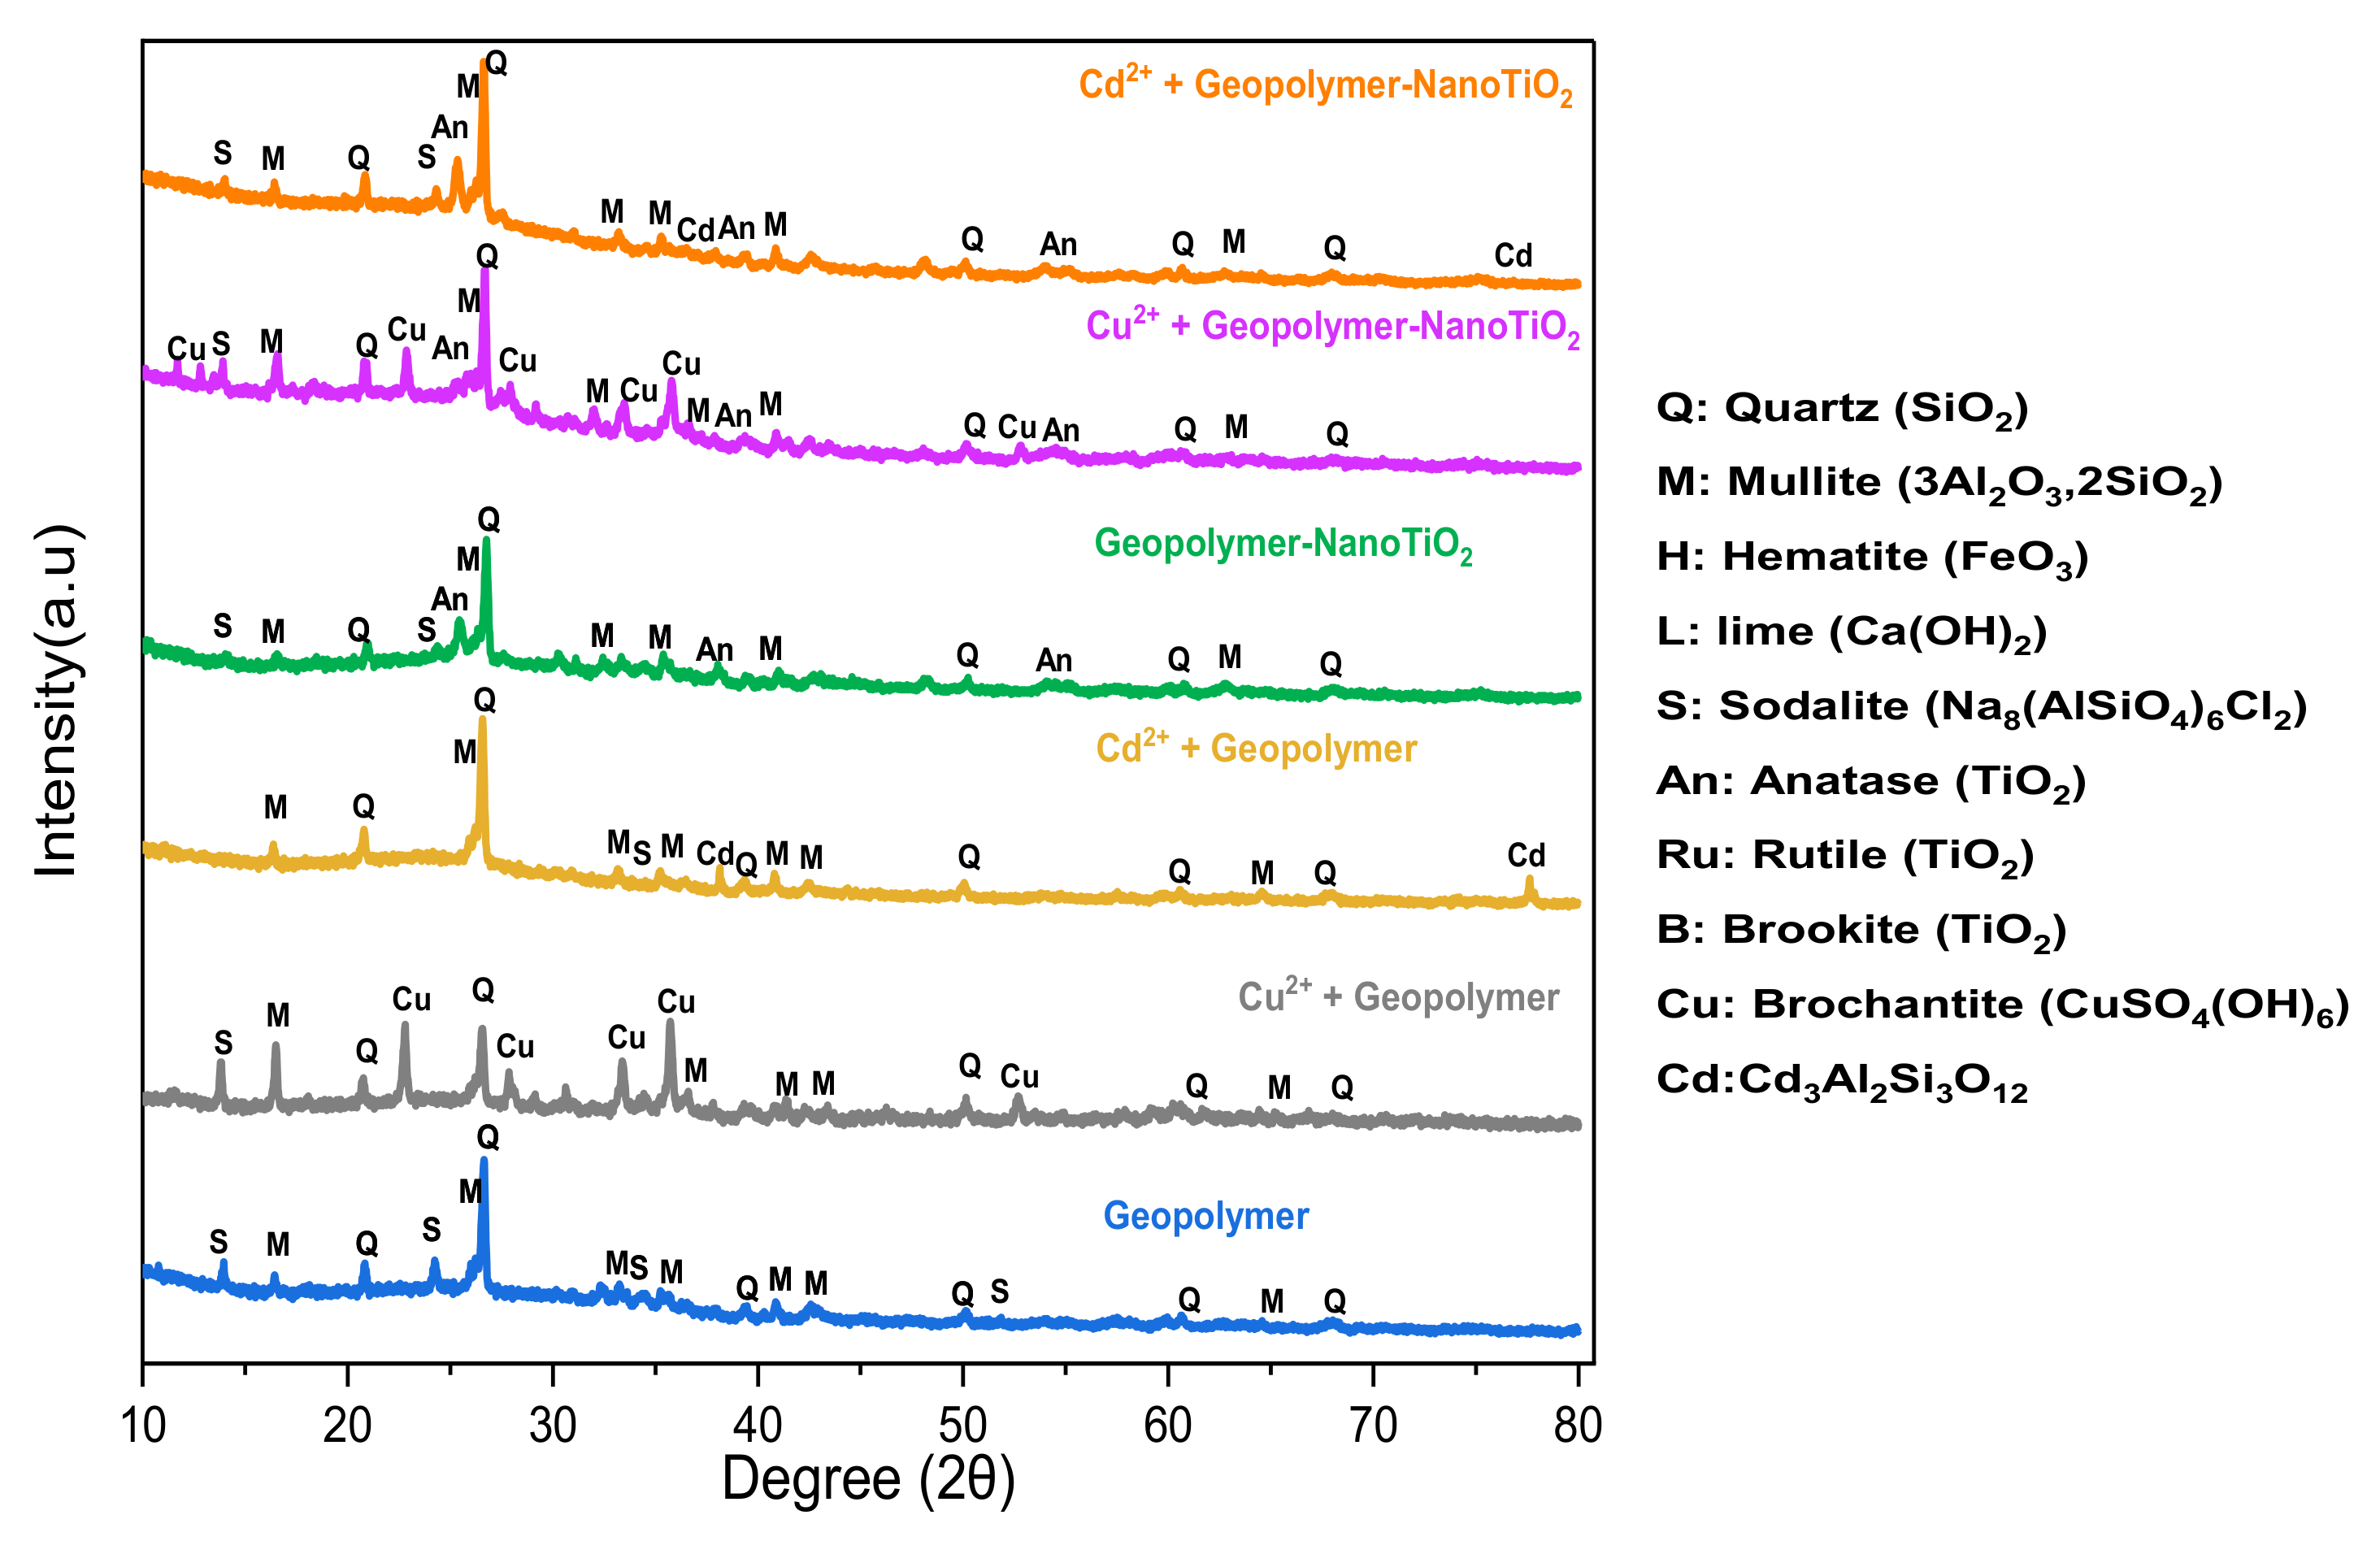
3.1. Sample Characterization

The silicon-aluminum composition of the fly ash is confirmed by XRD spectra. The major crystalline components of fly ash are: quartz (SiO2; ICDD 96-901-2601), mullite (3Al2O3.2SiO5; ICDD 96-900-1568), hematite (Fe2O3; ICDD 96-901-5965), and lime (Ca(OH)2; ICDD 96-100-0046) [25]. In addition to the crystalline phases, there is a large hump (Figure 1) which extends between (2 θ = 16–33°) [16,17]. This hump expresses the existence of amorphous phases. The presence of amorphous phases confirms that fly ash can be used as a raw material for the synthesis of geopolymers [26].
The structural transformations of fly ash occurring during geopolymerization and observed in XRD diagrams consist of the large hump recorded between (2 θ = 16–33°) in the fly ash, attributed to the amorphous phase of fly ash, which is slightly shifted to higher values (2 θ = 21–38°) in the XRD diagrams of geopolymer and geopolymer-NanoTiO2 composite, indicating the dissolution of the amorphous phase of fly ash and the formation of a new phase of amorphous aluminosilicate gel in geopolymer matrices. The XRD patterns of geopolymer and geopolymer-NanoTiO2 composite powders also exhibit the appearance of a new crystalline phase such as sodalite (ICDD 96-900-3328), which is considered a second product of geopolymerization [5].
The XRD profile of the TiO2 sample demonstrates the peak’s rutile (ICDD 96-900-7433), anatase (ICDD 96-900-9087), and brookite (ICDD 96-900-9088) phases [27]. The absence of any other peaks excludes the possibility of secondary impurity phase formation and suggests a high product quality [20]. Using Scherrer’s formula (Equation (2)), average particle sizes were found to be ~24 nm.
τ = K λ β cos θ
where τ is the size of crystallites, K is the shape factor with a typical value of 0.94, λ is the X-ray wavelength (1.5406 Å), β is the line broadening at half the maximum intensity (of a peak), and θ is diffraction angle.
XRD of geopolymer-NanoTiO2 shows the same phases as geopolymer, in addition to the brookite and anatase TiO2 phases, according to XRD of TiO2 nanoparticles following the incorporation of 5% of TiO2 nanoparticles [27].
The most characteristic difference observed between the FTIR spectrum of fly ash and the FTIR spectrum of geopolymer, as shown in Figure 2, is a band attributed to the asymmetric stretching vibration of Si–O–Si and Al–O–Si. This band that appeared at about 1075 cm−1 in the FTIR spectrum of fly ash is shifted to lower frequencies (∼997 cm−1) in the FTIR spectrum of geopolymer and geopolymer-NanoTiO2, indicating the formation of a new product (the amorphous aluminosilicate gel phase), which is related to the dissolution of the fly ash amorphous phase in the strong alkaline activating solutions [28]. Structural reorganization of fly ash is evidenced by the disappearance of the absorption band at around 792 cm−1, which is related to the AlO4 vibrations and the appearance of new bands at lower frequencies (∼690–560 cm−1) assigned to the symmetric stretching vibrations of Si–O–Si and Al–O–Si, indicating the formation of amorphous to semi-crystalline aluminosilicate materials [20,25]. The broad band at 3440 cm−1 and peak at 1650 cm−1 is due to the stretching vibrations of O–H bonds and H–O–H bending vibrations of interlayer adsorbed H2O molecules, respectively [29]. The band at about 1460 cm−1 that appeared in the geopolymer is characteristic of the asymmetric CO3 stretching mode related to the formation of sodium carbonate Na2CO3 due to the reaction between excess sodium and atmospheric carbon dioxide [21].
The FTIR spectrum of the synthesized TiO2 nanoparticles shows the presence of a broad peak that appeared in the range of 787 cm−1, which is related to the vibration of the Ti–O–Ti [20].
This peak was not observed in the spectrum of geopolymer-NanoTiO2 composite, showing changes in the titanium oxide environment [21]. Compared to geopolymer, the transmittance of the bands appeared at 1455 cm−1, 977 cm−1, and 460 cm−1 in geopolymer-NanoTiO2, which is enhanced due to the addition of TiO2 nanoparticles. The highest transmittance at 1420 cm−1 shows that more hydration products were carbonated than in the reference geopolymer; it could be deduced that more hydration gel-like products were produced when nano-TiO2 was added [30].
The morphology of the fly ash was studied using SEM microscopy (Figure 3a). The fly ash structure is complex, consisting of independent or agglomerated particles rounded and spherical but irregular in size with a number of interconnected pores [31]. The TiO2 nanoparticles are highly crystalline in nature. Figure 3b shows the SEM micrograph of TiO2 nanoparticles indicating that no clear spherical structures can be seen in the SEM image of the TiO2 nanoparticles. However, in this case, no diffraction rings are aligned. The nanoparticles obtained in this case are adhering to one another [32].
The microstructure of geopolymer (Figure 3c) and geopolymer-NanoTiO2 composite (Figure 3d) was denser and less porous compared to fly ash. The higher compactness of the geopolymer may be explained by the formation of a greater amount of aluminosilicate gel [33]. The well-distributed nanoparticles act as fillers in the empty space. Nanoparticles fill up the voids between geopolymer particles and then produce smaller pores in order to increase the adsorption capacity [34,35].
The elemental composition of the materials determined by XRD is confirmed by EDX.

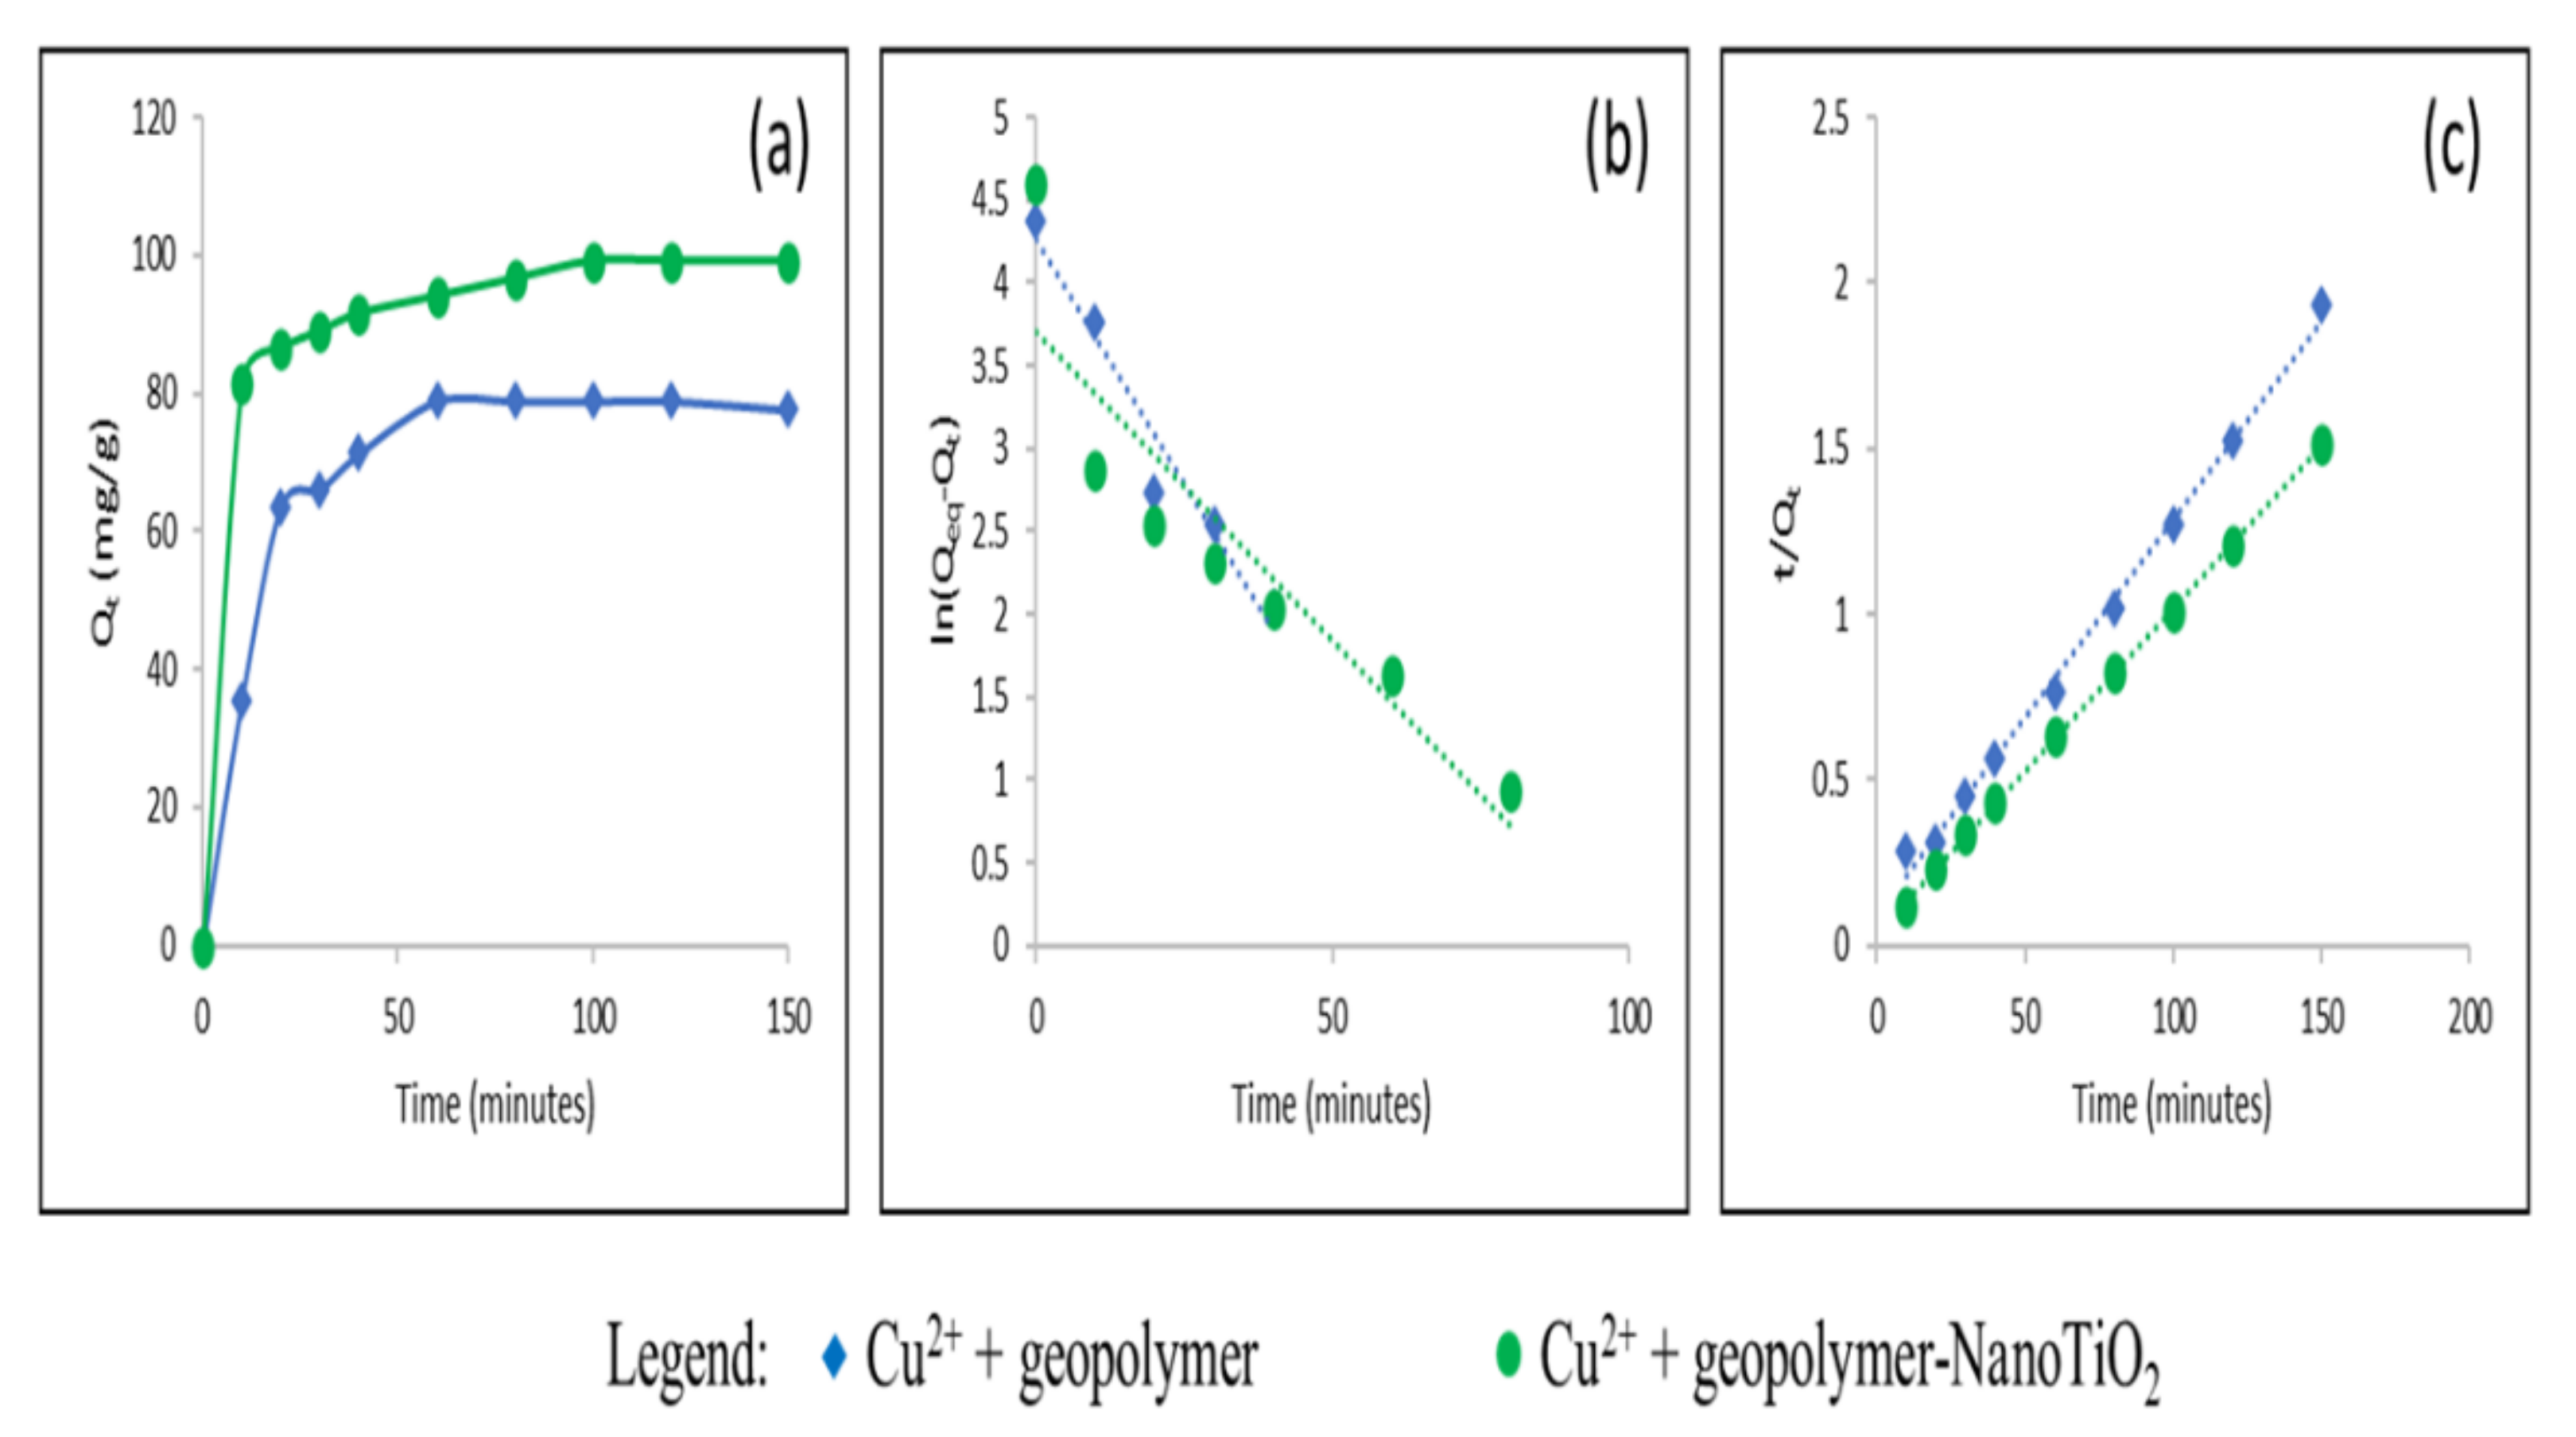
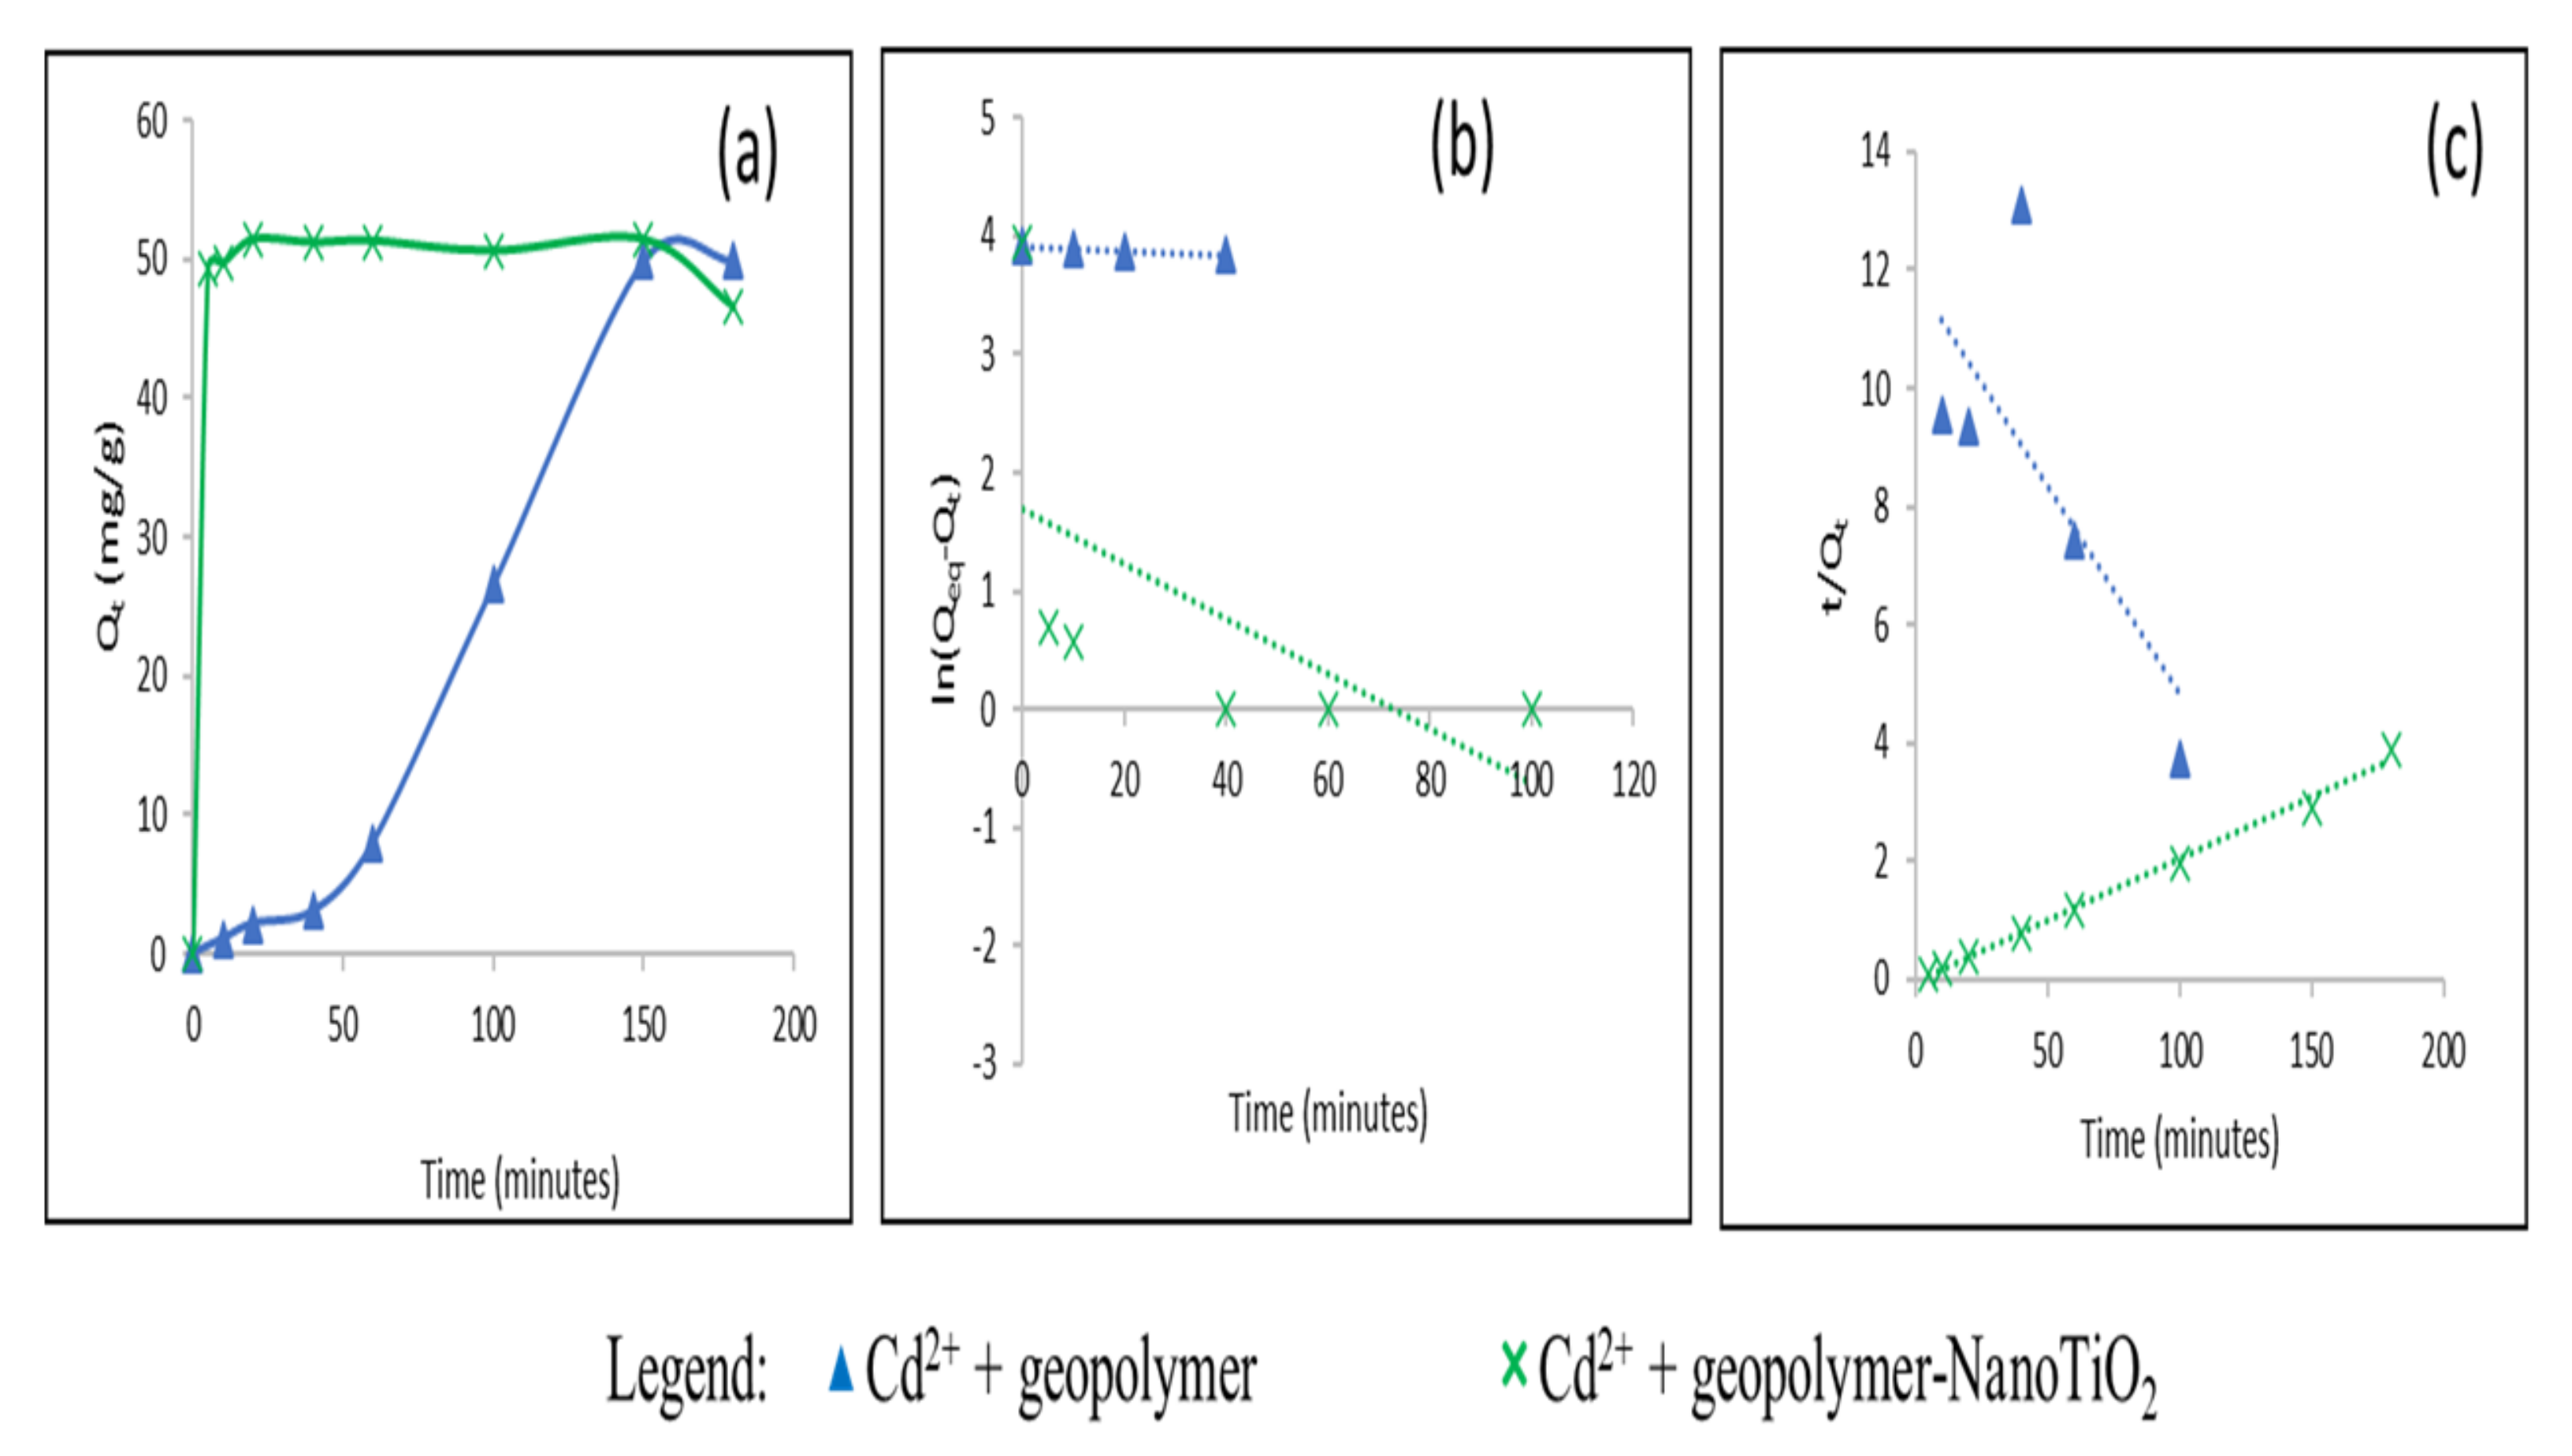
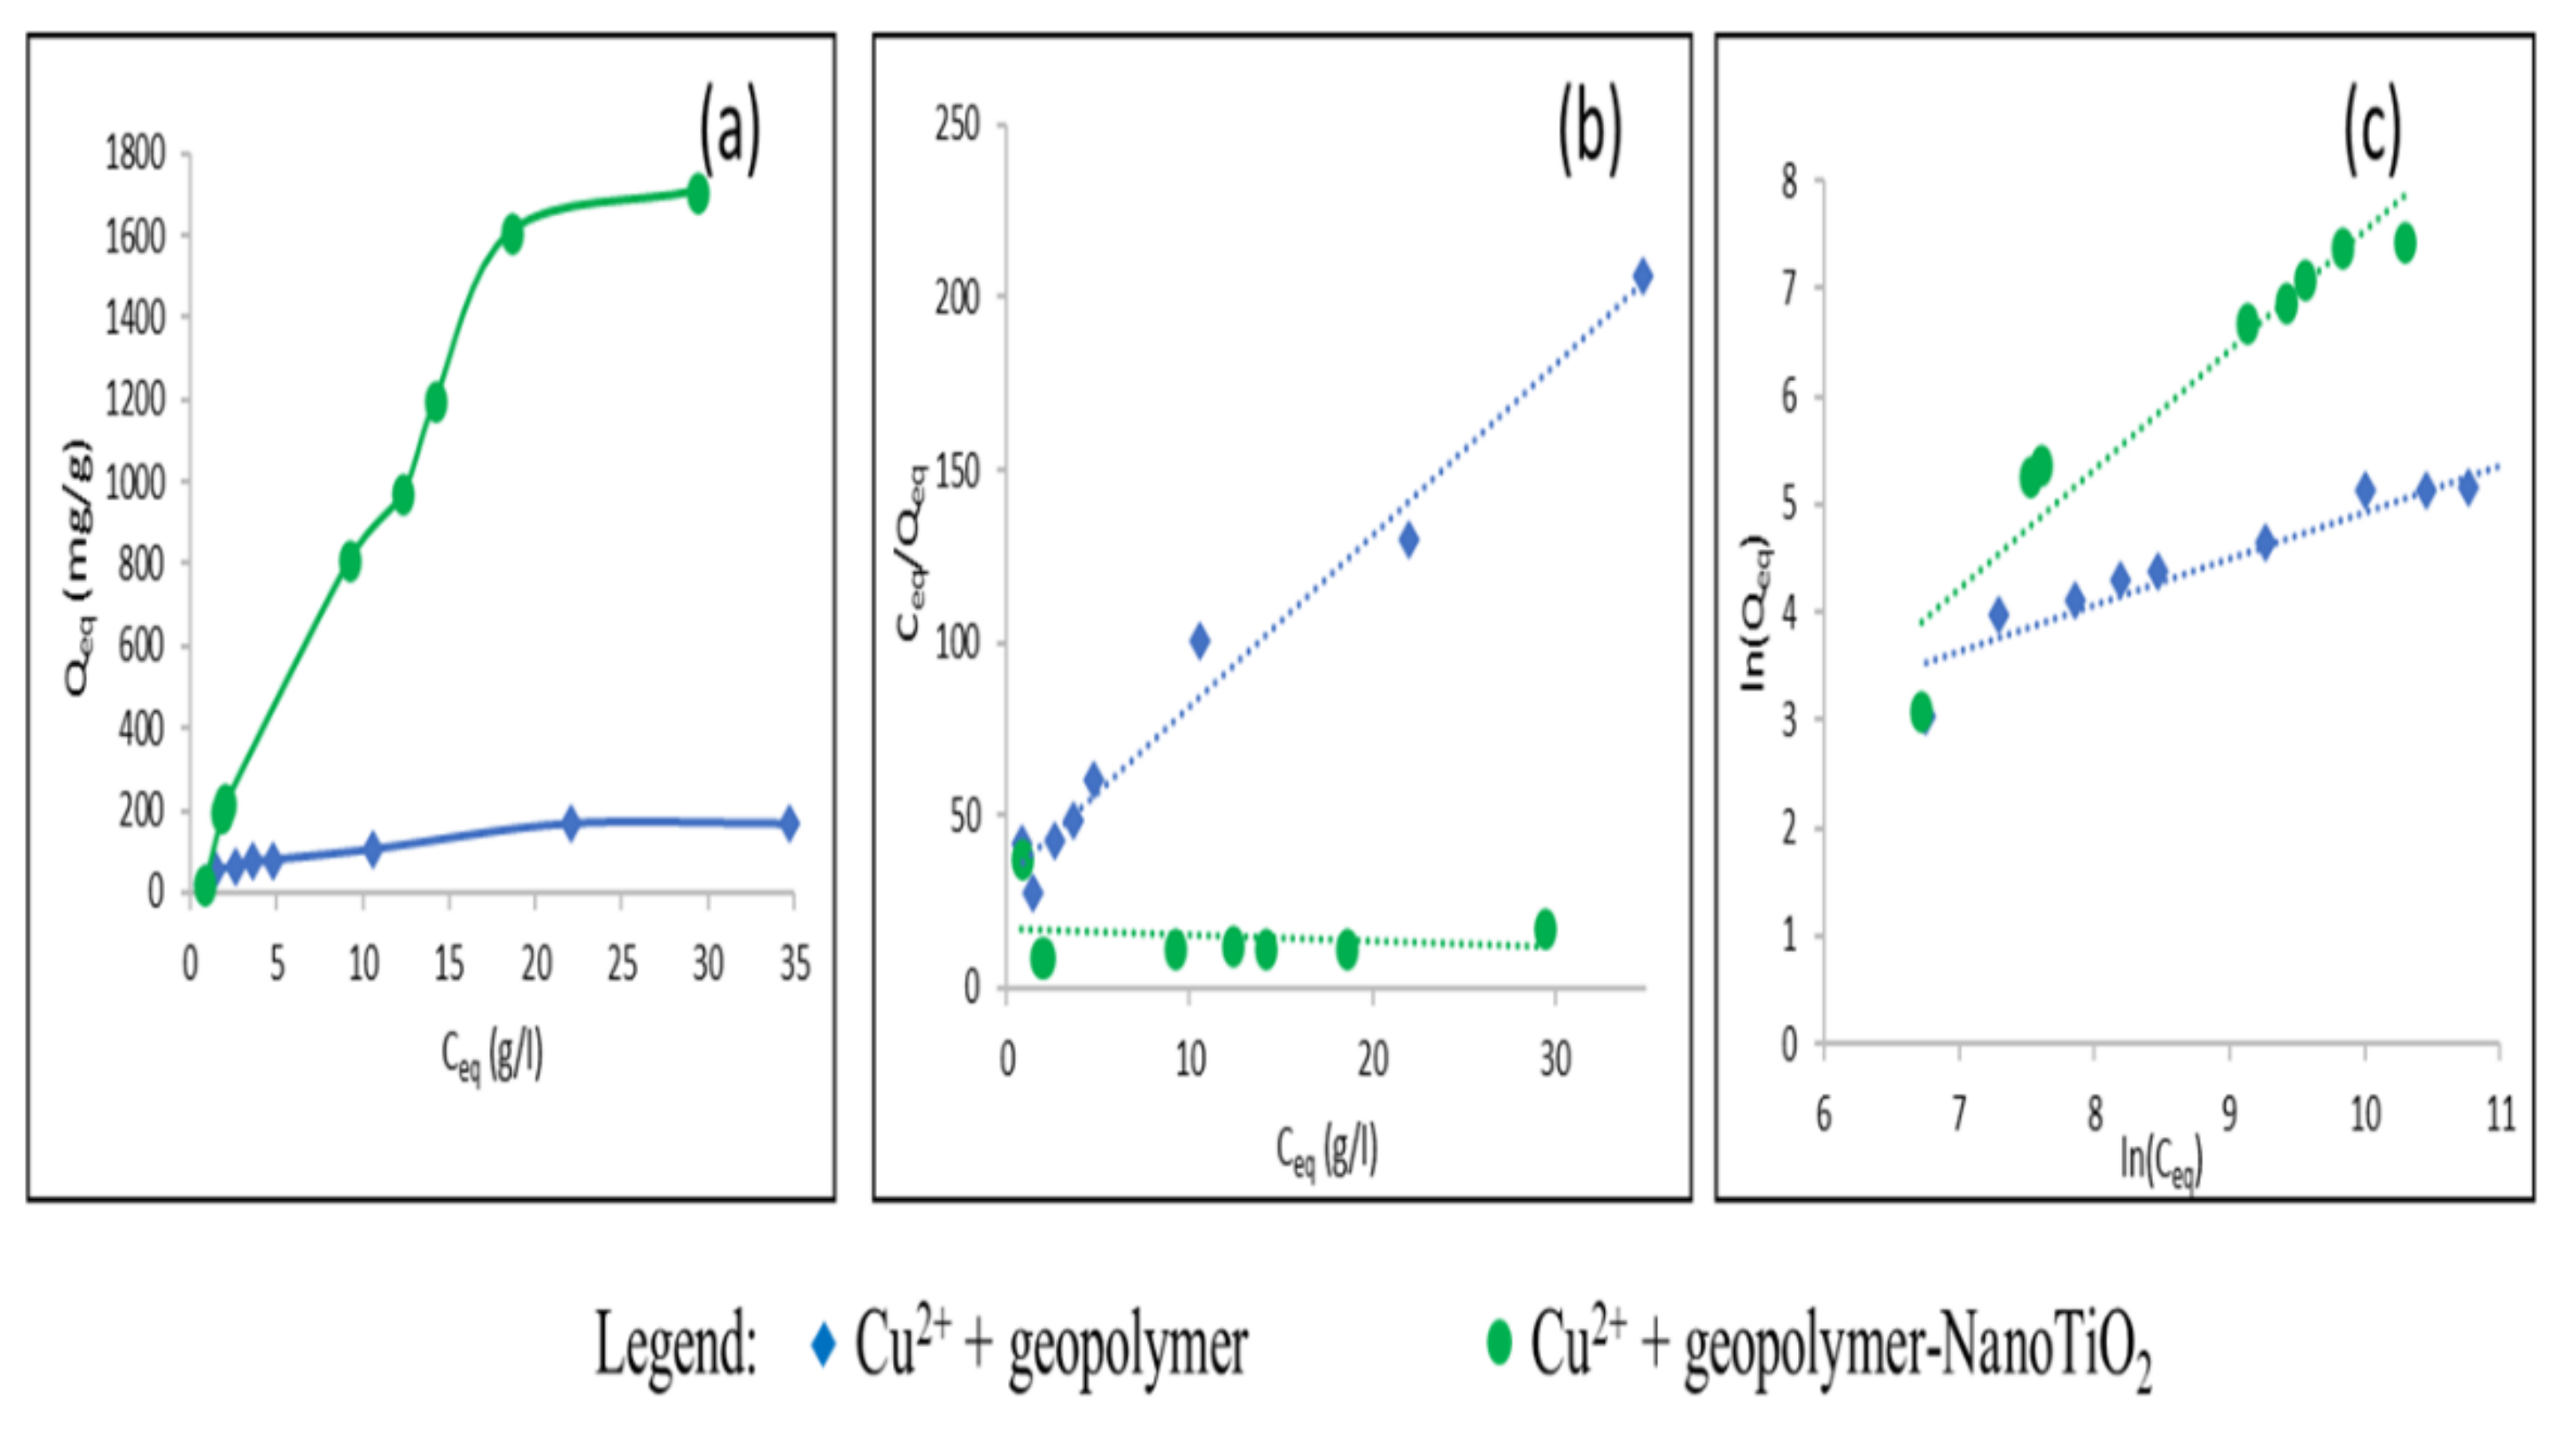
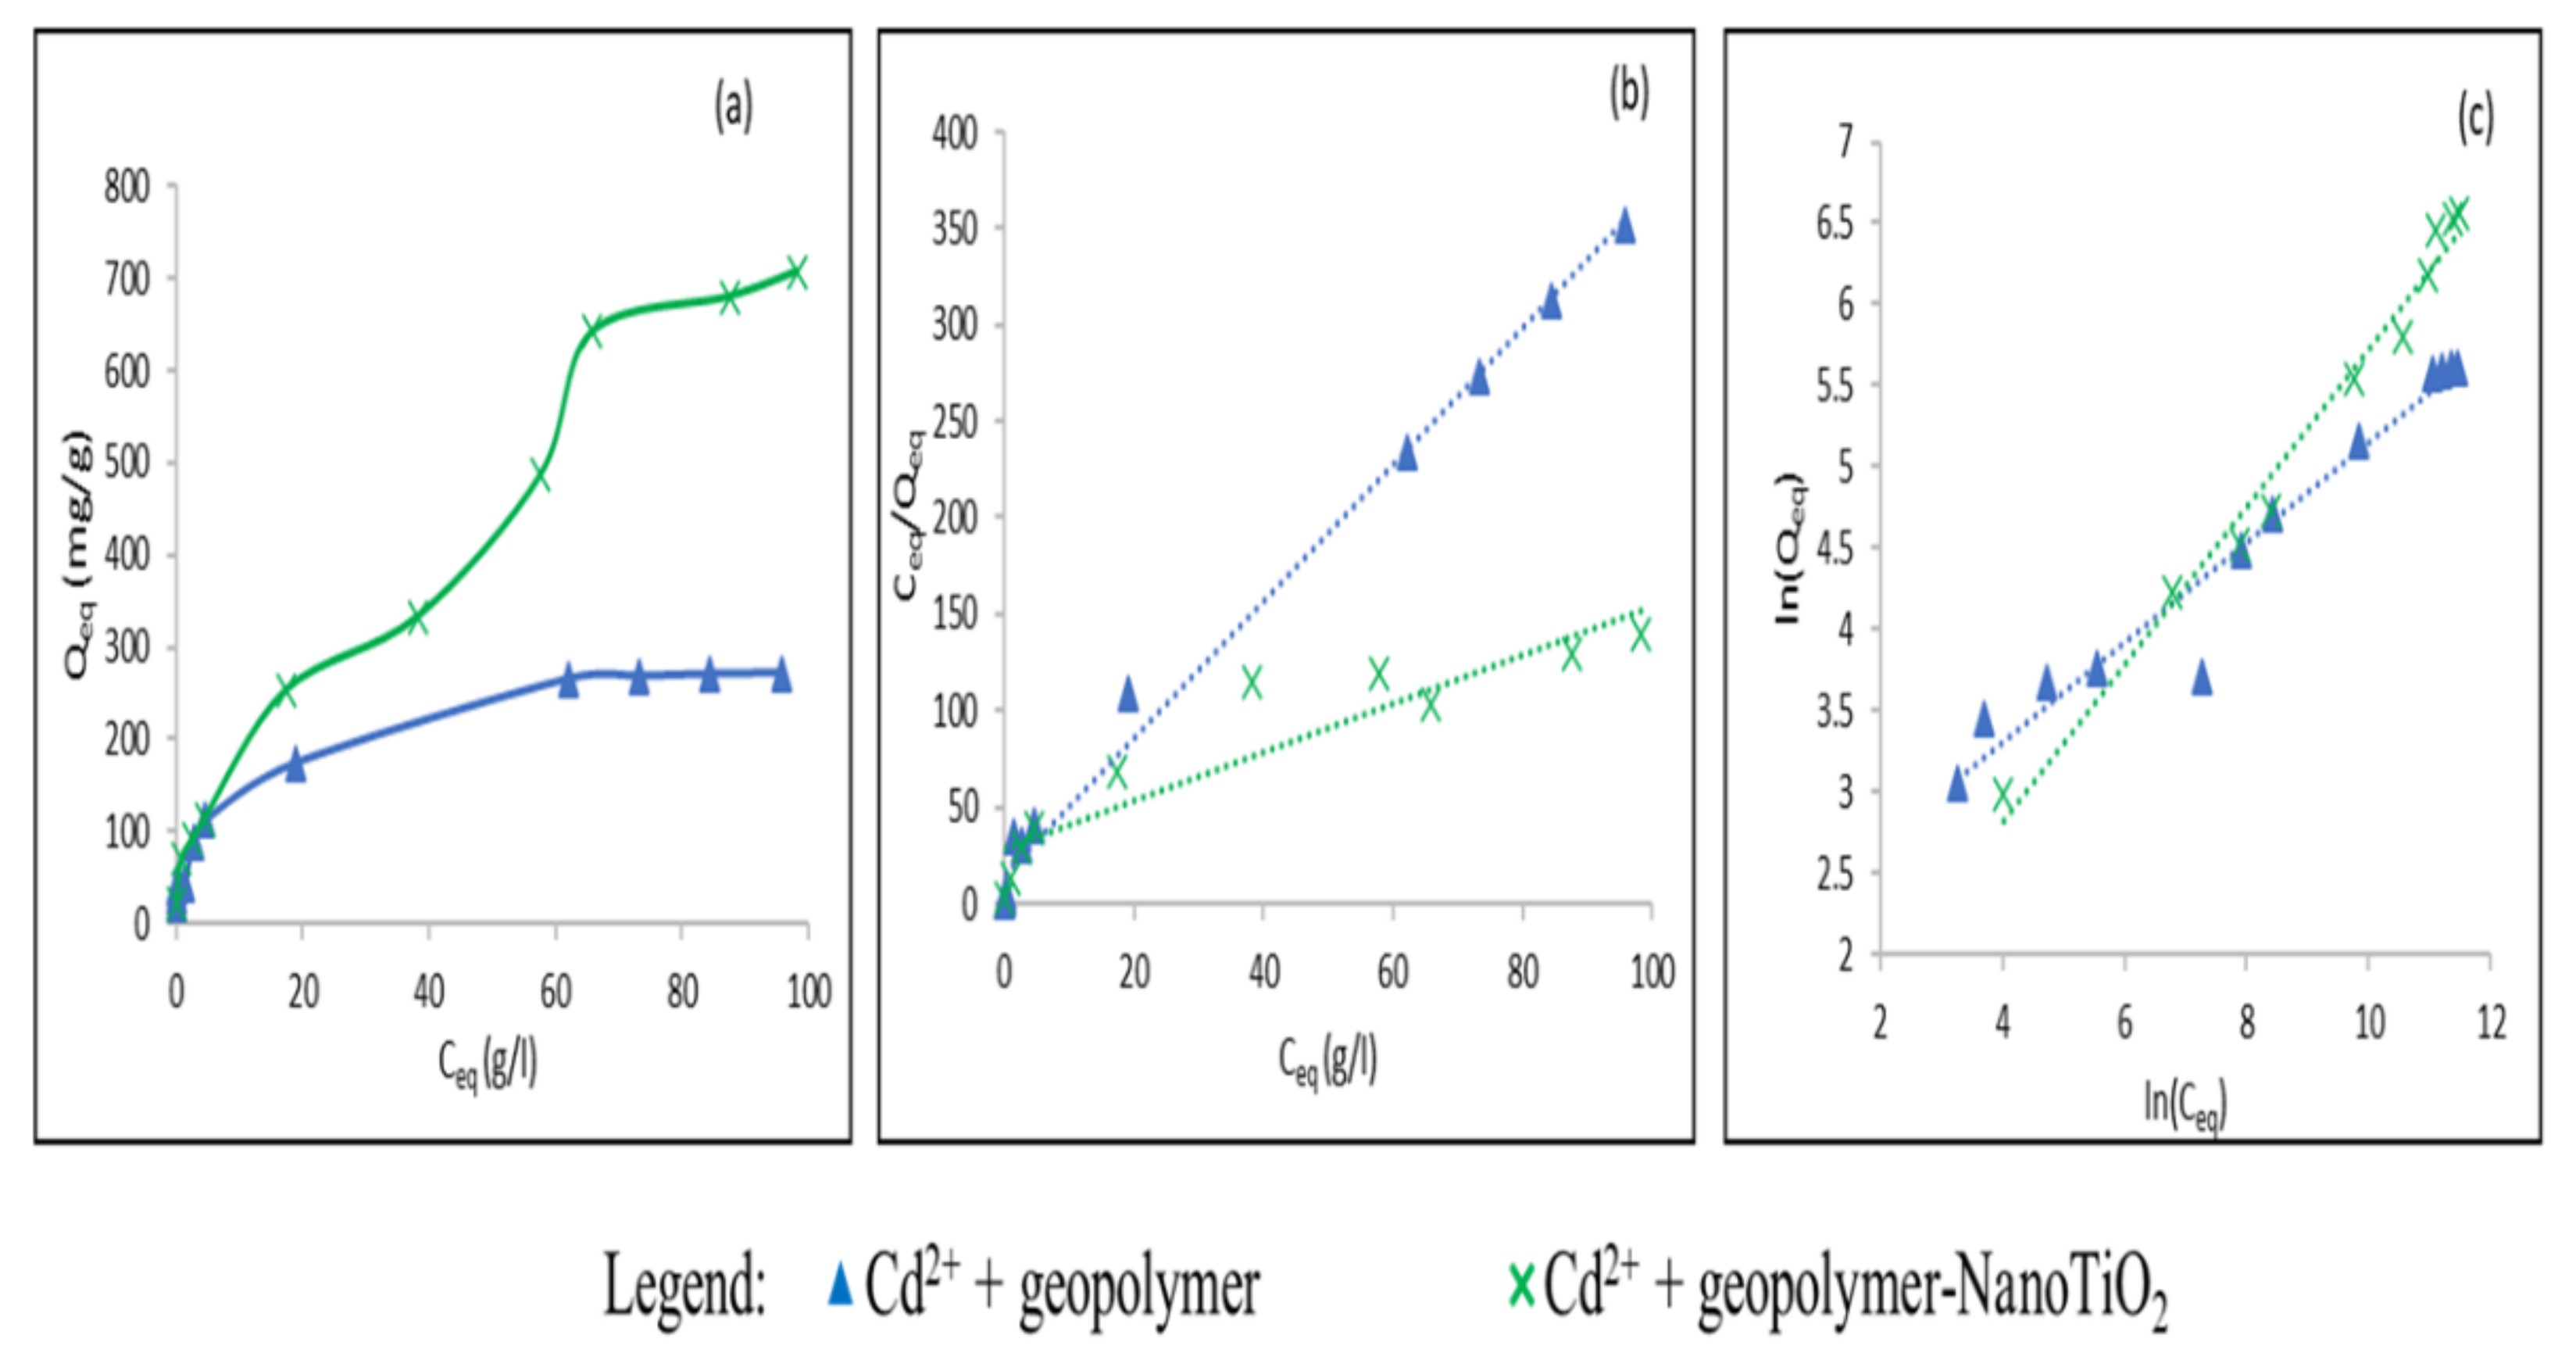
3.2. Study of the Adsorption of Cu2+ and Cd2+ from an Aqueous Solution

The effect of contact time on the amount of Cu2+ and Cd2+ metal ions’ adsorption on geopolymer and geopolymer-NanoTiO2 composite at 25 ◦C, pH = 6.8 is shown in Figure 4a and Figure 5a, respectively. As can be seen, the two adsorbents and adsorbates exhibit varying adsorption behavior. The results show that the rate of adsorption was rapid at the beginning and gradually decreased with increasing contact time until equilibrium was reached; for Cu2+ adsorption, geopolymer reached equilibrium very quickly, in about 60 min, and geopolymer-NanoTiO2 composite took 100 min to arrive at equilibrium. For Cd2+ adsorption, geopolymer took a long time, about 150 min, to reach equilibrium and geopolymer-NanoTiO2 composite reached equilibrium in 20 min. Therefore, these are the equilibrium times fixed for the study of the adsorption isotherms. In order to investigate the mechanism of the sorption process, two kinetic models have been used to test experimental data, pseudo-first-order given by Langergren and Svenska [36] (Equation (3)), and pseudo-second-order, which is used to describe the chemisorption mechanism [37] (Equation (4)). Both were employed to interpret the kinetic results.
l n ( Q e q Q t ) = l n Q e q K 1 × t
t Q t = 1 K 2 × Q e q 2 + t Q e q
where Qt is the amount adsorbed (mg/g) at time t (min), Qeq is the amount adsorbed at equilibrium (mg/g), K1 is the equilibrium rate constant for pseudo-first-order kinetics (min−1), and K2 is the equilibrium rate constant for pseudo-second-order kinetics (g.mg−1. min−1).
The kinetic models’ linear fitting data due to the removal of Cu2+ and Cd2+ ions are shown in Figure 4b,c and Figure 5b,c.
The parameters of the applied kinetic models (Qeq, K1, K2, and correlation coefficient R2) are displayed in Table 2. The results demonstrate that the determined Qeq values obtained by the pseudo-second-order model for the adsorption of Cu2+ and Cd2+ ions are not consistent with the experimental Qeq. Additionally, the R2 value obtained was relatively low (R2 for pseudo-first-order kinetic). This suggests that the pseudo-first-order kinetic model is not appropriate to represent the adsorption kinetics data of Cu2+ ions onto geopolymer and geopolymer-NanoTiO2 composite and also Cd2+ ions onto geopolymer-NanoTiO2 composite. Previous research has also reported similar results [5]. Except for the adsorption of Cd2+ ions onto geopolymer, the Qeq value calculated by pseudo-first-order shows better agreement with the Qeq experimental value and the value of correlation coefficient calculated by pseudo-first-order is higher than that calculated by pseudo-second-order, suggesting that the sorption of Cd2+ ions on geopolymer is a first-order reaction.
The adsorption isotherm of Cu2+ and Cd2+ ions onto geopolymer (Figure 6a) and geopolymer-NanoTiO2 composite (Figure 7a) were carried out at 25 °C, pH = 6.8 in a volume of 15 mL, adsorbents amount of 0.3 g and the optimized contact duration. The results showed that Cu2+ and Cd2+ ions’ adsorption capacity increased with increasing concentration until equilibrium, following maximum adsorption, the sites of the adsorbents were filled totally with metallic ions molecules (Cu2+ and Cd2+). This result suggests that increasing the concentration of (Cu2+ and Cd2+) provides a higher likelihood of contact between the active sites and the metal ions until the saturation point of the adsorbent is reached [38]. By comparing the adsorption capacities of Cu2+ and Cd2+ onto adsorbents in Table 3, the advantage of the TiO2 nanoparticles is clear. Geopolymer-NanoTiO2 presents an adsorption capacity of Cu2+ (Qmax = 1708.2 mg/g) 9~10 times larger than geopolymer (Qmax = 172.83 mg/g) and an adsorption capacity of Cd2+(Qmax = 706.9 mg/g) 2~3 times larger than geopolymer (Qmax = 271.66 mg/g). This outcome may be ascribed to the microstructure and geopolymer-NanoTiO2 composite morphology that are exclusive to this work and provide a large number of adsorption sites for the heavy metals.
The adsorption processes were studied using Langmuir and Freundlich isothermal models, using Equation (5) and Equation (7), respectively. The Langmuir model is based on a monolayer, uniform distribution of adsorption sites that are independent of each other on the surface of the adsorbents [39]. The Freundlich model could be used for both homogeneous and heterogeneous adsorption processes [33].
Langmuir model:
C e q Q e q = 1 Q m a x × K L + C e q Q e q
Qeq (mg/g) is the amount adsorbed at equilibrium, Qmax (mg/g) is the adsorption amount at maximum saturation (calculated value), Ceq (mg/L) is the concentration of Cu2+ and Cd2+ at equilibrium under different initial concentrations, and KL (L/mg) is the Langmuir constant.
Separation factor:
R L = 1 1 + K L × C 0
RL is the separation factor if 0 < RL < 1, it is counted as favorable adsorption, and C0 (mg/L) is the initial concentration of Cu2+ and Cd2+.
Freundlich model:
l n Q e q = l n K F + 1 n l n C e q
Qeq (mg/g) is the amount of adsorbents adsorbed at equilibrium, Ceq (mg/L) is the concentration of Cu2+ and Cd2+ at equilibrium under different initial concentrations, KF (mg/g)/(mg/L) is the equilibrium adsorption constant of the Freundlich model, and n is the heterogeneous constant of the Freundlich model, which shows the favorable or unfavorable nature of the adsorption (if n > 1, it is counted as favorable adsorption).
The Langmuir linear fitting data due to the removal of Cu2+ and Cd2+ ions are shown in Figure 6b and Figure 7b, respectively. The Freundlich linear fitting data due to the removal of Cu2+ and Cd2+ ions are shown in Figure 6c and Figure 7c, respectively. The relevant isotherm parameters are summarized in Table 3. The results of the adsorption of Cu2+ and Cd2+ by geopolymer show that the Langmuir model displayed better correlation coefficients (R2 = 0.99) than those of Freundlich. Hence, the Langmuir model was more consistent with the removal of Cu2+ and Cd2+ ions from aqueous by geopolymer. The calculated value of RL from fitting results in the Langmuir isotherm is between 0 and 1, indicating that the adsorption process is favorable. A similar trend was observed in the adsorption of Cu2+ on geopolymer [40] and Cd2+ on geopolymer [41].
The results of the adsorption of Cu2+ and Cd2+ by geopolymer-NanoTiO2 composite show the correlation coefficient (R2) values of the Freundlich isotherm model are higher than those of the Langmuir isotherm model, which suggests that the adsorption data are better described by the Freundlich isotherm model. This indicates that the adsorption of Cu2+ and Cd2+ on the surface of geopolymer-NanoTiO2 composite is heterogeneous and there is interaction between the adsorbed molecules. There are different active sites on the surface of geopolymer-NanoTiO2 composite, and the binding capacities with Cu2+ and Cd2+ at these sites are different.

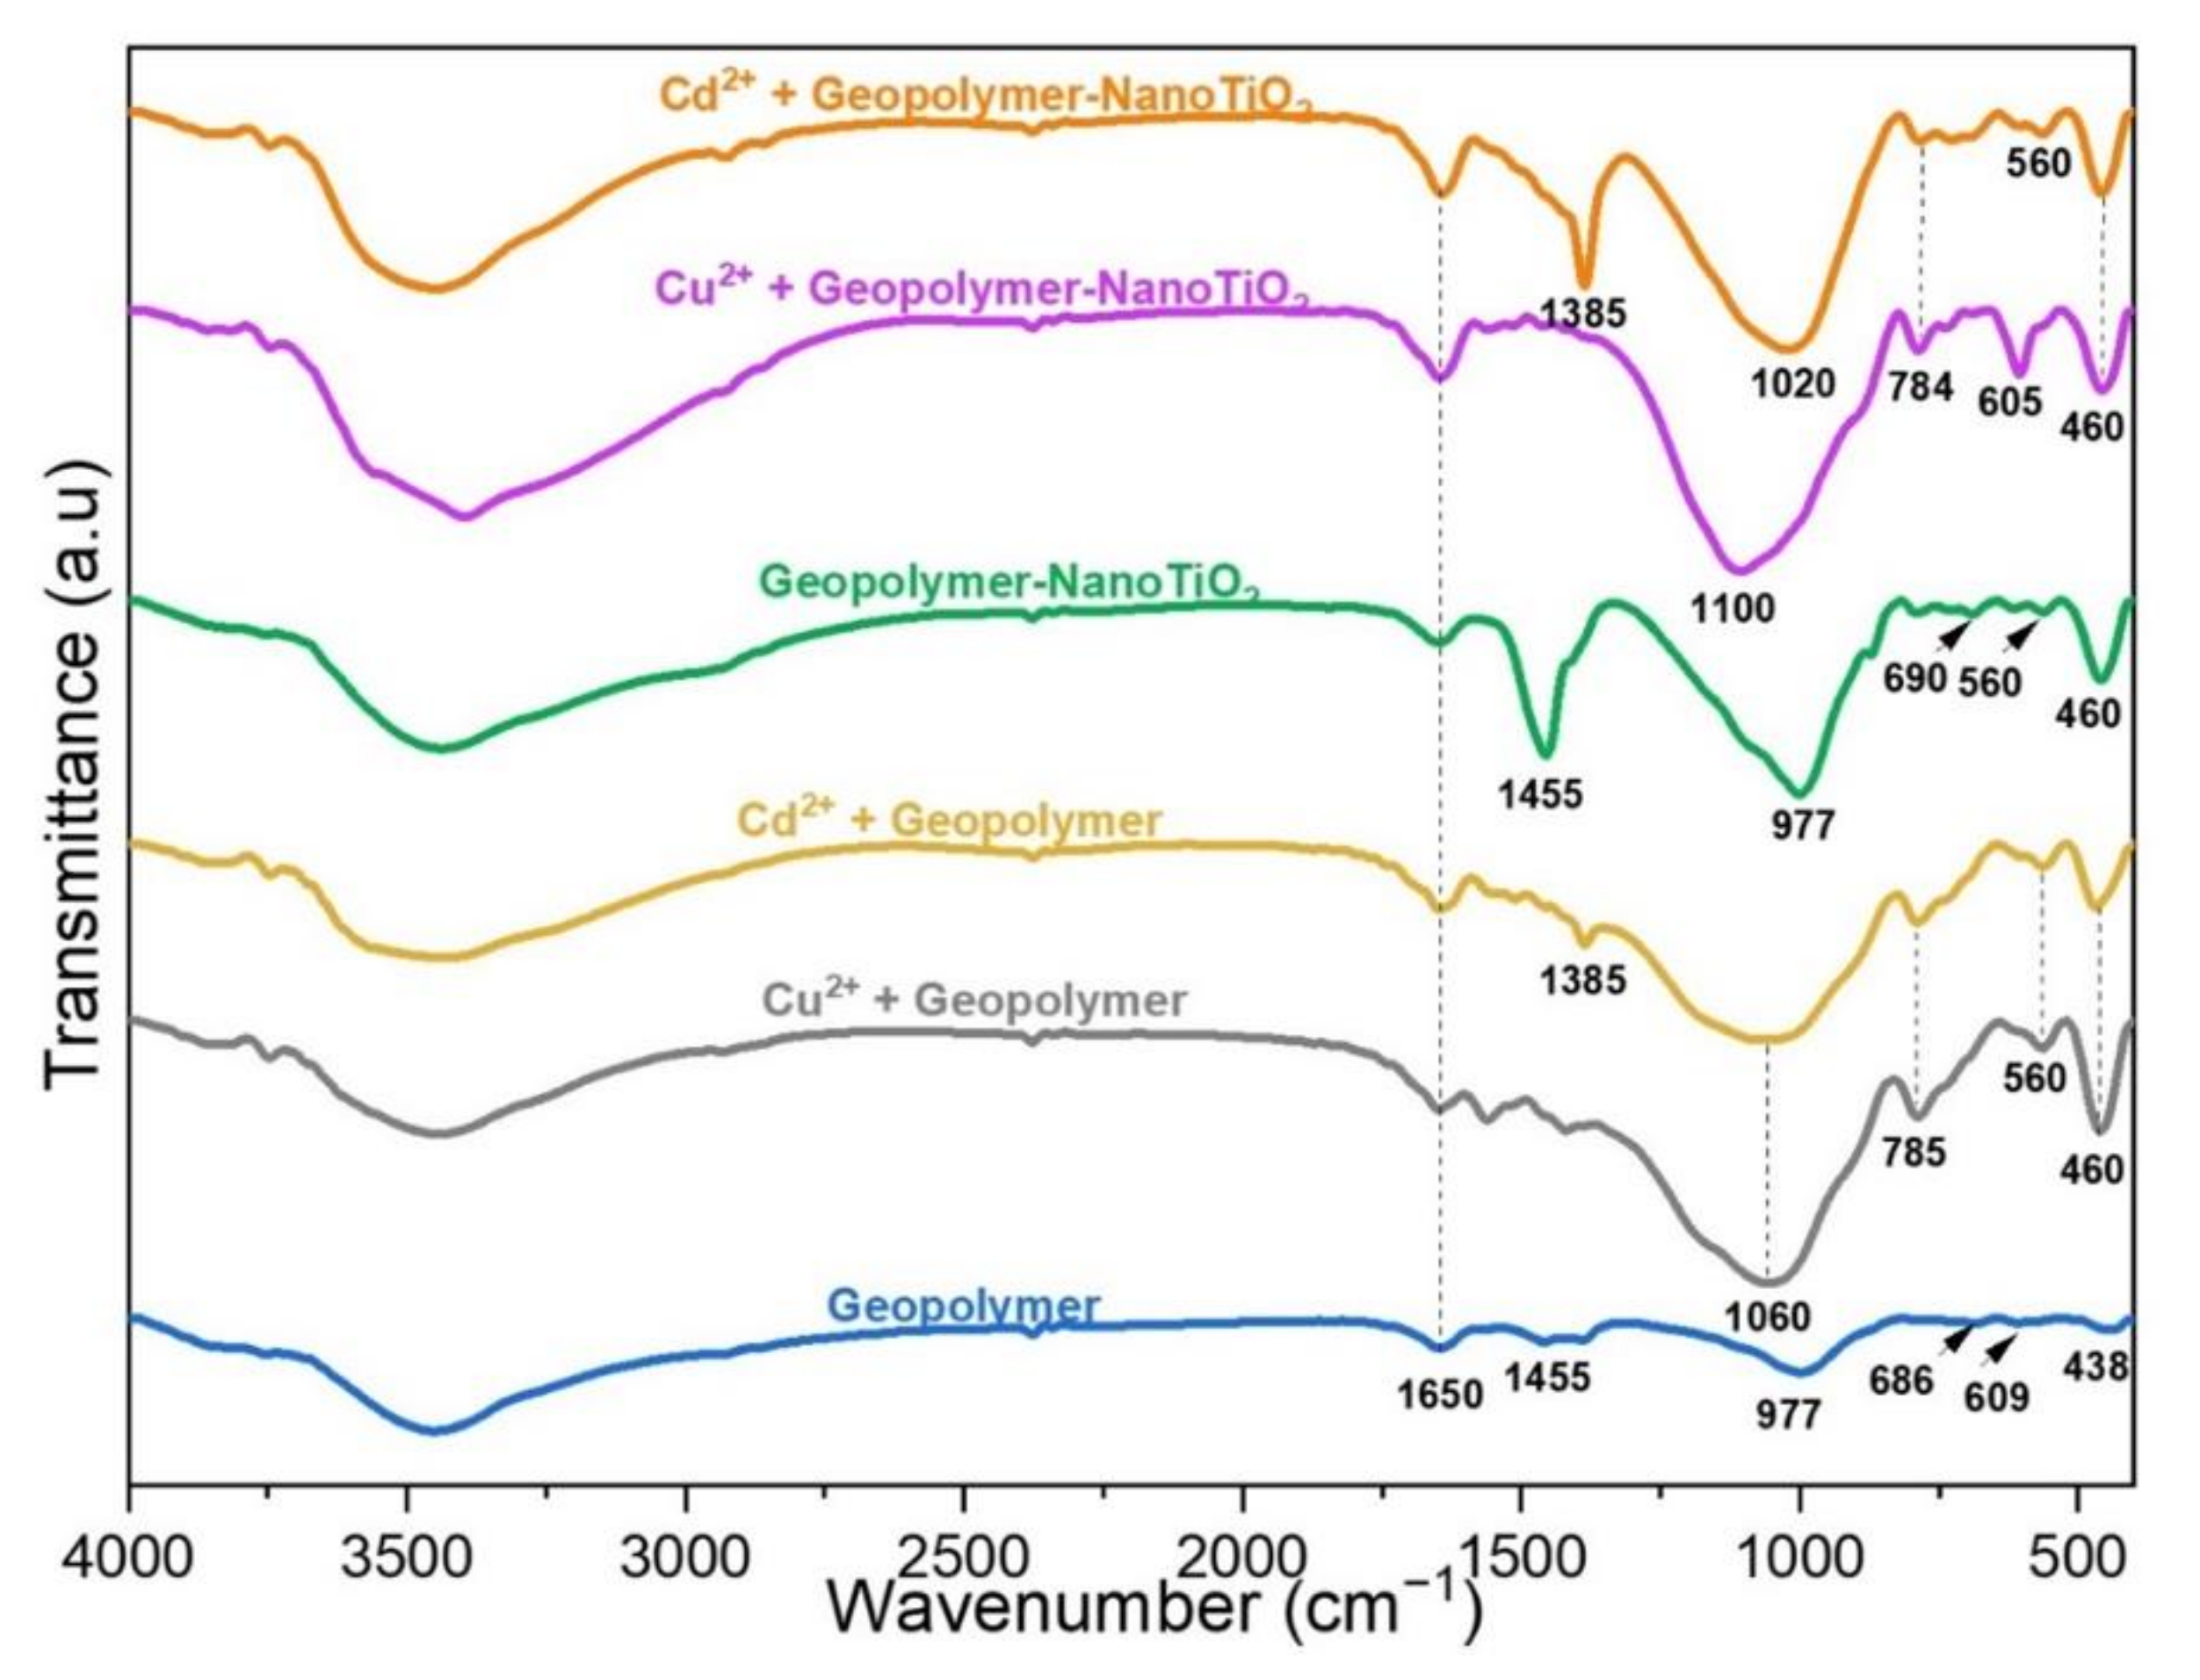
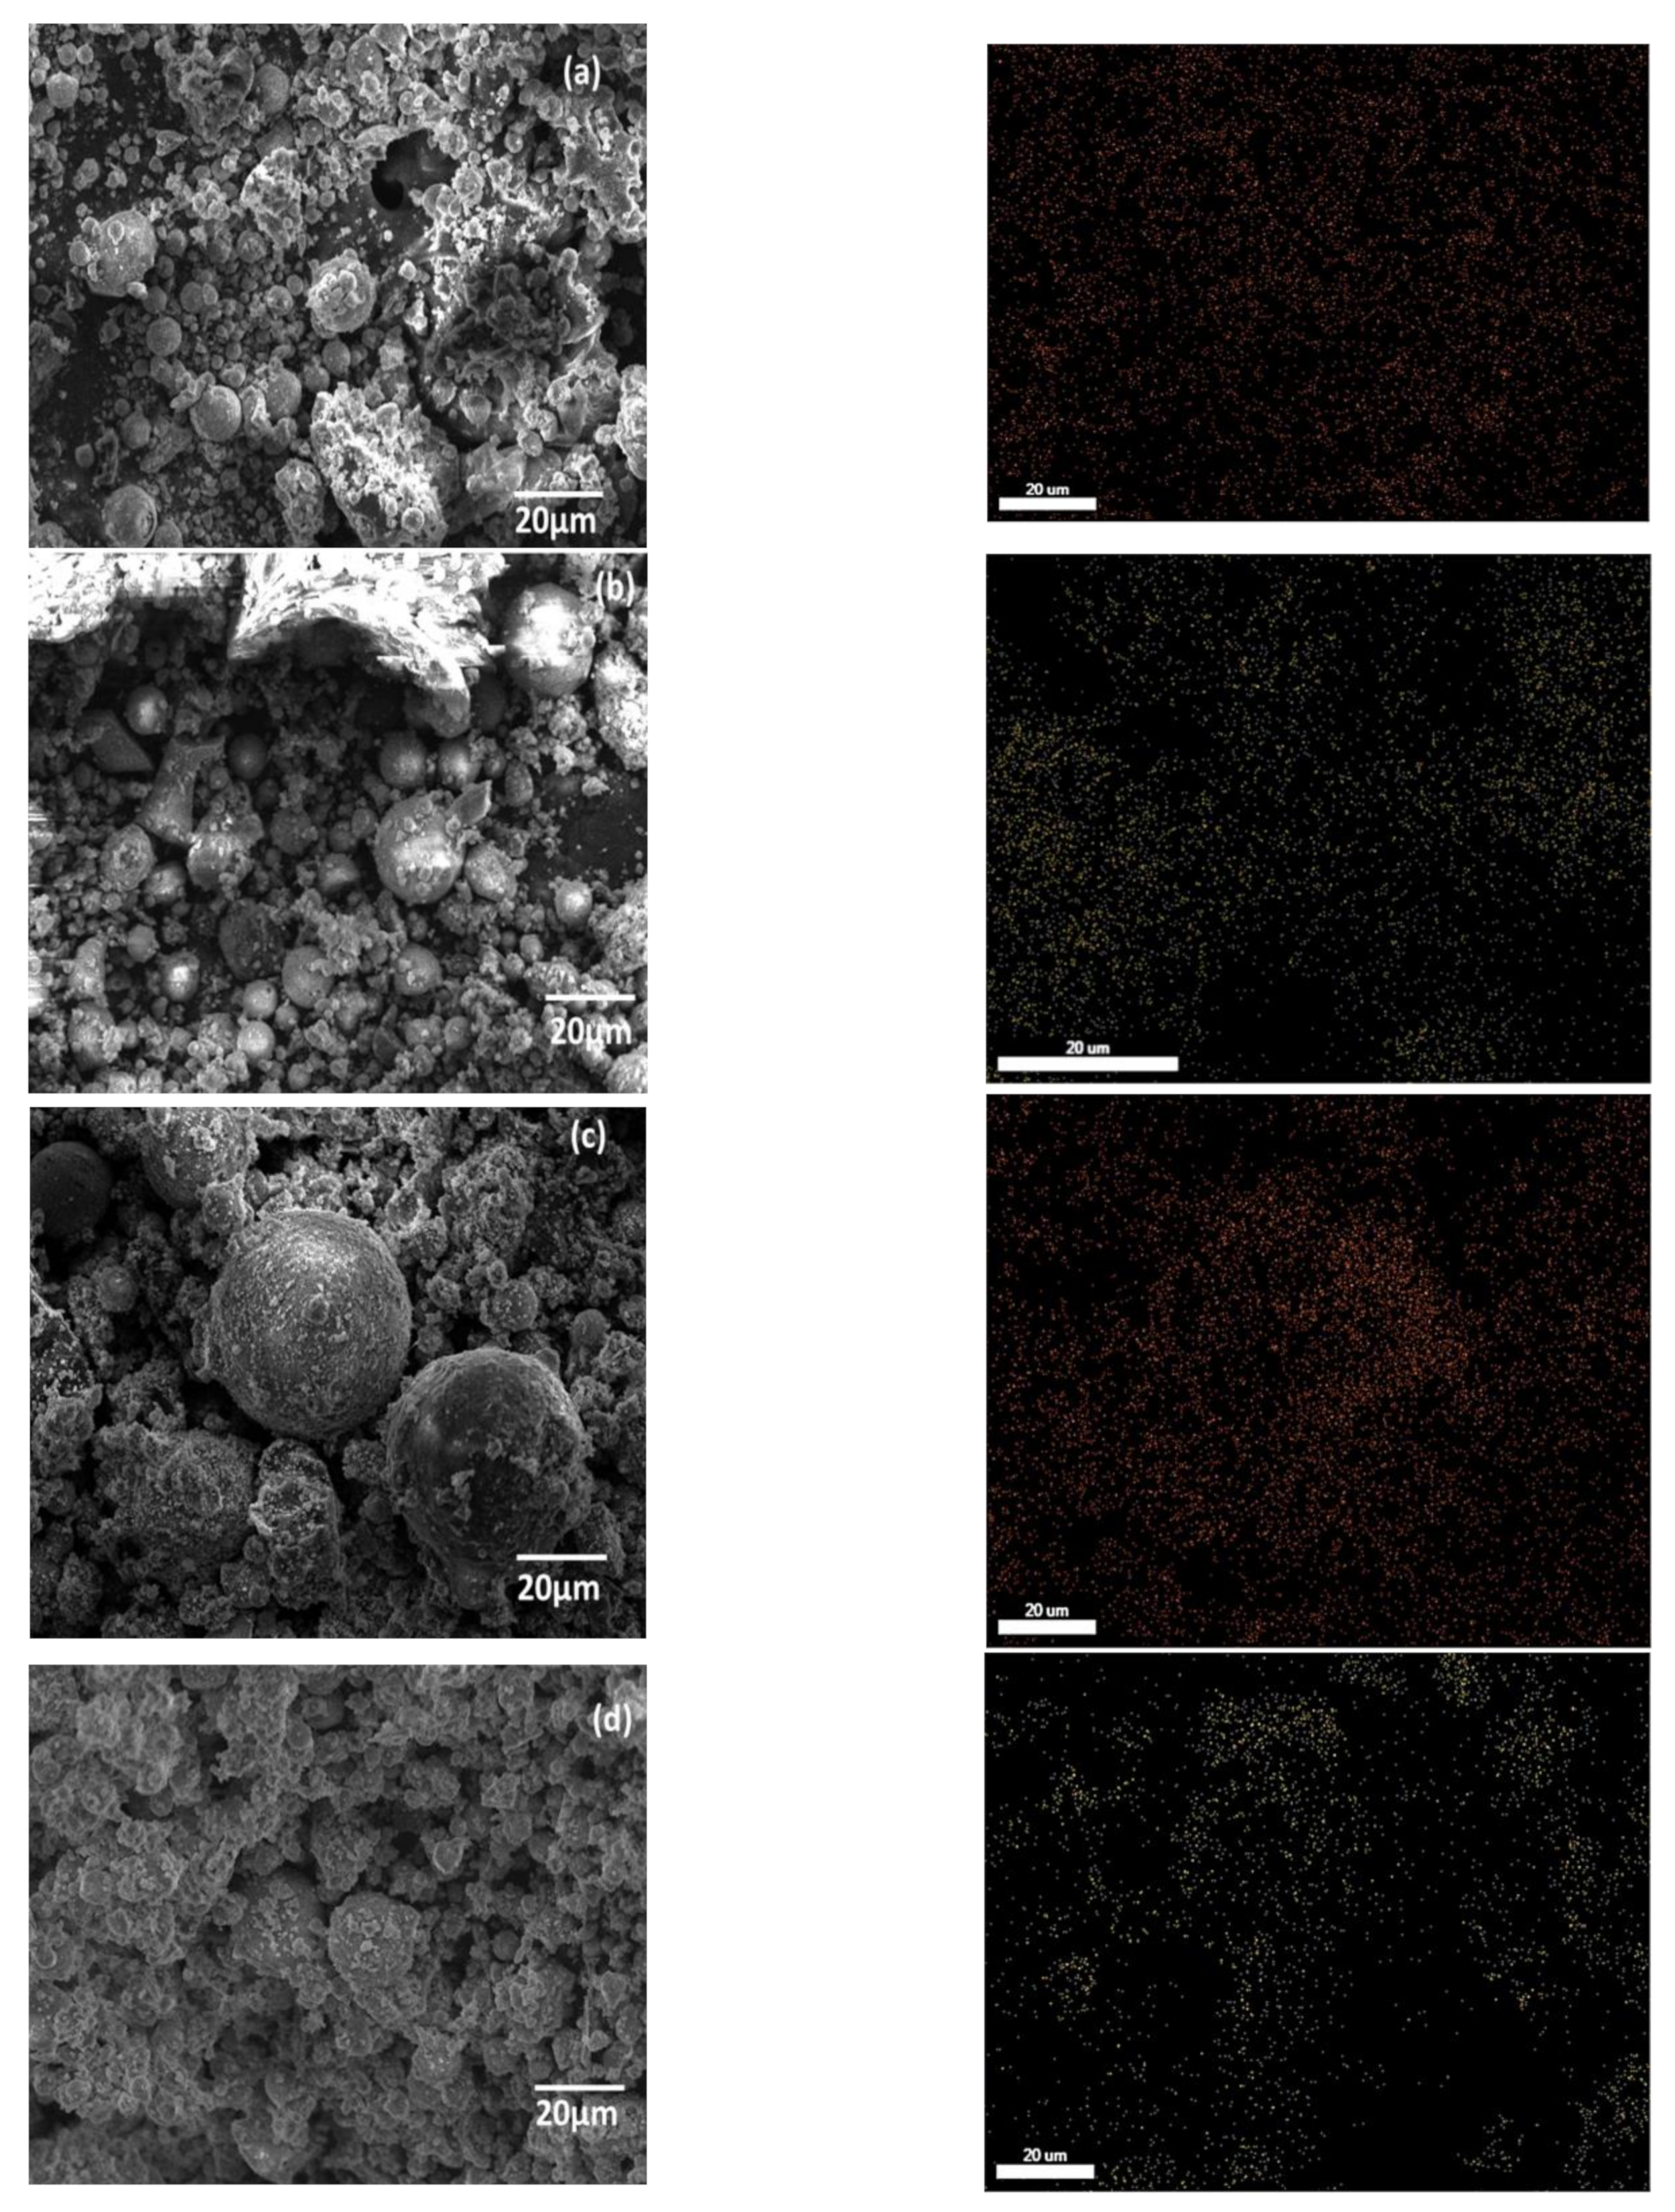
3.3. Characterization after Adsorption of Cu2+ and Cd2+ from an Aqueous Solution

The diffractograms after adsorption of Cu2+ and Cd2+ (Figure 8) show the presence of copper (Cu4SO4(OH)6; ICDD 96-901-6522) and cadmium (Cd3Al2Si3O12; ICDD 96-153-8398) phases, indicating the incorporation of Cu2+ and Cd2+ ions in geopolymer and geopolymer-NanoTiO2.
The FTIR spectrum after the adsorption of Cu2+ and Cd2+ was collected and compared with the FTIR before adsorption, as shown in Figure 9. The analysis of the obtained results indicated the shift with an improvement in intensity in almost all the peaks of geopolymer and geopolymer-NanoTiO2 composite. A shift in all the bands clearly indicates that all functional groups were involved in the interaction between heavy metal ions and the surface of adsorbents. The FTIR spectrums after adsorption of Cd2+ by geopolymer and geopolymer-NanoTiO2 composite show the presence of a peak corresponding to the vibration of Cd–O that is observed at 1385 cm−1 [42], confirming the presence of cadmium in geopolymer and composite [11].
The confirmation of Cu2+ and Cd2+ adsorption onto geopolymer and geopolymer-NanoTiO2 composite was performed by morphology study carried out by SEM and elemental mapping (Figure 10a–d), respectively.
The SEM and elemental mapping images show the presence of copper and cadmium on the surface of the adsorbents and a final confirmation was carried out by EDX (Table 4), where the presence of Cu and Cd content was found along with Si, Al, Ti, and O. It should be mentioned that such quantitative analysis is not highly reliable; however, it can be used as a qualitative indication of the adsorption [43].

3.4. Comparative Study

By comparing the adsorption capacities of Cu2+ and Cd2+ for various adsorbents in Table 5, it can be seen that geopolymer and geopolymer-NanoTiO2 composite in this study show adsorption capacities for Cu2+ and Cd2+ larger than adsorbents reported in the literature. Additionally, geopolymer-NanoTiO2 can be considered a new type of low-cost adsorbent.

4. Conclusions

The synthesized geopolymer and geopolymer-NanoTiO2 composite were characterized using different tools such as X-ray diffraction, spectroscopy infrared, and scanning electron microscopy; a study of the adsorption of heavy metals (copper and cadmium ions) by these materials was carried out on geopolymer and geopolymer-NanoTiO2 composite. Additionally, the effect of TiO2 nanoparticles was investigated. The results showed that the incorporation of (5%) TiO2 nanoparticles of approximately 24 nm in size delivered a maximum adsorption capacity of Cu2+ (Qmax = 1708.2 mg/g) that was 9~10 times larger than geopolymer material (Qmax = 172.83 mg/g) and an adsorption capacity of Cd2+ (Qmax = 706.9 mg/g) that was 2~3 times larger than geopolymer material. This study has significant advantages such as using fast, inexpensive, and eco-friendly material, an easy preparation method, simplicity in application and high efficiency at ambient conditions.

Author Contributions

Conceptualization and methodolgy, K.K.; Validation, M.E.A.; investigation, Writing–original draft, K.K. and L.L. All authors have read and agreed to the published version of the manuscript.

Funding

This research received no external funding.

Institutional Review Board Statement

Not Applicable.

Informed Consent Statement

Not Applicable.

Data Availability Statement

Conflicts of Interest

The authors declare no conflict of interest.

References

  1. Baby, J.; Raj, J.S.; Biby, E.T.; Sankarganesh, P.; Jeevitha, M.V.; Ajisha, S.U.; Rajan, S.S. Toxic Effect of Heavy Metals on Aquatic Environment. Int. J. Biol. Chem. Sci. 2011, 4, 939–952. [Google Scholar] [CrossRef] [Green Version]
  2. Crini, G. Recent Developments in Polysaccharide-Based Materials Used as Adsorbents in Wastewater Treatment. Prog. Polym. Sci. 2005, 30, 38–70. [Google Scholar] [CrossRef]
  3. Mohammed, A.S.; Kapri, A.; Goel, R. Heavy Metal Pollution: Source, Impact, and Remedies. In Biomanagement of Metal-Contaminated Soils; Springer: Dordrecht, The Netherlands, 2011; Volume 20, pp. 1–28. [Google Scholar] [CrossRef]
  4. Maleki, A.; Hajizadeh, Z.; Sharifi, V.; Emdadi, Z. A Green, Porous and Eco-Friendly Magnetic Geopolymer Adsorbent for Heavy Metals Removal from Aqueous Solutions. J. Clean. Prod. 2019, 215, 1233–1245. [Google Scholar] [CrossRef]
  5. Darmayanti, L.; Kadja, G.T.M.; Notodarmojo, S.; Damanhuri, E.; Mukti, R.R. Structural Alteration within Fly Ash-Based Geopolymers Governing the Adsorption of Cu2+ from Aqueous Environment: Effect of Alkali Activation. J. Hazard. Mater. 2019, 377, 305–314. [Google Scholar] [CrossRef] [PubMed]
  6. Ratnarathorn, N.; Chailapakul, O.; Henry, C.S.; Dungchai, W. Simple Silver Nanoparticle Colorimetric Sensing for Copper by Paper-Based Devices. Talanta 2012, 99, 552–557. [Google Scholar] [CrossRef] [PubMed]
  7. Ge, Y.; Cui, X.; Liao, C.; Li, Z. Facile Fabrication of Green Geopolymer/Alginate Hybrid Spheres for Efficient Removal of Cu(II) in Water: Batch and Column Studies. Chem. Eng. J. 2017, 311, 126–134. [Google Scholar] [CrossRef]
  8. Yu, Z.; Dang, Q.; Liu, C.; Cha, D.; Zhang, H.; Zhu, W.; Zhang, Q.; Fan, B. Preparation and Characterization of Poly(Maleic Acid)-Grafted Cross-Linked Chitosan Microspheres for Cd(II) Adsorption. Carbohydr. Polym. 2017, 172, 28–39. [Google Scholar] [CrossRef]
  9. Meng, J.; Cui, J.; Yu, J.; Huang, W.; Wang, P.; Wang, K.; Liu, M.; Song, C.; Chen, P. Preparation of Green Chelating Fibers and Adsorption Properties for Cd(II) in Aqueous Solution. J. Mater. Sci. 2017, 53, 2277–2289. [Google Scholar] [CrossRef]
  10. Wang, X.S.; Miao, H.H.; He, W.; Shen, H.L. Competitive Adsorption of Pb(II), Cu(II), and Cd(II) Ions on Wheat-Residue Derived Black Carbon. J. Chem. Eng. Data 2011, 56, 444–449. [Google Scholar] [CrossRef]
  11. Lan, T.; Li, P.; Rehman, F.U.; Li, X.; Yang, W.; Guo, S. Efficient Adsorption of Cd2+ from Aqueous Solution Using Metakaolin Geopolymers. Environ. Sci. Pollut. Res. 2019, 26, 33555–33567. [Google Scholar] [CrossRef]
  12. Cheng, Q.; Huang, Q.; Khan, S.; Liu, Y.; Liao, Z.; Li, G.; Ok, Y.S. Adsorption of Cd by Peanut Husks and Peanut Husk Biochar from Aqueous Solutions. Ecol. Eng. 2016, 87, 240–245. [Google Scholar] [CrossRef]
  13. Kutchko, B.G.; Kim, A.G. Fly Ash Characterization by SEM–EDS. Fuel 2006, 85, 2537–2544. [Google Scholar] [CrossRef]
  14. Li, L.; Wang, S.; Zhu, Z. Geopolymeric Adsorbents from Fly Ash for Dye Removal from Aqueous Solution. J. Colloid Interface Sci. 2006, 300, 52–59. [Google Scholar] [CrossRef] [PubMed]
  15. Gaya, U.I.; Abdullah, A.H. Heterogeneous Photocatalytic Degradation of Organic Contaminants over Titanium Dioxide: A Review of Fundamentals, Progress and Problems. J. Photochem. Photobiol. C Photochem. Rev. 2008, 9, 1–12. [Google Scholar] [CrossRef]
  16. Cho, H.; Oh, D.; Kim, K. A Study on Removal Characteristics of Heavy Metals from Aqueous Solution by Fly Ash. J. Hazard. Mater. 2005, 127, 187–195. [Google Scholar] [CrossRef] [PubMed]
  17. Aboulayt, A.; Jaafri, R.; Samouh, H.; Cherki El Idrissi, A.; Roziere, E.; Moussa, R.; Loukili, A. Stability of a New Geopolymer Grout: Rheological and Mechanical Performances of Metakaolin-Fly Ash Binary Mixtures. Constr. Build. Mater. 2018, 181, 420–436. [Google Scholar] [CrossRef]
  18. Kai, M.F.; Dai, J.G. Understanding Geopolymer Binder-Aggregate Interfacial Characteristics at Molecular Level. Cem. Concr. Res. 2021, 149, 106582. [Google Scholar] [CrossRef]
  19. Sumesh, M.; Alengaram, U.J.; Jumaat, M.Z.; Mo, K.H.; Alnahhal, M.F. Incorporation of Nano-Materials in Cement Composite and Geopolymer Based Paste and Mortar—A Review. Constr. Build. Mater. 2017, 148, 62–84. [Google Scholar] [CrossRef]
  20. Maiti, M.; Sarkar, M.; Maiti, S.; Malik, M.A.; Xu, S. Modification of Geopolymer with Size Controlled TiO2 Nanoparticle for Enhanced Durability and Catalytic Dye Degradation under UV Light. J. Clean. Prod. 2020, 255, 120183. [Google Scholar] [CrossRef]
  21. Sivasakthi, M.; Jeyalakshmi, R.; Rajamane, N.P. Investigation of Microstructure and Thermomechanical Properties of Nano-TiO2 Admixed Geopolymer for Thermal Resistance Applications. J. Mater. Eng. Perform. 2021, 30, 3642–3653. [Google Scholar] [CrossRef]
  22. Jézéquel, H.; Chu, K. Removal of Arsenate from Aqueous Solution by Adsorption onto Titanium Dioxide Nanoparticles. J. Environ. Sci. Health Part A 2007, 41, 1519–1528. [Google Scholar] [CrossRef] [PubMed]
  23. Hung, W.C.; Fu, S.H.; Tseng, J.J.; Chu, H.; Ko, T.H. Study on Photocatalytic Degradation of Gaseous Dichloromethane Using Pure and Iron Ion-Doped TiO2 Prepared by the Sol–Gel Method. Chemosphere 2007, 66, 2142–2151. [Google Scholar] [CrossRef] [PubMed]
  24. Hema, M.; Arasi, A.Y.; Tamilselvi, P.; Anbarasan, R. Titania Nanoparticles Synthesized by Sol-Gel Technique. Chem Sci Trans 2013, 2, 239–245. [Google Scholar] [CrossRef] [Green Version]
  25. Sindhunata; Van Deventer, J.S.J.; Lukey, G.C.; Xu, H. Effect of Curing Temperature and Silicate Concentration on Fly-Ash-Based Geopolymerization. Ind. Eng. Chem. Res. 2006, 45, 3559–3568. [Google Scholar] [CrossRef]
  26. Khatib, K.; Kerroumi, H.; El Azhari, M. Synthesis, Characterization and Optimization of New Adsorbent Materials Based on Industrial Discharges for the Decontamination of Liquid Effluents. Mater. Today Proc. 2020, 22, 120–125. [Google Scholar] [CrossRef]
  27. Sastry, K.V.S.G.K.; Sahitya, P.; Ravitheja, A. Influence of Nano TiO2 on Strength and Durability Properties of Geopolymer Concrete. Mater. Today Proc. 2021, 45, 1017–1025. [Google Scholar] [CrossRef]
  28. Van Jaarsveld, J.G.S.; Van Deventer, J.S.J. Effect of the Alkali Metal Activator on the Properties of Fly Ash-Based Geopolymers. Ind. Eng. Chem. Res. 1999, 38, 3932–3941. [Google Scholar] [CrossRef]
  29. Nath, S.K.; Maitra, S.; Mukherjee, S.; Kumar, S. Microstructural and Morphological Evolution of Fly Ash Based Geopolymers. Constr. Build. Mater. 2016, 111, 758–765. [Google Scholar] [CrossRef]
  30. Yang, L.Y.; Jia, Z.J.; Zhang, Y.M.; Dai, J.G. Effects of Nano-TiO2 on Strength, Shrinkage and Microstructure of Alkali Activated Slag Pastes. Cem. Concr. Compos. 2015, 57, 1–7. [Google Scholar] [CrossRef]
  31. Karanac, M.; Đolić, M.; Veličković, Z.; Kapidžić, A.; Ivanovski, V.; Mitrić, M.; Marinković, A. Efficient Multistep Arsenate Removal onto Magnetite Modified Fly Ash. J. Environ. Manage. 2018, 224, 263–276. [Google Scholar] [CrossRef]
  32. Vijayalakshmi, R.; Rajendran, V. Synthesis and Characterization of Nano-Tio2 via Different Methods. Arch. Appl. Sci. Res. 2012, 4, 1183–1190. [Google Scholar]
  33. Nikolić, V.; Komljenović, M.; Marjanović, N.; Baščarević, Z.; Petrović, R. Lead Immobilization by Geopolymers Based on Mechanically Activated Fly Ash. Ceram. Int. 2014, 40, 8479–8488. [Google Scholar] [CrossRef]
  34. Khataee, R.; Heydari, V.; Moradkhannejhad, L.; Safarpour, M.; Joo, S.W. Self-Cleaning and Mechanical Properties of Modified White Cement with Nanostructured TiO2. J. Nanosci. Nanotechnol. 2013, 13, 5109–5114. [Google Scholar] [CrossRef]
  35. Zailan, S.N.; Mahmed, N.; Abdullah, M.M.A.B.; Rahim, S.Z.A.; Halin, D.S.C.; Sandu, A.V.; Vizureanu, P.; Yahya, Z. Potential Applications of Geopolymer Cement-Based Composite as Self-Cleaning Coating: A Review. Coatings 2022, 12, 133. [Google Scholar] [CrossRef]
  36. Ono, Y.; Amano, Y.; Aikawa, M.; Machida, M. Zur Theorie Der Sogenannten Adsorption Geloster Stoffe. K. Sven. Vetenskapsakademiens. Handl. 1898, 24, 1–39. [Google Scholar] [CrossRef]
  37. Ho, Y.S.; McKay, G. Sorption of Dye from Aqueous Solution by Peat. Chem. Eng. J. 1998, 70, 115–124. [Google Scholar] [CrossRef]
  38. Tang, Q.; Wang, K.; Yaseen, M.; Tong, Z.; Cui, X. Synthesis of Highly Efficient Porous Inorganic Polymer Microspheres for the Adsorptive Removal of Pb2+from Wastewater. J. Clean. Prod. 2018, 193, 351–362. [Google Scholar] [CrossRef]
  39. Langmuir, I. The Constitution and Fundamental Properties of Solids and Liquids. Part I. Solids. J. Am. Chem. Soc. 1916, 38, 2221–2295. [Google Scholar] [CrossRef] [Green Version]
  40. Al-Harahsheh, M.S.; Al Zboon, K.; Al-Makhadmeh, L.; Hararah, M.; Mahasneh, M. Fly Ash Based Geopolymer for Heavy Metal Removal: A Case Study on Copper Removal. J. Environ. Chem. Eng. 2015, 3, 1669–1677. [Google Scholar] [CrossRef]
  41. Onutai, S.; Kobayashi, T.; Thavorniti, P.; Jiemsirilers, S. The Adsorption of Cadmium Ions on Fly Ash Based Geopolymer Particles. Key Eng. Mater. 2018, 766, 65–70. [Google Scholar] [CrossRef]
  42. Balamurugan, S.; Balu, A.; Usharani, K.; Suganya, M.; Anitha, S.; Prabha, D.L.; Ilangovan, S. Synthesis of CdO Nanopowders by a Simple Soft Chemical Method and Evaluation of Their Antimicrobial Activities. Pac. Sci. Rev. A Nat. Sci. Eng. 2016, 18, 228–232. [Google Scholar] [CrossRef]
  43. Pandey, S.; Tiwari, S. Facile Approach to Synthesize Chitosan Based Composite—Characterization and Cadmium(II) Ion Adsorption Studies. Carbohydr. Polym. 2015, 134, 646–656. [Google Scholar] [CrossRef]
  44. Ge, Y.; Cui, X.; Kong, Y.; Li, Z.; He, Y.; Zhou, Q. Porous Geopolymeric Spheres for Removal of Cu(II) from Aqueous Solution: Synthesis and Evaluation. J. Hazard. Mater. 2015, 283, 244–251. [Google Scholar] [CrossRef]
  45. Yu, Z.; Song, W.; Li, J.; Li, Q. Improved Simultaneous Adsorption of Cu(II) and Cr(VI) of Organic Modified Metakaolin-Based Geopolymer. Arab. J. Chem. 2020, 13, 4811–4823. [Google Scholar] [CrossRef]
  46. Taamneh, Y.; Sharadqah, S. The Removal of Heavy Metals from Aqueous Solution Using Natural Jordanian Zeolite. Appl. Water Sci. 2016, 7, 2021–2028. [Google Scholar] [CrossRef]
Figure 1. XRD spectra of fly ash, TiO2 nanoparticles, geopolymer, and geopolymer-NanoTiO2.
Minerals 12 01445 g001
Figure 2. FTIR spectra of fly ash, TiO2 nanoparticles, geopolymer and geopolymer-NanoTiO2.
Minerals 12 01445 g002
Figure 3. SEM images: (a) Fly ash; (b) TiO2 nanoparticles; (c) Geopolymer; (d) Geopolymer- NanoTiO2.
Minerals 12 01445 g003aMinerals 12 01445 g003b
Figure 4. (a) Kinetic model of Cu2+ on geopolymer and geopolymer-NanoTiO2 composite (volume (15 mL), mass of adsorbent (0.3), pH (6.8), ambient temperature, and stirring speed (250 rpm)), (b) Pseudo First Order, (c) Pseudo Second Order.
Minerals 12 01445 g004
Figure 5. (a) Kinetic model of Cd2+ on geopolymer and geopolymer-NanoTiO2 composite (volume (15 mL), mass of adsorbent (0.3), pH (6.8), ambient temperature, and stirring speed (250 rpm)), (b) Pseudo First Order, (c) Pseudo Second Order.
Minerals 12 01445 g005
Figure 6. (a) Adsorption isotherm of Cu2+ on geopolymer and geopolymer-NanoTiO2 composite (volume (15 mL), mass of adsorbent (0.3), pH (6.8), ambient temperature, and stirring speed (250 rpm)), (b) Langmuir model, (c) Freundlich model.
Minerals 12 01445 g006
Figure 7. (a) Adsorption isotherm of Cd2+ on geopolymer and geopolymer-NanoTiO2 composite (volume (15 mL), mass of adsorbent (0.3), pH (6.8), ambient temperature, and stirring speed (250 rpm)), (b) Langmuir model, (c) Freundlich model.
Minerals 12 01445 g007
Figure 8. XRD spectra of geopolymer and geopolymer-NanoTiO2 after adsorption (experimental conditions: volume (15 mL), mass of adsorbent (0.3), pH (6.8), ambient temperature, and stirring speed (250 rpm)).
Minerals 12 01445 g008
Figure 9. FTIR spectra of geopolymer and geopolymer-NanoTiO2 after adsorption (experimental conditions: volume (15 mL), mass of adsorbent (0.3), pH (6.8), ambient temperature, and stirring speed (250 rpm)).
Minerals 12 01445 g009
Figure 10. SEM and elemental mapping images: (a) Geopolymer after adsorption of Cu2+; (b) Geopolymer after adsorption of Cd2+; (c) Geopolymer-NanoTiO2 after adsorption of Cu2+; (d) Geopolymer-NanoTiO2 after adsorption of Cd2+. (Experimental conditions: (volume (15 mL), mass of adsorbent (0.3), pH (6.8), ambient temperature, and stirring speed (250 rpm)).
Minerals 12 01445 g010
Table 1. Chemical composition of fly ash used in this study.
ComponentSiO2Al2O3Fe2O3CaOK2OTiO2MgONa2OP2O5MnOLoss Amount
Content (wt%)33.8313.125.584.272.180.950.930.830.450.0637.76
Table 2. Pseudo-first-order kinetic model and pseudo-second-order kinetic model parameters.
AdsorbateAdsorbentsQeq (mg/g) ExperimentalPseudo First OrderPseudo Second Order
Qeq (mg/g)K1 (min−1)R2Qeq (mg/g)K2
(g.mg−1. min−1)
R2
Cu2+ Geopolymer 78.8737.620.02440.8684.031.5.10−30.99
Geopolymer-NanoTiO299.2340.280.03720.831022.620.99
Cd2+Geopolymer 49.956.687.5.10−30.8116.722.8.10−40.68
Geopolymer-NanoTiO251.431.790.0310.00948.070.010.99
Table 3. Langmuir and Freundlich isotherm model parameters.
AdsorbateAdsorbentsQmax (mg/g) ExperimentalLangmuir ModelFreundlich Model
Qmax (mg/g)KL (L/mg)RLR2nKF (mg/g)(L/mg)1/nR2
Cu2+ Geopolymer172.83188.671.7.10−40.02 < RL < 0.520.992.321.860.89
Geopolymer-NanoTiO21708.250001.17.10−50.25 < RL < 0.940.0330.90.0290.91
Cd2+Geopolymer 271.66285.712.3.10−40.006 < RL < 0.770.993.258.030.95
Geopolymer-NanoTiO2706.9833.333.78.10−50.07 < RL < 0.950.842.032.180.97
Table 4. Results of EDS characterization of fly ash, NanoTiO2, adsorbents geopolymer and geopolymer- NanoTiO2 before and after adsorption.
Fly AshNano TiO2GeopolymerCu2++ GeopolymerCd2++ GeopolymerGeopolymer-NanoTiO2Cu2++ Geopolymer-NanoTiO2Cd2++ Geopolymer-NanoTiO2
ElementWeight%Weight%Weight%Weight%Weight%Weight%Weight%Weight%
C61.483.072.3114.524.5412.5922.4222.78
O19.2939.5936.7238.7443.3239.2436.4339.40
Fe0.08-0.510.052.380.003.083.33
Na0.19-16.10-0.8413.84-2.04
Mg0.39-0.840.110.550.110.770.72
Al4.87-7.165.438.226.306.227.29
Si10.28-19.409.8716.4217.209.8112.13
S0.61--4.53--1.5-
K0.98-6.310.891.091.300.961.02
Ca1.84-10.641.131.033.831.132.83
N-0.08-0.38----
Br------ -
Ti-57.26---5.603.713.05
Cu---24.36--13.97-
Cd----1.61--5.41
Table 5. Comparison between the adsorption capacity of synthesized geopolymers and that of other adsorbents.
AdsorbentAdsorbatespHTime (min)Temperature °CQ(mg/g)Ref.
Porous geopolymerCu2+525002552.63[44]
Geopolymer/alginate hybrid spheresCu2+525002560.8[7]
CTAB/geopolymerCu2+56030147.2[45]
Jordanian zeoliteCu2+620-14.3[46]
Cd2+620-25.9
Metakaolin geopolymer powderCd2+54002570.3[11]
Fly ash-chitosanCd2+8180-87.72[43]
Geopolymer Cu2+6.86025172.83This work
Cd2+6.810025271.66
Geopolymer-NanoTiO2Cu2+6.8150251708.2
Cd2+6.82025706.9
Publisher’s Note: MDPI stays neutral with regard to jurisdictional claims in published maps and institutional affiliations.

