Article

Adsorption of Selected Heavy and Precious Metals from Simulated Wastewater Using Fabricated Polyacrylonitrile (PAN) and Poly(4-Vinylpyridine) (P4VP) Monoliths

by
Keziah E. Liebenberg
,
Abayneh A. Ambushe
and
Orpah Zinyemba
*
Department of Chemical Sciences, Auckland Park Kingsway Campus, University of Johannesburg, Johannesburg 2006, South Africa
*
Author to whom correspondence should be addressed.
Minerals 2021, 11(8), 884; https://doi.org/10.3390/min11080884
Submission received: 11 June 2021 / Revised: 16 July 2021 / Accepted: 19 July 2021 / Published: 16 August 2021

Abstract

:
Adsorption has become an attractive method for the extraction and recovery of metals from wastewater effluents. This study involved the fabrication of mesoporous neat polyacrylonitrile (PAN) monoliths and composite polymer monoliths of PAN and poly-4-vinylpyridine (P4VP) as adsorbents for toxic elements (As(V), Cr(VI)) and the recovery of PGMs(Ru(III), Rh(III), Pd(II)) from simulated wastewater solutions. Fabrication of the mesoporous polymer monoliths was conducted using the non-solvent induced phase separation method (NIPS). The monoliths were characterized by scanning electron microscopy (SEM), energy-dispersive X-ray spectroscopy (EDS), and Brunauer–Emmett–Teller (BET). Adsorption studies were conducted using crushed monoliths saturated in 1 mg·L−1 simulated wastewater solutions. Spectroscopic analyses of the resulting filtrates were conducted using inductively coupled plasma-optical emission spectrometry (ICP-OES). In this study, the NIPS method was successfully optimized and mesoporous PAN, as well as composite polymer monoliths, were successfully fabricated. A concentration of 1 mg·L−1 of Ru(III) and Pd(II) was completely adsorbed by both monoliths. The mesoporous composite polymer monoliths exhibited the highest adsorption capacity for Rh(III), As(V), and Cr(VI). The mesoporous polymer monoliths showed great potential for use as wastewater cleaning aids as well as remediators of precious metals.

1. Introduction

With a minimal 500 mm average annual rainfall, South Africa is included on a list of the 40 countries that are said to be the aridest in the world [1]. In addition to water scarcity, contamination of the water supply available in South Africa can further limit the supply of water in the country, leading to dire consequences for both living organisms and the environment [2]. The contamination of water by heavy metals from various anthropogenic activities is of great concern owing to their toxicity. Heavy metals have increasingly become a plague to the environment owing to their high accumulation and endurance in the environmental system as well as their non-biodegradability [3].
The contamination of water systems by precious metals is also increasing at an alarming rate as it compromises the quality of potable water sources and leads to irrecoverable loss of valuable metal resources. Precious metals are aptly named, as they are rare, in high global demand, and therefore have a high economic value [4]. Therefore, the availability of precious metals such as platinum group metals (PGMs) is crucial to the economy of any country. This availability is currently declining as natural ore deposits of PGMs are rapidly being depleted. Owing to their high demand, economic and industrial importance, scarcity, and cost, efficient methods for the recovery of PGMs from secondary sources is becoming increasingly critical as the supply from primary sources cannot keep up with global demand [5]. An example of such a secondary source is wastewater (industrial effluents from various industries where PGMs are used). The PGMs content of wastewater from refinery processes has been reported to be within the concentration range of 2–100 mg·L−1. It is therefore clear that the recovery of PGMs from such effluents is economically viable [6].
Currently, the recovery of PGMs from liquid effluents is carried out using a variety of methods such as electrochemical techniques, ion exchange, membrane techniques, as well as chemical precipitation and coagulation. These techniques, however, are not favorable as they require large amounts of chemical additives, the use of a high amount of energy, they produce sludges as by-products, and are overall cost-inefficient [7]. This study aims to develop a recovery technique that is void of these disadvantages. Adsorption is well suited for this application as it has been reported to be effective, economical, and able to extract metals even from effluents with low PGMs concentrations. An advantage of adsorbents specifically used for the treatment of wastewater includes their ability to treat large volumes of water without producing additional waste residue [8,9]. In addition to PGMs, adsorption has been applied for removal of toxic metal ions from water and wastewater. Recently, a polyaniline-based adsorbent material was applied for removal of carcinogenic Cr(VI) from wastewater by Hsini et al. [10].
Polyacrylonitrile (PAN) has been favored as an adsorbent in recent studies as it is abundantly produced and is insoluble in water, which is preferred since most adsorption studies are carried out in aqueous metal ion solutions. The PAN has also been reported to have good chemical resistivity, high strength, thermal stability, and abrasion resistance [11,12]. The nitrogen atom component of the nitrile group has been reported to enhance the selective adsorption of metal ions from solutions [8].
This research aimed to fabricate both mesoporous neat PAN as well as composite polymer monoliths of a combination of PAN and poly-4-vinylpyridine (P4VP) via the non-solvent induced phase separation (NIPS) method. The fabricated monoliths, as well as neat PAN, were further employed in the adsorption of toxic elements (As(V) and Cr(VI)) as well as PGMs ((III), Rh(III), and Pd(II)) from simulated wastewater solutions.

2. Materials and Methods

2.1. Reagents and Solvents

Analytical grade reagents were used as received. Polyacrylonitrile (PAN) (Mw ~ 150,000), poly-4-vinylpyridine (P4VP) (Mw ~ 60,000), and dimethyl sulfoxide (DMSO) were purchased from Sigma Aldrich (Johannesburg, South Africa) and 65% suprapur nitric acid (HNO3) was purchased from Merck (Darmstadt, Germany). Milli-Q water was obtained from a Millipore Milli-Q Direct 8/16 ultra-pure water purification system purchased from Merck (Johannesburg, South Africa) with a resistivity of 18 MΩ·cm. The palladium (Pd(II)), chromium (Cr(VI)), and rhodium (Rh(III)) standards were purchased from Merck (Darmstadt, Germany) and the arsenic (As(V)) and ruthenium (Ru(III)) standards were purchased from Inorganic Ventures (Christiansburg, VA, USA). All standards were purchased as 1000 mg·L−1 stock solutions. These standards were used in both the uptake experiments and in the preparation of calibration standards used during elemental quantification with ICP-OES.

2.2. Optimization of Fabrication of Mesoporous Neat PAN Monoliths

The optimization parameters evaluated in the fabrication of the polymer monoliths were two-fold: optimization of the mass of polymer and optimization of the ratio of the solvent: non-solvent mixture (DMSO:Milli-Q water) employed during fabrication. To optimize the mass of neat PAN polymer used, masses of 0.162 g, 0.164 g, 0.166 g, and 0.168 g were tested. To optimize the DMSO:Milli-Q water composition, ratios of 90:10 and 95:5 were evaluated.
The following procedure was carried out for each experiment involving the individual masses of neat PAN as well as their combination with the two different DMSO:Milli-Q water ratios. Each combination was repeated in triplicate. The mass of neat PAN of interest was weighed and a volume of 10 mL of a mixture of DMSO:Milli-Q water was then added. The mixture was then heated at 80 °C whilst stirring at 2 rpm in an oil bath for 6 h. Following the 6-h heating period, the resultant homogeneous solution was then pipetted dropwise into 300 mL Milli-Q water. The result was the formation of spherical polymer monoliths. The polymer monoliths were then filtered using filter discs purchased from Boeco Germany with a grade of 3 hw and pore size of 5–10 µm. The filtration velocity was 10 mL/35 s. After filtration, the polymer monoliths were dried under vacuum for 24 h.

2.3. Optimization of Fabrication of Composite Mesoporous Polymer Monoliths

The composite mesoporous polymer monoliths were fabricated from a mixture of PAN and P4VP at a ratio of 4:1, respectively, by adopting a method previously reported by Mphanje et al. [13]. To optimize the mixture of masses of neat PAN and P4VP polymer used, the following masses were tested (PAN + P4VP): (0.130 g + 0.032 g); (0.135 g + 0.037 g); (0.137 g + 0.039 g); and (0.140 g + 0.042 g). To optimize the DMSO:Milli-Q water, ratios of 90:10 and 95:5 were evaluated. The procedure as outlined above for the fabrication of mesoporous PAN monoliths was repeated for each experiment involving the varying masses of PAN and P4VP as well as their combination with the two different DMSO:Milli-Q water ratios. Each combination was repeated in triplicate.

2.4. Characterization of the Fabricated Polymer Monoliths

2.4.1. Scanning Electron Microscopy and Energy-Dispersive X-ray Spectroscopy Analysis

The porosity of the fabricated polymer monoliths (both the neat PAN and composite) was determined using scanning electronic microscopy (SEM) analysis. The elemental composition was determined by the use of energy-dispersive X-ray spectroscopy (EDS). The polymer spheres were cut in half and coated with a carbon layer using a Quorum Q300T ES large chamber, turbomolecular-pumped coating system, purchased from Quorum Technologies (East Sussex, UK). The analysis was then carried out with the scanning electron microscope Tescan Vega 3, purchased from Tescan Analytics (Provence, France) at a voltage of 20 kV and a working distance range of 10–16 mm.
The crushed polymer monoliths of both the neat PAN and the composite polymer were also analyzed with SEM and EDS to determine whether the internal porous network was retained after grinding the sample into a fine powder. Finely ground, raw PAN was also analyzed with SEM and EDS to compare its structure and composition to that of the powder of the two fabricated polymers as this polymer material was also employed in the sorption studies.

2.4.2. Brunauer–Emmett–Teller and Barret–Joyner–Halenda Analysis

Nitrogen adsorption and desorption and subsequent Brunauer–Emmett–Teller (BET) and Barret–Joyner–Halenda (BJH) analyses were employed for quantification of the pore size distribution (PSD) of the fabricated polymer monoliths as well as the average surface area. Individual masses of 0.1 g of finely crushed raw PAN, fabricated mesoporous neat PAN monoliths, and mesoporous composite polymer monoliths were weighed and degassed for 6 h at 80 °C. The samples were then placed into a cryogenic chamber where nitrogen adsorption and subsequent desorption studies were carried out at sub-zero temperatures. The instrument used was a TriStar 3000 gas adsorption analyzer purchased from Micromeritics Instruments Corporation (Norcross, GA, USA).

2.4.3. Thermogravimetric Analysis

Thermogravimetric analysis (TGA) was carried out on the two different mesoporous polymer monolith types as well as raw PAN to assess their thermal stability and decomposition profiles. A mass of 0.15 g of each of the three polymer samples was accurately weighed for analysis. The analysis was performed using a TA Q500 thermogravimetric analyzer purchased from TA Instruments (New Castle, DE, USA) over a temperature range of 25 °C to 650 °C. A heating rate of 10 °C/min was employed.

2.5. Adsorption Studies

Three different polymer materials were used for the adsorption studies. These included the raw PAN, the fabricated mesoporous neat PAN, and composite polymer monoliths. These polymers were each crushed into fine powders with the use of a grinder. A mass of 100 mg of each of the powders was weighed and placed into an Erlenmeyer flask. A volume of 5.5 mL of 1 mg·L−1 of a specific simulated metal ion solution, adjusted to pH 4 with 0.1 M NaOH, was added to each Erlenmeyer flask. A pH value of 4 was selected for the sorption study as it had been previously optimized for the adsorption of metal ions from aqueous solutions by employing similar mesoporous neat PAN monoliths by Mphanje et al. [13]. The various metal standard solutions included: As(V), Cr(VI), Ru(III), Rh(III), and Pd(II). Individual metal standard solutions were used for each adsorption study. No mixtures or competition studies were investigated. The resulting solutions were then stirred for 3 h at 2 rpm at room temperature. The mixtures were then filtered and the resulting filtrate was analyzed with an inductively coupled plasma-optical emission spectrometer (ICP-OES).

2.6. Spectroscopic Determination

The model of the ICP-OES instrument used for metal detection and quantification was the Spectro-ARCOS ICP-OES (Thermo-Fischer Scientific, Waltham, MA, USA). The concentrations of all the metal standard stock solutions were 1000 mg·L−1. Intermediate standard solutions of 10 mg·L−1 were prepared from these stock solutions. Five points calibration standards of 0, 0.1, 0.5, 1.0, and 1.5 mg·L−1 were prepared from these 10 mg·L−1 intermediate solutions. All standard solutions were made up with 1% HNO3.

2.7. Figures of Merit

2.7.1. Limit of Detection, the Limit of Quantification, and Coefficients of Determination

The limits of detection (LOD) for each analyte of interest, which included (As(V), Cr(VI), Ru(III), Rh(III), and Pd(II)), was calculated as three times the standard deviation of the raw intensity in counts per second (cps) of 10 individually prepared reagent blanks and further divided by the slope of the calibration curve [14]. The LOD values calculated according to this method correspond to a 98.3% confidence level [15]. The limits of quantification (LOQ) for each analyte in this study were calculated as 10 times the standard deviation of the raw intensity in counts per second (cps) of 10 individually prepared regent blanks and further divided by the slope of the calibration curve [14]. This method for LOQ determination corresponds to an accuracy level of 20% of the relative standard deviation [16,17].
The linearity of the method was evaluated using the values of coefficients of determination (R2), which were obtained from the calibration curves constructed for each analyte of interest. The calibration curves were constructed following ICP-OES analyses of five-point calibration standards of each analyte of interest in the range of 0 mg·L−1 to 1.5 mg·L−1.

2.7.2. Percent Relative Standard Deviation

The precision of the method was determined by analysis of the relative standard deviation (%RSD) values of the various analytes of interest including (As(V), Cr(VI), Ru(III), Rh(III), and Pd(II)). The %RSD values were calculated by using the mean and standard deviation values obtained from triplicate analysis of each analyte sample following the adsorption procedure. The standard deviation obtained for triplicate analysis of each analyte sample was divided by the mean value and multiplied by 100 [15].

3. Results and Discussion

3.1. Optimization of Fabrication of Mesoporous Neat PAN Monoliths

The two masses of PAN employed during the NIPS method that yielded the highest quality of polymer monoliths were found to be 0.164 g and 0.166 g. It can therefore be said that there is an optimal mass range of 0.164–0.166 g. The optimal DMSO:Milli-Q water ratio was found to be 90:10. This specific mass range and coagulation bath combination led to the formation of the most favorable liquid consistency after heating the mixture for 6 h at 80 °C. The liquid formed was homogenous and viscous, which favored the formation of a stable and defined spherical monolith shape once the liquid was pipetted dropwise into Milli-Q water. The polymer monoliths were found to dry completely within the 24-h allotted period under vacuum drying.

3.2. Optimization of Fabrication of Composite Mesoporous Polymer Monoliths

The optimal mass combination employed during the NIPS method was found to be 0.130 g of PAN and 0.032 g of P4VP. The optimal DMSO:Milli-Q water ratio was found to be 90:10. This method yielded composite polymer monoliths, which had a defined and stable structure, similar to that discussed above for the fabrication of the mesoporous neat PAN monoliths.

3.3. Common Findings for Both Fabrication Optimizations

The use of a DMSO:Milli-Q water ratio of 90:10 was found to successfully yield mesoporous polymer monoliths in all the optimization experiments for fabrication. In this study, the ratio of 95:5 did not yield any successful results which have been previously reported in the literature [18]. An increase in the amount of non-solvent used, as in the case of the 90:10 ratio, allows for weaker miscibility of the polymer in the coagulation bath. The kinetics of the phase separation, therefore, increases, favoring the formation of monoliths with a porous network [18]. The opposite is achieved for an increase in the amount of non-solvent used as in the case of the 95:5, DMSO:Milli-Q water ratio.
It should also be noted that it was found that the spherical monolith shapes formed best when the liquid mixture was pipetted into Milli-Q water immediately after its removal from the heated oil bath. This corresponds to the literature, as it has been reported that a rapid cooling rate favors the formation of an interconnected network as it promotes quicker phase separation, resulting in more defined structures [19].

3.4. SEM and EDS Analysis

SEM in conjunction with EDS was used to analyze both fabricated mesoporous polymer monoliths (neat PAN and the composite polymer) as well as raw PAN. An analysis was carried out to validate the existence of a porous network within the monoliths as well as to confirm their elemental composition. An analysis was also conducted on the fine powders obtained after both polymer monoliths were crushed to investigate if the porous network was retained after crushing.

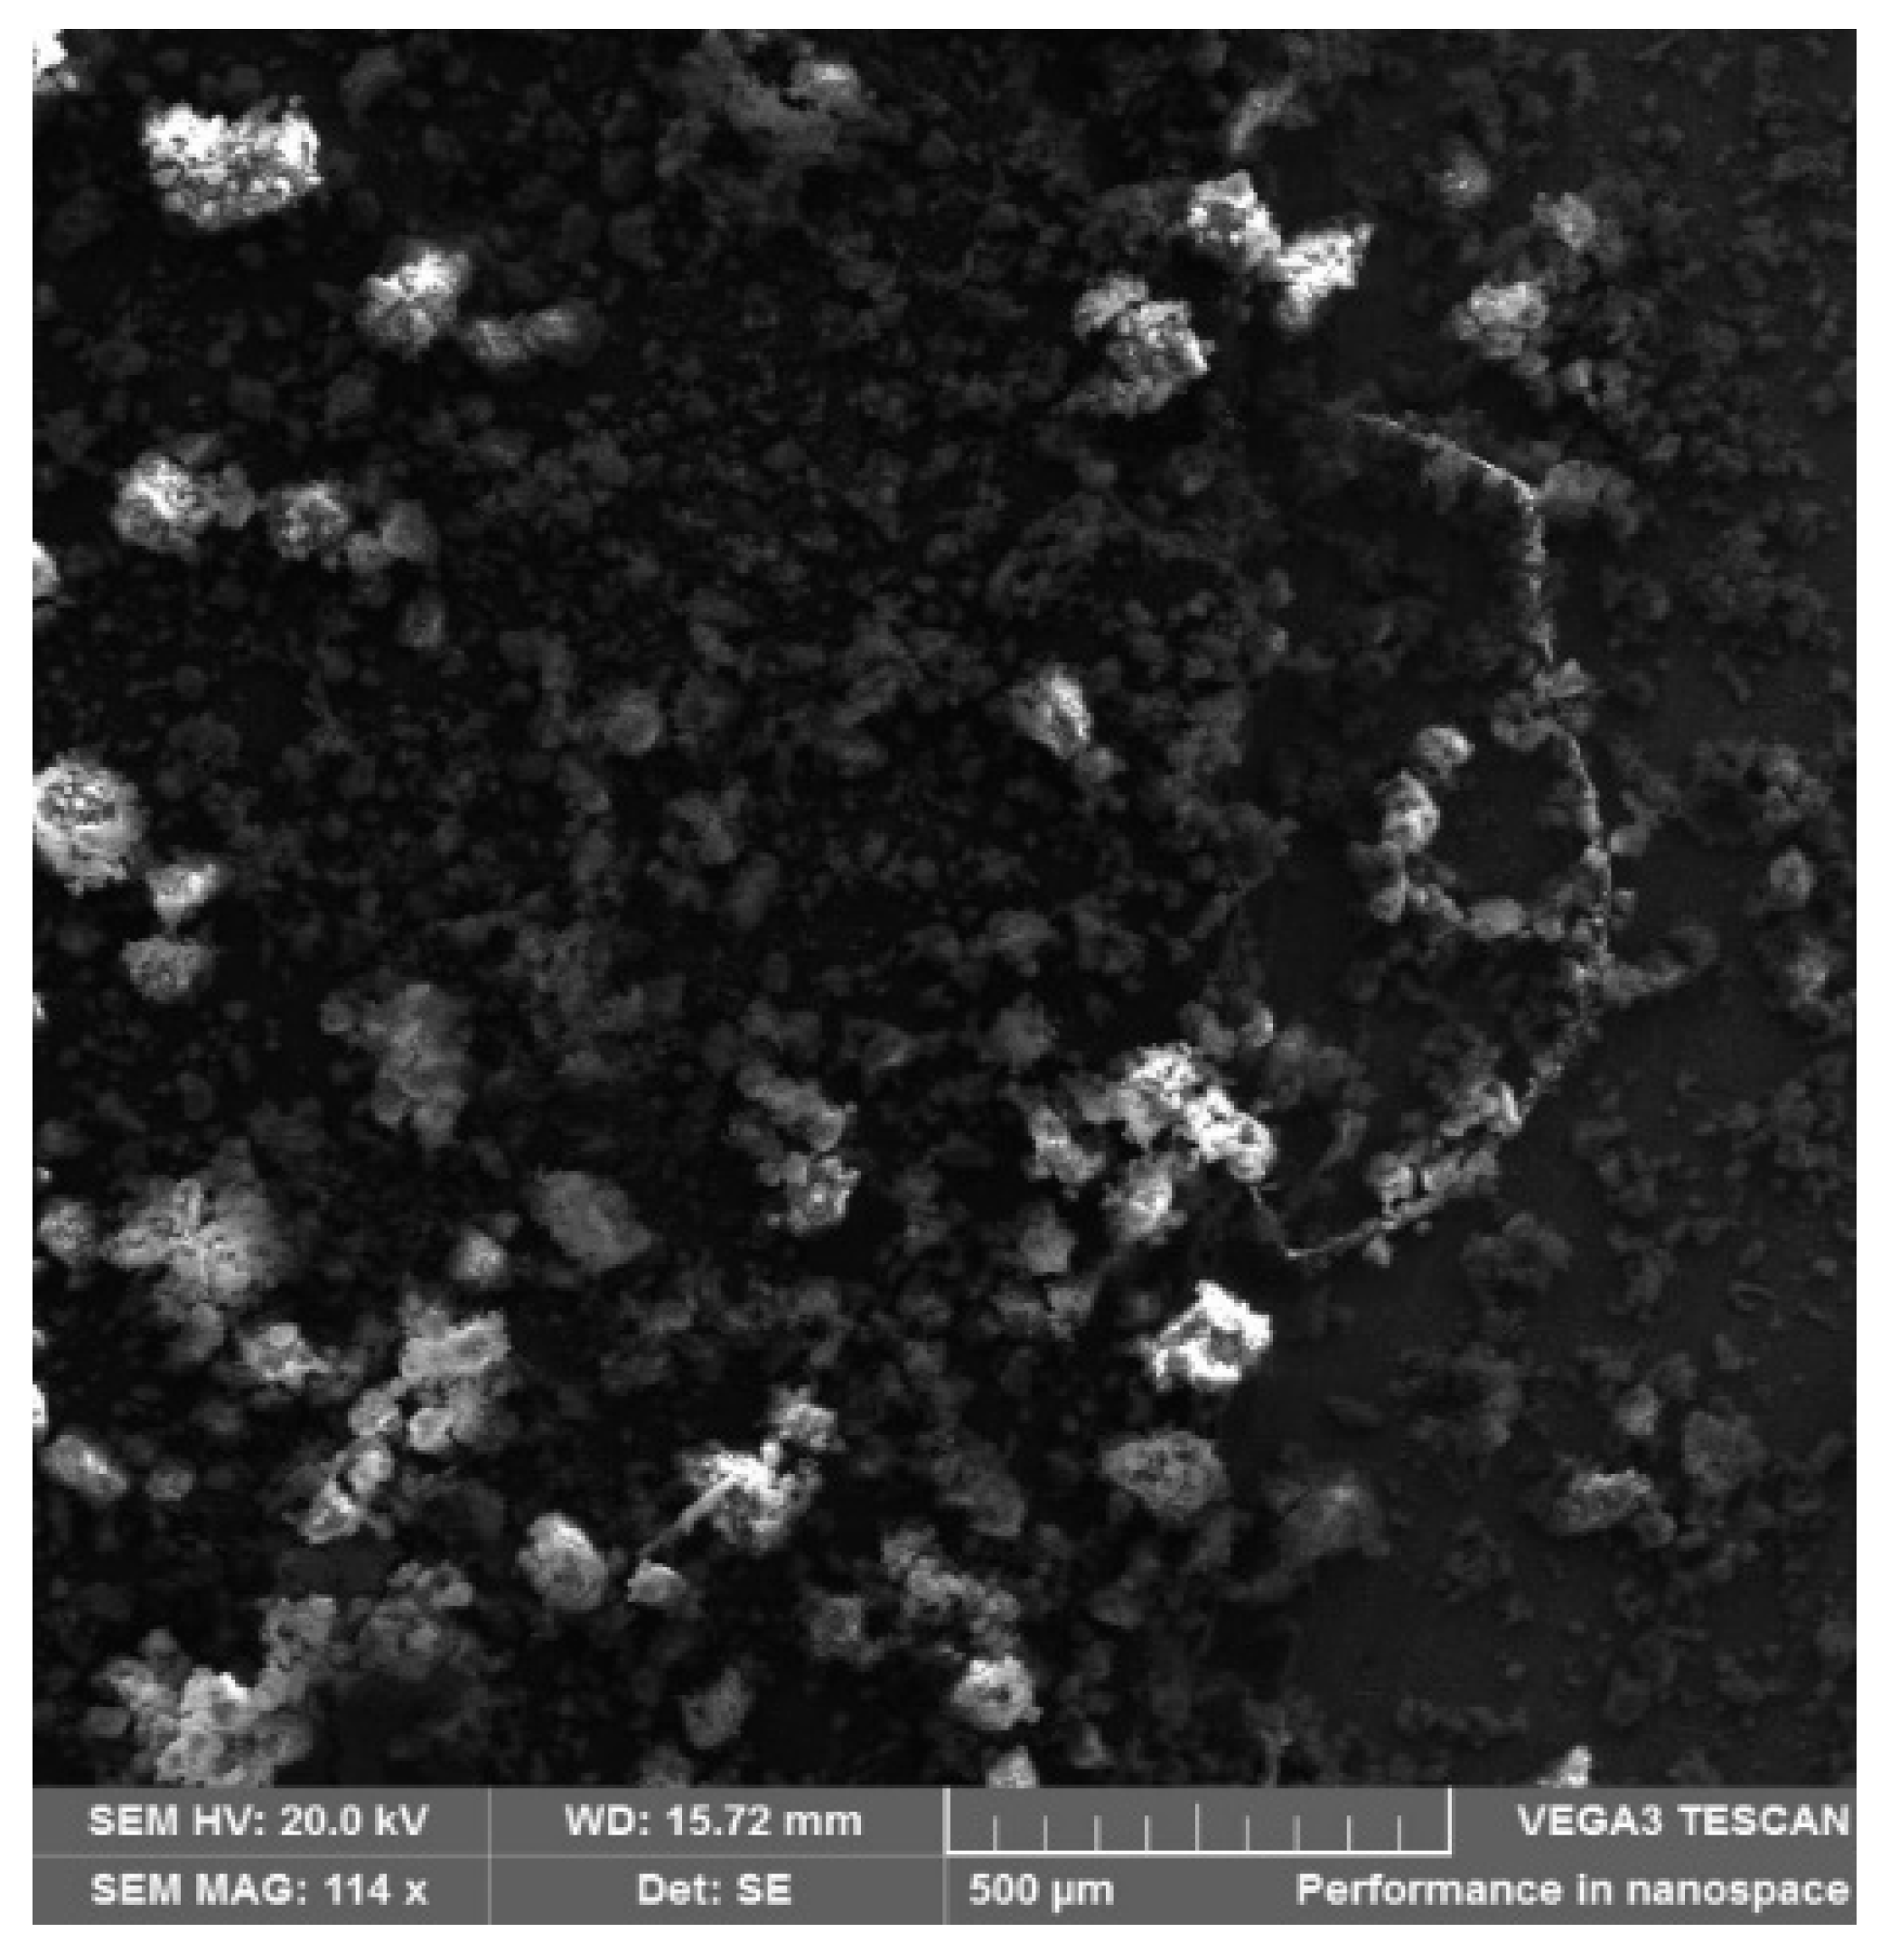
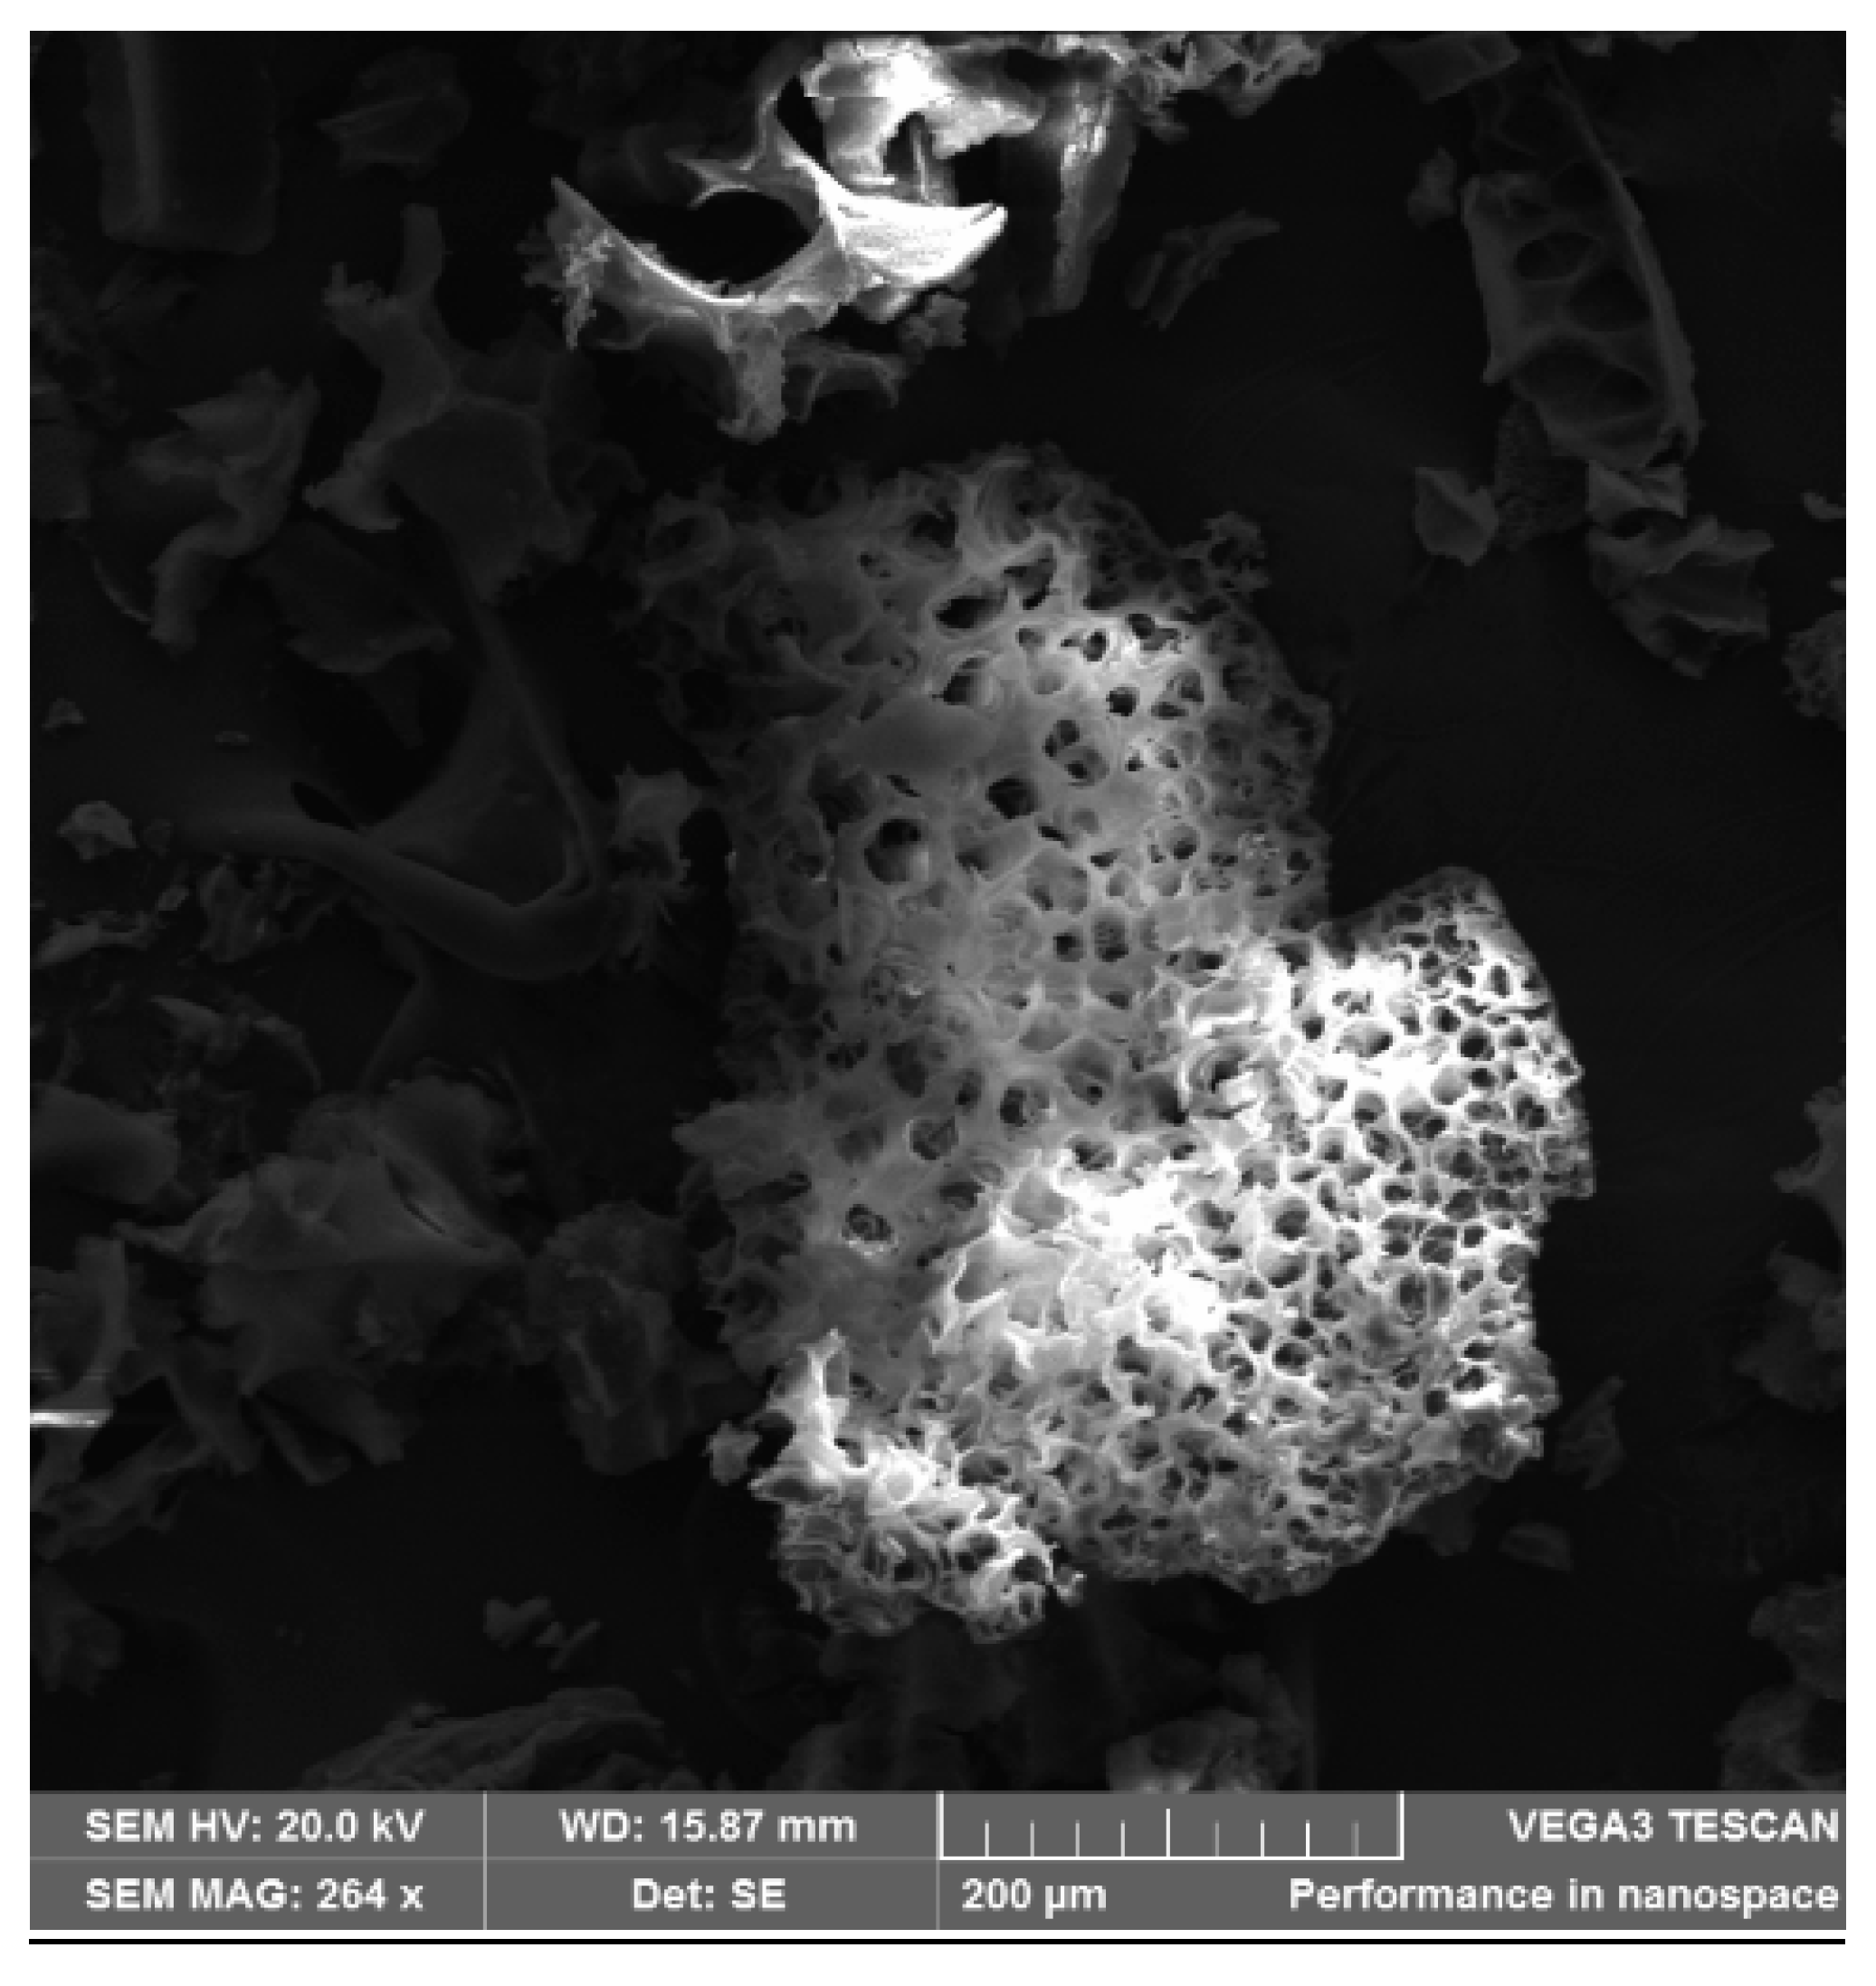
3.4.1. SEM Analysis of Raw PAN

An SEM analysis of crushed raw PAN was carried out to compare its structure once finely ground to that of the crushed mesoporous neat PAN monoliths. This comparison would indicate whether the porous nature of the fabricated mesoporous neat PAN monoliths has a major impact on the adsorptive capabilities of the material. If proved that both allowed for the same amount of metal ion uptake from the solution, it could then be argued that the raw PAN is favorable as it eliminates the time required for fabrication of the polymer and the cost. The SEM image in Figure 1 reveals the finely crushed texture of the raw PAN.
The powder seen in Figure 1 reveals a much finer powder than that of the crushed mesoporous neat PAN monoliths and therefore may have a larger surface area. The larger surface area of the crushed raw PAN was confirmed by BET analysis where it was seen to have a larger surface area in comparison to the crushed mesoporous neat PAN and composite polymer monoliths and discussed in detail in Section 3.4.10. A porous structure cannot be distinctly seen in Figure 1; however, analysis of the SEM images alone is not enough to determine whether the polymer is porous or not. Nitrogen adsorption and desorption, as well as BET and BJH analyses, are required.

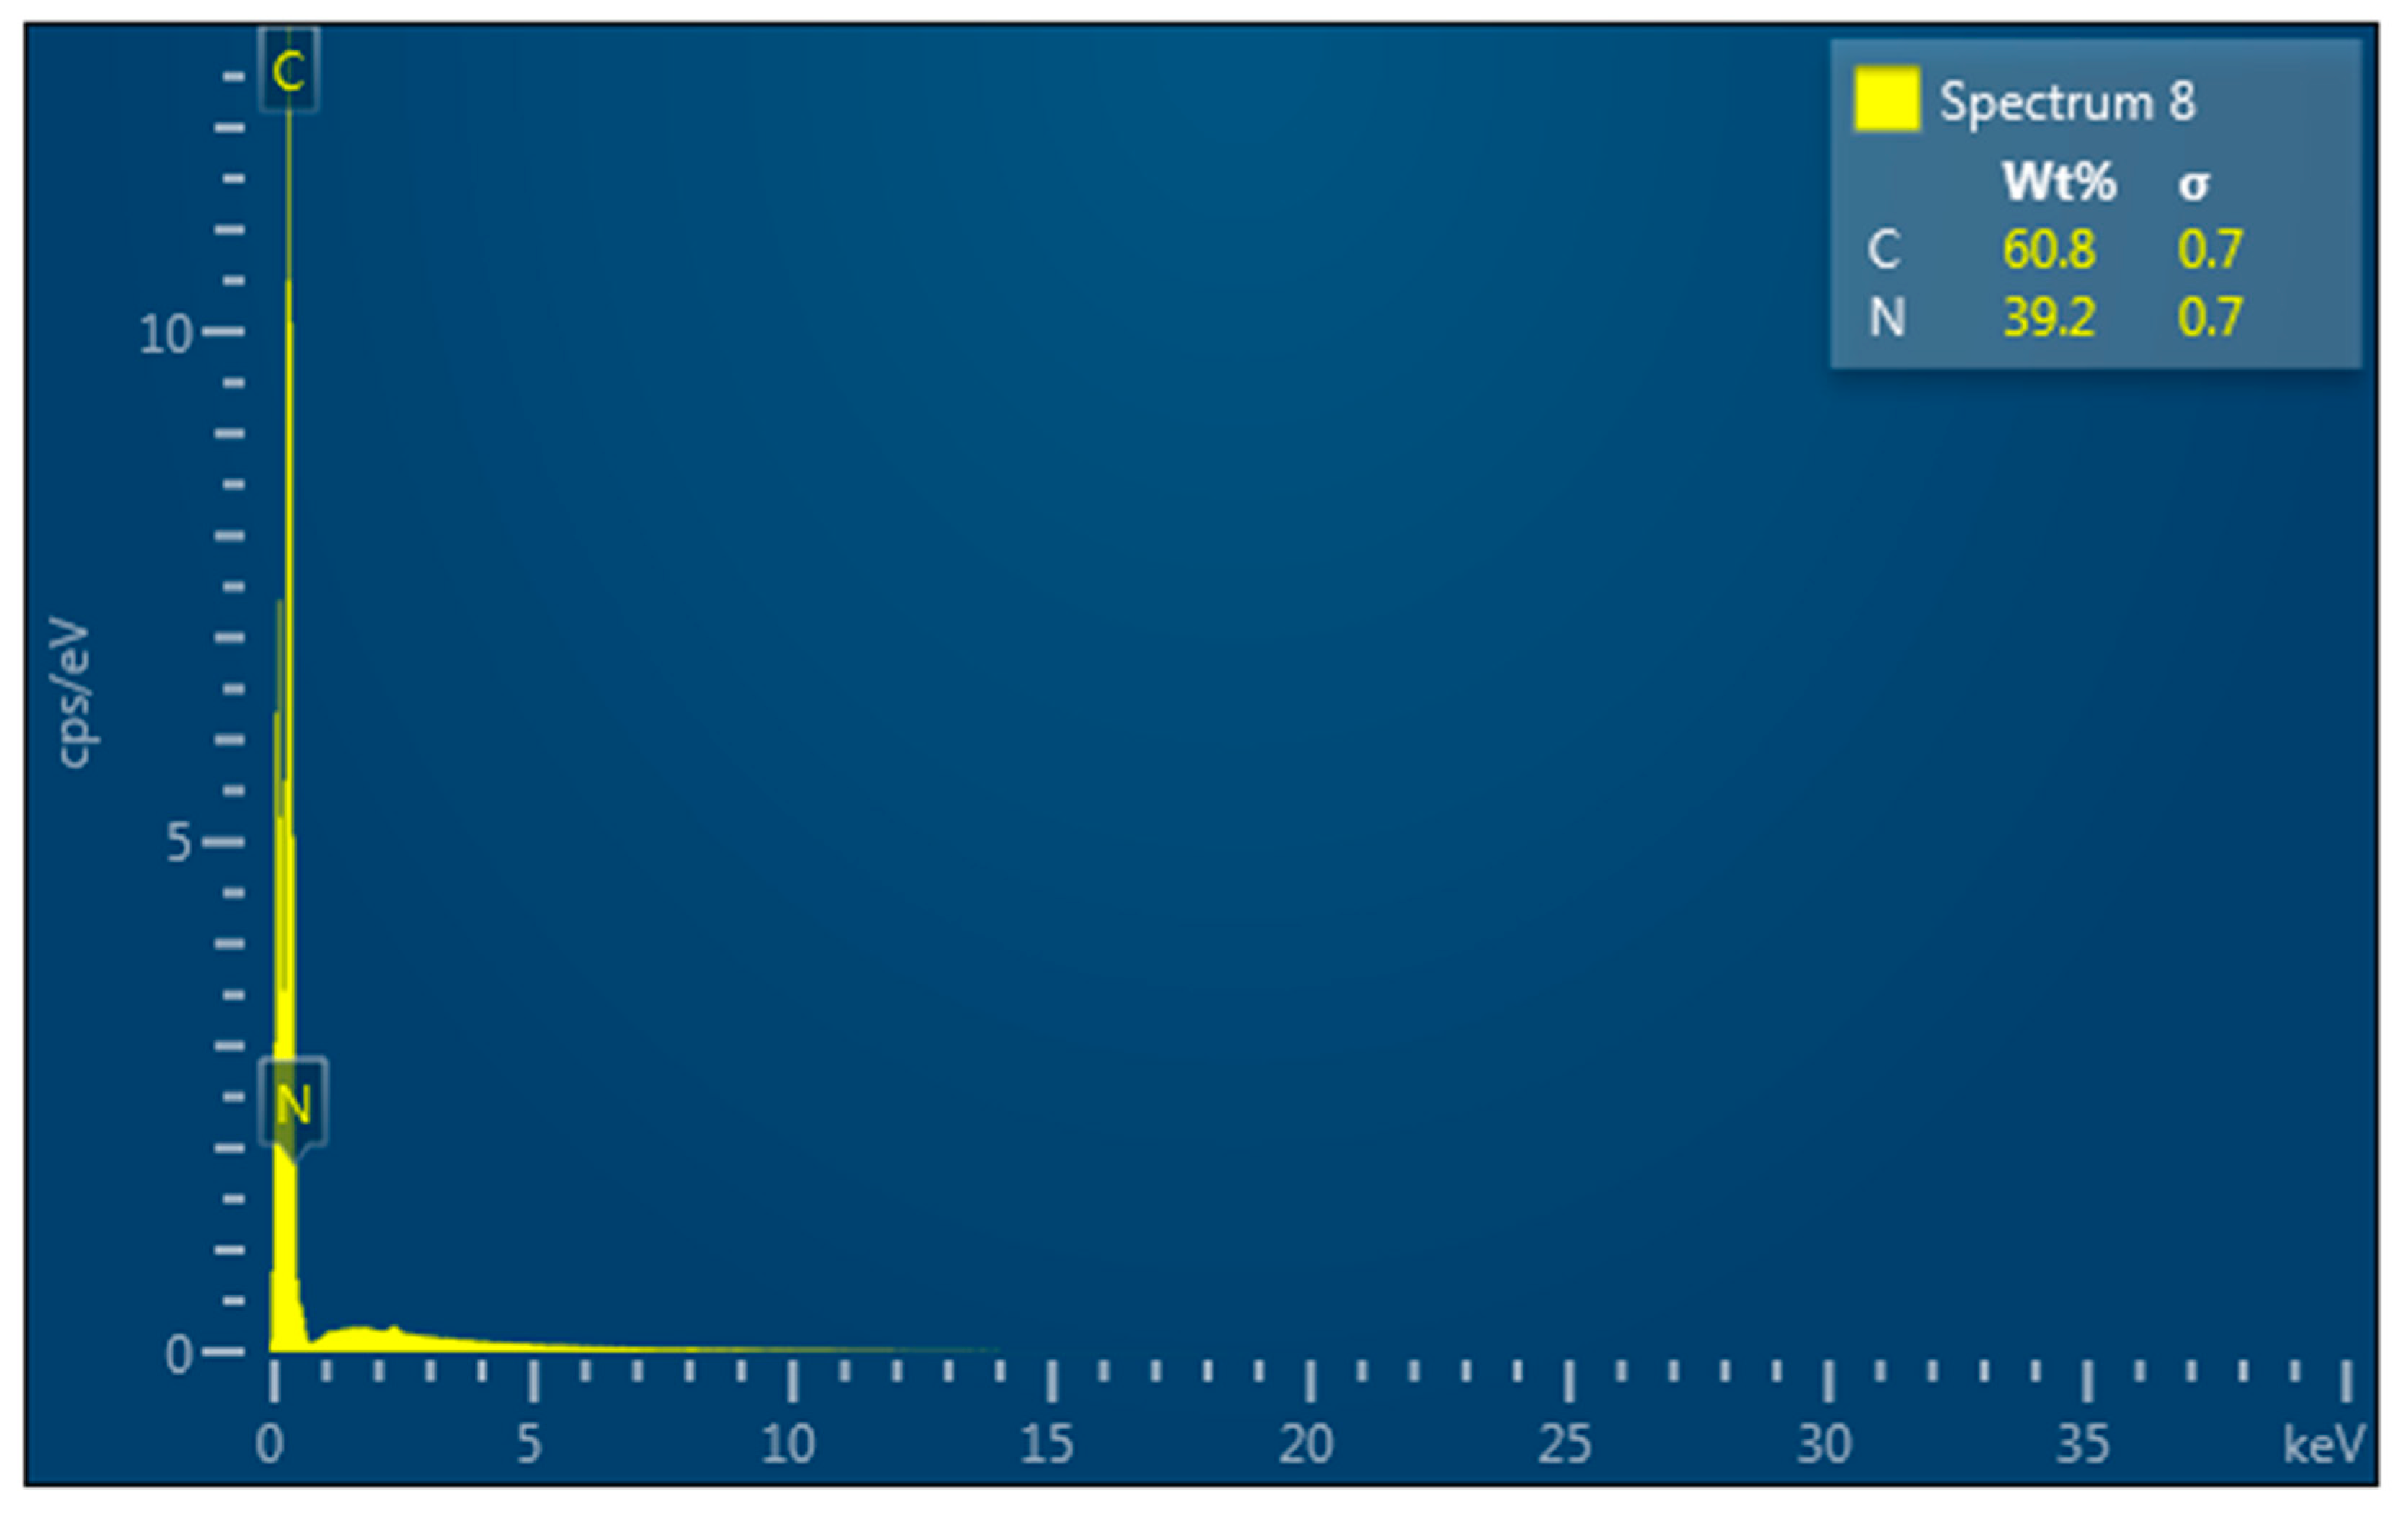
3.4.2. EDS Analysis of Raw PAN

It can be seen in the EDS analysis in Figure 2 that the elemental composition of raw PAN does not contain sulfur. This was expected as the raw PAN material did not come into contact with DMSO as it was not employed in the NIPS method. This may therefore prove to be advantageous during the adsorption studies as sulfur does not pose an obstacle or competitor for the binding of the metal ions to the nitrile groups.

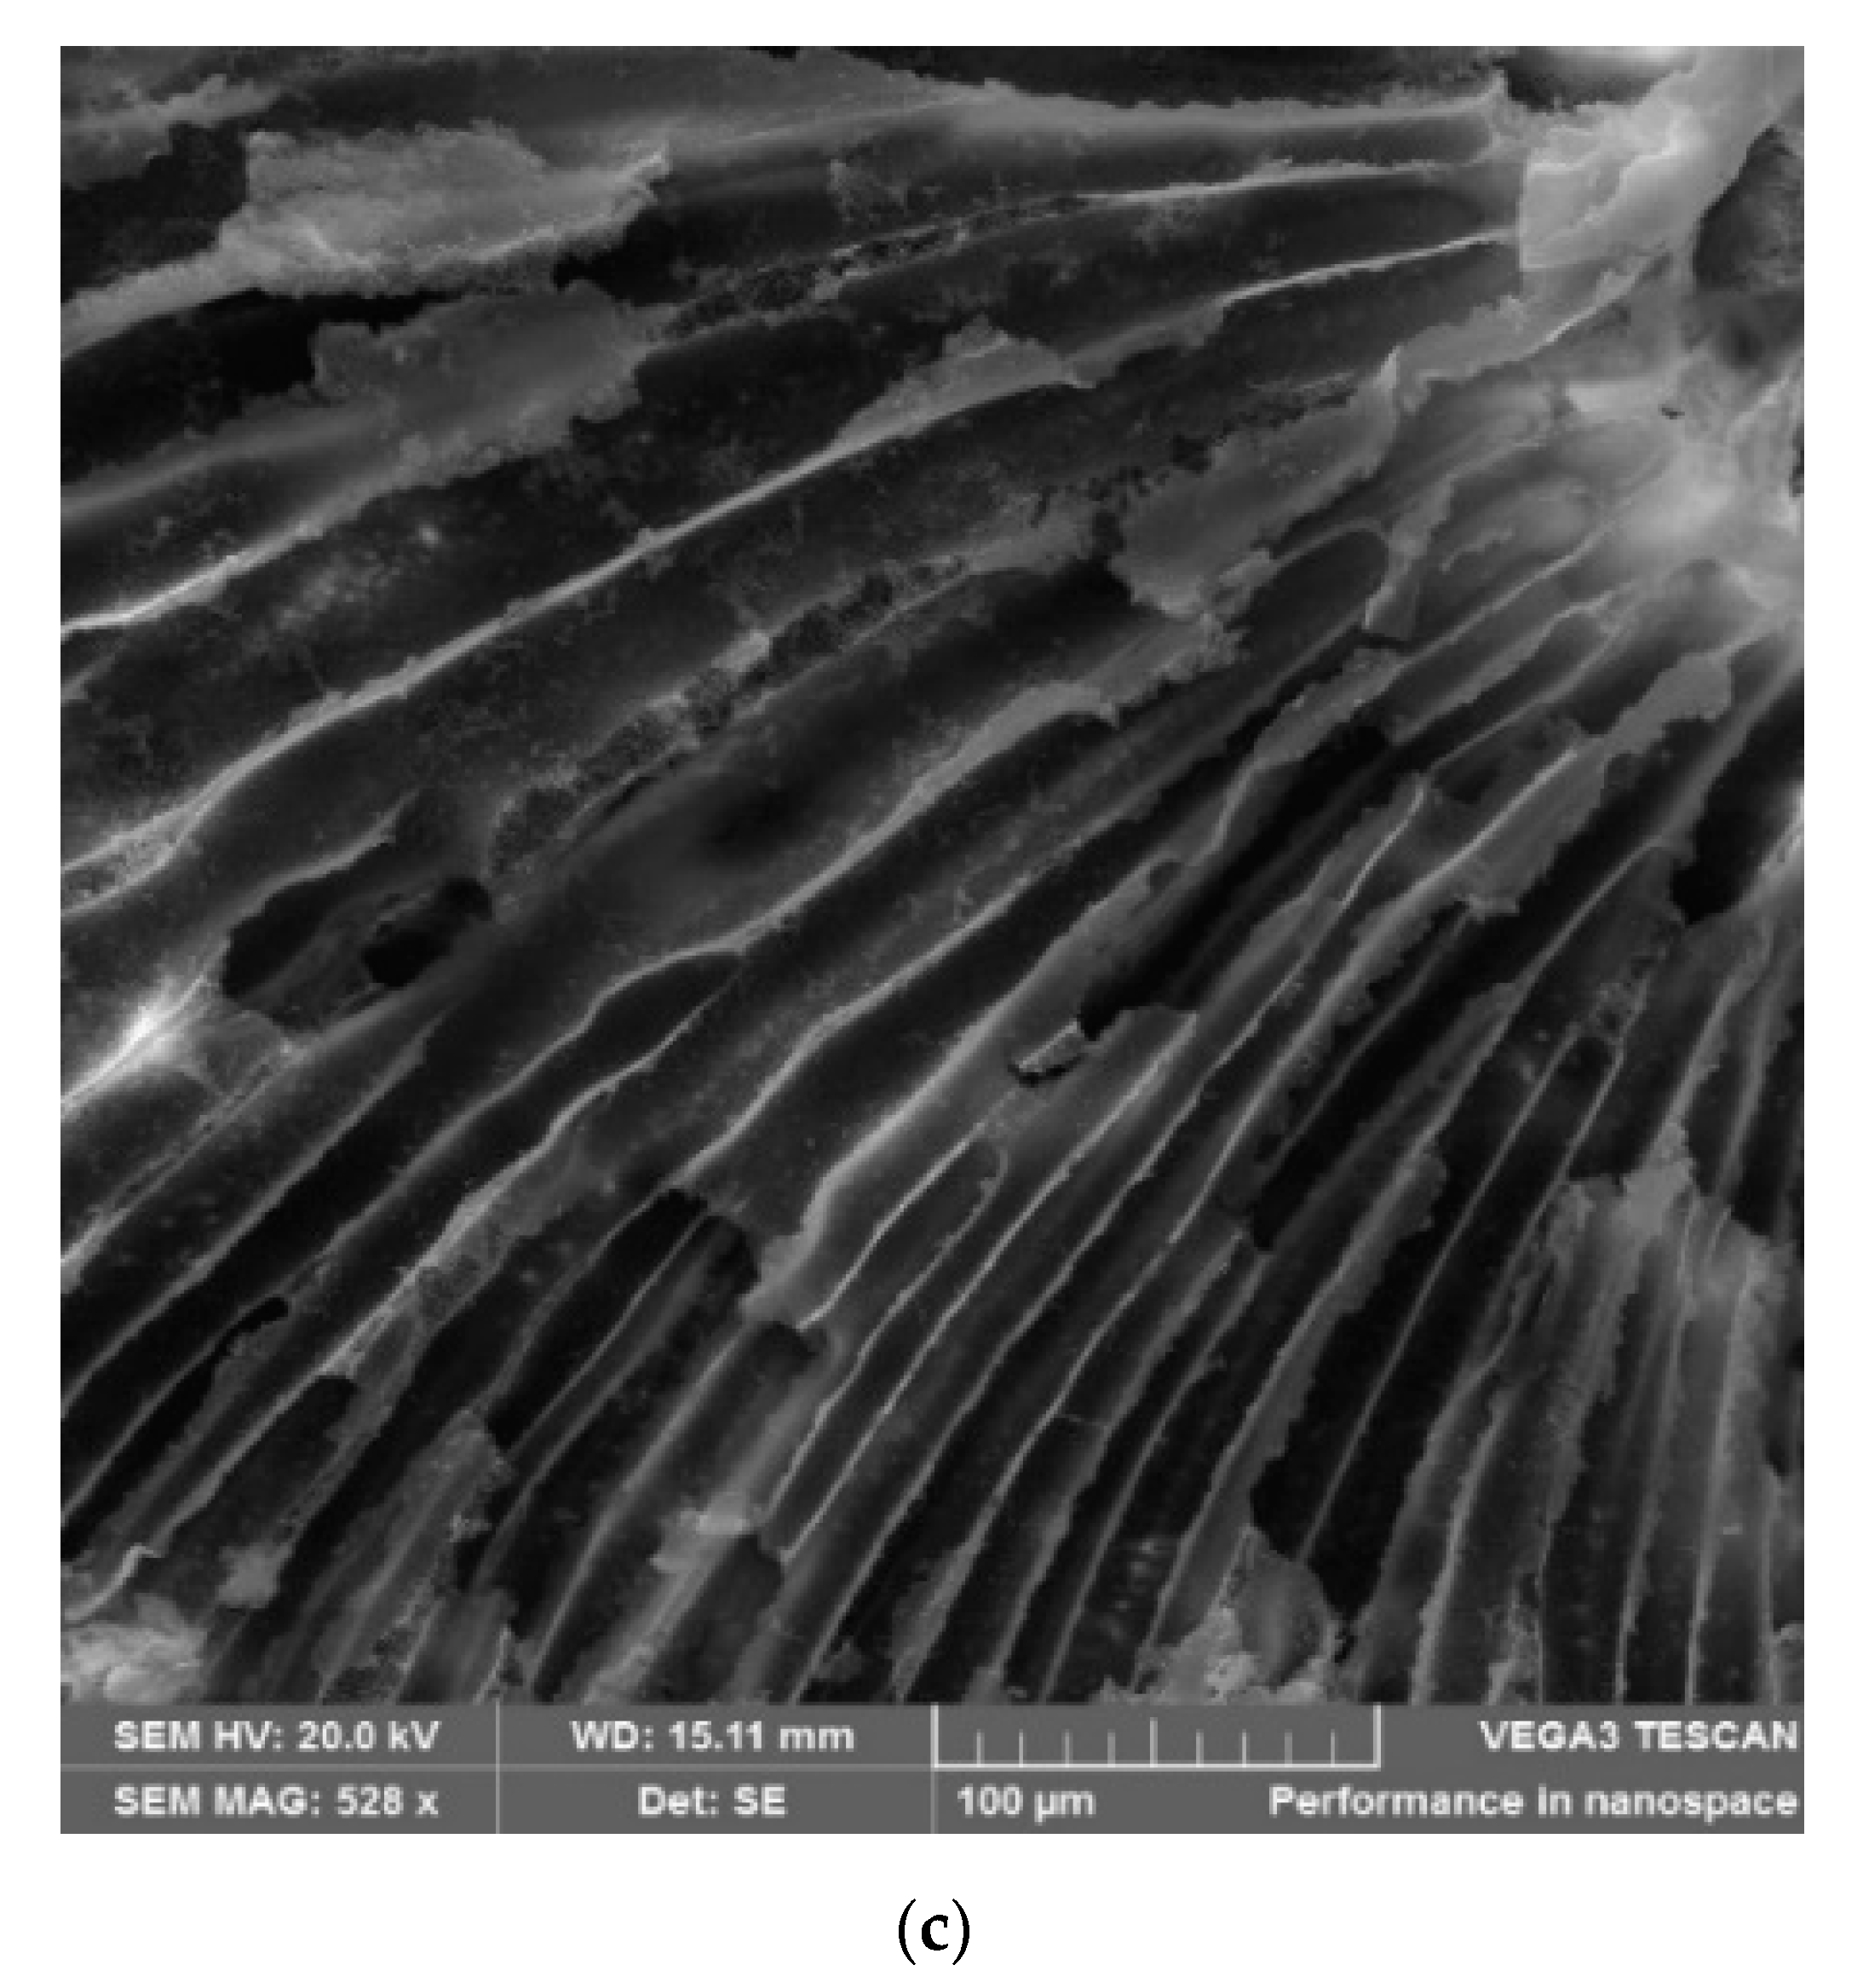
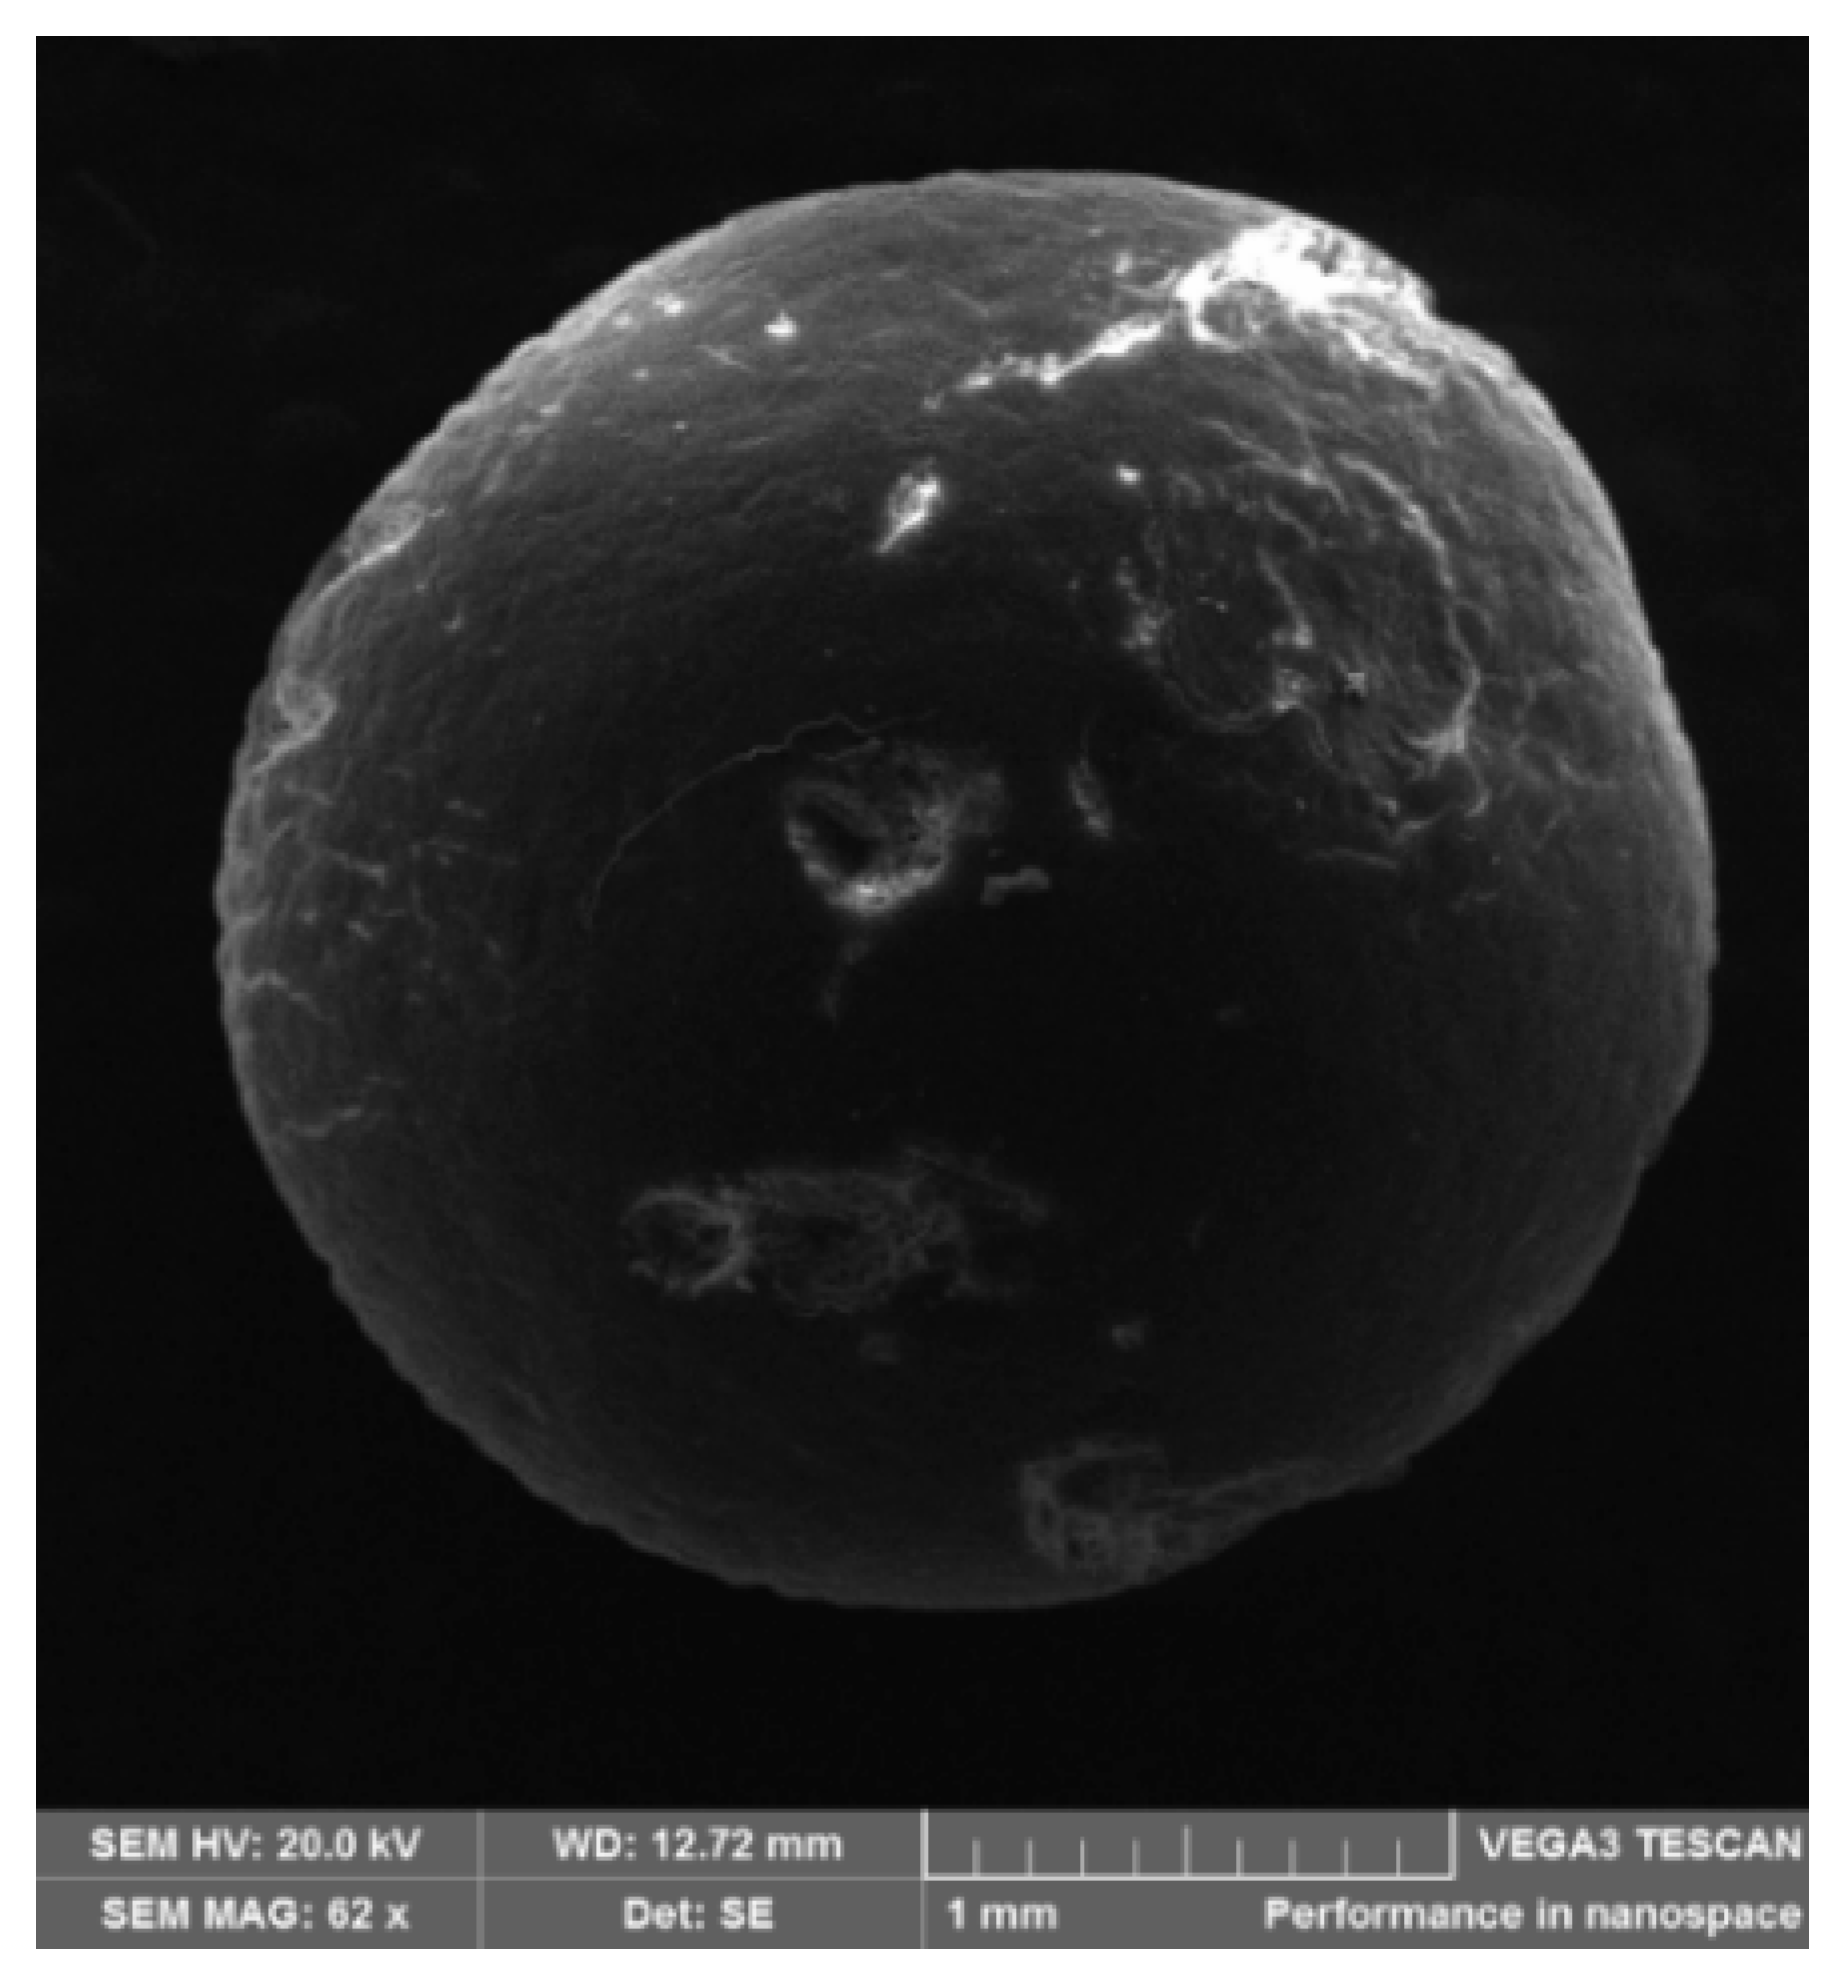
3.4.3. SEM Analysis of Mesoporous Neat PAN Monoliths

The SEM images in Figure 3a–c of a mesoporous neat PAN polymer monolith confirmed that the internal structure of the monolith was porous. Varying pore sizes can be seen distributed throughout the monolith. The fabricated porous network increases the surface area, binding capacity, and reactivity of the polymer monolith [20,21].
The SEM image in Figure 4 reveals that the fabricated monoliths consisted of a non-porous outer layer that has been previously reported in the literature [21]. It has been stated that rapid mixing between the solvent and the non-solvent in the coagulation bath, as well as rapid fluxes of these liquids through the polymer, may form a ‘skin’ [21]. Due to the formation of this non-porous outer layer, it was important to crush the polymer monoliths to allow for exposure of the internal porous network during the adsorption studies.

3.4.4. EDS Analysis of Mesoporous Neat PAN Monoliths

The EDS analysis as seen in Figure 5 shows the elemental composition of the mesoporous neat PAN monolith. Carbon, as well as nitrogen, were expected to be present since the structure of PAN is (C3H3N)n. The presence of sulfur, however, was not expected. This observation has been reported in the literature [22]. When PAN is dissolved in DMSO, dipole–dipole bonds form between the two molecules. Once water is introduced into the mixture, the sulfoxide groups in the DMSO begin to form hydrogen bonds with the water. The water simultaneously forms bonds with the nitrile groups of the PAN molecules. The dipole–dipole bonds between the PAN and DMSO molecules should break as the DMSO migrates into the coagulation bath and the water in the opposite direction, however, some DMSO molecules may remain bound [22].

3.4.5. SEM Analysis of Crushed Mesoporous Neat PAN Monoliths

There was an initial concern that the crushing of the mesoporous polymer monoliths would ultimately destroy its internal porous network. This would therefore have a direct impact on its increased surface area and reactivity. However, it can be seen in the SEM images in Figure 6a,b that this is not the case. Pieces of crushed polymer monoliths can be seen with their porous network still intact.

3.4.6. EDS Analysis of Crushed Mesoporous Neat PAN Monoliths

The amount of sulfur content in the crushed mesoporous neat PAN monoliths determined by the EDS analysis remained the same (2.7% of the mass) as for the whole/uncrushed PAN monoliths. This confirmed that the DMSO was chemisorbed and not physisorbed onto the PAN molecules as previously discussed.

3.4.7. SEM Analysis of Mesoporous Composite Polymer Monoliths

The SEM images in Figure 7a–c reveal that the mesoporous composite polymer monolith, like the mesoporous neat PAN monolith, has an internal porous network. As discussed for the mesoporous neat PAN monolith, this increases reactivity as well as binding capacity during the adsorption of metal ions from the solution [20,21].
Image c in Figure 7 reveals small pore tunnels moving vertically downward into larger pore tunnels, creating an intricate secondary porous network. This secondary network has been reported to further maximize the surface area, as well as the binding capacity [21]. The SEM analysis further revealed that like the mesoporous neat PAN monolith, it was found that the mesoporous composite monolith also consisted of a non-porous outer layer.

3.4.8. EDS Analysis of Mesoporous Composite Polymer Monoliths

The EDS analysis of the elemental composition of the mesoporous composite polymer monoliths revealed that sulfur chemisorbed to the nitrile and pyridine groups of the composite polymer monolith. It was found to consist of 2.2% of the total weight, similar to that found for the whole as well as the crushed mesoporous neat PAN monoliths.

3.4.9. SEM and EDS Analysis of Crushed Mesoporous Composite Polymer Monoliths

As observed with the crushed mesoporous neat PAN monoliths, the mesoporous composite monoliths also retained their porosity following crushing. This can be seen in Figure 8. This implies that both the crushed monolithic materials of PAN and the composite polymer should still exhibit the advantages of an interconnected porous network that includes an increased surface area, as well as reactivity, during the adsorption studies.
The EDS analysis of the elemental composition of the crushed composite polymer monoliths revealed that DMSO remained once again chemisorbed to the porous monoliths even after crushing was employed as the sulfur content remained 2.2% of the total weight.

3.4.10. BET and BJH Analysis

The pore size distribution, average pore size, and surface area of the three polymer materials, namely the raw PAN as well as the mesoporous neat PAN and composite polymer monoliths, were analyzed through nitrogen gas adsorption and desorption processes. The BET and BJH methods were employed for the quantification of the mentioned properties. Table 1 shows a comparison of the mean pore diameters and surface areas of the three different polymer materials. These structural characteristics may impact their respective adsorption capabilities and a comparison was therefore essential.
The obtained BET adsorption isotherms in Supplementary Figures S1–S3 revealed that all three polymer materials were mesoporous as they corresponded to a type IV isotherm as defined by the International Union of Pure and Applied Chemistry (IUPAC) [23]. All adsorption isotherms further revealed H1 type hysteresis loops, as defined by IUPAC, which corresponded to cylindrical-shaped pores in the monoliths [24]. Although all three materials were found to be mesoporous, the most commonly occurring pore diameter in each material differed greatly, with the pore sizes increasing as follows: mesoporous composite polymer monoliths ˂ mesoporous neat PAN monoliths ˂ raw PAN. The composite polymer monoliths having a smaller pore size in comparison to the mesoporous neat PAN monoliths correlates with findings in the literature, which reported an average pore size of 19.01 nm for the mesoporous composite polymer monoliths and an average pore size of 35.15 nm for the mesoporous neat PAN monoliths [25]. This can theoretically be explained through the comparison of the pendant group sizes of mesoporous neat PAN and the mesoporous composite polymer monoliths. The mesoporous neat PAN monoliths contain small, linear nitrile groups, whilst the mesoporous composite polymer monoliths contain both the nitrile groups of PAN as well as the larger and more bulky pyridine groups of P4VP. These pyridine groups occupy a larger space within the pore, decreasing the vacant space available, which in turn decreases the pore size.
The raw PAN was found to have a significantly larger surface area in comparison to both types of mesoporous polymer monoliths. This is because raw PAN could be crushed into a finer powder. Finely crushing the fabricated mesoporous polymer monoliths was difficult to achieve with the method that we employed. It therefore cannot be ruled out that the fabricated mesoporous polymer monoliths may have had a higher surface area had crushing been achieved to the same extent as the raw PAN.
The degree of adsorption of a specific PGM achieved by each of the three different polymer materials is not only determined by the surface of the material. It can also be influenced by other factors regarding the polymer material such as pore size and the type of functional groups present. It can be seen in Table 1 that the mesoporous composite polymer monoliths consisted of the smallest pore size in comparison to the raw PAN and mesoporous neat PAN monoliths. In fact, the pore sizes in Table 1 reveal the following trend: mesoporous composite polymer monolith < mesoporous neat PAN monolith < raw PAN, which agrees with the adsorption percentages achieved by these three materials for Rh(III). With regard to the type of functional groups present, PAN consists of soft nitrile groups, whilst P4VP consists of borderline/intermediate pyridine groups (according to the Lewis acid–base hardness and softness principle). Rh(III) is a borderline/intermediate Lewis acid and will therefore preferentially bind to the pyridine groups present in the mesoporous composite polymer monolith, which is what was observed.

3.4.11. Thermogravimetric Analysis (TGA)

The decomposition profiles, as seen in Supplementary Figure S4, for all three polymer materials were obtained to investigate their thermal stability and the appropriateness for their applicability in this study. The decomposition profiles revealed that all three polymer materials remained thermally stable over a wide temperature range and are therefore suitable for use in this study as they would not thermally decompose during their fabrication as well as during the adsorption studies. It can, however, be noted that the raw PAN exhibited greater thermal stability up to 300 °C in comparison to both types of mesoporous polymer monoliths.

3.5. Sorption Studies

3.5.1. Limit of Detection and Limit of Quantification

The LOD and LOQ values of the analytes of interest, which include Cr(VI), As(V), Ru(III), Rh(III), and Pd(II), were calculated to determine the sensitivity of the ICP-OES instrument. These values have been tabulated in Table 2. The LOD was reported with a 98.3% level of confidence and the LOQ was reported with an accuracy level of 20% of the relative standard deviation.
The LOD and LOQ values obtained for all 5 analytes of interest were in the sub-ppm level (Table 2), which implies that the method remained sensitive once the metal ion concentration decreased below the starting value of 1 mg·L−1 after the adsorption procedure. It is also worth noting that LOD and LOQ values at the sub-ppm level imply that low analyte concentrations in real water samples can easily be detected with this method and therefore the method is appropriate for application on real samples.
Table 2 further shows the coefficients of determination (R2) from the calibration curves constructed for each analyte. The calibration curves were constructed following ICP-OES analyses of five-point calibration standards of each analyte of interest in the range of 0 mg·L−1 to 1.5 mg·L−1. From the coefficients of determination, it is clear that the calibration curves showed good linearity over the abovementioned concentration range with R2 values varying from 0.9994 to 1.00.

3.5.2. Percent Relative Standard Deviation

The %RSD values were calculated by using the mean and standard deviation values obtained from triplicate analysis of each analyte sample following the adsorption procedure. The average analyte concentration following adsorption, the standard deviation, and the %RSD values have been tabulated in Table 3.
From Table 3, it can be seen that the %RSD values for the analytes Cr(VI), As(V), and Rh(III) were found to be within an acceptable range and the method, therefore, displays good precision. The %RSD calculations were not carried out for the analytes Ru(III) and Pd(II) as the concentrations for these analytes were found to be below the LOD of the instrument, as 100% adsorption was achieved for these analytes by all three polymer materials.

3.5.3. Adsorption of the PGMs

The percentage adsorption of 1 mg·L−1 of Ru(III), Rh(III), and Pd(II) from solution by the three various polymer materials, namely the raw PAN, the mesoporous neat PAN, and the composite polymer monoliths, can be seen in Figure 9. Complete adsorption of Ru(III), as well as Pd(II) ions from solution was achieved by all three polymer materials, which infers that the Lewis acid–base interactions, as well as the pH of the solutions, were favorable for their adsorption.
The adsorption capacities for Rh(III) ions by the three different polymer materials can be ordered as follows: raw PAN ˂ mesoporous neat PAN monoliths ˂ mesoporous composite polymer monoliths. This trend can be seen in Figure 9. This trend infers that a porous material allows for greater Rh(III) uptake in comparison to the raw PAN material. It was therefore observed that the porous network promotes the reactivity and binding capacity of Rh(III) ions. Furthermore, Rh(III) is a borderline acid [26] and will therefore bind more favorably to the pyridine groups in the mesoporous composite polymer monoliths, which therefore explains the higher adsorption capability of the composite polymer monolith as seen in the abovementioned trend.
Ru(III) was found to be completely absorbed by all three polymer materials; however, Rh(III) was not. Since both Ru(III) and Rh(III) are borderline acids [26], the failure of Rh(III) to completely adsorb out of solution cannot be explained through Lewis acid–base interactions. Since the pH of the metal solutions were all adjusted to pH 4, it is possible that although this pH promotes the complete adsorption of Ru(III), it may partly hinder the adsorption of Rh(III). It was reported in a study regarding the adsorption of Rh(III) and Pd(II) onto shale that the maximum uptake of Pd(II) was promoted by an acidic solution (pH 2–4). The maximum uptake of Rh(III), however, occurred at a neutral pH (7) with only 51% uptake occurring at pH 4 [27]. It is, therefore, possible that adjustment of the pH of the standard solution of Rh(III) to a higher value may promote complete adsorption of the ions out of the solution.
The impact of pH on adsorption studies has been reported in the literature. The pH of the standard metal solution is a major variable affecting the adsorption of metal ions from the solution. It has been considered that at a low pH the hydrogen ions in the solution may undergo competition with the metal ions for binding opportunities to the active sites on the adsorbent [28]. If the hydrogen ions are capable of binding to the active sites first, it causes steric hindrance, blocking the metal ions from binding [29]. It may also be a possibility that the chemisorbed sulfur, as seen in the EDS analysis of the mesoporous polymer monoliths, prevented the complete adsorption of Rh(III) from the solution.
It should be noted that for the uptake of Ru(III) and Pd(II), the use of the raw PAN is favorable. Since it is capable of 100% uptake of these metals, the fabrication of mesoporous polymer monoliths is not necessary. This allows for a more cost- and time-efficient removal of these two PGMs in comparison to the fabricated mesoporous polymer monoliths.

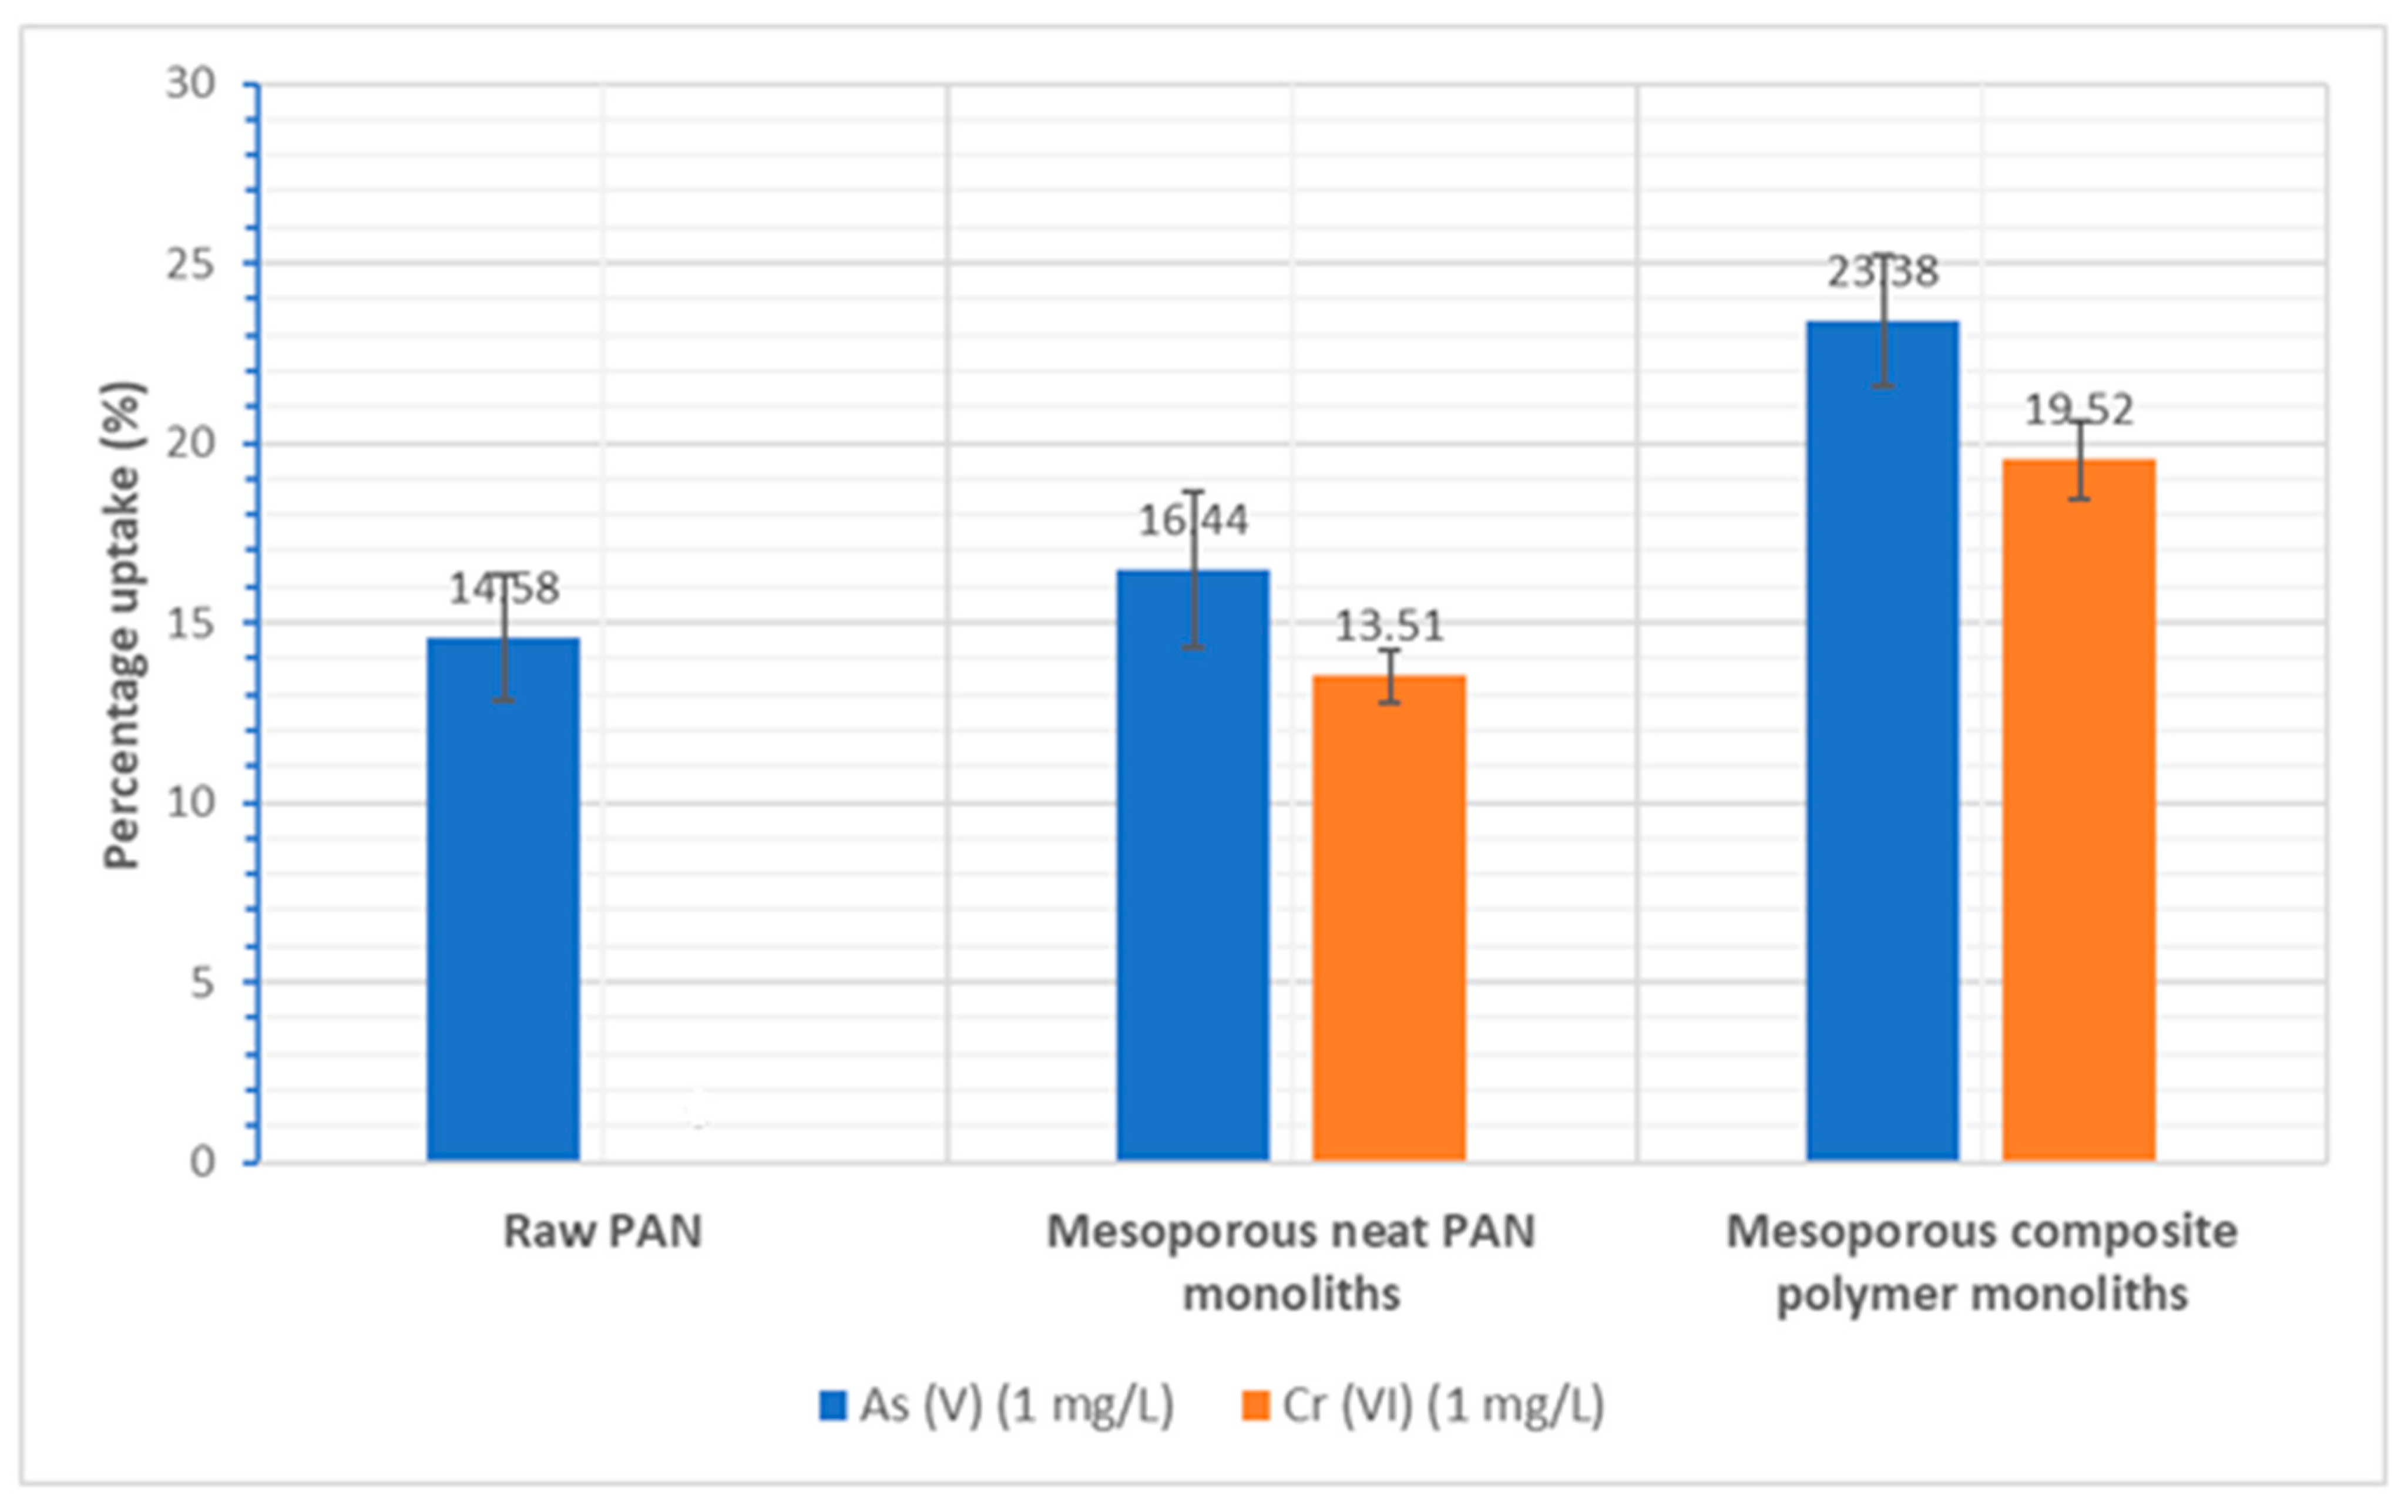
3.5.4. Adsorption of Arsenic(V) and Chromium(VI)

Figure 10 shows the percentage adsorption of 1 mg·L−1 of As(V) and Cr(VI) by the three different polymer materials. The adsorption percentages of both As(V) and Cr(VI) by all three polymer materials were low. Considering Lewis acid–base interactions, both As(V) and Cr(VI) are hard acids [26]. Neither of the metal ions will therefore favor binding to the soft nitrile groups, but may favor binding to the borderline pyridine groups [26]. This is confirmed by the observation that the composite polymer monoliths displayed the highest adsorption capacity for both these metal ions. It was further found that a decrease in the pore size of the material allowed for a higher uptake of both metal ions, where the trend was found to be raw PAN ˂ mesoporous neat PAN monoliths ˂ mesoporous composite polymer monoliths. This further confirms the higher adsorption capacity displayed by the composite polymer monoliths.
A smaller pore diameter in the composite polymer monolith implies that the pendant groups of the polymer are packed together closely. This is advantageous for two reasons: Firstly, it hinders the metal ion from migrating through the pores, subsequently trapping it. Secondly, it allows for the pendant functional group to undergo complexation with more than one metal, which leads to the formation of a more stable complex.

4. Conclusions

In conclusion, mesoporous neat PAN polymer monoliths, as well as mesoporous composite polymer monoliths, were successfully fabricated and characterized with the use of SEM and EDS analyses as well as the BET and BJH methods. The TGA evaluation of all three polymer materials revealed that they were thermally stable over a wide temperature range and were therefore suitable for the NIPS fabrication method as well as sorption studies. The composite polymer monoliths were found to have a significantly smaller pore size in comparison to the mesoporous neat PAN monoliths which, in addition to its multi-pendant group composition, enhanced its adsorption capacity.
A concentration of 1 mg·L−1 of Ru(III) and Pd(II) was found to be completely adsorbed by all three polymer materials. The future use of raw PAN is therefore favorable as it is cheaper and more time efficient. The mesoporous composite polymer monoliths were found to have the greatest adsorption capacity for Rh(III), As(V), and Cr(VI) in comparison to the other two polymer materials.
The three polymer materials revealed a great overall potential for their use as wastewater cleaning aids as well as remediators of precious metals. The current study mainly focused on developing proof of concept for adsorption of the three PGMs from simulated aqueous solutions using the polymer materials. To understand the mechanism of the adsorption process, a more detailed study including the adsorption-desorption (regeneration) experiment, as well as an investigation that focuses on kinetic models and isotherm models, is recommended for future studies. Further characterization using techniques such as Fourier-transform infrared (FTIR) spectroscopy is recommended to identify whether the adsorption occurs by Lewis acid–base interactions of the metal ions with the polymer materials or the metal ions are sitting in the cavities/tunnels of the monoliths. Based on the literature, a contact time of 3 h was used for adsorption in this study. To determine the time required to reach adsorption equilibrium for each metal ion, further optimization of the contact time should be carried out in future studies. These will provide insights on adsorption mechanism(s) of metal ions using the polymer materials.

Supplementary Materials

The following are available online at https://www.mdpi.com/article/10.3390/min11080884/s1, Figure S1: BET adsorption isotherm for crushed unfabricated neat PAN, Figure S2: BET adsorption isotherm for crushed unfabricated neat PAN, Figure S3: BET adsorption isotherm of crushed composite polymer monoliths, Figure S4: TGA curve representing the weight loss (%) of unfabricated raw PAN, mesoporous neat PAN and mesoporous composite polymer monoliths over a temperature range of 25 °C to 650 °C.

Author Contributions

Conceptualization, K.E.L. and O.Z.; methodology, K.E.L. and O.Z.; validation, K.E.L. and O.Z.; formal analysis, K.E.L.; investigation, K.E.L. and O.Z.; resources, A.A.A. and O.Z.; data curation, K.E.L., O.Z. and A.A.A.; writing—original draft preparation, K.E.L.; writing—review and editing, K.E.L., A.A.A. and O.Z.; visualization, K.E.L. and O.Z.; supervision, O.Z.; project administration, O.Z.; funding acquisition, A.A.A. and O.Z. All authors have read and agreed to the published version of the manuscript.

Funding

This work has been funded by the University of Johannesburg Research Centre for Synthesis and Catalysis.

Data Availability Statement

Not applicable.

Acknowledgments

The Central Analytical Facility of the Faculty of Science (Spectrum), University of Johannesburg is acknowledged for use of their facilities.

Conflicts of Interest

The authors declare no conflict of interest. The funders had no role in the design of the study; in the collection, analyses, or interpretation of data; in the writing of the manuscript; or in the decision to publish the results.

References

  1. Meissner, R.; Steyn, M.; Moyo, E.; Shadung, J.; Masangane, W.; Nohayi, N.; Jacobs-Mata, I. South African local government perceptions of the state of water security. Environ. Sci. Policy 2018, 87, 112–127. [Google Scholar] [CrossRef]
  2. Nthunya, L.N.; Masheane, M.L.; Malinga, S.P.; Nxumalo, E.N.; Mamba, B.; Mhlanga, S.D. Determination of toxic metals in drinking water sources in the Chief Albert Luthuli Local Municipality in Mpumalanga, South Africa. Phys. Chem. Earth 2017, 100, 94–100. [Google Scholar] [CrossRef]
  3. Carolin, C.F.; Kumar, P.S.; Saravanan, A.; Joshiba, G.J.; Naushad, M. Efficient techniques for the removal of toxic heavy metals from aquatic environment: A review. J. Environ. Chem. Eng. 2017, 5, 2782–2799. [Google Scholar] [CrossRef]
  4. Won, S.W.; Kotte, P.; Wei, W.; Lim, A.; Yun, Y.-S. Biosorbents for recovery of precious metals. Bioresour. Technol. 2014, 160, 203–212. [Google Scholar] [CrossRef] [PubMed]
  5. Nancharaiah, Y.; Mohan, S.V.; Lens, P.N.L. Biological and Bioelectrochemical Recovery of Critical and Scarce Metals. Trends Biotechnol. 2016, 34, 137–155. [Google Scholar] [CrossRef] [PubMed]
  6. Musina, A.; Bocokic, V.; Lavric, V.; van Zutphen, S. Phosphorus-Based Polymers for Selective Capture of Platinum Group Metals. Ind. Eng. Chem. Res. 2014, 53, 13362–13369. [Google Scholar] [CrossRef]
  7. Dodson, J.; Parker, H.L.; García, A.M.; Hicken, A.; Asemave, K.; Farmer, T.; He, H.; Clark, J.H.; Hunt, A.J. Bio-derived materials as a green route for precious & critical metal recovery and re-use. Green Chem. 2015, 17, 1951–1965. [Google Scholar] [CrossRef]
  8. Morcali, M.H.; Zeytuncu, B. Investigation of adsorption parameters for platinum and palladium onto a modified polyacrylonitrile-based sorbent. Int. J. Miner. Process. 2015, 137, 52–58. [Google Scholar] [CrossRef]
  9. Ehrlich, H.V.; Buslaeva, T.M.; Maryutina, T.A. Trends in Sorption Recovery of Platinum Metals: A Critical Survey. Russ. J. Inorg. Chem. 2017, 62, 1797–1818. [Google Scholar] [CrossRef]
  10. Hsini, A.; Benafqir, M.; Naciri, Y.; Laabd, M.; Bouziani, A.; Ez-Zahery, M.; Lakhmiri, R.; El Alem, N.; Albourine, A. Synthesis of an arginine-functionalized polyaniline@FeOOH composite with high removal performance of hexavalent chromium ions from water: Adsorption behavior, regeneration and process capability studies. Colloids Surf. A 2021, 617, 126274. [Google Scholar] [CrossRef]
  11. Lim, A.; Song, M.-H.; Cho, C.-W.; Yun, Y.-S. Development of Surface-Modified Polyacrylonitrile Fibers and Their Selective Sorption Behavior of Precious Metals. Appl. Sci. 2016, 6, 378. [Google Scholar] [CrossRef] [Green Version]
  12. Pan, G.R.G.Y.; Li, M.; Hoek, E.M.V. Preparation and Characterization of Membranes Formed by Nonsolvent In-duced Phase Separation: A Review. Ind. Eng. Chem. Res 2011, 50, 3798–3817. [Google Scholar] [CrossRef]
  13. Mphanje, K.; Zinyemba, O.; Darkwa, J. Fabrication of nitrogen donor macro- and meso-porous materials for group 11 metal ions sorption. S. Afr. J. Chem. 2018, 71, 94–102. [Google Scholar] [CrossRef] [Green Version]
  14. da Silva, I.J.; Lavorante, A.F.; Paim, A.P.; da Silva, M.J. Microwave-assisted digestion employing diluted nitric acid for mineral determination in rice by ICP OES. Food Chem. 2020, 319, 126435. [Google Scholar] [CrossRef]
  15. Skoog, D.A.; West, D.M.; Holler, F.J.; Crouch, S.R. Fundamentals of Analytical Chemistry; Brooks/Cole Cengage Learning: Belmont, CA, USA, 2014; pp. 109, 186–187. [Google Scholar]
  16. Armbruster, D.A.; Pry, T. Limit of Blank, Limit of Detection and Limit of Quantitation. Clin. Biochem. Rev. 2008, 29, S49. [Google Scholar]
  17. Schwarz, G.; Bäumler, S.; Block, A.; Felsenstein, F.G.; Wenzel, G. Determination of detection and quantification limits for SNP allele frequency estimation in DNA pools using real time PCR. Nucleic Acids Res. 2004, 32, 24e. [Google Scholar] [CrossRef] [PubMed] [Green Version]
  18. Xin, Y.; Fujimoto, T.; Uyama, H. Facile fabrication of polycarbonate monolith by non-solvent induced phase separation method. Polymer 2012, 53, 2847–2853. [Google Scholar] [CrossRef]
  19. Shao, J.; Chen, C.; Wang, Y.; Chen, X.; Du, C. Structure and surface nanomechanics of poly(l-lactide) from thermally in-duced phase separation process. Appl. Surf. Sci. 2012, 258, 6665–6671. [Google Scholar] [CrossRef]
  20. Li, W.; Wu, Z.; Wang, J.; Elzatahry, A.A.; Zhao, D. A Perspective on Mesoporous TiO2 Materials. Chem. Mater 2014, 26, 287–298. [Google Scholar] [CrossRef]
  21. Nguyen, A.M.; Nordborg, A.; Shchukarev, A.; Irgum, K. Thermally induced dissolution/precipitation—A simple approach for the preparation of macroporous monoliths from linear aliphatic polyamides. J. Sep. Sci. 2009, 32, 2619–2628. [Google Scholar] [CrossRef]
  22. Vettegren, V.I.; Kulik, V.B.; Savitskii, A.V.; Fetisov, O.I.; Usov, V.V. Molecular mechanism of gelation upon the addition of water to a solution of poly(acrylonitrile) in dimethylsulfoxide. Tech. Phys. 2010, 55, 743–746. [Google Scholar] [CrossRef]
  23. Sing, K.S.W. Reporting Physisorption Data for Gas/Solid Systems with Special Reference to the Determination of Surface Area and Porosity. IUPAC Commission on Colloid and Surface Chemistry Including Catalysis. Pure Appl. Chem. 1985, 57, 603–619. [Google Scholar] [CrossRef]
  24. Alothman, Z.A. A Review: Fundamental Aspects of Silicate Mesoporous Materials. Materials 2012, 5, 2874–2902. [Google Scholar] [CrossRef] [Green Version]
  25. Mphanje, K. Polymeric Nitrogen Donor Macro(meso)porous Sorption Materials for Selected Transition Metals. Master’s Thesis, University of Johannesburg, Johannesburg, South Africa, 2014. [Google Scholar]
  26. Pearson, R.G. Hard and soft acids and bases, HSAB, part 1: Fundamental principles. J. Chem. Educ. 1968, 45. [Google Scholar] [CrossRef]
  27. Koshcheeva, I.Y.; Kubrakova, I.V.; Korsakova, N.V.; Tyutyunnik, O.A. Solubility and migration ability of rhodium in natural conditions: Model experimental data. Geochem. Int. 2016, 54, 624–632. [Google Scholar] [CrossRef]
  28. Mavhungu, A.; Mbaya, R.K.K.; Moropeng, M.L. Recovery of Platinum and Palladium Ions from Aqueous Solution Using Grape Stalk Waste. Int. J. Chem. Eng. Appl. 2013, 46, 354–358. [Google Scholar] [CrossRef] [Green Version]
  29. Gonte, R.; Balasubramanian, K. Heavy and toxic metal uptake by mesoporous hypercrosslinked SMA beads: Isotherms and kinetics. J. Saudi Chem. Soc. 2016, 20, S579–S590. [Google Scholar] [CrossRef] [Green Version]
Figure 1. SEM image of crushed raw PAN.
Minerals 11 00884 g001
Figure 2. EDS spectrum showing the elemental composition of the crushed raw PAN.
Minerals 11 00884 g002
Figure 3. Scanning electron microscope (SEM) images of the internal porous network of a mesoporous neat PAN monolith: (a) image showing the entire porous network of the spherical monolith; (b) image highlighting the various pore sizes and morphologies within the monolith; (c) a close-up image of finger-like pores in the center of the monolith.
Minerals 11 00884 g003aMinerals 11 00884 g003b
Figure 4. SEM image revealing the non-porous outer layer of the mesoporous neat PAN monolith.
Minerals 11 00884 g004
Figure 5. A spectrum revealing the elemental composition of a mesoporous neat PAN monolith obtained using energy-dispersive X-ray spectroscopy (EDS).
Minerals 11 00884 g005
Figure 6. SEM images revealing the retained porosity of the crushed mesoporous neat PAN monoliths: (a) reveals various pieces of the crushed monolith with the porous network intact; (b) reveals a close-up of one of the crushed particles also with the finger-like pores still intact.
Minerals 11 00884 g006
Figure 7. SEM images of the internal porous network of a mesoporous composite polymer monolith: (a) image showing the entire porous network of the spherical monolith; (b) image highlighting the various pore sizes and morphologies within the monolith; (c) a close-up image revealing spherical pores within the finger-like pores, emphasizing the existence of an interconnected porous system.
Minerals 11 00884 g007
Figure 8. SEM image revealing the retained porosity of the crushed mesoporous composite polymer monolith.
Minerals 11 00884 g008
Figure 9. The percentage recovery of each of the three PGMs (Ru(III), Rh(III), Pd(II)) from 1 mg·L−1 prepared standard solutions by the three different polymer materials with error bars included.
Minerals 11 00884 g009
Figure 10. The percentage recovery of both toxic elements (As(V) & Cr(VI)) from 1 mg·L−1 prepared standard solutions by the three different polymer materials with error bars included.
Minerals 11 00884 g010
Table 1. A comparison of the surface and pore characteristics of the three polymer materials following BET and BJH analysis of nitrogen adsorption and desorption processes.
ParameterCrushed Raw PANCrushed Mesoporous Neat PAN MonolithsCrushed Mesoporous Composite Polymer Monoliths
BJH avg. pore diameter (nm)43.1 ± 0.328.8 ± 0.059.96 ± 0.09
BET surface area (m2/g)36.9 ± 0.11.43 ± 0.211.52 ± 0.07
Most occurring pore diameter (BJH PSD) (nm)38.04 ± 0.425.7 ± 0.12.99 ± 0.06
Isotherm typeType IVType IVType IV
Hysteresis loop typeType H1Type H1Type H1
Porosity categoryMesoporousMesoporousMesoporous
Pore geometryCylindricalCylindricalCylindrical
Table 2. The limit of detection (LOD), the limit of quantification (LOQ), and coefficient of determination (R2) values for the analytes of interest, which include As(V), Cr(VI), Ru(III), Rh(III), and Pd(II).
AnalyteLimit of Detection (LOD) (mg·L−1)Limit of Quantification (LOQ) (mg·L−1)Coefficient of Determination (R2)
As(V)0.01260.04211.00
Cr(VI)0.004600.01530.9999
Ru(III)0.009660.03220.9994
Rh(III)0.01700.05631.00
Pd(II)0.01200.04010.9998
Table 3. The relative standard deviation (%RSD) values for the various recovered metal ion solutions [As(V), Cr(VI), Ru(III), Rh(III), and Pd(II)] following the adsorption studies carried out with the three polymer materials.
AnalyteAdsorbent TypeAverage Concentration Following Adsorption (mg·L−1)
(Triplicate Analysis)
Standard Deviation%RSD
As(V)Raw PAN0.1120.003493.12%
Neat PAN monolith0.08370.005066.02%
Composite polymer monolith0.08200.007118.67%
Cr(VI)Raw PAN0.1200.003462.88%
Neat PAN monolith0.09620.003503.64%
Composite polymer monolith0.09520.007317.69%
Rh(III)Raw PAN0.02570.002238.58%
Neat PAN monolith0.04230.002044.86%
Composite polymer monolith<0.0170--
Publisher’s Note: MDPI stays neutral with regard to jurisdictional claims in published maps and institutional affiliations.

