
Mudrock Microstructure: A Technique for Distinguishing between Deep-Water Fine-Grained Sediments


Institute of Geoenergy Engineering, Heriot-Watt University, Edinburgh EH14 4AS, UK
*
Author to whom correspondence should be addressed.
Minerals 2021, 11(6), 653; https://doi.org/10.3390/min11060653
Submission received: 31 May 2021
/
Revised: 13 June 2021
/
Accepted: 15 June 2021
/
Published: 20 June 2021
(This article belongs to the Special Issue 10th Anniversary of Minerals: Frontiers of Mineral Science)
Abstract
:Distinguishing among deep-water sedimentary facies has been a difficult task. This is possibly due to the process continuum in deep water, in which sediments occur in complex associations. The lack of definite sedimentological features among the different facies between hemipelagites and contourites presented a great challenge. In this study, we present detailed mudrock characteristics of the three main deep-water facies based on sedimentological characteristics, laser diffraction granulometry, high-resolution, large area scanning electron microscopy (SEM), and the synchrotron X-ray diffraction technique. Our results show that the deep-water microstructure is mainly process controlled, and that the controlling factor on their grain size is much more complex than previously envisaged. Retarding current velocity, as well as the lower carrying capacity of the current, has an impact on the mean size and sorting for the contourite and turbidite facies, whereas hemipelagite grain size is impacted by the natural heterogeneity of the system caused by bioturbation. Based on the microfabric analysis, there is a disparate pattern observed among the sedimentary facies; turbidites are generally bedding parallel due to strong currents resulting in shear flow, contourites are random to semi-random as they are impacted by a weak current, while hemipelagites are random to oblique since they are impacted by bioturbation.
1. Introduction
Microstructure is one of the most important aspects of rock properties that has a significant impact and a wide range of applications in several areas of interest, including geosciences. For example, the importance of microstructure on unconventional reservoir quality and storage properties [1,2], seismic anisotropy [3,4], geomechanical properties [5,6], depositional processes [7,8], as well as post-depositional processes [9] are the subject of ongoing research. In a strict sense, microstructure in this paper is used to describe the total characterizable features from micrometer to nanometer features, such as pore size, grain size, porosity, connectivity, permeability, microfabric, mineralogy, orientation of crystals and grains, and other features at this scale.
Early work on mudrock microstructure was based on pedantic notions and on clay particles structure. The presumption is that clays are very small and have a very high tendency to stick together. This informed early descriptive terminologies such as honeycomb, cardhouse, and bookhouse fabrics, which are several descriptions of clay flocs and their arrangement [10]. The advent of scanning electron microscopy in the early 1970s led to the first direct observation of mudrock microstructure [11]. Interested readers of many of the earliest works, including hypotheses related to the formation of edge to edge (E-E), face to face (F-F), and edge to face (E-F) clay crystal interactions, are referred to a review by [12]. Despite the huge interest in mudrock microstructure, studies linking them to depositional processes are very rare [13].
There are very few works aimed at addressing microfabrics as a way of discriminating between deep-water facies, and the outcomes of the little research that has been done is often contradictory. For example, a clay microfabrics study by [14] suggested that hemipelagic sediment has a planar (anisotropic) orientation, whereas turbidites are random in orientation. A later study by [15] showed that subtle discrepancies exist between pelagites and turbidites in terms of clay microfabrics, while a study of hemipelagites by [16] revealed that they have a sub-parallel microfabric. Furthermore, [17] revealed that both hemipelagic and turbidite fabrics are disorganized and chaotic while pelagites associated with them are characterized by an anisotropic microfabric. A recent study also noted a disorganized microfabric in both turbidites and hemipelagites, but the presence of clay flocs in turbidites distinguishes them from the latter [18]. There is only one paper known to the authors to date where the author tried to characterize the microstructure of muddy contourites [8]. Owing to the controversies in previous publications on the subject, as well as the importance of microstructures on reservoir properties and geomechanical properties, among others [17,19], this paper presents the first detailed microstructural characterisation of contourites, hemipelagites, and turbidites. In this paper, we adopt large-scale, very high-resolution scanning electron microscopy [20], complemented by powerful hard synchrotron X-ray diffraction (which is one of the best techniques for textural and structural analysis of mudrocks [21,22]), to address these controversies. To date, we are unaware of any published papers that have addressed deep-water mudrock microstructure using large-scale, high-resolution SEM and the synchrotron X-ray diffraction technique.
2. Materials and Methods
2.1. Grain Size
Grain size analysis were carried out on 196 samples from three locations—the Gulf of Cadiz (contourites, 64 samples), the SW Iberian margin (hemipelagites, 59 samples), and the Indus Fan (turbidites, 72 samples). The core samples were obtained from International Ocean Discovery Program (IODP) repository centres; the University of Bremen, Marum, Germany (Expedition 339); and Kochi Core Centre (Expedition 355), respectively. The sampling was based on sedimentological features (grain size and sedimentological structures). Of these, 38 samples were selected for microstructural analysis using scanning electron microscopy and image analysis as well as synchrotron X-ray diffraction.
The study adopts the standard laser diffraction technique, in which a Malvern 2000 laser diffraction granulometer was used. The equipment can measure grain size in the range between 100 nm and 600 µm using three Fourier lenses. Statistical parameters, including standard deviation, mean, median, sorting, and kurtosis, among others, were derived using the Gradistat software (V4.0, Kenneth Pye Associates Ltd., Berkshire, UK) [23]. Further details about the grain size technique adopted in this paper have been presented elsewhere [24].
2.2. High-Resolution Semi-Automated Large Area Imaging
The high-resolution large scale imaging of the randomly selected area follows the procedures described in [25,26]. The procedure makes use of an automated collection of multiple tiles and stitching from a regular grid across the surface of the sample using the FEI Maps software (Oxford Instruments NanoAnalysis & Asylum Research, London, UK). The procedure can be applied to produce a large montage SEM image of the whole slide. The only constraints to the large-scale high-resolution image are storage, time, and availability of software to process or analyse the large amounts of data generated. Well-polished, thin sections were imaged using a field emission Quanta 650 SEM (SEM, Thermo Fischer Scientific, Waltham, MA, USA) equipped with a backscattered detector. The operational settings are low vacuum mode (0.83 Torr), a working distance of 10 mm, a voltage of 15 kV, and a spot size of about 4.5. A step-wise scanning procedure was utilised, and a detailed description of the procedure is presented in [20]. The resolutions of the SEM images are 45 nm per pixel and 5 nm per pixel for the microfabric analysis and porosity estimation, respectively.
2.3. Image Analysis
Image segmentation was performed using Fiji Software (version 1.51 for windows, 64 bits, NIH, Bethesda, MD, USA). Fiji open-source software is easy to use and hosts a number of algorithms initially developed for biological image analysis [27] but it is now popularly used in different fields of science for handling image analysis [28]. In order to reduce subjectivity, the image segmentation was performed through unsupervised machine learning segmentation [29,30] using Trainable Weka Segmentation (TWS), a Fiji plugin, which relies on very few annotations in order to achieve automated image classification [20].
The dimension of each of the areas analysed is approximately 650 µm by 400 µm, which is believed to be sufficiently representative of the whole sample. Random selection of these areas was conducted in order to account for heterogeneity in the grain size within the sample. The orientation of each grain was measured through the best fit ellipse drawn around that grain. In order to focus only on the silt and clay-size particles separately, a macro was run on the orientation data in Excel in order to examine only particle sizes 4–63 µm (i.e., silt-sized) in the first instance, and then <4 µm (i.e., clays). A further filter was applied to exclude particles with an aspect ratio of less than 2. This guaranteed that only silt and clay size particles that are elongated (typically mica and clay platelets) were used for the orientation analysis. Orientation data were divided into 18 bins, and rose diagrams were constructed with Georient 9.5.1 software (Rod Holocombe, Tallai, Australia) [31]. In addition to the rose diagrams produced by Georient, the software gives circular statistical parameters as an output, including circular variance, circular standard deviation, kappa coefficient, and circular skewness, among others.
2.4. X-ray Diffraction
Powder X-ray diffraction was performed at the ID-11 beamline, European Synchrotron Radiation Facility (ESRF) at Grenoble, France. Prior to the experiment, the samples were impregnated in resin to harden the samples, and the resulting samples had an approximate volume of about 2.5 cm × 2.5 cm × 1.5 cm. The blocky samples were later cut into slices of around 1.5 mm in thickness, with a rock cutting machine using an oil-based IsoCut (Thermo Fisher Scientific, Waltham, MA, USA) as a coolant to avoid swelling of clay minerals as well as the destruction of the samples. In performing the experiment, a monochromatic X-ray beam of a short wavelength of approximately 0.30996 Å (energy ~40 KeV) and beam size of 0.05 mm × 0.05 mm, and radial diffraction geometry recorded by a 2048 × 2048 pixels charged couple device (CCD) detector at about 0.231 m away from the sample, was employed. The samples were mounted on a metal pin and placed on the goniometer. Data acquisition was carried out at twelve different angles as the sample was being rotated about the horizontal axis from −75° to 75° at an increment of 15° for good statistics of textural analysis and to improve the pole figure coverage [32]. The bedding plane was placed perpendicular to the tilting axis in order to ensure that the X-ray beam hit the same layer during rotation. The instrumentation employed and procedures are shown in Figure 1.
Due to the inherent heterogeneity of mudrock, data were acquired over three spots, spaced at about 1 mm intervals in order to obtain a representative average [33]. The time for data acquisition is approximately 45 min per sample.
The diffraction images are characterised by Debye rings, which correspond to different mineral phases and varying lattice planes. Preferred orientations from synchrotron powder X-ray diffraction were inferred based on intensity variation along the Debye rings [34]. This preferred orientation represents crystallographic preferred orientation, unlike grain orientation shown by the SEM method. Interpretation of crystallographic orientation was based on qualitative inspection of diffraction images (Figure 2), which is enough to reveal the orientation patterns of the clay minerals [34].
3. Results
3.1. Lithological Characteristics
3.1.1. Contourites
Contourites are one of the principal deep-water sedimentary facies, and are generally defined as sediments generated or tremendously reworked by bottom-currents [35]. During expedition 339, contourite deposits were recovered from six sites (1386 to 1391) in the Gulf of Cadiz. The contourites in the Gulf of Cadiz remain world-class examples and a natural laboratory for studying contourite systems [36,37]. Many studies on the sediments recovered from the expedition are still ongoing to further test the contourites’ paradigms. The contourite systems have been interpreted by expedition scientists based on seismic attributes, sedimentological features, ichnofacies, and physical properties [38]. Overall, the contourites from these sites are uniform in colour and composition. They comprise an admixture of biogenic components (mainly nannofossils and foraminifera) and terrigenous particulates (mainly clay minerals, quartz, and detrital carbonate). Other components are present in minor or trace amounts [39]. They show a distinctive, though often subtle, cyclicity in grain size, from mud to silty, mud to silty sand, then back to silty mud and mud. The changes in their grain sizes reflect cyclicity and bi-gradational sequences [40,41]. A range of partial bi-gradational sequences are also present, as well as sandier contourites in the more proximal site.
Bedding is very indistinct, and most contacts between individual sequences and parts of the sequence are wholly gradational. In general, there are no primary sedimentary structures observable in the contourite facies, but there is conspicuous mottling throughout resulting from moderate bioturbation (Figure 3); although the ichnogenera are rarely identifiable. The sediment accumulation rate varies from one site to another, averaging 35 cm/ky at site 1387, 25–27 cm/ky at sites 1386 and 1391, 25–40 cm/ky at site 1389, and more than 100 cm/ky at site 1389.
3.1.2. Hemipelagites
Hemipelagites are typically very uniform, made up of a series of nannofossil muds, with varieties of biogenic carbonate and terrigenous materials. This description, as well as their composition, conforms with the widely used hemipelagic model [16]. The bedding patterns are generally very indistinct to non-existent, but are well typified by a distinct colour variation, which is conspicuous throughout the cores and ranges from paler to darker greyish hues. These colour cycles are related to more biogenic materials (paler colour) and more terrigenous sediments (darker colour), respectively. Similar repetitive variations were also noticed in the measured physical properties such as natural gamma radiation, magnetic susceptibility, density, and sediment colour spectral indices. The less common lithologies observed in the cores include more carbonate-rich nannofossil ooze, and more clay-rich mud with biogenic grains.
Primary sedimentary structures are not present, and there is no noticeable variation in the very fine grain size. Bioturbation and burrowing are prevalent, and the bioturbation index ranges from moderate to intense. Prominent trace fossils observed include numerous Planolites, Paleophycus, Thalassinoides, and Taenidium, while Chondrites and Zoophycos are rare. Other non-specific traces are also present together with abundant biodeformation. Small-scale, sub-vertical microfaults are present at relatively few restricted intervals, and one thin interval of contorted strata was observed during the expedition [42]. Typical facies photographs with trace fossils and bioturbation are shown in Figure 4.
3.1.3. Turbidites
The principal deep-water sedimentary facies retrieved during Expedition 355 in sites 1456 and 1457 are siliciclastic turbidites, which are part of the Indus Fan. The turbidites are occasionally interbedded with pelagic sediments [43] and their interpretation was based on morphological features and seismic signatures [44,45]. Further description of the cores carried out by the authors revealed that the sediments are made up of terrigenous sediments (silty clay and silty sand). The sequence of turbidites from the Indus Fan are thin-bedded or medium bedded. The medium-graded turbidites prograde and are typical of Bouma sequences [46]. Much of the succession comprises mud-rich distal turbidites, whereas parts are more sand-prone. Most of the turbidites have a sharp erosive base and show clear normal grading. The silt-mud turbidites are generally structureless, at least under visual inspection, but typically show very thin to thin sandy silt layers at the base. The common primary structures in these lower divisions are parallel lamination, lenticular lamination, and micro-cross-lamination. The turbidite facies are mostly non-bioturbated, but with rare bioturbation restricted to the upper parts of beds (Figure 5).
3.2. Grain Size
Contourite facies are medium silt to coarse clay with mean sizes ranging between 5.96 and 8.91 phi values. Out of the 64 samples of contourite facies analysed, about 28% are coarse clay, 53% very fine silt, 17% fine silt, and approximately 2% are medium silt. The contourite facies are generally very poorly sorted but with occasional poor sorting. The skewness varies from symmetrical to very fine skewed. Most samples are platykurtic, but some are mesokurtic.
Hemipelagites are very fine-grained, with a mean size between very fine silt and very fine clay, i.e., between 7.63 and 12.27 phi. Most of the hemipelagite facies fall within the coarse clay grain size (63%), 15% are very fine silt, 14% are fine clay, and 8% are medium clay. In terms of sorting characteristics, they are generally poorly sorted, while a few samples of the hemipelagites are moderately well sorted and very poorly sorted. In terms of skewness, the hemipelagite facies are mostly fine skewed but symmetrical distribution is also common. Results of kurtosis show that a large percentage of hemipelagites are mesokurtic and the rest are platykurtic.
The mean grain size of turbidite facies ranges between medium silt (5.43 phi) and very fine clay (11.22 phi). About 50% of the samples fall within the silt grain size, whereas the other 50% are clay size (Table 1 and Figure 6). Many of the turbidite facies are poorly sorted, while a few are moderately sorted or very poorly sorted. In terms of skewness, they are rather diverse but generally fine skewed and symmetrical. More than 60% of the turbidite facies are platykurtic and the rest are mesokurtic.
Although these grain size data show that contourite facies analysed are, on average, slightly coarser-grained, and the hemipelagites are slightly finer-grained, the grain sizes are sufficiently similar that valid comparisons of microstructures can be made. The turbidites span the grain size range of both contourites and hemipelagites.
Bivariate plots of grain size statistical parameters, including mean size versus sorting, kurtosis, and skewness, present interesting results, in which some differences are clearly depicted on the graphs. Turbidite facies plot across both contourites and hemipelagites. However, plots of these statistical parameters excluding turbidite samples show a possible boundary between contourites and hemipelagites, but still with a region of overlap (Figure 7, Figure 8 and Figure 9). More significant are the trends between different variables, which apply to all three facies. Mean size and sorting show a strong positive correlation, with a marked improvement in sorting for finer grain sizes. There is a much poorer positive correlation between mean size and skewness, but no apparent correlation between mean size and kurtosis.
3.3. Qualitative Analysis
Visual inspection revealed that contourites exhibit both grain-supported and matrix-supported patterns. Their microfabric appears random with some oblique patterns that are nearly perpendicular to the bedding. The distribution of coccoliths varies from one sample to the other (1% to 15%). Contourite facies are characterised by burrows that are filled with pyrite. Other micro features present in the contourite facies are tunicate spicules and algae borings (Figure 10).
Hemipelagites are rich in calcareous contents and siliciclastic materials. It is convenient to differentiate them into siliciclastic rich hemipelagites and calcareous dominated hemipelagites. However, it is somehow difficult to differentiate between contourites and hemipelagites based on their contents in some samples but in others, hemipelagites calcareous content is higher, predominantly coccoliths, and roughly up to 50% or more (Figure 11). They appear thoroughly bioturbated and exhibit random microfabric but show some oblique orientations. The hemipelagites generally consist of floating grains within the matrix, in which case they are usually matrix-supported except within burrows in which there might be in-filling of the burrows with coarse-grained particles that are in contact with each other.
Turbidite facies show well-aligned fabrics that have parallel and oblique patterns, but in some areas random patterns are occasionally present. Siliciclastic components dominate in the turbidite facies, and they are associated with numerous platy-like materials that are usually mica and clay platelets. Calcareous nannofossils (coccoliths) are not common within the turbidite facies, and when they are present they are usually less than 1%. Forams are not common components within the turbidite facies, but they were seen in some samples as part of the accessory components. Silt size particles in turbidite facies embedded within the matrix are finer than those of the contourites, while hemipelagites show some level of uniformity and have close contacts with each other, which therefore makes them exhibit a grain-supported pattern.
3.4. Quantitative Analysis
Contourite facies are typically random to semi-random in orientation with occasional parallel bedding patterns. Of one hundred and fifty rose diagrams constructed for the contourite facies, about 42% of them indicate random orientation while 30% and 23% of the plots showed semi-random and parallel to bedding patterns, respectively. Rose plots showing oblique patterns are negligible (Figure 12 and Figure 13, and Supplementary Materials Table S1).
From a hundred rose diagrams constructed for the hemipelagites, approximately 43% are randomly oriented while 48% and 9% show oblique orientation and semi-random orientation, respectively. In some cases, the oblique to bedding characteristics exhibited by the hemipelagites are nearly perpendicular to the bedding plane (Figure 12 and Figure 13).
Out of the ninety-six rose plots constructed for the turbidite facies, 14% are oblique parallel, 81% show bedding parallel, while a negligible percentage show semi-random orientation. Beyond burial depth greater than 800 m, both the silt and the clay size particles for the turbidite facies exhibit a preferred orientation that is bedding-parallel.
3.5. Synchrotron X-ray Diffraction
The diffraction images for contourite, hemipelagite, and turbidite samples are presented in Table 2. Virtually all the diffraction images for the contourite facies display a lack of preferred orientation, which is marked by a lack of azimuthal intensity variation along the diffraction rings except in one sub-area in sample 1 where there is a slight intensity variation in the innermost Debye ring. The Debye rings for the turbidite facies show variation in intensity at the innermost Debye rings, which is an indication of the preferred orientation of the clay minerals. 50% of the diffraction images for the hemipelagites indicate some element of preferred orientation while the other 50% are characterized by random orientation. These results are consistent with grain orientation from the image analysis of the SEM images.
3.6. Depth vs. Porosity, Grain Size, and Microfabric
Plots of key petrophysical parameters such as average grain size, porosity (derived from helium pycnometry), sedimentation rate, and general microfabric against burial depths are presented in Figure 14, Figure 15 and Figure 16. In all sites, there are no obvious links between microstructure and depth. In the case of porosity, a decrease in porosity along the depth profile is moderate and this is observed in all the sites (Figure 14, Figure 15 and Figure 16). Computed statistics for porosity changes indicate low standard deviation, which is an indication of minimal dispersion of data around the mean value. The values of correlation coefficient along the depth profile using Pearson function suggest a weak to strong negative correlation (Table 3). The sedimentation rate decreases with depth in virtually all the sites, in which case it is directly proportional to porosity. However, both depth and likewise sedimentation rate have no clear observable trend with respect to the microfabric pattern.
4. Discussion
The original sample selection of mud-rich sediments has ensured that all are fine-grained, with mean size mostly in the fine silt to fine clay range (6–11 phi), with one or two medium silt and very fine clay sizes. An effort was made to select the finer mud-rich parts of contourite sequences from the Gulf of Cadiz cores, the upper mud-rich parts of distal turbidites from the Indus Fan cores, and normal slope hemipelagites with an admixture of terrigenous mud and fine bioclastics. There is, therefore, relatively little difference in the range of mean size for each of the three deep-water facies, although the hemipelagites are slightly finer-grained overall, the contourites are slightly coarser-grained, and the turbidites span the spectrum of both other facies. This allows for reasonable comparisons to be made between the facies without any significant influence of grain size.
The actual mean size of deep-water sediments is controlled by three principal factors: (a) sediment supply—, i.e., the grain size distribution of the original source material; (b) distance from the source—, i.e., the distance travelled in the turbidity current or bottom current, or the distance from shore for hemipelagites; and (c) current velocity—in that this affects the current’s capacity to transport and/or winnow sediment.
As both the turbidite and contourite facies sampled are closely associated with similar but coarser-grained facies (commonly in the same bed), neither the sediment supply nor the distance travelled is likely to exert significant control. Rather, it is the current velocity at the time of deposition and within that part of the depositing current that was most important. This is likely to have been very low for both types of current, i.e., around 10 cm/s or less. Hemipelagite grain size, by contrast, is controlled by sediment supply, including primary productivity of biogenic material, and by distance from the source, for the wind-blown and surface-current transported terrigenous fraction.
Cross plots of textural statistical parameters to differentiate between river, dune, and beach environments have been in use for some decades but there is very little application of this approach to distinguish between deep-water sediments. Early work on distinguishing turbidites from contourites is reported by [47] and, more recently, [48] and [49] have presented many recent data on grain-size characteristics from the Gulf of Cadiz contourites, including some very interesting bivariate cross plots. The bivariate cross plots of average grain size versus sorting, kurtosis, and skewness presented in this paper complement those of [49] and confirm that, in general, these textural statistical parameters are sensitive to depositional processes occurring within the deep-water. The plot of mean size versus sorting (see Figure 7) shows a well-defined trend, albeit with some scatter, of improved sorting with a decrease in mean size for all the three facies types. Although this trend is noted by [49], these authors focus primarily on the coarse silt to sand facies and have little to say about the finer muds. They do suggest that low current velocity and extensive bioturbation have induced the very poorly sorted nature of the fine and medium silts. However, the controls on this trend, which includes all facies, must be more complex. The hemipelagites were deposited in the absence of current action and are intensely bioturbated throughout, whereas the turbidites were deposited by low-velocity currents without significant bioturbation, and the contourites also show weak current action but with much bioturbation. It is therefore proposed that the mean-size/sorting trend observed is due to a combination of: (a) decreasing current velocity and hence lower carrying capacity for both contourite and turbidite facies; (b) natural heterogeneity in the hemipelagites, in part caused by bioturbation, with areas dominated by only nannofossils and clays; (c) effective sorting within the fine-grained portion of a turbidity current; and (d) an effective lower limit to the grain size of weathered terrigenous particulates in natural systems. Based on the data presented, such a limit may be around 13–14 phi (0.125–0.063 microns).
The skewness/mean-size cross plot also reveals a pronounced trend, in which the finer grain sizes show low or zero skewness (symmetrical size distribution) and the coarser grain sizes show increasingly fine to very fine skew. This pattern reflects deposition dominated by vertical settling for the finest sediments, and by increased, but still low, current velocity as the grain size increases. The kurtosis/mean size cross plot shows very little evidence of a systematic trend. Overall, the combination of the grain size statistical parameters provides useful information about the depositional process as shown in Figure 17. However, it is less useful for differentiating between the three sediment types—contourites, hemipelagites, and turbidites—because of significant overlap in the data points. There is some better separation between contourites and hemipelagites, which may be able to inform their distinction in some instances. However, it is believed there is a natural continuum between the two processes.
4.1. General Control of Microfrabric
Several controls have been proposed for the origin and nature of microfabric in mudrock, and these include:
- (a)
- Primary orientation of grains during deposition either as dispersed or flocculated particles, which may be linked to the depositional process and/or environment.
- (b)
- Primary and secondary orientation of grains as a result of organic matter content of the sediment, whereby greater organic-matter content leads to greater fissility and parallel grain orientation.
- (c)
- Primary and secondary orientation of clay minerals as a result of the silt content, with more silt leading to more random orientation.
- (d)
- Re-orientation of clay minerals during the smectite to illite transformation.
- (e)
- Re-orientation of grains as the result of mechanical compaction, fault gouge, and low-grade metamorphism.
Over 340 measurements of microfabric have been documented and plotted as individual rose diagrams of grain orientation—150 contourites, 100 hemipelagites, and 96 turbidites. These clearly show two important points: firstly, visual observation of the rose plots coupled with quantitative statistical analysis provides robust data; and, secondly, the microfabric data derived from silt orientation is nearly always the same as that for clay orientation, so that one can be used as the proxy for the whole sediment. They also reveal very distinct differences between the three facies types.
These pronounced differences are interpreted as being due to depositional processes. The preferred microfabric in turbidites reflects deposition from a relatively low-velocity and low-concentration turbidity current. Estimates of flow properties for such currents [50] suggest velocity <20 cm/s and concentration between 25–250 mg/L. The actual rate of sedimentation would be geologically instantaneous, with deposition occurring over a few days for a 10 cm mud turbidite. Many of the oblique orientation plots for the turbidites are only slightly deviated from parallel to bedding and may therefore reflect slight draw-down at the edge of the core due to the coring process. The very few semi-random plots might be influenced by draped fabric around coarser silt grains. Some minor bioturbation is also possible but was not observed in the cores studied.
Hemipelagic sedimentation has been proposed to result from very slow sedimentation, augmented by pelletization [51]. Subsequent research focused on trace fossils in hemipelagites [52], and a recent study focused on the porosity characteristics of deep-water mudrocks that have identified pellets within them [53]. However, in the current study no pellet was observed through thin-section petrography and scanning electron microscopy. The reason for the lack of pellets in hemipelagites remains an enigma but one possibility is bacterial degradation.
The random microfabric of hemipelagites, and the complete absence of a preferred bedding parallel fabric, reflect deposition in the absence of any current influence, and result from ultra-low concentration settling through the water column mainly as flocs and possibly as pellets. The rate of sedimentation is more or less uniformly very slow and has been calculated as 11 cm/ky for the study site based on very careful dating [54]. The co-dominance of an oblique microfabric, often highly oblique to bedding and with more or less distinct grain alignment, is believed to result from bioturbation (Figure 18). Distinctive large-scale burrowing and overall bioturbational mottling is a notable feature of the study cores, and hemipelagites in general. The oblique microfabric observed is therefore considered to be a secondary preferred alignment, which is at various oblique angles or nearly vertical to bedding, caused by burrowing organisms that align the grains along the length of the burrow, particularly along the cavity walls. As hemipelagites are more ubiquitously bioturbated and characterised by large scale burrows compared to contourites, the oblique orientation is more common in them compared to the latter.
4.2. Other Controls: This Study
4.2.1. Grain Size
Regarding the potential grain size influence on the microfabric, there appears to be no systematic correlation between the two. The mean grain size classes represented in the studied samples include fine silt, very fine silt, coarse clay, and medium clay, and across this spectrum of grain sizes, there is an irregular variation between all microfabric types observed. This is true for all facies taken together and for each facies separately (Table 4).
4.2.2. Burial Depth
The burial depths from which samples were analysed for microfabrics ranges from 8–985 m below seafloor. Those sediments recovered from near the surface are soft and unconsolidated, whereas those from 700 m and below are hard, compact, and semi-consolidated. Certain horizons even above 700 m are cemented as hard rocks, but samples from these were not included in this study. It is therefore reasonable to assume that any pronounced effects of compaction and consolidation on the microfabric would be evident in the deeper samples. In particular, one might anticipate a high degree of preferred grain alignment with bedding as an effect of compaction.
However, the two contourite samples closest to the surface (within 10 m below the seafloor) show 87% strongly preferred orientation that is parallel to the bedding, whereas the two deepest samples (at 763 m and 808 m depth below seafloor) show only 45% preferred, bed-parallel orientation. There is no systematic variation between these upper and lower samples.
Hemipelagites are characterised by dominantly random and oblique orientations at all depths, whereas turbidites show mostly preferred bed-parallel microfabric at all depths. However, in the case of the turbidites, the samples below 750 m show >95% preferred bed-parallel fabric, whereas the samples above 150 m show 40% preferred bed-parallel and 60% preferred oblique to bedding. These oblique fabrics are mostly well aligned and only slightly oblique to bedding, so that they may be a result of core-margin bending during retrieval.
The results presented in this study reveal no systematic variation in microfabric and grain size along the depth profile. However, for each of the sites, there is systematic decrease in the total porosity values with increasing depth.
4.3. Towards a Microfabric Model for Deep-Water Sediments
Very few previous studies have specifically addressed the microfabric of deep-water sediments [14,16] and these demonstrate rather inconclusive results. Ref. [14] suggest turbidites are characterised by randomly oriented clays due to clay flocculation within more concentrated turbidity currents, whereas hemipelagites prefer a clay orientation. This conclusion is supported by [16], who further reports that contourites may show parts with particle clusters (random fabric) and parts with a more aligned fabric were not bioturbated. They further report on 30 samples of hemipelagites from the Oman margin that were examined for microstructure. These results are rather mixed but mostly indicate a random fabric.
These early studies utilised broken surfaces in combination with scanning electron microscopy, which had rather poorer resolution at the micron-scale than today’s instruments. Retrieving information on mudrock microstructures from broken surfaces is elusive and is no longer recommended [55], and the routinely higher resolution that can be achieved today should permit more definitive observations.
Two more recent studies have reported no difference between microfabric of turbidites and hemipelagites, and that both facies are characterised by random fabric [17,18]. Most recently, a single study by [8] presented results on microfabric from the Gulf of Cadiz contourites, which indicate that these contourites, in general, have a sub-parallel clay microfabric [8]. These recent papers employed hand-polished samples [17] or blocky samples [8,18] and their interpretation was based on visual judgement.
The results presented in this study represent the most detailed study to date, using 38 samples of mud-rich contourites, hemipelagites, and turbidites, and a total of 346 high-resolution SEM images of microfabric. Furthermore, the study utilised semi-automated image acquisition and quantitative analysis of multiple, large, high-resolution SEM images from randomly selected areas of the selected samples. The methodology has the advantage of resolving a spatially representative area of fine-grained, heterogeneous materials [20]. It is also supported by synchrotron X-ray powder diffraction images from which there is a remarkable consistency between the results from both techniques.
In the data presented here, the microfabric of deep-water mudrocks is interpreted as closely linked to the depositional process coupled with modification by syn-depositional and early post-depositional bioturbation processes. The grain size, mineralogy, and depth of burial appear to have little effect, certainly for burial depths of less than 1 km as examined for this study. The depositional controls are threefold: flow velocity, sediment concentration, and sedimentation rate. These are illustrated in Figure 19 with respect to the microfabric type found in turbidites, contourites, and hemipelagites.
In muddy turbidity currents, with low to moderate velocity and low sediment concentration, clay flocs and silt grains become progressively more concentrated as they settle out of suspension towards the seafloor. The randomly oriented clay fabric within the flocs, now much more concentrated near the base of the flow, is then broken up by flow shear as final deposition occurs through the benthic boundary layer. This leads to the preferred bed-parallel microfabric (Figure 20). In more silt-rich muddy turbidity currents, it is shear sorting through the benthic boundary layer that has been invoked for the origin of alternating silt-mud laminae [56,57]. However, the same flow shear process will operate to yield a preferred microfabric. The actual rate of deposition is very rapid, i.e., hours to days.
Bottom currents, in the process of depositing muddy contourites, have slightly lower flow velocity and much lower levels of sediment concentration than muddy turbidity currents. The same flow shear process will operate as sediment settles through the benthic boundary layer, thereby yielding a preferred bed-parallel microfabric, but this is likely to be less pronounced than in turbidites (Figure 20). In particular, the lower concentration of flocs passing through the boundary layer at any one time will result in less particle interference and, therefore, a microfabric somewhere between parallel and semi-random. The rate of sedimentation is low, so that bioturbation is continuous throughout deposition, and disruption of the fabric will occur to a greater or lesser extent, yielding a partially random and semi-random microfabric.
Hemipelagic sedimentation occurs in the absence of current activity and with a very sparse distribution of flocs and particles in the water column. Without flow shear, the default microfabric is random. The rate of sedimentation is mostly still lower than for contourites, and the bioturbation is more intense and continuous (Figure 20). Rather than making an already random fabric more random, the burrowing activity can serve to re-align clay (and other) particles, yielding a preferred oblique or semi-preferred microfabric that is typically inclined to the bedding.
5. Conclusions
Microstructural analysis of deep-water sedimentary facies, as presented in this paper, through semi-automated high-resolution SEM benefited from the advancement in technology. The study provides an unprecedented insight into the microstructural characteristics of mudrocks, differs significantly from previous works, and specifically relates microstructure to depositional processes. Based on the results presented in this study, it is clear that in the deep water, mudrocks microstructure, especially within the topmost 1 km burial depth, is dominantly process controlled.
In terms of microfabric, turbidites are generally characterized by preferred parallel to bedding orientation, which is produced by rapid sedimentation from turbulent suspension and flow shear during deposition through the benthic boundary layer. Hemipelagites, by contrast, show random or oblique orientation, which is suggested to be associated with the absence of current influence and a strong bioturbation effect. The oblique orientations, which are mostly at a high angle and nearly perpendicular, are considered secondary alignments resulting from burrowing. Contourites, on the other hand, show part alignment resulting from low concentration bottom currents coupled with weaker flow shear, and part random orientation imparted by bioturbation.
Supplementary Materials
The following are available online at https://www.mdpi.com/article/10.3390/min11060653/s1, Table S1: Rose diagrams showing orientation patterns for contourite, hemipelagite and turbidites. The arrow indicates the direction of the bedding. Contourites are generally random but can show parallel to bedding. Hemipelagites are characterised by a mixture of oblique and random orientations while turbidite are dominantly parallel to bedding. Arrow indicates direction parallel to the bedding. OB = Oblique P = bedding parallel R = random orientation SR = Semi random.
Author Contributions
Conceptualization, S.B.; methodology, S.B., J.B., D.S. and Z.S.; formal analysis, S.B.; investigation, S.B.; resources, S.B., J.B., D.S. and H.L.; writing—original draft preparation, S.B.; writing—review and editing, S.B., J.B., D.S., Z.S. and H.L.; visualization, S.B.; supervision, S.B., D.S., J.B. and H.L.; funding acquisition, S.B. All authors have read and agreed to the published version of the manuscript.
Funding
This research received funding from Petroleum Technology Development Nigeria, who sponsored S.B.’s Ph.D program at Heriot-Watt University, Edinburgh, UK.
Data Availability Statement
Data for this work can be found within the article or the supplementary data while the core samples can be retrieved from the International Ocean Discovery Program.
Acknowledgments
S.B appreciates the sponsorship received from Petroleum Technology Development Fund, Nigeria. The authors are grateful to the European Synchrotron Radiation Facility, Grenoble, France for the opportunity to carry out synchrotron experiments in their facility. We thank the International Ocean Discovery Program for providing us with access to the core samples. S.B is grateful to the 335 Expedition Scientists and the IODP technical staff (Walter Hale and Alex Wülbers) at MARUM IODP repository, Bremen, Germany and Lallan Gupta at Kochi Core Center, Japan for their guidance and co-operation during the core sampling. Mark Curtis of the University of Oklahoma, United States of America is also appreciated for preparing the ion-milled samples.
Conflicts of Interest
The authors declare no conflict of interest.
References
- Silin, D.; Kneafsey, T. Shale Gas: Nanometer-Scale Observations and Well Modelling. J. Can. Pet. Technol. 2012, 51, 464–475. [Google Scholar] [CrossRef]
- Bust, V.K.; Majid, A.A.; Oletu, J.U.; Worthington, P.F. The petrophysics of shale gas reservoirs: Technical challenges and pragmatic solutions. Pet. Geosci. 2013, 19, 91–103. [Google Scholar] [CrossRef]
- Almqvist, B.S.G.; Mainprice, D. Seismic properties and anisotropy of the continental crust: Predictions based on mineral texture and rock microstructure. Rev. Geophys. 2017, 55, 367–433. [Google Scholar] [CrossRef] [Green Version]
- Vauchez, A.; Dineur, F.; Rudnick, R. Microstructure, texture and seismic anisotropy of the lithospheric mantle above a mantle plume: Insights from the Labait volcano xenoliths (Tanzania). Earth Planet. Sci. Lett. 2005, 232, 295–314. [Google Scholar] [CrossRef]
- Moon, V.G. Microstructural controls on the geomechanical behaviour of ignimbrite. Eng. Geol. 1993, 35, 19–31. [Google Scholar] [CrossRef]
- Ibanez, W.D.; Kronenberg, A.K. Experimental deformation of shale: Mechanical properties and microstructural indicators of mechanisms. Int. J. Rock Mech. Min. Sci. 1993, 30, 723–734. [Google Scholar] [CrossRef]
- Lachniet, M.S.; Larson, G.J.; Lawson, D.E.; Evenson, E.B.; Alley, R.B. Microstructures of sediment flow deposits and subglacial sediments: A comparison. Boreas 2001, 30, 254–264. [Google Scholar] [CrossRef]
- Nishida, N. Microstructure of muddy contourites from the Gulf of Cádiz. Mar. Geol. 2016, 377, 110–117. [Google Scholar] [CrossRef]
- Casella, L.A.; Griesshaber, E.; Simonet Roda, M.; Ziegler, A.; Mavromatis, V.; Henkel, D.; Laudien, J.; Häussermann, V.; Neuser, R.D.; Angiolini, L.; et al. Micro- and nanostructures reflect the degree of diagenetic alteration in modern and fossil brachiopod shell calcite: A multi-analytical screening approach (CL, FE-SEM, AFM, EBSD). Palaeogeogr. Palaeoclimatol. Palaeoecol. 2018, 502, 13–30. [Google Scholar] [CrossRef]
- Sloane, R.L.; Kell, T.R. The fabric of mechanically compacted kaolin. In Clays and Clay Minerals: Proceedings of the Fourteenth National Conference; Elsevier: Berkeley, CA, USA, 1966; pp. 289–296. [Google Scholar]
- Sergeyev, Y.M.; Grabowska-Olszewska, B.; Osipov, V.I.; Sokolov, V.N.; Kolomenski, Y.N. The classification of microstructures of clay soils. J. Microsc. 1980, 120, 237–260. [Google Scholar] [CrossRef]
- Moon, C.F.; Hurst, C.W. Fabric of muds and shales: An overview. Geol. Soc. Lond. Spec. Publ. 1984, 15, 579–593. [Google Scholar] [CrossRef]
- Schieber, J.; Zimmerle, W. Introduction and overview: The history and promise of shale research. Shales Mudstones 1998, 1, 1–10. [Google Scholar]
- O’Brien, N.R.; Nakazawa, K.; Tokuhashi, S. Use of clay fabric to distinguish turbiditic and hemipelagic siltstones and silts. Sedimentology 1980, 27, 47–61. [Google Scholar] [CrossRef]
- Shephard, L.E.; Rutledge, A.K. Clay Fabric of Fine-Grained Turbidite Sequences from the Southern Nares Abyssal Plain. In Microstructure of Fine-Grained Sediments; Bennett, R., Bryant, W., Hulbert, M., Chiou, W.A., Faas, R.W., Kasprowicz, J., Li, H., Lomenick, T., O’Brien, N.R., Pamukcu, S., et al., Eds.; Springer: New York, NY, USA, 1991; pp. 61–72. ISBN 978-1-4612-8766-7. [Google Scholar]
- Stow, D.A.V.; Tabrez, A.R. Hemipelagites: Processes, facies and model. Geol. Soc. Spec. Publ. 1998, 129, 317–337. [Google Scholar] [CrossRef]
- Ochoa, J.; Wolak, J.; Gardner, M.H. Recognition criteria for distinguishing between hemipelagic and pelagic mudrocks in the characterization of deep-water reservoir heterogeneity. Am. Assoc. Pet. Geol. Bull. 2013, 97, 1785–1803. [Google Scholar] [CrossRef]
- Kase, Y.; Sato, M.; Nishida, N.; Ito, M.; Mukti, M.M.; Ikehara, K.; Takizawa, S. The use of microstructures for discriminating turbiditic and hemipelagic muds and mudstones. Sedimentology 2016, 63, 2066–2086. [Google Scholar] [CrossRef]
- Davies, D.; Bryant, W.; Vessell, R.; Burkett, P. Porosities, permeabilities, and microfabrics of Devonian Shales. In Microstructure of Fine-Grained Sediments; Bennett, R., Bryant, W., Hulbert, M., Chiou, W.A., Faas, R.W., Kasprowicz, J., Li, H., Lomenick, T., O’Brien, N.R., Pamukcu, S., et al., Eds.; Springer: New York, NY, USA, 1991; pp. 109–119. ISBN 978-1-4612-8766-7. [Google Scholar]
- Bankole, S.A.; Buckman, J.; Stow, D.; Lever, H. Automated Image Analysis of Mud and Mudrock Microstructure and Characteristics of Hemipelagic Sediments: IODP Expedition 339. J. Earth Sci. 2019, 30, 407–421. [Google Scholar] [CrossRef]
- Lonardelli, I.; Wenk, H.-R.; Ren, Y. Preferred orientation and elastic anisotropy in shales. Geophysics 2007, 72, D33–D40. [Google Scholar] [CrossRef]
- Wenk, H.R.; Van Houtte, P. Texture and anisotropy. Rep. Prog. Phys. 2004, 67, 1367. [Google Scholar] [CrossRef]
- Blott, S.J.; Pye, K. GRADISTAT: A grain size distribution and statistics package for the analysis of unconsolidated sediments. Earth Surf. Process. Landf. 2001, 26, 1237–1248. [Google Scholar] [CrossRef]
- Bankole, S.A.; Buckman, J.; Stow, D.; Lever, H. Grain-size analysis of mudrocks: A new semi-automated method from SEM images. J. Pet. Sci. Eng. 2019, 174, 244–256. [Google Scholar] [CrossRef]
- Buckman, J. Microscopy and Analysis; John Wiley & Sons, Ltd.: Hoboken, NJ, USA, 2014; pp. 13–15. [Google Scholar]
- Bankole, S.A.; Stow, D.A.V.; Lever, H.; Buckman, J. Microstructure of Mudrock and the Choice of Representative Sample. In Proceedings of the Fifth EAGE Shale Workshop, EAGE, Catania, Italy, 2–4 May 2016. [Google Scholar]
- Schindelin, J.; Arganda-Carreras, I.; Frise, E.; Kaynig, V.; Longair, M.; Pietzsch, T.; Preibisch, S.; Rueden, C.; Saalfeld, S.; Schmid, B.; et al. Fiji: An open-source platform for biological-image analysis. Nat. Methods 2012, 9, 676–682. [Google Scholar] [CrossRef] [Green Version]
- Schindelin, J.; Rueden, C.T.; Hiner, M.C.; Eliceiri, K.W. The ImageJ ecosystem: An open platform for biomedical image analysis. Mol. Reprod. Dev. 2016, 82, 518–529. [Google Scholar] [CrossRef] [PubMed] [Green Version]
- Arganda-Carreras, I.; Kaynig, V.; Rueden, C.; Eliceiri, K.W.; Schindelin, J.; Cardona, A.; Seung, H.S. Trainable Weka Segmentation: A machine learning tool for microscopy pixel classification. Bioinformatics 2017, 33, 2424–2426. [Google Scholar] [CrossRef]
- Lai, Z.; Chen, Q. Reconstructing granular particles from X-ray computed tomography using the TWS machine learning tool and the level set method. Acta Geotech. 2019, 14, 1–18. [Google Scholar] [CrossRef]
- Holcombe, R.J. GEOrient-an integrated structural plotting package for MS-Windows. Geol. Soc. Aust. Abstr. 1994, 36, 73–74. [Google Scholar]
- Wenk; Voltolini; Mazurek; Loon, V.L.R.; Vinsot. Preferred Orientations and Anisotropy in Shales: Callovo-Oxfordian Shale (France) and Opalinus Clay (Switzerland). Clays Clay Miner. 2008, 56, 285–306. [Google Scholar] [CrossRef]
- Kanitpanyacharoen, W.; Vasin, R.; Wenk, H.R.; Dewhurst, D.N. Linking preferred orientations to elastic anisotropy in muderong shale, Australia. Geophysics 2014, 80, C9–C19. [Google Scholar] [CrossRef] [Green Version]
- Janssen, C.; Kanitpanyacharoen, W.; Wenk, H.R.; Wirth, R.; Morales, L.; Rybacki, E.; Kienast, M.; Dresen, G. Clay fabrics in SAFOD core samples. J. Struct. Geol. 2012, 43, 118–127. [Google Scholar] [CrossRef]
- Stow, D.A.V.; Faugères, J.C. Chapter 13 Contourite Facies and the Facies Model. In Developments in Sedimentology; Rebesco, M., Camerlenghi, A., Eds.; Elsevier: Amsterdam, The Netherlands, 2008; Volume 60, pp. 223–256. ISBN 0070-4571. [Google Scholar]
- Hernández-Molina, F.J.; Llave, E.; Stow, D.A.V.; García, M.; Somoza, L.; Vázquez, J.T.; Lobo, F.J.; Maestro, A.; Díaz del Río, V.; León, R.; et al. The contourite depositional system of the Gulf of Cádiz: A sedimentary model related to the bottom current activity of the Mediterranean outflow water and its interaction with the continental margin. Deep Sea Res. Part II Top. Stud. Oceanogr. 2006, 53, 1420–1463. [Google Scholar] [CrossRef]
- Rebesco, M.; Hernández-Molina, F.J.; Van Rooij, D.; Wåhlin, A. Contourites and associated sediments controlled by deep-water circulation processes: State-of-the-art and future considerations. Mar. Geol. 2014, 352, 111–154. [Google Scholar] [CrossRef] [Green Version]
- Hernández-Molina, F.J.; Hodell, D.A.; Stow, D.A.V.; Alvarez-Zarikian, C. Virtual special issue on IODP Expedition 339: The Mediterranean outflow. Mar. Geol. 2016, 144, 263–269. [Google Scholar] [CrossRef]
- Expedition 339 Scientists Expedition 339 summary. In Proc. IODP, 339; Stow, D.A.V.; Hernández-Molina, F.J.; Alvarez Zarikian, C.A.; The Expedition 339 Scientists (Eds.) Integrated Ocean Drilling Program Management International, Inc.: Tokyo, Japan, 2013; Volume 339. [Google Scholar]
- Bahr, A.; Jimenez-Espejo, F.J.; Kolasinac, N.; Grunert, P.; Hernandez-Molina, F.J.; Rohl, U.; Voelker, A.H.L.; Escutia, C.; Stow, D.A.V.; Hodell, D.; et al. Deciphering bottom current velocity and paleoclimate signals from contourite deposits in the Gulf of Cadiz during the last 140 kyr: An inorganic geochemical approach. Geochem. Geophys. Geosyst. 2014, 15, 3145–3160. [Google Scholar] [CrossRef]
- Hodell, D.; Lourens, L.; Crowhurst, S.; Konijnendijk, T.; Tjallingii, R.; Jiménez-Espejo, F.; Skinner, L.; Tzedakis, P.C.; Abrantes, F.; Acton, G.D.; et al. A reference time scale for Site U1385 (Shackleton Site) on the SW Iberian Margin. Glob. Planet. Chang. 2015, 133, 49–64. [Google Scholar] [CrossRef]
- Expedition 339 Scientists Mediterranean Outflow: Environmental Significance of the Mediterranean Outflow Water and its Global Implications; Integrated Ocean Drilling Program Management International (IODP), Inc.: San Diego, CA, USA, 2012; pp. 1–97.
- Pandey, D.K.; Clift, P.D.; Kulhanek, D.K.; the Expedition 355 Scientists. Expedition 355 summary. IODP Proc. 2016, 355, 32. [Google Scholar] [CrossRef]
- Pandey, D.K.; Clift, P.D.; Kulhanek, D.K.; Andò, S.; Bendle, J.A.P.; Bratenkov, S.; Griffith, E.M.; Gurumurthy, G.P.; Hahn, A.; Iwai, M.; et al. Deep sea drilling in the Arabian Sea: Constraining tectonic-monsoon interactions in South Asia. IODP Prelim. Report355 2015, 355, 1–46. [Google Scholar]
- Mishra, R.; Pandey, D.K.; Ramesh, P.; Clift, P.D. Identification of new deep sea sinuous channels in the eastern Arabian Sea. Springerplus 2016, 5, 1–18. [Google Scholar] [CrossRef] [PubMed] [Green Version]
- Bouma, A.H. Coarse-grained and fine-grained turbidite systems as end member models: Applicability and dangers. Mar. Pet. Geol. 2000, 17, 137–143. [Google Scholar] [CrossRef]
- Stow, D.A.V. Distinguishing between fine-grained turbidites and contourites on the Nova Scotian deep water margin. Sedimentology 1979, 26, 371–387. [Google Scholar] [CrossRef]
- Alonso, B.; Ercilla, G.; Casas, D.; Stow, D.A.V.; Rodríguez-Tovar, F.J.; Dorador, J.; Hernández-Molina, F.-J. Contourite vs gravity-flow deposits of the Pleistocene Faro Drift (Gulf of Cadiz): Sedimentological and mineralogical approaches. Mar. Geol. 2016, 377, 77–94. [Google Scholar] [CrossRef]
- Brackenridge, R.E.; Stow, D.A.V.; Hernández-Molina, F.J.; Jones, C.; Mena, A.; Alejo, I.; Ducassou, E.; Llave, E.; Ercilla, G.; Nombela, M.A.; et al. Textural characteristics and facies of sand-rich contourite depositional systems. Sedimentology 2018, 65, 2223–2252. [Google Scholar] [CrossRef] [Green Version]
- Stow, D.A.V.; Omoniyi, B.A. Thin-bedded turbidites: Overview and petroleum perspective. AAPG Mem. 2018, 115, 97–117. [Google Scholar]
- Stow, D.A.V. Fine-grained sediments in deep water: An overview of processes and facies models. Geo-Mar. Lett. 1985, 5, 17–23. [Google Scholar] [CrossRef]
- Uchman, A.; Wetzel, A. Deep-sea ichnology: The Relationships between Depositional Environment and Endobenthic Organisms. In Developments in Sedimentology; Elsevier: Amsterdam, The Netherlands, 2011; Volume 63, ISBN 0070-4571. [Google Scholar]
- Slatt, R.M.; O’Brien, N.R. Microfabrics related to porosity development, sedimentary and diagenetic processes, and composition of unconventional resource shale reservoirs as determined by conventional scanning electron microscopy. AAPG Mem. 2013, 102, 37–44. [Google Scholar] [CrossRef]
- Brackenridge, R.E.; Hernández-Molina, F.J.; Stow, D.A.V.; Llave, E. A Pliocene mixed contourite-turbidite system offshore the Algarve Margin, Gulf of Cadiz: Seismic response, margin evolution and reservoir implications. Mar. Pet. Geol. 2013, 46, 36–50. [Google Scholar] [CrossRef]
- Schieber, J. Traces in the dark-sedimentary processes and facies gradients in the Upper Devonian-Lower Mississippian upper shale member of the Bakken Formation, Williston Basin, North Dakota, U.S.A.—Discussion. J. Sediment. Res. 2014, 84, 839–841. [Google Scholar] [CrossRef] [Green Version]
- Stow, D.A.V.; Bowen, A.J. A physical model for the transport and sorting of fine-grained sediment by turbidity currents. Sedimentology 1980, 27, 31–46. [Google Scholar] [CrossRef]
- Stow, D.A.V.; Bowen, A.J. Origin of lamination in deep sea, fine-grained sediments. Nature 1978, 274, 324–328. [Google Scholar] [CrossRef]
Figure 1.
Sample preparation and experimental setup for data acquisition for textural analysis at the European Synchrotron Radiation Facility, Grenoble (ID-11 beamline). (A) Block of mudrock impregnated in epoxy resin (thickness ca. 5 mm). (B) Rock cutting machine, which uses oil-based coolant. (C) Mudrock slab mounted on a pin (thickness ca. 1.5 mm). The arrow mark on the slab is perpendicular to the bedding. (D) Experimental set up at ESRF, ID-11 beamline. The red line is the direct X-ray beam; the yellow arrow is the 1.5 mm thick sample mounted on the stage, and the broken square indicates the position of the CCD detector.
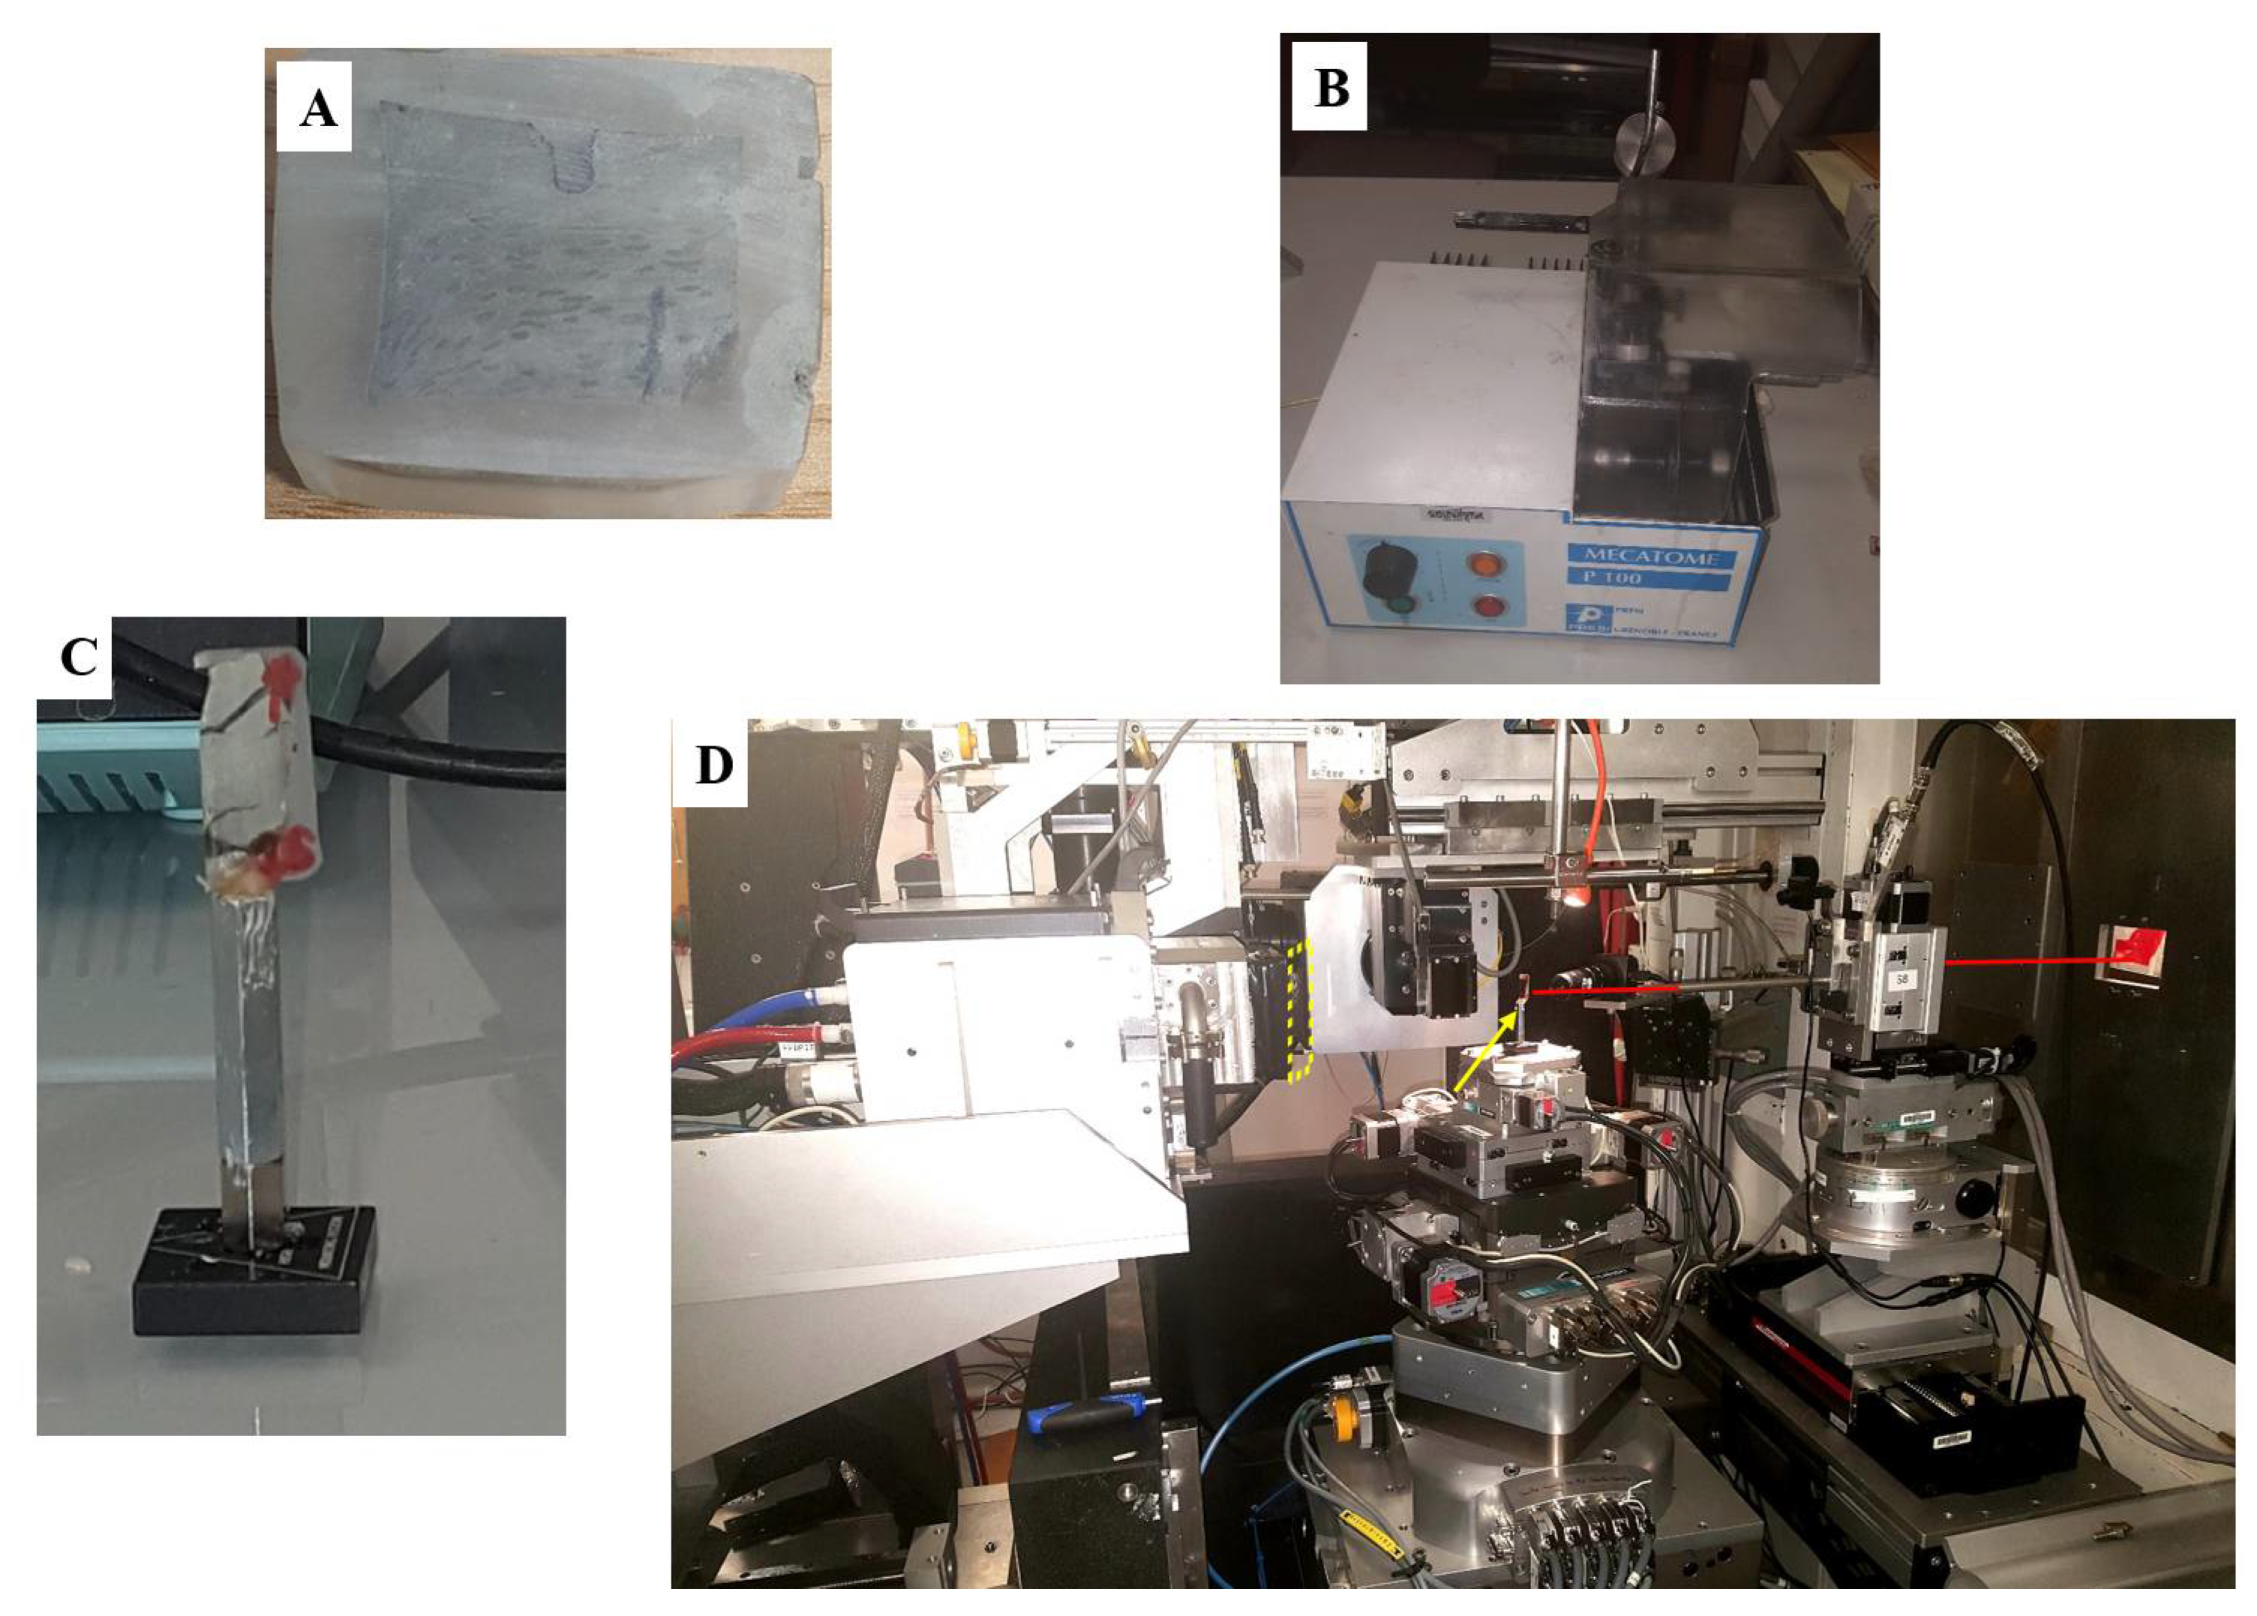
Figure 2.
Samples of diffraction image from an area of 1 mm × 1 mm with Debye rings of illite-smectite, illite-mica, and quartz indexed. Note the variation in intensity in the core of the diffraction images (phyllosilicate minerals), which signifies anisotropy, i.e., preferred orientation. (A) Well preferred orientation of illite-mica and illite-smectite. (B) Weak preferred crystallographic orientation of phyllosilicate minerals. (C) Isotropic orientation, i.e., random orientation.
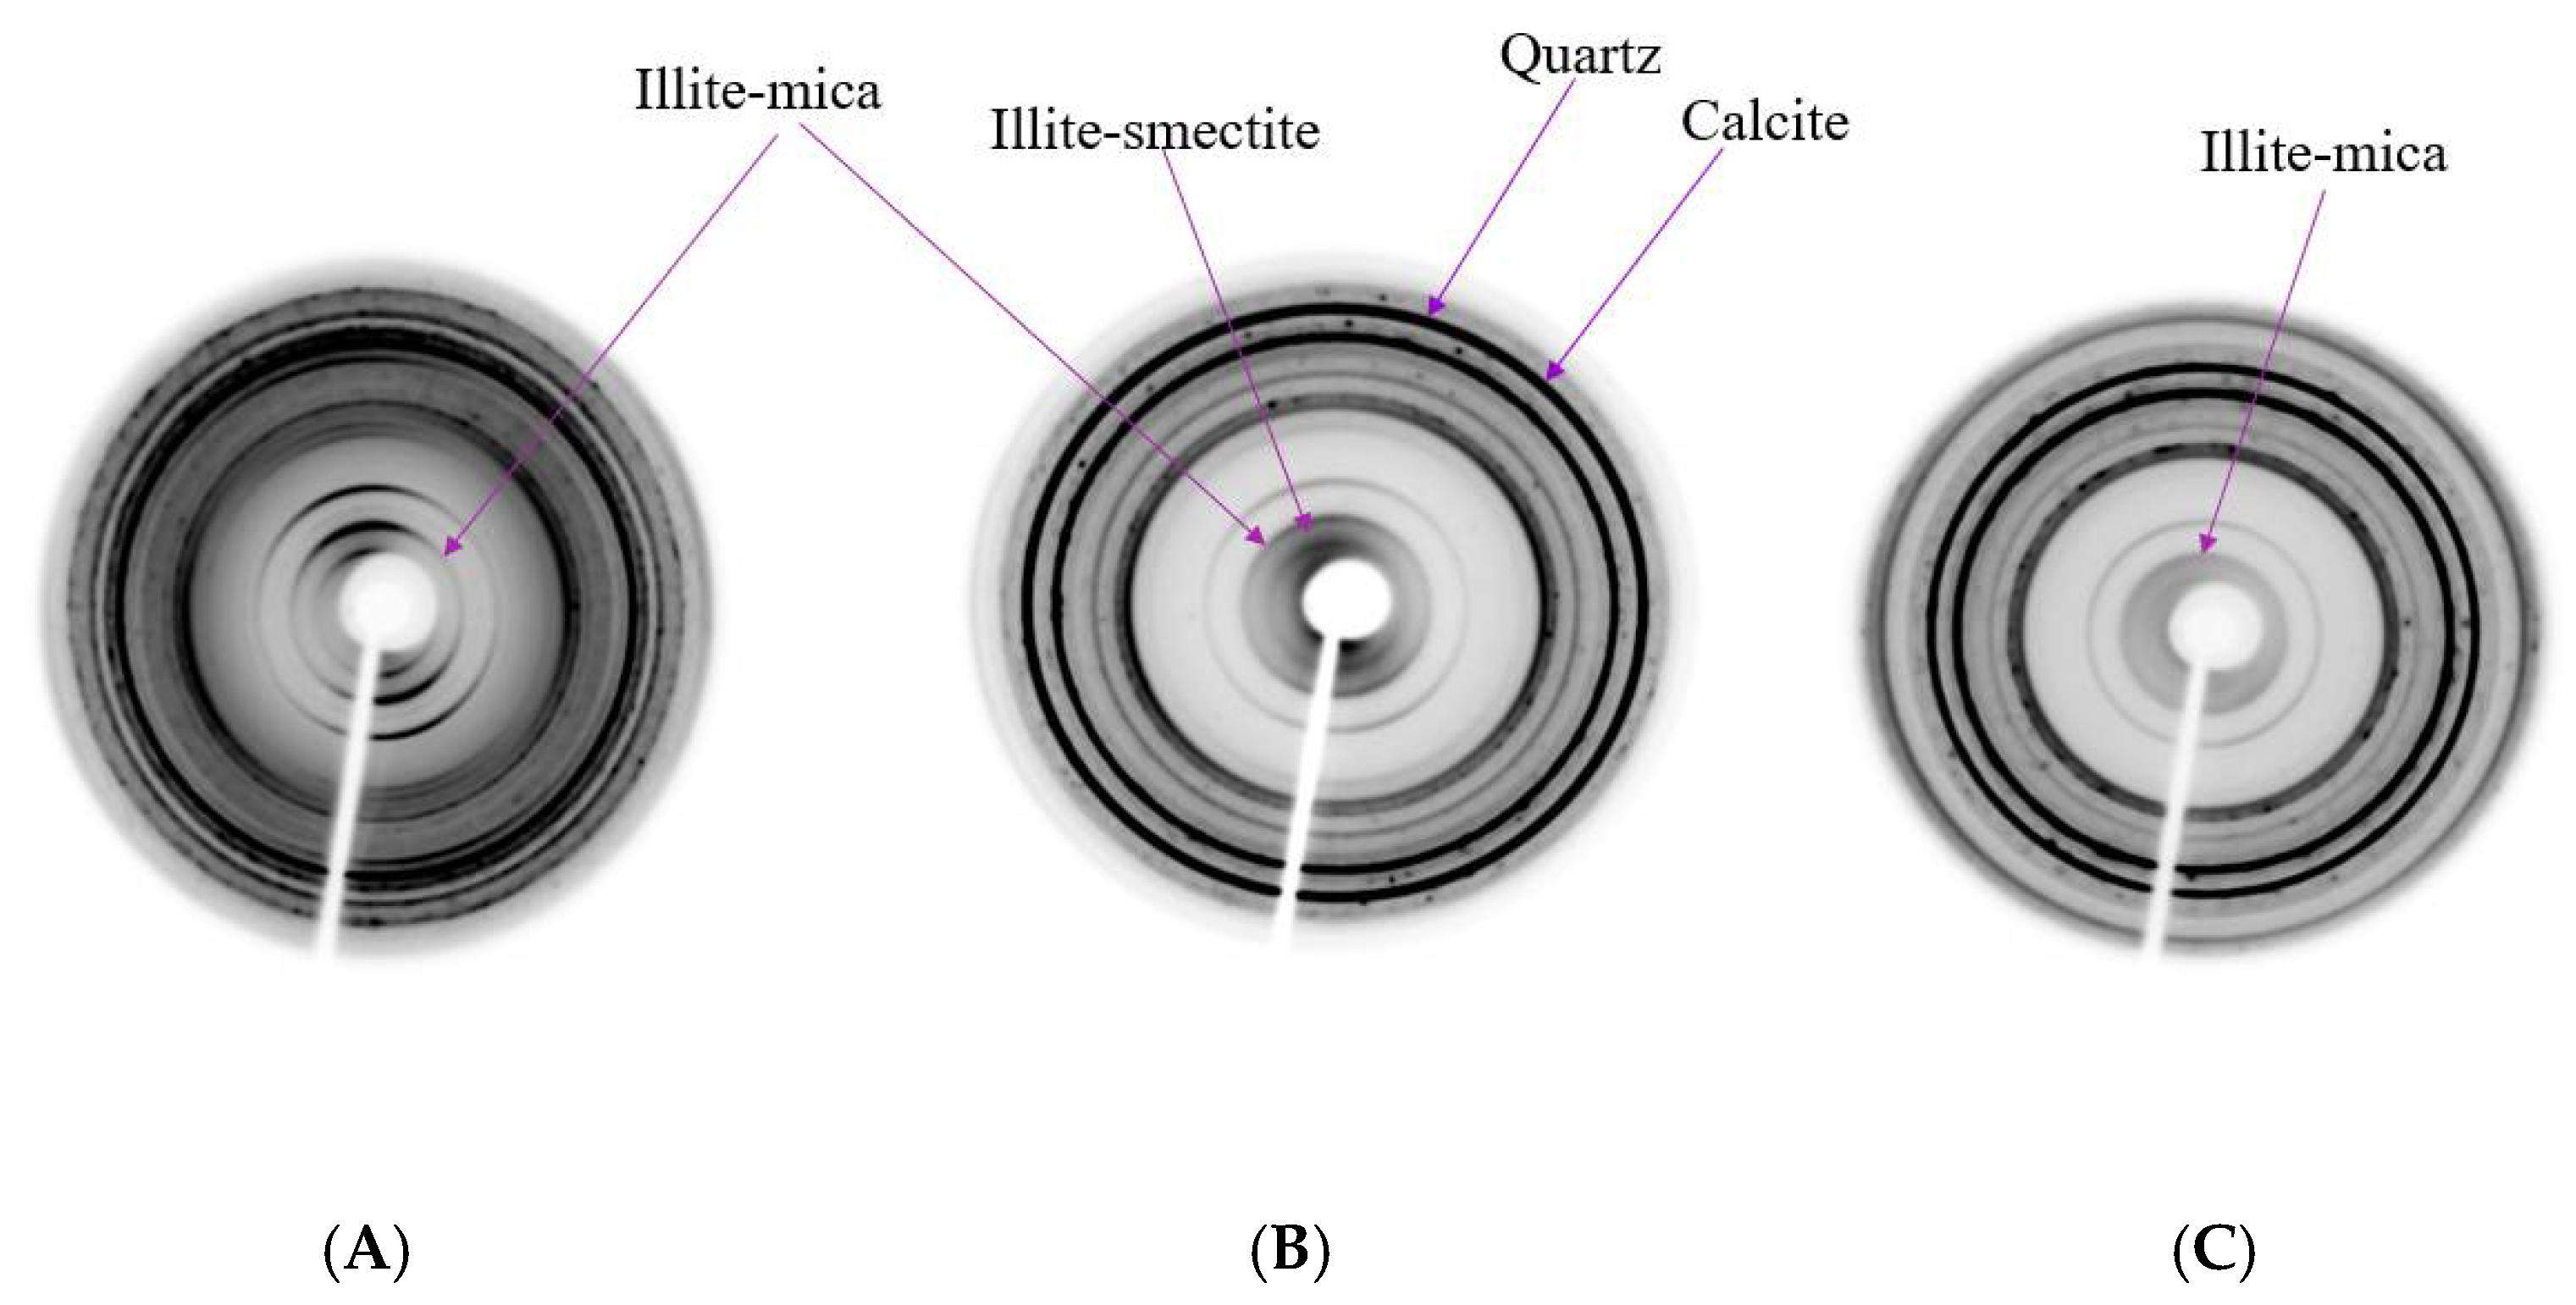
Figure 3.
Muddy contourite facies showing a varying degree of mottling due to bioturbation. All the core photographs are from expedition 339 of the IODP (A) site 1387B-2H-5A; (B) 1389A-2H-6A; (C) 1389A-7H-1A; (D) 1390A-7H-4A. Note the presence of bi-gradational grading in core 1390A-7H-4A.
Figure 3.
Muddy contourite facies showing a varying degree of mottling due to bioturbation. All the core photographs are from expedition 339 of the IODP (A) site 1387B-2H-5A; (B) 1389A-2H-6A; (C) 1389A-7H-1A; (D) 1390A-7H-4A. Note the presence of bi-gradational grading in core 1390A-7H-4A.

Figure 4.
Core photographs showing typical hemipelagite facies from site 1385 of expedition 339 with pervasive mottling. The core photos display intense bioturbations and distinct colour cyclicity, in which lighter grey intervals have higher biogenic carbonate and darker grey intervals are rich in terrigenous components. Ch-Chondrites, Pl-Planolites, Tha-Thalassinoides, Z-Zoophycos. (A) 1385E-6H1-A; (B) 1385A-10H-7A; (C) 1385E-6H-1A; (D) 1385A-7H-1A; (E) 1385A-11H-3A.

Figure 5.
Core photographs of typical turbidite facies from site 1457 of expedition 355. The turbidite sequences are characterised by dark grey sandy silt or silt and normal grading to pale grey mud. Ts-thin layer of silty sand, Es-erosional surface, L-laminated. (A) 1457A-8H-2A; (B) 1457A-1F-1A; (C) 1457C-9R-1A; (D) 1457C-38R-2A.

Figure 6.
Distribution of grain size within deep-water sedimentary facies.

Figure 7.
Bivariate plot of mean versus sorting (inclusive of standard deviation). (A) Turbidite facies can be found in both contourites and hemipelagites areas. (B) A distinct boundary exists between contourites and hemipelagites.
Figure 7.
Bivariate plot of mean versus sorting (inclusive of standard deviation). (A) Turbidite facies can be found in both contourites and hemipelagites areas. (B) A distinct boundary exists between contourites and hemipelagites.
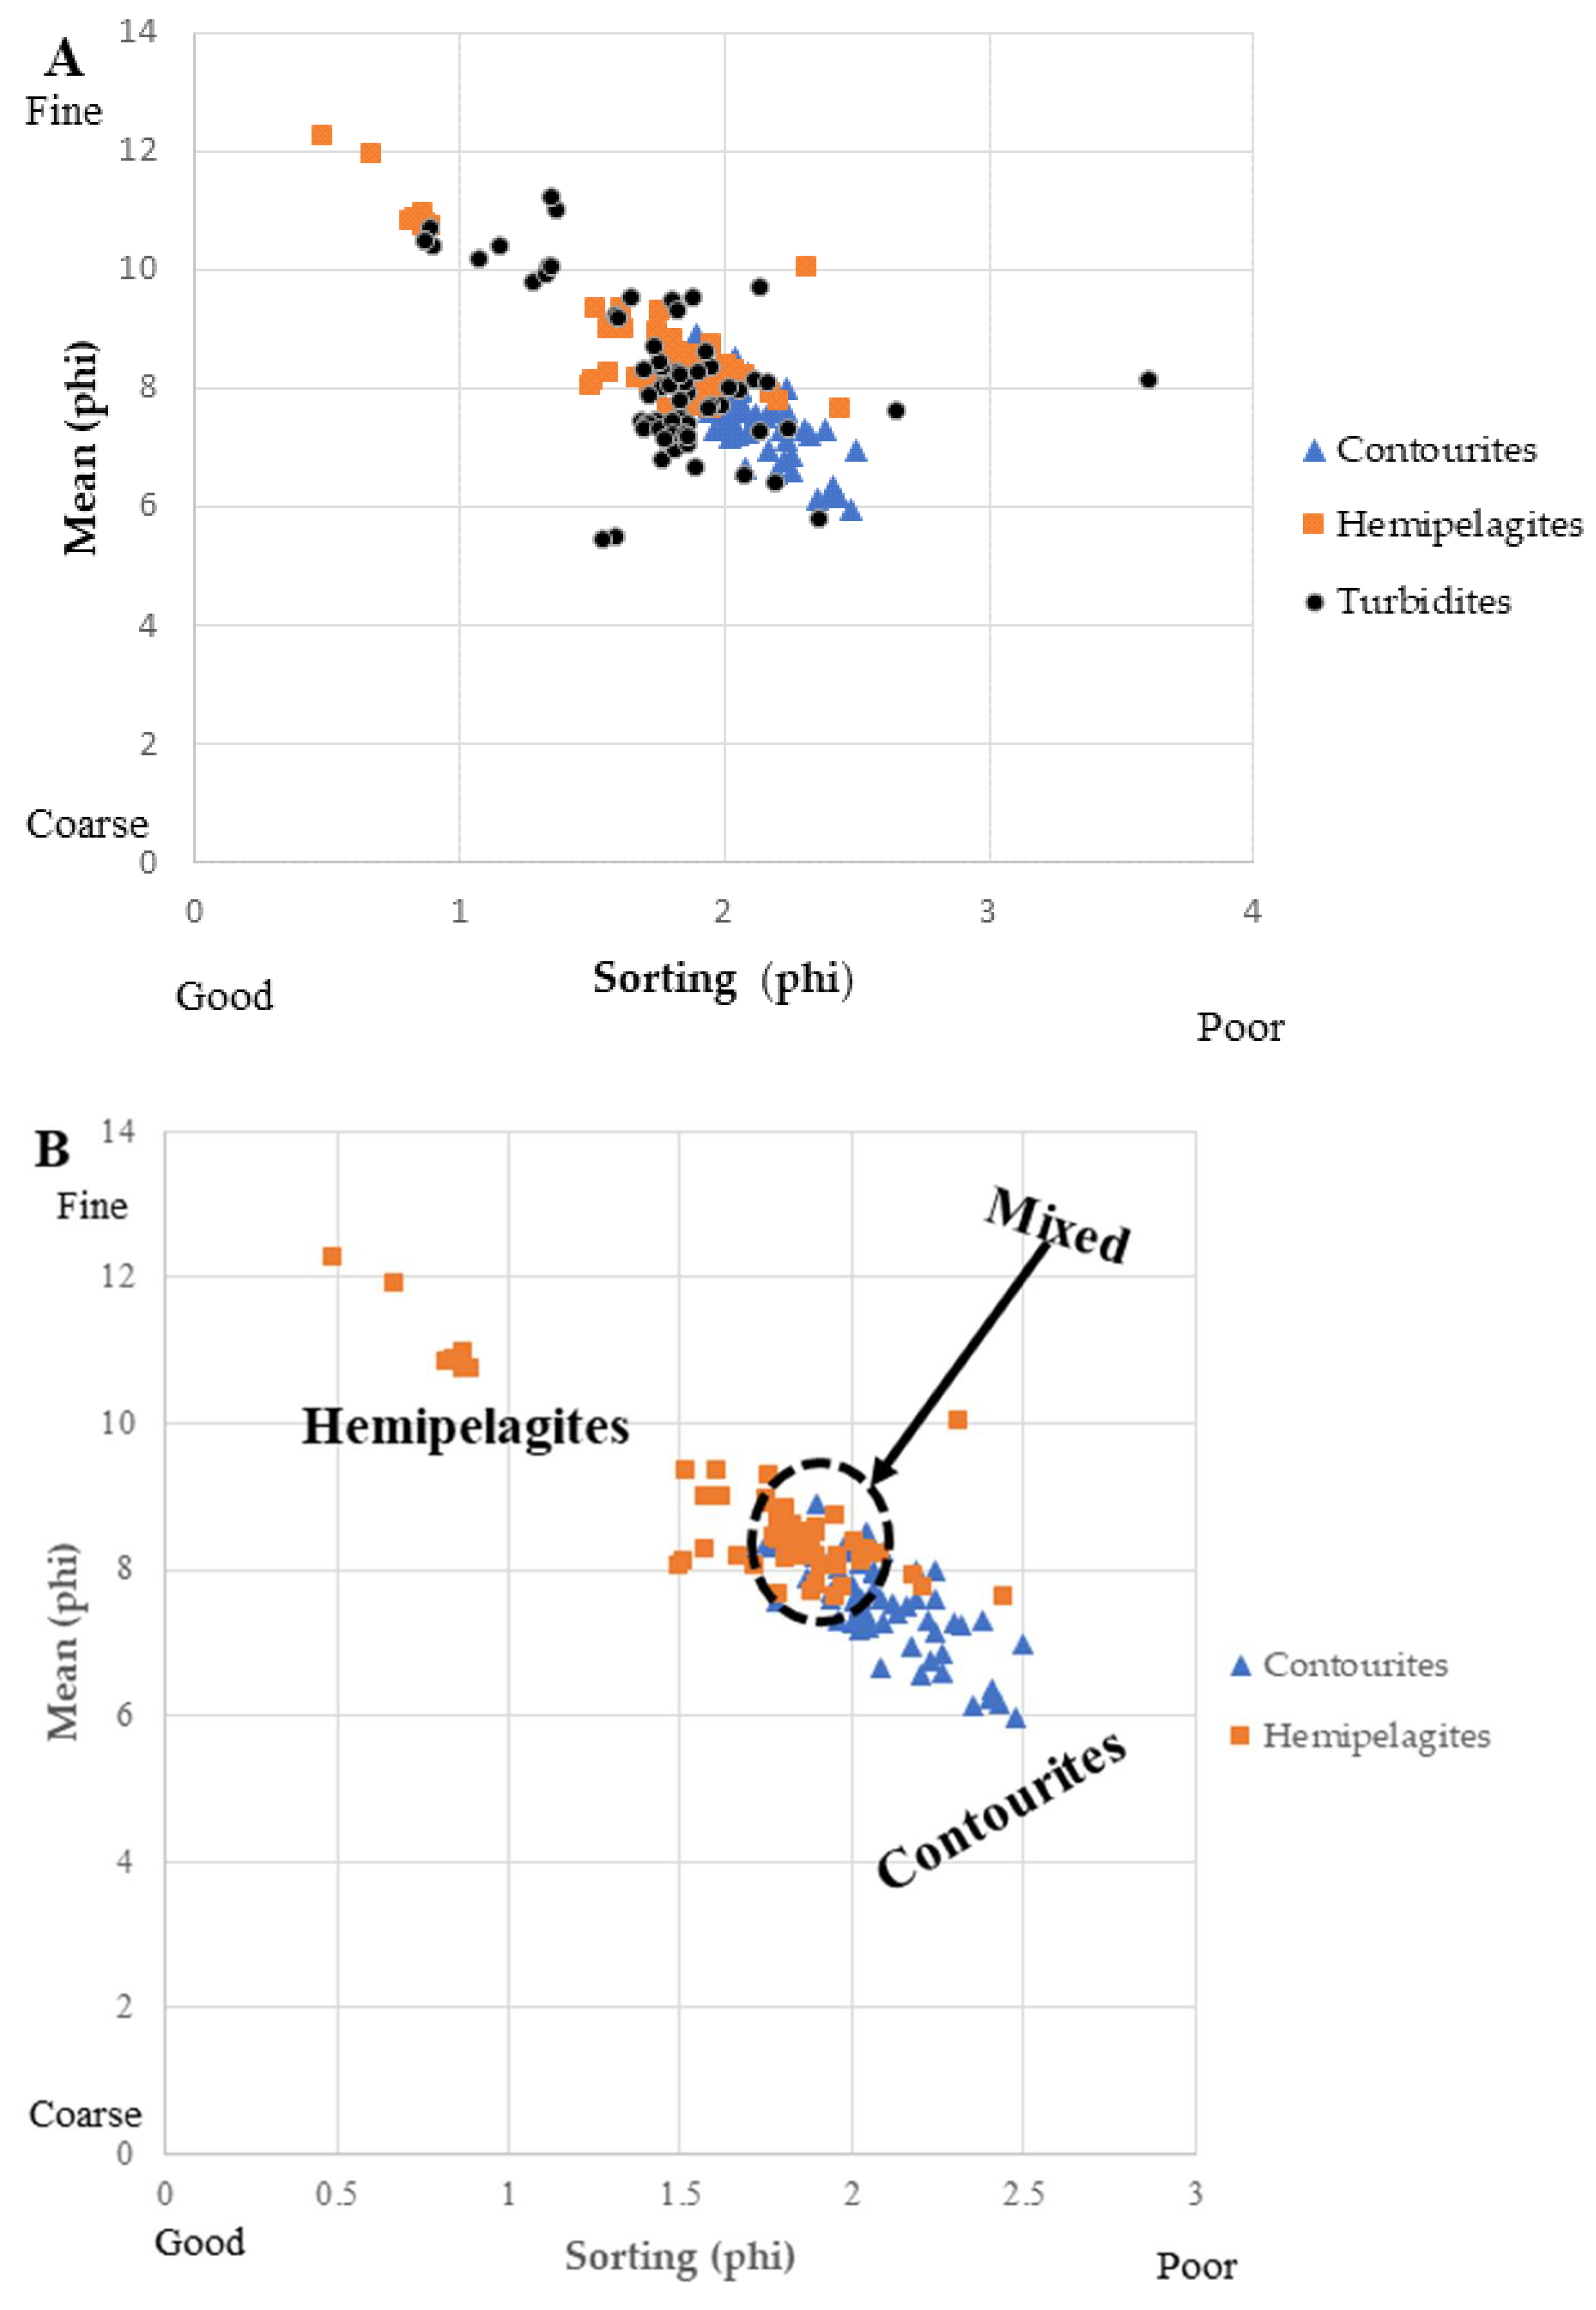
Figure 8.
Cross plot of Kurtosis versus average grain size. (A) There is no clear boundary between turbidites and contourites and between turbidites and hemipelagites. (B) There exists a defined boundary between contourites and hemipelagites.
Figure 8.
Cross plot of Kurtosis versus average grain size. (A) There is no clear boundary between turbidites and contourites and between turbidites and hemipelagites. (B) There exists a defined boundary between contourites and hemipelagites.
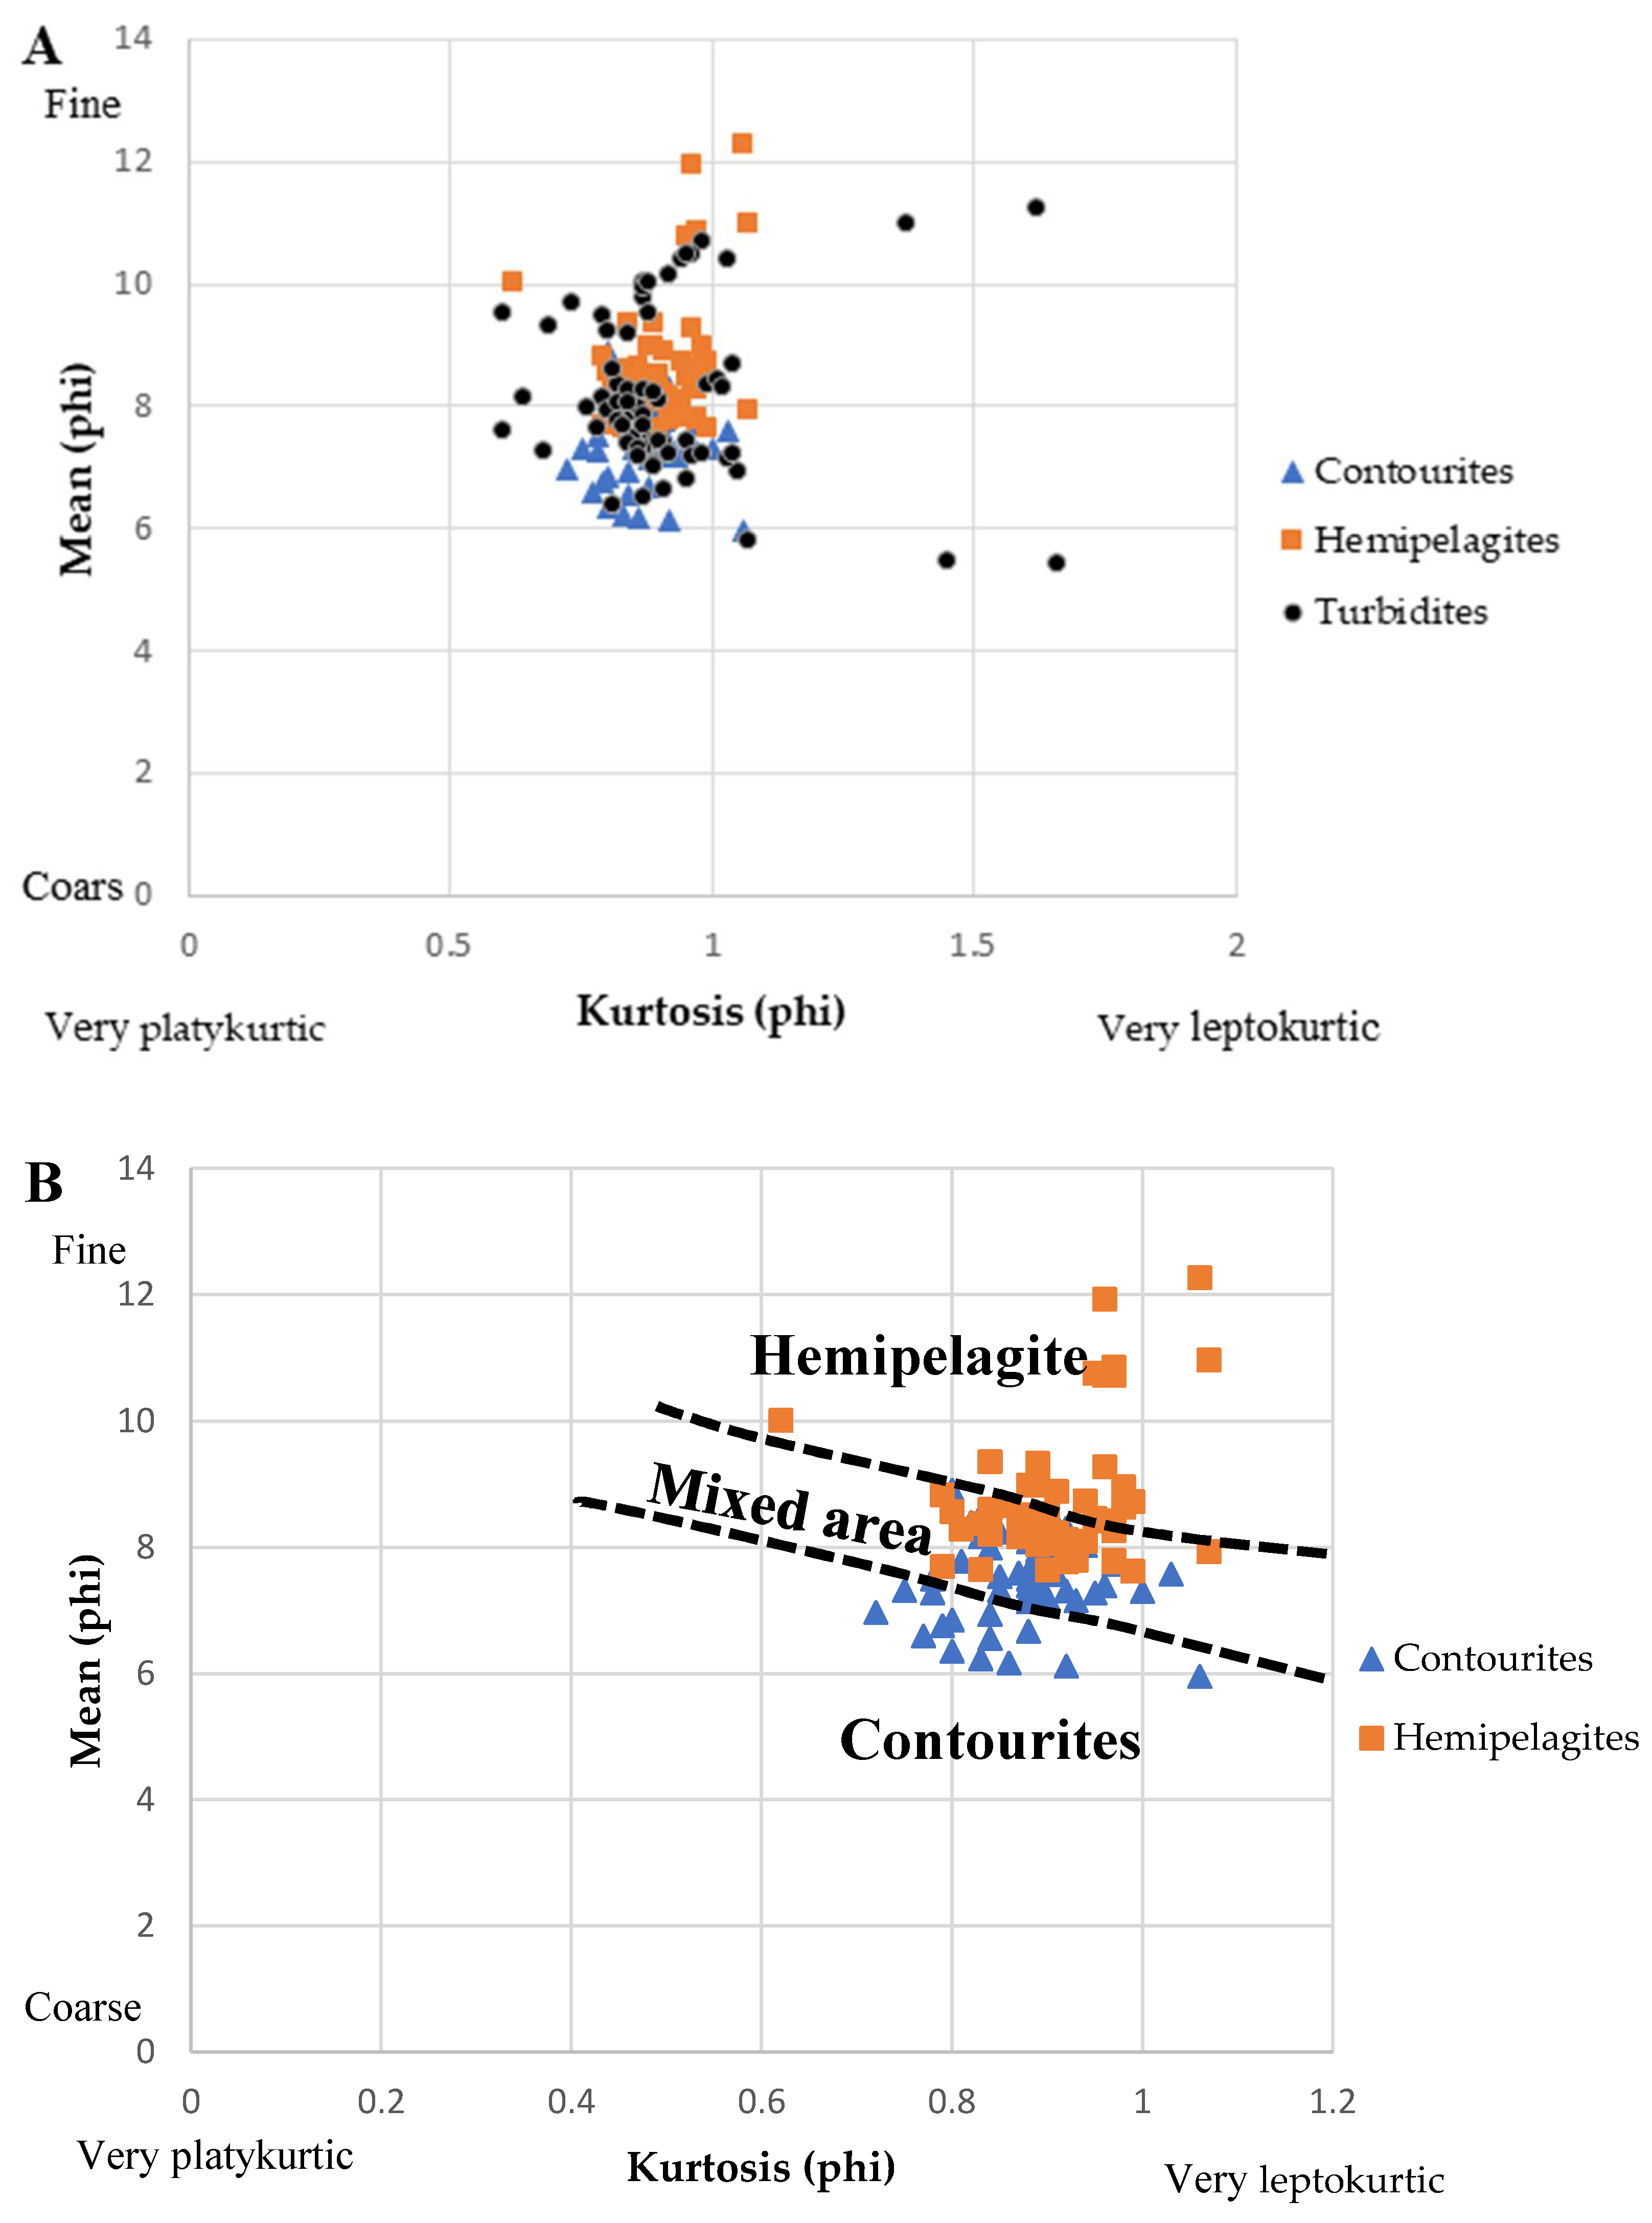
Figure 9.
Bivariate plot of skewness versus mean. (A) All the three facies, with turbidites plotting in both contourites and hemipelagites regions. (B) Contourites and hemipelagites, with a clearer boundary between the two sediment types and a mixed area.
Figure 9.
Bivariate plot of skewness versus mean. (A) All the three facies, with turbidites plotting in both contourites and hemipelagites regions. (B) Contourites and hemipelagites, with a clearer boundary between the two sediment types and a mixed area.
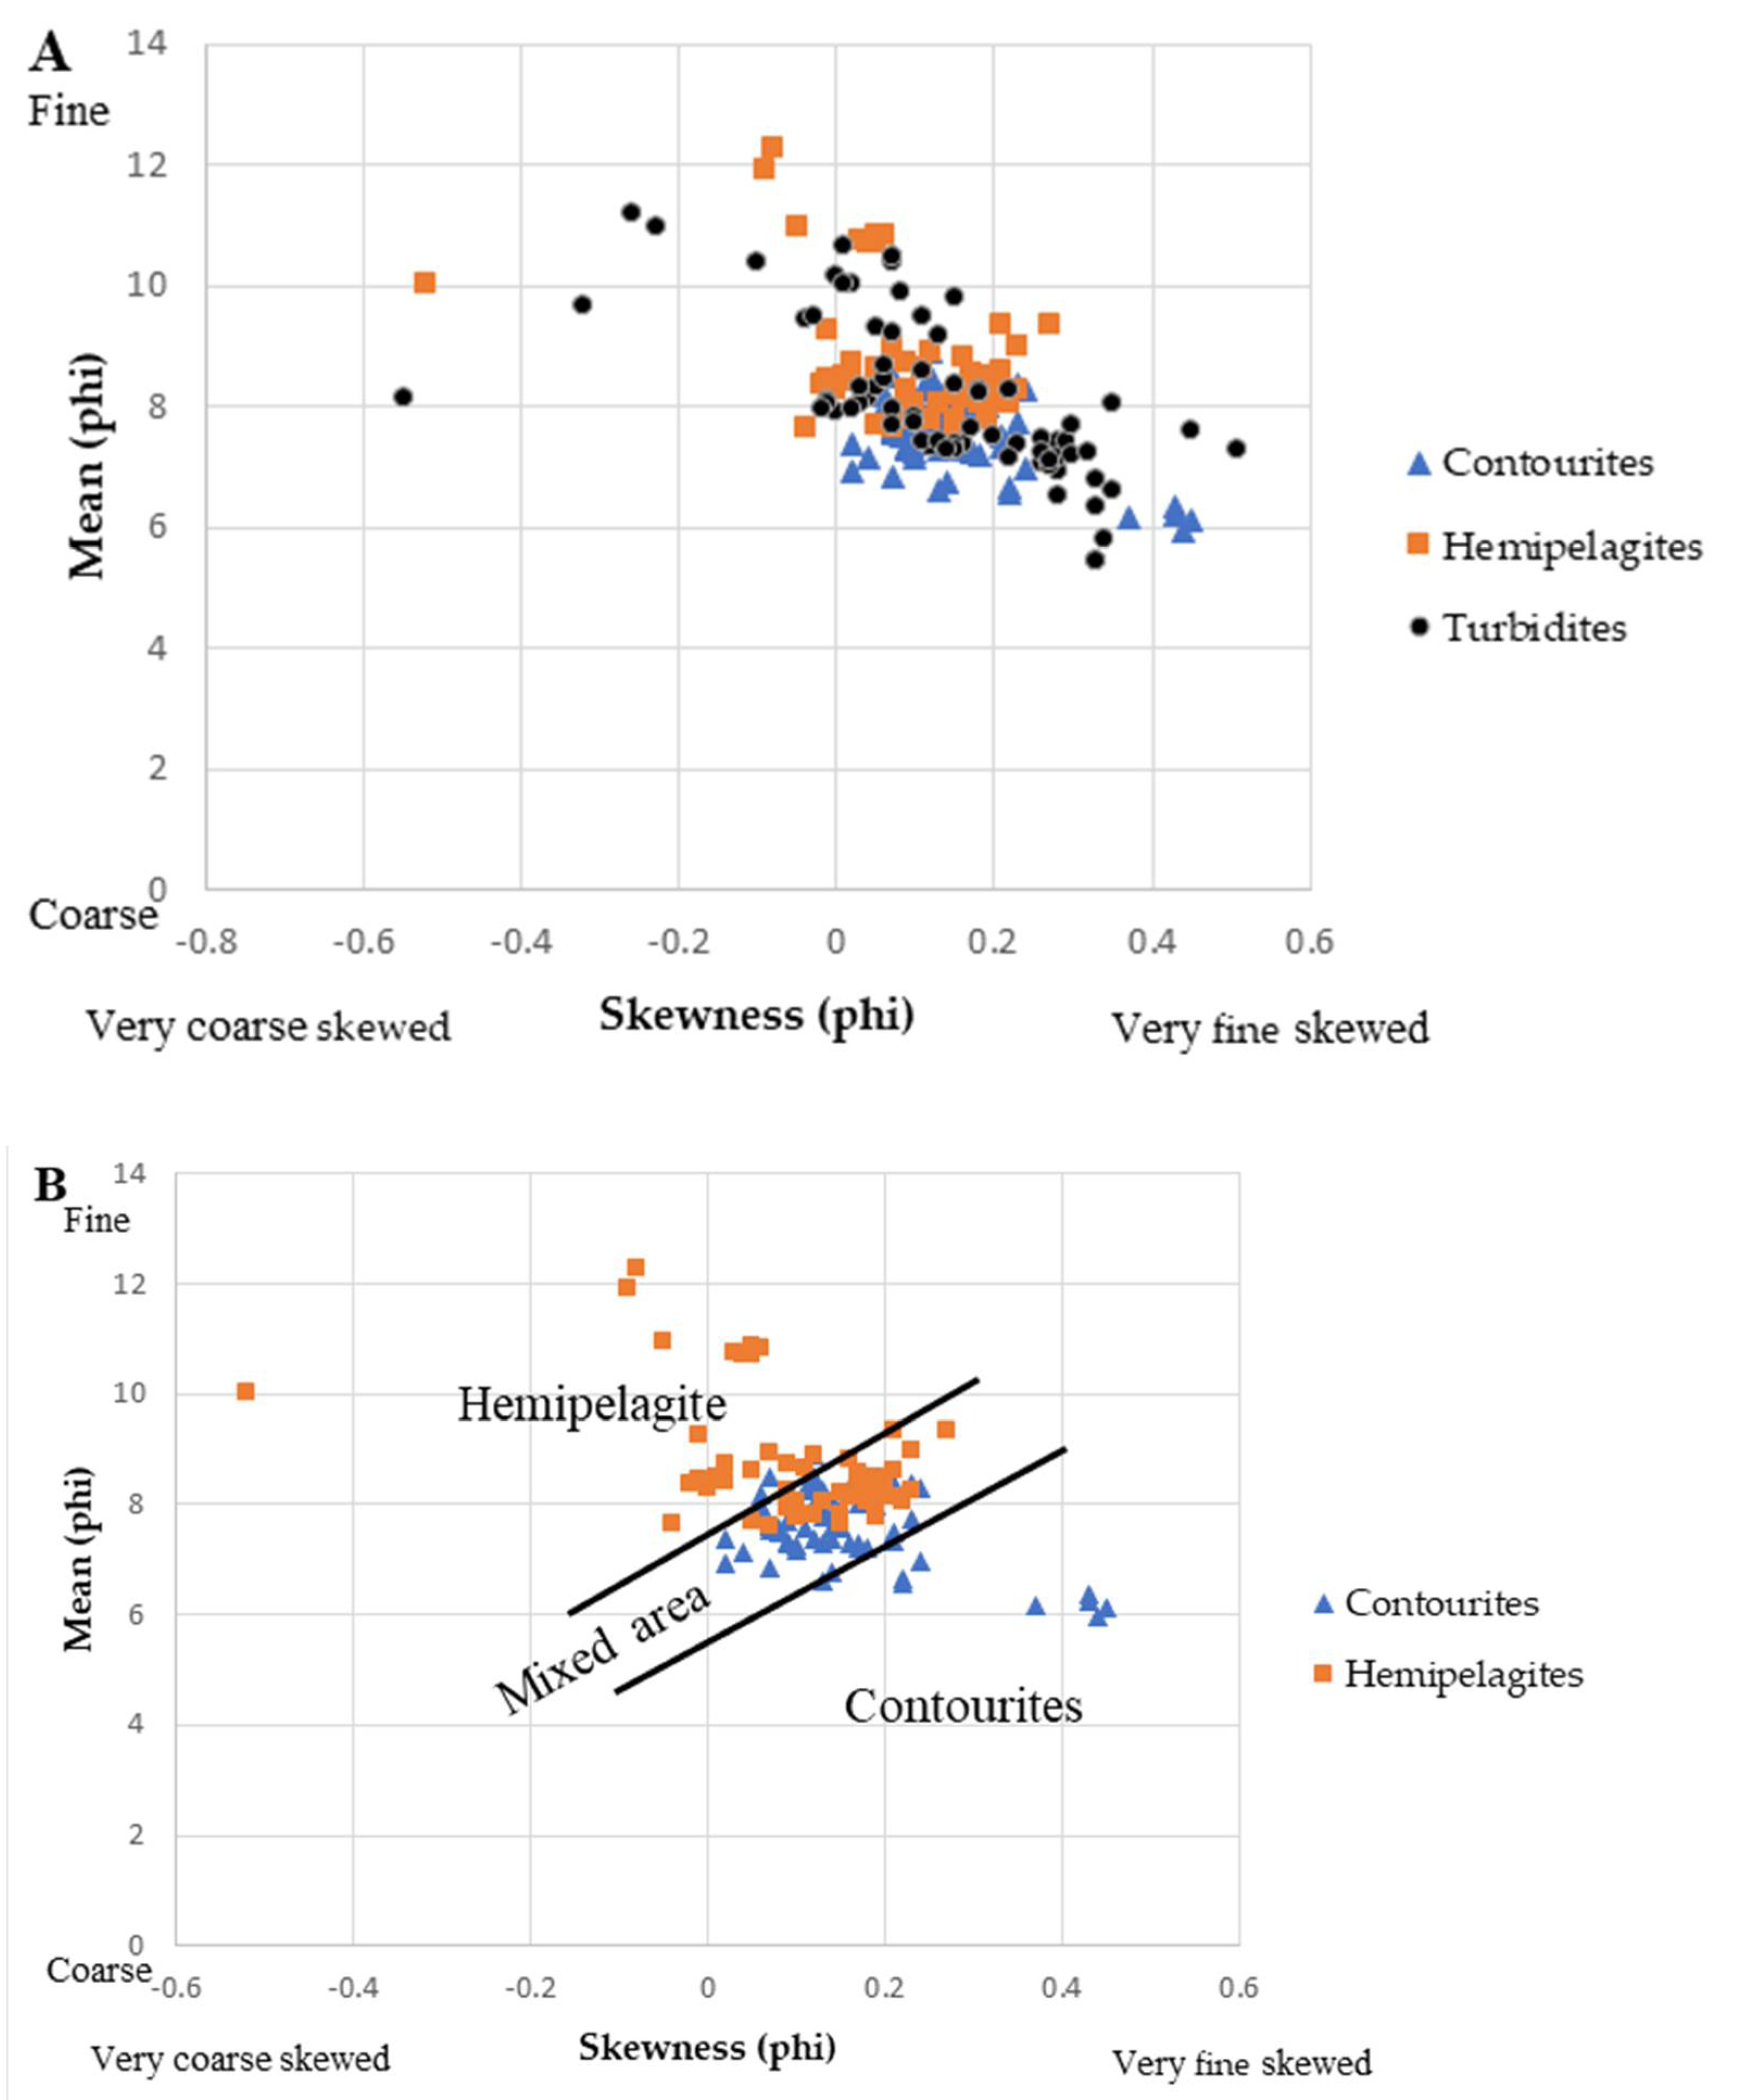
Figure 10.
BSE-SEM images of typical contourite facies showing their microfabric. The direction of bedding is parallel to scales in the micrographs (A) Chaotic fabric and matrix-supported to grain supported patterns (B) Tunicate spicule (Ts) at the centre of the image and clearer grain supported pattern. Note, the black box in A shows mudclast.
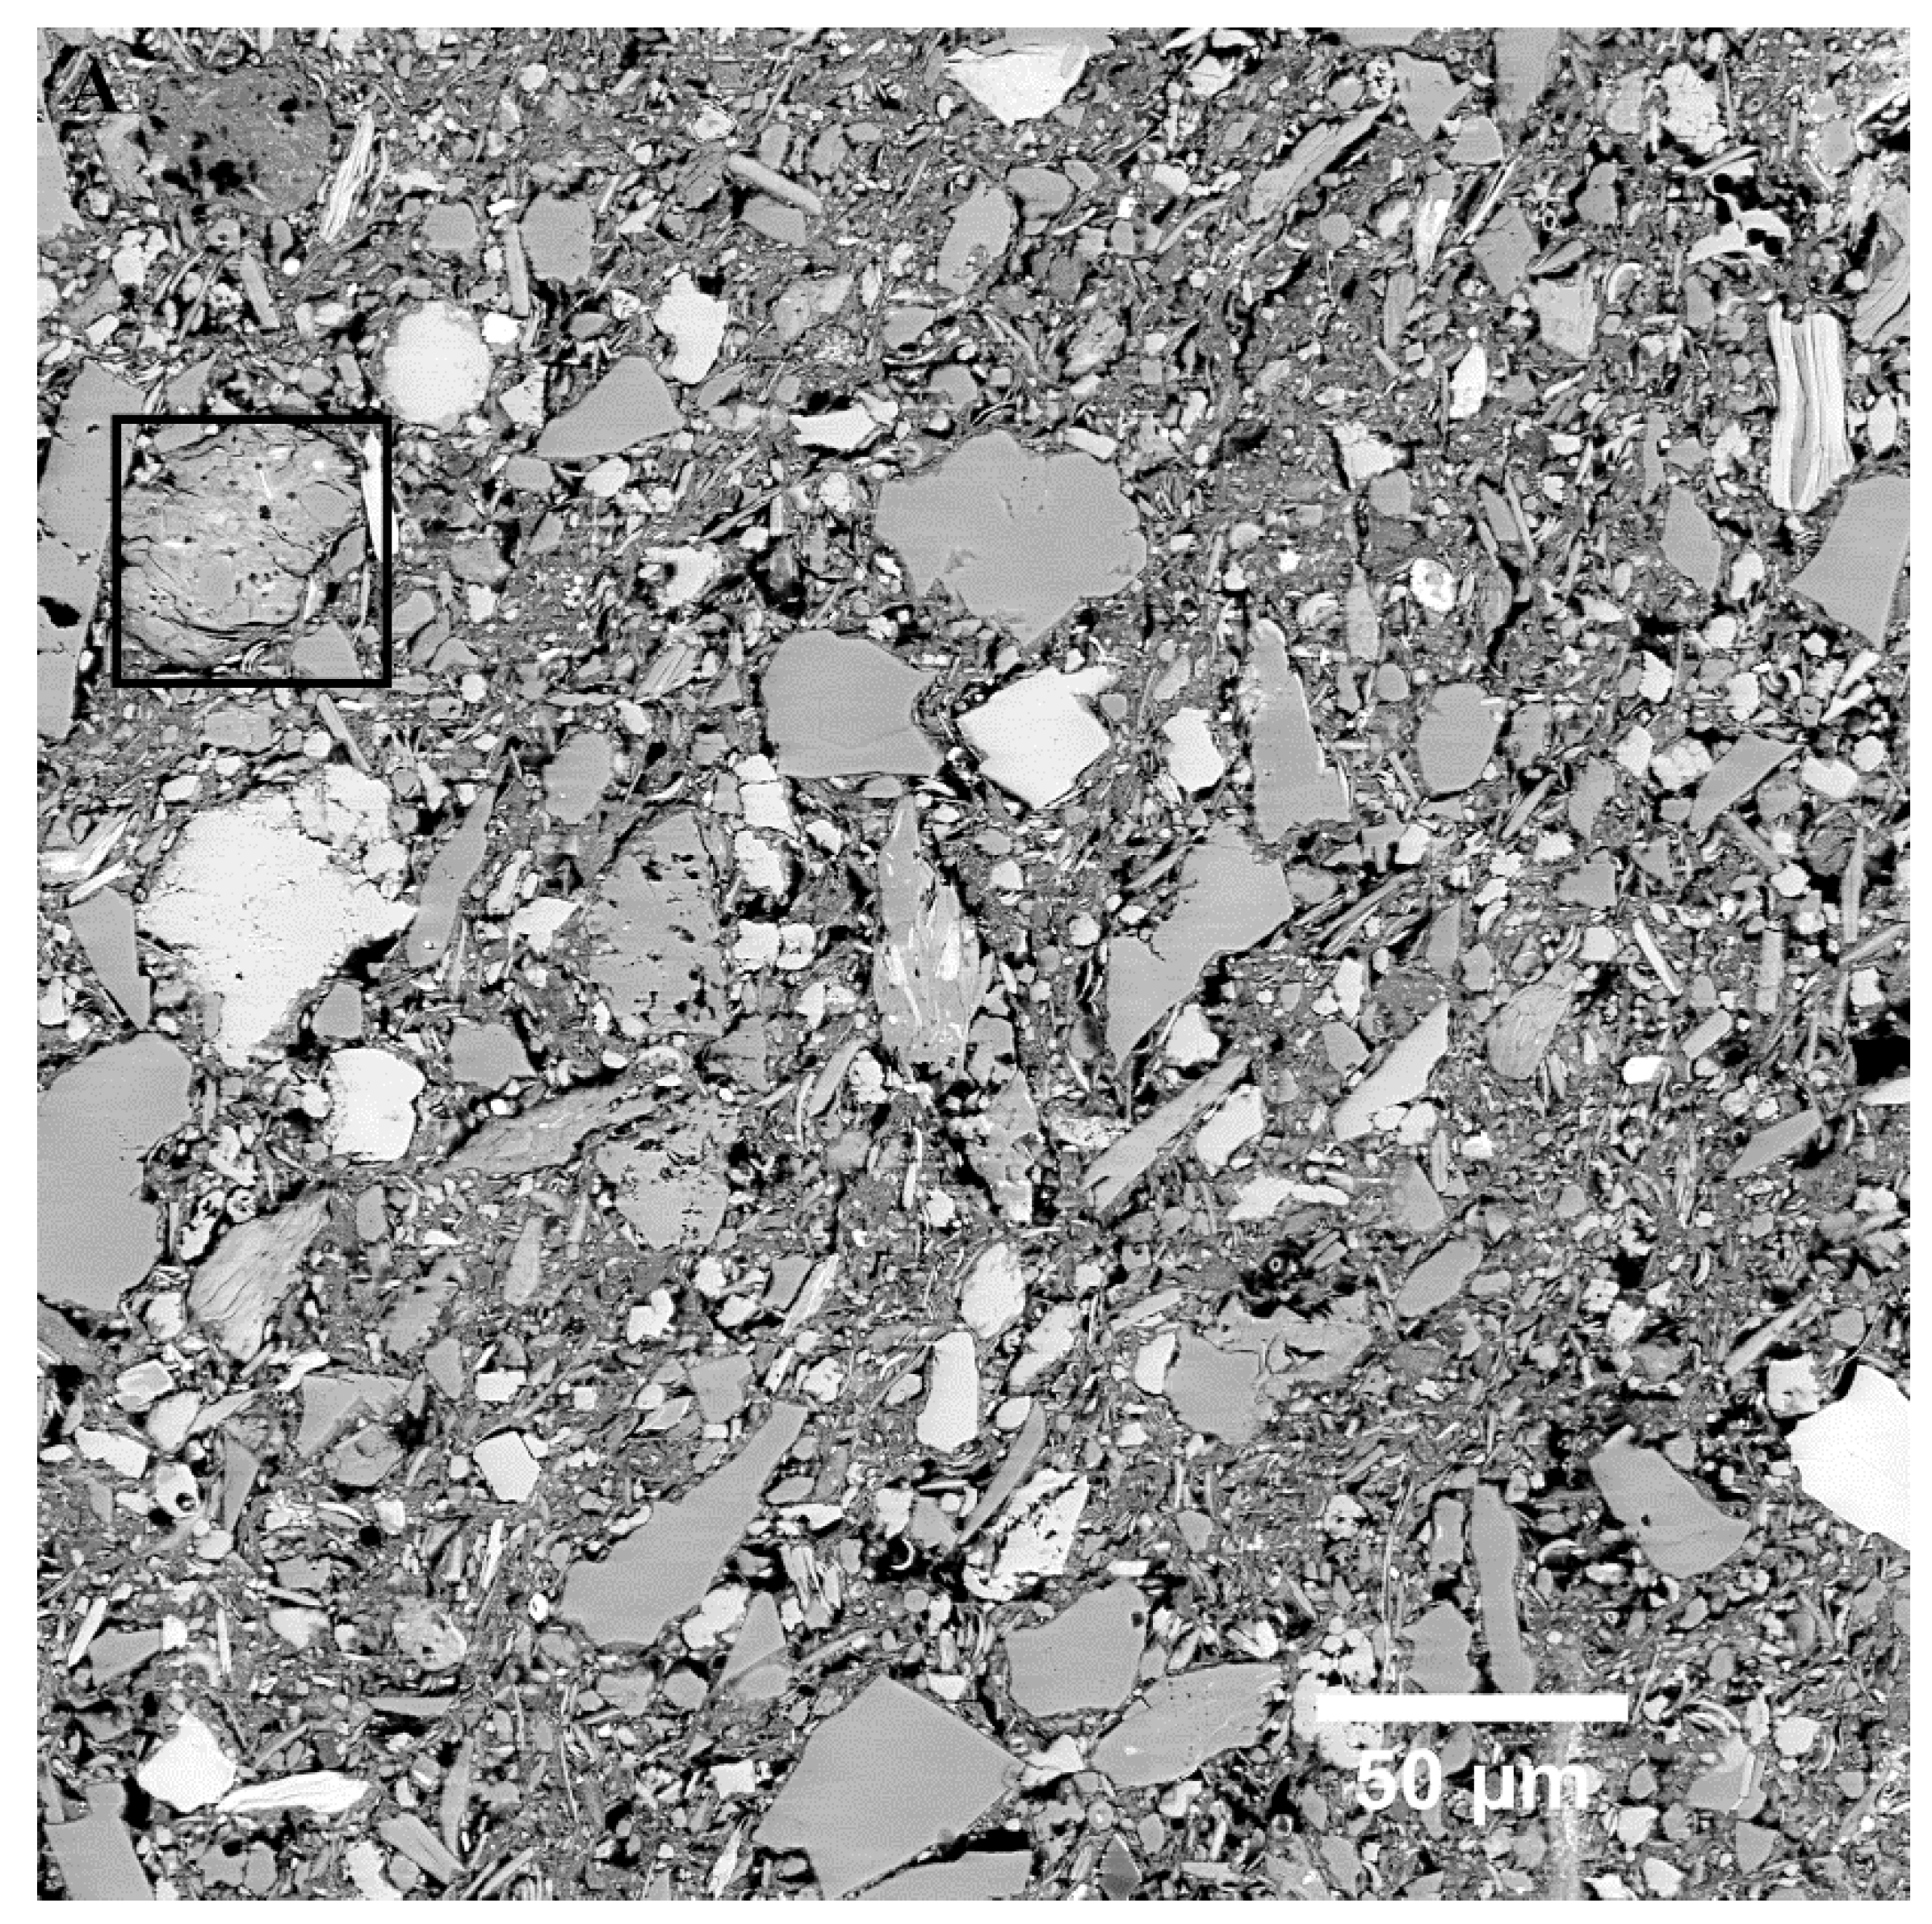
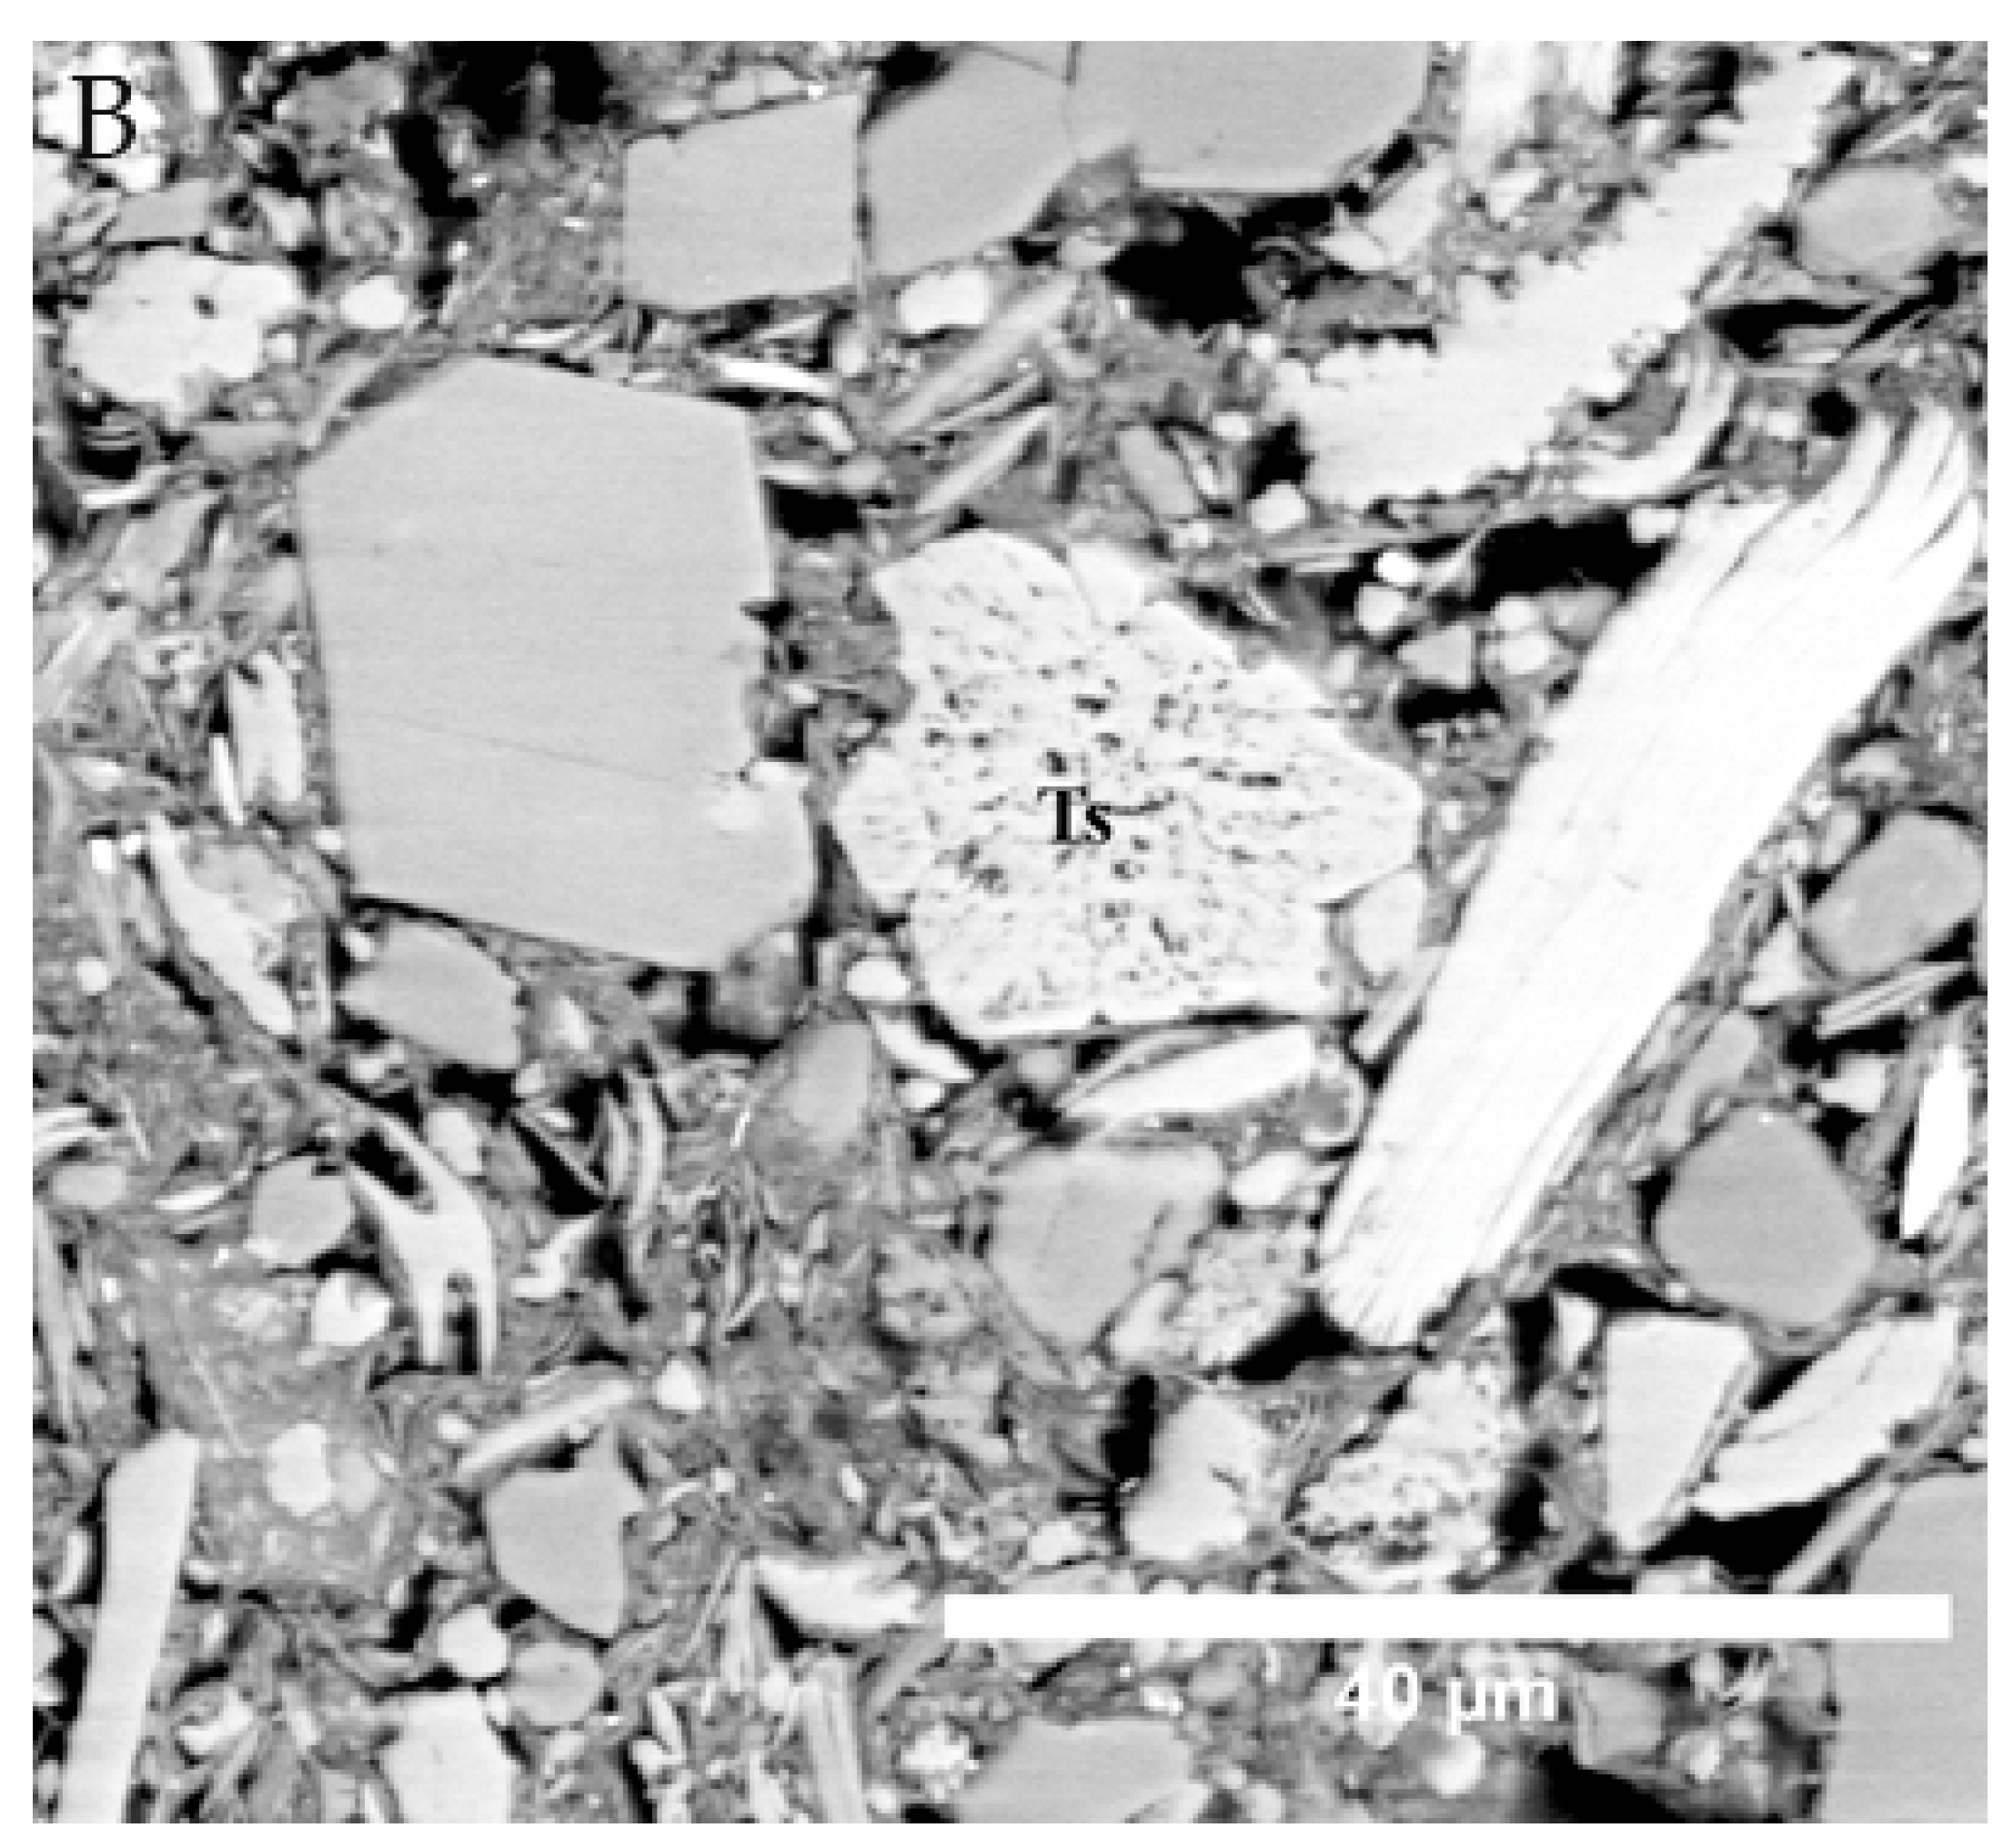
Figure 11.
BSE-SEM image of hemipelagites showing their representative fabric. Note that bedding plane is parallel to the scales. (A) Random fabric and siliciclastic rich (B) Random fabric and calcareous dominated. Note the framboidal pyrites filling the inclined burrow and grains around the burrow are generally inclined.

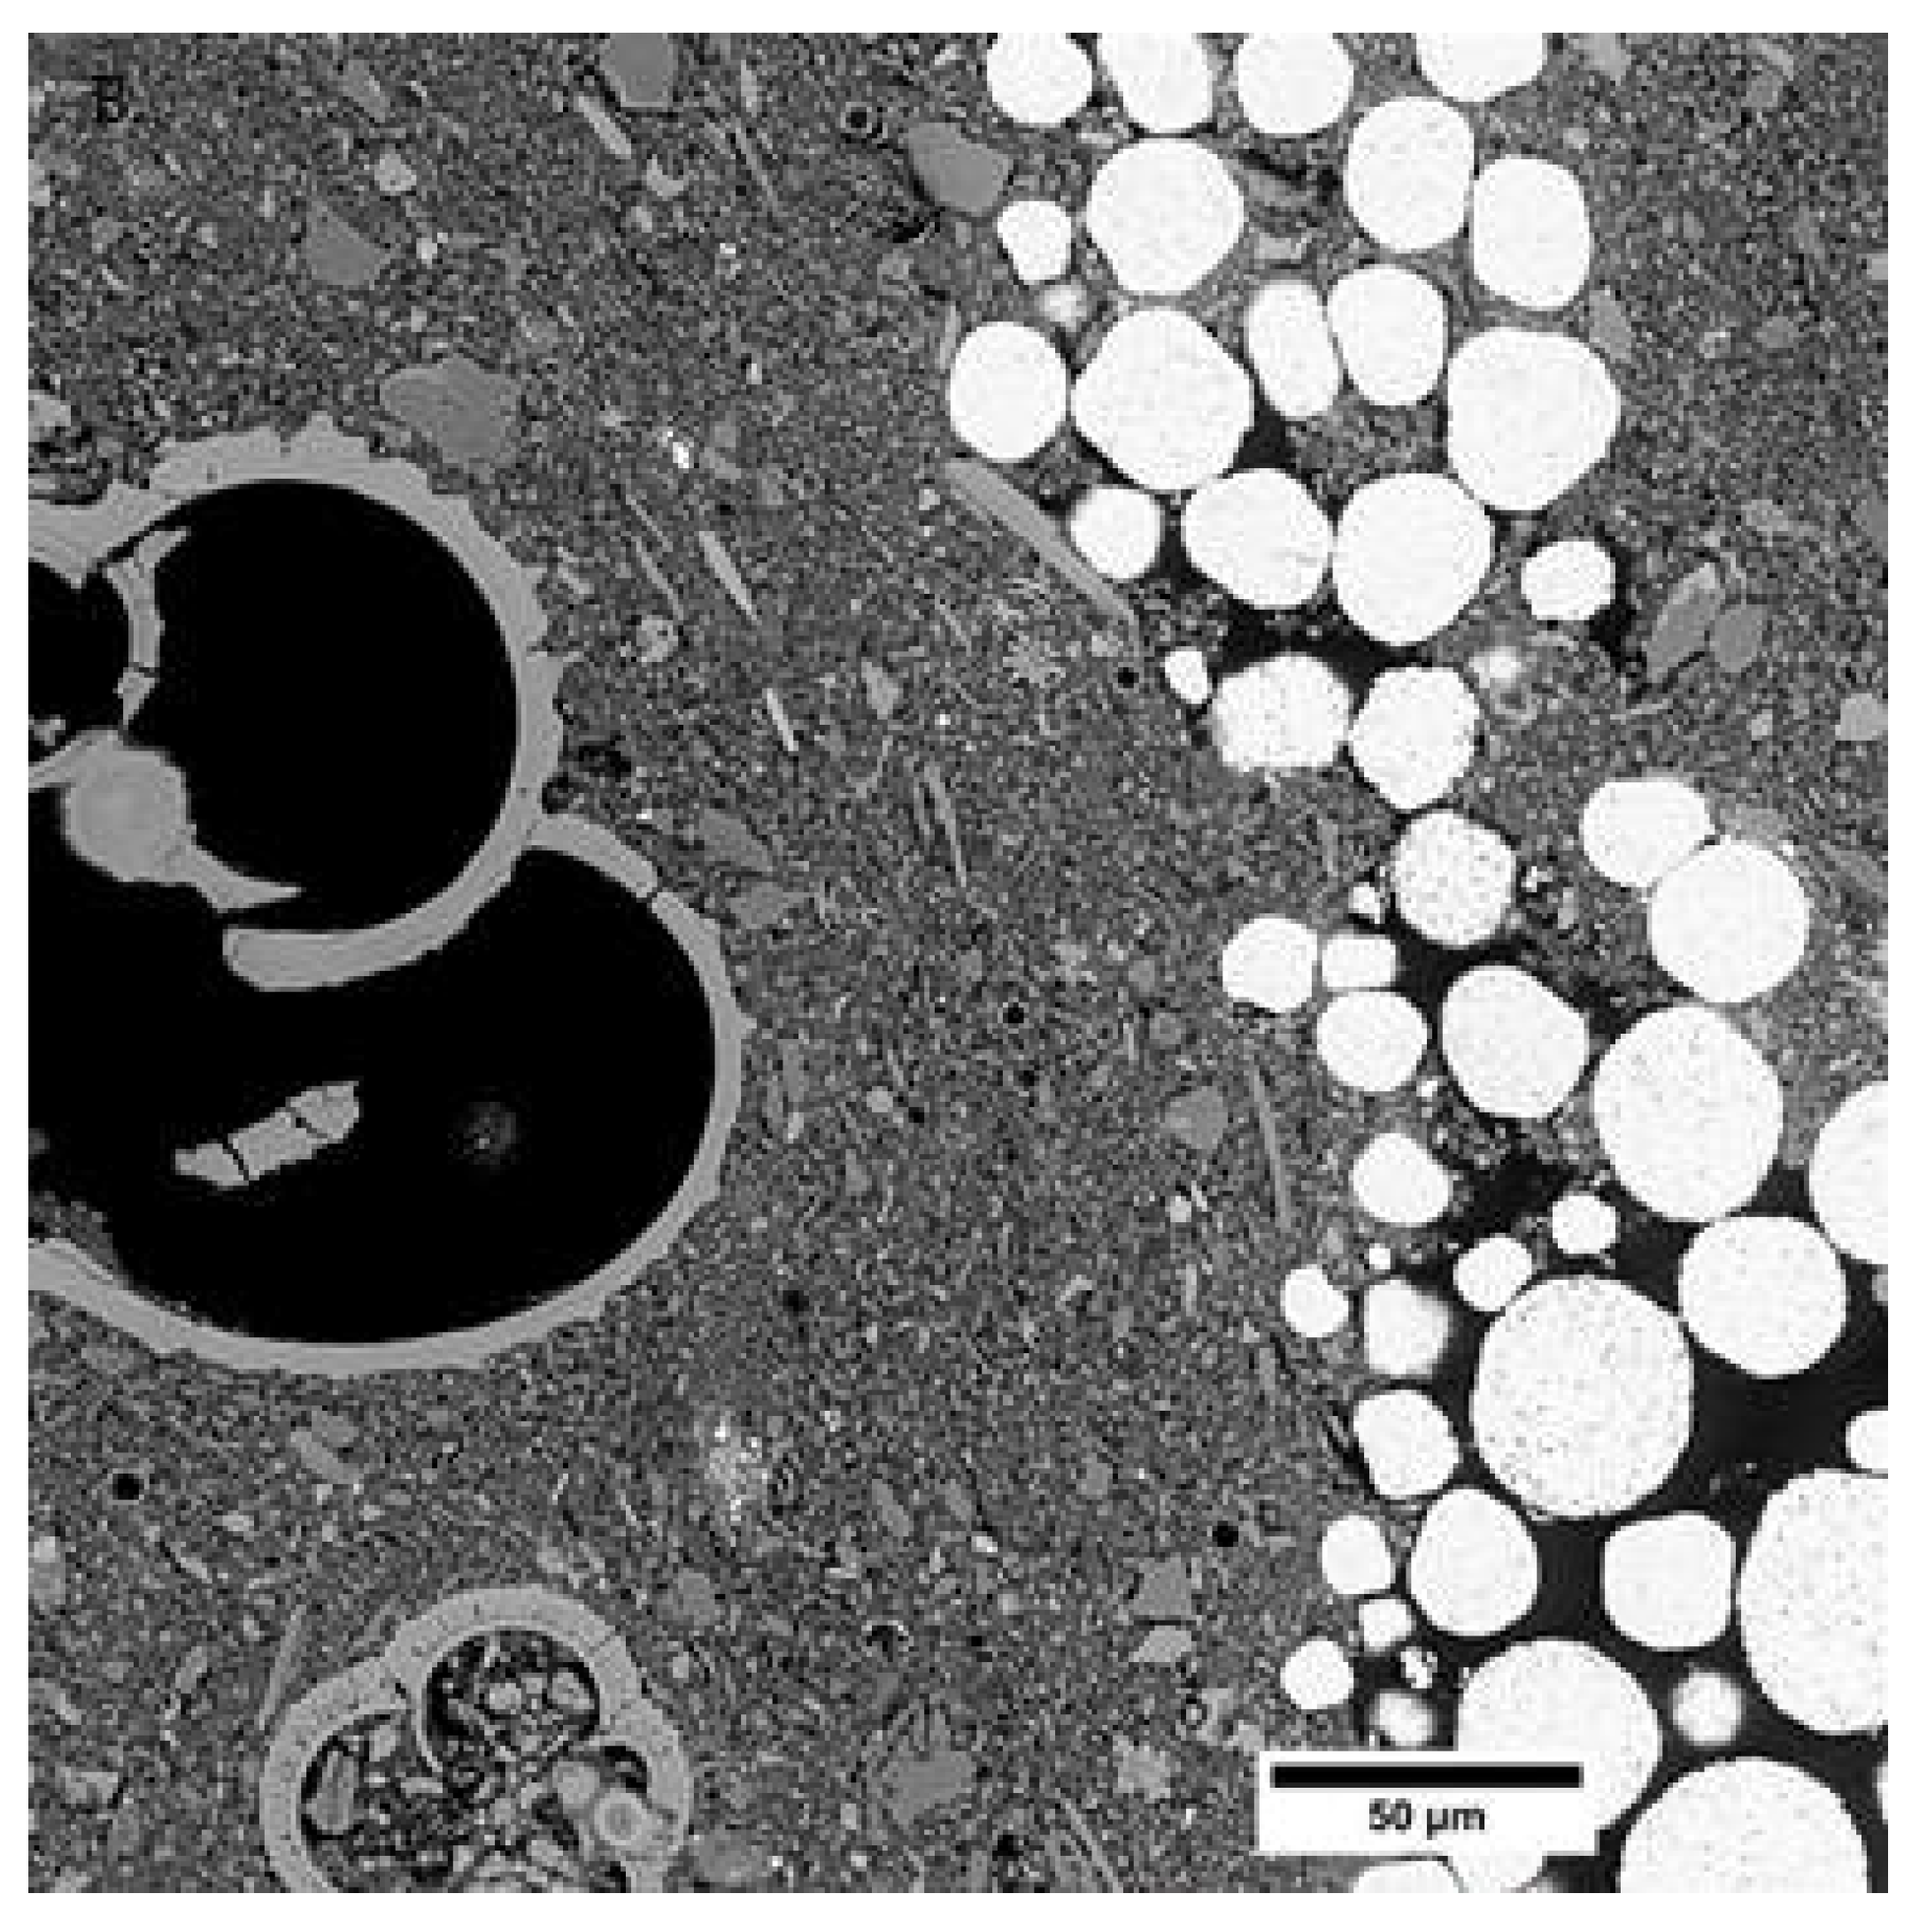
Figure 12.
BSE-SEM images show typical microfabric of turbidite facies. The elongated grains appear to be parallel along the bedding plane and shows matrix-supported fabric.
Figure 12.
BSE-SEM images show typical microfabric of turbidite facies. The elongated grains appear to be parallel along the bedding plane and shows matrix-supported fabric.

Figure 13.
Sample of rose diagrams showing orientation patterns for (A) contourites, (B) hemipelagites, and (C) turbidites. The arrow indicates the direction of the bedding. Contourites are generally random but are somewhat parallel to bedding. Hemipelagites are characterised by a mixture of oblique and random orientations while turbidites are dominantly parallel to bedding. OB = oblique, P = bedding parallel, R = random orientation, SR = semi-random.

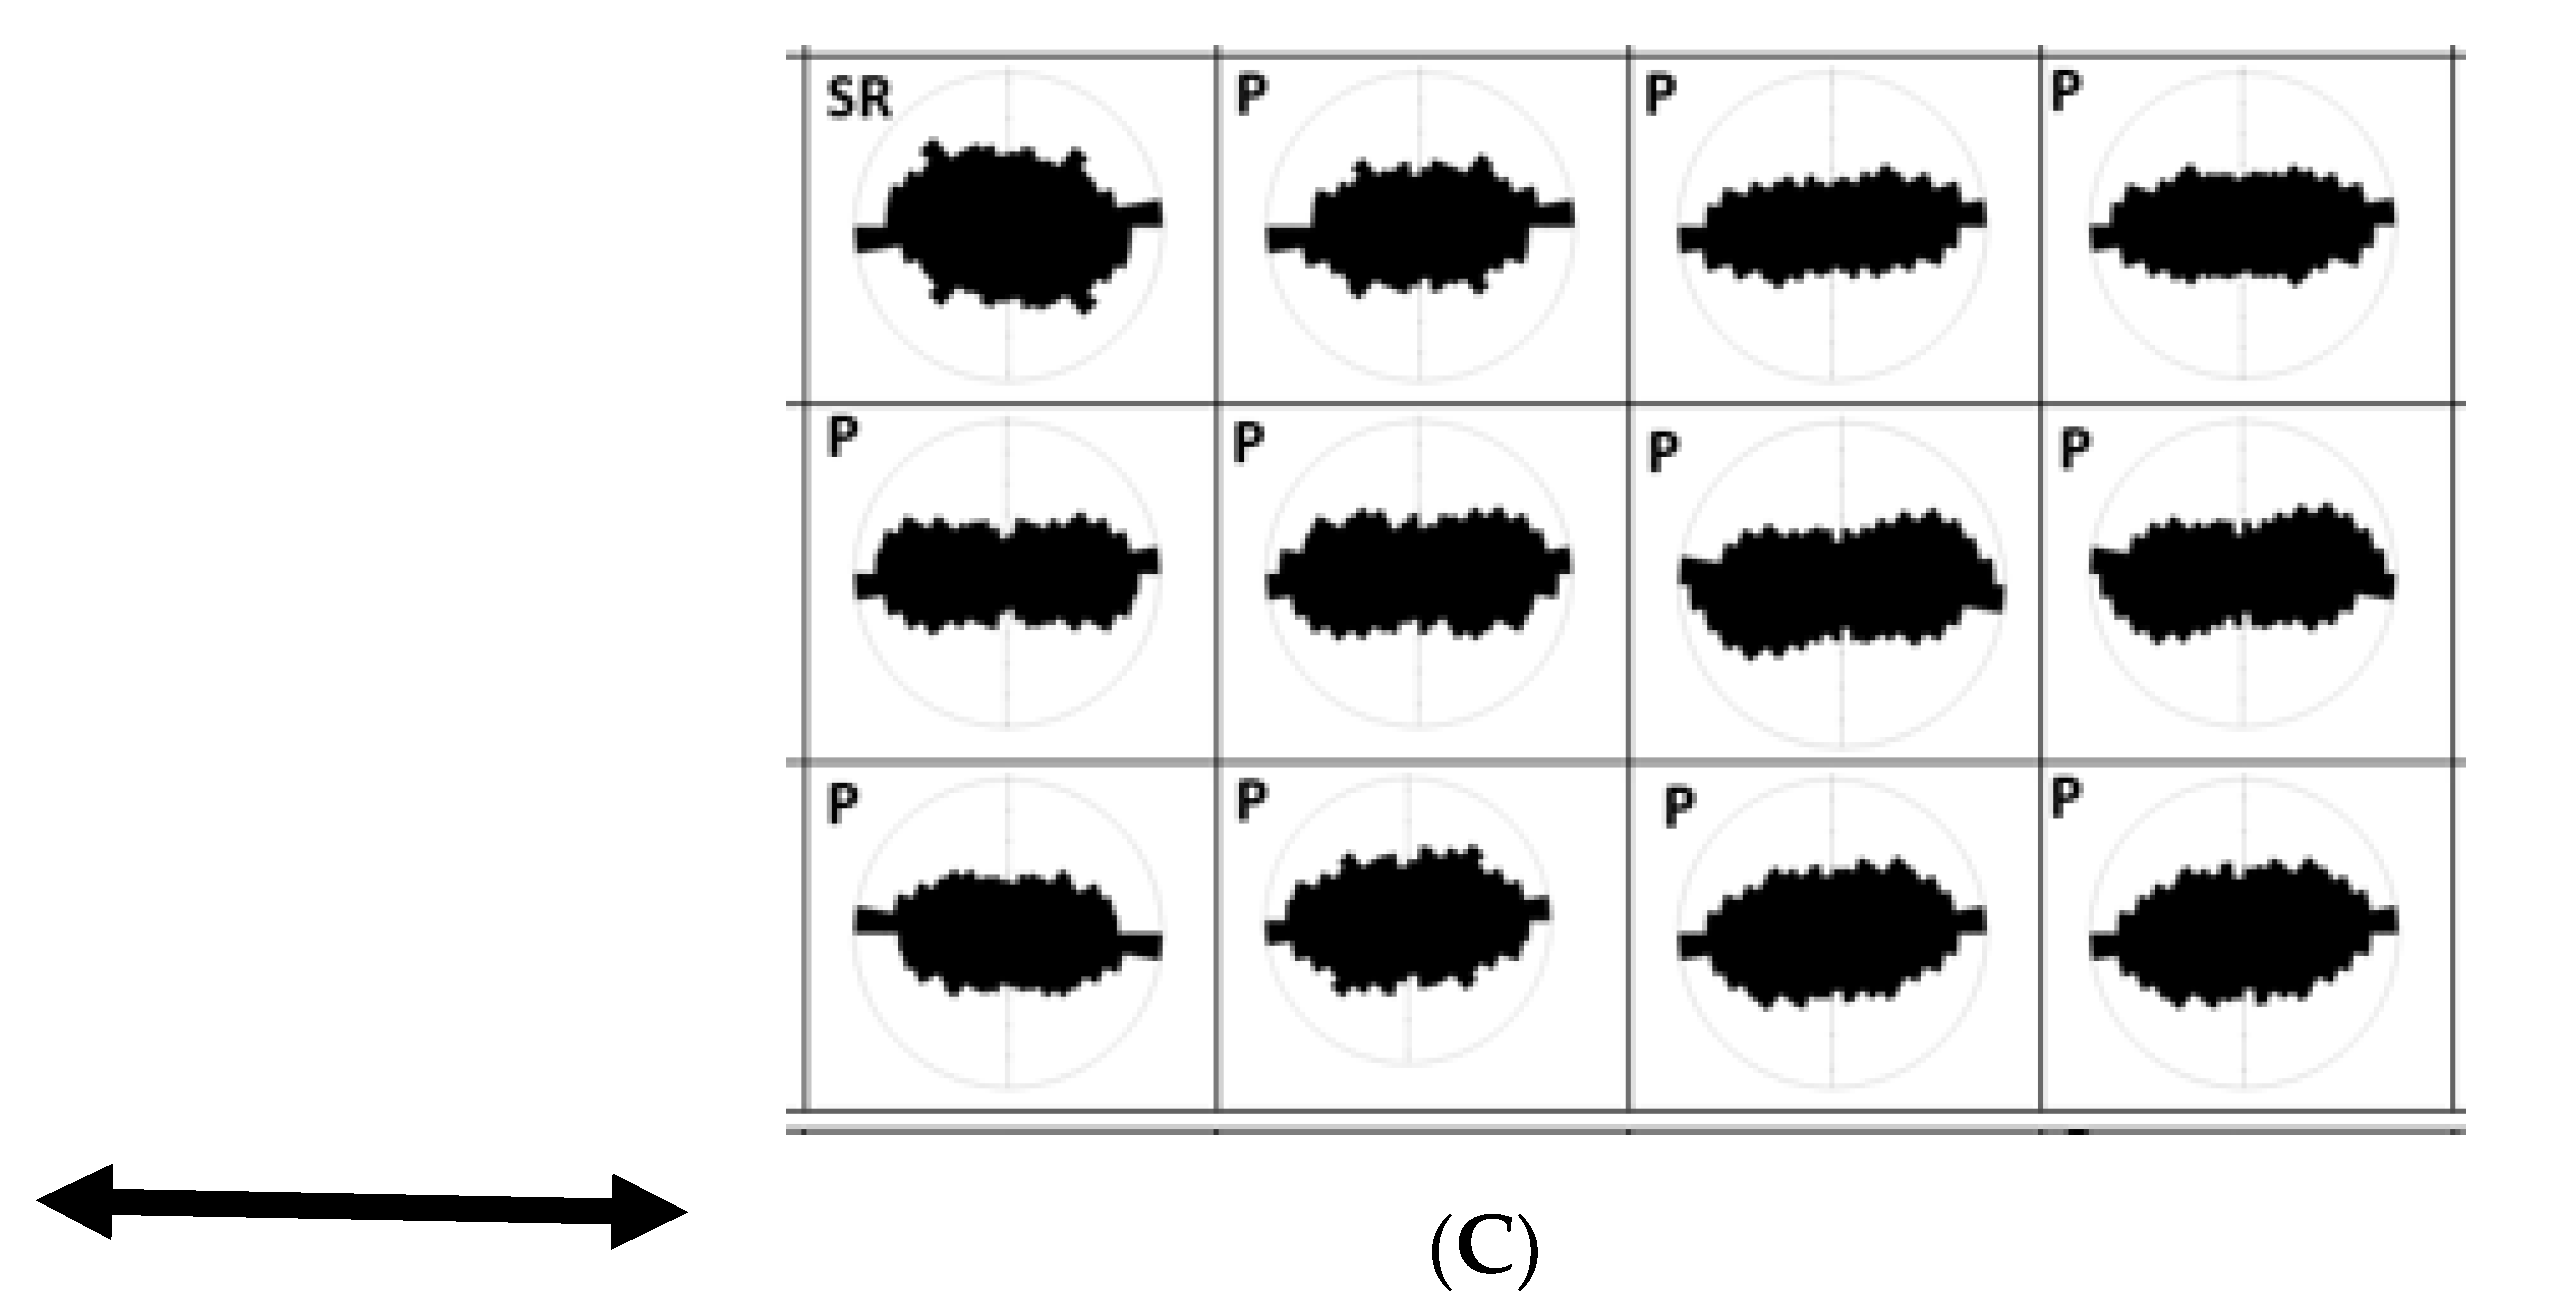
Figure 14.
A plot of average grain size, porosity (from IODP database), sedimentation rate, and microfabric along the depth profile in site 1385 (hemipelagites).
Figure 14.
A plot of average grain size, porosity (from IODP database), sedimentation rate, and microfabric along the depth profile in site 1385 (hemipelagites).
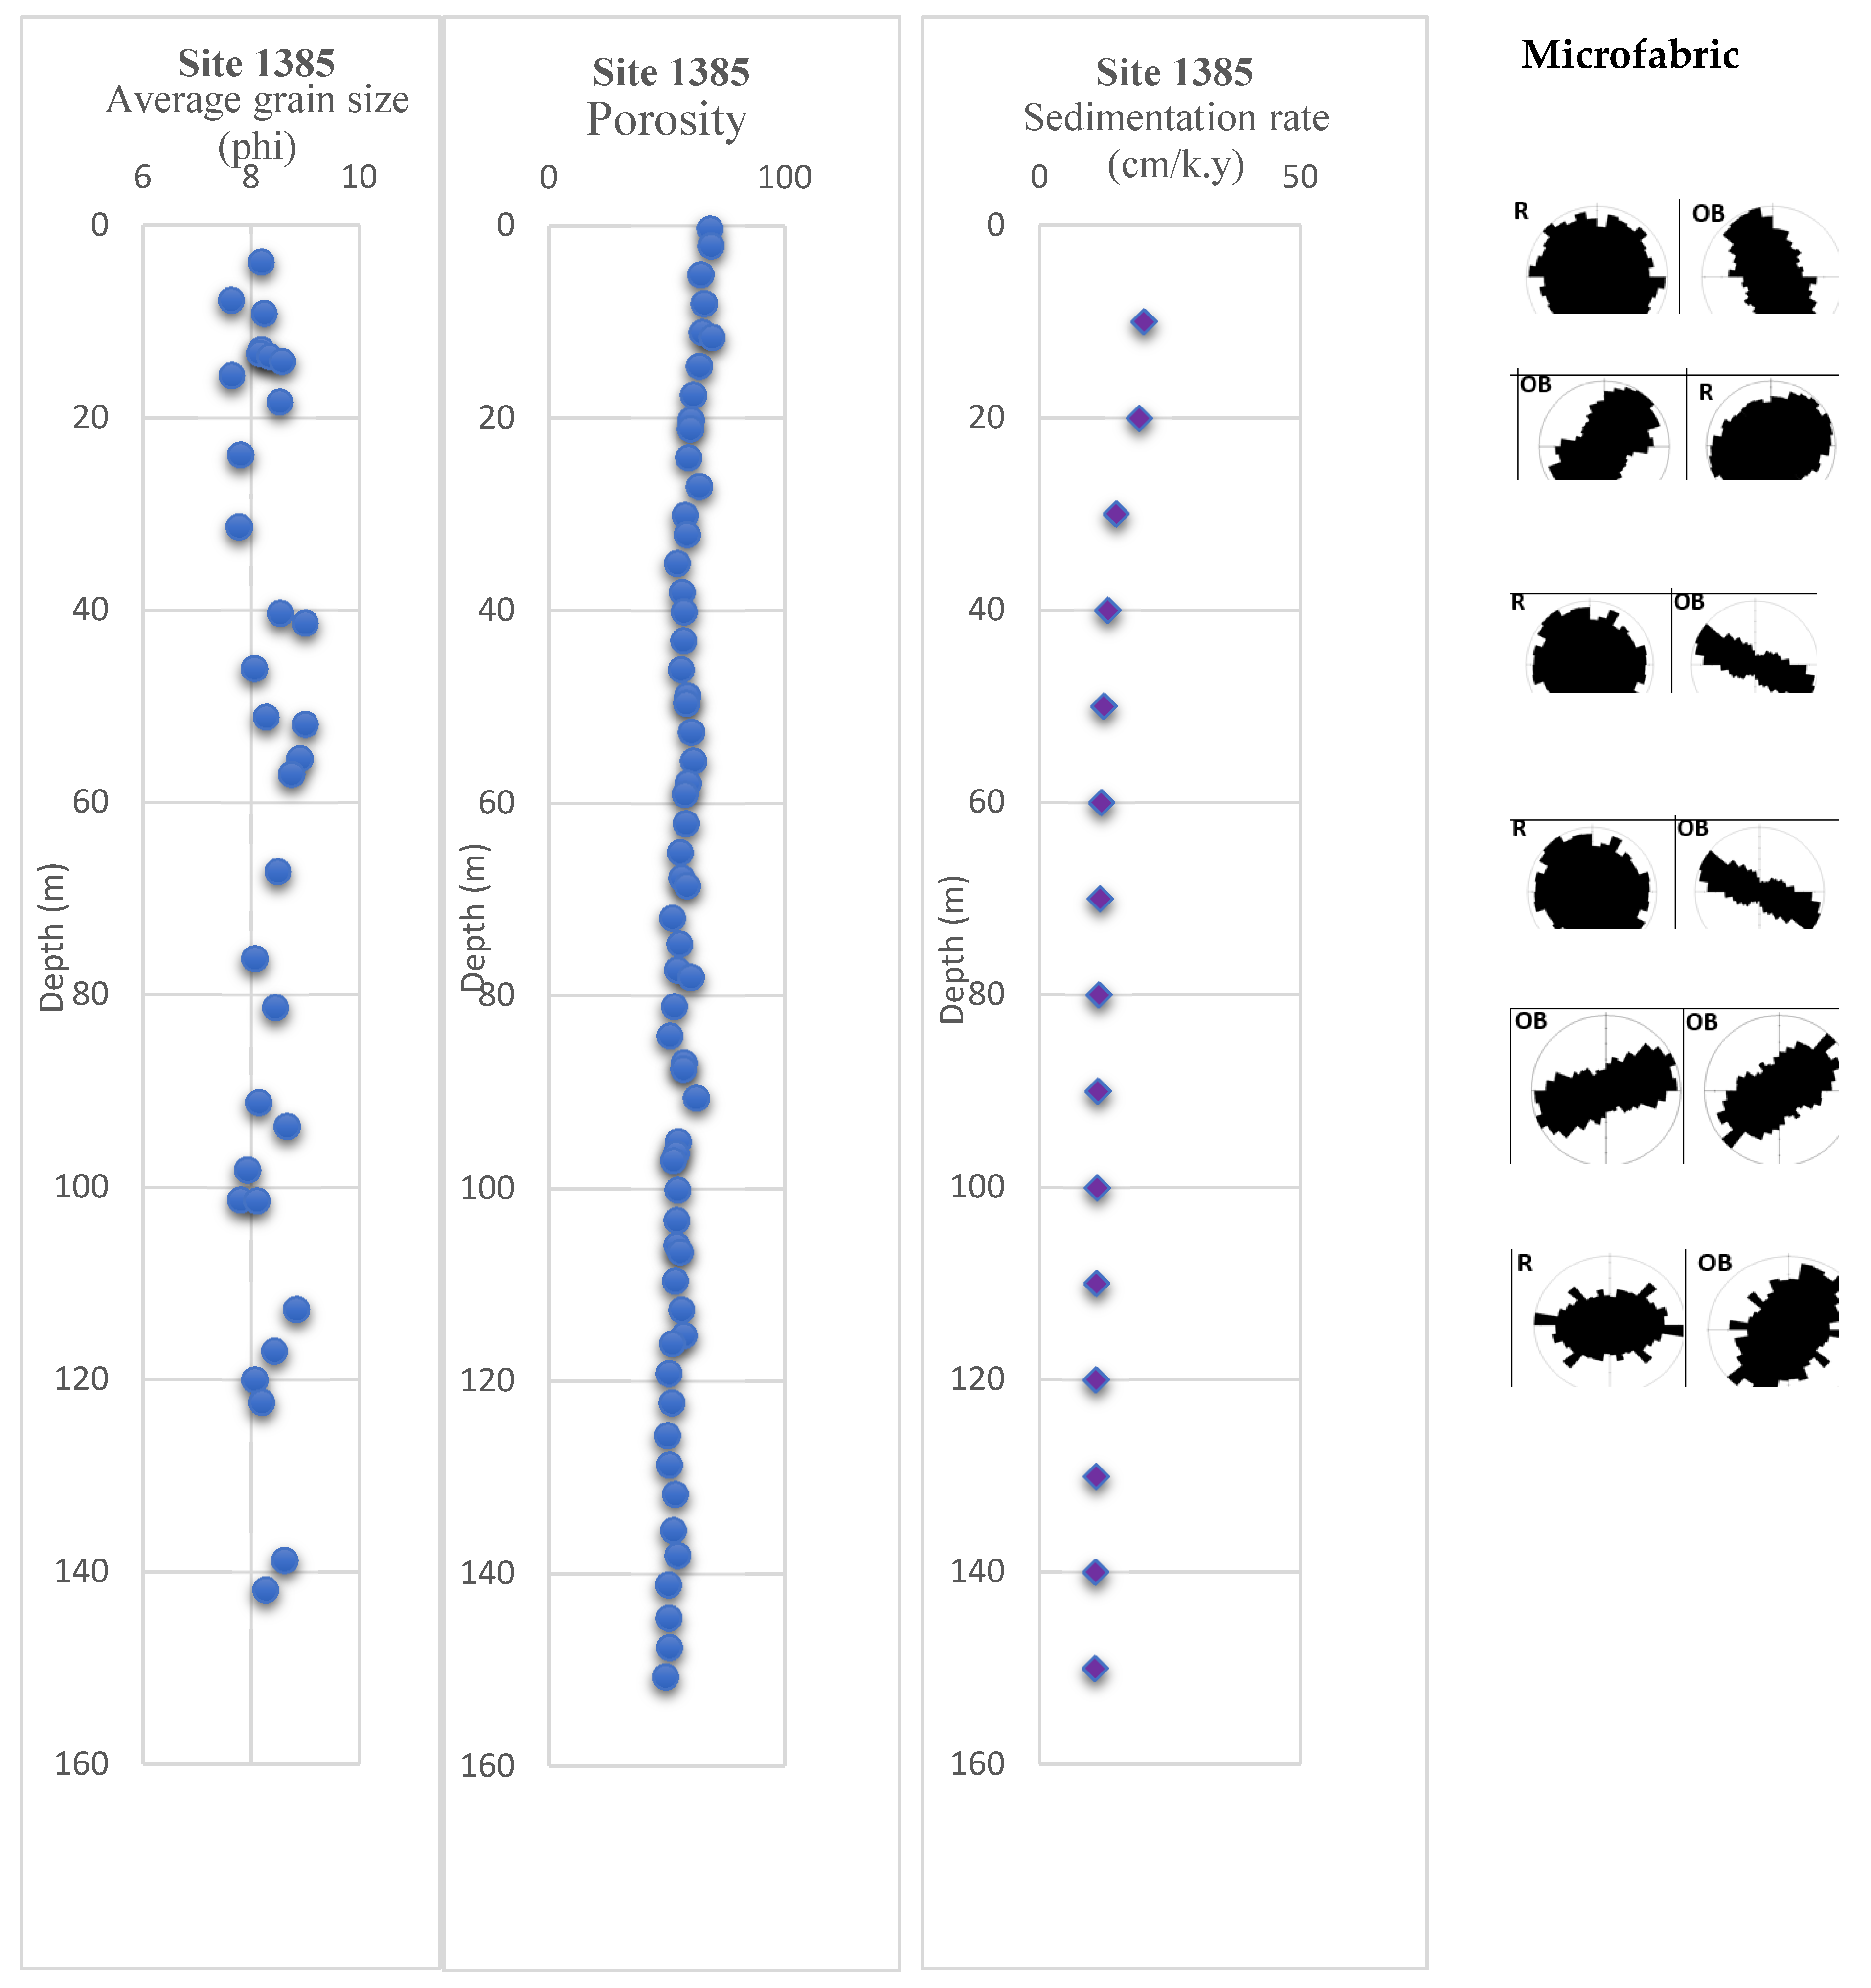
Figure 15.
A plot of average grain size, porosity (from IODP data), sedimentation rate, and microfabric along with the depth profile in site 1389 (contourites).
Figure 15.
A plot of average grain size, porosity (from IODP data), sedimentation rate, and microfabric along with the depth profile in site 1389 (contourites).
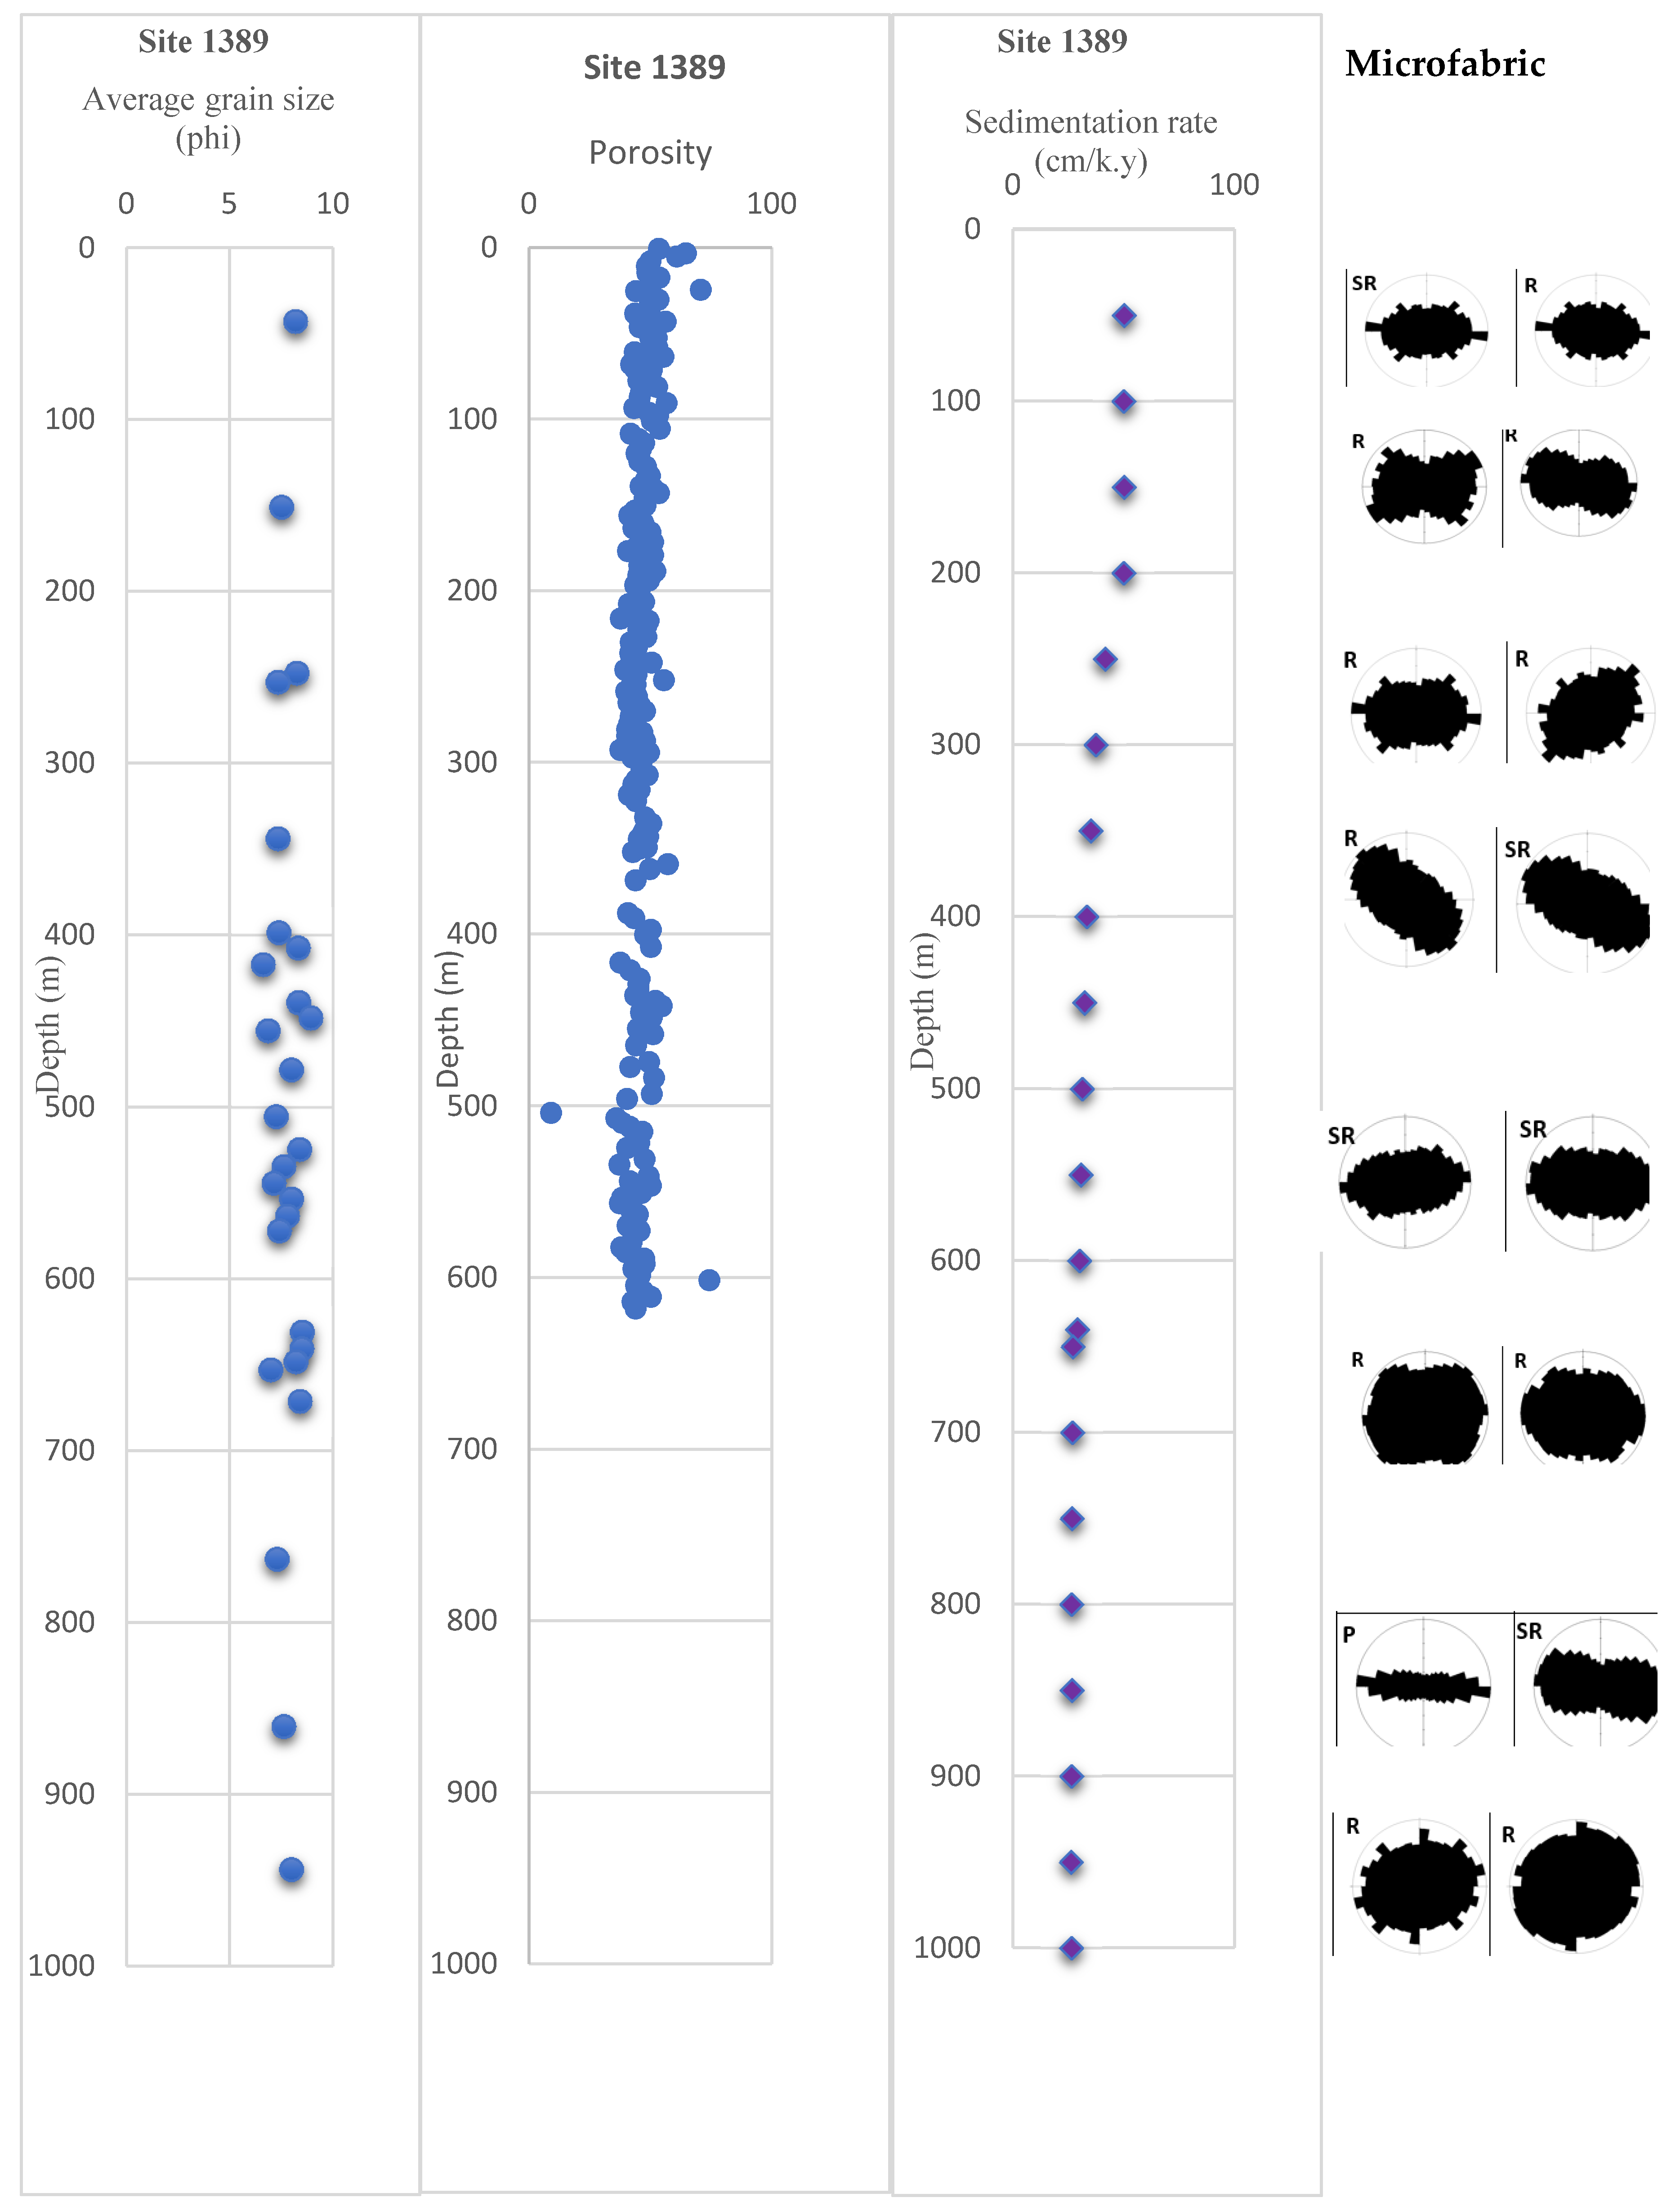
Figure 16.
A plot of average grain size, porosity (from IODP data), sedimentation rate, and microfabric along with the depth profile in site 1457 (turbidites).
Figure 16.
A plot of average grain size, porosity (from IODP data), sedimentation rate, and microfabric along with the depth profile in site 1457 (turbidites).

Figure 17.
Cross plot of grain size against sorting. The plot shows two endmembers (sand rich and mud rich) of grains.
Figure 17.
Cross plot of grain size against sorting. The plot shows two endmembers (sand rich and mud rich) of grains.
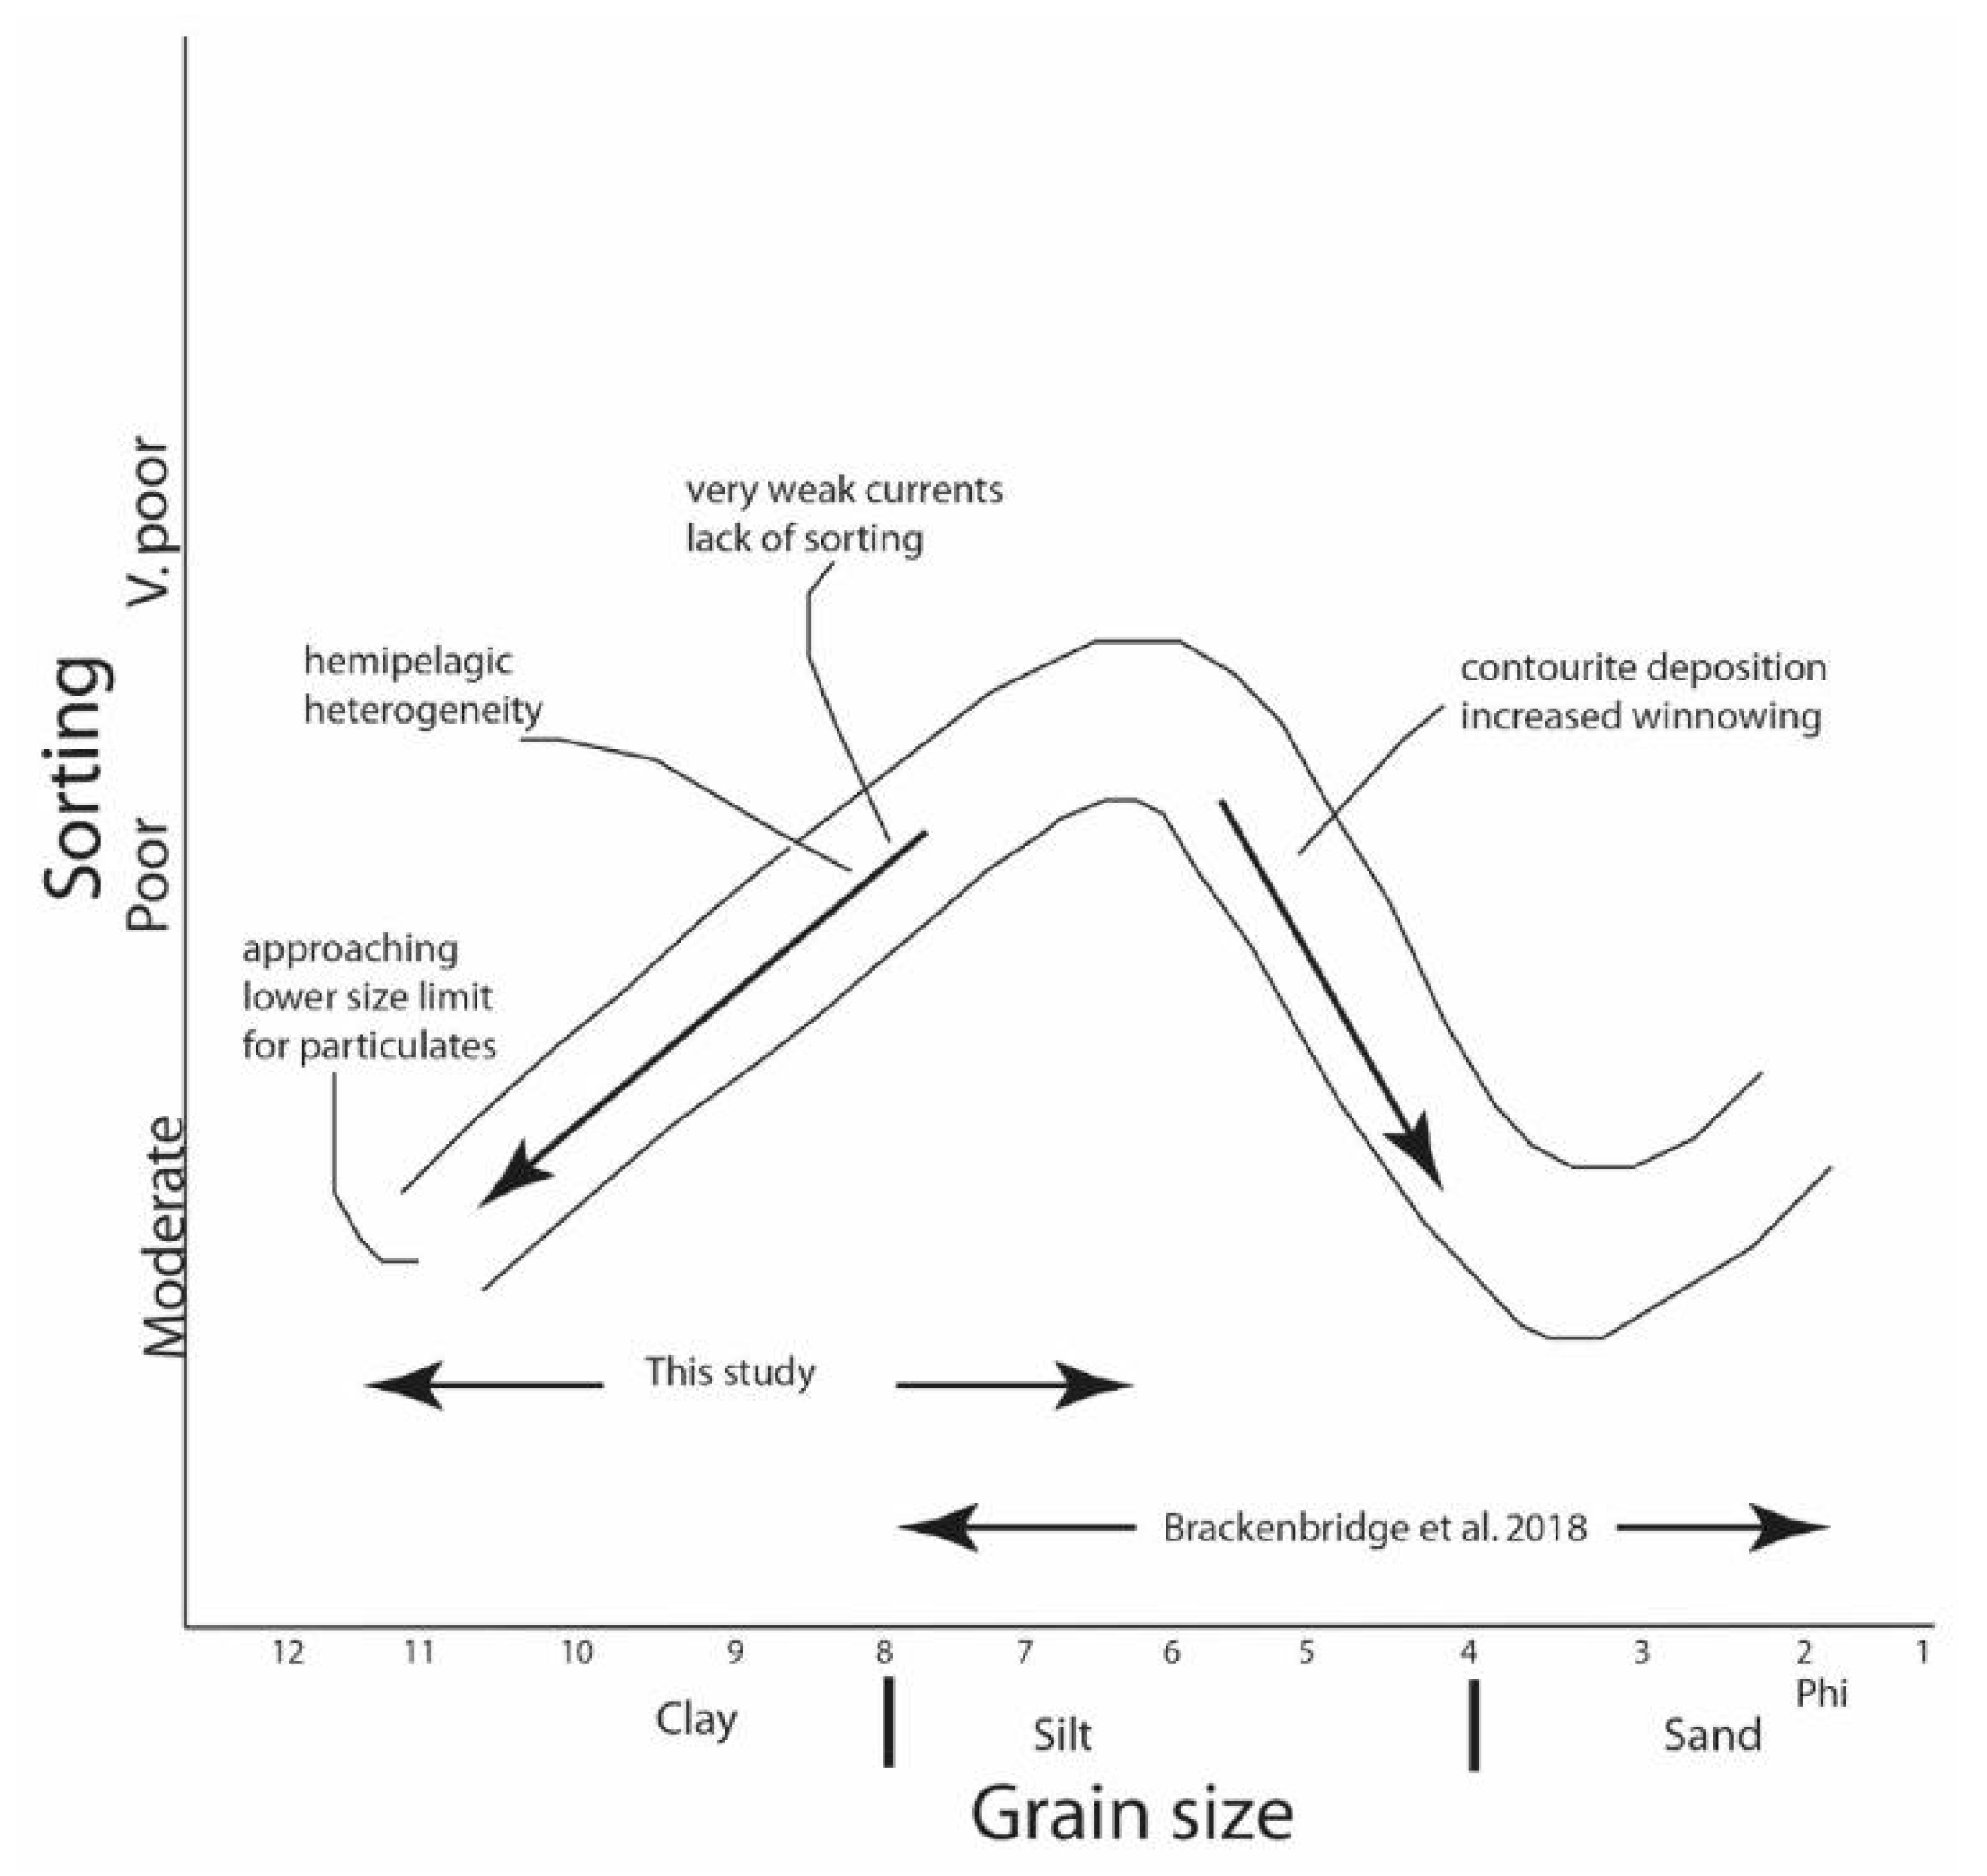
Figure 18.
Burrows imparting preferred orientation directions on grains in hemipelagite facies (A) Hemipelgites with random fabric; (B) Hemipelagites, note the oblique orientation close to the burrows and rather chaotic fabric away from the burrows.
Figure 18.
Burrows imparting preferred orientation directions on grains in hemipelagite facies (A) Hemipelgites with random fabric; (B) Hemipelagites, note the oblique orientation close to the burrows and rather chaotic fabric away from the burrows.

Figure 19.
Microfabric model for deep-water fine-grained sediments. Hemipelagites are associated with no current flow and very low sedimentation rate (<10 cm/ky), and their typical microfabric is random to oblique. Contourites are characterised with mixed fabric (random, semi-random, and parallel to bedding), the sedimentation rate is also low and associated with low flow concentration. Turbidites are typically bedding parallel, which is associated with very rapid sedimentation.

Figure 20.
Diagrammatic scheme showing the development of microfabric in deep-water for fine-grained sediments. In hemipelagic sedimentation, there is zero flow and sediments settle down through vertical settling. The resultant product is a random fabric with extensive bioturbation. Contourites are produced by weak flow and as the flocculated sediments transit from the boundary layer towards the viscous sub-layer, the flocs are dispersed with grains partially aligned and distortion is caused by bioturbation. Turbidites are associated with high turbulence and the flocs break up as it transits between boundary layer to the viscous sub-layer due to shearing, which results in well-aligned grains with little bioturbation.


Table 1.
Summary of grain size data.
| Grain Size | Contourites (%) Gulf of Cadiz | Hemipelagites (%) Iberian Margin | Turbidites (%) Indus Fan |
|---|---|---|---|
| Coarse silt | - | ||
| Medium silt | 2 | 4 | |
| Fine silt | 17 | 14 | 7 |
| Very fine silt | 53 | 15 | 42 |
| Coarse clay | 28 | 63 | 21 |
| Medium clay | - | 5 | 12 |
| Fine clay | - | 12 | |
| Very fine clay | - | 3 | 2 |
Table 2.
Diffraction images for selected samples of contourites, hemipelagites, and turbidites. The diffraction images for each sample represent analysis on three separate spots, in which each spot is about 1 mm × 1 mm and situated 1 mm apart. Figure 2 for interpretation of the diffraction images.
Table 2.
Diffraction images for selected samples of contourites, hemipelagites, and turbidites. The diffraction images for each sample represent analysis on three separate spots, in which each spot is about 1 mm × 1 mm and situated 1 mm apart. Figure 2 for interpretation of the diffraction images.
| Samples | Diffraction Images | ||
|---|---|---|---|
| Contourites Depth 9 m 339-1387B-2H1 32-34 | 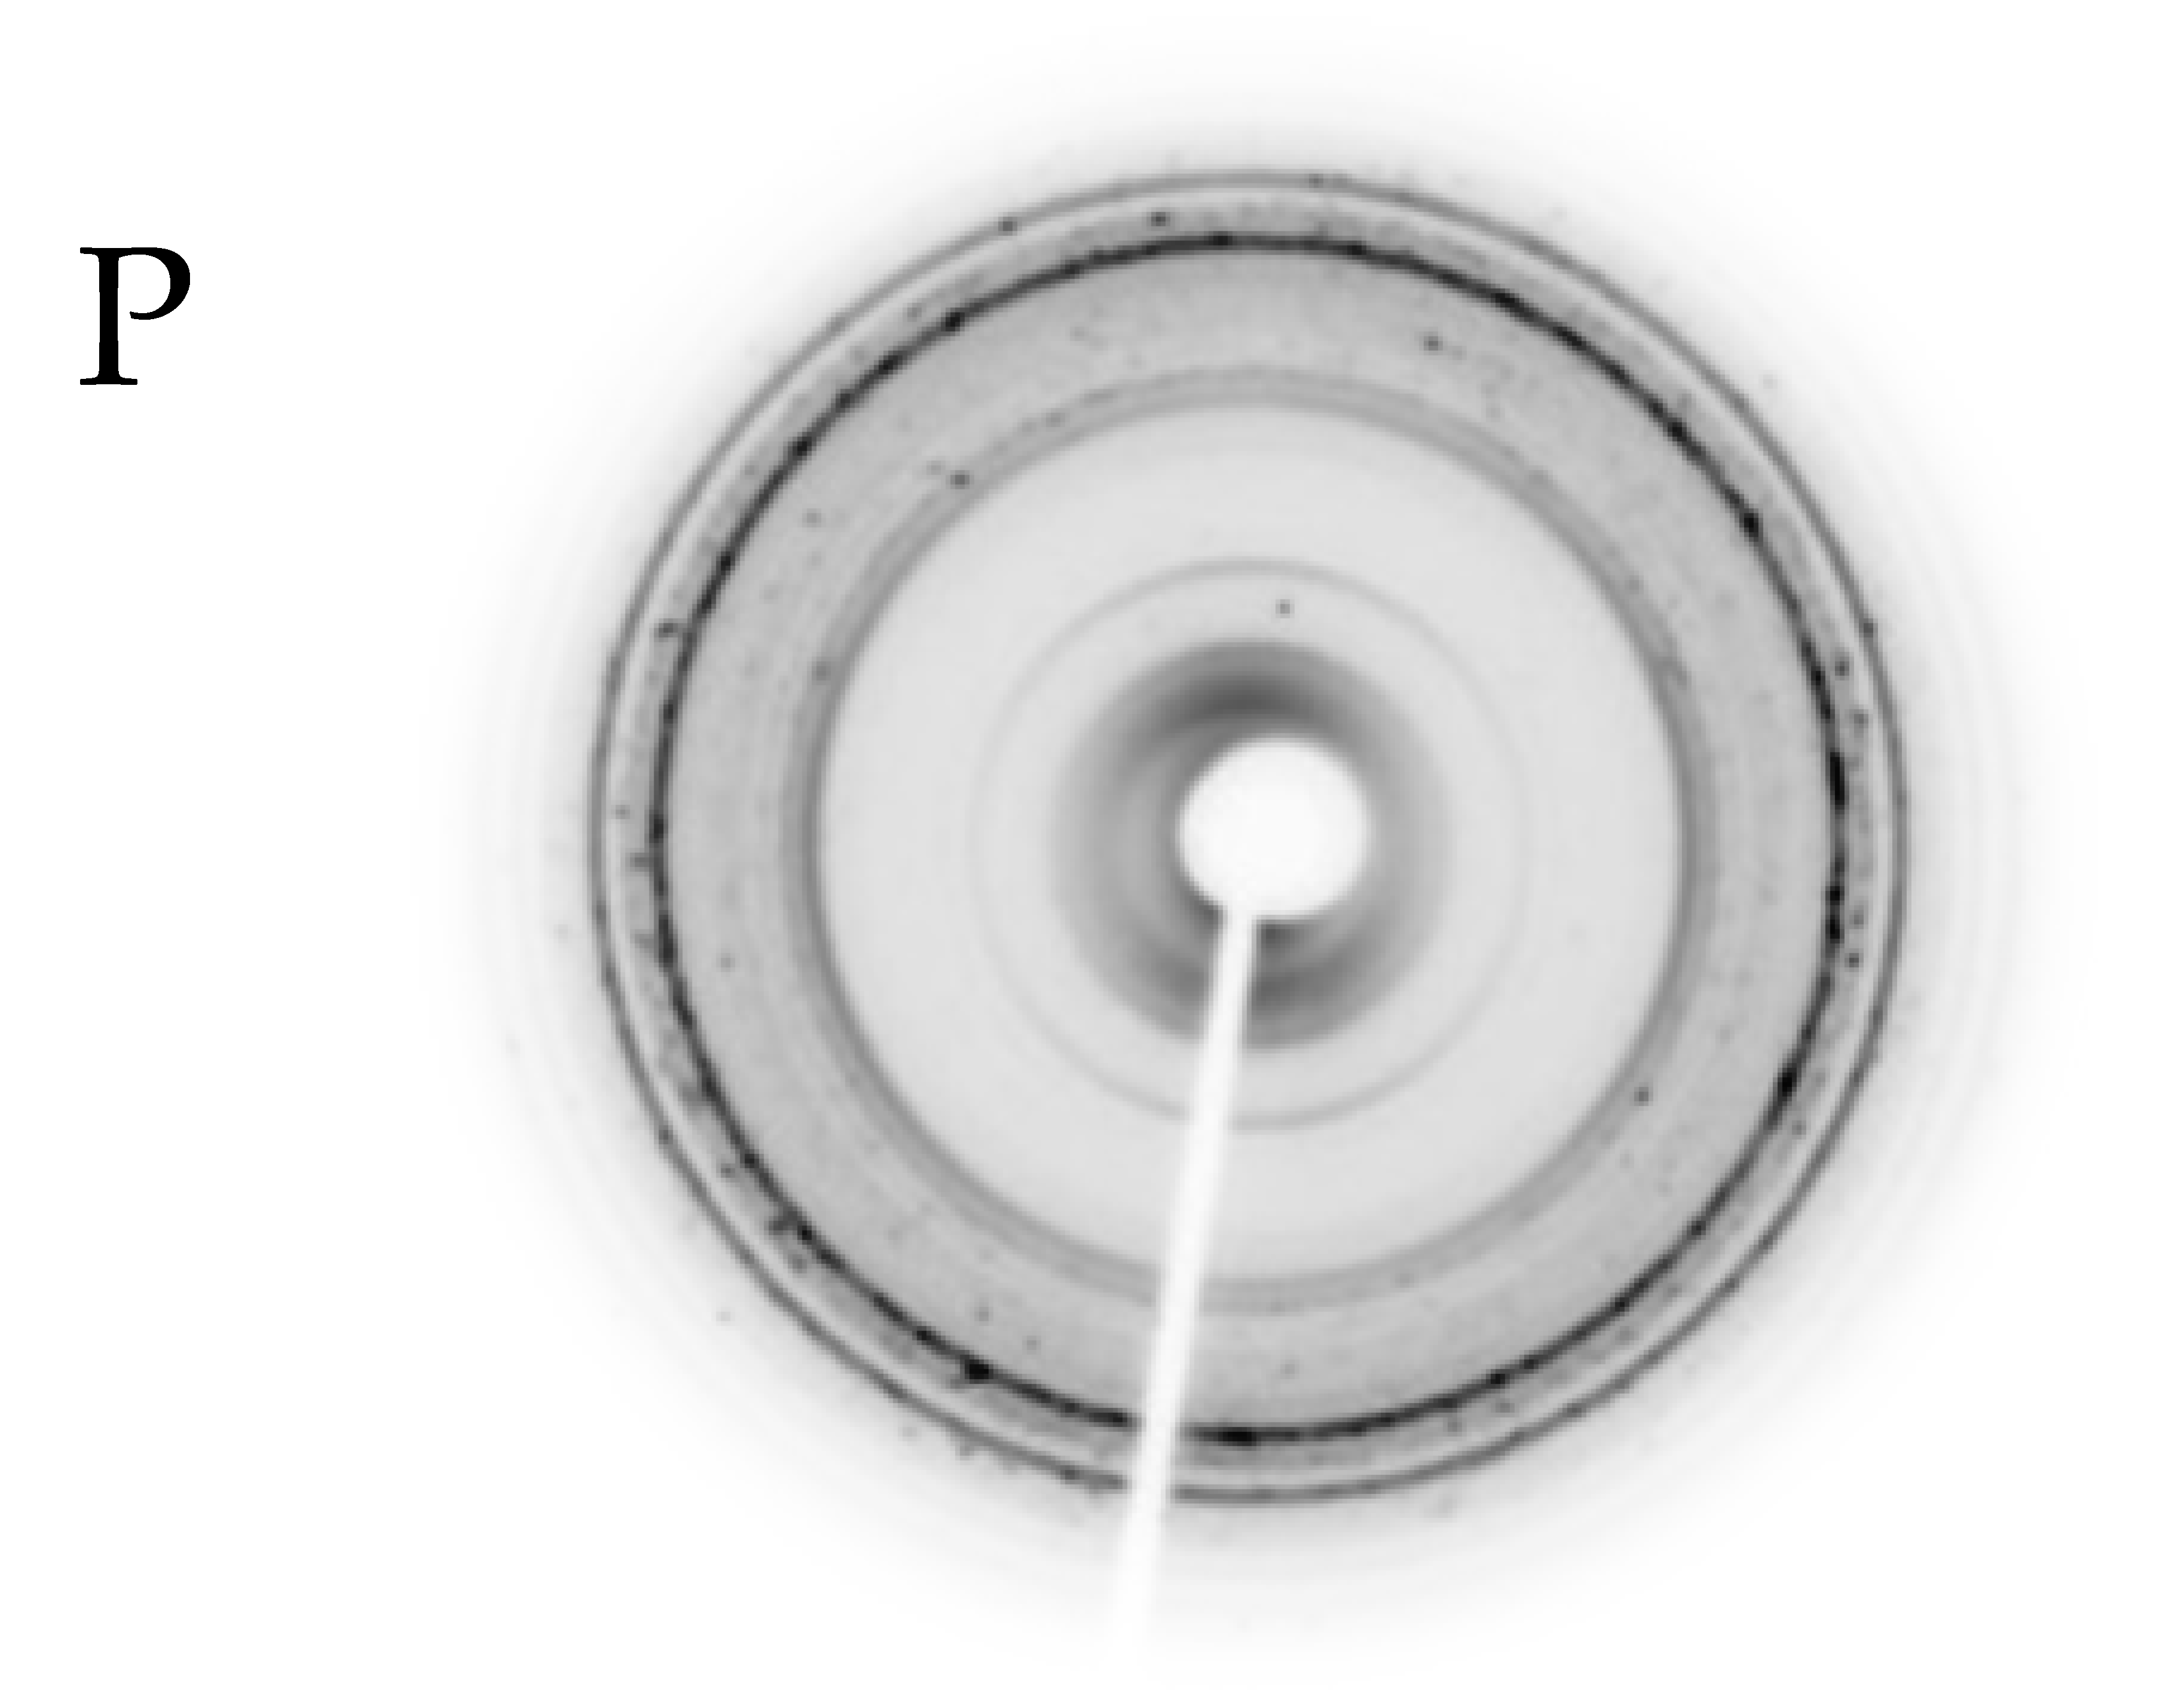 | 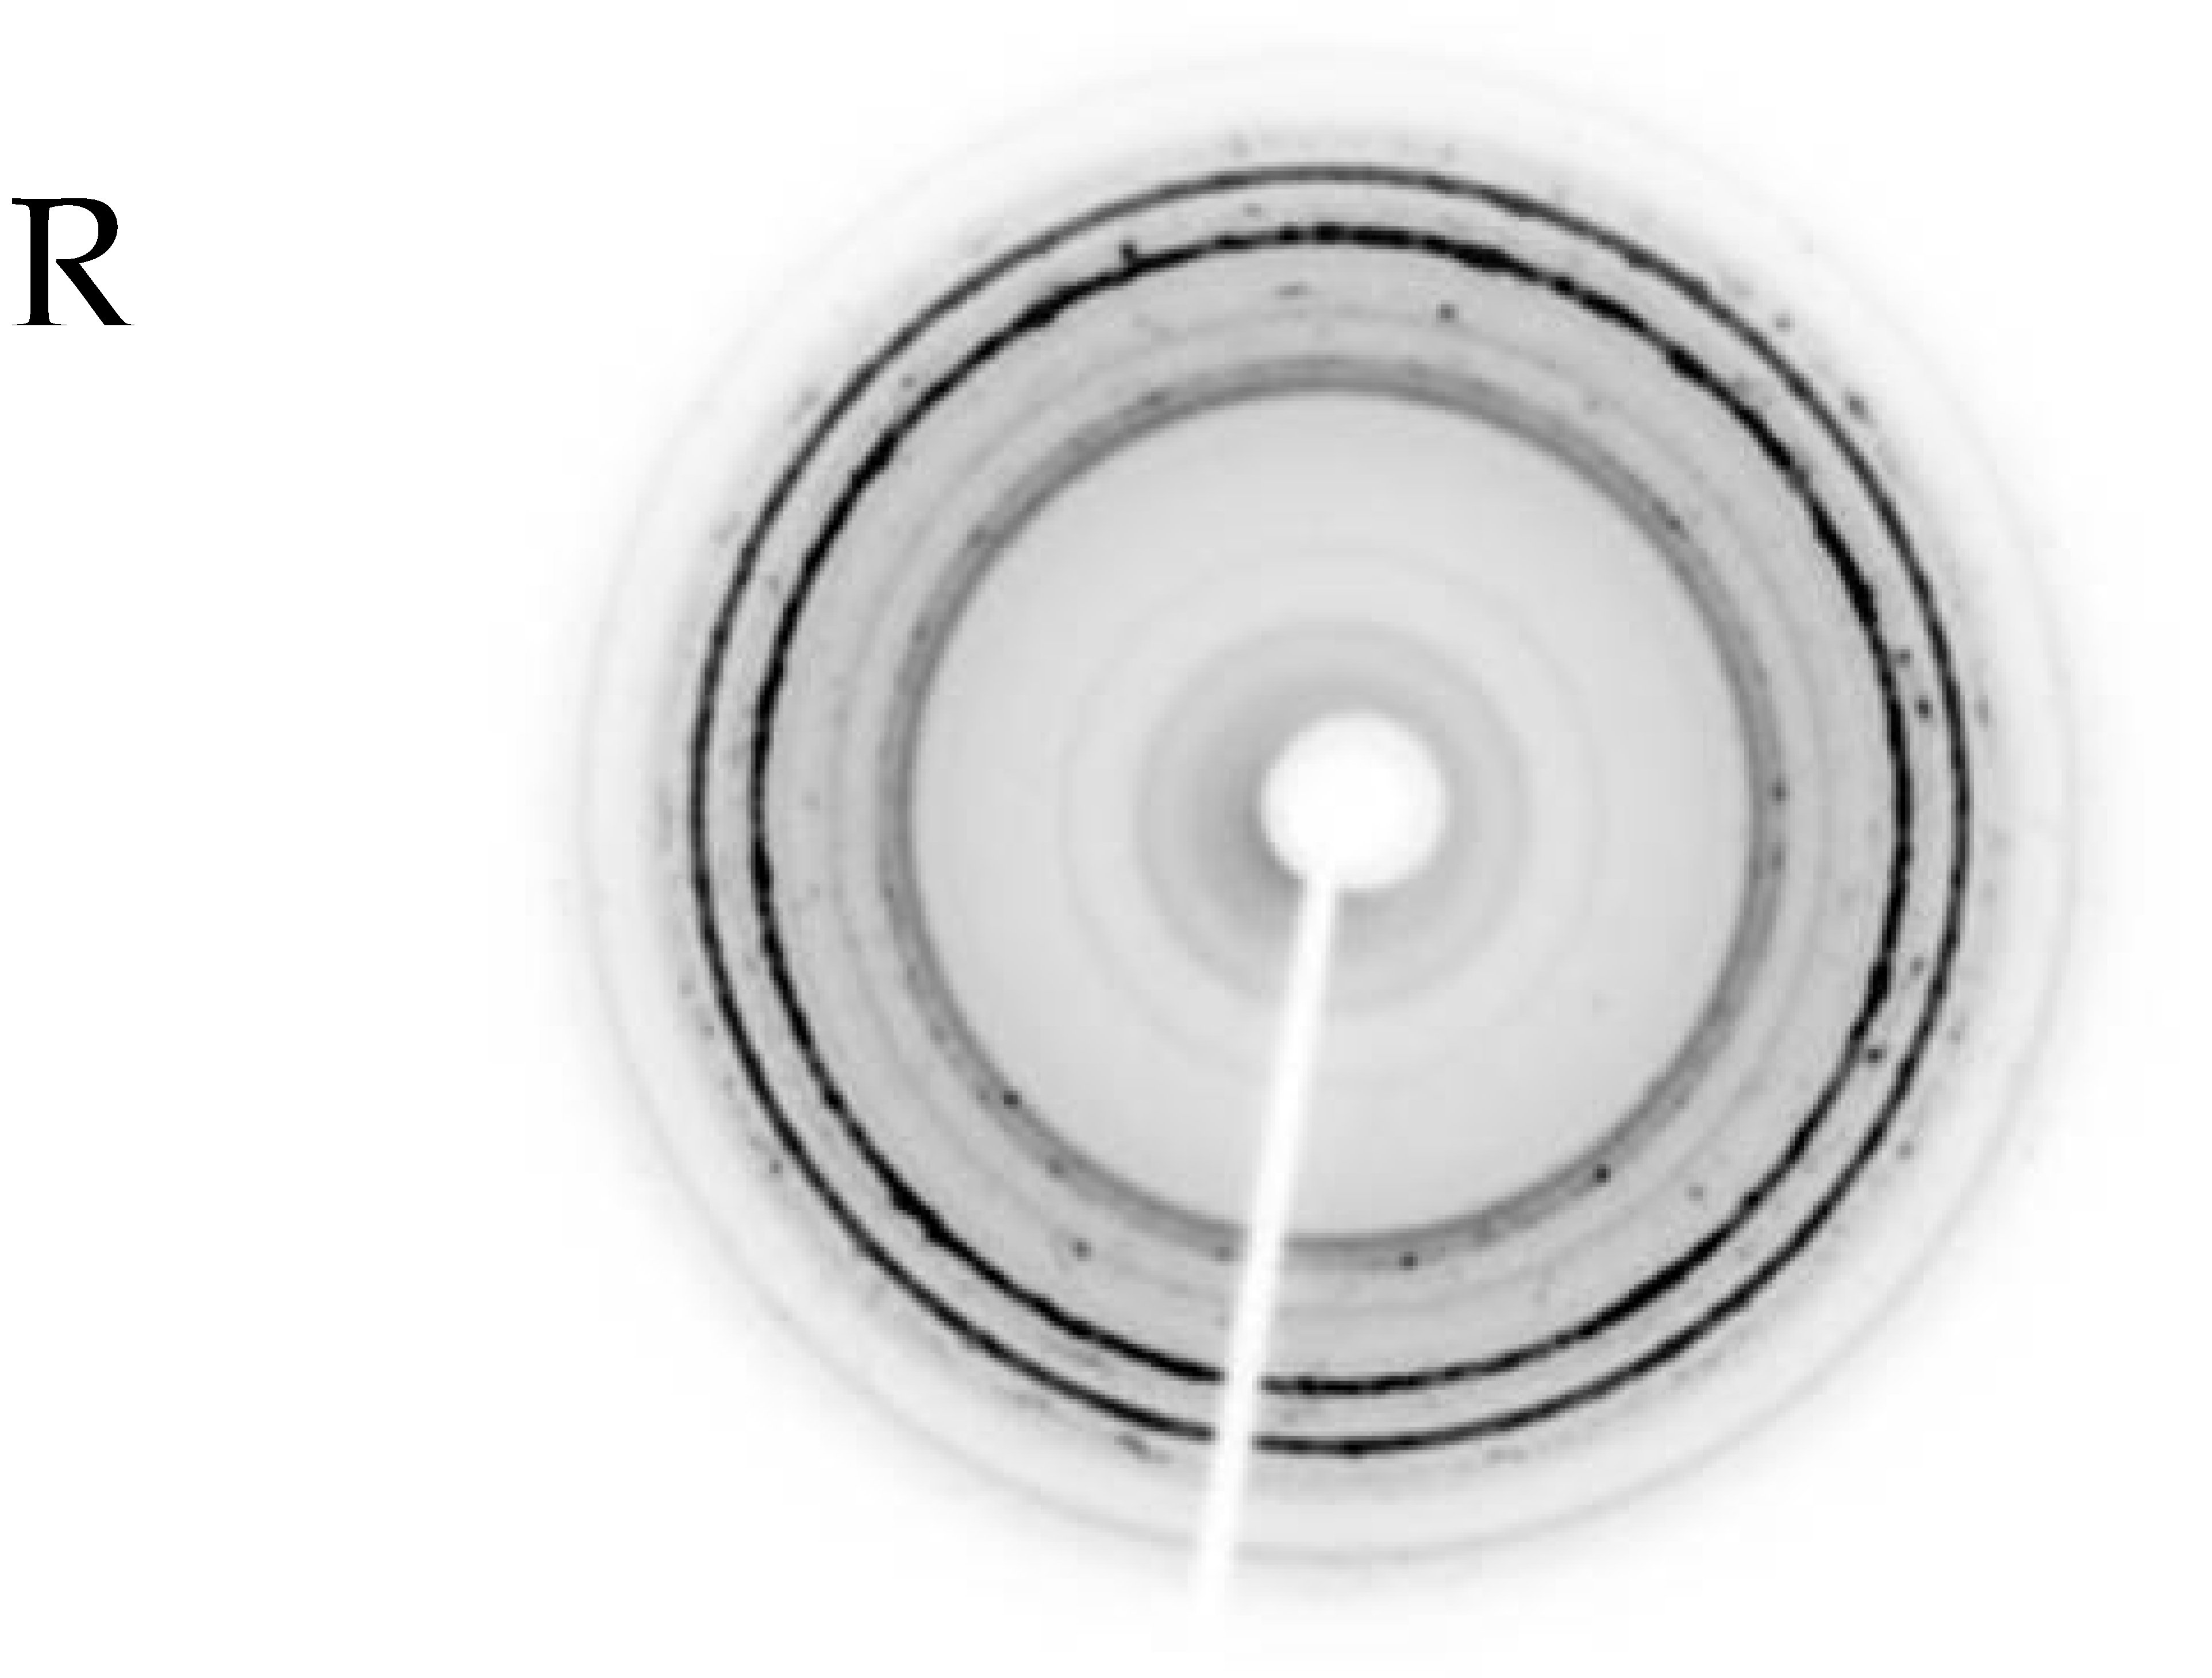 | 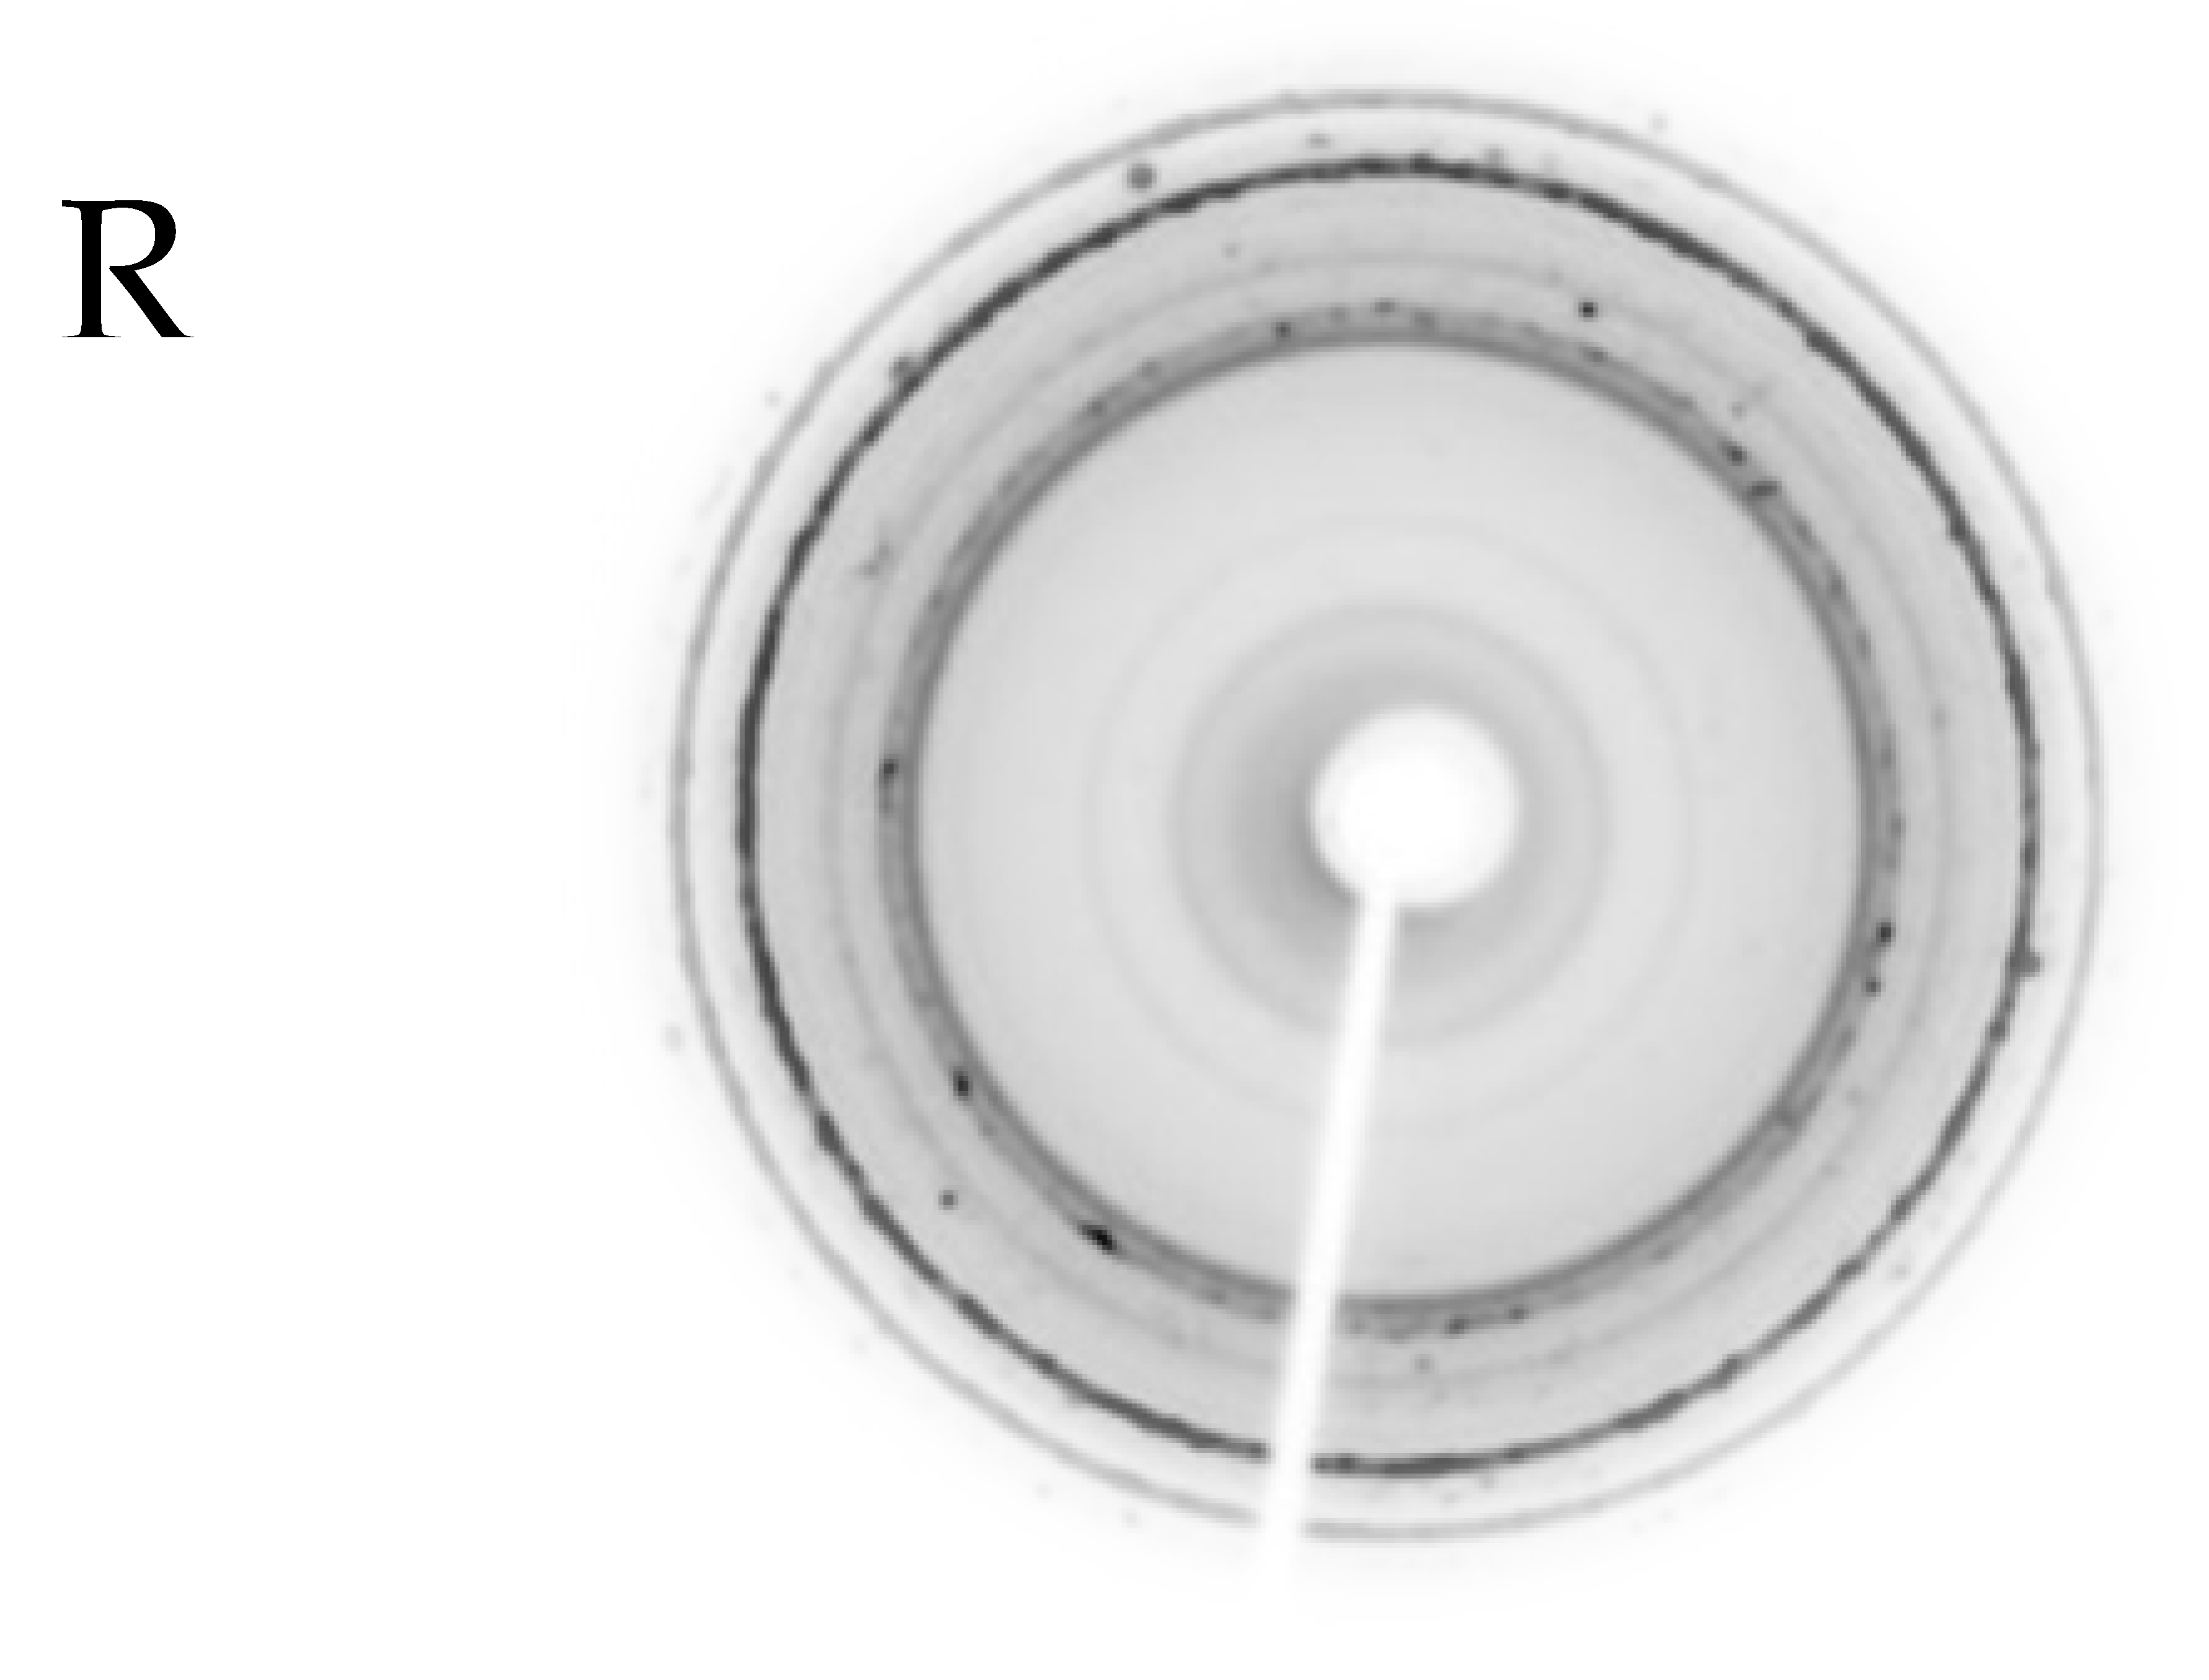 |
| Contourites Depth 253 m 339-1389A-28X5 130-132 | 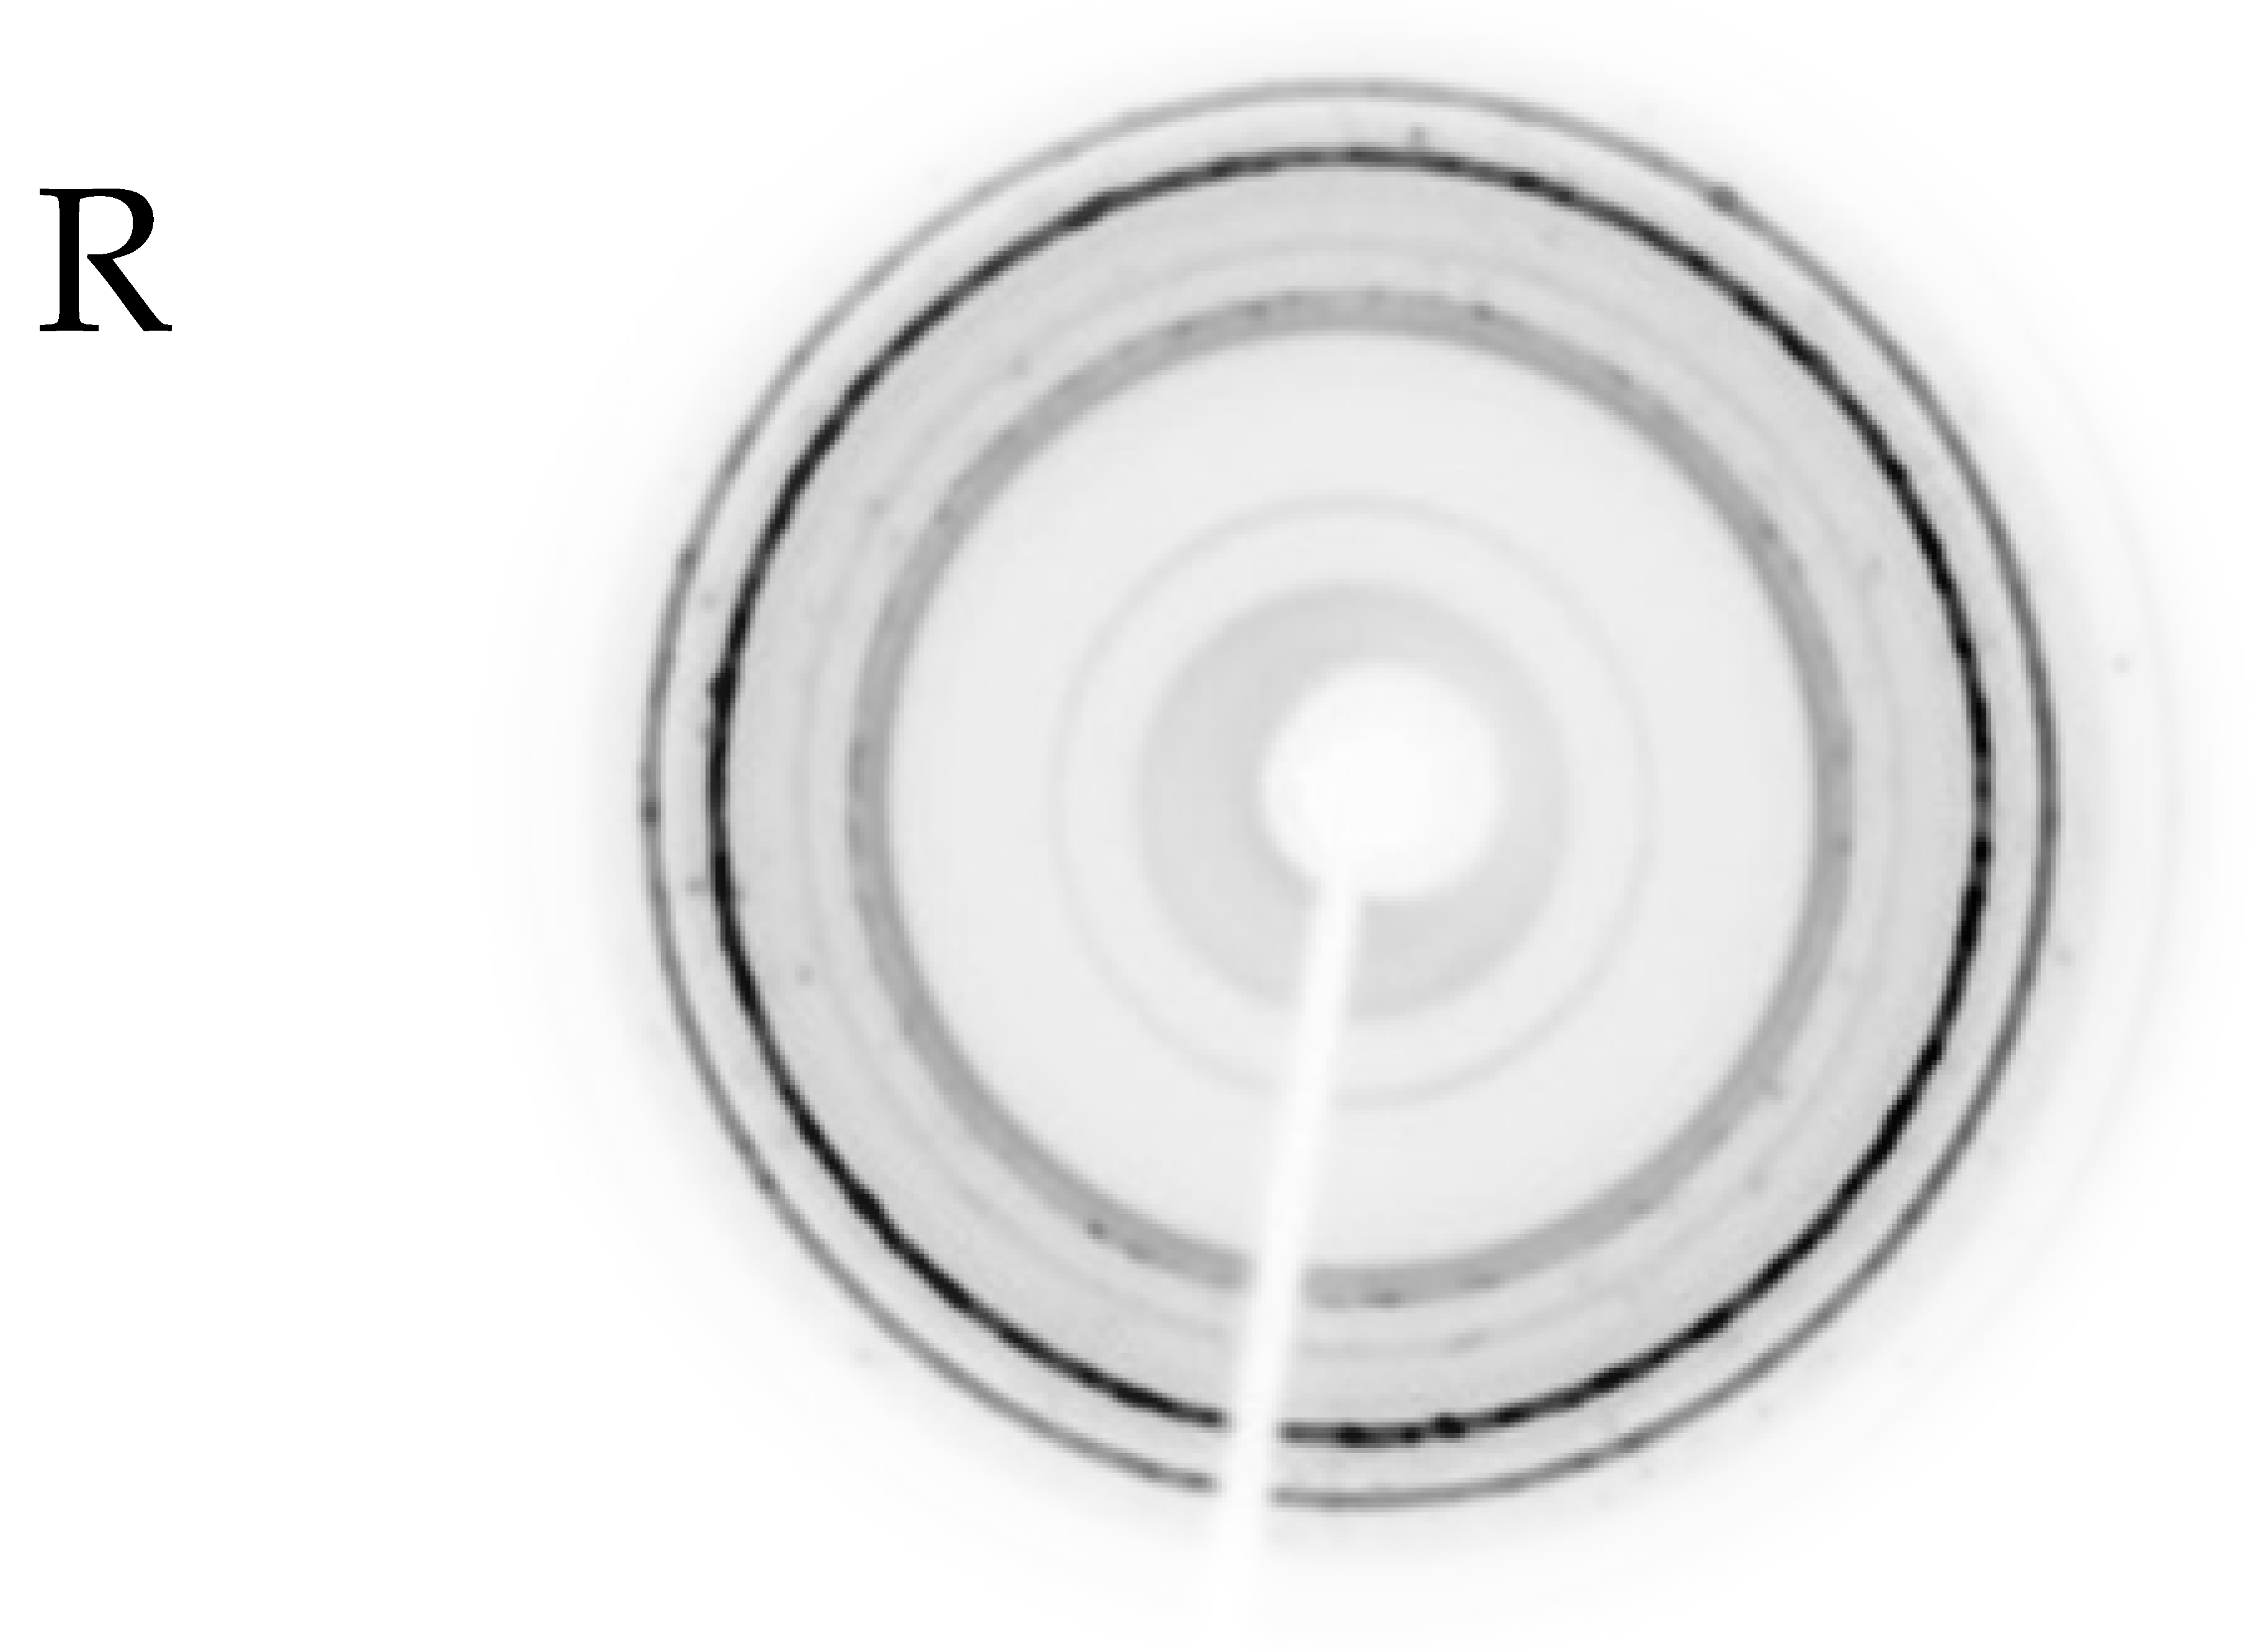 |  |  |
| Hemipelagites Depth 57 m 339-1385A 7H6 54-56 | 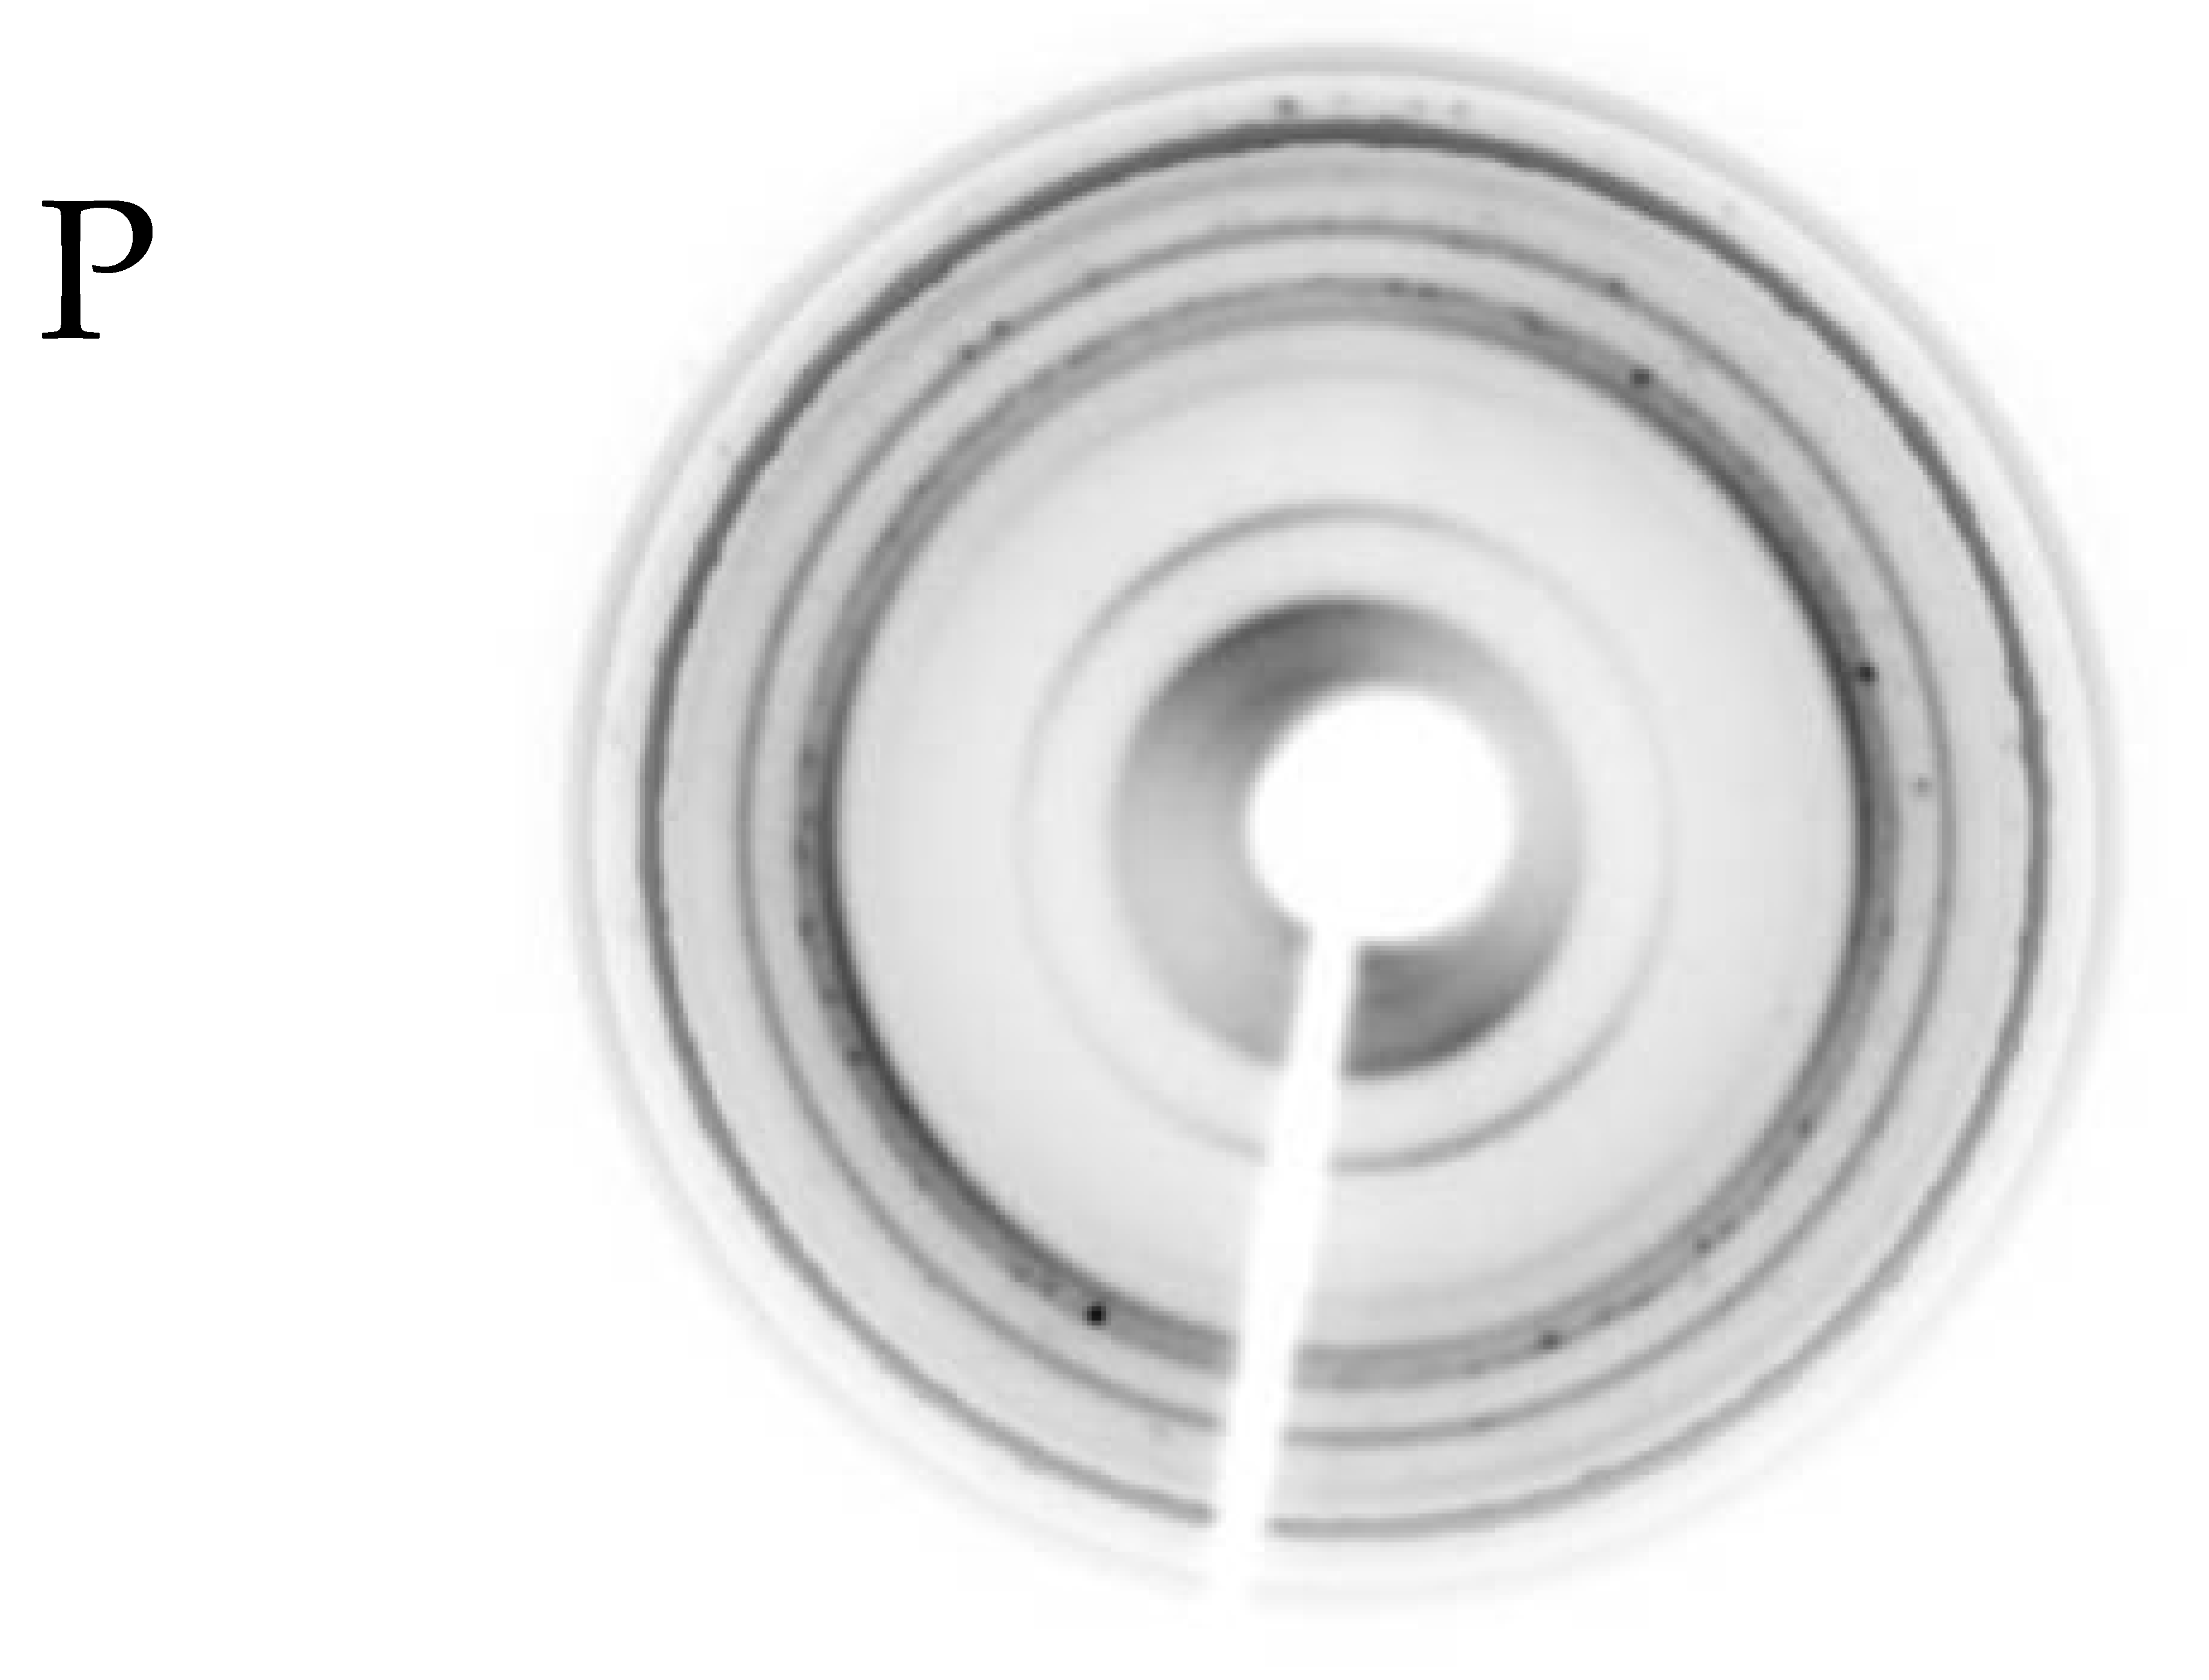 | 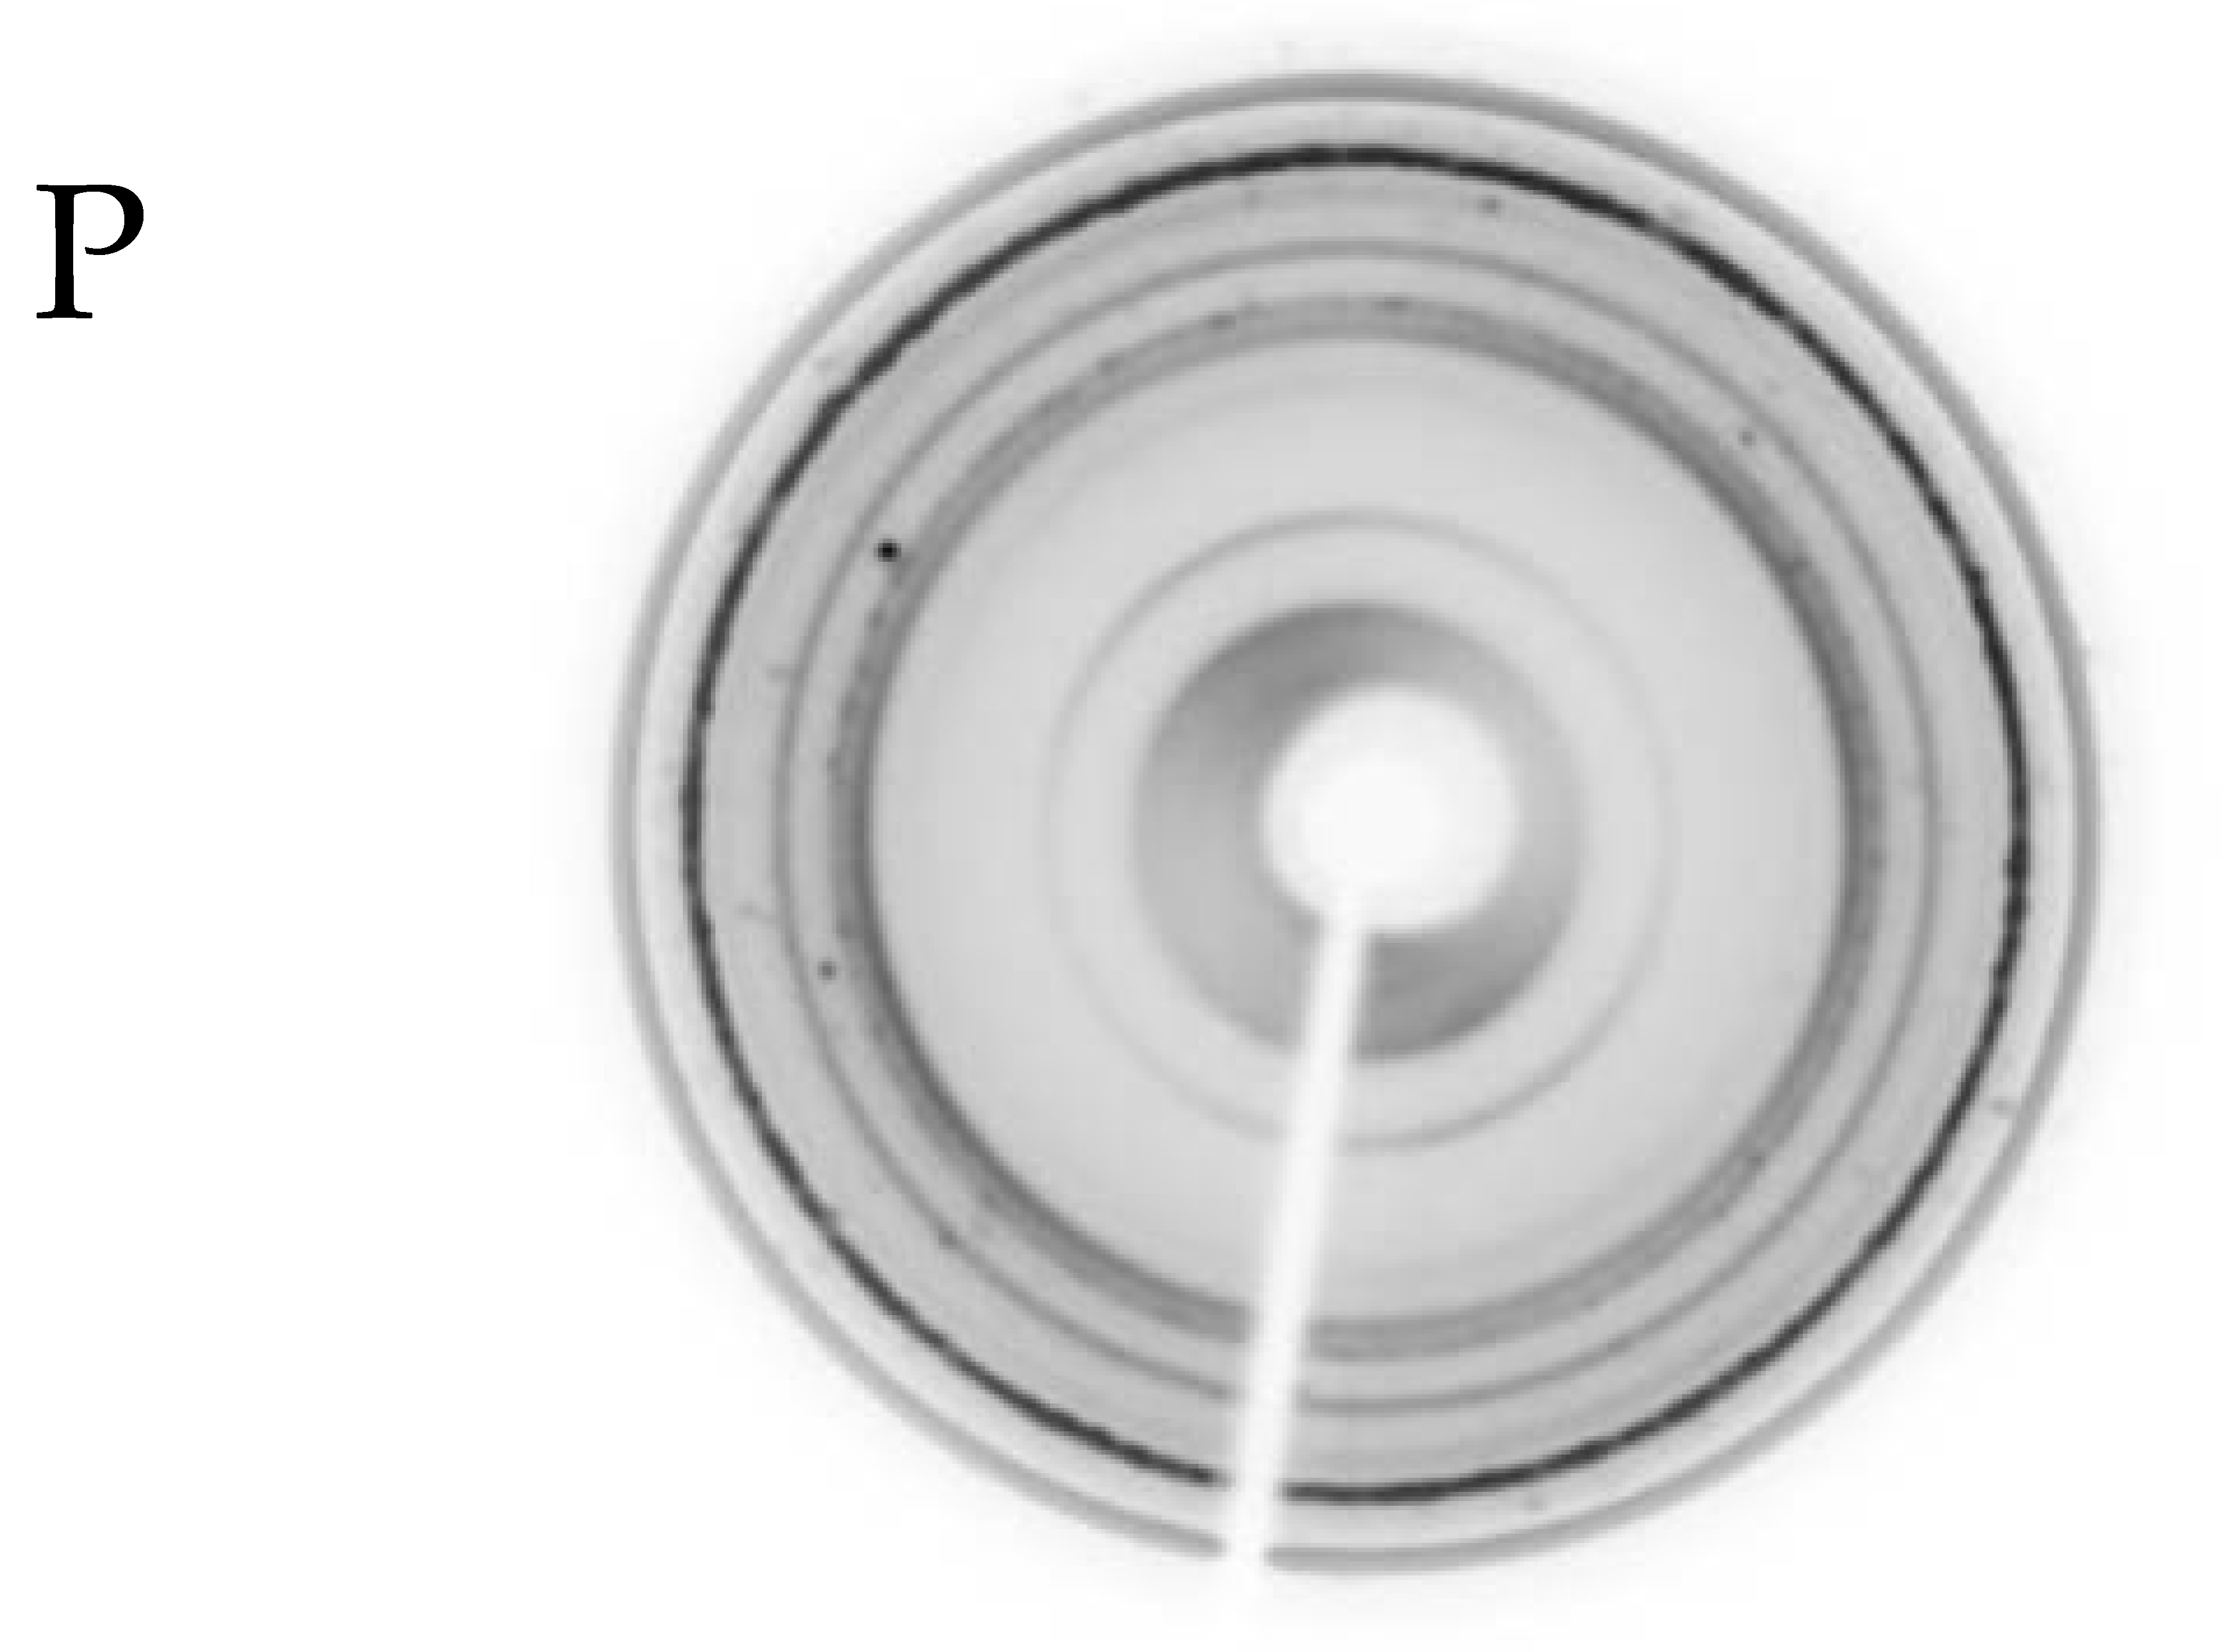 | 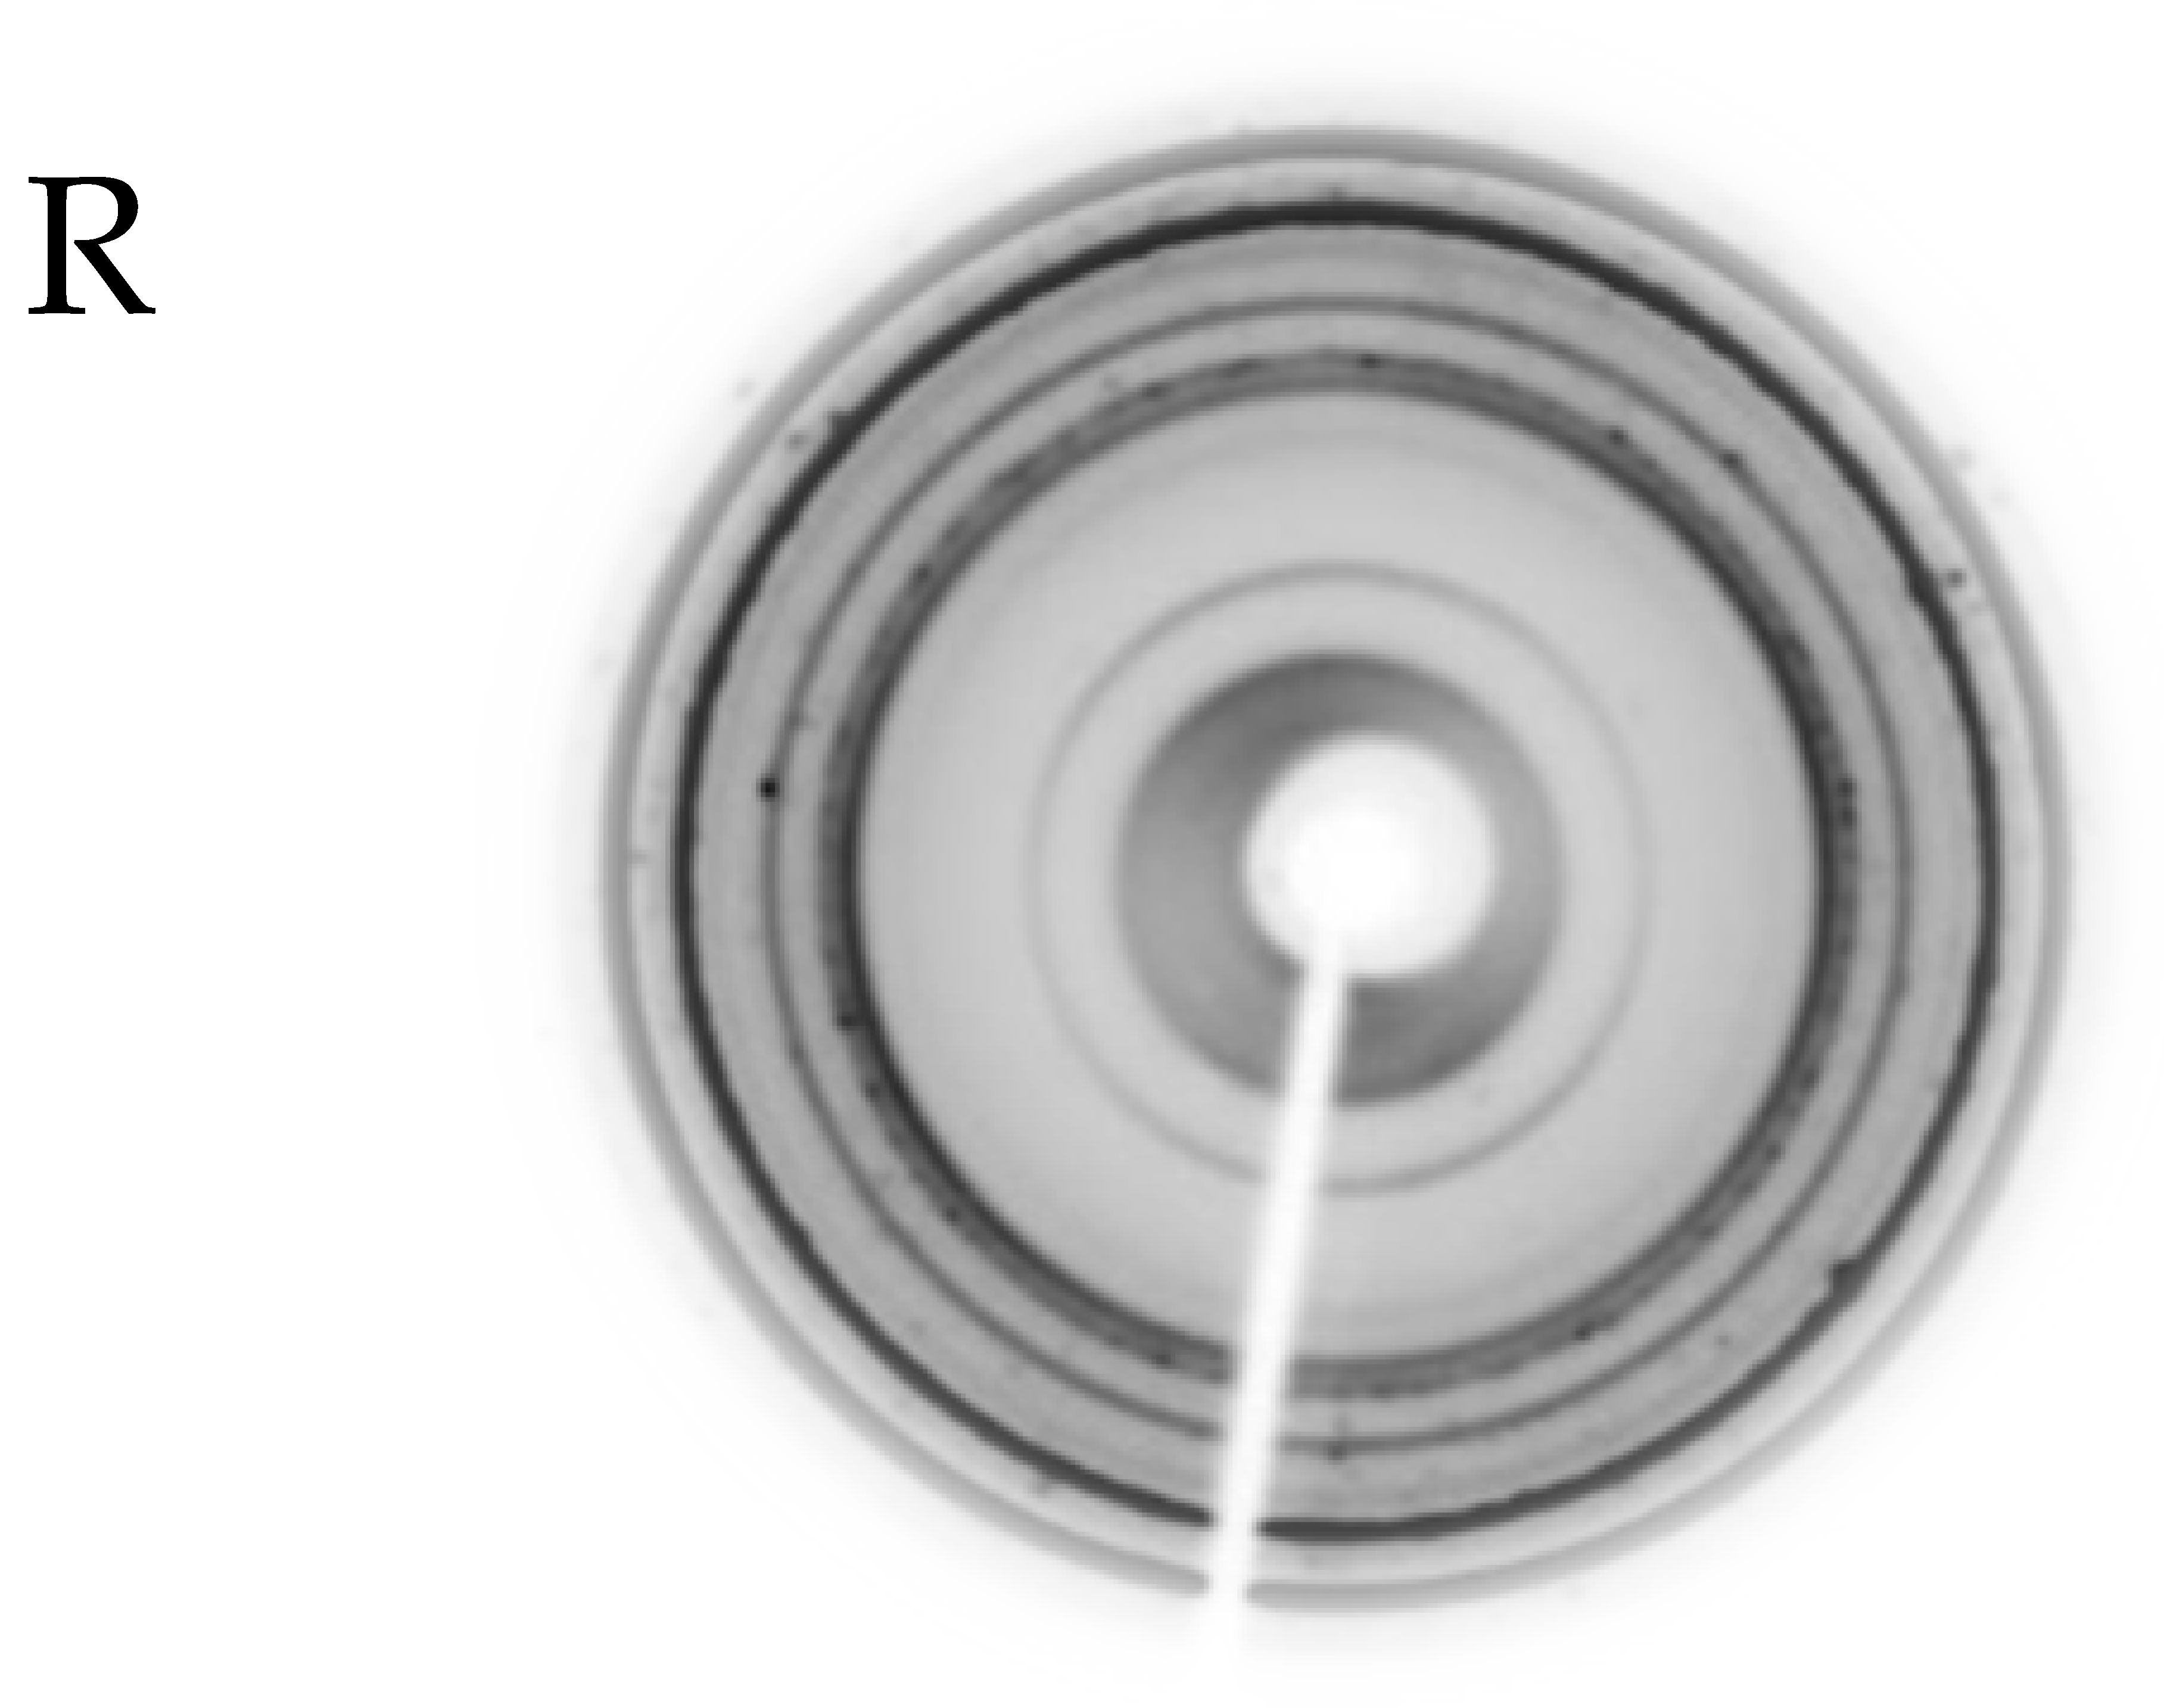 |
| Hemipelagites Depth 117 m 339-1385A 14H2 70-72 |  | 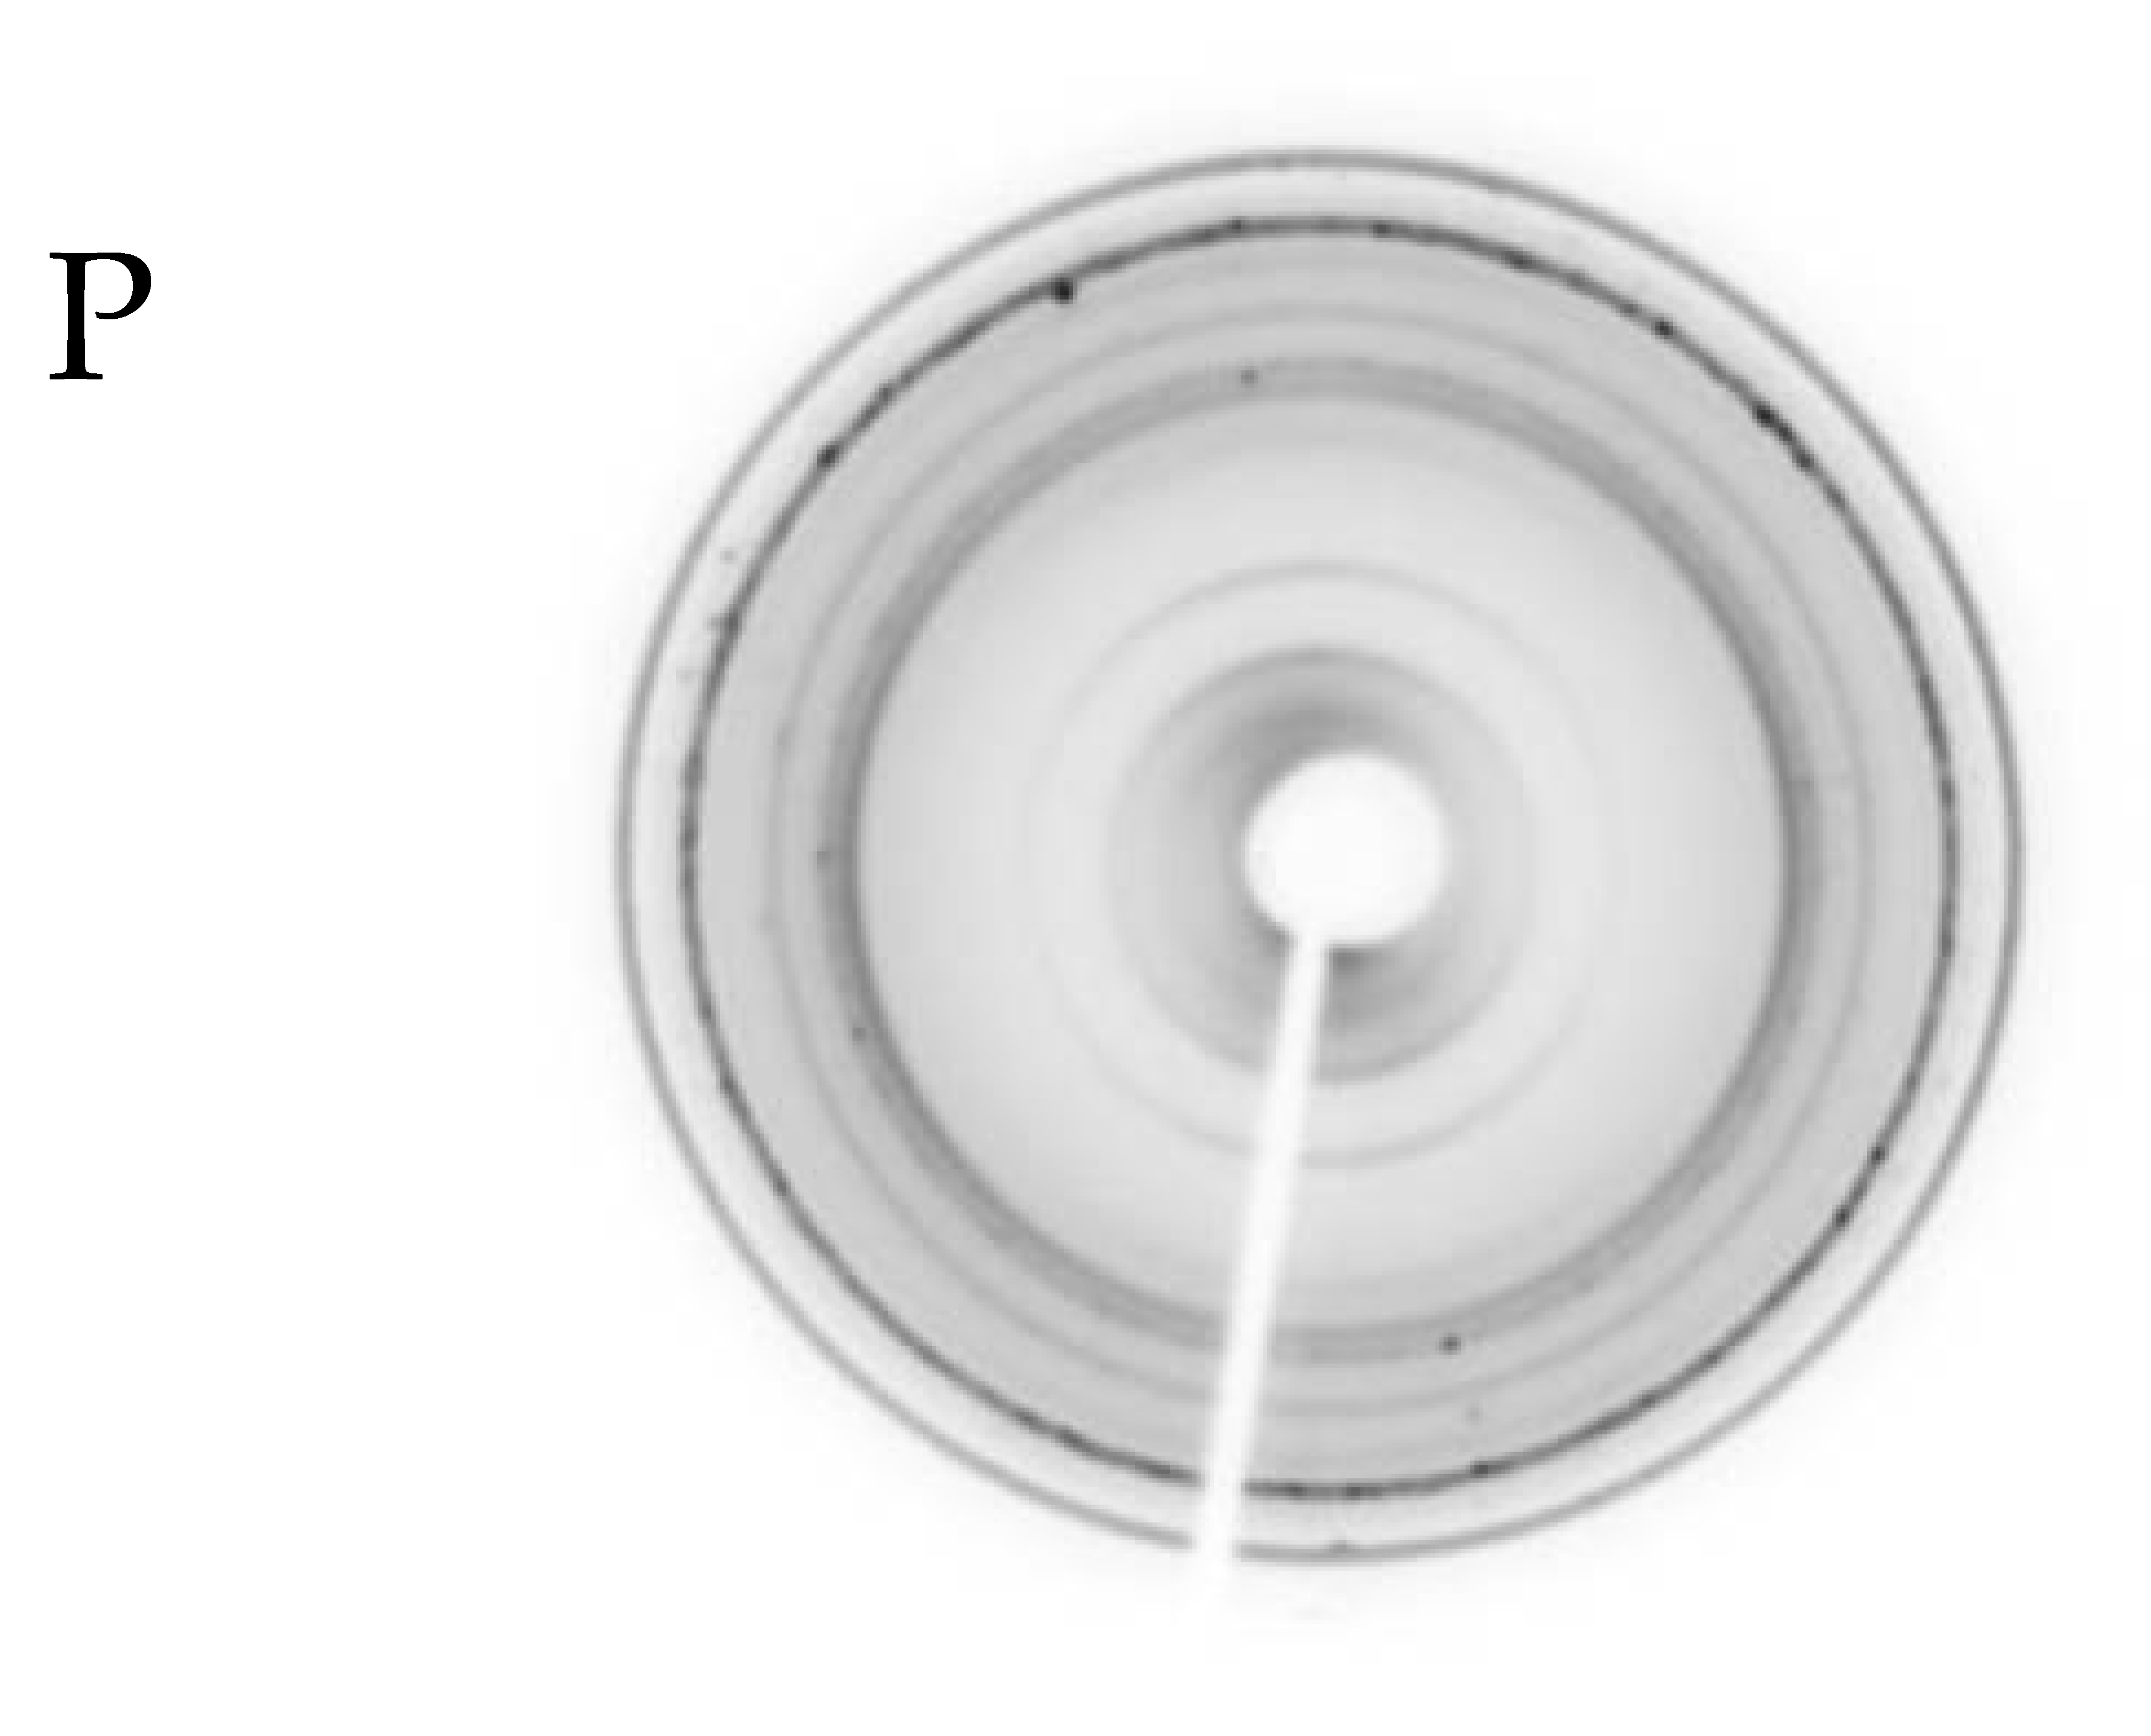 | 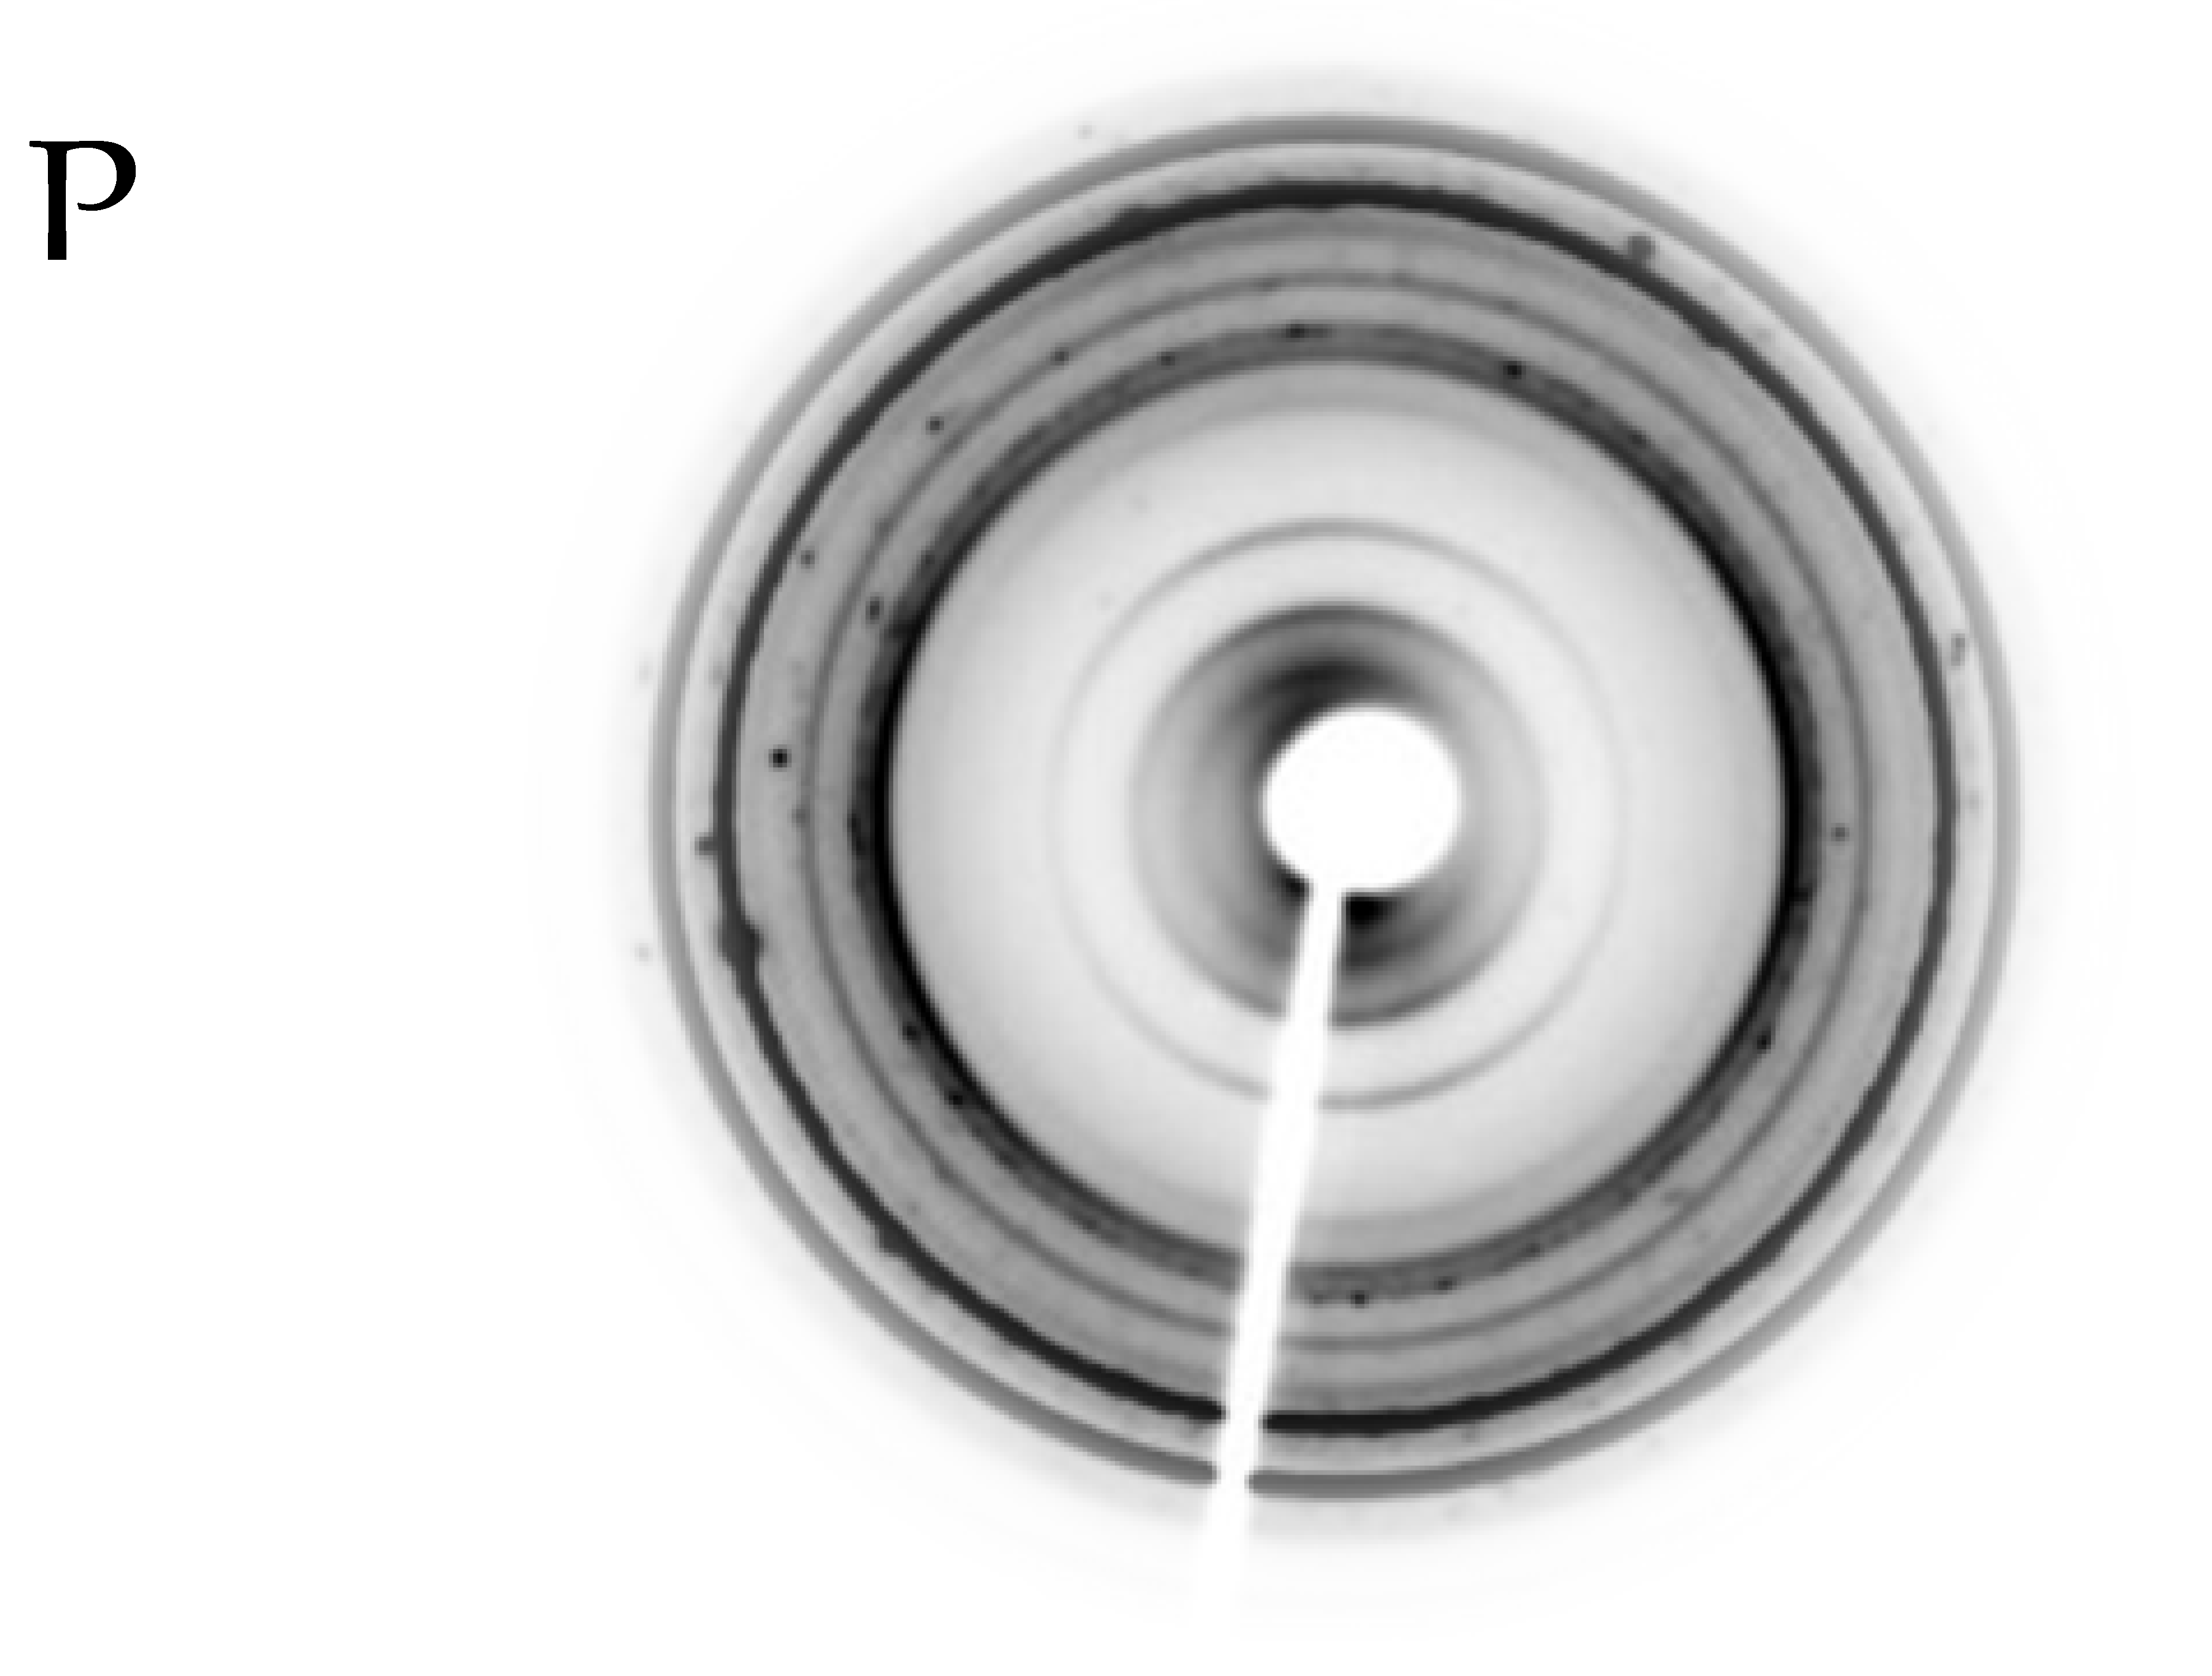 |
| Turbidites Depth 260 m 355-1457C 9R1 7-11 |  |  | 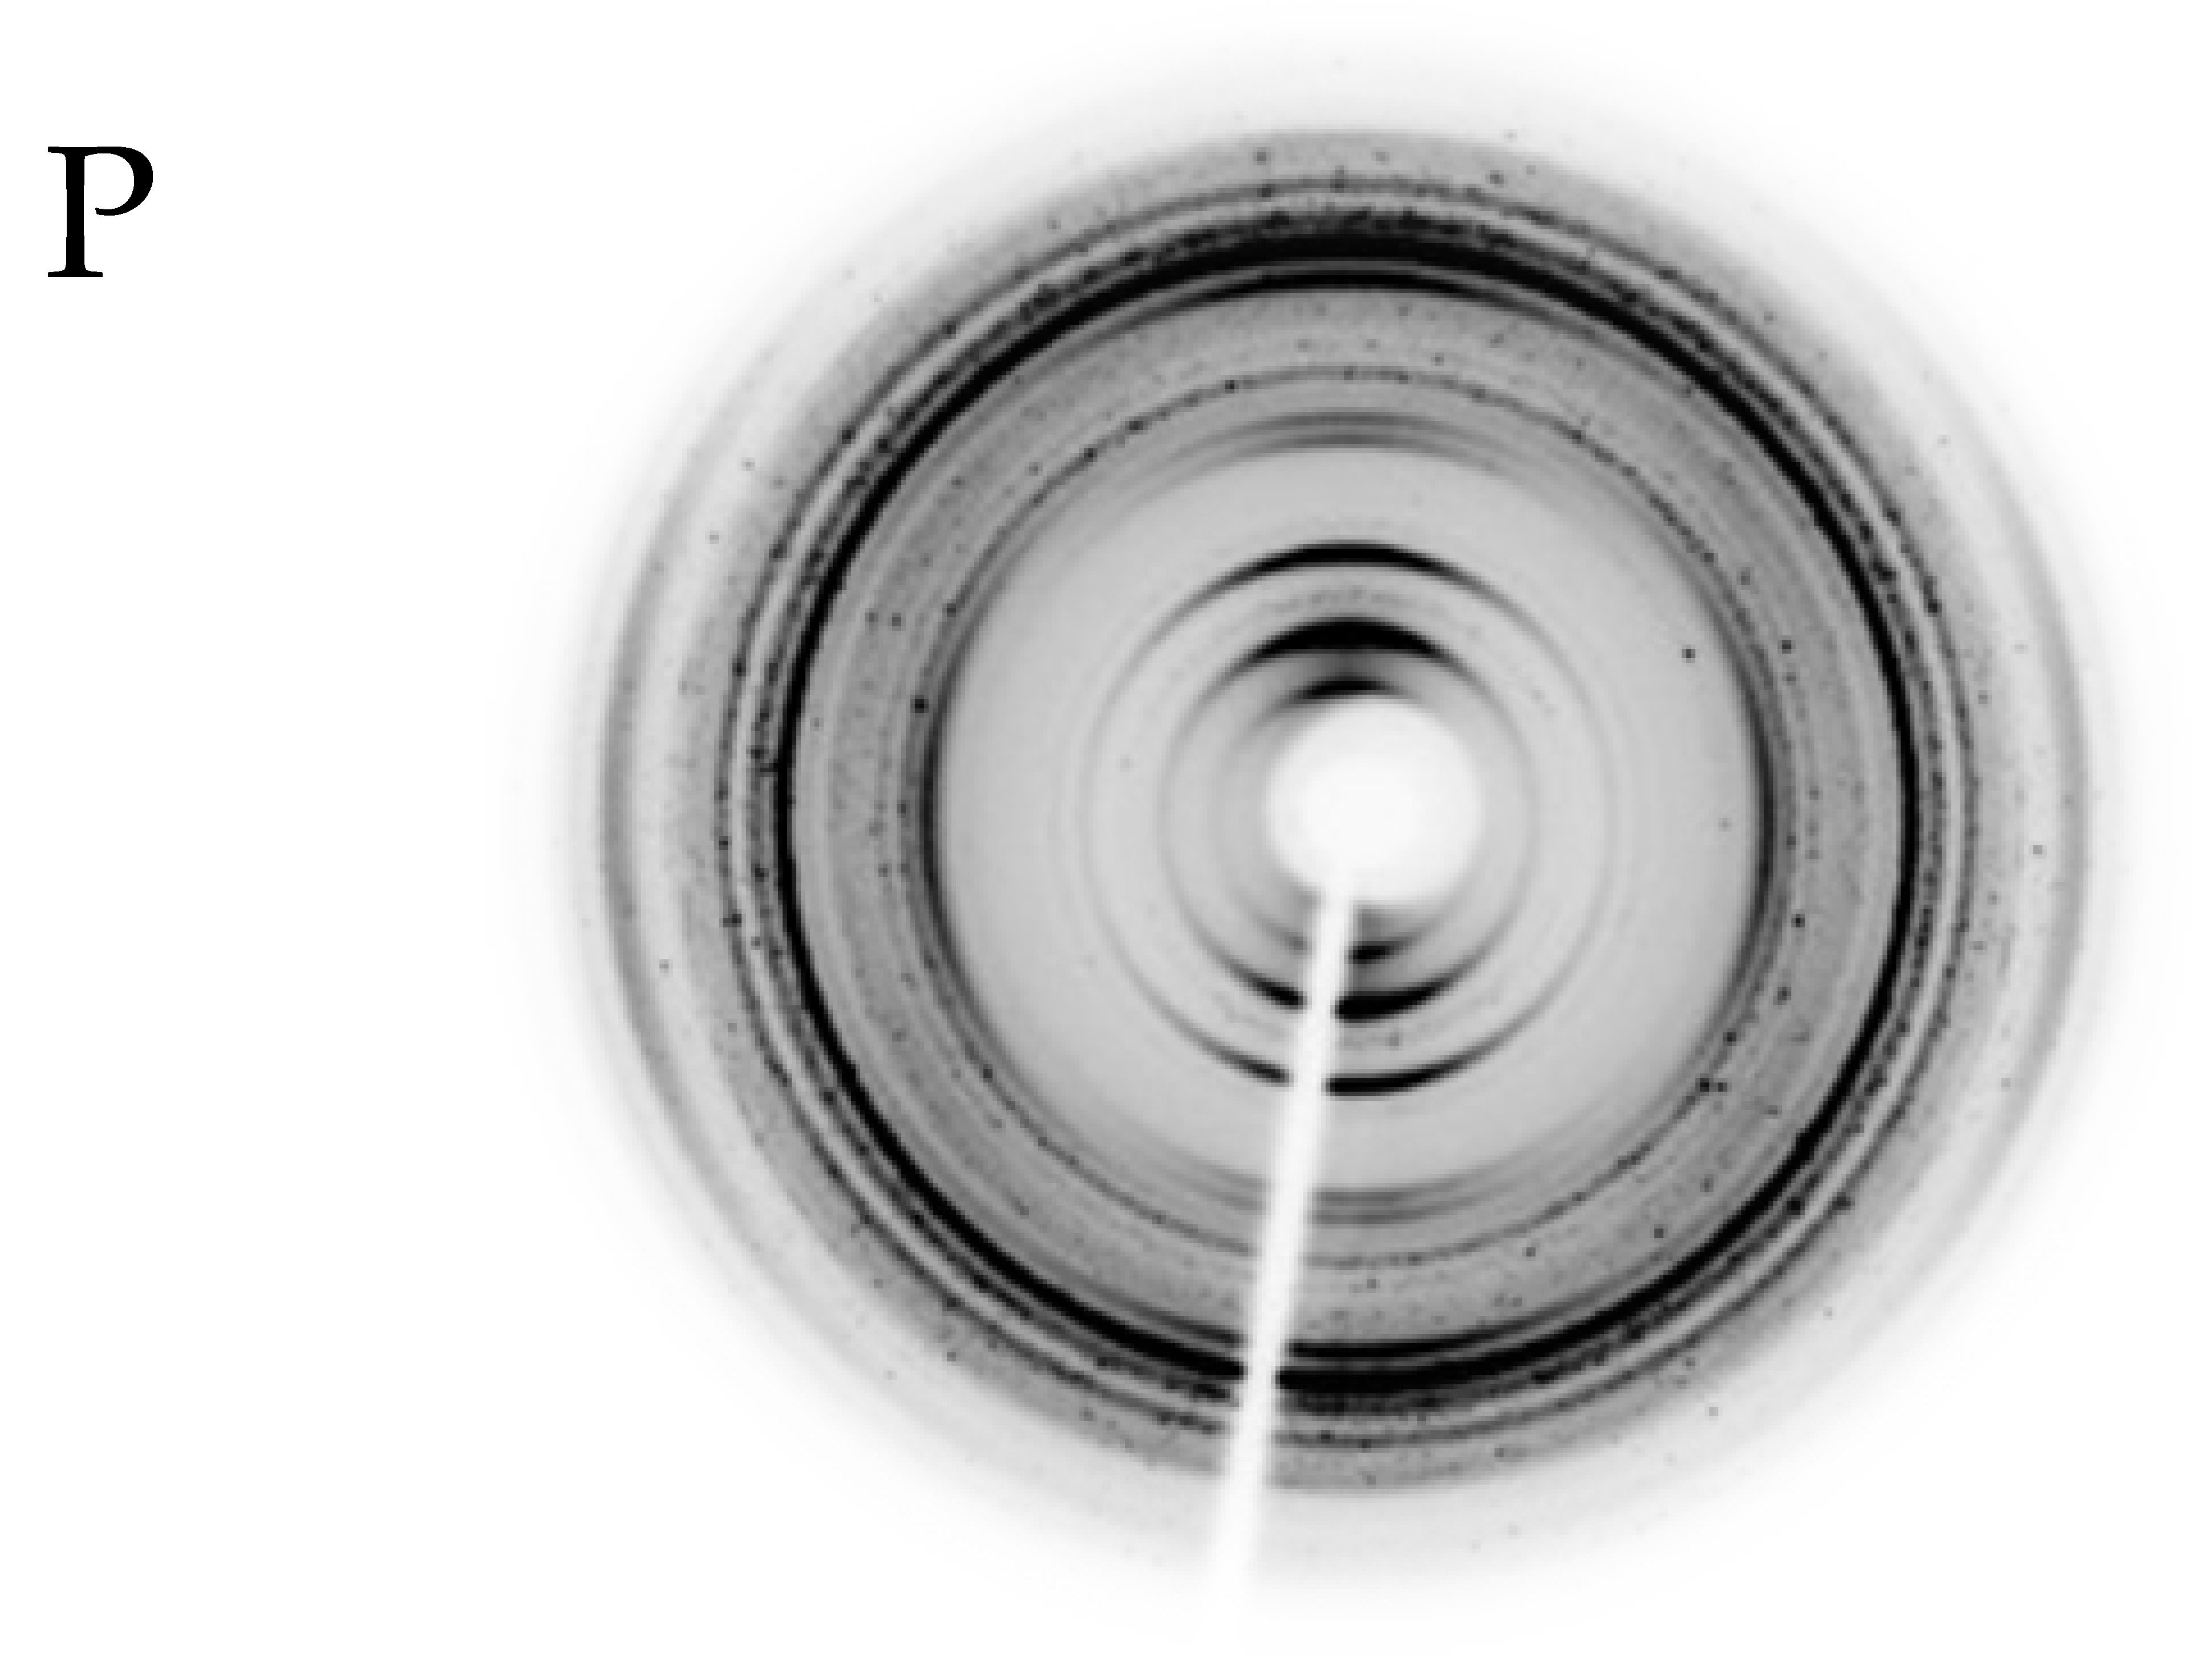 |
| Turbidites Depth 985 m 355-1457C 83R6 5-6 | 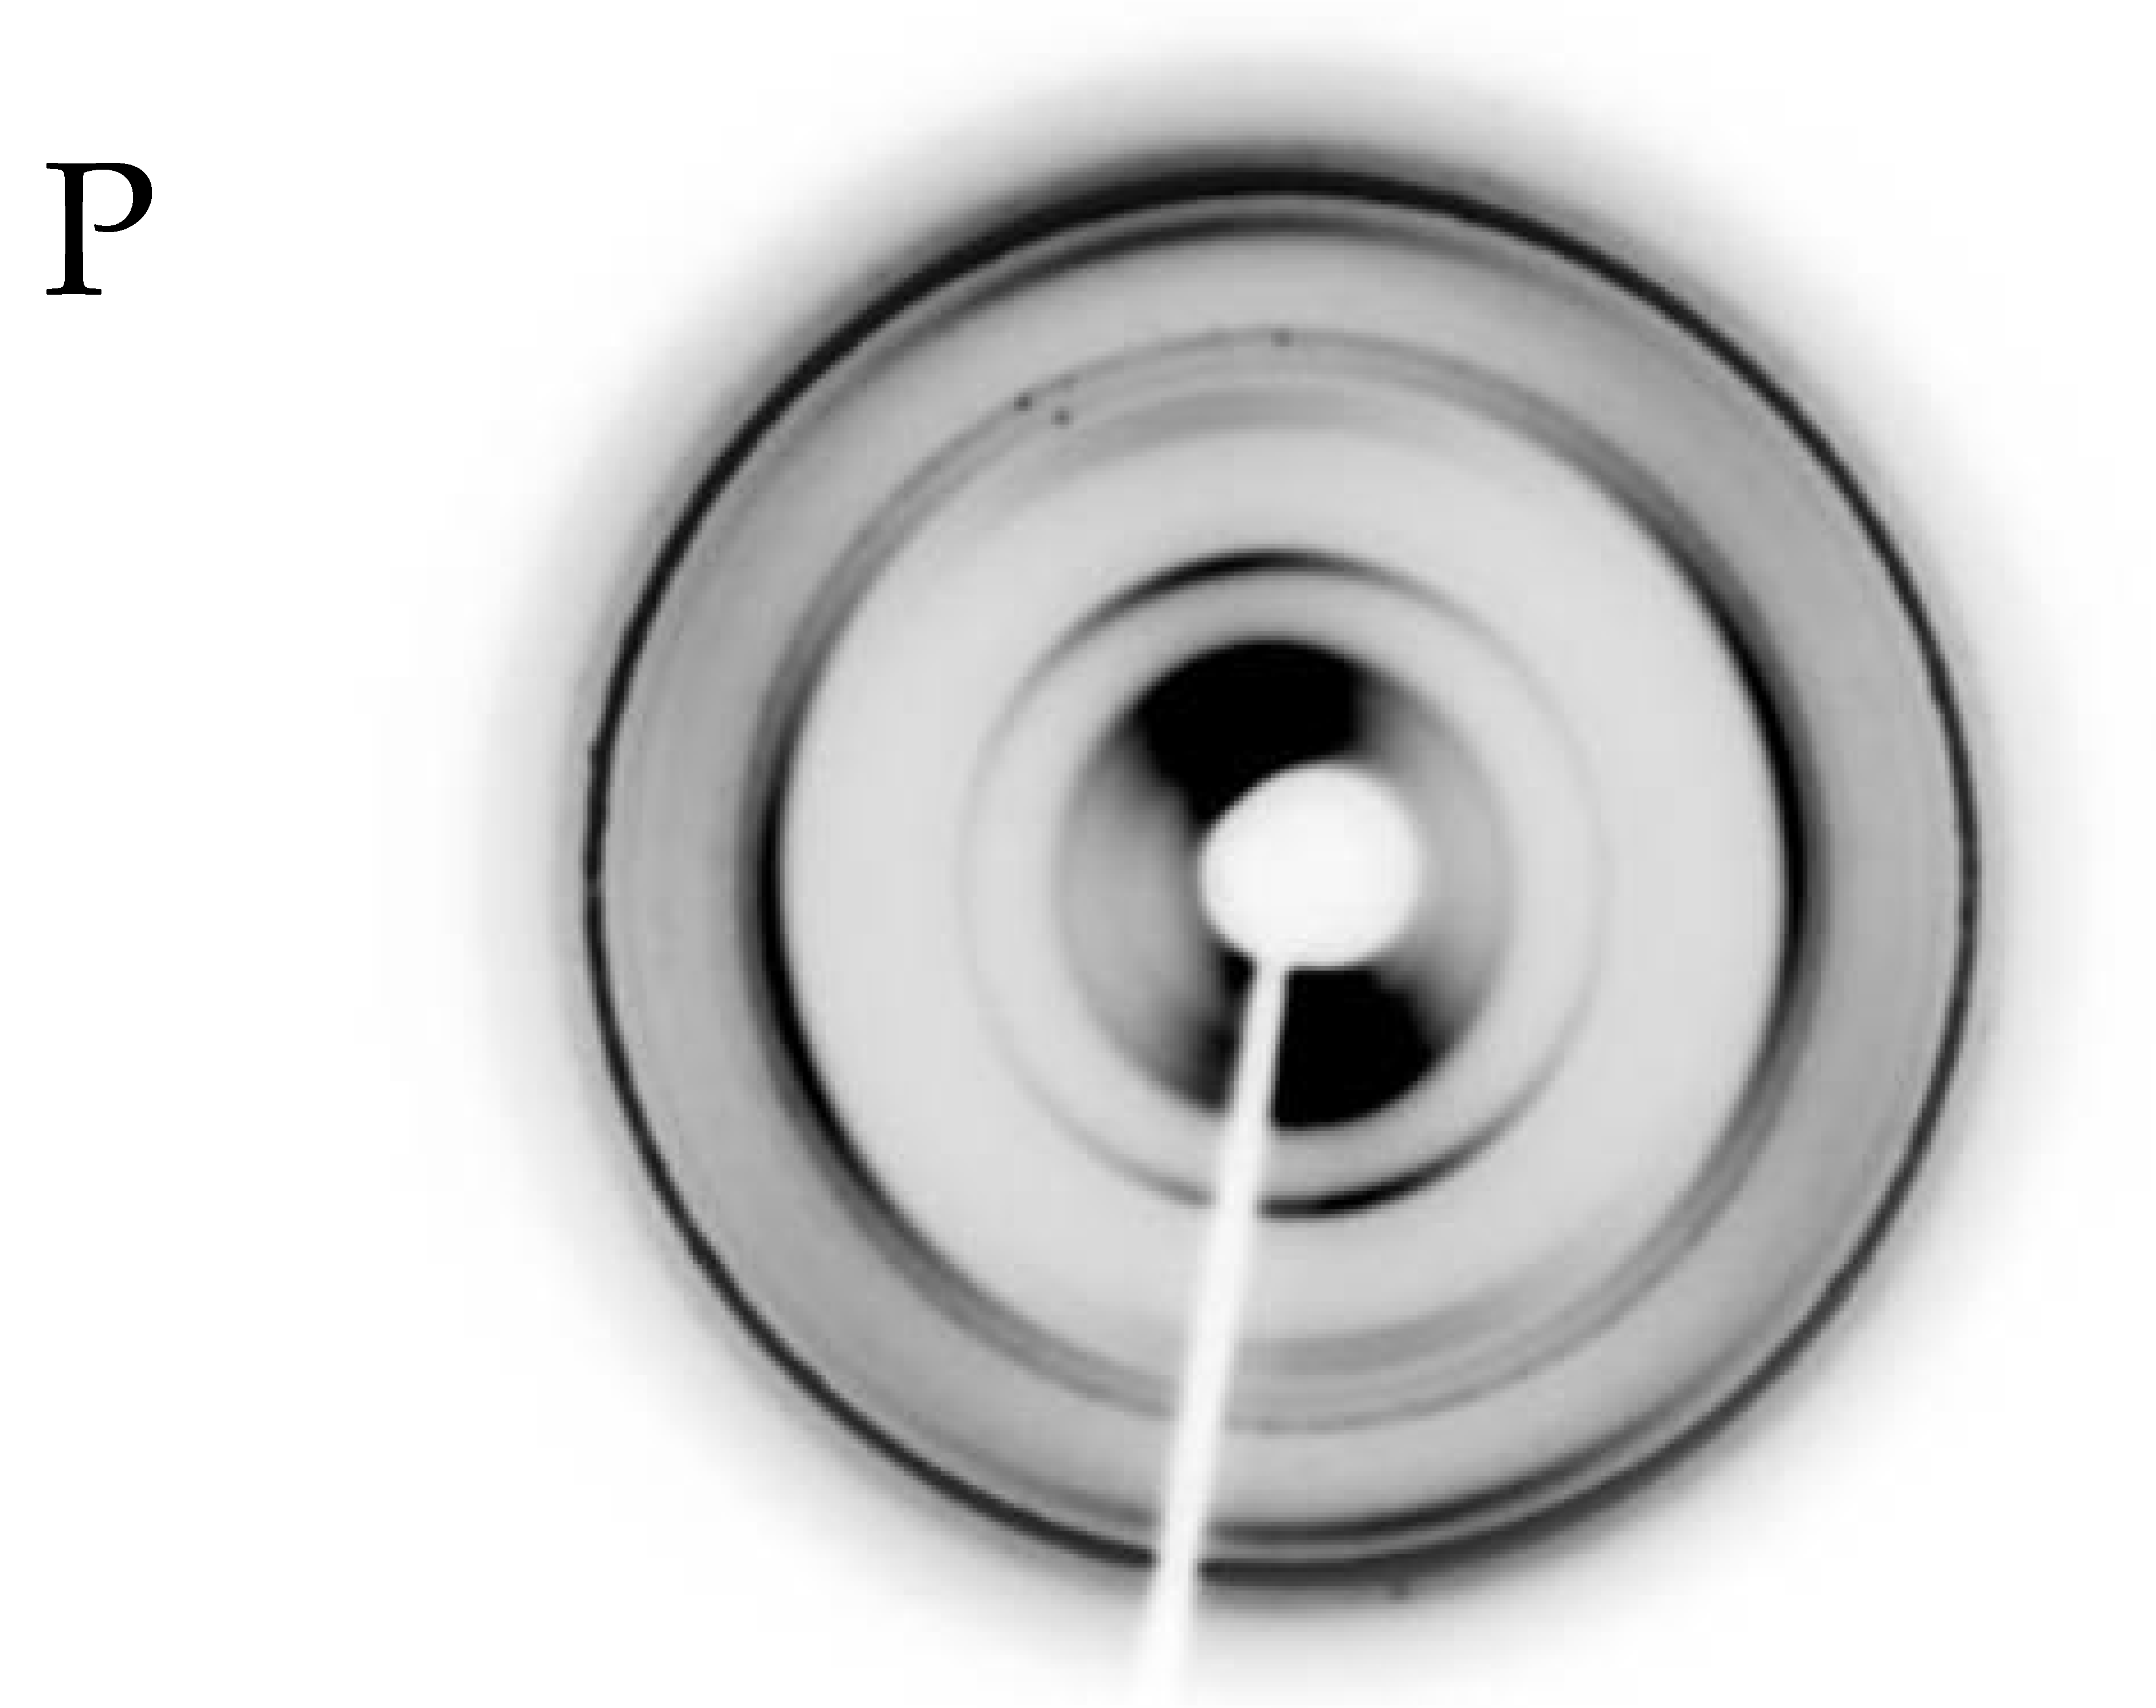 |  |  |
Table 3.
Summary of statistical parameters for porosity changes with depth for all six sites. The Pearson correlation coefficient indicates the presence of negative moderate to strong correlation between depth (<1 km) and porosity.
Table 3.
Summary of statistical parameters for porosity changes with depth for all six sites. The Pearson correlation coefficient indicates the presence of negative moderate to strong correlation between depth (<1 km) and porosity.
| Expedition | Site | Maximum Depth (mbsf) | Mean (vol.%) | Median (vol.%) | Range (vol.%) | Standard Deviation (vol.%) | Pearson Correlation Cofficient (PCC) | R Correlation Coefficient |
|---|---|---|---|---|---|---|---|---|
| 399 | 1385 | 150 | 56.9 | 56.3 | 19.8 | 4.8 | −0.83 | 0.83 |
| 399 | 1386 | 520 | 45.7 | 45.6 | 52.3 | 5.6 | −0.41 | 0.41 |
| 399 | 1387 | 550 | 46.5 | 46.3 | 41.2 | 0.33 | −0.44 | 0.39 |
| 399 | 1389 | 980 | 45.3 | 44.9 | 65.3 | 0.34 | −0.38 | 0.33 |
| 399 | 1390 | 350 | 47.2 | 47.3 | 34.3 | 6.1 | −0.68 | 0.70 |
| 355 | 1457 | 1000 | 45.6 | 43.3 | 45.9 | 0.76 | −0.81 | 0.81 |
Table 4.
Correlation of mean grain size class with microfabric.
| Microfabric | Fine Silt | ||
|---|---|---|---|
| Contourites (%) | Hemipelagites (%) | Turbidites (%) | |
| Parallel bedding | 12.5 | - | 50 |
| Semi-random | 42 | - | - |
| Random | 33 | - | - |
| Oblique | 12.5 | - | 50 |
| Very fine Silt | |||
| Parallel bedding | 36 | 0 | 97.5 |
| Semi-random | 31 | 16 | 2.5 |
| Random | 31 | 48 | - |
| Oblique | 3 | 36 | - |
| Coarse clay | |||
| Parallel bedding | 21 | - | 66 |
| Semi-random | 28 | 3.5 | 3 |
| Random | 49 | 44 | - |
| Oblique | 2 | 52.5 | 31 |
| Medium clay | |||
| Parallel bedding | - | - | 87.5 |
| Semi-random | - | - | 12.5 |
| Random | - | - | - |
| Oblique | - | - | - |
Publisher’s Note: MDPI stays neutral with regard to jurisdictional claims in published maps and institutional affiliations. |
© 2021 by the authors. Licensee MDPI, Basel, Switzerland. This article is an open access article distributed under the terms and conditions of the Creative Commons Attribution (CC BY) license (https://creativecommons.org/licenses/by/4.0/).
Share and Cite
MDPI and ACS Style
Bankole, S.; Stow, D.; Smillie, Z.; Buckman, J.; Lever, H. Mudrock Microstructure: A Technique for Distinguishing between Deep-Water Fine-Grained Sediments. Minerals 2021, 11, 653. https://doi.org/10.3390/min11060653
AMA Style
Bankole S, Stow D, Smillie Z, Buckman J, Lever H. Mudrock Microstructure: A Technique for Distinguishing between Deep-Water Fine-Grained Sediments. Minerals. 2021; 11(6):653. https://doi.org/10.3390/min11060653
Chicago/Turabian StyleBankole, Shereef, Dorrik Stow, Zeinab Smillie, Jim Buckman, and Helen Lever. 2021. "Mudrock Microstructure: A Technique for Distinguishing between Deep-Water Fine-Grained Sediments" Minerals 11, no. 6: 653. https://doi.org/10.3390/min11060653
Note that from the first issue of 2016, this journal uses article numbers instead of page numbers. See further details here.